ran duchin amir goldberg denis sosyura - michigan rosswebuser.bus.umich.edu/dsosyura/research...
TRANSCRIPT

Spillovers inside Conglomerates: Incentives and Capital*
Ran Duchin Amir Goldberg Denis Sosyura
University of Washington Stanford University University of Michigan [email protected] [email protected] [email protected]
Abstract
Using hand-collected data on divisional managers at conglomerates, we find that a change in industry pay
in one division generates spillovers on managerial pay in other divisions of the same firm. These
spillovers arise only within the boundaries of a conglomerate. The intra-firm spillovers increase when
conglomerates have excess cash and when managers have more influence over its distribution, but decline
in the presence of strong governance. These spillovers are associated with weaker performance and lower
firm value. Our evidence is consistent with simultaneous cross-subsidization via managerial compensation
and capital budgets and suggests that these practices arise in similar firms.
* We are grateful for helpful comments from David De Angelis, Chris Florackis, Michael Lemmon, Lalitha Naveen, and conference participants at the 2014 Annual Meeting of the Western Finance Association, the 2014 Rothschild Caesarea Center Conference at IDC-Herzliya, the 2014 Conference on Corporate Governance at Drexel University, and the 2015 Edinburgh Corporate Finance Conference, and seminar participants at the Australian National University, Bank of Canada, the Chinese University of Hong Kong, Georgetown University, the Nova School of Business and Economics, Texas A&M University, the University of Alberta, the University of Kentucky, the University of Melbourne, and the University of New South Wales. An earlier draft of this paper was circulated under the title “Compensation of Divisional Managers: Peer Effects inside the Firm.”

Introduction
The majority of large firms operate in multiple divisions. Such multidivisional firms, or conglomerates,
account for over 70% of book assets and market equity of S&P 500 firms. Because most large firms have
several divisions, corporate outcomes depend on how firms allocate resources across divisional managers
at similar levels of hierarchy. Theory demonstrates that this intra-firm resource allocation determines a
firm’s investment efficiency and value (e.g., Stein 1997; Rajan, Servaes, and Zingales 2000).
In theory, the value of conglomerates depends on the allocation of two resources across divisional
managers: monetary compensation and investment capital (Scharfstein and Stein 2000). While the
allocation of capital has been extensively studied, less is known about divisional managers’ pay.
Furthermore, while analytical frameworks model these resources jointly, there is little evidence on their
combined allocation inside a firm. Our paper provides evidence on both issues: the allocation of
managerial pay and its relation to the allocation of capital.
So far, empirical research has focused mostly on the allocation of capital. Prior work finds that
cash flows in one division subsidize investment in other divisions (Lamont 1997; Billet and Mauer 2003).
This cross-subsidization has been one of the key wedges between the bright and dark side views of
internal capital markets.1 The bright side view posits that cross-subsidization relaxes financing constraints
and improves investment efficiency (e.g., Fee, Hadlock, and Pierce 2009; Masulis, Pham, and Zein 2011,
2015; Almeida, Kim, and Kim 2015). The dark side view states that cross-subsidization reflects divisional
managers’ pressure for a more even distribution of resources (Shin and Stulz 1998) and shows that such
frictions erode value (Servaes 1996; Denis, Denis, and Yost 2002).
Which of these views prevails depends on the incentives of the agents involved in resource
allocation. For example, the strength of CEO incentives is positively related to conglomerates’ investment
efficiency (Ozbas and Scharfstein 2010) and value (Lins and Servaes 2002), and the quality of internal
governance enhances the value of conglomerates (Hoechle, Schmid, Walter, and Yermack 2012). In
contrast, CEOs with weaker incentives spread capital more evenly across divisions (Graham, Harvey, and
Puri 2015) and use capital allocation to elicit support from divisional managers (Xuan 2009).
1 For an overview of theories of internal capital markets, see Stein (2003) and Maksimovic and Phillips (2007).
1

While the CEO allocates resources to divisions, their efficient use depends on the incentives of
divisional managers. So far, research has studied capital allocations as a measure of indirect, non-
pecuniary managerial rewards. Yet, the main source of managerial incentives is monetary pay. Therefore,
an analysis of divisional managers’ pay is important for understanding resource allocation in conglomerates.
We study how conglomerates allocate executive pay across divisional managers and how it
responds to changes in the productivity of their divisions. Our empirical analysis seeks to answer three
questions. First, how does a change in industry pay in one division affect the pay of the manager of this
division and the pay of other divisional managers inside the firm? Second, what are the mechanisms?
Third, how is the redistribution of managerial pay related to the allocation of capital and what explains a
conglomerate’s choice between the redistribution of these resources?
To study these questions, we construct a hand-collected dataset of divisional managers at S&P
1500 firms and exploit industry-level pay shocks as a source of variation exogenous to the firm. In
particular, we study how industry-level changes in pay influence divisional managers’ pay in the affected
division and in other divisions of the firm. By focusing on changes in pay, our design differences out the
effect of all manager-, division-, and firm-level characteristics that remain invariant over one year.
We find that a positive change in managerial pay in one divisional manager’s industry is
associated with a large increase in the pay of other divisional managers within the same firm, even if
these managers oversee divisions in unrelated industries (e.g., telecom vs. paper products). For every
percentage point increase in industry pay in one division, other divisional managers in the same
conglomerate get a pay raise of about 32-41 bps. These estimates control for firm-level attributes, such as
changes in a firm’s profitability, valuation ratios, earnings per share, and stock returns.
Firm boundaries play an important role in promulgating the spillovers. The spillovers arise only
when managers work for the same conglomerate. In contrast, we find no evidence of spillovers between
managers of standalone firms that match the industries of the conglomerates’ divisions or in a subsample
of synthetic conglomerates – replicas of each conglomerate constructed from standalone firms most similar
to each of the divisions. This suggests that these spillovers are unlikely to be explained by cross-industry
synergies alone, such as the applications of technological innovations from one industry to another.
2

We consider three mechanisms through which the spillovers may operate: (i) distribution of cash,
(ii) benchmarking of pay, and (iii) internal transfers across divisions. By studying the factors that amplify
or attenuate spillovers, we make a first step to understanding their relation with governance and efficiency.
The first channel, which we label the cash surplus effect, states that a positive industry change in
one division affects the pay of other divisional managers via the distribution of excess cash. For example,
excess cash may provide CEOs with the financial flexibility to distribute part of the surplus in the form of
pay raises to all managers, even those whose marginal product was unaffected (Bertrand and
Mullainathan 2003). Consistent with this hypothesis, we find that the spillovers are stronger in the
presence of excess cash. A one standard deviation increase in excess cash (16.8% of assets) raises
managerial pay in unaffected divisions by 7 bps for each percentage point of an industry pay increase in
another division of the same conglomerate.
The second channel, which we label the benchmarking effect, posits that a pay change in one
industry inside a conglomerate affects the pay of other divisional managers via intra-firm compensation
benchmarking. For example, when determining annual pay raises, the compensation committee may take
into account considerations of equity in addition to considerations of merit (e.g., Hart and Moore 2008).
Alternatively, an increase in one manager’s pay may provide his peers with a credible reason to lobby for
a pay raise, and firms may anticipate or respond to managerial lobbying.
Three pieces of evidence support the benchmarking channel. First, the intensity of spillovers is
magnified in the presence of intra-firm social ties, which facilitate the comparison of wages, increase the
pressure for conformity (McPherson et al. 2001), and foster coordination (Attanasi et al. 2014). Second,
the intensity of spillovers increases when wages become easier to compare. In particular, we find a 16-
21% increase in internal spillovers following the 2006 regulatory shock to compensation disclosure,
which facilitated intra-firm comparisons of pay and required the disclosure of external benchmarking
groups. Third, the effect of spillovers is asymmetric: it is driven almost entirely by pay raises rather than
by pay cuts, consistent with managerial lobbying for pay raises and against pay cuts.
Our third channel – internal transfers – posits that conglomerates’ divisions are linked through
intra-firm transfers, such as transfers of materials and managerial talent. Therefore, an industry change in
one division affects the marginal product of managers in other divisions by changing the cost of
3

internally-sourced inputs or technological efficiency, even if this effect is not observed at single-segment
firms in the same industry. Under this scenario, internal spillovers reflect the increase in managers’
marginal products across all divisions.
We do not find that the spillovers are driven by internal transfers. The spillovers in pay are
equally strong across divisions whose industries have no overlap in their input-output matrix and across
divisional managers who have not worked in any other industry. We reach similar conclusions when we
use changes in industry wages at standalone firms as a proxy for changes in managers’ marginal products.
The magnitude and significance of compensation spillovers remain unchanged when we remove the
common component of the variation in pay across industries and focus only on its idiosyncratic part.
In summary, among the three channels, we find stronger evidence in support of the distribution of
excess cash and intra-firm benchmarking. If these attributes reflect agency frictions, such as the free cash
flow problem and managerial rent-seeking, the intensity of spillovers should increase under weak
governance. If, on the other hand, the extra cash and social ties enhance managers’ marginal products,
they should be associated with stronger governance.
To distinguish between these interpretations, we examine three dimensions of governance: (i)
firm-level governance, (ii) composition of the compensation committee, and (iii) quality of compensation
advisers. Across all three dimensions, the spillovers are amplified under weaker governance. For
example, the spillovers are stronger when managers have more influence on the pay-setting process, such
as when the compensation committee includes insiders. In contrast, they are sharply reduced when a
firm’s pay is reviewed by an external advisory firm, particularly when this firm is large and reputable.
Next, we study the relation between the internal redistributions of capital and pay – the two main
drivers of divisional managers’ incentives in theoretical work. First, we document that the redistributions
of investment funds and managerial pay are positively correlated (ρ=0.22 to 0.32) and arise in similar
firms, consistent with our evidence on the importance of firm boundaries. At the same time, these
correlation magnitudes imply that firms often choose to redistribute one type of resources rather than the
other. When we investigate this decision, we find that a firm’s choice between the redistribution of capital
and pay depends on the balance between managers’ control rights over the respective resource and the
disciplining influence of shareholders and markets. For example, when a firm’s compensation practices
4

are under scrutiny (e.g., shareholder proposals on pay), firms are more likely to redistribute capital rather
than managerial pay. In contrast, when product market competition increases the costs of redistributing
capital from strong to weak divisions, conglomerates are more likely to reward managers with pay.
We continue the joint analysis of the redistributions of capital and pay by examining how they
affect the link between each resource’s marginal product and its allocation in the firm. We find that the
redistributions of managerial pay weaken the sensitivity of a divisional manager’s pay to performance,
measured by the divisional ROA, the main evaluation criterion of divisional managers (Cichello, Fee,
Hadlock, and Sonti 2009). Similarly, the redistributions of investment funds across divisions weaken the
link between the allocation of capital and its marginal product (measured by the investment-to-Q
sensitivity, as in Ozbas and Scharfstein 2010). Overall, both types of redistributions appear to loosen the
link between a resource’s marginal product and its allocation inside conglomerates.
In our final analysis, we provide suggestive evidence on how the redistributions of capital and
pay are related to firm outcomes. We find that both types of redistributions are negatively associated with
operating performance and firm value. Yet, these outcomes may also reflect the effect of other value-
eroding practices that give rise to the redistributions in the first place. Our findings complement prior
evidence from internal capital markets that a positive shock to one division creates redistributions to other
divisions, which do not appear to be value-enhancing (Lamont 1997; Shin and Stulz 1998).
Our findings have several implications. First, positive changes in industry pay generate spillovers
on the pay of managers in other industries spanned by the firm. Second, internal redistributions affect
both human capital and investment capital, arise in similar firms, and loosen the link between resource
allocation and marginal products. Third, the choice of rewarding divisional managers with extra pay or
capital depends on investment opportunities and the governance of the pay-setting process.
Our evidence connects the literatures on executive pay and internal capital markets. In research
on executive pay, we document internal spillovers in managerial pay and uncover the mechanisms that
give rise to within-firm correlation in wages documented in prior work (Schoar 2002; Silva 2015). In
internal capital markets, we extend the view of resource distribution beyond investment capital and
provide the first evidence on a firm’s choice between the redistribution of capital and managerial pay.
5

1. Related Literature
Our paper is part of the literature on corporate governance in multidivisional firms. Previous work in this
area documents agency frictions in conglomerates. Denis, Denis, and Sarin (1997) find that firms with
higher managerial ownership and higher block ownership of outside investors are less likely to be
diversified. Lins and Servaes (2002) show that conglomerates have lower market valuations when
managers’ control rights exceed their cash flow rights. Xuan (2009) finds that CEOs use capital allocation
to build rapport with divisional managers. Ozbas and Scharfstein (2010) provide evidence that
conglomerates with lower managerial ownership have a lower sensitivity of investment to Q and conclude
that agency issues inhibit investment. Hoechle, Schmid, Walter, and Yermack (2012) show that proxies
for weak governance help explain the diversification discount. Graham, Harvey, and Puri (2015) provide
survey evidence that one in four CFOs admits that corporate politics affects capital allocation in
conglomerates. Our paper extends this research by providing the first evidence on the joint allocation of
two fundamental resources inside the firm: capital and pay. Our findings suggest that the allocations of
both resources are affected by considerations of internal equity and arise in similar governance settings.
We also add to the recent literature that studies internal labor markets in conglomerates. So far,
these labor markets have been examined primarily in the context of factory workers. Tate and Yang
(2015) show that workers in diversified firms benefit from greater intra-firm mobility, which provides
displaced workers with better opportunities for redeployment. Silva (2015) shows that factory workers in
lower-skill industries earn higher wages in conglomerates when these conglomerates also operate in high-
wage industries and attributes this pattern to frictions in conglomerates’ labor markets. Our paper adds to
this literature by providing evidence on the pay of executives with control rights over divisional cash
flows and by identifying the mechanisms that give rise to correlated changes in pay inside a firm.
Our findings are also related to the literature on managerial pay and performance evaluation. We
extend this work by studying the incentives of divisional managers. This important group of managers,
responsible for day-to-day decisions in large diversified firms, has received less attention in recent work,
compared with CEOs (Fahlenbrach and Stulz 2011), top executives (Graham, Li, and Qiu 2012), and
directors (Yermack 2004). We complement this literature by providing evidence on senior managers
outside the executive suite. In earlier work, Fee and Hadlock (2004) study turnover-performance
6

sensitivity for the top five executives and find that it is smaller for non-CEO managers than for CEOs.
Cichello, Fee, Hadlock, and Sonti (2009) investigate job allocations of divisional managers and show that
divisional ROA explains managerial promotions. Masulis and Zhang (2014) study compensation gaps
between CEOs and other executives and find that these gaps are explained by productivity differentials.
Alok and Gopalan (2015) examine pay-performance sensitivity in multidivisional firms and find that it is
lower when accounting earnings are less informative. Gartenberg and Wulf (2015) exploit a 1992 change
in SEC proxy rules to study the effect of disclosure on wages and find that disclosure compresses the
internal distribution of pay. We contribute to this literature by providing evidence on pay spillovers inside
conglomerates and identifying their mechanisms.
Finally, we add to the literature on benchmarking in managerial pay. So far, this research has
focused on benchmarking in managerial pay across different firms (Bizjak, Lemmon, and Naveen 2008;
Bizjak, Lemmon, and Nguyen 2011; Faulkender and Yang 2010, 2013). In complement to this work, we
study a less explored type of benchmarking – namely, the internal benchmarking of pay within the firm.
2. Sample and Data
2.1. Firms and Divisions
We start our sample construction by identifying industrial conglomerates included in the S&P 1500 index
from January 2000 to December 2008. Our sample begins in 2000 because data coverage in BoardEx and
Equilar, our main sources of governance data, is sparse before 2000. Industrial conglomerates comprise
firms that report at least two operating segments on Compustat and operate in industries other than
financial services and utilities (one-digit SIC codes 6 and 4, respectively).2 The universe of conglomerates
that meet these selection criteria comprises 806 firms.
Next, we manually go through each firm’s organization structure, as reported in quarterly and
annual reports, proxy statements, and information prospectuses, to identify the sample of firms with
divisional organization structures – those where managers oversee specific operating segments. This filter
ensures a clean one-to-one match between managers, divisions, and marginal products. Given this sample
criterion, we alert the reader that our analysis applies only to firms with such organization structures.
2 Operating segments exclude corporate accounts, allocation adjustments, and divisions with zero or negative sales.
7

We exclude firms with organization structures that lack a clear correspondence between managers
and divisions (396 firms). The excluded firms usually use a functional organization structure where
managers are assigned on the basis of their functional roles (e.g., vice president of manufacturing), so that
each manager supervises an entire functional area across all divisions. Some of the excluded firms have a
geographic organization structure where managers are assigned on the basis of regional markets (e.g.,
vice president – Northwest), so that each manager oversees a target market across all divisions.
To identify the divisional manager responsible for each business segment, we read biographical
sketches of the firms’ executives in annual reports, proxy statements, and management directories. We
consider a manager to be in charge of a division if he or she is the highest-level executive directly
responsible for a business segment during a given time period. Divisional managers typically hold the
title of divisional president, executive vice president, or senior vice president.
Next, we collect the starting and ending dates of each manager’s tenure. To obtain these dates, we
supplement the annual data from corporate disclosure with executive biographies from the Forbes
Executive Directory, Reuters, Marquis’s Who’s Who, and Notable Names Database, as well as firms’
press releases which provide managers’ appointment dates. We are able to reliably identify divisional
managers for 91.5% of conglomerates that meet our sample criteria, and we exclude the remaining 35
firms with missing data on divisional managers.
In the final step, we collect data on divisional managers’ pay, following the procedure discussed
in the next subsection. After imposing the filter that requires that compensation data be available for all of
the firm’s divisional managers, we arrive at our main sample of 162 firms and 535 divisions. Panel A in
Appendix Table B1 depicts the sequence of sample selection criteria and, at each step, provides the
number of firms, divisions, and observations retained after each filter.
Panel A in Table 1 provides summary statistics for our sample firms. The average (median)
conglomerate operates in 3.5 (3) business segments, generates an annual return on assets of 4.8% (5.7%),
and delivers an annual stock return of 6.7% (3.2%) during our sample. The average division produces
$4.4 billion in sales, generates an ROA of 6.5%, and has an industry market-to-book ratio of 1.8.
Panel B in Appendix Table B1 compares our final sample to the rest of industrial conglomerates
in the S&P 1500 index across the main firm characteristics examined in our study, including earnings per
8

share, stock return, free cash flow, profitability, capital investment, market-to-book ratio, and firm size.
This comparison reveals that our sample is statistically indistinguishable from the rest of the universe of
industrial conglomerates in the S&P 1500 across all characteristics examined, except for firm size. In
particular, the average firm in our sample is significantly larger. This distinction is explained by the fact
that larger firms provide more disclosure about their divisional managers, and they are less likely to be
dropped due to data limitations. Our sample firms are economically important. They account for 60.2% of
book assets and 63.9% of market equity of all industrial conglomerates in the S&P 1500.
2.2. Managerial Characteristics
After linking firms and divisions to managers, we collect data on managerial characteristics. First, we
hand-match divisional managers to BoardEx, which covers over 10,000 public, private, and non-profit
firms and provides data on their top executives, directors, and other managers. This database provides us
with three sets of managerial characteristics: (i) personal attributes, such as age, education, and affiliation
with nonprofit organizations, (ii) professional attributes, such as employment history, and (iii) governance
attributes, such as service on the board of directors and its committees, as well as external directorships at
other firms. We cross-check and supplement BoardEx data with managerial biographies obtained from
firms’ disclosures (biographical sketches in press releases, annual reports, and proxy statements) and the
executive databases discussed above. Next, we collect the same information for the top executives (CEO,
CFO, and COO) and directors who served at our sample firms at any time in 2000-2008.
Our sample comprises 2,557 managers at various levels of hierarchy: 723 divisional managers,
206 CEOs, and 1,628 other executives and directors. Table 1, Panel B shows summary statistics for
divisional managers. The median divisional manager is 52 years old and has a firm tenure of 13 years.
62% of divisional managers hold advanced degrees, and 14% serve as insiders on the firm’s board.
2.3. Pay and Governance
We combine and cross-verify four sources of compensation data, both public and private, to mitigate
sample selection concerns. First, we obtain data from Execucomp, which is compiled from mandatory
disclosures. Second, we supplement these data with BoardEx Compensation, a database compiled by the
9

data provider’s compensation analysts. Third, we obtain compensation data from the Standard & Poor’s
Capital IQ database, which covers a wider range of firms and executives than Execucomp and also
provides information on an executive’s employment history, education, and professional biography.
We cross-check the data for overlapping observations between Execucomp, BoardEx, and Capital
IQ and find that they provide very close compensation estimates (usually within 5% of each other). The
small differences are explained by the methodological choices in the valuation of stock option grants.
Execucomp computes the value of option grants using a modified version of the Black-Scholes model
under a unified set of assumptions.3 Capital IQ reports the fair value estimate of the option grant provided
by the issuing firm. BoardEx computes the value of the option grant using the closing stock price as of the
calendar year-end instead of the closing stock price on the date of the option grant. Another caveat is that
BoardEx converts compensation values into U.S. dollars based on the end-of-year exchange rate, which
affects compensation from foreign sources (e.g., foreign directorships), although this issue is less
important in our setting. While our results are unaffected by these methodological choices, we alert the
reader that these choices (particularly currency translations) may change after the recent acquisition of the
London-based Management Diagnostics (the owner of BoardEx) by the New York-based TheStreet, Inc.
Our fourth data source is Equilar, Inc., a California-based compensation research and consulting
firm. As part of its compensation analysis for corporate clients, Equilar obtains additional compensation
data directly from firms. These data are standardized and provided in the same format as the mandatory
disclosure data, but they cover a broader range of managers. We cross-check Execucomp and Equilar and
find that the two databases yield largely identical compensation estimates for overlapping observations. In
addition, Equilar provides unique data on the use of compensation consultants for Russell 3000 firms, a
dataset we use in the analysis of the compensation-setting process. Finally, we obtain annual data on the
composition of compensation committees for each sample firm from BoardEx and Equilar.
3 Execucomp uses the following assumptions in the Black-Scholes model. The exercise price is the market price per share at the time of grant (i.e., options are granted at-the-money). The stock price volatility is the annualized standard deviation of stock returns over the trailing 60 months ending on the date of the option grant. If the stock has traded for less than one year, Execucomp inputs the average volatility value for the S&P 1500. The dividend yield is average dividend yield over the trailing 36 months ending on the grant date. The risk-free rate is the yield-to-maturity on the seven-year Treasury bond observed on the grant date. The time to maturity is equal to 70% of the stated maturity (following the assumption that most executives exercise options before expiration). To calculate the stated maturity, Execucomp uses the actual expiration date reported in the proxy and assumes that the option grant date is July 1 of the year for which the data are reported.
10

Panel C of Table 1 reports summary statistics on managerial pay and corporate governance. The
top rows of the panel report three measures of pay: (1) salary and bonus (Pay1), (2) salary, bonus, stock
grants, and stock option grants (Pay2), and (3) total pay (Pay3). Their definitions appear in Appendix A.
The average (median) divisional manager earns $0.7 ($0.6) million per year in salary and bonus,
as shown by the values of Pay1. Our second measure of pay, Pay2, augments the previous measure with
stock and stock option grants. The average (median) value of a divisional manager’s annual salary, bonus,
stock, and option grants is $2.1 ($1.3) million. The third measure, Pay3, captures total compensation,
which combines the annual salary, bonus, other annual compensation, long-term incentive payouts, and
other cash payouts. The average (median) value of a divisional manager’s total annual pay is $2.5 ($1.3).
In comparison, the mean (median) total pay of a conglomerate’s CEO is $7.6 ($5.2) million per year.
Panel C indicates that divisional managers at the same firm earn comparable compensation. This
can be seen from the distribution of the within-firm coefficient of variation, measured as the intra-firm
standard deviation of divisional managers’ pay scaled by the intra-firm mean. The coefficient of variation
for the median firm ranges from 0.13 to 0.14 across the three components of pay, indicating its tight
within-firm distribution. A similar conclusion emerges from another measure of intra-firm variation – the
compensation gap, defined as the within-firm range of divisional managers’ pay scaled by its mean. For
the median firm in our sample, the compensation gap is 8% (when measured for total pay), indicating
comparable levels of pay for peer managers at the same firm, consistent with internal benchmarking.
Panel C also shows the distribution of the annual percentage changes in compensation at the level
of each divisional manager. The median manager receives a 3.5% annual pay raise in his salary and bonus
(Pay 1) and a 6.3% annual increase in total compensation (Pay 3). Since many of our tests use the annual
percentage change in managerial pay as a dependent variable, Appendix B provides more detail on the
distribution of this variable and shows that it fits well with the assumptions of a linear regression.
The bottom rows of Panel C show information on compensation committees and compensation
consultants. The average (median) compensation committee includes 3.5 (3) members, and 86% of
compensation committees have no insiders. 93% of conglomerates employ compensation consultants. The
most frequently used compensation consultants are Frederic W. Cook & Co., Towers Perrin, Mercer, and
Hewitt Associates, which account for 47% of consulting firms in our sample.
11

3. Empirical Results
3.1. Empirical Design
In this section, we test for compensation spillovers in conglomerates by studying how a compensation
shock to one of the divisions affects managerial pay in the treated division and in other divisions of the
same firm. To identify compensation shocks to select divisions, we exploit industry-level changes in pay.
By relying on a source of variation external to the firm, this approach mitigates the possibility of an
omitted firm-level variable that could affect managerial pay across all divisions and confound the
interpretation. Our first test studies how a divisional manager’s pay is associated with (1) pay changes in
his own industry and (2) pay changes in the industries of other divisions in the same firm.
This empirical approach has several advantages for identification. First, it provides an external
treatment effect on the managerial pay of select divisions, where the intensity of treatment is specified
according to a pre-determined factor – namely, industry. This approach allows us to compare pay changes
in treated divisions (those in the same industry) against the benchmark of untreated divisions (those in
other industries) of the same firm. Second, the identifying source of variation originates outside the firm,
mitigating concerns about an unobservable firm-specific shock that could affect compensation in all
divisions, while being unrelated to spillovers. Third, our focus on changes in pay seeks to provide a clean
estimate of the treatment effect, while differencing out all drivers of pay that stay constant over a year at
the level of a manager (e.g., education, ability, network), division (e.g., industry, complexity, core
segment), and firm (e.g., prestige, visibility, diversification).
Our research design also accounts for a number of dynamic drivers of pay. As discussed earlier,
an industry-level change in pay may be correlated with a change in a divisional manager’s marginal
product and those of his peers at the same firm. To account for this, our regressions control for financial
performance (profitability and cash flow) both at the level of the division and firm. While these controls
capture productivity gains that affect the bottom line, some of these effects may be intangible or realized
slowly in the future. To the extent that stock prices reflect such information, we account for intangible or
expected productivity gains at the level of a firm and division’s industry by controlling for changes in
their market valuation: stock returns and market-to-book ratios. Finally, because industry changes may
affect a firm’s investment and asset growth, we control for changes in division size and firm size. To
12

control for time trends in compensation, we include year fixed effects. To account for time-series
correlation in residuals, we cluster standard errors by firm.
All independent variables are measured in the same year. This choice of timing reflects several
considerations. First, managerial pay contains a significant incentive component determined by the same-
year outcomes. As a result, a contemporaneous system of controls aligns the timing of compensation
measures with the timing of performance outcomes that affect these measures, as well as with other
contemporaneous pay drivers, such as changes in division size and firm size. Second, firms typically
benchmark their compensation contemporaneously to avoid management attrition. Some firms explicitly
disclose in their financial statements that they make intra-year adjustments to managerial pay to “align
salaries with those of individuals in peer companies in a step-wise fashion.” 4 Prior research also finds
evidence of contemporaneous benchmarking to industry pay (Faulkender and Yang, 2010, 2013).
Contemporaneous updates on industry pay are available from several sources. The first is the
mandatory reporting of executive pay. Over 97% of industries in our sample include firms with fiscal year
ends in every calendar quarter, and their reporting throughout the year provides continuous updates on
the dynamics of pay. Second, competitive intelligence firms gather up-to-date information from
proprietary surveys, recruiting, and consulting (93% of our firms employ compensation consultants).
Such firms monitor aggregate industry dynamics and inform their clients of significant changes. Third,
managers may obtain contemporaneous information on industry pay from informal channels, such as
connections to executives at other firms in their industry, as shown in Shue (2013).
Table 2 shows our baseline specification. The dependent variable is the annual percentage change
in a divisional manager’s pay, captured by one of the three measures: Pay1, Pay2, and Pay3, in columns
1-3, respectively. The variables ∆Industry pay and ∆Industry pay in other divisions are defined as the
average percentage change in the annual CEO pay of standalone firms which operate in the division’s
industry and in the industries of the other divisions of the conglomerate, respectively. Industry definitions
follow the 3-digit SIC classification. Formally, ∆Industry pay in other divisions is defined as follows:
4 For example, Rigel Pharmaceuticals notes in its proxy statement that “Compensation Committee engages a well-established consulting firm to analyze our executives' compensation packages against the compensation packages of executives at comparable companies... Mid-year adjustments to salaries are made under special circumstances, such as promotions or increased responsibilities, or in order to align certain salaries with those of individuals in peer companies in a step-wise fashion.” (Rigel Pharmaceuticals form DEF 14A, 04/08/2008).
13

∆ ∑ ∆
(1)
where the subscript i corresponds to division i and the subscript j corresponds to the industries of all other
divisions in the conglomerate, with a total of n divisions.
3.2. Sensitivity to Industry Pay in Conglomerates
This subsection presents our first empirical results on the relation between changes in industry pay and
the compensation of divisional managers in conglomerates.
Table 2 shows that a divisional manager’s pay is positively related to industry pay changes in
other divisions of the conglomerate. The coefficients on ∆Industry pay in other divisions are positive,
significant at the 1% level, and similar in magnitude across all measures of pay. Based on the estimates in
columns 1-3, a divisional manager’s pay increases by 32 to 41 bps in response to a one percentage point
increase in the average industry pay in other divisions. This suggests that a change in industry pay in one
division generates positive spillovers on managerial pay in other divisions of the same firm.
A divisional manager’s pay responds positively and more strongly to pay changes in his own
industry, as shown by the positive and significant coefficients on ∆Industry pay. However, the elasticity
of such a response is below one: a divisional manager’s pay increases by 69 to 80 bps for every
percentage point increase in managerial pay in the division’s own industry.
Control variables show expected results. A divisional manager’s pay is positively related to his
division’s ROA, and this effect is stronger in columns 2-3, which correspond to compensation proxies
with a higher share of incentive pay. This result is consistent with the finding in Cichello, Fee, Hadlock,
and Sonti (2009) that divisional ROA is the main criterion for internal evaluation of divisional managers.
A divisional manager’s pay is also positively related to asset growth in the division, as shown by the
coefficients on ∆Division size, which are uniformly positive and statistically significant at the 1% level
across specifications. A divisional manager’s pay increases by 13-19 bps for a one percentage point
increase in division size. Finally, a divisional manager’s pay is strongly positively related to the firm’s
financial performance, particularly earnings per share, stock returns, and profitability, and this effect is
stronger for measures with a higher share of incentive pay.
14
In summary, a change in industry pay in one of the conglomerate’s divisions produces spillovers
on the pay of other divisional managers at the same firm. The magnitude of these spillovers is about one
third of the industry change in pay.
3.3. Boundaries of the Firm
The evidence so far suggests that a change in managerial pay in one industry produces spillovers on the
pay of managers in other industries inside the same firm. In this subsection, we test whether these
spillovers promulgate beyond firm boundaries. This analysis seeks to distinguish between two possible
interpretations. If the spillovers are driven by cross-industry links, such as innovations that improve
productivity or reduce costs, they should operate across firm boundaries. However, if the spillovers are
driven by intra-firm factors, they should operate only within firm boundaries.
In our first test, we distinguish between these interpretations by studying how a divisional
manager’s pay responds to pay changes in industries that are not spanned by the conglomerate. In Table
3, Panel A, we augment our baseline specification from Table 2 with the variable ΔIndustry pay in
industries outside the conglomerate, defined as the average percentage change in CEO pay in standalone
firms that operate in industries that are not represented in the conglomerate.
The evidence shows a stark contrast: a divisional manager’s pay responds strongly to pay changes
in the industries of other divisions of the firm, but does not respond to pay changes in industries
unrepresented in the conglomerate. The coefficients on the variable ΔIndustry pay in other divisions are
significant at the 1% level and have nearly the same point estimates as in Table 2. In contrast, the
coefficients on the new variable, ΔIndustry pay in industries outside the conglomerate, are not statistically
significant across all columns, have near-zero point estimates, and flip signs. This evidence indicates that
the spillovers in pay are specific to the subset of industries within the boundaries of the firm.
In the second test, we study how pay changes in one industry affect managerial pay in other
industries when these industries are separated by firm boundaries—namely, when the firms in these
industries operate as standalones. To implement this test, we construct a sample of standalone firms that
appear in the Compustat segment files and report a single business segment. Using the same data sources
15

as before, we construct a panel dataset that includes information on CEO pay and financial characteristics
for these firms in 2000-2008. This panel includes 6,747 firm-year observations.
Table 3, Panel B tests the sensitivity of managerial pay in standalone firms to changes in
managerial pay in the same industry and in other industries, as defined by the three-digit SIC codes. The
dependent variable is the annual percentage change in CEO pay in standalone firms, computed for the
same three measures of pay. The first independent variable of interest is the average percentage change in
CEO pay across all standalone firms that operate in the firm’s core industry (∆Industry pay). The second
variable of interest is the average annual percentage change in CEO pay in standalone firms that operate
outside of the firm’s core industry (∆Industry pay in other industries). As before, the analysis controls for
dynamic determinants of managerial pay and year fixed effects.
Panel B shows that changes in managerial pay in standalone firms are strongly positively related
to the average changes in managerial pay in the same industry, as indicated by the positive and significant
coefficients on ∆Industry pay across all specifications. As expected, the coefficient estimates on this
variable are narrowly clustered around one, ranging from 1.01 to 1.09 across columns. In contrast, the
coefficients on ∆Industry pay in other industries are economically small, flip signs, and fall far short of
statistical significance. This indicates that managerial pay in standalone firms is not significantly related
to changes in pay in other industries after controlling for firm characteristics and time trends.
One caveat with the analysis in Panels A and B is that a conglomerate’s choice of industries is not
random. Conglomerates tend to operate in economically related industries (Hoberg and Phillips 2015).
Therefore, it is possible that the results that a divisional manager’s pay reacts only to pay changes in the
industries spanned by the conglomerate (Panel A) and that managerial pay in standalone firms is not
significantly related to pay changes in other industries (Panel B) are explained by the tighter economic
links between conglomerates’ industries rather than by firm-level factors.
To test this hypothesis, we replicate the industry mix of each conglomerate by constructing its
synthetic match from standalone firms. In particular, for each division, we select a single-segment firm in
the division’s industry with the closest value of book assets. Using this pair-matching algorithm, for each
conglomerate in our sample, we construct its synthetic replica that spans the same portfolio of industries
and has similar size. If the spillovers are related to the unique portfolio of industries spanned by each
16

conglomerate, they should be also observed in synthetic conglomerates because they replicate all the
industry groupings. In contrast, if the spillovers are driven by intra-firm factors, they should be muted in
synthetic conglomerates because each synthetic division is separated by firm boundaries.
Table 3, Panel C shows no evidence of spillovers in synthetic conglomerates. The coefficients on
ΔIndustry pay in other divisions are never statistically significant, flip signs, and show small point
estimates. In contrast, synthetic conglomerates respond strongly to pay changes in their own industry, as
shown by the coefficients on ΔIndustry pay, all of which are significant at the 1% level. The point
estimates on this variable are grouped around one (1.03-1.08), suggesting that managerial pay in the
matched subsample of synthetic conglomerates responds dollar-for-dollar to pay changes in the same
industry. These estimates are significantly larger than those for actual conglomerates, indicating that
managerial pay in standalone firms is more elastic to changes in pay in the same industry.
The comparison of results for synthetic and actual conglomerates suggests that changes in
managerial pay in one industry affect managerial pay in other industries only when managers work for the
same firm. In contrast, this effect disappears when managers work for separate standalone firms, even if
these firms replicate the industry mix of each conglomerate and match its size. This distinction suggests
that firm boundaries play an important role, and that spillovers are driven by mechanisms inside the firm.
3.4. Robustness
In this subsection, we test the robustness of our evidence on spillovers to alternative specifications. The
results discussed in this subsection are presented in Appendix C.
Our main analysis relies on industry changes in pay as a source of identifying variation to
mitigate the possibility of an omitted firm-level variable. An alternative and more direct approach is to
exploit a within-firm source of variation in pay and test whether changes in pay in one division propagate
to other divisions of the same firm. An advantage of this approach is that it exploits information from the
same firm, rather than industry and, hence, provides a more powerful test. A limitation of this approach is
that it is difficult to identify the underlying driver of changes in pay in a given division and to account for
firm-level variables that could simultaneously drive changes in pay across all divisions. Given this
limitation, we present this analysis as additional evidence that should be viewed with caution.
17

Appendix Table C1 shows how pay changes in one division respond to pay changes in other
divisions of the same firm. The main variable of interest is ∆Pay in other divisions, defined as the average
annual percentage change in the pay of other divisional managers at the same firm. The results show that
a divisional manager’s pay responds strongly positively to pay changes in other divisions of the firm. A
divisional manager gets a pay raise of 44-49 bps in response to a one percentage point increase in the pay
of other divisional managers at the same firm. These results support our earlier evidence on spillovers and
suggest slightly higher sensitivities of managerial pay to the pay in other divisions of the firm. These
higher magnitudes are expected because this specification exploits the entire variation in managerial pay
in other divisions rather than just its component attributable to industry-level factors.
In the next robustness test, we impose an additional filter on the sample of conglomerates. We
exclude all firms that have multiple divisions in the same three-digit SIC code. This filter ensures that
only one division in a firm is affected by each industry shock. After imposing this filter, our conclusions
remain very similar, both in magnitude and significance, as shown in Appendix Table C2.
So far, we have focused on the annual changes in pay to difference out all manager-, division-,
and firm-level determinants of managerial pay that remain unchanged in the short term. In our next test,
presented in Appendix Table C3, we test for spillovers in the levels of pay. The dependent variable is the
natural logarithm of one of the three components of a divisional manager’s pay. All independent variables
are also expressed in levels. The measures of annual pay in the division’s industry (Industry pay) and in
the industries of the other divisions of the conglomerate (Industry pay in other divisions) are expressed as
natural logarithms of the average annual pay in the respective three-digit SIC codes.
The results indicate that the level of a divisional manager’s pay is strongly positively related to
the level of industry pay for other divisional managers in the conglomerate, a relationship significant at
the 1% level. The level of a divisional manager’s pay increases by 22-31 bps for every one percentage
point of the level of industry pay in the other divisions of the conglomerate, a sensitivity comparable to
our earlier estimates. The coefficients on Industry pay indicate a below-one sensitivity of a divisional
manager’s pay to the level of pay in the division’s own industry, consistent with earlier findings.
Overall, executive pay in conglomerates responds to the pay of a manager’s peers in other divisions.
This result persists both in levels and changes in pay and appears robust to alternative specifications.
18

4. Mechanisms
This section studies three non-mutually exclusive mechanisms that may contribute to intra-firm spillovers
in pay: (1) distribution of excess cash, (2) benchmarking of pay, and (3) internal transfers between divisions.
The purpose of this analysis is two-fold. First, beyond documenting the spillovers, it seeks to understand
why these spillovers occur. Second, by studying the factors that amplify or attenuate the spillovers, it
makes a first step toward understanding their relation with governance and efficiency.
4.1. Distribution of Excess Cash
A positive industry change in one division may affect compensation in other divisions via the distribution
of excess cash. For example, excess cash may increase discretion in the allocation of funds (Denis and
Denis 1993) and provide CEOs with financial flexibility to distribute part of the surplus as pay raises to
all managers, even those whose marginal product was unaffected (Bertrand and Mullainathan 2003).
To examine this channel, we study how changes in a conglomerate’s excess cash associated with
an industry change affect managerial pay. To measure excess cash, we follow Bates, Kahle, and Stulz
(2009) and estimate the portion of cash holdings unexplained by a firm’s precautionary savings.
Specifically, we measure excess cash as the residual from regressing a firm’s cash ratio on a vector of
control variables following the empirical model in Bates, Kahle, and Stulz (2009), which includes cash
flow, the market-to-book ratio, a foreign income dummy, net working capital (excluding cash), capital
expenditure, debt, R&D expenditures, acquisitions, payout ratio, cash flow volatility, and firm size.
As another signal of excess cash, we use the initiation of a special dividend. We introduce a
binary indicator, Special dividend, which equals 1 if the firm initiates a special dividend and 0 otherwise.
Following Denis (1990) and DeAngelo et al. (2000), dividends are classified as special if they have CRSP
distribution codes of 1262 or 1272, which identify those labeled ‘year-end’, ‘final’, ‘extra’, or ‘special.’
Table 4 tests the relation between excess cash and spillovers in pay. This table augments our base
specification with the interaction terms between industry-level changes in pay and firm-level measures of
excess cash: ΔExcess cash (columns 1-3) and Special dividend (columns 4-6). The results show that intra-
firm spillovers in pay are magnified in the presence of excess cash. An increase in pay in a division’s
industry is associated with a stronger increase in pay in other divisions when this increase is associated
19

with excess cash. This is shown by the positive and significant interaction terms between changes in
industry pay in other divisions and measures of excess cash. A one standard deviation increase in excess
cash (16.8% of assets) raises managerial pay in unaffected divisions by extra 7 bps for every percentage
point of an industry pay increase, indicating a 20% increase in the magnitude of spillovers. Similarly, a
one percentage point increase in industry pay raises pay in other divisions by extra 5-7 bps at firms that
initiate special dividends. Finally, there is also a positive relation between an increase in excess cash and
changes in pay in the affected division, suggesting that the surplus is distributed in the form of pay raises
to both affected and unaffected managers. This evidence parallels that in Blanchard et al. (1994) who
study 11 firms that receive cash windfalls and find that 16% of the windfall is spent to raise executive pay.
We also find that firms with excess cash pay higher wages. In unreported specifications without
the interaction terms, the relation between changes in excess cash and compensation is positive and
statistically significant. When the interaction terms are added, the point estimates on the direct measures
of excess cash remain uniformly positive but lose significance to the interaction terms. One interpretation
of this pattern is that the positive relation between cash and managerial pay is most pronounced around
industry compensation shocks, perhaps because they provide a justification for pay raises.
In summary, excess cash magnifies spillovers in pay. When one of the divisions experiences a
positive industry change that generates excess cash, part of the cash is distributed to managers via pay
raises. This channel highlights similarities to cross-subsidization in internal capital markets—namely, the
evidence that transfers between divisions increase when firms have more cash (Hovakimian 2011).
4.2. Internal Benchmarking of Managerial Pay
A change in industry pay in one division may affect compensation in other divisions via intra-firm
benchmarking. For example, when determining annual pay raises, the compensation committee may take
into account considerations of equity between managers. Similarly, an increase in one manager’s pay may
lead his peers to lobby for a pay raise, and firms may anticipate or respond to such lobbying activity. This
hypothesis is grounded in the theoretical work that emphasizes the importance of relative pay for agents’
utility (Akerlof and Yellen 1990) and highlights the effect of perceived fairness on the pay-setting process
(Akerlof 1982, 1984; Hart and Moore 2008).
20

Because the benchmarking channel is tied to intra-firm interactions, we need to measure the ease
with which divisional managers can exchange information about their expected changes in pay before
such information is finalized and disclosed outside the firm. In our first test, we focus on intra-firm social
ties—informal connections between managers via social clubs, alumni networks, and professional
appointments. We conjecture that social ties facilitate intra-firm benchmarking via two mechanisms.
The first mechanism posits that social ties facilitate an exchange of information about pay raises
between divisional managers, and divisional managers lobby for pay raises similar to those of their peers.
For example, Shue (2013) finds that managers obtain information about their peers’ pay through social
networks and that such information exchanges (e.g., at alumni reunions) are associated with large pay
raises, consistent with lobbying. Because divisional managers learn about their next-year pay before such
changes become effective, there is a significant time window when a manager can act upon this
information. Research in other settings documents nearly immediate transfers of information via social
networks even when there are major barriers to information sharing and when this information is highly
time-sensitive (Cohen, Frazzini, and Malloy 2008, 2010; Ahern 2015). At the same time, we acknowledge
that our measures of information sharing are only crude proxies based on prior research, and that a
thorough investigation of intra-firm information transfers would deserve a separate paper.
The second mechanism of internal benchmarking posits that boards anticipate a greater intensity
of managerial lobbying at socially-connected firms and take into account considerations of equity when
setting managerial pay. First, social ties allow managers to learn about the pay raises of their peers before
they become effective, thus creating a window for lobbying. Second, social ties raise the pressure for
within-group conformity (McPherson, Smith-Lovin, and Cook 2001) and foster coordination between
peers (e.g., Attanasi et al. 2014). If boards rationally anticipate a higher degree of managerial coordination
and lobbying at socially-connected firms, they are likely to set more equitable pay raises.
We define three types of social ties: those via nonprofit organizations, education, and professional
activities. Connections via nonprofit organizations proxy for managerial interaction via social clubs,
sports clubs, and philanthropic activities. Because these connections are location-specific (e.g.,
Greenwich Country Club or United Way of Toledo), they also proxy for geographic proximity between
managers, which facilitates information sharing. Two managers are connected if they hold memberships
21
in the same nonprofit chapter. Educational ties foster a sense of belonging to a common group—alumni
network—as evidenced by alumni clubs and college sports. Two managers are connected if they hold
degrees from the same university. Finally, professional ties reflect work-related connections, and two
managers are connected if they worked together at another firm or served on the same board of directors.
We measure a divisional manager’s social ties in a given year by the average number of
connections to other divisional managers in the firm. To account for a manager’s access to the CEO and
the compensation committee, a proxy for the ease of lobbying, we also measure social ties between a
manager and these agents. Because divisional managers rarely serve on the compensation committee
(1.6% of observations), social ties provide an important channel of indirect access to its members.5
Table 5, Panel A shows that a divisional manager’s pay responds more strongly to an industry
change in another division when these managers have social ties, as indicated by the positive and
significant coefficients on the term ΔIndustry pay in other divisions x Social ties to other divisional
managers. In columns 4-6, the coefficients on the interaction term ΔIndustry pay in other divisions x
Social ties to compensation committee indicate that managers connected to the compensation committee
receive greater pay raises in response to the same industry change in pay. A similar increase in pay raises
is observed for managers connected to the CEO. This result is consistent with prior evidence that
managers with social ties to the board receive higher wages (Hwang and Kim 2009).
As another test of the benchmarking channel, we exploit a regulatory shock to the disclosure of
managerial pay intended to facilitate intra-firm comparisons of pay. Beginning December 15, 2006, the
SEC required publicly traded firms to provide a number of additional disclosures related to managerial
pay, such as a table listing the dynamics of a manager’s pay over the trailing three years, a similar table
comparing the dynamics of each director’s pay over the same horizon, and the disclosure of perquisites.6
In describing the goal of these disclosures, the SEC notes that “Improved disclosure under the
amendments of executive and director compensation … will better enable investors to make comparisons
both within and across companies” (SEC 2006, p. 236).
5 At the time of writing, public firms may no longer include corporate insiders on their compensation committees. In January 2013, the SEC approved the new listing standards of the NYSE and Nasdaq that mandate the independence of compensation committees of listed firms, and these requirements became effective on July 1, 2013. The definition of committee independence follows the independence rules of audit committees prescribed in the Sarbanes Oxley Act of 2002. 6 The full text of the new disclosure requirements can be accessed at: http://www.sec.gov/rules/final/2006/33-8732a.pdf
22

While it is debatable whether this regulation fulfilled its goal (a bias against finding any effect), it
produced a spike in the focus on benchmarking and internal comparisons of pay. For example, the SEC
reports receiving over 20,000 letters from firms and investors during a several-month comment period
and estimates that producing compensation comparisons would make “accelerated filers spend 60 hours
in the first year and 10 hours in each of the two succeeding years.” (SEC 2006, p. 9 and 98). 7
These
estimates demonstrate that the new regulation led to an increase in attention to compensation comparisons
and an increase in corporate effort dedicated to both internal and external benchmarking.
If the benchmarking channel contributes to intra-firm spillovers, its effect is expected to increase
with the new regulatory regime, a hypothesis we test in Table 5, Panel B. To minimize the possibility of a
spurious relation due to other governance reforms (e.g., Sarbanes Oxley), we compare the magnitude of
spillovers in the period immediately before the regulation (2005-2006) and immediately after (2007-
2008).8 We find that after the new regulation, the spillovers increase by 4.5-6.2 bps for every one
percentage point increase in industry pay. This effect, captured by the interaction term ΔIndustry pay in
other divisions x Enhanced disclosure, reflects an 18-21% increase in spillovers relative to their magnitude
before the regulatory change (shown by the coefficients on ΔIndustry pay in other divisions).
As a third test of the benchmarking channel, we study the effects of positive and negative
industry changes in pay. If the spillovers are related to intra-firm bargaining, we would expect managers
to bargain for pay increases in response to positive industry shocks and to bargain against pay reductions
in response to negative ones. To distinguish between positive and negative industry shocks, we define
∆Industry pay in other divisions+ (∆Industry pay in other divisions -) as the average percentage changes
in the industry pay of the other divisions when the average change is positive (negative) and 0 otherwise.
We also introduce analogous variables for the positive and negative changes in managerial pay in the
division’s own industry: ∆Industry pay+ and ∆Industry pay.-.
Table 5, Panel C shows that the spillovers are driven by pay raises. The coefficients on ∆Industry
pay in other divisions+ are positive and significant at the 1% level across all columns. In contrast, the
7 Securities and Exchange Commission Final Rule on Executive Compensation and Related Person Disclosure (page 9), release Nos. 33-8732A; 34-54302A; IC-27444A; File No. S7-03-06, available at http://www.sec.gov/rules/final/2006/33-8732a.pdf 8 According to the SEC timeline, because the 2006 managerial pay had been already determined before the new rules became effective, our “after” period starts in 2007, the first year when the additional disclosures may affect the pay-setting process.
23

coefficients on ∆Industry pay in other divisions - are not significant at conventional levels and have much
smaller point estimates. A similar asymmetric pattern – namely, a higher sensitivity to industry pay
increases than to pay decreases – is also observed for pay changes in the division’s own industry. This
asymmetry between positive and negative changes in pay is consistent with downward rigidity in wages
and the predictions of the benchmarking channel.
Overall, the benchmarking channel contributes to the spillovers in pay. Our findings add to prior
evidence on other types of benchmarking in conglomerates, such as using the same discount rate to
benchmark returns across divisions (Graham and Harvey 2001; Krueger, Landier, and Thesmar 2015).
4.3. Internal Transfers between Divisions
Divisions of conglomerates are linked through intra-firm transfers, such as transfers of materials and
talent. If technological changes in one division raise the marginal product of managers in other divisions,
the corresponding increase in these managers’ pay could be consistent with efficient contracting.
If this channel is operative, spillovers should be stronger between divisions in economically
related industries. To identify such industries, we obtain data on cross-industry transfers from the 2002
input-output matrix of the Bureau of Economic Analysis. Following Ahern and Harford (2014), we
calculate the percentage of industry i’s sales purchased by industry j and the percentage of industry j’s
inputs purchased by industry i. We define industries i and j as related if either percentage exceeds 1%.
Finally, we define an indicator Industry relatedness, which is equal to 1 if the division is related to any of
the other divisions’ industries and 0 otherwise. In our sample, 27.6% of the divisions are industry-related.
Columns 1-3 of Table 6 augment our baseline regression with the interaction term ΔIndustry pay
in other divisions x Industry relatedness. If the spillovers in pay are driven by transfers between related
industries, we should observe a positive and significant coefficient on this term. In contrast to this
prediction, the coefficients on the interaction term are statistically indistinguishable from zero across
columns 1-3, and the point estimates are an order of magnitude smaller than the baseline effect of
spillovers captured by the variable ΔIndustry pay in other divisions. To the extent that our proxies are
correlated with intra-firm transfers, their contribution to compensation spillovers is weak.
24
Another possible manifestation of this channel is the transfer of human capital. Even if two
divisions have no overlap in materials, they may rely on similar managerial talent. For example, Tate and
Yang (2015) find that conglomerates have active internal labor markets that move employees across
divisions. In this case, a positive industry change in one division may raise employment options for
managers in other divisions, and managers’ pay raises may reflect these improved options.
This channel predicts that compensation spillovers will be stronger for managers with experience
in multiple industries, a proxy for transferable skills. To test this hypothesis, we use divisional managers’
work histories to construct the indicator Experience outside industry, which is equal to 1 if a divisional
manager has experience in multiple industries over the past decade and 0 otherwise. Experience is defined
as professional service in a standalone firm or a conglomerate’s division in a given industry.
In columns 4-6 of Table 6, we add the interaction term ∆Industry pay in other divisions x
Experience outside industry to our base specification. This interaction term captures the differential effect
of industry shocks on the pay of divisional managers with multi-industry experience. Across columns 4-6,
the coefficients on the interaction term are economically small and insignificantly different from zero,
indicating that the spillovers in pay are not significantly different between divisional managers with
multi-industry experience and those without any experience outside their industry.
In our final test of this channel, we use changes in the wages of managers at standalone firms as a
proxy for changes in their marginal products (under the assumption of efficient contracting). Under this
assumption, a positive association between an industry pay change in one division and the pay of
managers in other divisions reflects their common exposure to a factor that affects marginal products in
multiple industries. To test this hypothesis, we remove the common components of industry pay changes
and focus on their idiosyncratic residuals. By construction, these idiosyncratic industry pay changes are
uncorrelated with pay changes in any other industry in the same three-digit SIC classification.
To extract the idiosyncratic component of changes in industry pay, we rely on statistical analysis.
This approach allows for a unique correlation structure at the level of each industry pair and avoids a
selection bias in defining an ex ante driver of changes in pay. For each industry, we regress industry-level
changes in CEO pay at standalone firms on industry-level changes in CEO pay at standalone firms in all
other industries, thus extracting the industry-specific residual change in pay after accounting for all
25

pairwise correlations between a given industry and all other industries. The distribution of the
idiosyncratic residuals of changes in industry pay appears in Table 1. Next, we replace the percentage
change in industry pay in earlier tests with this new measure of industry-specific change in pay.
Columns 7-9 of Table 6 show how a divisional manager’s pay is associated with idiosyncratic
pay changes in his own industry and idiosyncratic pay changes in the industries of other divisions of the
conglomerate. The main independent variables of interest are ΔIndustry pay and ΔIndustry pay in other
divisions. ΔIndustry pay is defined as the residual from regressing the average percentage change in CEO
pay of standalone firms in each industry on the average percentage change in CEO pay of standalone
firms in all other industries. Analogously, ΔIndustry pay in other divisions is defined as the average
residual ΔIndustry pay in all other industries in the conglomerate.
The removal of the common movements in pay across industries has little effect on the magnitude
of spillovers. A divisional manager’s pay responds strongly to an idiosyncratic change in industry pay in
another division, and the magnitude of this effect is similar to that obtained using raw changes in pay.
This suggests that the response of a divisional manager’s pay to pay changes in other divisions is not
driven by the common changes in marginal products across industries, to the extent that they are reflected
in managerial wages at standalone firms.
In summary, among the three possible channels of spillovers examined in this section, we find
stronger evidence in support of the distribution of excess cash and intra-firm benchmarking. In contrast,
the evidence in support of intra-firm transfers is relatively weak.
4.4. Governance
The analysis so far suggests that spillovers are magnified in the presence of excess cash and intra-firm
social ties. If these attributes reflect agency frictions, spillovers should be associated with weaker
governance. However, if social ties and extra cash increase divisional managers’ productivity, for
example, by supporting cooperation and operating flexibility, spillovers should be associated with
stronger governance. To distinguish between these interpretations, we study the association between the
intensity of spillovers and three dimensions of governance: (i) firm-level governance, (ii) composition of
the compensation committee, and (iii) quality of compensation advisers.
26

Table 7, Panel A focuses on firm-level measures of governance: (1) block ownership, defined as
an indicator equal to one if the percentage of shares held by any one institutional investor exceeds 5%, (2)
board independence, defined as the ratio of the number of independent directors to the total number of
directors, and (3) the Gompers, Ishii, and Metrick (2003) governance index. As before, the dependent
variable is one of the measures of a divisional manager’s annual percentage change in pay. The main
independent variable of interest is the interaction term ∆Industry pay in other divisions x Governance,
which shows how spillovers are associated with the three governance measures.
Panel A shows that compensation spillovers decline in the presence of strong governance. Based
on columns 1-3, a change in a divisional manager’s pay in response to a one percentage change in
industry pay in another division is reduced by 7-9 bps in the presence of large blockholders, as shown by
the negative and significant coefficients on the main interaction term, suggesting an over 20% reduction
in spillovers relative to the baseline effect. Similar conclusions emerge from the evidence on board
independence and the G-index: stronger governance is associated with smaller spillovers in pay.
Panel B focuses on the compensation committee and introduces three measures of its governance.
The first variable, Independent committee, is an indicator that equals 1 if all the committee members are
independent directors and 0 otherwise. The second variable, Socially independent committee, is an
indicator that equals 1 if the committee members have no social ties to the CEO or divisional managers
and 0 otherwise. This proxy reflects the evidence that social ties to managers weaken the boards’
monitoring and increase managerial influence on pay (Hwang and Kim 2009) and other firm policies
(Fracassi and Tate 2012; Ishii and Xuan 2014). The third variable, Committee appointed under a prior
CEO, is an indicator that equals 1 if any of the committee members was appointed before the incumbent
CEO and 0 otherwise. This measure is motivated by the evidence that managers influence board
appointments (Shivdasani and Yermack 1999; Denis, Denis, and Walker 2014) and retain more power
under the directors appointed during the managers’ tenure (Coles, Daniel, and Naveen 2014).
Panel B shows that internal spillovers are significantly reduced when a firm’s compensation
committee is more independent. This result persists across all measures of committee independence, as
shown by the consistently negative and statistically significant interaction terms of committee
independence and ∆Industry pay in other divisions across all nine specifications.
27

Panel C focuses on compensation advisers. Using data from Equilar, we construct two variables
that measure the extent to which a firm’s compensation policies are subject to an external review. The
first variable, Review by an external compensation adviser, is an indicator equal to 1 if the firm employs
an external compensation adviser and 0 otherwise. The second variable, Large compensation adviser, is
an indicator that equals 1 if the adviser is one of the ‘big four’ advisory firms – the largest firms based on
the number of clients (Frederic W. Cook & Co., Towers Perrin, Mercer, and Hewitt Associates). We posit
that monitoring incentives increase with the advisory firm’s reputation capital (proxied by size).
Panel C shows that the intensity of spillovers declines in the presence of advisory firms,
particularly when these advisers are large and reputable. Based on the estimates in columns 6, the
magnitude of spillovers is reduced by 29% in the presence of large compensation advisers.9
Overall, spillovers in pay increase when managers play a greater role in the pay-setting process
and decline in the presence of strong governance and external monitoring. These patterns persist across
multiple layers of governance, suggesting that they likely reflect an overall balance of power inside a firm.
5. Links between Spillovers in Pay and Capital Budgeting
This section examines how the redistribution of pay is related to another key resource distributed to
divisional managers – investment funds. This analysis is motivated by theoretical work on corporate
diversification which shows that monetary pay and capital budgets serve as the primary incentives for
divisional managers, which should be examined jointly in the analysis of corporate outcomes.
For example, in Scharfstein and Stein (2000), CEOs allocate resources to divisional managers in
the form of monetary pay or capital budgets. Since the authors wish to focus on capital budgets, they
make two assumptions that lead the CEO to reallocate capital instead of pay. First, the CEO does not
derive any utility from paying managers in cash, but can spend any unallocated capital funds on himself.
Second, a divisional manager is indifferent between being paid in cash or with investment funds (i.e., a
$10,000 increase in the division’s capital budget provides the same utility as a $10,000 pay raise). The
authors acknowledge that their assumptions are “not intended to be realistic” (p. 2548) and that when they
are relaxed, firms will redistribute both investment capital and pay.
9 Based on the point estimates in column 6, the reduction is measured as follows: (-0.048-0.046)/0.325 = -29%.
28
This section considers such a general setting and studies the conditions that influence a firm’s
choice between the two methods of redistribution. We also investigate how both types of redistributions
affect the link between each resource’s marginal product and its allocation inside the firm.
5.1. Redistribution of Capital and Pay
To study the link between the allocation of capital and pay, we develop measures of their redistribution
inside the firm. To measure pay redistribution, we estimate the firm-level elasticity of a divisional
manager's percentage change in pay relative to (i) changes in pay in his industry and (ii) the average
change in pay in other industries of the same conglomerate. This approach follows the intuition that
spillovers increase the elasticity to changes in pay in other industries and reduce the elasticity to the
division’s own industry. We also construct an analogous measure of capital redistribution by estimating
the firm-level elasticity of the percentage change in divisional CapEx to (i) changes in Tobin’s Q in the
division’s industry and (ii) the average change in Tobin’s Q in other industries of the conglomerate.10
Industry-level changes in the average pay and Q are estimated based on standalone firms. We estimate
four firm-level elasticities: (1) elasticity of ∆Pay to own industry, (2) elasticity of ∆Pay to other industries,
(3) elasticity of ∆CapEx to own industry, and (4) elasticity of ∆CapEx to other industries. We define Pay
redistribution index as the average between the percentile ranking of the ∆Pay elasticity to other
industries and the percentile ranking of the negative ∆Pay elasticity to own industry. We define Capital
redistribution index analogously. The details on the estimation of elasticities appear in Appendix B.
Appendix Table B2 shows summary statistics for the redistribution indexes. The table shows that
the redistributions of pay and capital are positively correlated. The correlation between Pay redistribution
index and Capital redistribution index ranges from 0.22 to 0.25 (significant at the 1% level), depending
on the measure of divisional managers’ pay. These estimates imply that redistributions of pay and capital
arise in similar firms and appear to be firm-specific, consistent with our earlier analysis of firm
boundaries. The relatively modest correlation magnitudes imply that these practices are far from perfectly
correlated – namely, firms choose to redistribute one type of resources more than the other.
10 This measure of capital redistribution follows prior work on cross-subsidization in internal capital markets to facilitate comparisons of the evidence (e.g., Shin and Stulz 1998; Billett and Mauer 2003; Ozbas and Scharfstein 2010).
29
Our analysis of a firm’s choice between the two methods of redistribution is motivated by
theoretical work. Theory suggests that resource distribution inside a firm depends on how the incentives
of agents responsible for these decisions are balanced against the disciplining forces that align these
incentives with those of other stakeholders. This tension has been modeled separately in the allocation of
capital (Scharfstein and Stein 2000) and pay (DeMarzo and Kaniel 2015). Motivated by this work, we
conjecture that a firm’s choice of the method of resource redistribution depends on the balance between
managers’ control rights over the particular decision and the disciplining forces that affect this type of
resource distribution: (a) internal controls, (b) external shareholder influence, and (c) market competition.
Table 8 studies the determinants of the balance between the redistribution of pay and capital
inside conglomerates. The dependent variable is the ratio of the pay redistribution index to the capital
redistribution index. Columns 1-6 characterize the scrutiny of the firm’s pay-setting process.
In columns 1-3, the main independent variable is a measure of internal controls in the pay-setting
process – namely, the independence of a firm’s compensation committee (an indicator that equals 1 if the
committee is fully independent and 0 otherwise). The number of firms is the same as in the main sample,
but the number of observations declines because the unit of observation is now a firm-year rather than a
division year (given the focus on firm-level policies) and because we use five-year rolling windows to
obtain reliable estimates of the intra-firm elasticity of pay and capital for the redistribution indexes.
Columns 4-6 focus on shareholders’ scrutiny of a firm’s compensation practices, measured by the
initiation of compensation-related proposals. Data on shareholder proposals come from Institutional
Shareholder Services (ISS), cover S&P 1500 firms, and include the shareholder meeting date, proposal
topic, and outcome. Using a four-digit topic code assigned by ISS, we identify shareholder proposals
related to compensation. Of the 1,087 proposals for our sample firms, 18.7% are classified as related to
compensation. We define Shareholder compensation proposals as an indicator that equals 1 if
shareholders made a proposal about compensation over the last three years and 0 otherwise. This indicator
is equal to 1 for 20.1% of firm-year observations. Conditional on having a compensation proposal,
shareholders raise 1.7 proposals, on average, within a three-year window. We alert the reader that
shareholder scrutiny of pay, like most other governance variables, is an endogenous outcome, and our
analysis only seeks to describe its associations with the method of resource distribution.
30

Columns 7-9 examine a key disciplining force in investment decisions – product market
competition. This analysis is grounded in theoretical work in industrial organization that singles out
product market competition as one of the main disciplining mechanisms in a firm’s investment decisions
(e.g., Fudenberg and Tirole 1983). We conjecture that competition increases the cost of redistributing
capital from strong to weak divisions because attractive investment opportunities are quickly captured by
rivals. For example, Grenadier (2002) shows analytically that competitive threats reduce investment
delays. Simintzi (2013) provides evidence that corporate investment responds quickly to competitive
threats. To measure product market competition, we focus on product market fluidity. This measure,
defined in Appendix A, was developed in Hoberg, Phillips, and Prabhala (2014) from textual analysis of
corporate disclosure as a proxy for the firm’s own assessment of the intensity of competition.
Table 8 shows that the variation in a firm’s competitive landscape and the scrutiny of its pay-
setting process help explain the balance between the redistribution of capital and pay. Columns 1-6 show
that firms facing a higher scrutiny of compensation policies, proxied by a more independent compensation
committee (columns 1-3) and shareholder activism on compensation issues (columns 4-6), are more likely
to redistribute capital rather than pay. Columns 7-9 show that firms facing competitive threats in the
product markets are less likely to redistribute capital rather than pay. These relationships arise across all
measures of pay and are statistically significant at conventional levels.
In summary, our evidence is consistent with a simultaneous cross-subsidization via managerial
pay and capital budgets inside conglomerates. These practices are positively correlated and arise in
similar firms. A firm’s choice between the redistribution of capital and pay depends on the monitoring
intensity of the pay-setting process and the strength of product market competition.
5.2. Resource Redistribution and Marginal Products
This subsection studies how the redistribution of capital and pay affects the link between the marginal
product of each resource and its allocation inside the firm. This analysis makes a step toward
understanding the relation between intra-firm spillovers and the productivity of capital and labor.
To examine the relation between intra-firm spillovers in pay and the productivity of labor, we
study how compensation spillovers affect the link between a manager’s pay and his marginal product. As
31

a measure of a manager’s marginal product, we use divisional ROA, the main evaluation criterion for
divisional managers’ performance (Cichello, Fee, Hadlock, and Sonti 2009). If compensation spillovers
are consistent with efficient contracting, they should tighten the link between a manager’s pay and
performance. In contrast, if compensation spillovers are symptomatic of agency frictions, they should
weaken managerial incentives and loosen the link between pay and performance.
We use a similar framework to study how capital redistributions affect the link between
investment and the marginal product of capital. Following the literature on internal capital markets which
studies the sensitivity of capital investment to its marginal product (e.g., Shin and Stulz 1998; Ozbas and
Scharfstein 2010), we use industry Q as a proxy for the marginal product of capital. If the redistributions
of capital are consistent with efficient cross-subsidization, as in Stein (1997), they should increase the
sensitivity of investment to the marginal product of capital. If, on the other hand, such redistributions
reflect agency frictions inside the firm, as in Rajan, Servaes, and Zingales (2000), they should weaken the
link between the allocation of capital and its marginal product.
Table 9 tests how the redistributions of capital and pay affect the link between the allocation of
these resources and their marginal products. Columns 1-3 examine the relation between the intra-firm
redistribution of pay and the sensitivity of a divisional manager’s pay to performance. Column 4
examines the relation between the intra-firm redistribution of capital and the sensitivity of investment to
the marginal product of capital.
Table 9 shows two main results. First, the redistributions of pay weaken the link between
managerial performance and compensation. The coefficients on the interaction term between the pay
redistribution index and managerial performance are consistently negative across all components of
managerial pay and statistically significant at the 5% level in two of the three specifications (columns 2-
3). Second, the redistributions of capital across divisions weaken the link between divisional investment
and the marginal product of capital, as shown by the negative and statistically significant interaction term
of the capital redistribution index and industry Q in column 4.
In summary, the redistributions of capital and pay appear to loosen the link between a resource’s
marginal product and its allocation across divisions.
32

6. Economic Outcomes
This section studies the association between intra-firm spillovers and economic outcomes. Because
corporate outcomes depend on a variety of correlated factors, separating out the marginal contribution of
each effect is challenging. Thus, the goal of this analysis is to understand whether the spillovers in pay
and investment are positively or negatively associated with firm outcomes rather than to estimate the
precise magnitude of these effects or to provide causal inferences.
6.1. Empirical Predictions
The evidence in the previous sections suggests that managerial pay in conglomerates is less sensitive to
changes in pay in the manager’s own industry, but is significantly affected by changes in pay in other
industries within the boundaries of the firm. This pattern condenses the distribution of pay raises inside
the firm and contributes to internal pay equity, a result that may have several possible interpretations.
On the one hand, more equitable pay raises may increase internal collaboration across divisions,
encourage resource sharing, and improve managerial effort. This view, which we label the collaboration
hypothesis, is consistent with models of organization design (e.g., Kogut and Zander 1992) and
experimental evidence (Pfeffer and Langton 1993; Woolley et al. 2010). To promote collaboration and
improve effort, a firm may design a contract under which a manager’s pay is sensitive to the performance
of his peers. For example, DeMarzo and Kaniel (2015) show theoretically that such contracts can be
optimal and value-increasing. Under this view, the spillovers improve performance and value.
On the other hand, the spillovers may be driven by managerial influence, thus reflecting the
interests of managers to a greater extent than those of shareholders. For example, if an industry factor
raises one divisional manager’s marginal product, others managers may lobby for a pay raise even if their
productivity was unaffected, consistent with predictions of managerial rent-seeking in conglomerates
(e.g., Rajan, Servaes, and Zingales 2000). This would dampen pay raises in the affected divisions (to
avoid internal distortions), while also pushing up wages in the unaffected ones. This scenario is consistent
with the evidence in the previous sections that the spillovers are amplified under weaker governance and
that they dampen the sensitivity of pay to performance. According to this view, which we label the
managerial influence hypothesis, the spillovers are unlikely to improve performance and value.
33

6.2. Performance and Value
This subsection studies whether the redistributions of managerial pay and investment funds in
conglomerates are associated with three firm outcomes: performance, Tobin’s Q, and excess value.
Table 10 tests whether spillovers predict firm outcomes. In columns 1-3, the dependent variable is
firm-level operating performance (Profitability), defined as the ratio of net income to assets. In columns
4-6, the dependent variable is firm-level Tobin’s Q, which approximates the ratio of the firm’s market
value to its book value.11 In columns 7-9, the dependent variable is Excess value, which compares the
conglomerate’s valuation with that of standalone firms in the same industries. Following Berger and Ofek
(1995), Excess value is the natural logarithm of the ratio of the conglomerate’s actual value to its imputed
value. A firm’s actual value is the sum of the book value of debt, the liquidation value of preferred stock,
and the market value of equity. A firm’s imputed value is the sum of the imputed values of its segments,
where each segment’s imputed value is equal to the segment’s book assets multiplied by the median ratio
of the market to book ratio for standalone firms in the same industry.
The analysis of the association between the intra-firm spillovers and performance outcomes is
subject to two sources of endogeneity: (1) simultaneity (reverse causality) and (2) omitted variables.
The first issue – simultaneity – arises because an empirical relation between spillovers and firm
outcomes may indicate that the spillovers respond to corporate outcomes rather than affect them. For
example, strong or weak corporate performance may generate infra-firm spillovers. To mitigate this
concern, our analysis relies on predictive regressions, where all dependent variables are measured in the
next period – that is, they follow the intra-firm spillovers.
The second issue – omitted variable – may arise because a missing factor could drive performance
outcomes while being correlated with spillovers. To mitigate this possibility, our analysis controls for the
main firm characteristics that have been shown to affect performance and value of conglomerates: Size
(logarithm of the firm’s book assets), Number of divisions, Herfindahl index of division size, Diversity in
Q, and Leverage, which are defined in Appendix A. To reduce the possibility of an unobservable omitted
variable, all regressions include firm fixed effects, which absorb the influence of all attributes that remain
11 Following Kaplan and Zingales (1997), Tobin’s Q = market value of assets (book assets (at) + market value of common equity (csho*prcc) - common equity (ceq) - deferred taxes (txdb)) / (0.9*book value of assets (at) + 0.1*market value of assets).
34

unchanged during our sample period. To account for the effect of business cycles and nationwide
temporal variation in performance outcomes, all regressions include year fixed effects.
Table 10 shows that intra-firm redistributions of pay are associated with lower profits and firm
values in the subsequent year. Pay redistribution index is negatively related to all of the three outcome
measures: forward-looking profitability, Tobin’s Q, and Excess value. This negative relation is uniformly
consistent across all columns and statistically significant in seven of the nine columns. Based on the
estimates for total pay (Pay3) in Table 10, a one standard deviation increase in Pay redistribution index
corresponds to a subsequent decrease of 1.4% in profitability and of 5.8% in Tobin’s Q.
Redistributions of capital are also negatively related to future performance and value, consistent
with prior work (e.g., Rajan, Servaes, and Zingales 2000; Ozbas and Scharfstein 2010). The coefficients
on the capital redistribution index are uniformly negative across all columns and statistically significant in
six of the nine specifications. According to the specifications that correspond to total pay, a one standard
deviation increase in Capital redistribution index is followed by a 0.6% decrease in profitability and a
2.2% decline in Excess value. This result is consistent with the findings in Shin and Stulz (1998) that an
increase in capital redistributions across divisions is associated with a steeper conglomerate discount.
Overall, the evidence is more consistent with the managerial influence hypothesis. A necessary
condition underlying this hypothesis is that managers’ private rents from resource redistribution exceed
the decline in their incentive pay from the erosion in firm value. Jensen and Murphy (1990) empirically
investigate this assumption and find that a $1,000 change in shareholder wealth corresponds to only a
$1.85 change in the CEO’s wealth for larger firms (similar to those in our sample) and a $3.25 change for
the average firm. These estimates are based on changes in the combined value of a manager’s salary,
bonus, stock holdings, options, and the expected loss from a higher likelihood of dismissal. The authors
conclude that these incentives are unlikely to discourage even the most egregious agency behavior
because managers internalize most of the private benefits but bear only a small fraction of the costs.
In summary, the results in this section suggest that both types of redistributions – those of capital
and pay – are important for corporate outcomes. When included jointly in the analysis, they predict
significant declines in near-term operating performance and valuation. These distinct effects suggest that
the analysis of managerial pay helps extend prior work on resource allocation in conglomerates.
35

6.3. Robustness
We open this subsection by testing the robustness of our evidence to an alternative measure of intra-firm
redistributions. We then further evaluate the possibility of an omitted variable and consider an alternative
explanation for our evidence on performance outcomes.
In our main analysis, we measure the intensity of compensation spillovers by using the sensitivity
of a manager’s pay to changes in pay in the manager’s own industry and to industries in other divisions of
the conglomerate. An advantage of this approach is that it is based on a direct estimation of time-varying,
firm-specific elasticities of managerial pay that incorporate the unique industry mix of each conglomerate.
A limitation of this approach is that it imposes a linear structure on the estimation of elasticities and
requires a sufficient number of data points to estimate the regression (as discussed, we use a five-year
rolling estimation window to obtain reliable firm-specific estimates).
To evaluate the robustness of our evidence, we introduce an alternative measure of spillovers,
which is free from modeling assumptions on functional form and does not require a time series for
estimation. This alternative measure is the cross-divisional dispersion in the annual changes in industry-
adjusted pay (Heterogeneity in ∆Pay) and capital budgets (Heterogeneity in ∆Capital). The intuition
behind this measure is that intra-firm redistributions of resources lead to a more even allocation of these
resources across divisions and reduce the dispersion in pay raises and investment budgets.
Appendix Table B2 shows summary statistics for the new measure of redistribution. Consistent
with our earlier evidence, redistributions of pay and capital are positively correlated. The correlation
between the intra-firm Heterogeneity in ∆Pay and Heterogeneity in ∆Capital is 0.30-0.32 (significant at
the 1% level), a level comparable to the correlation between Pay redistribution index and Capital
redistribution index (0.22 to 0.25, also significant at the 1% level).
Appendix Table C4 studies the association between the heterogeneity in intra-firm resource
allocation across divisions and firm outcomes. These alternative measures of redistribution yield similar
conclusions as in Table 10. In particular, a higher magnitude of spillovers (indicated by lower intra-firm
heterogeneity in pay raises) predicts a decline in profitability and value. This relation is indicated by the
strong positive association between the heterogeneity in pay and future performance outcomes, which is
36

statistically significant in eight of the nine specifications. A similar relation, albeit of weaker statistical
significance, is observed for the heterogeneity in the distribution of capital.
Overall, internal spillovers in conglomerates are associated with lower next-period profits and
firm values. These conclusions persist whether the intensity of spillovers is measured by the redistribution
indexes or by the heterogeneity of intra-firm resource distribution.
One alternative explanation for the relation between the spillovers and firm outcomes is that the
outcomes are driven by a firm characteristic unaccounted for in our analysis. Such a characteristic should
vary on an annual basis, remain uncaptured by our system of controls, arise only in response to industry
compensation shocks, and negatively predict future firm outcomes. One possible variable that would
satisfy these criteria is a change in CEO expectations about future firm value. If a positive industry shock
has a negative effect on the conglomerate’s future value and if the conglomerate’s CEO accurately
predicts this negative effect, he could distribute more pay to divisional managers to offset the impending
loss in the value of their incentive pay. In this case, the spillovers would be a response to an anticipated
decline in future performance and could serve as an optimal retention mechanism.
To test this hypothesis, we infer CEO expectations about the near-term firm value from their
insider trades. To construct a precise measure of expectations, we separate information-driven,
opportunistic trades from routine trades (those that occur according to a pre-specified sales plan) by
following the algorithm in Cohen, Malloy, and Pomorski (2012) and applying the filters suggested by the
authors. We only include open market purchases or sales, delete observations marked as inaccurate or
incomplete, and focus only on the trades by the CEO. Data come from the TFN Insider Filing database.
We use two measures to proxy for CEO expectations of a near-term performance decline. In
columns 1-3 of Appendix Table C5, the measure of CEO pessimism is an indicator Net Seller, which
takes on the value of one if the number of shares sold by the CEO exceeds the number of shares bought in
a given firm-year and zero otherwise. In columns 4-6, the measure of CEO pessimism is the variable Sell-
Buy Imbalance, defined as the difference between the number of shares sold and bought by the CEO,
scaled by the total number of shares traded by the CEO in a given firm-year.
The results in Appendix Table C5 do not support the alternative hypothesis. The coefficients on
the interaction terms between the measures of CEO pessimism and the magnitude of the spillovers are not
37

statistically significant across all columns. Moreover, they have the opposite sign of that predicted by the
alternative hypothesis: if anything, CEO pessimism is associated with a lower, not higher magnitude of
spillovers. The coefficients on the variables Net Seller and Sell-Buy Imbalance show that opportunistic
insider trades reliably predict near-term firm performance, consistent with prior evidence. This result
confirms that our variables capture the information component of CEO trades in the tests of the
alternative hypothesis. Overall, the evidence in Appendix Table C5 suggests that the additional pay
distributed to divisional managers following industry shocks is unlikely to reflect the CEO’s anticipation
of an imminent decline in the future value of company stock.
In summary, our evidence is consistent with simultaneous cross-subsidization via managerial pay
and capital budgeting and suggests that these practices are not performance-enhancing. While this
conclusion appears robust to different measures of spillovers and some alternative hypotheses, we view
this evidence as suggestive, given the aforementioned empirical challenges.
Conclusion
This article studies spillovers in managerial pay in conglomerates. We find that an increase in industry
pay in one division raises managerial pay in other divisions, an effect confined by the boundaries of the
firm. Such spillovers are stronger when firms have more excess cash and when managers are more likely
to influence its distribution. The spillovers loosen the link between managerial pay and performance.
Our paper extends the literature on the allocation of resources in conglomerates. Complementing
prior work on the distribution of investment capital, we examine the distribution of both investment
capital and managerial pay. We find that intra-firm cross-subsidizations in investment funds and
managerial payoffs arise in similar firms.
Our paper also contributes to the debate on the relation between managerial pay and performance
outcomes in conglomerates. While some authors find a negative relation between intra-firm convergence
in pay and performance outcomes in conglomerates (e.g., Silva 2015 and Gartenberg and Wulf 2015),
other researchers find evidence consistent with optimal contracting (Alok and Gopalan 2015). We hope
that future work will provide causal evidence in this direction. Our evidence suggests that an increased
focus on the interplay between human capital and investment capital can provide further insights into the
inner workings of a firm.
38

References
Ahern, Kenneth, 2015. Information networks: evidence from illegal insider trading tips. Working paper. Ahern, Kenneth, and Jarrad Harford, 2014. The importance of industry links in merger waves, Journal of
Finance 69, 527–576. Ahn, Seoungpilm, and David Denis, 2004. Internal capital markets and investment policy: evidence from
corporate spinoffs. Journal of Financial Economics 71, 489–516. Akerlof, George, 1982. Labor contracts as partial gift exchange, 1982. Quarterly Journal of Economics
97, 543–569. Akerlof, George, 1984. Gift exchange and efficiency-wage theory: four views. American Economic
Review 74, 79–83. Akerlof, George, and Janet Yellen, 1990. The fair wage-effort hypothesis and unemployment, Quarterly
Journal of Economics 105, 255–283. Almeida, Heitor, Hwanki Brian Kim, and Chang-Soo Kim, 2015. Internal capital markets in business
groups: Evidence from the Asian financial crisis, Journal of Finance 70, 2539–2586. Alok, Shashwat, and Radhakrishnan Gopalan, 2015. Managerial compensation in multi-division firms.
Working paper. Attanasi, Giuseppe, Astrid Hopfensitz, Emiliano Lorini, Frédéric Moisan, 2014. The effects of social ties
on coordination: conceptual foundations for an empirical analysis. Phenomenology and the Cognitive Sciences 13, 47–73
Bates, Thomas, Kathleen Kahle, and René Stulz, 2009. Why do U.S. firms hold so much more cash than they used to? Journal of Finance 64, 1985–2021.
Bertrand, Marianne, and Sendhil Mullainathan, 2003. Enjoying the quiet life? Corporate governance and managerial preferences. Journal of Political Economy 111, 1043–1075.
Billett, Matthew, and David Mauer, 2003. Cross-subsidies, external financing constraints, and the contribution of the internal capital market to firm value. Review of Financial Studies 16, 1167–1201.
Bizjak, John, Michael Lemmon, and Lalitha Naveen, 2008. Does the use of peer groups contribute to higher pay and less efficient compensation? Journal of Financial Economics 90, 152–168.
Bizjak, John, Michael Lemmon, and Thanh Nguyen, 2011. Are all CEOs above average? An empirical analysis of compensation peer groups and pay design. Journal of Financial Economics 100, 538–555.
Blanchard, Olivier, Florencio Lopez-de-Silanes, and Andrei Shleifer, 1994. What do firms do with cash windfalls? Journal of Financial Economics 36, 337–360.
Cichello, Michael, C. Edward Fee, Charles Hadlock, and Ramana Sonti, 2009. Promotions, turnover, and performance evaluation: Evidence from the careers of division managers. Accounting Review 84, 1119–1143.
Cohen, Lauren, Andrea Frazzini, and Christopher Malloy, 2008. The small world of investing: board connections and mutual fund returns. Journal of Political Economy 116, 951–979.
Cohen, Lauren, Andrea Frazzini, and Christopher Malloy, 2010. Sell side school ties. Journal of Finance 65, 1409–1437.
Cohen, Lauren, Christopher Malloy, and Lukas Pomorski, 2012. Decoding inside information. Journal of Finance 67, 1009–1043. Coles, Jeffrey, Naveen Daniel, and Lalitha Naveen, 2014. Co-opted boards. Review of Financial Studies
27, 1751-1796. DeAngelo, Harry, Linda DeAngelo, and Douglas Skinner. 2000. Special dividends and the evolution of
dividend signaling. Journal of Financial Economics 57, 309–354. DeMarzo, Peter, and Ron Kaniel, 2015. Relative pay for non-relative performance. Working paper. Denis, David, 1990. Defensive changes in corporate payout policy: share repurchases and special
dividends. Journal of Finance 45, 1433–1456. Denis, David, and Diane Denis, 1993. Managerial discretion, organizational structure, and corporate
performance: a study of leveraged recapitalizations, Journal of Accounting and Economics 16, 209-236. Denis, David, Diane Denis, and Atulya Sarin, 1997. Agency problems, equity ownership, and corporate
diversification. Journal of Finance 52, 135–160. Denis, David, Diane Denis, and Keven Yost, 2002. Global diversification, industrial diversification, and
firm value. Journal of Finance 57, 1951–1980. Denis, David, Diane Denis, and Mark Walker, 2014. Breaking the ties that bind: board structure following
corporate spinoffs. Working paper.
39

Duchin, Ran, and Denis Sosyura, 2013. Divisional managers and internal capital markets, Journal of Finance 68, 387–429.
Fahlenbrach, Rüdiger, and René Stulz, 2011. Bank CEO incentives and the credit crisis. Journal of Financial Economics 99, 11–26.
Faulkender, Michael, and Jun Yang, 2010. Inside the black box: The role and composition of compensation peer groups, Journal of Financial Economics 96, 257–270.
Faulkender, Michael, and Jun Yang, 2013. Is disclosure an effective cleansing mechanism? The dynamics of compensation peer benchmarking, Review of Financial Studies 26, 806–839.
Fee, C. Edward and Charles Hadlock 2004. Management turnover across the corporate hierarchy. Journal of Accounting and Economics 37, 3–38.
Fee, C. Edward, Charles Hadlock, and Joshua Pierce, 2009. Investment, financing constraints, and internal capital markets: evidence from the advertising expenditures of multinational firms. Review of Financial Studies 22, 2361–2392.
Fracassi, Cesare, and Geoffrey Tate, 2012. External networking and internal firm governance, Journal of Finance 67, 153–194.
Fudenberg, Drew and Jean Tirole, 1983. Capital as a commitment: Strategic investment to deter mobility. Journal of Economic Theory 31, 227-250.
Gartenberg, Claudine, and Julie Wulf, 2015. Pay harmony: peer comparison and executive compensation, working paper.
Gompers, Paul, Joy Ishii, and Andrew Metrick, 2003. Corporate governance and equity prices, Quarterly Journal of Economics 118, 107–155.
Graham, John, and Campbell Harvey, 2001. The theory and practice of corporate finance: evidence from the field. Journal of Financial Economics 60, 187–243.
Graham, John, Campbell Harvey, and Manju Puri, 2015. Capital allocation and delegation of decision-making authority within firms. Journal of Financial Economics 115, 449–470.
Graham, John, Si Li, and Jiaping Qiu, 2012. Managerial attributes and executive compensation. Review of Financial Studies 25, 144-186.
Grenadier, Steven R., 2002. Option exercise games: An application to the equilibrium investment strategies of firms. Review of Financial Studies 15, 691–721.
Hart, Oliver, and John Moore, 2008. Contracts as reference points. Quarterly Journal of Economics 123, 1–48.
Hoberg, Gerard, and Gordon Phillips, 2015. Industry choice and product language, working paper. Hoberg, Gerard, Gordon Phillips, and Nagpuranand Prabhala, 2014. Product market threats, payouts, and
financial flexibility. Journal of Finance 69, 293-324. Hoechle, Daniel, Markus Schmid, Ingo Walter, and David Yermack, 2012. How much of the
diversification discount can be explained by poor corporate governance? Journal of Financial Economics 103, 41–60.
Hovakimian, Gayané, 2011. Financial constraints and investment efficiency: Internal capital allocation across the business cycle. Journal of Financial Intermediation 20, 264–283.
Hwang, Byoung-Hyoun, and Seoyoung Kim, 2009. It pays to have friends. Journal of Financial Economics 93, 138–158.
Ishii, Joy, and Yuhai Xuan, 2014. Acquirer-target social ties and merger outcomes. Journal of Financial Economics 112, 344–363.
Jensen, Michael C., and Kevin J. Murphy, 1990. Performance pay and top-management incentives. Journal of Political Economy 98, 225–265.
Kaplan, Steven, and Luigi Zingales, 1997. Do investment-cash flow sensitivities provide useful measures of financing constraints? Quarterly Journal of Economics 112, 169–215.
Kogut, Bruce, and Udo Zander, 1992. Knowledge of the firm, combinative capabilities, and the replication of technology. Organization Science 3, 383–397.
Krueger, Philipp, Augustin Landier, and David Thesmar, 2015. The WACC fallacy: the real effects of using a unique discount rate. Journal of Finance 70, 1253–1285.
Lang, Larry, and Rene Stulz, 1994. Tobin’s Q, corporate diversficiation, and firm performance. Journal of Political Economy 102, 1248-1280.
Lamont, Owen, 1997. Cash flow and investment: evidence from internal capital markets. Journal of Finance 52, 83–109.
40

Lins, Karl and Henri Servaes, 2002. Is corporate diversification beneficial in emerging markets? Financial Management 31, 5–31.
Maksimovic, Vojislav, and Gordon Phillips, 2007. Conglomerate firms and internal capital markets, in Handbook of Corporate Finance, 1: Empirical Corporate Finance, edited by B. Espen Eckbo.
Masulis, Ronald, Peter Pham, and Jason Zein, 2011. Family business groups around the world: Financing advantages, control motivations, and organizational choices. Review of Financial Studies 24, 3556–3600.
Masulis, Ronald, Peter Pham, and Jason Zein, 2015. Does group affiliation facilitate access to external financing? Evidence from IPOs by family business groups. Working paper.
Masulis, Ronald, and Shage Zhang, 2014. Compensation gaps among top corporate executives. Working paper.
McPherson, Miller, Lynn Smith-Lovin, and James Cook, 2001. Birds of a feather: homophily in social networks. Annual Review of Sociology 27, 415–444.
Ozbas, Oguzhan, and David Scharfstein, 2010. Evidence on the dark side of internal capital markets. Review of Financial Studies 23, 581–599.
Pfeffer, Jeffrey, and Nancy Langton, 1993. The effect of wage dispersion on satisfaction, productivity, and working collaboratively: evidence from college and university faculty. Administrative Science Quarterly 38, 382-407.
Rajan, Raghuram, Henri Servaes, and Luigi Zingales, 2000. The cost of diversity: the diversification discount and inefficient investment. Journal of Finance 55, 35–80.
Scharfstein, David, and Jeremy Stein, 2000. The dark side of internal capital markets: divisional rentseeking and inefficient investment. Journal of Finance 55, 2537–2564.
Schoar, Antoinette, 2002. The effect of diversification on firm productivity. Journal of Finance 62, 2379–2403.
Securities and Exchange Commission, 2006. Press releases No. 33-8732A and 34-54302A. Executive compensation and related person disclosure. Washington, DC. August 29, 2006.
Servaes, Henri, 1996. The value of diversification during the conglomerate merger wave. Journal of Finance 51, 1201–1225.
Shin, Hyun-Han, and René Stulz, 1998. Are internal capital markets efficient? Quarterly Journal of Economics 113, 531–552.
Shivdasani, Anil, and David Yermack, 1999. CEO involvement in the selection of new board members: an empirical analysis. Journal of Finance 54, 1829–1853.
Shue, Kelly, 2013. Executive networks and firm policies: evidence from the random assignment of MBA peers. Review of Financial Studies 26, 1401–1442.
Silva, Rui, 2015. Internal labor markets and investment in conglomerates. Working paper. Simintzi, Elena, 2013. Strategic investments: Evidence from restructuring announcements. Working
paper. Stein, Jeremy, 1997. Internal capital markets and the competition for corporate resources. Journal of
Finance 52, 111–133. Stein, Jeremy, 2003. Agency, information and corporate investment, in Handbook of the Economics of
Finance, edited by George Constantinides, Milton Harris and René Stulz, Elsevier, 111–165. Tate, Geoffrey, and Liu Yang, 2015. The bright side of corporate diversification: evidence from internal
labor markets. Review of Financial Studies 28, 2201–2015. Woolley, Anita, Chris Chabris, Alex Pentland, Nada Hashmi, and Thomas Malone, 2010. Evidence for a
collective intelligence factor in the performance of human groups. Science 330, 686–688. Xuan, Yuhai, 2009. Empire-building or bridge-building? Evidence from new CEOs' internal capital
allocation decisions. Review of Financial Studies 22, 4919–4948. Yermack, David, 2004. Remuneration, retention, and reputation incentives for outside directors. Journal
of Finance 59, 2281–2308.
41

Appendix A: Variable Definitions Note: Entries in parentheses refer to the annual Compustat item name. A.1. Firms
Earnings per share (EPS) = Basic EPS, including extraordinary items (epspi).
Free cash flow = Operating income before depreciation (oibdp) - total taxes (txt) - interest expense (xint) / total assets (at) at the beginning of the year.
Market-to-book = Market value of assets (book assets (at) + market value of common equity (csho*prcc) - common equity (ceq) - deferred taxes (txdb)) / (0.9*book value of assets (at) + 0.1*market value of assets).
Profitability = Net income (ni) / total assets (at) as of the beginning of the year.
Size = The natural logarithm of book assets (at) at the beginning of the year.
Stock return = Realized annual return on the firm’s stock.
Special dividend = an indicator that equals 1 if the firm initiates a special dividend and 0 otherwise. Following Denis (1990) and DeAngelo et al. (2000), dividend distributions are classified as special if they have CRSP distribution codes of 1262 or 1272, which correspond to dividends labeled ‘year-end’, ‘final’, ‘extra’, or ‘special.’
ΔExcess cash = The percentage change in the residual from regressing a firm’s cash ratio on a vector of control variables following the model in Bates, Kahle, and Stulz (2009), which includes cash flow, the market-to-book ratio, a foreign income dummy, net working capital (excluding cash), capital expenditure, debt, R&D expenditures, acquisitions, payout ratio, cash flow volatility, and firm size.
Diversity in Q = Standard deviation of Industry market-to-book over all divisions of a conglomerate.
Herfindahl index of division size = Herfindahl index based on the book assets of the division.
Leverage = Short-term debt (dlc) + long-term debt (dltt) / total assets (at) at the beginning of the year.
Number of divisions = The number of the conglomerate’s business segments reported on Compustat. A.2. Divisions
Cash flow = Annual net sales (sale) divided by book assets (at) as of the beginning of the year.
Industry market-to-book = The median market-to-book ratio across all single-segment firms in the division's industry (based on the 3-digit SIC code industry classification).
Industry relatedness = An indicator based on trade flows between industries obtained from input-output data provided by the Bureau of Economic Analysis. This measure is constructed using data from the 2002 industry input-output matrix. Following Ahern and Harford (2014), we calculate the percentage of industry i’s sales purchased by industry j and the percentage of industry j’s inputs purchased by industry i. We define industries i and j as related if either percentage exceeds 1%. The indicator Industry relatedness is equal to 1 if the division is related to any other division’s industry in the conglomerate and 0 otherwise.
ROA = Annual operating profit of a division (ops) divided by its book assets (at) as of the beginning of the year.
Size = The natural logarithm of the division’s identifiable total assets (ias) at the beginning of the year.
42

A.3. Divisional Managers
Age = Manager’s age in years.
Male indicator = An indicator equal to 1 if the manager is male and 0 if the manager is female.
Bachelor's degree indicator = An indicator equal to 1 if the manager has a bachelor’s degree and 0 otherwise.
Master’s degree indicator = An indicator equal to 1 if the manager has a master’s degree and 0 otherwise.
Board member indicator = An indicator equal to 1 if the manager is an inside director and 0 otherwise.
Tenure with the company = Number of years the manager worked at the firm.
Experience outside industry = An indicator equal to 1 if the divisional manager has worked at a standalone firm or a conglomerate division operating in a different industry over the past 10 years and 0 otherwise.
Social ties to CEO = The number of connections between the divisional manager and the CEO based on nonprofits, education, and prior employment.
Social ties to other divisional managers = The average number of connections between the divisional manager and the other divisional managers of the same firm based on nonprofits, education, and prior employment.
A.4. Pay and Investment Capital
Pay1 = Annual salary and bonus.
Pay2 = Annual salary and bonus plus stock and stock option grants.
Pay3 = Total annual compensation, including salary, bonus, other annual compensation, long-term incentive payouts, and other cash payouts.
ΔIndustry pay = The average percentage change in CEO pay of standalone firms which operate in the division’s industry, defined according to the 3-digit SIC code industry classification.
ΔIndustry pay in other divisions = The average percentage change in CEO pay of standalone firms which operate in the industries of the other divisions in the conglomerate.
ΔOther industry pay = The average percentage change in CEO pay of standalone firms which operate in other industries outside of the standalone firm’s core industry.
Idiosyncratic ΔIndustry pay = The residual from regressing the average percentage change in CEO pay of standalone firms in each industry on the average percentage change in CEO pay of standalone firms in all other industries.
Pay redistribution index = The average between the percentile ranking of the ∆Pay elasticity to other industries of the conglomerate and the percentile ranking of the negative ∆Pay elasticity to own industry. The elasticities are calculated by estimating a firm-by-firm regression of the percentage change in the manager’s pay on the average changes in the same industry and in the industries of the other divisions in the conglomerate, where industry-level pay is measured by the average CEO pay of standalone firms.
Capital redistribution index = The average between the percentile ranking of the ∆CapEx elasticity to other industries of the conglomerate and the percentile ranking of the negative CapEx elasticity to own industry. The elasticities are calculated by estimating a firm-by-firm regression of the division’s percentage change in capital expenditure on the average Tobin’s Q changes in the same industry and in the industries of the other divisions in the conglomerate.
43
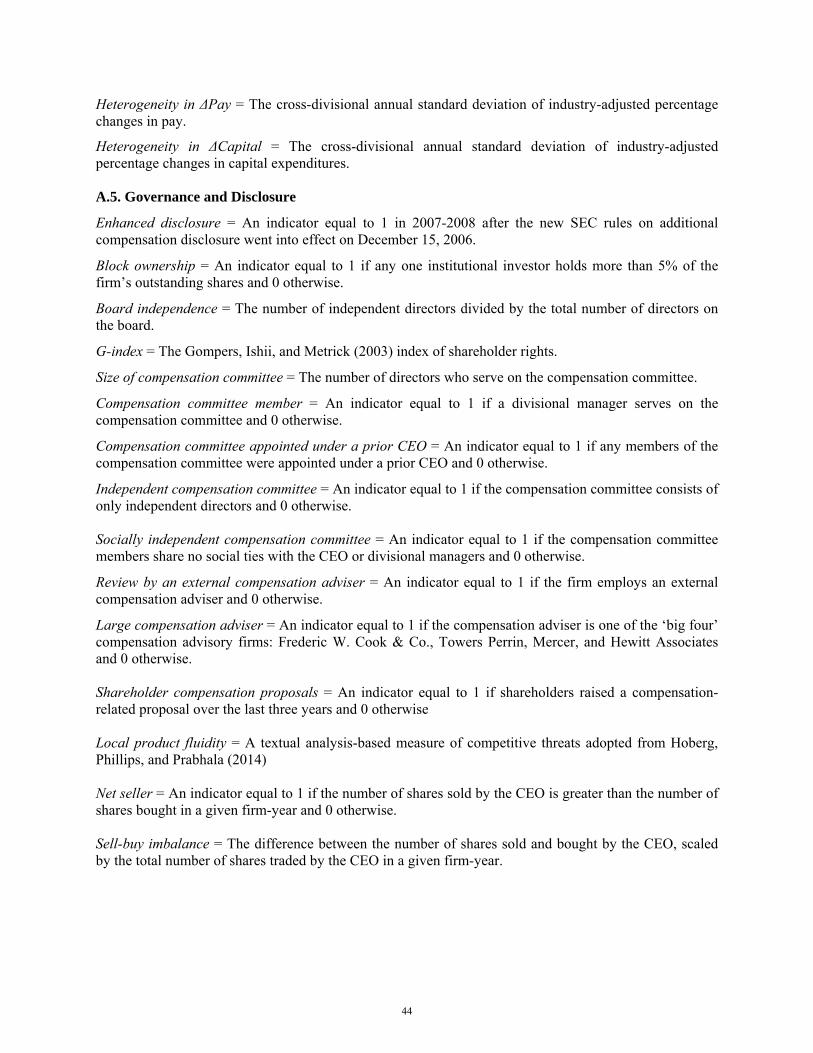
Heterogeneity in ΔPay = The cross-divisional annual standard deviation of industry-adjusted percentage changes in pay.
Heterogeneity in ΔCapital = The cross-divisional annual standard deviation of industry-adjusted percentage changes in capital expenditures. A.5. Governance and Disclosure
Enhanced disclosure = An indicator equal to 1 in 2007-2008 after the new SEC rules on additional compensation disclosure went into effect on December 15, 2006.
Block ownership = An indicator equal to 1 if any one institutional investor holds more than 5% of the firm’s outstanding shares and 0 otherwise.
Board independence = The number of independent directors divided by the total number of directors on the board.
G-index = The Gompers, Ishii, and Metrick (2003) index of shareholder rights.
Size of compensation committee = The number of directors who serve on the compensation committee.
Compensation committee member = An indicator equal to 1 if a divisional manager serves on the compensation committee and 0 otherwise.
Compensation committee appointed under a prior CEO = An indicator equal to 1 if any members of the compensation committee were appointed under a prior CEO and 0 otherwise.
Independent compensation committee = An indicator equal to 1 if the compensation committee consists of only independent directors and 0 otherwise. Socially independent compensation committee = An indicator equal to 1 if the compensation committee members share no social ties with the CEO or divisional managers and 0 otherwise.
Review by an external compensation adviser = An indicator equal to 1 if the firm employs an external compensation adviser and 0 otherwise.
Large compensation adviser = An indicator equal to 1 if the compensation adviser is one of the ‘big four’ compensation advisory firms: Frederic W. Cook & Co., Towers Perrin, Mercer, and Hewitt Associates and 0 otherwise. Shareholder compensation proposals = An indicator equal to 1 if shareholders raised a compensation-related proposal over the last three years and 0 otherwise Local product fluidity = A textual analysis-based measure of competitive threats adopted from Hoberg, Phillips, and Prabhala (2014) Net seller = An indicator equal to 1 if the number of shares sold by the CEO is greater than the number of shares bought in a given firm-year and 0 otherwise. Sell-buy imbalance = The difference between the number of shares sold and bought by the CEO, scaled by the total number of shares traded by the CEO in a given firm-year.
44

Appendix B: Sample and Variables B.1. Sample In this subsection, we describe the construction of our sample and compare the characteristics of the sample firms to those of all other industrial conglomerates in the S&P 1500 index. APPENDIX TABLE B1: Sample Construction and Characteristics This table describes the construction of the main sample, which consists of industrial conglomerates in the S&P 1500 index, excluding firms with functional organizational structure and firms with missing data on divisional managers or their pay. The sample period is from January 2000 to December 2008. Panel A shows sample selection criteria and provides the number of firms screened out by each sample filter. Panel B compares the characteristics of firms in the main sample with the characteristics of all other industrial conglomerates in the S&P 1500 index that are excluded by sample filters. The values reported are time-series averages over the sample period. All variable definitions appear in the Appendix. In Panel B, statistical significance levels for the test of the difference in means are indicated as follows: *=10%, **=5%, ***=1%. Panel A: Sample Construction
Sample # Firms # Divisions # Observations
S&P 1500 industrial firms with at least 2 divisions 806 3,024 13,672
- Firms with non-divisional organizational structure 396 1,706 7,491
- Firms with incomplete data on all divisional managers 35 127 566
- Firms with missing pay data on divisional managers 213 656 3,484
= Final Sample 162 535 2,131
Panel B: Comparison of Sample Characteristics
Variable Our sample Other S&P 1500 conglomerates
Difference t-statistic
Earnings per share (EPS) 1.659 1.477 0.182 1.486
Stock return 0.067 0.055 0.012 1.144
Free cash flow 0.066 0.056 0.010 1.160
Profitability 0.048 0.043 0.005 1.285
Investment 0.042 0.044 -0.002 -0.985
Market-to-book 1.910 1.819 0.091 1.126
Size (log assets) 8.638 7.158 1.480 6.344
45

B.2. OLS Assumptions
To test whether the standard OLS assumptions hold for our main regression analyses, we create the
regression residuals after running the regressions reported in columns 1-3 of Table 2. In these regressions,
the dependent variable is the annual percentage change in a divisional manager’s pay measured by ΔPay1,
ΔPay2, and ΔPay3, respectively.
We use these regression residuals to perform two tests. First, we investigate the heteroscedasticity
of the residuals. We test the null hypothesis that the variance of the residuals is homogeneous using
White’s test. The p-values for ΔPay1, ΔPay2, and ΔPay3 are 0.606, 0.467, and 0.519, respectively
(untabulated). We therefore cannot reject the null hypothesis that the variance is homogenous.
Second, in Appendix Figure B1, we investigate the normality of the residuals of our main
regression model. The normality assumption assures that the p-values for the t-tests will be valid.
Specifically, we produce a kernel density plot with a normal density overlaid on the plot for each of the
three dependent variables: ΔPay1, ΔPay2, and ΔPay3 (Panels A, B, and C, respectively). As evident from
the figure, the distribution of the regression residuals is well-behaved and approximately normal.
APPENDIX FIGURE B1: Normality of Regression Residuals This figure presents a kernel density plot of the residuals from the regressions in columns 1-3 of Table 2, which correspond to the dependent variables ΔPay1, ΔPay2, and ΔPay3, respectively. For comparison, a normal density is overlaid on the plot. Panel A: ΔPay1
01
23
Den
sity
-1 -.5 0 .5 1Residuals
Kernel density estimate
Normal density
kernel = epanechnikov, bandwidth = 0.0205
Kernel density estimate
46

Panel B: ΔPay2
Panel C: ΔPay3
01
23
4D
ensi
ty
-1 -.5 0 .5Residuals
Kernel density estimate
Normal density
kernel = epanechnikov, bandwidth = 0.0164
Kernel density estimate0
12
34
Den
sity
-1 -.5 0 .5Residuals
Kernel density estimate
Normal density
kernel = epanechnikov, bandwidth = 0.0159
Kernel density estimate
47

B.3. Redistribution Measures
In this subsection we detail the construction of the measures of the redistribution of pay and capital inside
conglomerates. Appendix Table B2 provides summary statistics for these measures.
B.3.1. Pay Redistribution Index
The pay redistribution index is a composite index that measures the elasticity of a divisional manager’s
pay to the pay of managers in his industry and in the industries of the other divisional managers in his
company.
The index is calculated in two steps. First, we estimate firm-by-firm 5-year rolling window
regressions of the annual percentage change in the divisional manager’s pay on the average annual
changes in the pay of managers in the same industry and in the industries of the other divisions in the
conglomerate. The industry-level measures of pay are computed by using the pay of CEOs of standalone
firms that operate in one industry, defined according to the 3-digit SIC code industry classification. To
provide a reliable estimate of industry averages, we require that each industry contain at least 5 publicly-
traded standalone firms with available data on executive pay that operate in the same 3-digit SIC code.
After we impose this requirement, the average (median) number of standalone firms in an industry-year is
15.5 (9). This step generates two elasticities per firm: (1) average same-industry pay elasticity; and (2)
average other-industry pay elasticity. Note that the same-industry pay elasticity captures the manager’s
outside option, whereas the other-industry pay elasticity captures pay spillovers across industries in the
same conglomerate.
Second, we calculate the percentile ranking of the two elasticities across all the firms in our
sample. To compute Pay redistribution index, we use the average between the percentile ranking of the
∆Pay elasticity to other industries and the percentile ranking of the negative ∆Pay elasticity to own
industry.
B.3.2. Capital Redistribution Index
The capital redistribution index is a composite index that measures the elasticity of a division’s
investment capital (as measured by its capital expenditure) to the investment opportunities (as measured
by Tobin’s Q) in its industry and in the industries of the other divisions in the company.
Similar to the pay redistribution index, the index is calculated in two steps. First, we estimate
firm-by-firm 5-year rolling window regressions of the annual percentage change in the division’s
investment on the average annual changes in investment opportunities in the same industry and in the
industries of the other divisions in the conglomerate. The industry-level measures of investment
opportunities are computed by using standalone firms that operate in one industry, defined according to
48

the 3-digit SIC code industry classification. As before, this step generates two elasticities per firm: (1)
average same-industry investment elasticity; and (2) average other-industry investment elasticity. Note
that the same-industry investment elasticity captures the effect of the division’s investment opportunity
set, whereas the other-industry investment elasticity captures investment spillovers across industries in the
same conglomerate.
Second, we calculate the percentile ranking of the two elasticities across all the firms in our
sample. To compute the capital redistribution index, we use the average between the percentile ranking of
the ∆Capital expenditure elasticity to other industries and the percentile ranking of the negative ∆Capital
expenditure elasticity to own industry.
B.3.3. Heterogeneity in Pay and Capital
To calculate the intra-firm heterogeneity in divisional managers’ pay, we calculate the annual standard
deviation of industry-adjusted percentage changes in pay. The industry-adjusted percentage change in pay
is calculated as the annual percentage change in a divisional manager’s pay minus the average annual
percentage change in the pay of managers in the same industry. The industry-level measures of pay are
computed by using standalone firms that operate in one industry, defined according to the 3-digit SIC
code industry classification. For each firm-year, we then calculate Heterogeneity in ΔPay as the standard
deviation in the industry-adjusted percentage change in pay across all the divisional managers.
Heterogeneity in ΔCapital is calculated analogously with respect to a division’s capital expenditure.
APPENDIX TABLE B2: Measures of Redistribution of Pay and Investment Capital This table presents summary statistics and correlations for measures of intra-firm redistributions of pay and investment funds. Statistical significance levels are indicated as follows: *=10%, **=5%, ***=1%.
Measure of redistribution Mean 25th percentile
Median 75th percentile
Standard deviation
Correlation with redistribution in capital
Pay1 redistribution index 0.037 -0.506 -0.005 0.464 0.842 0.224***
Pay2 redistribution index 0.052 -0.488 0.023 0.493 0.864 0.247***
Pay3 redistribution index 0.041 -0.481 0.018 0.506 0.887 0.233***
Capital redistribution index 0.069 -0.479 0.031 0.511 0.895 1.000
Heterogeneity in ΔPay1 0.176 0.025 0.092 0.226 0.277 0.304***
Heterogeneity in ΔPay2 0.222 0.029 0.104 0.249 0.399 0.310***
Heterogeneity in ΔPay3 0.236 0.035 0.108 0.261 0.373 0.318***
Heterogeneity in ΔCapital 0.592 0.206 0.387 0.674 0.671 1.000
49

Appendix C: Robustness and Extensions APPENDIX TABLE C1: Compensation Spillovers from Other Divisions This table presents evidence on the relation between a divisional manager’s pay and pay changes in: (1) his division’s industry and (2) the other divisions inside the same conglomerate. Each column reports estimates from a single regression, where the dependent variable is the annual percentage change in a divisional manager’s pay measured by several components of pay: ΔPay1, ΔPay2, and ΔPay3 which are defined in the Appendix. The variables ∆Industry pay and ∆Pay in other divisions are defined as the average percentage changes in CEO pay of standalone firms which operate in the division’s industry and in the pay of the other divisional managers in the conglomerate, respectively. Industry definitions are based on the 3-digit SIC codes. Variable definitions appear in Appendix A. All regressions include year fixed effects. Standard errors [in brackets] are adjusted for heteroscedasticity and clustered by firm. Significance levels are indicated as follows: *=10%, **=5%, ***=1%.
Dependent variable ΔPay1 ΔPay2 ΔPay3
Model (1) (2) (3)
ΔIndustry pay 0.702*** 0.717*** 0.816*** [0.136] [0.152] [0.163]
ΔPay in other divisions 0.437*** 0.450*** 0.492*** [0.096] [0.102] [0.109]
ΔDivision cash flow 0.038 0.017 0.050** [0.032] [0.025] [0.023]
ΔDivision return on assets (ROA) 0.043 0.045*** 0.069*** [0.032] [0.017] [0.024]
ΔDivision size 0.148*** 0.182*** 0.155*** [0.016] [0.059] [0.059]
ΔIndustry market-to-book 0.003 0.121* 0.185** [0.012] [0.068] [0.089]
ΔFirm earnings per share (EPS) 0.007*** 0.087** 0.083* [0.001] [0.043] [0.048]
Firm stock return 0.020*** 0.032*** 0.024*** [0.001] [0.005] [0.003]
ΔFirm free cash flow 0.080*** 0.028 0.025 [0.026] [0.030] [0.026]
ΔFirm profitability 0.052** 0.060*** 0.044* [0.025] [0.019] [0.023]
ΔFirm size 0.130*** 0.184*** 0.173*** [0.016] [0.056] [0.059]
Year fixed effects Yes Yes Yes
Adjusted R2 0.250 0.242 0.284
N_obs 2,131 2,051 2,070
50

APPENDIX TABLE C2: Excluding firms with Multiple Divisions in the Same Industry This table presents evidence on the relation between a divisional manager’s pay and pay changes in: (1) his division’s industry and (2) the industries of other divisions inside the same conglomerate. The sample excludes conglomerates for which at least two divisions operate in the same industry, as defined by the 3-digit SIC code. Each column reports estimates from a single regression, where the dependent variable is the annual percentage change in a divisional manager’s pay measured by several components of pay: ΔPay1, ΔPay2, and ΔPay3 which are defined in the Appendix. The variables ∆Industry pay and ∆Industry pay in other divisions are defined as the average percentage changes in CEO pay of standalone firms which operate in the division’s industry and in the industries of the other divisions in the conglomerate, respectively. Variable definitions appear in Appendix A. All regressions include year fixed effects. Standard errors [in brackets] are adjusted for heteroscedasticity and clustered by firm. Significance levels are indicated as follows: *=10%, **=5%, ***=1%.
Dependent variable ΔPay1 ΔPay2 ΔPay3
Model (1) (2) (3)
ΔIndustry pay 0.708*** 0.729*** 0.810*** [0.139] [0.152] [0.170]
ΔIndustry pay in other divisions 0.317*** 0.374*** 0.386*** [0.098] [0.099] [0.112]
ΔDivision cash flow -0.004 0.016 0.070*** [0.034] [0.025] [0.022]
ΔDivision ROA 0.022 0.039** 0.045* [0.033] [0.018] [0.025]
ΔDivision size 0.133*** 0.172*** 0.168*** [0.017] [0.060] [0.056]
ΔIndustry market-to-book 0.017 0.139** 0.178* [0.018] [0.068] [0.093]
ΔFirm EPS 0.041*** 0.072** 0.087* [0.004] [0.036] [0.046]
Firm stock return 0.045*** 0.019*** 0.022*** [0.003] [0.001] [0.008]
ΔFirm free cash flow 0.074** 0.052** 0.061** [0.031] [0.024] [0.026]
ΔFirm profitability 0.062** 0.052*** 0.044** [0.028] [0.015] [0.022]
ΔFirm size 0.125*** 0.170*** 0.183*** [0.015] [0.053] [0.052]
Year fixed effects Yes Yes Yes
Adjusted R2 0.267 0.242 0.256
N_obs 1,672 1,651 1,623
51

APPENDIX TABLE C3: Intra-firms Spillovers: Evidence on Pay Levels This table presents evidence on the relation between a divisional manager’s pay level and pay levels in: (1) his division’s industry and (2) the other divisions inside the same conglomerate. Each column reports estimates from a single regression, where the dependent variable is the natural logarithm of the annual amount of three components of divisional managers’ pay (measured in thousands of dollars): Pay1, Pay2, and Pay3 which are defined in the Appendix The variables Industry pay and Industry pay in other divisions are defined as the average of the natural logarithm of CEO pay in standalone firms which operate in the division’s industry and in the industries of the other divisions in the conglomerate, respectively. Industry definitions are based on the 3-digit SIC codes. Variable definitions appear in Appendix A. All regressions include year fixed effects. Standard errors [in brackets] are adjusted for heteroscedasticity and clustered by firm. Significance levels are indicated as follows: *=10%, **=5%, ***=1%.
Dependent variable Pay1 Pay2 Pay3
Model (1) (2) (3)
Industry pay 0.474*** 0.455*** 0.392*** [0.038] [0.063] [0.050]
Industry pay in other divisions 0.218*** 0.276*** 0.313*** [0.044] [0.049] [0.058]
Division cash flow 0.068*** 0.072*** 0.080*** [0.011] [0.009] [0.014]
Division return on assets (ROA) 0.027 0.017 0.028 [0.041] [0.017] [0.036]
Division size 0.057 0.043* 0.071*** [0.127] [0.022] [0.019]
Industry market-to-book 0.117*** 0.204*** 0.115** [0.030] [0.062] [0.052]
Firm earnings per share (EPS) 0.010* 0.128 0.193** [0.005] [0.078] [0.097]
Firm stock return 0.024*** 0.116*** 0.109** [0.004] [0.043] [0.050]
Firm free cash flow 0.005*** 0.018** 0.051*** [0.000] [0.009] [0.003]
Firm profitability 0.109* 0.264*** 0.317*** [0.064] [0.036] [0.053]
Firm size 0.126*** 0.179*** 0.187*** [0.018] [0.053] [0.062]
Year fixed effects Yes Yes Yes
Adjusted R2 0.250 0.242 0.284
N_obs 2,131 2,051 2,070
52

APPENDIX TABLE C4: An Alternative Measure of Redistributions: Firm Performance and Value This table studies whether intra-firm redistributions of managerial pay and investment capital predict firm performance and value. In columns 1-3, the dependent variable is Firm profitability, defined as the ratio of net income to book assets at the beginning of the year. In columns 4-6, the dependent variable is Tobin's Q, defined as the ratio of the market value of equity plus book value of debt to book value of assets. In columns 7-9, the dependent variable is Excess value, defined as the natural logarithm of the ratio of the conglomerate’s market value to its imputed value, as in Lang and Stulz (1994). Heterogeneity in pay and capital is the intra-conglomerate standard deviation of industry-adjusted annual percentage changes in pay and capital expenditures, respectively. This calculation results in an estimated heterogeneity in ∆Pay and ∆CapEx changes for each firm-year pair. Summary statistics on the measures of redistribution appear in Appendix B. All regressions include year and firm fixed effects and the following set of controls variables: Size, Leverage, Number of divisions, Herfindahl index of division size, and Diversity in Q. Standard errors [in brackets] are adjusted for heteroscedasticity and clustered by firm. Significance levels are indicated as follows: *=10%, **=5%, ***=1%.
Dependent variable Firm profitability Tobin's Q Excess value
Compensation measure Pay1 Pay2 Pay3 Pay1 Pay2 Pay3 Pay1 Pay2 Pay3
Model (1) (2) (3) (4) (5) (6) (7) (8) (9)
Heterogeneity in Δpay -0.004 0.005* 0.004** 0.293** 0.303* 0.314* 0.045* 0.055** 0.058** [0.006] [0.003] [0.002] [0.145] [0.170] [0.176] [0.026] [0.025] [0.028]
Heterogeneity in Δcapital 0.003 0.012 0.019* 0.192 0.167 0.182 0.016 0.025* 0.029** [0.014] [0.011] [0.011] [0.178] [0.174] [0.177] [0.021] [0.014] [0.014]
Year fixed effects Yes Yes Yes Yes Yes Yes Yes Yes Yes
Firm fixed effects Yes Yes Yes Yes Yes Yes Yes Yes Yes
Controls Yes Yes Yes Yes Yes Yes Yes Yes Yes
Adjusted R2 0.596 0.596 0.597 0.448 0.449 0.451 0.472 0.474 0.474
N_obs 1,047 1,028 1,033 1,047 1,028 1,033 1,047 1,028 1,033
53

APPENDIX TABLE C5: Robustness: CEO Outlook and Compensation Spillovers This table studies whether the intensity of intra-firm compensation spillovers varies with CEO expectations about the future value of company stock. CEO expectations are proxied by opportunistic purchases and sales of company stock. To capture informed trading, we focus on open-market trades and exclude routine transactions, following the methodology in Cohen, Malloy, and Pomorski (2012). Data on CEO trades are from the TFN Insider Filing Database. In columns 1-3, the measure of CEO expectations is an indicator Net seller, which takes on the value of one if the number of shares sold by the CEO is greater than the number of shares bought in a given firm-year and zero otherwise. In columns 4-6, the measure of CEO expectations is the variable Sell-buy imbalance, defined as the difference between the number of shares sold and bought by the CEO, scaled by the total number of shares traded by the CEO in a given firm-year. Each column reports estimates from a single regression, where the dependent variable is the annual percentage change in a divisional manager’s pay measured by several components of pay: ΔPay1, ΔPay2, and ΔPay3 which are defined in the Appendix. The variables ∆Industry pay and ∆Industry pay in other divisions are defined as the average percentage changes in CEO pay of standalone firms which operate in the division’s industry and in the industries of the other divisions in the conglomerate, respectively. Industry definitions are based on the 3-digit SIC codes. Variable definitions appear in the Appendix. All regressions include year fixed effects and the same set of controls as in Table 2. Standard errors [in brackets] are adjusted for heteroscedasticity and clustered by firm. Significance levels are indicated as follows: *=10%, **=5%, ***=1%.
Dependent variable ΔPay1 ΔPay2 ΔPay3 ΔPay1 ΔPay2 ΔPay3
Model (1) (2) (3) (4) (5) (6)
ΔIndustry pay 0.676*** 0.718*** 0.802*** 0.691*** 0.720*** 0.793*** [0.137] [0.153] [0.160] [0.138] [0.155] [0.162]
ΔIndustry pay in other divisions 0.339*** 0.338*** 0.377*** 0.314*** 0.333*** 0.413*** [0.100] [0.101] [0.111] [0.099] [0.105] [0.112]
ΔIndustry pay in other divisions x Net seller
-0.017 -0.023 -0.022 [0.046] [0.056] [0.054]
Net seller -0.058*** -0.060** -0.042*** [0.022] [0.025] [0.016]
ΔIndustry pay in other divisions x Sell-buy imbalance
-0.068 -0.076 -0.083 [0.147] [0.156] [0.148]
Sell-buy imbalance -0.110*** -0.121*** -0.126***
[0.027] [0.033] [0.036]
Controls Yes Yes Yes Yes Yes Yes
Year fixed effects Yes Yes Yes Yes Yes Yes
Adjusted R2 0.278 0.255 0.261 0.281 0.257 0.270
N_obs 1,456 1,302 1,361 1,456 1,302 1,361
54

TABLE 1 Summary Statistics
This table reports summary statistics. The sample consists of multi-divisional firms in the S&P 1500 index, excluding financials and utilities, firms with functional organizational structure, and firms with missing data on divisional managers’ pay. The values reported are time-series averages over the sample period. The sample period is from January 2000 to December 2008. All variable definitions appear in Appendix A.
Panel A: Firms and Divisions
Variable Mean 25th
percentile Median
75th percentile
Standard deviation
Firm Level
Earnings per share (EPS) 1.659 0.830 1.620 2.810 4.972
Stock return 0.067 -0.215 0.032 0.240 0.724
Free cash flow 0.066 0.024 0.052 0.086 0.088
Profitability 0.048 0.023 0.057 0.087 0.086
Size (log assets) 8.636 7.718 8.394 9.619 1.442
Number of divisions 3.464 2.000 3.000 4.000 1.399
Division level
Return on assets (ROA) 0.065 0.008 0.044 0.079 0.056
Cash flow 0.184 0.072 0.133 0.224 0.895
Sales ($ mil.) 4,379 539 1,363 4,115 7,371
Size (log assets) 7.096 6.104 7.002 8.103 1.597
Industry market-to-book 1.766 1.369 1.652 2.120 0.575
Panel B: Divisional Managers
Variable Mean 25th
percentile Median
75th percentile
Standard deviation
Tenure with the company (years) 12.89 9.00 13.00 16.00 5.08
Age (years) 51.68 47.00 52.00 56.00 5.89
Male indicator 0.914 1.000 1.000 1.000 0.273
Board member indicator 0.138 0.000 0.000 0.000 0.343
Compensation committee member 0.016 0.000 0.000 0.000 0.126
Bachelor's degree indicator 0.980 1.000 1.000 1.000 0.133
Master's degree indicator 0.618 0.000 1.000 1.000 0.491
55
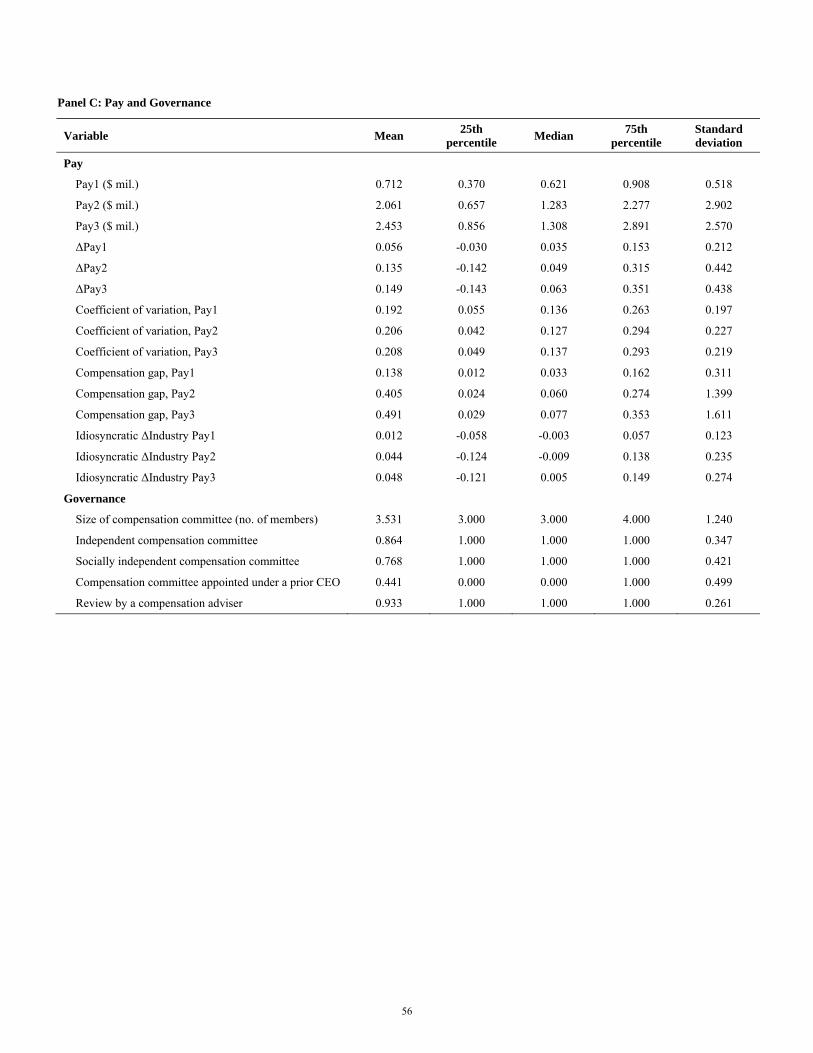
Panel C: Pay and Governance
Variable Mean 25th
percentile Median
75th percentile
Standard deviation
Pay
Pay1 ($ mil.) 0.712 0.370 0.621 0.908 0.518
Pay2 ($ mil.) 2.061 0.657 1.283 2.277 2.902
Pay3 ($ mil.) 2.453 0.856 1.308 2.891 2.570
ΔPay1 0.056 -0.030 0.035 0.153 0.212
ΔPay2 0.135 -0.142 0.049 0.315 0.442
ΔPay3 0.149 -0.143 0.063 0.351 0.438
Coefficient of variation, Pay1 0.192 0.055 0.136 0.263 0.197
Coefficient of variation, Pay2 0.206 0.042 0.127 0.294 0.227
Coefficient of variation, Pay3 0.208 0.049 0.137 0.293 0.219
Compensation gap, Pay1 0.138 0.012 0.033 0.162 0.311
Compensation gap, Pay2 0.405 0.024 0.060 0.274 1.399
Compensation gap, Pay3 0.491 0.029 0.077 0.353 1.611
Idiosyncratic ΔIndustry Pay1 0.012 -0.058 -0.003 0.057 0.123
Idiosyncratic ΔIndustry Pay2 0.044 -0.124 -0.009 0.138 0.235
Idiosyncratic ΔIndustry Pay3 0.048 -0.121 0.005 0.149 0.274
Governance
Size of compensation committee (no. of members) 3.531 3.000 3.000 4.000 1.240
Independent compensation committee 0.864 1.000 1.000 1.000 0.347
Socially independent compensation committee 0.768 1.000 1.000 1.000 0.421
Compensation committee appointed under a prior CEO 0.441 0.000 0.000 1.000 0.499
Review by a compensation adviser 0.933 1.000 1.000 1.000 0.261
56
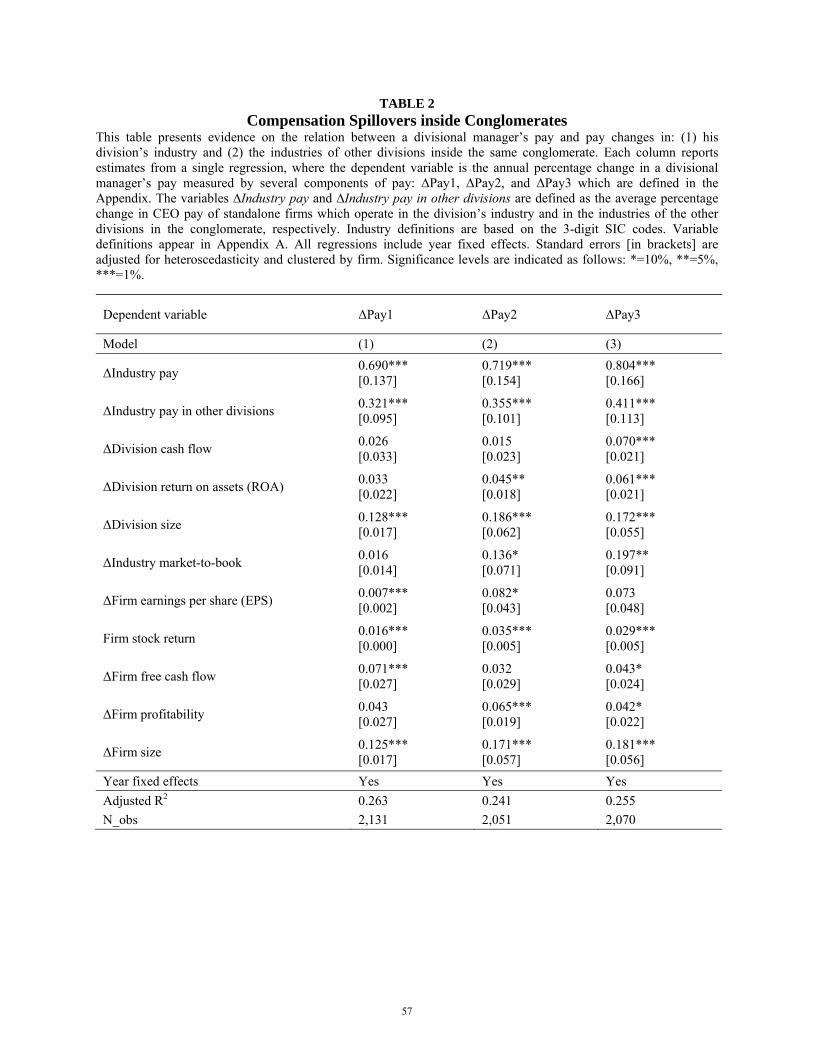
TABLE 2 Compensation Spillovers inside Conglomerates
This table presents evidence on the relation between a divisional manager’s pay and pay changes in: (1) his division’s industry and (2) the industries of other divisions inside the same conglomerate. Each column reports estimates from a single regression, where the dependent variable is the annual percentage change in a divisional manager’s pay measured by several components of pay: ΔPay1, ΔPay2, and ΔPay3 which are defined in the Appendix. The variables ∆Industry pay and ∆Industry pay in other divisions are defined as the average percentage change in CEO pay of standalone firms which operate in the division’s industry and in the industries of the other divisions in the conglomerate, respectively. Industry definitions are based on the 3-digit SIC codes. Variable definitions appear in Appendix A. All regressions include year fixed effects. Standard errors [in brackets] are adjusted for heteroscedasticity and clustered by firm. Significance levels are indicated as follows: *=10%, **=5%, ***=1%.
Dependent variable ΔPay1 ΔPay2 ΔPay3
Model (1) (2) (3)
ΔIndustry pay 0.690*** 0.719*** 0.804*** [0.137] [0.154] [0.166]
ΔIndustry pay in other divisions 0.321*** 0.355*** 0.411*** [0.095] [0.101] [0.113]
ΔDivision cash flow 0.026 0.015 0.070*** [0.033] [0.023] [0.021]
ΔDivision return on assets (ROA) 0.033 0.045** 0.061*** [0.022] [0.018] [0.021]
ΔDivision size 0.128*** 0.186*** 0.172*** [0.017] [0.062] [0.055]
ΔIndustry market-to-book 0.016 0.136* 0.197** [0.014] [0.071] [0.091]
ΔFirm earnings per share (EPS) 0.007*** 0.082* 0.073 [0.002] [0.043] [0.048]
Firm stock return 0.016*** 0.035*** 0.029*** [0.000] [0.005] [0.005]
ΔFirm free cash flow 0.071*** 0.032 0.043* [0.027] [0.029] [0.024]
ΔFirm profitability 0.043 0.065*** 0.042* [0.027] [0.019] [0.022]
ΔFirm size 0.125*** 0.171*** 0.181*** [0.017] [0.057] [0.056]
Year fixed effects Yes Yes Yes
Adjusted R2 0.263 0.241 0.255
N_obs 2,131 2,051 2,070
57

TABLE 3 Boundaries of the Firm
This table studies how intra-firm spillovers in pay are related to firm boundaries. In Panel A, we estimate a placebo test that examines how a divisional manager’s pay responds to pay changes in industries unrepresented in the conglomerate. The key variable of interest is ΔIndustry pay in industries outside the conglomerate, defined as the average percentage change in CEO pay of standalone firms that operate in industries unrepresented in the conglomerate. In Panel B, we focus on standalone firms and estimate the sensitivity of managerial pay to changes in managerial pay in the firm’s industry and to changes in pay in other industries. The key variable of interest is ΔOther industry pay, defined as the average percentage change in CEO pay of standalone firms that operate in other industries. In Panel C, we construct synthetic conglomerates, which represent sets of single-segment firms that have been pair-matched to conglomerate divisions. The pair-matching is based on industry and closest division assets in the previous year with replacement. ΔIndustry pay in other divisions is defined analogously to Table 2. Industries are defined based on the 3-digit SIC codes. Variable definitions appear in Appendix A. All regressions include year fixed effects. Standard errors [in brackets] are adjusted for heteroscedasticity and clustered by firm. Significance levels are indicated as follows: *=10%, **=5%, ***=1%. Panel A: Pay changes in industries outside the conglomerate
Dependent variable ΔPay1 ΔPay2 ΔPay3
Model (1) (2) (3)
ΔIndustry pay 0.698*** 0.749*** 0.810*** [0.138] [0.162] [0.163]
ΔIndustry pay in other divisions 0.307*** 0.338*** 0.405*** [0.092] [0.099] [0.117]
ΔIndustry pay in industries outside the conglomerate
0.004 -0.019 0.028 [0.035] [0.022] [0.067]
ΔDivision cash flow 0.028 0.055** 0.047** [0.027] [0.022] [0.019]
ΔDivision return on assets (ROA) 0.057* 0.038*** 0.051*** [0.031] [0.011] [0.019]
ΔDivision size 0.103*** 0.178*** 0.144*** [0.016] [0.063] [0.053]
ΔIndustry market-to-book 0.025* 0.159** 0.204** [0.013] [0.072] [0.094]
ΔFirm earnings per share (EPS) 0.005** 0.080** 0.119** [0.002] [0.035] [0.052]
Firm stock return 0.011*** 0.038*** 0.048*** [0.000] [0.009] [0.006]
ΔFirm free cash flow 0.036 0.052** 0.047*** [0.027] [0.021] [0.016]
ΔFirm profitability 0.033 0.055*** 0.077*** [0.031] [0.016] [0.025]
ΔFirm size 0.121*** 0.180*** 0.178*** [0.019] [0.057] [0.058]
Year fixed effects Yes Yes Yes
Adjusted R2 0.243 0.225 0.233
N_obs 2,131 2,051 2,070
58
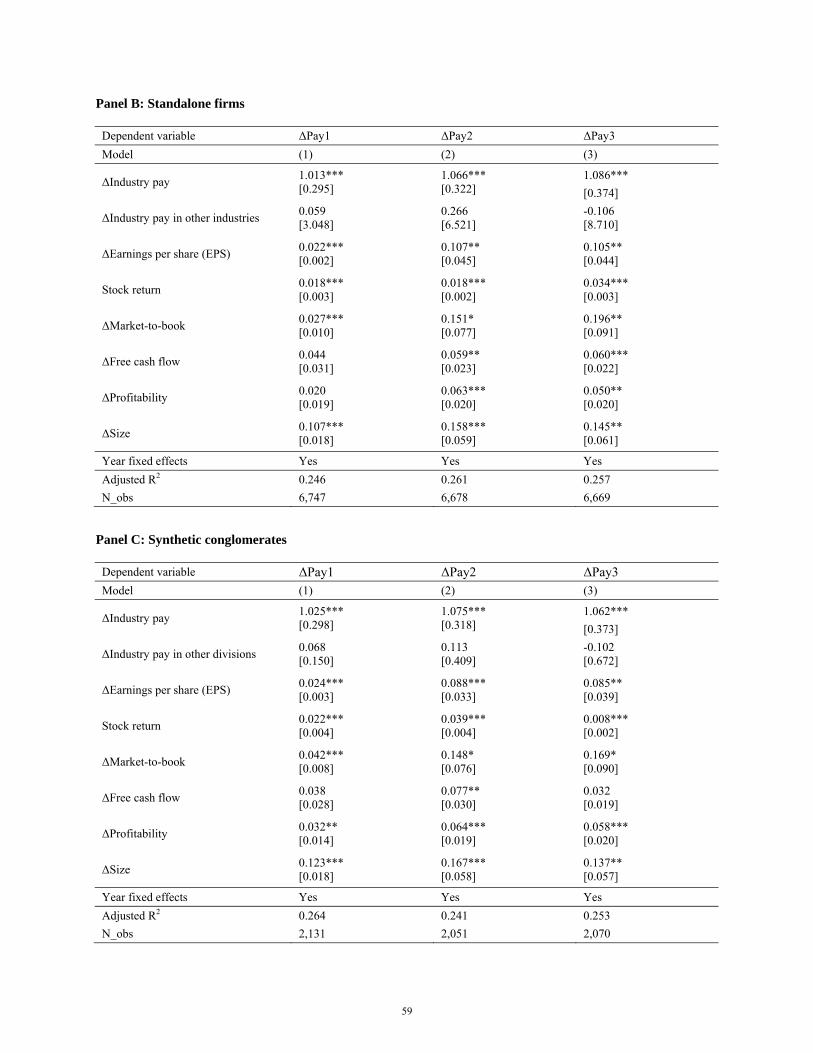
Panel B: Standalone firms
Dependent variable ΔPay1 ΔPay2 ΔPay3
Model (1) (2) (3)
ΔIndustry pay 1.013*** 1.066*** 1.086*** [0.295] [0.322] [0.374]
ΔIndustry pay in other industries 0.059 0.266 -0.106 [3.048] [6.521] [8.710]
ΔEarnings per share (EPS) 0.022*** 0.107** 0.105** [0.002] [0.045] [0.044]
Stock return 0.018*** 0.018*** 0.034*** [0.003] [0.002] [0.003]
ΔMarket-to-book 0.027*** 0.151* 0.196** [0.010] [0.077] [0.091]
ΔFree cash flow 0.044 0.059** 0.060*** [0.031] [0.023] [0.022]
ΔProfitability 0.020 0.063*** 0.050** [0.019] [0.020] [0.020]
ΔSize 0.107*** 0.158*** 0.145** [0.018] [0.059] [0.061]
Year fixed effects Yes Yes Yes
Adjusted R2 0.246 0.261 0.257
N_obs 6,747 6,678 6,669 Panel C: Synthetic conglomerates
Dependent variable ΔPay1 ΔPay2 ΔPay3 Model (1) (2) (3)
ΔIndustry pay 1.025*** 1.075*** 1.062*** [0.298] [0.318] [0.373]
ΔIndustry pay in other divisions 0.068 0.113 -0.102 [0.150] [0.409] [0.672]
ΔEarnings per share (EPS) 0.024*** 0.088*** 0.085** [0.003] [0.033] [0.039]
Stock return 0.022*** 0.039*** 0.008*** [0.004] [0.004] [0.002]
ΔMarket-to-book 0.042*** 0.148* 0.169* [0.008] [0.076] [0.090]
ΔFree cash flow 0.038 0.077** 0.032 [0.028] [0.030] [0.019]
ΔProfitability 0.032** 0.064*** 0.058*** [0.014] [0.019] [0.020]
ΔSize 0.123*** 0.167*** 0.137** [0.018] [0.058] [0.057]
Year fixed effects Yes Yes Yes
Adjusted R2 0.264 0.241 0.253
N_obs 2,131 2,051 2,070
59

TABLE 4 Distribution of Excess Cash
This table presents evidence on the relation between excess cash and intra-firm spillovers in pay. The dependent variable is the annual percentage change in a divisional manager’s pay. ∆Industry pay and ∆Industry pay in other divisions are defined as the average percentage change in CEO pay of standalone firms which operate in the division’s industry and in the industries of the other divisions in the conglomerate, respectively. Industry definitions are based on the 3-digit SIC codes. ΔExcess cash is defined as the percentage change in the residual from regressing a firm’s cash ratio on a vector of control variables following the model in Bates, Kahle, and Stulz (2009), which includes cash flow, the market-to-book ratio, a foreign income dummy, net working capital (excluding cash), capital expenditure, debt, R&D expenditures, acquisitions, payout ratio, cash flow volatility, and firm size. Special dividend is an indicator that equals 1 if the firm initiates a special dividend and 0 otherwise. Following Denis (1990) and DeAngelo et al. (2000), dividend distributions are classified as special if they have CRSP distribution codes of 1262 or 1272, which correspond to dividends labeled ‘year-end’, ‘final’, ‘extra’, or ‘special.’ All regressions include year fixed effects and the same control variables as in Table 2, which are not shown. Variable definitions appear in Appendix A. Standard errors [in brackets] are adjusted for heteroscedasticity and clustered by firm. Significance levels are indicated as follows: *=10%, **=5%, ***=1%.
Dependent variable ΔPay1 ΔPay2 ΔPay3 ΔPay1 ΔPay2 ΔPay3
Model (1) (2) (3) (4) (5) (6)
ΔIndustry pay 0.594*** 0.625*** 0.614*** 0.609*** 0.627*** 0.598*** [0.114] [0.204] [0.209] [0.123] [0.218] [0.197]
ΔIndustry pay in other divisions 0.318*** 0.312*** 0.337*** 0.309*** 0.320*** 0.345*** [0.094] [0.094] [0.110] [0.102] [0.107] [0.112]
ΔIndustry pay x ΔExcess cash 0.397** 0.403** 0.364** [0.165] [0.172] [0.173]
ΔIndustry pay in other divisions x ΔExcess cash
0.202** 0.330*** 0.366*** [0.094] [0.114] [0.116]
ΔExcess cash 0.158 0.118 0.131 [0.147] [0.131] [0.133]
ΔIndustry pay x Special dividend 0.021 0.026 0.059**
[0.028] [0.025] [0.023]
ΔIndustry pay in other divisions x Special dividend
0.053*** 0.065*** 0.062** [0.019] [0.023] [0.031]
Special dividend 0.007 0.019 0.038
[0.025] [0.034] [0.028]
Year fixed effects Yes Yes Yes Yes Yes Yes
Controls Yes Yes Yes Yes Yes Yes
Adjusted R2 0.251 0.247 0.252 0.246 0.241 0.244
N_obs 2,131 2,051 2,070 2,131 2,051 2,070
60
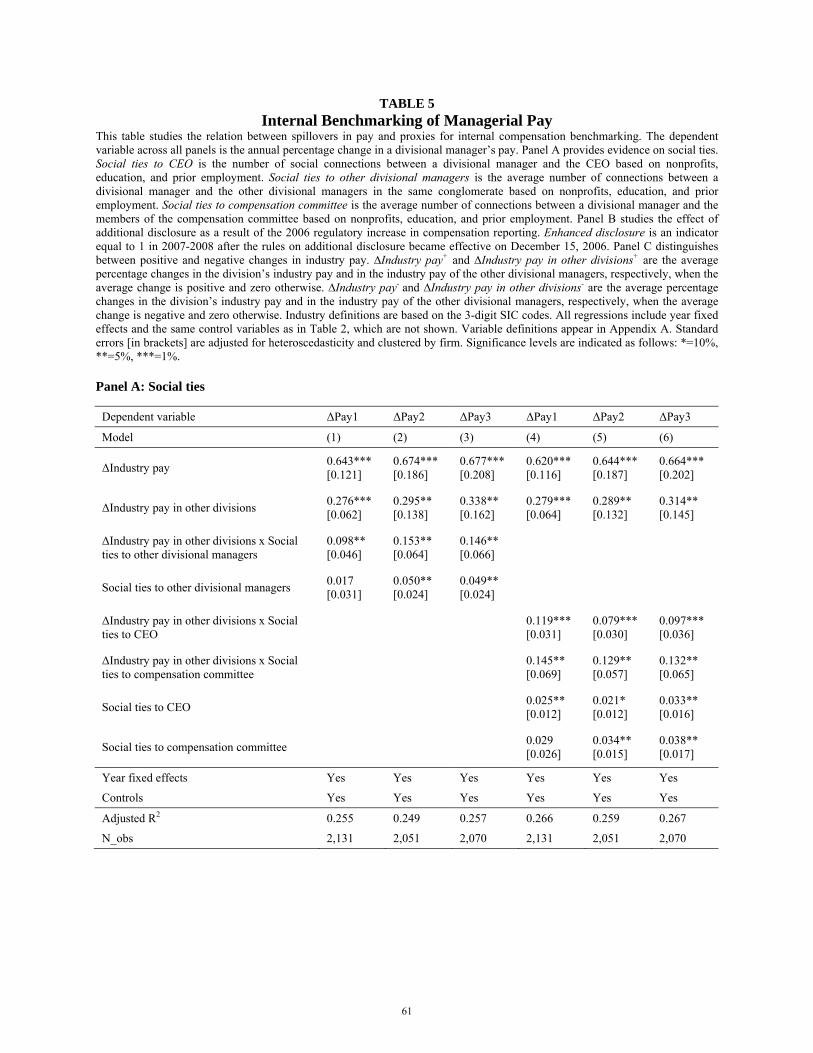
TABLE 5 Internal Benchmarking of Managerial Pay
This table studies the relation between spillovers in pay and proxies for internal compensation benchmarking. The dependent variable across all panels is the annual percentage change in a divisional manager’s pay. Panel A provides evidence on social ties. Social ties to CEO is the number of social connections between a divisional manager and the CEO based on nonprofits, education, and prior employment. Social ties to other divisional managers is the average number of connections between a divisional manager and the other divisional managers in the same conglomerate based on nonprofits, education, and prior employment. Social ties to compensation committee is the average number of connections between a divisional manager and the members of the compensation committee based on nonprofits, education, and prior employment. Panel B studies the effect of additional disclosure as a result of the 2006 regulatory increase in compensation reporting. Enhanced disclosure is an indicator equal to 1 in 2007-2008 after the rules on additional disclosure became effective on December 15, 2006. Panel C distinguishes between positive and negative changes in industry pay. ∆Industry pay+ and ∆Industry pay in other divisions+ are the average percentage changes in the division’s industry pay and in the industry pay of the other divisional managers, respectively, when the average change is positive and zero otherwise. ∆Industry pay- and ∆Industry pay in other divisions- are the average percentage changes in the division’s industry pay and in the industry pay of the other divisional managers, respectively, when the average change is negative and zero otherwise. Industry definitions are based on the 3-digit SIC codes. All regressions include year fixed effects and the same control variables as in Table 2, which are not shown. Variable definitions appear in Appendix A. Standard errors [in brackets] are adjusted for heteroscedasticity and clustered by firm. Significance levels are indicated as follows: *=10%, **=5%, ***=1%. Panel A: Social ties
Dependent variable ΔPay1 ΔPay2 ΔPay3 ΔPay1 ΔPay2 ΔPay3
Model (1) (2) (3) (4) (5) (6)
ΔIndustry pay 0.643*** 0.674*** 0.677*** 0.620*** 0.644*** 0.664*** [0.121] [0.186] [0.208] [0.116] [0.187] [0.202]
ΔIndustry pay in other divisions 0.276*** 0.295** 0.338** 0.279*** 0.289** 0.314** [0.062] [0.138] [0.162] [0.064] [0.132] [0.145]
ΔIndustry pay in other divisions x Social ties to other divisional managers
0.098** 0.153** 0.146** [0.046] [0.064] [0.066]
Social ties to other divisional managers 0.017 0.050** 0.049** [0.031] [0.024] [0.024]
ΔIndustry pay in other divisions x Social ties to CEO
0.119*** 0.079*** 0.097*** [0.031] [0.030] [0.036]
ΔIndustry pay in other divisions x Social ties to compensation committee
0.145** 0.129** 0.132** [0.069] [0.057] [0.065]
Social ties to CEO 0.025** 0.021* 0.033**
[0.012] [0.012] [0.016]
Social ties to compensation committee 0.029 0.034** 0.038**
[0.026] [0.015] [0.017]
Year fixed effects Yes Yes Yes Yes Yes Yes
Controls Yes Yes Yes Yes Yes Yes
Adjusted R2 0.255 0.249 0.257 0.266 0.259 0.267
N_obs 2,131 2,051 2,070 2,131 2,051 2,070
61

Panel B: Enhanced disclosure
Dependent variable ΔPay1 ΔPay2 ΔPay3
Model (1) (2) (3)
ΔIndustry pay 0.651*** 0.657*** 0.641*** [0.118] [0.185] [0.204]
ΔIndustry pay in other divisions 0.245*** 0.276** 0.296** [0.054] [0.122] [0.138]
ΔIndustry pay x Enhanced disclosure -0.002 0.013 -0.002 [0.023] [0.018] [0.010]
ΔIndustry pay in other divisions x Enhanced disclosure 0.052* 0.045* 0.062** [0.029] [0.024] [0.030]
Year fixed effects Yes Yes Yes
Controls Yes Yes Yes
Adjusted R2 0.248 0.241 0.256
N_obs 724 709 715
Panel C: Positive and negative industry pay changes
Dependent variable ΔPay1 ΔPay2 ΔPay3
Model (1) (2) (3)
ΔIndustry pay + 0.758*** 0.764*** 0.776*** [0.117] [0.186] [0.206]
ΔIndustry pay - 0.461*** 0.576** 0.554*** [0.115] [0.187] [0.209]
ΔIndustry pay in other divisions + 0.398*** 0.423*** 0.457*** [0.078] [0.157] [0.159]
ΔIndustry pay in other divisions - 0.147 0.195 0.135 [0.148] [0.313] [0.572]
Year fixed effects Yes Yes Yes
Controls Yes Yes Yes
Adjusted R2 0.247 0.244 0.249
N_obs 2,131 2,051 2,070
62

TABLE 6 Internal Transfers between Divisions
This table presents evidence on the effect of intra-firm transfers of materials and managerial talent. The dependent variable is the annual percentage change in a divisional manager’s pay. In columns 1-6, ∆Industry pay and ∆Industry pay in other divisions are defined as the average percentage change in CEO pay of standalone firms which operate in the division’s industry and in the industries of the other divisions in the conglomerate, respectively. In columns 7-9, ΔIndustry pay is defined as the residual from regressing the average percentage change in CEO pay of standalone firms in each industry on the average percentage change in CEO pay of standalone firms in all other industries. ΔIndustry pay in other divisions is defined as the average residual ΔIndustry pay in all other industries in the conglomerate. Industry definitions are based on the 3-digit SIC codes. To construct Industry relatedness, we calculate the percentage of industry i’s sales purchased by industry j and the percentage of industry j’s inputs purchased by industry i, using data on trade flows between industries from the 2002 input-output matrix of the Bureau of Economic Analysis. We define industries i and j as related if either percentage is greater than 1%. Industry relatedness is an indicator equal to 1 if the division is related to any industry of the other divisions in the conglomerate and 0 otherwise. Experience outside industry is an indicator equal to 1 if the divisional manager worked at a standalone firm or a conglomerate division operating in a different industry over the last 10 years and 0 otherwise. All regressions include year fixed effects and the same control variables as in Table 2, which are not shown. Variable definitions appear in Appendix A. Standard errors [in brackets] are adjusted for heteroscedasticity and clustered by firm. Significance levels are indicated as follows: *=10%, **=5%, ***=1%.
Test Industry relatedness Experience outside industry Idiosyncratic industry pay changes
Dependent variable ΔPay1 ΔPay2 ΔPay3 ΔPay1 ΔPay2 ΔPay3 ΔPay1 ΔPay2 ΔPay3
Model (1) (2) (3) (4) (5) (6) (7) (8) (9)
ΔIndustry pay 0.626*** 0.650*** 0.661*** 0.641*** 0.660*** 0.620*** 0.633*** 0.683*** 0.659*** [0.117] [0.192] [0.204] [0.115] [0.187] [0.211] [0.125] [0.182] [0.209]
ΔIndustry pay in other divisions 0.302*** 0.299* 0.363** 0.236*** 0.269** 0.305** 0.301*** 0.312** 0.321** [0.083] [0.153] [0.159] [0.077] [0.132] [0.151] [0.081] [0.155] [0.162]
ΔIndustry pay in other divisions x Industry relatedness 0.026 0.049 0.043 [0.088] [0.076] [0.084]
Industry relatedness 0.013 -0.036 -0.016 [0.072] [0.066] [0.072]
ΔIndustry pay in other divisions x Experience outside industry
0.055 0.043 0.043 [0.083] [0.098] [0.082]
Experience outside industry 0.029** 0.035** 0.032**
[0.012] [0.017] [0.016]
Year fixed effects Yes Yes Yes Yes Yes Yes Yes Yes Yes
Control variables Yes Yes Yes Yes Yes Yes Yes Yes Yes
Adjusted R2 0.242 0.239 0.239 0.255 0.251 0.252 0.257 0.249 0.258
N_obs 2,131 2,051 2,070 2,131 2,051 2,070 2,131 2,051 2,070
63

TABLE 7 Corporate Governance
This table presents evidence on the relation between internal spillovers in pay and three dimensions of corporate governance: (1) firm-level governance (Panel A), (2) composition of the compensation committee (Panel B), and (3) quality of compensation advisers (Panel C). The dependent variable is the annual percentage change in a divisional manager’s pay. ∆Industry pay and ∆Industry pay in other divisions are defined as the average percentage change in CEO pay of standalone firms which operate in the division’s industry and in the industries of the other divisions in the conglomerate, respectively. Industry definitions are based on the 3-digit SIC codes. Block ownership is an indicator equal to one if the percentage of shares held by any one institutional investor exceeds 5%. Board independence is the ratio of the number of independent directors to the total number of directors. G-index is the Gompers, Ishii, and Metrick (2003) governance index. Independent committee is an indicator that equals 1 if all the committee members are independent directors and 0 otherwise. Socially independent committee is an indicator that equals 1 if the committee members share no social ties with the CEO or divisional managers and 0 otherwise. Committee appointed under a prior CEO is an indicator that equals 1 if any of the compensation committee members were appointed before the incumbent CEO and 0 otherwise. Review by an external compensation adviser is an indicator equal to 1 if the firm employs an external compensation adviser and 0 otherwise. Large compensation adviser is an indicator equal to 1 if the compensation adviser is one of the ‘big four’ compensation advisory firms: Frederic W. Cook & Co., Towers Perrin, Mercer, and Hewitt Associates and 0 otherwise. All regressions include year fixed effects and the same control variables as in Table 2, which are not shown. Variable definitions appear in Appendix A. Standard errors [in brackets] are adjusted for heteroscedasticity and clustered by firm. Significance levels are indicated as follows: *=10%, **=5%, ***=1%. Panel A: Firm-level governance
Governance measure Block ownership Board independence G-index
Dependent variable ΔPay1 ΔPay2 ΔPay3 ΔPay1 ΔPay2 ΔPay3 ΔPay1 ΔPay2 ΔPay3
Model (1) (2) (3) (4) (5) (6) (7) (8) (9)
ΔIndustry pay in other divisions 0.334*** 0.322*** 0.411*** 0.305*** 0.361*** 0.373*** 0.299*** 0.348*** 0.408*** [0.094] [0.104] [0.106] [0.090] [0.104] [0.106] [0.095] [0.098] [0.111]
ΔIndustry pay in other divisions x Corporate governance
-0.069*** -0.091*** -0.068* -0.037 -0.084** -0.086* 0.036*** 0.047*** 0.033** [0.023] [0.033] [0.037] [0.027] [0.037] [0.045] [0.013] [0.017] [0.015]
Corporate governance -0.056 -0.068 -0.072 -0.085 -0.072 -0.095 0.042 0.071 0.038 [0.060] [0.084] [0.091] [0.084] [0.047] [0.068] [0.064] [0.061] [0.052]
Year fixed effects Yes Yes Yes Yes Yes Yes Yes Yes Yes
Controls Yes Yes Yes Yes Yes Yes Yes Yes Yes
Adjusted R2 0.263 0.261 0.267 0.253 0.269 0.260 0.254 0.248 0.249
N_obs 2,131 2,051 2,070 2,131 2,051 2,070 2,131 2,051 2,070
64

Panel B: Compensation Committee
Compensation committee Independent committee Socially independent committee Committee appointed under a prior CEO
Dependent variable ΔPay1 ΔPay2 ΔPay3 ΔPay1 ΔPay2 ΔPay3 ΔPay1 ΔPay2 ΔPay3
Model (1) (2) (3) (4) (5) (6) (7) (8) (9)
ΔIndustry pay in other divisions 0.274*** 0.343*** 0.440*** 0.269*** 0.292* 0.352** 0.275*** 0.333** 0.331** [0.093] [0.102] [0.115] [0.082] [0.159] [0.160] [0.078] [0.153] [0.156]
ΔIndustry pay in other divisions x Compensation committee
-0.066** -0.087** -0.087** -0.059** -0.067* -0.080*** -0.064** -0.068*** -0.074** [0.029] [0.040] [0.044] [0.026] [0.035] [0.034] [0.029] [0.024] [0.034]
Compensation committee -0.014 -0.038 -0.062 -0.035 -0.056 -0.064 -0.026 -0.069 -0.057 [0.056] [0.079] [0.095] [0.060] [0.075] [0.089] [0.054] [0.084] [0.091]
Year fixed effects Yes Yes Yes Yes Yes Yes Yes Yes Yes
Controls Yes Yes Yes Yes Yes Yes Yes Yes Yes
Adjusted R2 0.238 0.230 0.244 0.251 0.245 0.243 0.240 0.236 0.233
N_obs 2,131 2,051 2,070 2,131 2,051 2,070 2,131 2,051 2,070
65

Panel C: Compensation adviser
Dependent variable ΔPay1 ΔPay2 ΔPay3 ΔPay1 ΔPay2 ΔPay3
Model (1) (2) (3) (4) (5) (6)
ΔIndustry pay in other divisions 0.277*** 0.347** 0.329** 0.279*** 0.311** 0.325** [0.083] [0.156] [0.154] [0.083] [0.154] [0.155]
ΔIndustry pay in other divisions x Review by an external compensation adviser
-0.050 -0.052** -0.057* -0.049 -0.038** -0.048** [0.032] [0.024] [0.031] [0.036] [0.018] [0.021]
Review by an external compensation adviser
-0.048 -0.076 -0.091 -0.091 -0.022 -0.053 [0.078] [0.049] [0.062] [0.067] [0.074] [0.082]
ΔIndustry pay in other divisions x Large compensation adviser
-0.021 -0.020 -0.046** [0.017] [0.018] [0.022]
Large compensation adviser 0.030* -0.010 -0.011
[0.016] [0.012] [0.023]
Year fixed effects Yes Yes Yes Yes Yes Yes
Controls Yes Yes Yes Yes Yes Yes
Adjusted R2 0.236 0.231 0.232 0.236 0.232 0.232
N_obs 1,636 1,564 1,499 1,636 1,564 1,499
66

TABLE 8 Choice between Redistribution of Pay and Capital
This table studies the determinants of the choice between the redistribution of pay and capital. The dependent variable is the ratio of the pay redistribution index to the capital redistribution index. The Pay and capital redistribution indexes are calculated by estimating a firm-by-firm elasticity of divisional percentage changes in managerial pay and capital investment to changes in the same industry and in the other industries of the conglomerate. Pay redistribution index is the average between the percentile ranking of the ∆Pay elasticity to other industries and the percentile ranking of the negative ∆Pay elasticity to own industry. The elasticities are calculated by estimating a firm-by-firm, five-year rolling window regression of the percentage change in the manager’s pay on the average changes in the same industry and in the industries of the other divisions in the conglomerate, where industry-level pay is measured by the average CEO pay of standalone firms. Capital redistribution index is average between the percentile ranking of the ∆CapEx elasticity to other industries and the percentile ranking of the negative CapEx elasticity to own industry. The elasticities are calculated by estimating firm-by-firm regressions of the division’s percentage change in capital expenditure on the average Tobin’s Q changes in the same industry and in the industries of the other divisions in the conglomerate, analogously to the construction of the pay redistribution index. Additional details on the estimation of Pay redistribution index and Capital redistribution index, as well as their summary statistics, appear in Appendix C. In columns 1-3, Independent compensation committee is an indicator variable that equals 1 if the compensation committee comprises only independent directors and 0 otherwise. In columns 4-6, Shareholder compensation proposals is an indicator variable that equals 1 if shareholders raised a compensation-related proposal over the last three years and 0 otherwise. In columns 7-9, Local product fluidity is a textual analysis-based measure of competitive threats adopted from Hoberg, Phillips, and Prabhala (2014). Variable definitions appear in Appendix A. All regressions include year fixed effects. Standard errors [in brackets] are adjusted for heteroscedasticity and clustered by firm. Significance levels are indicated as follows: *=10%, **=5%, ***=1%.
Compensation measure Pay1 Pay2 Pay3 Pay1 Pay2 Pay3 Pay1 Pay2 Pay3
Model (1) (2) (3) (4) (5) (6) (7) (8) (9)
Independent compensation committee -0.031** -0.034** -0.035** [0.013] [0.015] [0.015]
Shareholder compensation proposals -0.019* -0.021** -0.024** [0.010] [0.010] [0.011]
Local product fluidity 0.050** 0.056** 0.048**
[0.021] [0.024] [0.022]
Year fixed effects Yes Yes Yes Yes Yes Yes Yes Yes Yes
Adjusted R2 0.084 0.082 0.085 0.077 0.077 0.078 0.079 0.076 0.076
N_obs 548 522 531 548 522 531 548 522 531
67
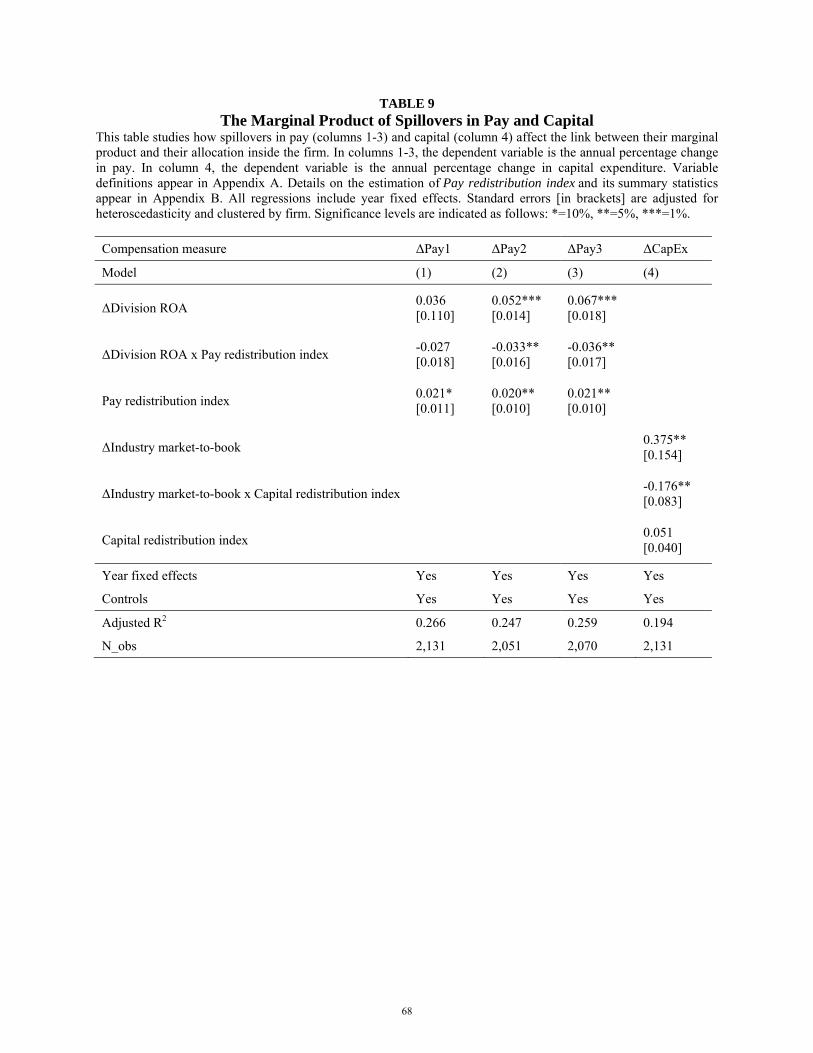
TABLE 9 The Marginal Product of Spillovers in Pay and Capital
This table studies how spillovers in pay (columns 1-3) and capital (column 4) affect the link between their marginal product and their allocation inside the firm. In columns 1-3, the dependent variable is the annual percentage change in pay. In column 4, the dependent variable is the annual percentage change in capital expenditure. Variable definitions appear in Appendix A. Details on the estimation of Pay redistribution index and its summary statistics appear in Appendix B. All regressions include year fixed effects. Standard errors [in brackets] are adjusted for heteroscedasticity and clustered by firm. Significance levels are indicated as follows: *=10%, **=5%, ***=1%.
Compensation measure ΔPay1 ΔPay2 ΔPay3 ΔCapEx
Model (1) (2) (3) (4)
ΔDivision ROA 0.036 0.052*** 0.067*** [0.110] [0.014] [0.018]
ΔDivision ROA x Pay redistribution index -0.027 -0.033** -0.036** [0.018] [0.016] [0.017]
Pay redistribution index 0.021* 0.020** 0.021** [0.011] [0.010] [0.010]
ΔIndustry market-to-book 0.375**
[0.154]
ΔIndustry market-to-book x Capital redistribution index -0.176**
[0.083]
Capital redistribution index 0.051
[0.040]
Year fixed effects Yes Yes Yes Yes
Controls Yes Yes Yes Yes
Adjusted R2 0.266 0.247 0.259 0.194
N_obs 2,131 2,051 2,070 2,131
68

TABLE 10 Firm Performance and Value
This table studies whether intra-firm redistributions of managerial pay and investment capital predict firm performance and value. In columns 1-3, the dependent variable is Firm profitability, defined as the ratio of net income to book assets at the beginning of the year. In columns 4-6, the dependent variable is Tobin's Q, defined as the ratio of the market value of equity plus book value of debt to book value of assets. In columns 7-9, the dependent variable is Excess value, defined as the natural logarithm of the ratio of the conglomerate’s actual value to its imputed value, as in Berger and Ofek (1995). We construct the redistribution indices by estimating a firm-by-firm elasticity of divisional percentage changes in managerial pay and capital investment to changes in the same industry and in the other industries of the conglomerate. Pay redistribution index is the average between the percentile ranking of the ∆Pay elasticity to other industries and the percentile ranking of the negative ∆Pay elasticity to own industry. The elasticities are calculated by estimating a firm-by-firm, five-year rolling window regression of the percentage change in the manager’s pay on the average changes in the same industry and in the industries of the other divisions in the conglomerate, where industry-level pay is measured by the average CEO pay of standalone firms. Capital redistribution index is average between the percentile ranking of the ∆CapEx elasticity to other industries and the percentile ranking of the negative CapEx elasticity to own industry. The elasticities are calculated by estimating firm-by-firm regressions of the division’s percentage change in capital expenditure on the average Tobin’s Q changes in the same industry and in the industries of the other divisions in the conglomerate, analogously to the construction of the pay redistribution index. Additional details on the estimation of the redistribution indexes and their summary statistics appear in Appendix Table A1. Summary statistics on the measures of redistribution appear in Appendix Table A1. All regressions include year and firm fixed effects and the following set of controls variables: Size, Leverage, Number of divisions, Herfindahl index of division size, and Diversity in Q. Variable definitions appear in Appendix A. Standard errors [in brackets] are adjusted for heteroscedasticity and clustered by firm. Significance levels are indicated as follows: *=10%, **=5%, ***=1%.
Dependent variable Firm profitability Tobin's Q Excess value
Compensation measure Pay1 Pay2 Pay3 Pay1 Pay2 Pay3 Pay1 Pay2 Pay3
Model (1) (2) (3) (4) (5) (6) (7) (8) (9)
Pay redistribution index -0.010 -0.013** -0.016** -0.129** -0.122** -0.124** -0.020* -0.038* -0.034 [0.011] [0.006] [0.007] [0.060] [0.049] [0.052] [0.011] [0.021] [0.025]
Capital redistribution index -0.005 -0.006 -0.007* -0.079* -0.093* -0.110* -0.007 -0.023** -0.025** [0.004] [0.005] [0.004] [0.044] [0.054] [0.059] [0.022] [0.010] [0.012]
Year fixed effects Yes Yes Yes Yes Yes Yes Yes Yes Yes
Firm fixed effects Yes Yes Yes Yes Yes Yes Yes Yes Yes
Controls Yes Yes Yes Yes Yes Yes Yes Yes Yes
Adjusted R2 0.572 0.573 0.575 0.426 0.426 0.427 0.447 0.448 0.448
N_obs 548 522 531 548 522 531 548 522 531
69