ramsay health care limited · 2017-09-12 · conglomerate sime darby berhad. the joint venture...
TRANSCRIPT

RAMSAY HEALTH CARE LIMITED
AND CONTROLLED ENTITIES
A.B.N. 57 001 288 768
FINANCIAL REPORT
FOR THE YEAR ENDED 30 JUNE 2017
1
RAMSAY HEALTH CARE LIMITED FINANCIAL REPORT FOR THE YEAR ENDED 30 JUNE 2017
CONTENTS PAGE
Directors’ Report 2 Independent Audit Report 40 Directors’ Declaration 44 Consolidated Income Statement 45 Consolidated Statement of Comprehensive Income 46 Consolidated Statement of Financial Position 47 Consolidated Statement of Changes in Equity 48 Consolidated Statement of Cash Flows 49 Notes to the Consolidated Financial Statements 50
I. RESULTS FOR THE YEAR
II. CAPITAL – FINANCING
III. ASSETS AND LIABILITIES OPERATING AND INVESTING
IV. RISK MANAGEMENT
V. OTHER INFORMATION
Page 57 Page 62 Page 73 Page 90 Page 94
1. Segment Information
6. Equity 8. Working Capital 15. Financial Risk Management
16. Share Based Payment Plans
2. Revenue 7. Net Debt 9. Business Combinations
17. Expenditure Commitments
3. Expenses 10. Property, Plant and Equipment
18. Auditors’ Remuneration
4. Dividends 11. Intangible Assets 19. Related Party Transactions
5. Earnings per share
12. Impairment Testing of Goodwill
20. Subsequent Events
13. Taxes 21. Information Relating to Subsidiaries
22. Closed Group
23. Parent Entity Information
24. Material Partly-Owned Subsidiaries
Attachment 1 – Ramsay Health Care Limited Directors & Company Secretary
103
14. Other Assets/ (Liabilities)

2
RAMSAY HEALTH CARE LIMITED DIRECTORS’ REPORT Your Directors submit their report for the year ended 30 June 2017. DIRECTORS The names of the Directors of Ramsay Health Care Limited (“Ramsay”, “the Company” or “the Group”) in office during the financial year and until the date of this report, unless noted otherwise, are listed below. Each Director’s beneficial interest in the share capital of the Company as at the date of this report is as follows: Director
Ordinary Shares
Ramsay Health Care Limited
Convertible Adjustable Rate Equity Securities
(CARES)
Rights over Ordinary Shares
M.S. Siddle 3,903,793 - - P.J. Evans 8,438 - - C.P. Rex (retired 2 July 2017) 900,480 5,334 375,407 C.R.McNally (appointed 3 July 2017) 413,351 - 130,721 B.R. Soden 383,102 2,000 162,158 I.P.S. Grier AM 1,229 - - A. J. Clark AM (retired 7 November 2016) 75,000 1,700 - R.H. McGeoch AO 58,560 257 - K.C.D. Roxburgh 73,729 - - P. Akopiantz 2,596 - - M. Seale 2,534 - - Particulars of each Director’s experience and qualifications are set out in Attachment 1. Interests in Contracts or Proposed Contracts with the Company No Director has any interest in any contract or proposed contract with the Company other than as disclosed elsewhere in this report.
3
RAMSAY HEALTH CARE LIMITED DIRECTORS’ REPORT (CONTINUED) OPERATING AND FINANCIAL REVIEW Principal Activities Ramsay is a global hospital group operating 235 hospitals and day surgery facilities across Australia, the United Kingdom, France, Indonesia, Malaysia and Italy. The Group is committed to being a leading provider of health care services by delivering high quality outcomes for patients and ensuring long term profitability. Ramsay is well-respected in the health care industry for operating quality private hospitals and for its excellent record in hospital management, staff engagement and patient care. Ramsay facilities cater for a broad range of health care needs from day surgery procedures to highly complex surgery, as well as psychiatric care and rehabilitation. With circa 25,000 beds and places, the Group employs circa 60,000 staff, across six countries, treats almost 3.5 million patients per annum and is ranked in the top 5 private hospital operators in the world. Ramsay listed on the Australian Securities Exchange in 1997 and, over the last twenty years has developed and acquired a high quality portfolio of strategically located assets both in Australia and overseas, which have helped to position it at the forefront of the global health care market. Ramsay is committed to ongoing improvement in patient care in all areas and has an excellent record in providing quality patient care and managing clinical risk. All Ramsay facilities offer high quality health care services and are fully accredited with the relevant accreditation bodies in their regions. Accreditation is an important driver for safety and quality improvement and ensures that Ramsay hospitals are at the forefront of health care delivery. Ramsay maintains a decentralised management structure which allows each of its facility managers to develop productive working relationships with doctors. This has assisted in attracting high calibre medical practitioners to consult in its facilities. Ramsay takes a leadership role in shaping the world that we live in through its focus on the environment, good corporate governance and societal issues at large. In 2012 and 2013, Ramsay was recognised in the Global 100 Most Sustainable Corporations in the World. In 2013 it was one of only nine Australian companies to make this industry leading corporate sustainability index. Since 2011 Ramsay has been included in the FTSE4Good Index, an index which objectively measures the performance of companies that meet globally recognised corporate responsibility standards. The Group also commits significant funds and resources to clinical teaching and medical research believing that the private sector has an important role to play in the training and development of the future medical and nursing workforce. To this end, through its hospitals, the Group works closely with government and universities in the training of nursing and medical staff. In November 2007, Ramsay Health Care acquired Capio UK and its portfolio of hospitals in England. Ramsay Health Care UK is now one of the leading providers of independent hospital services in the UK, with a network of 35 acute hospitals and day procedure centres providing a comprehensive range of clinical specialties to private and self-insured patients as well as to patients referred by the National Health Service (NHS). In March 2010, Ramsay Health Care purchased a 57% interest in Group Proclif SAS (Proclif), a private hospital operator based in France. Proclif changed its name to Ramsay Santé. This was the start of several acquisitions in France, culminating in its acquisition of a controlling interest in Générale de Santé (GdS) in October 2014. GdS was the leading operator of private hospitals in France comprising 75 facilities (including 61 hospitals) in the fields of medicine, surgery, obstetrics and rehabilitation. On 1 July 2015, Ramsay Santé and GdS merged and is now known as the Ramsay Générale de Santé (RgDS). This merged entity acquired HPM, a group of nine hospitals in Lille in December 2015 and brings Ramsay’s total portfolio in France to 120 (including 110 hospitals). In July 2013, Ramsay Health Care entered into a Joint Venture arrangement with Malaysian multinational conglomerate Sime Darby Berhad. The joint venture combined Sime Darby’s portfolio of health care assets in Malaysia (three hospitals and a nursing and health sciences college) with Ramsay’s three Indonesian hospitals, under a jointly owned company, Ramsay Sime Darby Health Care Sdn Bhd (RSD).
4
RAMSAY HEALTH CARE LIMITED DIRECTORS’ REPORT (CONTINUED) OPERATING AND FINANCIAL REVIEW (CONTINUED) Financial Performance A summary of the audited consolidated statutory revenue and earnings is set out below: Summary of Statutory earnings 2017
$000 2016
$000 % Change
Revenue from services 8,705,368 8,684,116 0.2% Earnings before interest, tax, depreciation and amortisation (EBITDA) 1,256,810
1,224,427
2.6%
Earnings before interest and tax (EBIT) 881,266 840,353 4.9% Net profit attributable to owners of the parent 488,947 450,297 8.6% 2017 2016 % Change
Basic earnings per share (after CARES dividend) 236.5c 217.6c 8.7% Diluted earnings per share (after CARES dividend) 234.9c 216.1c 8.7% Ramsay’s net profit attributable to the owners of the parent for the year ended 30 June 2017 was $488,947 million, an 8.6% increase on the previous corresponding period. Diluted earnings per share is 234.9 cents for the year, an 8.7% increase. The growth in admissions and procedural volumes in Ramsay’s Australian business ensured it delivered another year of strong revenue and EBIT growth, while its international businesses performed well, given challenging tariff environments. Operational Highlights – Australia / Asia During the year, Ramsay’s Australian business achieved revenue growth of 7.0% and EBIT growth of 13.6% driven by strong demand and our brownfield developments. Our equity accounted share of the Asian joint venture with Sime Darby was up 31.9% to $13.1 million. It continues to perform well in the challenging circumstances due to a focus on cost controls. Operational Highlights – UK
Ramsay’s UK business delivered results in accordance with expectations. Operating profit (EBITDAR) increased 1.7% to £113.9 million. Operational Highlights – France Ramsay Générale de Santé hospitals demonstrated resilience in what are challenging tariff environments for the near term. Revenue increased by 0.3% and EBITDAR is up 0.5% to €448.3 million, both benefitting from a strong focus on operational efficiencies. Financial Position A summary of the audited balance sheet is set out below: 2017
$000 2016 $000 % Change
Total assets 8,335,361 8,241,482 1.1% Total liabilities (5,976,675) (6,195,421) (3.5%) Net assets 2,358,686 2,046,061 15.3%
Ramsay’s total assets increased by 1.1% due mainly to an increase in working capital.Given there were no major acquisitions during the year this is in line with expectations. Total liabilities decreased by 3.5% due mainly to a reduction in interest bearing loans and borrowings with the repayment of bank loans, payment of deferred consideration and bondholder loans.
The Group in a net current asset position at 30 June 2017 (2016: net current liability position). Typically the Group receives cash from the provision of patient services ahead of cash paid out to suppliers. Surplus cash is used to pay-down the non-current bank loans. In addition, the Group endeavours to hold minimum cash balances at any point in time to ensure the efficient use of our working capital. These business attributes usually result in a net current liability position or marginal net current asset position, as seen in the current year.
5
RAMSAY HEALTH CARE LIMITED DIRECTORS’ REPORT (CONTINUED) OPERATING AND FINANCIAL REVIEW (CONTINUED)
Financial Position (continued)
Ramsay’s net asset position increased by 15.3% which is largely attributable to the current year’s profit after tax of $489 million less dividends paid to Ramsay shareholders of $265 million. Balance Sheet, Cash Flow and Refinancing
Ramsay’s robust balance sheet and strong cash flow generation continues to provide us with the flexibility to fund the ongoing demand for brownfield capacity expansion, future acquisitions and working capital needs. In November 2016, Ramsay and its wholly owned subsidiaries restructured their existing A$, GBP and Euro senior debt facilities, into new Syndicated Debt Facility Agreements. The new Agreements provide Ramsay with significantly improved terms and conditions, particularly lower margins and extended maturity in respect of the GBP and Euro debt facilities, increased flexibility to fund future growth initiatives, improved access to offshore debt markets and improved access to additional debt funding, provided financial and other undertakings are satisfied. Additionally, on 11 August 2017, RGdS successfully completed an Amend and Extend of its senior debt facilities, achieving improved terms and conditions, including a 2 year extension of maturity date to 3 October 2022. Business Strategies and Prospects for Future Financial Years
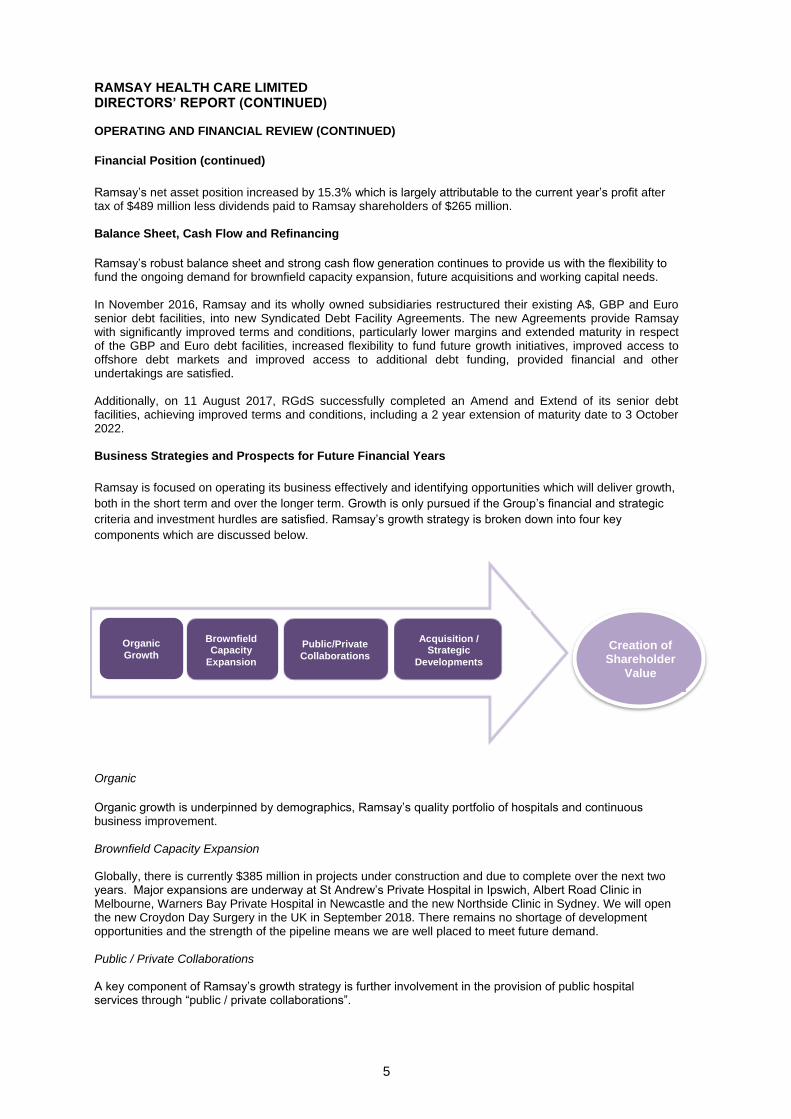
Ramsay is focused on operating its business effectively and identifying opportunities which will deliver growth,
both in the short term and over the longer term. Growth is only pursued if the Group’s financial and strategic
criteria and investment hurdles are satisfied. Ramsay’s growth strategy is broken down into four key
components which are discussed below.
Organic
Organic growth is underpinned by demographics, Ramsay’s quality portfolio of hospitals and continuous business improvement. Brownfield Capacity Expansion Globally, there is currently $385 million in projects under construction and due to complete over the next two years. Major expansions are underway at St Andrew’s Private Hospital in Ipswich, Albert Road Clinic in Melbourne, Warners Bay Private Hospital in Newcastle and the new Northside Clinic in Sydney. We will open the new Croydon Day Surgery in the UK in September 2018. There remains no shortage of development opportunities and the strength of the pipeline means we are well placed to meet future demand. Public / Private Collaborations A key component of Ramsay’s growth strategy is further involvement in the provision of public hospital services through “public / private collaborations”.
Organic
Growth
Brownfield Capacity
Expansion
Public/Private
Collaborations
Acquisition / Strategic
Developments
Creation of Shareholder
Value

6
RAMSAY HEALTH CARE LIMITED DIRECTORS’ REPORT (CONTINUED)
OPERATING AND FINANCIAL REVIEW (CONTINUED)
Business Strategies and Prospects for Future Financial Years (continued)
Acquisitions
Ramsay continues to canvass emerging opportunities in France, the UK, Asia, and other markets.
Material Business Risks
Ramsay faces a number of business risks that could affect the Group’s operations, business strategies and financial prospects. These are described below, together with relevant mitigation strategies:
Australian government policy & regulation There are a number of areas in which changes in the policies of State and Federal government may have a material impact on the Australian health sector and, more specifically, the private health care sector and Ramsay. Some of the changes which may affect Ramsay include:
The Federal Government’s move since 1 July 2012 to “means test” individuals’ private health insurance rebate may lead to a reduction in the number of Australians who hold private health fund memberships or members downgrading their cover to more affordable policies;
The government regulation of health funds, in particular, restrictions on the levels of insurance premium increase and the scope of coverage; and
Private hospital licensing policy which could have the effect of reducing the barriers to entry and exposing Ramsay to increased competition and additional compliance costs.
Ramsay monitors legislative and regulatory developments and engages appropriately with the relevant bodies where required.
Foreign country government policy & regulation As Ramsay continues to expand into foreign markets, the Group must operate in accordance with these countries’ government policies and regulations which may differ from Australian government policy and regulation. Changes in foreign government policy may have a material impact on the health sector and Ramsay’s business operations. Additionally, cultural differences may arise in the way businesses operate in foreign markets in comparison to how Ramsay has traditionally carried out its operations. If cultural differences are not identified and addressed, the local population will not be open to using Ramsay’s facilities in these markets and the facilities located in foreign countries will not achieve their expected positive contribution to the Group’s overall performance.
Ramsay undertakes comprehensive due diligence when entering into foreign markets to ensure that any risk of entering a foreign market is minimised to the extent possible, both in regards to government policy and regulation and cultural differences. Ramsay monitors legislative and regulatory developments and engages appropriately with the relevant bodies where required.
Acquisitions Over the last decade, Ramsay has acquired several hospitals and groups of hospitals both locally and abroad. Should these hospitals fail to continue their improvement in financial performance and not achieve their expected positive contribution to the Group’s overall financial performance, this may adversely impact on the financial performance and operations of Ramsay.
As discussed above, part of Ramsay’s business and growth strategy includes the potential acquisition of additional hospitals. The acquisitions may expose Ramsay to unanticipated liabilities. The process of integrating acquired operations into Ramsay’s existing operations may also result in unforseen operating difficulties and may require significant financial resources.
Ramsay undertakes comprehensive due diligence when entering into foreign markets to ensure that any risk of entering a foreign market is minimised to the extent possible and takes a disciplined approach to investment of capital.
Cyber Security / Information Technology Sensitive clinical, financial and other information is stored electronically by Ramsay and has the potential to be affected by a cyber-attack. The strength and effectiveness of the Group’s information technology controls are subject to regular review and proactively managed. The Group has adopted a Cybersecurity Framework, which has been designed to work within the Group’s overarching risk management approach. The Board, through the Risk Management Committee, has ultimate responsibility for and ownership of the Cybersecurity Framework and receives quarterly reports on (among other things) how cyber risk is being proactively managed.

7
RAMSAY HEALTH CARE LIMITED DIRECTORS’ REPORT (CONTINUED) OPERATING AND FINANCIAL REVIEW (CONTINUED) Material Business Risks (continued) Health funds The majority of Ramsay’s revenue in Australia is derived from health funds. Accordingly, Ramsay has prima facie, significant credit risk exposure to receivables owing from a single or group of related health funds. The credit quality of these health funds is considered high as they are governed by the Australian Prudential Regulatory Authority (APRA). Additionally, failure to reach a satisfactory commercial relationship with key health funds has the potential to impact on the financial performance and operations of Ramsay. Failure to achieve an acceptable outcome may be because of differences in rates, terms or conditions (including the introduction of different funding models). Ramsay maintains a regular dialogue with each of the private health funds and continues to work with them to deliver mutually beneficial outcomes as part of normal contract negotiations. Revenue from government sources The majority of Ramsay’s revenue in the UK and France is derived from government sources. Accordingly, Ramsay has prima facie, significant risk exposure to adverse pricing changes as set by the respective governments. Failure to reach a satisfactory outcome with governments has the potential to impact on the financial performance and operations of Ramsay. Failure to achieve an acceptable outcome may be because of differences in rates, terms or conditions (including the introduction of different funding models). Ramsay engages with the relevant government bodies where required and continues to work with them to deliver mutually beneficial outcomes. Relationships with Doctors As the majority of doctors operating or consulting at Ramsay’s hospitals are not employees, doctors have no obligation to use any of Ramsay’s facilities. Doctors directly affect the efficiency and quality of services of Ramsay’s facilities through the number and type of patients they treat, the time they take in theatre, their consumption of supplies and their decision on when to discharge patients. Furthermore, Ramsay’s reputation may be affected by the quality of the doctors using its facilities. Ramsay regularly engages with its doctors to maintain a strong relationship. Ramsay facilities operate within a strict quality and clinical framework to ensure a high quality of clinical outcomes. Reliance on Nursing Ramsay’s most significant cost is nursing labour. Whilst currently there is a good supply of nursing labour, it is projected that the supply will tighten over the next 10 years. Should Ramsay be unable to secure sufficient nurses or the cost of nurses escalates beyond anticipated levels this could impact on the financial and operational performance of the business. Ramsay undertakes a worldwide recruitment program for nurses to help mitigate any risks of issues with supply of nursing labour. Insurance Insurance is maintained within ranges of coverage consistent with industry practice. If any one of Ramsay’s insurers ceased to be in a position to meet claims (for example, because of insolvency) Ramsay could be materially adversely affected. Ramsay has an experienced team which works closely with its insurers and manages both Ramsay’s on-going insurance needs and any claims that may arise from time to time. Licences Hospitals are required to be licensed under various legislations. These licences are generally subject to annual review and are subject to revocation in certain circumstances. Hospitals cannot operate without a valid licence. If Ramsay is unable to secure applicable licences for the operation of its hospitals in the future or if any of its existing hospital licences are revoked, this may have a material adverse effect on Ramsay. Ramsay has robust compliance policies and procedures that are designed to manage each facility’s licensing and accreditation obligations. Competition Ramsay operates in markets with established competitors and no assurance can be given that the actions of existing or future competitors will not have a material adverse effect on Ramsay’s ability to implement its plans and on Ramsay’s business, results of operations or financial condition. Ramsay concentrates on providing high quality health care in each of its locations and maintaining a high standard at all facilities to mitigate competition risk.

8
RAMSAY HEALTH CARE LIMITED DIRECTORS’ REPORT (CONTINUED) DIVIDENDS Dividends paid or recommended for payment on ordinary shares are as follows: Final dividend recommended @ 81.5 cents per share (2016: 72.0 cents) $164,696,000 (2016: $145,498,000) Interim dividend paid during the year @ 53.0 cents per share (2016: 47.0 cents) $107,103,000 (2016: $94,978,000) Dividends paid or recommended for payment on CARES are as follows: Final dividend recommended @ $2.39 per security (2016: $2.57) $6,210,000 (2016: $6,670,000) Interim dividend paid during the year @ $2.39 per security (2016: $2.47) $6,207,000 (2016: $6,433,000)
The tax rate at which paid dividends have been franked and recommended dividends will be franked is 30% (2016: 30%). CORPORATE INFORMATION This financial report covers the Ramsay Health Care Limited consolidated Group which comprises the Company and its subsidiaries (‘the Group’). The Group's functional and presentational currency is AUD ($). The Company is a for-profit company, limited by shares, that is incorporated and domiciled in Australia, whose shares are publicly traded on the Australian Securities Exchange. The registered office is Suite 18.03, Level 18, 126 Phillip Street, Sydney NSW 2000. The financial report of the Company for the year ended 30 June 2017 was authorised for issue on 12 September 2017 in accordance with a resolution of the Directors. SIGNIFICANT CHANGES IN THE STATE OF AFFAIRS There have been no significant changes in the state of the Group’s affairs during the financial year. PERFORMANCE RIGHTS (EQUITY) At the date of this report there were 1,265,340 (2016: 1,319,207) ordinary shares under the Executive Performance Rights Plan that are yet to vest. Refer to Note 16 of the financial statements for further details of any rights outstanding as at 30 June 2017. SIGNIFICANT EVENTS AFTER THE REPORTING DATE There have been no significant events after the reporting date that may significantly affect the Group’s operations in future years, the results of these operations in future years or the Group’s state of affairs in future years. LIKELY DEVELOPMENTS AND EXPECTED RESULTS Directors and management of the consolidated entity will continue to seek growth in its existing business and to ensure the operation of high quality, cost effective facilities, in order to optimise returns to shareholders. At the same time, directors and management are continuing to pursue opportunities, including expansion of existing facilities, further hospital acquisitions as well as other opportunities closely aligned to the hospital sector, which are within the Company’s core competencies and investment criteria. INDEMNIFICATION AND INSURANCE OF DIRECTORS AND OFFICERS The Company has a Directors’ and Officers’ Liability policy covering each of the Directors and certain executive officers for liabilities incurred in the performance of their duties and as specifically allowed under the Corporations Act 2001. The premiums in respect of the policy are payable by the Company. The terms of the policy specifically prohibit the disclosure of any other details relating to the policy and therefore the Directors do not intend disclosing further particulars relating thereto.
9
RAMSAY HEALTH CARE LIMITED DIRECTORS’ REPORT (CONTINUED)
REMUNERATION REPORT Dear Shareholders
On behalf of the Board, I am pleased to present you with Ramsay’s 2017 Remuneration Report.
This Remuneration Report illustrates how our remuneration policies and practices are linked to Ramsay’s performance, both in the way they are structured and in the outcomes they deliver. Your Board is committed to continuing to provide shareholders and other stakeholders with all the information needed to properly understand Ramsay’s remuneration framework and outcomes for each financial year. To this end, this year we have undertaken a “refresh” of our Remuneration Report to make it more user-friendly and ensure the information is presented in a clear, concise and transparent manner.
Our remuneration framework is structured so that executives are rewarded where strong performance is delivered and value is generated for shareholders. Ramsay has continued to perform strongly over the last 12 months, sustaining its financial performance and continuing to consolidate its global footprint. Short-term incentive awards averaged 96.2% of maximum for executive key management personnel, reflecting another excellent year for the Group. Executives were also rewarded for their role in delivering sustained growth in Ramsay’s core earnings per share and shareholder returns, which supported another year of strong long-term incentive vesting. Section 3 of the Report illustrates how the executive remuneration outcomes have linked directly to the creation of value for all shareholders.
On 3 July 2017, we welcomed Craig McNally into the role as Ramsay’s Managing Director and Chief Executive Officer. Craig is one of Ramsay’s longest serving senior executives and is an outstanding choice to lead Ramsay going forward. As part of the Managing Director succession process, the Remuneration Committee and Board undertook a comprehensive review and benchmarking of the remuneration package for the Managing Director role. As a result of this review, and in line with the feedback we received from key stakeholders, we have recalibrated the total remuneration for the Managing Director role and have reweighted the fixed and at-risk components. Your Board remains committed to taking appropriate steps to align its remuneration framework and levels with investor expectations, and the recalibration of the Managing Director’s remuneration package is an important step in what the Board recognises is a multi-year journey.
Ramsay would like to acknowledge the exceptional contribution of our previous Managing Director and Chief Executive Officer, Chris Rex, who retired on 2 July 2017 after nine years in the role. Chris’ termination package was structured having regard to his contractual entitlements, although Chris voluntarily waived his right to his full 12 month notice period and will not receive any payment in lieu of notice.
Ramsay recognises that the outstanding results it has achieved in recent years reflect the contribution made by each and every staff member, not just the directors and executives. To recognise and reward our people and the contribution they make to the Group’s success, Ramsay has continued its Employee Share Programme which gives employees an opportunity to hold shares in Ramsay and directly benefit from the Group’s strong performance in the same way as other shareholders.
On behalf of the Remuneration Committee and the Board, I commend this Remuneration Report to you.
Yours sincerely
Rod McGeoch AO
Chairman
Remuneration Committee
12 September 2017

10
RAMSAY HEALTH CARE LIMITED DIRECTORS’ REPORT (CONTINUED)
REMUNERATION REPORT – Audited
1. HIGHLIGHTS
The Ramsay Board is committed to a remuneration framework that aligns the pay outcomes for the Managing Director and Chief Executive Officer (Managing Director) and other executive key management personnel (together, Executives) with the achievement of the Group’s strategy and business objectives including generating returns for shareholders.
This Remuneration Report for the year ended 30 June 2017 outlines the remuneration arrangements of the key management personnel (KMP) of Ramsay for the purposes of the Corporations Act 2001 and the Accounting Standards. KMP are those people who have the authority and responsibility for planning, directing and controlling the Group’s activities, either directly or indirectly.
A summary of the year’s highlights and key remuneration outcomes is set out below.
Managing Director and Chief Executive Officer changeover
During FY2017 Ramsay was delighted to announce the appointment of Mr Craig McNally as Ramsay’s new Managing Director. Mr McNally assumed the appointment as of 3 July 2017. The key terms of his employment contract were announced to the market on 28 March 2017 and are set out in section 2.
Mr McNally took over as Managing Director from Mr Christopher Rex, who announced in February 2017 his intention to retire. The details of Mr Rex’s retirement package are also set out below under section 2.
Fixed remuneration in FY2017
There was a 2.5% increase in the fixed remuneration of all Executives for FY2017.
STI outcomes in FY2017
Executives performed well against their STI targets for FY2017, with the average proportion of the maximum STI awarded to all Executives in FY2017 being 96.2%. Whilst Ramsay has paid either maximum STI bonuses or close to maximum STI bonuses for all Executives over the last five financial years, the Board emphasises that this result is not an indication that the key performance indicators (KPIs) are too lenient, but instead reflects the contribution of each of the Executives to Ramsay’s outstanding performance.
The table below summarises performance versus target and ‘stretch’ against each scorecard category under the FY2017 STI plan for Mr Rex.
Measures
Associated Strategic Objectives
Scorecard Weighting
Actual Outcome Comment
Target KPIs
Financial performance of the global business as a whole
Group profitability and strong growth
24% Achieved in Full
Ramsay achieved Core NPAT and Core EPS growth of 12.7% and 13.0% respectively. This result outperformed the market guidance given in August 2016.
Strategy, leadership & culture
Management and culture
18% Achieved in Full
Mr Rex successfully executed Ramsay’s strategy during FY2017, including demonstrating strong leadership in managing the impact arising from changes to government funding policies in France and the United Kingdom. Mr Rex’s leadership during the transition to Mr McNally as the incoming Managing Director was invaluable.
International strategy Strong growth and financial discipline
12% Achieved in Full
Mr Rex continued to oversee the effective integration and alignment of Ramsay’s international businesses. Despite no material hospital acquisitions during the year, Mr Rex continued to demonstrate a prudent approach to the use of shareholder funds in respect of the opportunities explored during the year.
Discretionary criteria Patients, people and operational safety
6%
Achieved in Full
In considering the discretionary component of Mr Rex’s target KPIs, the Remuneration Committee and the Board focused on clinical governance in Ramsay’s facilities and workplace health and safety – two areas of

11
RAMSAY HEALTH CARE LIMITED DIRECTORS’ REPORT (CONTINUED)
REMUNERATION REPORT – Audited
Measures
Associated Strategic Objectives
Scorecard Weighting
Actual Outcome Comment
Ramsay’s business that go to the heart of The Ramsay Way and its “People caring for people” ethos. On any number of internal and in-country benchmarks used, Mr Rex’s performance in overseeing the management of the Group’s clinical and workplace health and safety was very strong.
‘Stretch’ KPIs
Core NPAT 6% above FY2017 budget
Strong growth 20% Achieved in Part
Ramsay achieved Core NPAT growth of 4.07% above budgeted FY2017 Core NPAT growth. This result was less than the 6% growth required to fully satisfy this component of the ‘stretch’ KPI.
Discretionary criteria
Management and culture Strong growth Patients, people and operational safety
20% Achieved in Full
The discretionary criteria against which Mr Rex’s performance was assessed included: • Maintaining The Ramsay Way and
culture; • Ensuring the success of global
management structure and process; • Deriving material savings for the
Group from the global procurement strategy;
• Developing a robust quality and risk management mechanism across the Group;
• Continuing to source and review acquisition opportunities in existing and new markets;
• Navigating Ramsay to best achievable outcomes in negotiation with funders;
• Further reviewing and re-setting the Strategic Plan for the Company;
• Further developing succession planning for key management positions;
• Working positively with the Board and any potential candidates on personal succession planning; and
Maintaining close relationships with governments.
The Remuneration Committee and the Board were satisfied that Mr Rex had performed extremely well in each of these areas. Among other things, Mr Rex oversaw the delivery of material Group procurement savings and was at the forefront of driving continued improvements to Ramsay’s Group-wide quality and risk management function.
FY2017 STI Scorecard Outcome 100% 93.6%

12
RAMSAY HEALTH CARE LIMITED DIRECTORS’ REPORT (CONTINUED)
REMUNERATION REPORT – Audited
Mr McNally (in his capacity as Group Chief Operating Officer) and all other Executives also performed well against their individual objectives and, in light of Ramsay’s strong financial and overall performance, received STI awards of 100% of maximum for FY2017.
LTI outcomes in FY2017
Ramsay’s FY2015 LTI grant was tested based on performance for the three years to 30 June 2017. Ramsay’s sustained growth in EPS and strong TSR performance relative to its peers has resulted in near-full vesting of the FY2015 Performance Rights. See section 3 for further details.
Non-Executive Director Fees for FY2017 and FY2018
For FY2017, Non-Executive Director fees and committee fees increased by 2.5% over FY2016 levels. In respect of FY2018, the Board has resolved not to increase Non-Executive Director fees and committee fees above FY2017 levels.
2. MANAGING DIRECTOR REMUNERATION
Investors rightly have an interest in ensuring that the quantum and structure of executive remuneration levels are fair and appropriate. This is particularly true for the Managing Director. In setting the new Managing Director's remuneration package, the Board took into consideration external benchmarking, investor feedback and the fact that Mr McNally is new to the role. Based on this, the Board has approved a total remuneration package that is significantly lower than the previous Managing Director's package. Remuneration at target has reduced by approximately 45% to $5 million. In addition, while the Board believes that much of a Managing Director's remuneration should be at risk (total ‘at risk’ remuneration continues to comprise a majority of the overall remuneration opportunity for Mr McNally), it also recognised that the proportion of LTIs in the previous package was high and has adjusted that component. The Board will continue to review Mr McNally’s remuneration annually with particular regard to his performance. The overview and comparison between the packages is illustrated below.
Mr McNally’s remuneration mix for FY2018
(1) ‘Target’ performance assumes all target STI KPIs are met and 50% vesting for each LTI component.
The figures used to compile the above chart are taken from Mr McNally’s remuneration package for FY2018, as announced to the ASX on 28 March 2017. Statutory superannuation, other non-monetary and leave entitlements are not included.
26.5%
40.5%
100%
26.5%
24%
47%
35.5%
0 1 2 3 4 5 6 7 8
Maximum
Target (1)
Minimum
Fixed Remuneration ($m) STI ($m) LTI ($m)

13
RAMSAY HEALTH CARE LIMITED DIRECTORS’ REPORT (CONTINUED)
REMUNERATION REPORT – Audited
Mr Rex’s remuneration mix for FY2017
(1) ‘Target’ performance assumes all target STI KPIs are met and 50% vesting for each LTI component.
The figures used to compile the above chart are taken from Mr Rex’s FY2017 remuneration package. Statutory superannuation, other non-monetary and leave entitlements are not included.
Key terms of the Executive Service Agreement for Mr McNally
Duration Ongoing.
Termination by Mr McNally
6 months’ notice. Company may elect to make payment in lieu of notice.
Mr McNally may terminate the employment agreement without notice if a fundamental change occurs in his role or responsibilities.
Termination by Company
12 months’ notice or payment in lieu of notice.
Ramsay may summarily terminate Mr McNally’s employment without notice in certain circumstances.
Restraint 12 month restraint provision applies.
The key terms of Mr Rex’s Executive Service Agreement have been outlined in previous years’ Remuneration Reports and are not restated here given his retirement from the position of Managing Director. Details of his retirement arrangements are set out below.
Retirement package for Mr Rex
Since notice of Mr Rex’s termination was given on 22 March 2017, he has continued to receive his ordinary fixed remuneration throughout his notice period which was agreed to end on 31 August 2017. Mr Rex waived his right to payment of the full 12 month notice period and will not receive any payment in lieu of notice. Mr Rex is not eligible to receive an STI or be granted an LTI in respect of FY2018. Upon ceasing employment:
Mr Rex will receive his accrued statutory entitlements.
Mr Rex will receive his FY2017 STI award of $2,222,764 which was calculated based on performance against agreed key performance indicators over the relevant performance period (being 1 July 2016 to 30 June 2017). Mr Rex’s FY2017 STI award is not pro-rated as Mr Rex was Managing Director throughout the whole of the performance period up to 30 June 2017. Mr Rex’s FY2017 STI will be paid in the ordinary course of Ramsay’s STI payment cycle, wholly in cash (with no further deferral or restriction).
Restrictions that remain on shares acquired under the STI plan will be lifted.
Mr Rex’s unvested LTI Awards granted in FY2016 and FY2017 will remain on foot in accordance with the terms upon which they were granted, notwithstanding the cessation of his employment within the Group.
15.8%
26.5%
100%
15.8%
16%
68.4%
57.5%
0 2 4 6 8 10 12 14 16
Maximum
Target (1)
Minimum
Fixed Remuneration ($m) STI ($m) LTI ($m)

14
RAMSAY HEALTH CARE LIMITED DIRECTORS’ REPORT (CONTINUED)
REMUNERATION REPORT – Audited
Components of Mr McNally’s remuneration and link to strategy
Executive Remuneration Component
Delivery Performance measure Link to strategy
Fixed remuneration Cash and superannuation (up to the statutory cap)
Fixed/guaranteed element Set at a market competitive level to retain and motivate
STI 50% cash, 50% shares which are restricted for 3 years
Financial performance including core NPAT, strategy, leadership and culture, international strategy and discretionary criteria
60% linked to achievement of target performance levels
40% linked to achievement of ‘stretch’ performance levels
Rewards performance at a Group level that is consistent with execution of Ramsay’s strategic priorities during the financial year
LTI Performance Rights over Ramsay shares
50% relative TSR hurdle and 50% EPS hurdle
Directs attention to achieving Ramsay’s long-term strategy and delivering sustainable value to its shareholders. Also aligns Executive and shareholder interests
The below diagram illustrates the remuneration cycle for the Managing Director and other Executives. The remuneration components are explained in further detail in section 6 below.
Short Term IncentiveAt risk based on financialand non-financial hurdles
Total Fixed RemunerationDetermined based on: 2016 performance market benchmarking
Long Term IncentiveAt risk based on a combination of relative total shareholder return and earnings per share
Financial Year
2017 2018 2019 2020 2021
FY2017Executive
Remuneration
FY2018 Executive
Remuneration
Short Term IncentiveAt risk based on financialand non-financial hurdles
Long Term IncentiveAt risk based on a combination of relative total shareholder return and earnings per share
Total Fixed RemunerationDetermined based on: 2017 performance market benchmarking
Possible re-testing of TSR performance
hurdle
Restriction period for 50% of the Managing Director’s STI that is deferred into shares purchased on market
Possible re-testing of TSR performance
hurdle
Restriction period for 50% of the Managing Director’s STI that is deferred into shares purchased on market

15
RAMSAY HEALTH CARE LIMITED DIRECTORS’ REPORT (CONTINUED)
REMUNERATION REPORT – Audited
3. FY2017 REMUNERATION OUTCOMES FOR EXECUTIVES
FY2017 remuneration outcomes
Details of the remuneration of Executives, prepared in accordance with statutory obligations and accounting standards, are set out in section 7 of this Remuneration Report. However, the Board recognises that the statutory tables do not provide a clear indication of the actual value of remuneration earned by the Executives during the year.
The table on the following page has been prepared to provide shareholders with a greater understanding of actual remuneration received by Executives in FY2017.
The key difference between remuneration figures provided in the below table compared to the statutory table is that under the applicable accounting standards the statutory table requires the value of equity grants to be estimated and apportioned over the relevant vesting period, irrespective of whether those awards ultimately vest. By contrast, the actual reward outcomes table below only captures equity grants that vested based on performance and delivered value to the Executive in FY2017.

16
RAMSAY HEALTH CARE LIMITED DIRECTORS’ REPORT (CONTINUED)
REMUNERATION REPORT – Audited
Executive Position held Cash salary
STI1 LTI
(at grant date)2
Super-annuation
Other3 Total
Remuneration –
Grant Date4
LTI
growth in value
5
Total Remuneration –
Vesting Date6
C.P. Rex Managing Director $2,376,000 $2,222,764 $8,424,636 $19,616 $20,121 $13,063,137 $9,164,628 $22,227,765
C.R. McNally Group Chief Operating Officer
$878,637 $436,138 $2,297,628 $19,616 $33,379 $3,665,398 $2,499,444 $6,164,842
B.R. Soden Group Chief Financial Officer and Group Finance Director
$1,530,151 $741,178 $3,637,911 $19,616 $30,024 $5,958,880 $3,957,453 $9,916,333
D.A. Sims Chief Executive Officer - Ramsay Health Care Australia
$878,637 $436,138 $2,297,628 $19,616 $9,703 $3,641,722 $2,499,444 $6,141,166
1. This figure represents the actual STI earned for performance in FY2017 (to be paid in FY2018).
2. This figure represents the market value of the Performance Rights that have vested during FY2017 based on multi-year performance between 1 July 2013 and 30 June 2016. The value is calculated by multiplying the number of vested rights by the 5-day volume weighted average price of Ramsay shares up to and including the date of grant on 14 November 2013 (being $38.2938). Performance Rights, including those granted in FY2017, which remained unvested as at 30 June 2017, do not appear in this table as no actual value was realised by Executives from these Performance Rights during FY2017.
3. This figure represents non-monetary benefits such as private health insurance cover.
4. This figure shows the total actual remuneration using the value of Performance Rights as at the date of grant on 14 November 2013.
5. This figure shows the increase in market value of the Performance Rights due to share price growth between the grant date and the vesting date. The increase in value of the Performance Rights is calculated by multiplying the number of vested rights by the difference between the 5-day volume weighted average price of Ramsay shares up to and including the date of grant on 14 November 2013 ($38.2938) and the date of vesting on 31 August 2016 (being $79.9512).
6. This figure shows the total actual remuneration using the value of Performance Rights as at the date of vesting on 31 August 2016.

17
RAMSAY HEALTH CARE LIMITED DIRECTORS’ REPORT (CONTINUED)
REMUNERATION REPORT – Audited
STI outcomes for FY2017 The details of Ramsay’s STI plan are set out in section 6 of this Remuneration Report. The plan is designed to reward performance against measures developed for each Executive based on their areas of responsibility and execution of key strategic objectives. Details of the FY2017 STI targets and outcomes for the former Managing Director, Mr Rex, are set out in section 1. Unlike the Managing Director, whose total STI opportunity is divided into a target component (60%) and a ‘stretch’ component (40%) with different performance hurdles for each, other Executives have a set of challenging KPIs that apply to the entire STI bonus. The Executives’ KPIs and associated weightings per KPI vary depending on their role and responsibilities. Executives’ financial KPIs include:
core EBIT performance to budget;
business unit contribution to EBIT (for Executives with business unit accountability); and
capital and financial management.
The non-financial KPIs are tailored for the individual Executive, but broadly include:
strategy, leadership and culture KPIs, such as: o delivering safe, high quality patient care; o implementing 5 year strategic plan; and o promotion of the ‘Ramsay Way’ culture.
functional KPIs, such as: o search for acquisitions; o management of brownfield opportunities; o new business initiatives; and o investor relations.
As noted above, each of the Executives either met or exceeded their individual KPIs for FY2017, other than the former Managing Director who fell slightly short of achieving his ‘stretch’ KPIs in full. This level of individual achievement, combined with the outstanding financial performance of the Group resulted in each of the Executives, other than the former Managing Director, receiving 100% of their STI for FY2017.
Whilst Ramsay has paid either maximum STI bonuses or close to maximum STI bonuses for all Executives over the last five financial years, the Board emphasises that this result is not an indication that the KPIs are too lenient, but instead reflects the contribution of each of the Executives to Ramsay’s outstanding performance. The Board is of the view that the STI outcomes for Executives continue to be aligned with shareholder returns.
The table below shows the actual STI bonus amounts to be paid to the Managing Director and other Executives for their performance in FY2017.
Executive Minimum potential
STI Bonus
Maximum potential
STI bonus
Actual STI for FY2017, to be paid in FY2018
subject to target KPIs
Actual STI for FY2017, to be paid in FY2018
subject to ‘stretch’ KPIs
Actual STI awarded as % of
maximum STI
C.P. Rex1, 2
Nil 2,376,000 1,425,600 $797,164 93.6%
B.R. Soden Nil 741,178 741,148 Not applicable 100%
D.A. Sims Nil 436,138 436,138 Not applicable 100%
C.R. McNally Nil 436,138 436,138 Not applicable 100%
1. For Mr Rex, 60% of his maximum bonus is awarded where target KPI performance levels are
achieved. The remaining 40% of his maximum bonus only becomes available where performance meets or exceeds ‘stretch’ KPI levels, in which case some or all of the remaining 40% of the STI may be awarded based on performance against stretch KPI levels.
2. As Mr Rex exceeded target performance levels for FY2017 and fell just short of meeting the ‘stretch’ targets, his total FY2017 STI award is 93.5% of the total maximum STI available for the financial year.

18
RAMSAY HEALTH CARE LIMITED DIRECTORS’ REPORT (CONTINUED)
REMUNERATION REPORT – Audited
LTI vesting for FY2017
The details of Ramsay’s LTI plan are set out in section 6 of this Remuneration Report. The LTI is issued as Performance Rights with a three year performance period subject to EPS, relative TSR and, for divisional heads, business unit performance hurdles.
Ramsay’s FY2015 LTI grant was tested on 30 June 2017. There were changes made to the LTI performance hurdles in FY2016 which mean that the LTI hurdles tested in FY2017 differ from those described in section 6 (which relate to the current LTIs on foot, including the LTI issued during FY2017). The FY2015 grant is the last year to which the previous performance hurdles apply. The table below outlines the key differences in the terms of the previous LTI compared to the current LTI:
Grants made prior to FY2016 (Previous LTI) Grants made in FY2016 onwards (Current LTI)
EPS target
EPS target based on budget EPS target based on market guidance given upon Ramsay disclosing its full-year preliminary financial results in August
EPS vesting schedule
EPS vesting schedule allowed for vesting on a straight line basis where EPS was between a threshold and target figure
Vesting occurs on a stepped basis. No additional rights will vest for EPS performance that is between the stepped thresholds outlined in section 6 below
RTSR comparator group
Comparator group used to measure relative TSR was S&P/ASX200 (excluding companies in the real estate, finance and resources sectors)
Comparator group used to measure relative TSR is S&P/ASX100 (excluding companies in the real estate, finance and resources sectors)
Strong year-on-year performance has enabled Ramsay to outperform its peers over a long-term time horizon. Executives have derived significant value from their LTI grants over the past 5 years, consistent with the strong performance of Ramsay both on a stand-alone basis and compared to Ramsay’s peers. The following table sets out Ramsay’s performance over the past 5 years in respect of the key financial indicators identified by the Board to assess Ramsay’s performance and future prospects.

19
RAMSAY HEALTH CARE LIMITED DIRECTORS’ REPORT (CONTINUED)
REMUNERATION REPORT – Audited
Financial Year
Share Performance Earnings Performance (A$m)
Enterprise Value
3
(A$m) Closing Share Price
(A$)
Dividend
(cents/share)
TSR Percentile Ranking
1
(%)
Core EPS 2
(cents/share)
Core EBIT
Core NPAT
2017 $73.60 134.5¢ 72.17% 261.4¢ $943.4 $542.7 $18,061
2016 $71.76 119.0¢ 90.82% 231.4¢ $897.1 $481.4 $17,877
2015 $61.47 101.0¢ 97.83% 196.6¢ $803.9 $412.1 $15,515
2014 $45.50 85.0¢ 96.81% 163.9¢ $584.9 $346.2 $10,817
2013 $35.81 70.5¢ 96.55% 135.9¢ $485.3 $290.9 $8,485
1. TSR percentile ranking against the relevant comparator group over the 3-year performance period up to the close of each relevant financial year, with exclusions and adjustments described below.
2. Core EPS is calculated using earnings from continuing operations before specific items and amortisation of intangibles, as represented by non-core items (set out in note (a)(i) of the Overview of the Financial Report).
3. Enterprise Value is Ramsay’s market capitalisation (being the total number of issued ordinary shares on 30 June of the relevant financial year at the closing market share price) plus CARES and net debt.
Ramsay’s sustained growth in EPS and TSR percentile ranking has resulted in near-full vesting of Performance Rights granted under the FY2015 Previous LTI grant (which was tested on 30 June 2017). EPS performance
Ramsay is able to disclose that, for the year ended 30 June 2017, the maximum EPS target was set at 251.2. cents per share and the threshold EPS target was 95% of this target (238.6 cents per share). The EPS achieved in FY2017 was 261.4 cents per share.
The table below shows the vesting achieved for the EPS components of the Previous LTI awards for each of the past 3 years. Full vesting has been achieved in each year as a result of Ramsay’s strong and sustained growth in EPS.
Financial Year Aggregate 3-year minimum EPS
threshold
(cents per share)
Aggregate 3-year maximum EPS
target
(cents per share)
Actual aggregate 3-year EPS achieved
(cents per share)
EPS component vesting under LTI
programme
2017 624.3 657.3 689.4 100%
2016 529.9 557.9 591.9 100%
2015 438.1 468.0 496.4 100%
Relative TSR performance
Similarly, Ramsay’s strong TSR performance relative to its peers has resulted in 94.34% vesting for those rights granted under the FY2015 LTI that are subject to a relative TSR performance condition. In accordance with the terms of issue for the FY2015 LTI, those rights that were subject to the TSR performance condition and did not vest will remain on foot and be retested at 31 December 2017 and, if necessary, 30 June 2018. The retesting will be undertaken on the basis of Ramsay’s performance over the extended period – i.e., from 1 July 2014 until the relevant retesting date.
The below table sets out the outcomes achieved for Previous LTI grants tested against a TSR hurdle in each of the past three years:
Year of grant
Testing date
(30 June) 1
TSR percentile ranking for vesting
to commence
TSR percentile ranking for full
vesting
Actual TSR percentile
ranking achieved
TSR component vesting under LTI
programme
FY2015 2017 50% 75% 72.17% 94.34%
FY2014 2016 50% 75% 90.82% 100%
FY2013 2015 50% 75% 97.83% 100%

20
RAMSAY HEALTH CARE LIMITED DIRECTORS’ REPORT (CONTINUED)
REMUNERATION REPORT – Audited
Striking the balance between reward and restraint
The Executive remuneration outcomes in recent years demonstrate that there has been a strong correlation between the returns delivered by Ramsay to its shareholders and the rewards derived by Executives from STI and LTI grants and that the intended alignment between shareholder and Executive interests is being achieved in practice. Executives have derived significant value from the at risk component of their remuneration, particularly their LTI grants which are delivered in equity. Vesting of this component is directly linked to delivery of value to shareholders through growth in earnings, share price and dividends. The graph below illustrates the change in share price between the date of grant and the end of the performance period for Previous LTI grants that have vested in the past three years. This is a direct illustration of the shared benefit that has been enjoyed by Ramsay’s Executives and all other shareholders. The graph also shows the value of dividends paid in respect of the performance period for each Previous LTI award, which is additional value delivered to shareholders beyond that derived by the Executives (who do not receive dividends with respect to their Performance Rights).
Notes:
(1) The share price appreciation over the vesting period is calculated as the difference between Ramsay’s share price at the close of trading on 30 June of the final year of the relevant performance period and Ramsay’s share price on grant date.
(2) The dividend paid over the vesting period means the interim and final dividend paid in respect of each financial year comprising the relevant performance period.
While Executives have received high levels of vesting from their ‘at-risk’ remuneration components, this has not been accompanied by large increases in their fixed remuneration levels. Total remuneration packages for Executives remain heavily weighted towards the ‘at-risk’ components, particularly the LTI which focuses Executives on delivering sustainable strong performance. Ramsay’s excellent record of retaining its Executives is an indication that factors beyond remuneration, in particular the strong ‘Ramsay Way’ culture and the Group’s investment in the development of staff through tailored training programmes, are equally important in attracting, motivating and retaining talented employees as well as supporting the internal promotion of staff to management positions.
4. REMUNERATION GOVERNANCE
How we make decisions This diagram provides an overview of the process Ramsay follows in setting Non-Executive Director and Executive remuneration:
$23.83
$38.37
$52.80
$37.64
$33.39
$20.81$2.57
$3.05$3.53
FY2013LTI Grant
FY2014LTI Grant
FY2015LTI Grant
Dividend paid over the vestingperiod
Share price appreciation overthe vesting period
Share price on grant date

21
RAMSAY HEALTH CARE LIMITED DIRECTORS’ REPORT (CONTINUED)
REMUNERATION REPORT – Audited
REMUNERATION CONSULTANTS &
OTHER EXTERNAL ADVISORS
Support the Remuneration Committee by
providing independent advice on matters
including:
objective benchmarking data and market
practice of other listed companies;
independent legal and regulatory advice
on issues that impact on remuneration
arrangements for Directors and
executives; and
advice on alternatives for incentive
plans.
BOARD
Maintains overall responsibility and accountability for oversight of the Company’s remuneration policy and the principles
and processes which give effect to that policy.
Approves, having regard to recommendations of the Remuneration Committee:
the Company’s executive remuneration policy;
the remuneration packages of the Executive Directors (including the Managing Director) and all of the Managing
Director’s direct reports;
the ‘at risk’ components of the executive remuneration packages, including the structure and operation of equity based
plans; and
the remuneration of the Non-Executive Directors (within the aggregated fee pool limit approved by shareholders).
REMUNERATION COMMITTEE
Primarily responsible for:
reviewing and making
recommendations to the Board regarding
the Group’s remuneration policies;
considering and making recommendations
to the Board on the specific remuneration
for the Executive Directors and all senior
executives reporting directly to the
Managing Director;
reviewing and making recommendations to
the Board regarding the design of all
executive incentive plans; and
reviewing and recommending to the Board
the level and form of remuneration for Non-
Executive Directors.
Instruct &
Oversee
Inform &
Recommend
Engage &
Oversee
Support &
Advise
Instruct &
Oversee
Inform &
Recommend
MANAGING DIRECTOR
Recommend to the Remuneration Committee:
the remuneration arrangements and
performance assessments of direct
reports.
Management of Risk linked to Remuneration Framework
One of the key factors of the Board’s approach to setting Executive remuneration is to discourage excessive risk taking or short term thinking by Executives. Ramsay’s Executive remuneration framework is structured in a way that encourages strategic decision-making and behaviours that align with the Group’s long-term interests.
Key features of the remuneration framework which discourage excessive risk taking include the use of strategic goals as part of the STI KPIs, an LTI with performance hurdles that utilise a combination of internal and external measures and a prohibition on hedging unvested equity awards. This approach to management of risk is consistent with the robust approach to risk management that Ramsay adopts across all aspects of its business (refer to the Corporate Governance Statement in the 2017 Annual Report for further details of the risk management framework).
Engagement of remuneration consultants and other external advisors
During FY2017, Godfrey Remuneration Group (Godfrey) provided Ramsay with remuneration recommendations relating to:
the structure of the Executives’ remuneration packages (e.g., for the new Managing Director for FY2018), including by reference to national and international benchmarks; and
the quantum of LTI grants to Executives.

22
RAMSAY HEALTH CARE LIMITED DIRECTORS’ REPORT (CONTINUED)
REMUNERATION REPORT – Audited
Godfrey’s fees for providing the remuneration recommendations in FY2017 were $59,125 (including GST). Godfrey did not provide any other advice to Ramsay during FY2017. During FY2017, PricewaterhouseCoopers (PWC) also provided the Remuneration Committee and the Board with independent national and global benchmarking analysis in relation to the proposed remuneration for the Managing Director and other executive roles. No remuneration recommendations were made by PWC. The Board has developed protocols regarding the engagement of remuneration consultants and the parameters around the interaction between management and remuneration consultants (Protocols). Under the Protocols, which were reviewed and updated in FY2017, the Remuneration Committee has formal selection criteria and is responsible for oversight of any direct interaction between a remuneration consultant and a member of Ramsay’s KMP. The recommendations provided by Godfrey in FY2017 complied with the Protocols and were accompanied by a declaration that the recommendations were made free from undue influence by any members of the KMP to whom the recommendations related. Therefore, the Board is satisfied that the recommendations were made free from undue influence by any members of the KMP to whom the recommendations related. 5. REMUNERATION POLICY Guiding principles on Executive remuneration The key principles that underpin Ramsay’s Executive remuneration approach and structures are set out in the table below.
Principle Link to Strategy / Shareholders’ Interests
Talent management attraction & retention
Ramsay’s remuneration structure aims to attract and retain exceptional people to lead and manage the Group and to support internal development and promotion of executive talent from within Ramsay.
Performance driven outcomes
The amount of remuneration ultimately earned by any individual is dependent on superior performance and generating value for shareholders that is mainly achieved through the ‘at-risk’ components of Executive remuneration.
Long-term value for shareholders
To drive sustainable growth and returns to shareholders, Executives are set both short and long-term performance targets linked to the core activities necessary to build competitive advantages for the Group’s business, without creating excessive risk for the Group.
Communication & engagement of stakeholders
The Board is committed to clear, transparent disclosure and explanation of Ramsay’s remuneration structures for shareholders and other users of this Report. Where appropriate, the Board seeks and considers the views of shareholders, proxy advisors and shareholder representative bodies in designing and implementing remuneration structures. The Board welcomes questions from shareholders, not just at the AGM, but throughout the year.
Guiding principles on Non-Executive Director remuneration Ramsay’s Non-Executive Director remuneration policy is summarised below.
Principle Link to Strategy / Shareholders’ Interests
Aggregate Board and Committee fees are approved by shareholders
Shareholders approve the pool of fees available for distribution to Non-Executive Directors, which allows them to ensure that the aggregate fees remain within appropriate levels.
The current aggregate fee pool for Non-Executive Directors of $3,500,000 (including statutory superannuation contributions) was approved by shareholders at the 2015 AGM.
Fees are set by reference to key considerations
Non-Executive Director fees must be set at a level that is sufficient to attract and retain high caliber directors with skills and experience required to oversee a business of Ramsay’s size and complexity.
The aggregate fee pool and the manner in which it is apportioned amongst the Non-Executive Directors is reviewed annually. The Remuneration Committee undertakes this review and makes recommendations to the Board, having regard to:
the responsibilities and risks of the role;
the time commitment expected of Non-Executive Directors;
the fees paid by companies to Non-Executive Directors; and
the independent advice received from external advisers.

23
RAMSAY HEALTH CARE LIMITED DIRECTORS’ REPORT (CONTINUED)
REMUNERATION REPORT – Audited
Principle Link to Strategy / Shareholders’ Interests
Remuneration is structured to preserve independence whilst creating alignment
To create alignment between the interests of Non-Executive Directors and shareholders, Non-Executive Directors are encouraged to hold shares in Ramsay.
Under the Non-Executive Director Share Rights Plan approved by shareholders at the 2015 AGM, Non-Executive Directors receive a portion of their remuneration in the form of share rights which, on exercise, convert into shares in Ramsay. These shares are initially subject to a holding lock.
The Board considers structuring Non-Executive Director remuneration in this way will further enhance alignment of interests between Non-Executive Directors and shareholders. Importantly, no portion of the Non-Executive Directors’ remuneration is at risk and the share rights are not subject to any performance conditions in order to preserve the Non-Executive Directors’ impartiality.
6. HOW REMUNERATION IS DELIVERED
Executive remuneration Total remuneration for the Managing Director and other Executives is made up of fixed remuneration (comprising salary and superannuation) and variable remuneration (comprising STI and LTI). The relative mix of the three remuneration components is determined by the Board on the recommendation of the Remuneration Committee. Details of Mr Rex’s remuneration mix are in section 2. For other Executives, the mix that applied for FY2017 is set out below:
% of Total Remuneration (Annualised)
Fixed Remuneration Performance Based ‘At-Risk’ Remuneration
Maximum STI Opportunity Maximum LTI Opportunity
B.R. Soden 22% 11% 67%
C.R. McNally 21% 10% 69%
D.A. Sims 21% 10% 69%
Fixed remuneration is reviewed regularly by the Remuneration Committee with reference to:
each Executive’s individual performance; and
relevant comparative compensation in the market. Executive remuneration levels are set after undertaking a comparison to similar roles in ASX-listed industrial companies with international operations of comparable size to Ramsay in terms of enterprise value and revenue. As noted above, the Board engaged Godfrey to undertake a national and international benchmarking of the Executives’ remuneration packages. Even though Ramsay continues to perform strongly, the Board and Remuneration Committee’s practice is to set fixed remuneration for Executives at median market levels and exercise restraint in its approach to Executive fixed salary increases to ensure fixed remuneration levels do not exceed the desired market median level. The terms applicable to the ‘at risk’ components of Executive remuneration for FY2017 are outlined below.
STI Current LTI
(i.e. LTIs granted in FY2016 & FY2017)
Delivery Managing Director: 50% cash and 50% (less any applicable tax) shares with a 3 year restriction period following on market purchase.
Other Executives: cash.
Performance Rights. Each Performance Right is an entitlement to receive a fully-paid ordinary share in Ramsay at no cost (or an equivalent cash payment).

24
RAMSAY HEALTH CARE LIMITED DIRECTORS’ REPORT (CONTINUED)
REMUNERATION REPORT – Audited
STI Current LTI
(i.e. LTIs granted in FY2016 & FY2017)
Summary of performance conditions
Executives will only receive their STI bonus where they meet challenging KPIs. The KPIs include both financial and non-financial targets for each Executive, although the KPIs vary between Executives depending on the Executive’s role and responsibilities. More information regarding the STI KPIs is included under section 3 of this Remuneration Report.
Executives with global responsibilities
Relative TSR hurdle (50%)
EPS hurdle (50%)
Divisional and business unit heads
Relative TSR hurdle (1/3)
EPS hurdle (1/3)
Business unit performance hurdle (1/3)
Rationale for performance conditions
A combination of financial and non-financial KPIs are chosen because the Board believes that there should be a balance between short term financial measures and more strategic non-financial measures which in the medium to longer term will ultimately drive future growth and returns for shareholders.
The financial KPIs are chosen to provide measureable financial performance criteria strongly linked to year-on-year shareholder returns.
Non-financial KPIs are chosen to encourage the achievement of personal business goals consistent with the Group’s overall objectives including the delivery of safe, high quality patient care, safe working environment, strategic growth, the retention of a professional workforce and the development of new business initiatives.
Relative TSR
The relative TSR hurdle has been chosen because it provides a direct link between Executive reward and shareholder return, relative to Ramsay’s ASX peers.
EPS
The EPS hurdle has been chosen as it provides evidence of Ramsay’s growth in profitability and is directly linked to shareholder returns.
Business unit performance
The purpose of this additional hurdle is to help focus the efforts of those divisional and business unit heads on continually improved performance of the business unit for which they are responsible.
Assessment of performance
Performance against the relevant operational targets is assessed annually as part of the broader performance review process for the individual Executives. Both financial and non-financial KPIs are assessed quantitatively against predetermined benchmarks where appropriate.
Where quantitative assessment is not practicable, qualitative performance appraisals are undertaken by the Remuneration Committee and the Board. Where available, the Remuneration Committee and the Board draw on the outcomes of 360-degree feedback reviews in making these assessments, which are periodically conducted by Ramsay in conjunction with an external consultant.
These methods of assessing performance were chosen because they are, as far as practicable, objective and capable of being independently audited.
TSR hurdle
The relative TSR hurdle is determined by measuring and ranking Ramsay’s TSR relative to the TSRs of a comparator group of companies. The comparator group is comprised of the S&P/ASX100 index (excluding companies in sectors having different drivers of operating performance being those in the real estate, finance and resources sectors).
If the TSR hurdle is not achieved on the first test date then unvested Performance Rights will be re-tested on two more occasions (at 6 and 12 months following the original testing date) based on performance over the extended period. Retesting is considered necessary by the Directors as the comparator group used for assessing Ramsay’s TSR is comprised of companies from a broad range of sectors, ensuring that the Company’s TSR performance on the first test may not necessarily reflect Ramsay’s true relative TSR performance.
If the TSR hurdle is not satisfied on the second and final re-test, unvested Performance Rights will lapse.

25
RAMSAY HEALTH CARE LIMITED DIRECTORS’ REPORT (CONTINUED)
REMUNERATION REPORT – Audited
STI Current LTI
(i.e. LTIs granted in FY2016 & FY2017)
Assessment of performance
(cont)
EPS hurdle
The EPS hurdle is measured by comparing Ramsay’s aggregate EPS over 3 years against an aggregate EPS target calculated based on Ramsay’s market guidance for EPS disclosed at the start of each financial year.
The annual EPS targets are then aggregated to provide the threshold and maximum 3-year targets for vesting of Performance Rights.
No re-testing of the EPS hurdle is permitted.
These methods of assessment are fair and objective, provide Executives with a line of sight on performance required for vesting and align the interests of Executives and shareholders.
Performance period
1 year 3 years
Vesting Mr Rex
60% of the maximum STI opportunity will vest where target performance levels are achieved; and
a further 40% of the maximum STI opportunity will vest where ‘stretch’ levels of performance are achieved. The ‘stretch’ KPIs are designed to only be met where outstanding performance is achieved.
The maximum annual STI opportunity is set at 100% of Mr Rex’s total fixed remuneration.
Other Executives
A single set of challenging KPIs apply to the entire STI bonus, although the specific targets vary between individual Executives (as explained above).
TSR vesting schedule
Company’s TSR ranking against the comparator group
% of Performance Rights subject to the TSR hurdle that vest
Below 50th percentile Nil
At 50th percentile 50%
Between 50th and 75th percentile
Between 50% and 100% increasing on a straight line basis
Above 75th percentile 100%

26
RAMSAY HEALTH CARE LIMITED DIRECTORS’ REPORT (CONTINUED)
REMUNERATION REPORT – Audited
STI Current LTI
(i.e. LTIs granted in FY2016 & FY2017)
Vesting (cont) EPS vesting schedule
Aggregate EPS performance
% of Performance Rights subject to the EPS hurdle that vest
EPS well short of the market guidance
0%
EPS just below the lower end of market guidance
25%
Lower end of market guidance is achieved
50%
Mid-point of market guidance is achieved
75%
Upper end of market guidance is achieved
90%
Well above the upper end of market guidance achieved
100%
No additional rights will vest for EPS performance that is between the above specified points.
Details of the EPS growth targets for FY2016, FY2017 and FY2018, as well as actual EPS achieved in FY2016 and FY2017, are set out in section 8 below.
What if an Executive ceases employment?
If an Executive ceases employment with Ramsay before KPI targets are achieved, then they will generally not be entitled to receive any STI bonus.
However, if cessation of employment is due to illness, disability or death or is a Company-initiated termination other than for cause, the Executive may receive a pro-rata STI payment for the portion of the performance period they were employed.
In general, subject to Board discretion, where an Executive’s employment is terminated during the vesting period:
for serious misconduct, their unvested Performance Rights will lapse; or
in other circumstances, their unvested Performance Rights will remain on foot and will be tested in the ordinary course subject to the performance hurdles outlined above.

27
RAMSAY HEALTH CARE LIMITED DIRECTORS’ REPORT (CONTINUED)
REMUNERATION REPORT – Audited
Service agreements for Executives other than the Managing Director No Executives, other than the Managing Director, have written service contracts and therefore their employment continues until termination by either the Executive or Ramsay. On termination, reasonable notice will apply and the Executive will be entitled to any benefits that they have earned prior to termination (including statutory entitlements) and any applicable payments under Ramsay’s policies. Non-Executive Director remuneration
Board & committee fees For FY2017, Non-Executive Director fees and committee fees increased by 2.5% over FY2016 levels. In respect of FY2018, the Board has resolved not to increase Non-Executive Director fees and committee fees above FY2017 levels.
Component Explanation
Board fees / Committee fees
Fees, per annum, for FY2017 are:
Board: - Chairman - $724,816 - Deputy Chairman - $339,159 - Members - $284,066
Audit Committee: - Chairman - $56,065 - Members - $28,033
Risk Management Committee: - Chairman - $49,838 - Members - $24,919
Remuneration Committee: - Chairman - $41,000 - Members - $20,500
Nomination Committee: - Chairman – Nil - Members – Nil
The above Chairman, Deputy Chairman and base Board fees also include amounts referrable to compulsory superannuation contributions made on behalf of each Non-Executive Director. The above Board fees are also inclusive of share rights granted to each Non-Executive Director in FY2017 under the Non-Executive Director Share Rights Plan.
In FY2017, Non-Executive Directors (including the Chairman and Deputy Chairman) were each granted 537 share rights, which converted to ordinary shares in Ramsay in March 2017.
Other fees Other than as set out below, no additional fees for special duties were paid during FY2017.
Post-employment benefits
Superannuation contributions are made on behalf of the Non-Executive Directors (at the FY2017 rate of 9.5%). This is capped at the statutory limit ($19,615 per Director for FY2017).
Certain Non-Executive Directors are entitled to retirement benefits under the (now frozen) Directors Retirement Benefits Plan. Further details are provided below.
Non-Executive Director Share Rights Plan Fees paid by Ramsay to Non-Executive Directors for their services are delivered partially in cash and partially in the form of rights to Ramsay shares. Structuring Non-Executive Director remuneration in this way supports Non-Executive Directors in building their shareholdings in Ramsay and enhances the alignment of interests between Non-Executive Directors and shareholders. The share rights were fully vested at the time of granting in December 2016 (i.e. they were not subject to any performance conditions or potential forfeiture) and were automatically exercised at no cost and converted into shares in Ramsay in March 2017. A holding lock is in place on these shares until the earlier of:
the Non-Executive Director ceasing to be a Director of Ramsay, or
3 years from the date of grant or such longer period nominated by the Non-Executive Director at the time of the offer (up to a maximum of 15 years from the date of grant).
Preserved benefits under the (frozen) Non-Executive Directors Retirement Benefits Plan Non-Executive Directors appointed prior to October 2003 (being, Michael S Siddle, Peter J Evans, Rod H McGeoch and Kerry C D Roxburgh) remain entitled to retirement benefits under the (now frozen) Directors’ Retirement Benefits Plan.
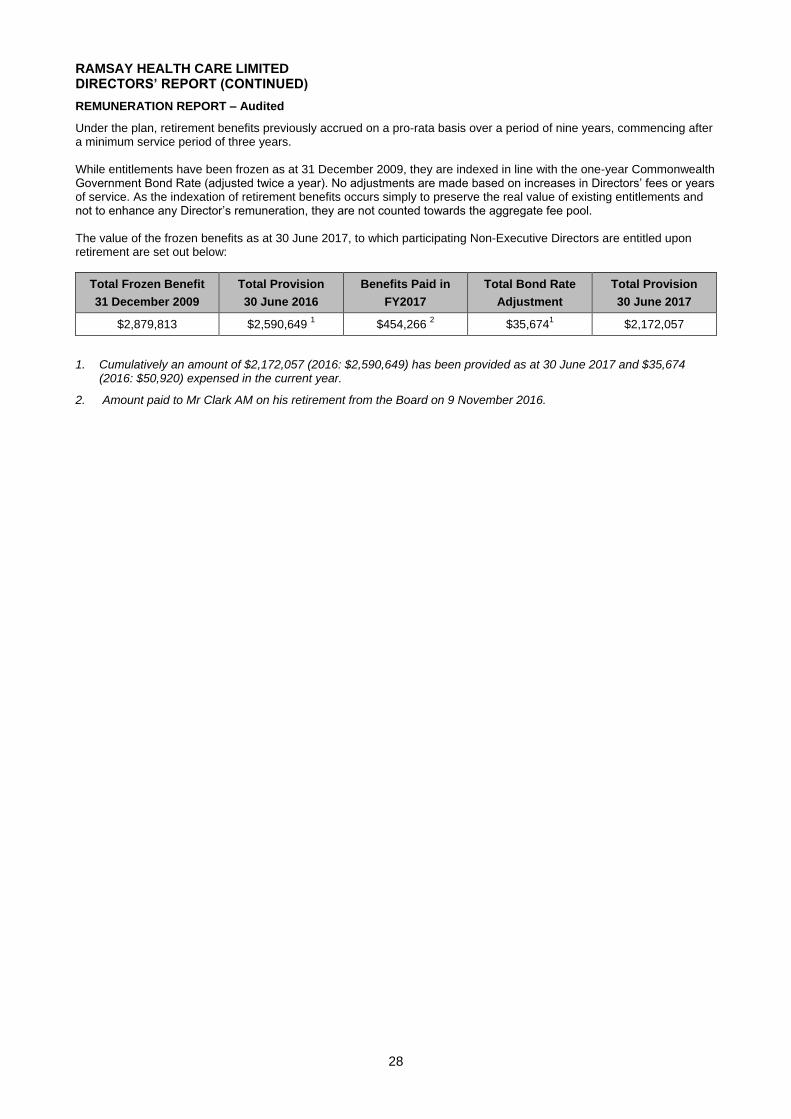
28
RAMSAY HEALTH CARE LIMITED DIRECTORS’ REPORT (CONTINUED)
REMUNERATION REPORT – Audited
Under the plan, retirement benefits previously accrued on a pro-rata basis over a period of nine years, commencing after a minimum service period of three years. While entitlements have been frozen as at 31 December 2009, they are indexed in line with the one-year Commonwealth Government Bond Rate (adjusted twice a year). No adjustments are made based on increases in Directors’ fees or years of service. As the indexation of retirement benefits occurs simply to preserve the real value of existing entitlements and not to enhance any Director’s remuneration, they are not counted towards the aggregate fee pool. The value of the frozen benefits as at 30 June 2017, to which participating Non-Executive Directors are entitled upon retirement are set out below:
Total Frozen Benefit
31 December 2009
Total Provision
30 June 2016
Benefits Paid in
FY2017
Total Bond Rate
Adjustment
Total Provision
30 June 2017
$2,879,813 $2,590,649 1 $454,266
2 $35,674
1 $2,172,057
1. Cumulatively an amount of $2,172,057 (2016: $2,590,649) has been provided as at 30 June 2017 and $35,674 (2016: $50,920) expensed in the current year.
2. Amount paid to Mr Clark AM on his retirement from the Board on 9 November 2016.

29
RAMSAY HEALTH CARE LIMITED DIRECTORS’ REPORT (CONTINUED)
REMUNERATION REPORT – Audited
7. STATUTORY REMUNERATION FOR FY2017 Details of each of the KMP’s remuneration for FY2017 (calculated in accordance with applicable Accounting Standards) are set out below. All values are in A$ unless otherwise stated.
Name1 Short term Post-employment Share based payment
rights Total
$
Total performance
related Salary & fees
2
$
Non monetary
3
$
Accrued bonus
4
$
Long service leave
entitlements
$
Super-
annuation
$
Accrued termination benefits/Retirement
benefits5,
$
Amortised cost of incentive share based rights
6
$
C.P. Rex Managing Director
FY2017 2,376,000 20,121 2,222,764 53,891 19,616 - 18,847,575 23,539,967 90%
FY2016 2,318,000 18,327 2,297,330 53,296 19,308 - 8,962,779 13,669,040 82%
B.R. Soden
Group Chief Financial Officer & Group Finance Director
FY2017 1,530,151 30,024 741,178 42,263 19,616 - 4,444,175 6,807,407 76%
FY2016 1,456,420 33,183 723,100 43,886 19,308 - 3,870,285 6,146,182 75%
C.R. McNally
Group Chief Operating Officer
FY2017 878,637 33,379 436,138 25,203 19,616 - 2,806,833 4,199,806 77%
FY2016 857,207 30,418 425,500 26,213 19,308 - 2,444,387 3,803,033 75%
D.A. Sims
Chief Executive Officer – Ramsay Health Care Australia
FY2017 878,637 9,703 436,138 19,286 19,616 - 2,900,342 4,263,732 78%
FY2016 857,207 31,952 425,500 19,330 19,308 - 2,487,754 3,841,051 76%
M.S. Siddle
Chairman
FY2017 705,126 - - - 19,616 8,618 - 733,360 -
FY2016 688,000 - - - 19,308 10,144 - 717,452 -
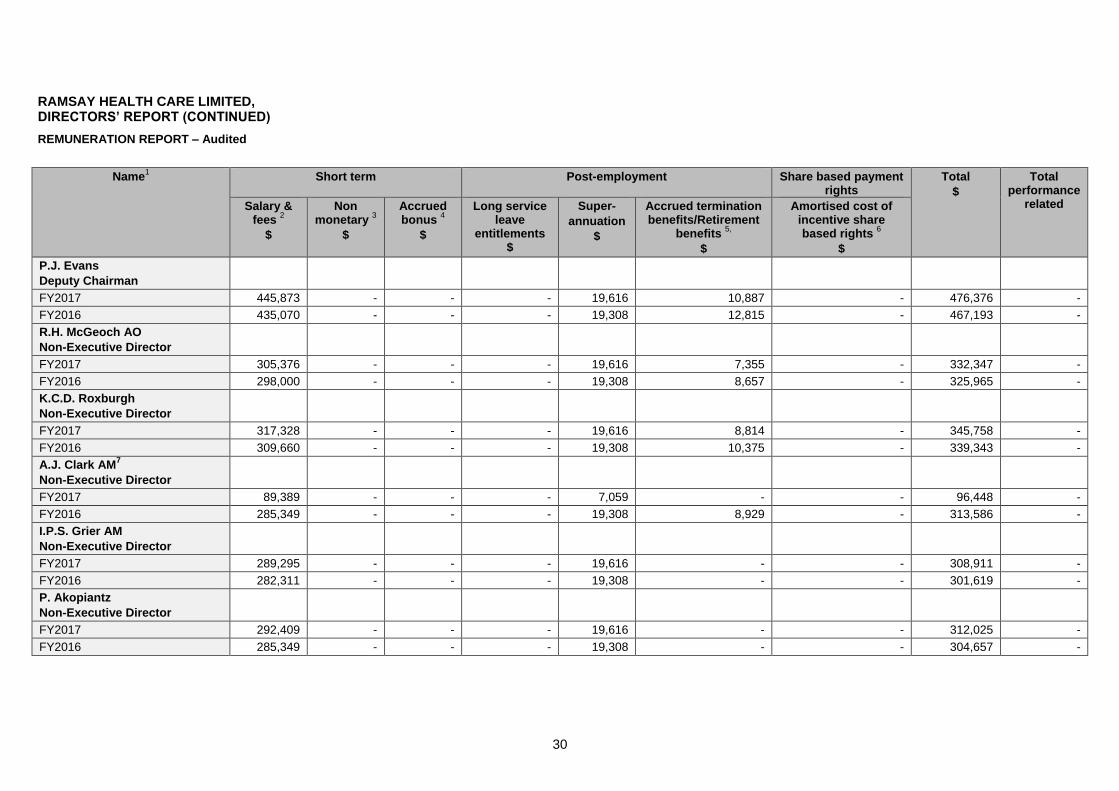
30
RAMSAY HEALTH CARE LIMITED, DIRECTORS’ REPORT (CONTINUED)
REMUNERATION REPORT – Audited
Name1 Short term Post-employment Share based payment
rights Total
$
Total performance
related Salary & fees
2
$
Non monetary
3
$
Accrued bonus
4
$
Long service leave
entitlements $
Super-
annuation
$
Accrued termination benefits/Retirement
benefits 5,
$
Amortised cost of incentive share based rights
6
$
P.J. Evans
Deputy Chairman
FY2017 445,873 - - - 19,616 10,887 - 476,376 -
FY2016 435,070 - - - 19,308 12,815 - 467,193 -
R.H. McGeoch AO
Non-Executive Director
FY2017 305,376 - - - 19,616 7,355 - 332,347 -
FY2016 298,000 - - - 19,308 8,657 - 325,965 -
K.C.D. Roxburgh
Non-Executive Director
FY2017 317,328 - - - 19,616 8,814 - 345,758 -
FY2016 309,660 - - - 19,308 10,375 - 339,343 -
A.J. Clark AM7
Non-Executive Director
FY2017 89,389 - - - 7,059 - - 96,448 -
FY2016 285,349 - - - 19,308 8,929 - 313,586 -
I.P.S. Grier AM
Non-Executive Director
FY2017 289,295 - - - 19,616 - - 308,911 -
FY2016 282,311 - - - 19,308 - - 301,619 -
P. Akopiantz
Non-Executive Director
FY2017 292,409 - - - 19,616 - - 312,025 -
FY2016 285,349 - - - 19,308 - - 304,657 -

31
RAMSAY HEALTH CARE LIMITED DIRECTORS’ REPORT (CONTINUED)
REMUNERATION REPORT – Audited
Name1 Short term Post-employment Share based payment
rights Total
$
Total performance
related Salary & fees
2
$
Non monetary
3
$
Accrued bonus
4
$
Long service leave
entitlements $
Super-
annuation
$
Accrued termination benefits/Retirement
benefits 5,
$
Amortised cost of incentive share based rights
6
$
M. Seale
Non-Executive Director
FY2017 289,295 - - - 19,616 - - 308,911 -
FY2016 282,311 - - - 19,308 - - 301,619 -
Total - FY2017 8,397,516 93,227 3,836,218 140,653 222,835 35,674 28,998,925 41,725,048 79%
Total - FY2016 8,354,884 113,880 3,871,430 142,725 231,696 50,920 17,765,205 30,530,740 71%
1. Each of the KMP held their named position for the whole of FY2017 (except for Mr A.J. Clark AM).
2. With respect to Non-Executive Directors, this amount includes fees received in the form of share rights under the Non-Executive Directors Share Rights Plan.
3. This figure represents non-monetary benefits such as health insurance cover and motor vehicle running costs that do not form part of the KMP’s cash salary.
4. The FY2016 and FY2017 amounts represent the Executive’s accrued STI for the year. Accrued STI bonuses payable to Mr Rex are delivered 50% in cash and the other 50% is withheld (less applicable tax) to purchase on-market ordinary shares in Ramsay at market price, except for his FY2017 award which is payable wholly in cash given his retirement.
5. With respect to Non-Executive Directors, this constitutes amounts provided for by Ramsay during the financial year in relation to the contractual retirement benefits which the Non-Executive Director will be entitled to upon retirement from office. These amounts represent the bond rate adjustment for the year as set out in section 6 above.
6. In accordance with the requirements of the Accounting Standards, the remuneration includes a proportion of the fair value of the Performance Rights awarded under the LTI programme granted or outstanding during the year. The fair value is determined as at the grant date and is progressively allocated over the vesting period. The amount included as remuneration is not related to or indicative of the benefit (if any) that Executives may ultimately realise should the equity instruments vest. The fair value of the Performance Rights at the date of their grant has been determined in accordance with AASB 2 applying the Black-Scholes and Monte Carlo Simulation models. The assumption underpinning these valuations are set out in note 16 to the financial statements.
In relation to Mr Chris Rex, who retired as Managing Director on 2 July 2017, the outstanding fair value of Mr Rex’s unvested performance rights at 30 June 2017 that are not due to vest until August 2018 and August 2019, are included in the above table notwithstanding that they may not actually vest in accordance with their terms of issue. The outstanding fair value of these unvested rights, being an amount of $8,555,795, has been expensed in FY2017.
7. Mr Clark AM retired from the Board following Ramsay’s 2016 AGM on 9 November 2016. Upon his retirement, he received $15,939 (in lieu of an annual grant of share rights under the Non-Executive Share Rights Plan, pro-rated) plus his accrued Retirement Benefit of $454,266.

32
RAMSAY HEALTH CARE LIMITED DIRECTORS’ REPORT (CONTINUED)
REMUNERATION REPORT – Audited
8. EQUITY AWARDS Equity movements The below table shows the movements (during FY2017 and up to the date of this Report) in equity settled Performance Rights granted as remuneration to Executives.
Date of grant
Number of rights granted
Vesting date1 Number of rights
vested / exercised
2
Value of rights vested / exercised
3
$
Number of rights subject to TSR
retesting4
Number of rights forfeited /
lapsed5
Value of rights forfeited / lapsed
$
C.P. Rex
Equity Settled Performance Rights
14-Nov-13
13-Nov-14
13-Nov-15
10-Nov-16
220,000
220,000
191,060
178,121
31-Aug-16
31-Aug-17
31-Aug-18
30-Aug-19
220,000
213,774
-
-
17,589,264
14,906,675
-
-
-
6,226
-
-
-
-
-
-
-
-
-
-
B.R. Soden
Equity Settled Performance Rights
14-Nov-13
13-Nov-14
13-Nov-15
10-Nov-16
95,000
95,000
82,553
76,916
31-Aug-16
31-Aug-17
31-Aug-18
30-Aug-19
95,000
92,311
-
-
7,595,364
6,436,938
-
-
-
2,689
-
-
-
-
-
-
-
-
-
-
C.R. McNally
Equity Settled Performance Rights
14-Nov-13
13-Nov-14
13-Nov-15
10-Nov-16
60,000
60,000
52,107
48,578
31-Aug-16
31-Aug-17
31-Aug-18
30-Aug-19
60,000
58,302
-
-
4,797,072
4,065,457
-
-
-
1,698
-
-
-
-
-
-
-
-
-
-
D.A. Sims
Equity Settled Performance Rights
14-Nov-13
13-Nov-14
13-Nov-15
10-Nov-16
60,000
60,000
52,107
48,578
31-Aug-16
31-Aug-17
31-Aug-18
30-Aug-19
60,000
58,302
-
-
4,797,072
4,065,457
-
-
-
1,698
-
-
-
-
-
-
-
-
-
-
1. This vesting date is an indicative date only. Vesting of Performance Rights will occur once the Board has determined the extent to which the applicable performance hurdles have been met. Vesting will only occur after the announcement of the release of Ramsay’s Full Year results for the previous financial year.

33
RAMSAY HEALTH CARE LIMITED, DIRECTORS’ REPORT (CONTINUED)
REMUNERATION REPORT – Audited
2. On vesting of each Performance Right, the holder received one fully-paid ordinary share in Ramsay, subject to disposal and other dealing restrictions, if held in the trust.
3. The amount is based on Ramsay’s 5-day VWAP on the date of vesting (as there is no exercise price payable in respect of Performance Rights or share rights). The market value of each Performance Right on vesting was $79.9512 on 31 August 2016 and $69.7310 on 31 August 2017.
4. The performance conditions applicable to the FY2015 LTI were satisfied in full, other than in respect of the TSR performance hurdle. Accordingly, approximately 5.66% of the FY2015 LTIs subject to the TSR performance condition did not vest and will be retested on 31 December 2017 and, if necessary, 30 June 2018. If the relevant threshold for vesting of these retested performance rights is not achieved, they will lapse.
5. The performance conditions applicable to the FY2014 LTI which vested on 31 August 2016 were fully satisfied, and no Performance Rights lapsed or were forfeited in respect of the FY2014 LTI. As noted above, the performance conditions applicable to the FY2015 LTI were satisfied in full, other than in respect of the TSR performance hurdle.
The below table shows the movements (during FY2017 and up to the date of this Report) in share rights granted as a part of Non-Executive Director remuneration:
Date of grant Number of rights granted
1
Vesting date2 Number of rights
vested / exercised3
Value of rights vested / exercised
4
$
Number of rights forfeited / lapsed
5
Value of rights forfeited / lapsed
$
M.S. Siddle
Share Rights 16-Dec-16 537 2-Mar-17 537 44,001 - -
P.J. Evans
Share Rights 16-Dec-16 537 2-Mar-17 537 44,001 - -
P.E. Akopiantz
Share Rights 16-Dec-16 537 2-Mar-17 537 44,001 - -
A.J. Clark AM 6
- - - - -
I. P.S Grier AM
Share Rights 16-Dec-16 537 2-Mar-17 537 44,001 - -
R.H. McGeoch AO
Share Rights 16-Dec-16 537 2-Mar-17 537 44,001 - -
K.C.D. Roxburgh
Share Rights 16-Dec-16 537 2-Mar-17 537 44,001 - -
M.L. Seale
Share Rights 16-Dec-16 537 2-Mar-17 537 44,001 - -
1. Share Rights are granted to Non-Executive Directors as a part of their fees for services to the Company. The number of shares rights granted is determined by dividing 20% of the Non-Executive Director base fee by the 5 trading day VWAP commencing on the day after the Company announced its FY2016 preliminary results ($81.9394).
2. Share Rights were fully vested at the time of granting and automatically exercised after the announcement of the release of the Company’s half yearly results.
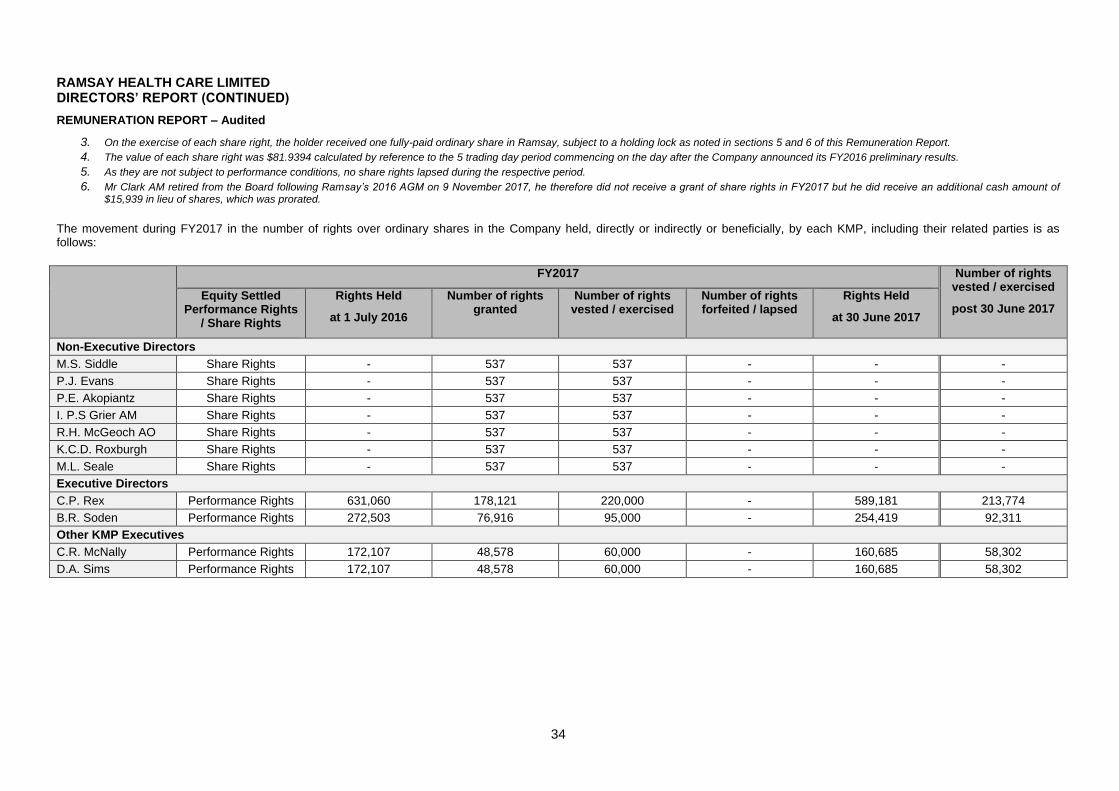
34
RAMSAY HEALTH CARE LIMITED DIRECTORS’ REPORT (CONTINUED)
REMUNERATION REPORT – Audited
3. On the exercise of each share right, the holder received one fully-paid ordinary share in Ramsay, subject to a holding lock as noted in sections 5 and 6 of this Remuneration Report.
4. The value of each share right was $81.9394 calculated by reference to the 5 trading day period commencing on the day after the Company announced its FY2016 preliminary results.
5. As they are not subject to performance conditions, no share rights lapsed during the respective period.
6. Mr Clark AM retired from the Board following Ramsay’s 2016 AGM on 9 November 2017, he therefore did not receive a grant of share rights in FY2017 but he did receive an additional cash amount of $15,939 in lieu of shares, which was prorated.
The movement during FY2017 in the number of rights over ordinary shares in the Company held, directly or indirectly or beneficially, by each KMP, including their related parties is as follows:
FY2017 Number of rights vested / exercised
post 30 June 2017 Equity Settled
Performance Rights / Share Rights
Rights Held
at 1 July 2016
Number of rights granted
Number of rights vested / exercised
Number of rights forfeited / lapsed
Rights Held
at 30 June 2017
Non-Executive Directors
M.S. Siddle Share Rights - 537 537 - - -
P.J. Evans Share Rights - 537 537 - - -
P.E. Akopiantz Share Rights - 537 537 - - -
I. P.S Grier AM Share Rights - 537 537 - - -
R.H. McGeoch AO Share Rights - 537 537 - - -
K.C.D. Roxburgh Share Rights - 537 537 - - -
M.L. Seale Share Rights - 537 537 - - -
Executive Directors
C.P. Rex Performance Rights 631,060 178,121 220,000 - 589,181 213,774
B.R. Soden Performance Rights 272,503 76,916 95,000 - 254,419 92,311
Other KMP Executives
C.R. McNally Performance Rights 172,107 48,578 60,000 - 160,685 58,302
D.A. Sims Performance Rights 172,107 48,578 60,000 - 160,685 58,302

35
RAMSAY HEALTH CARE LIMITED DIRECTORS’ REPORT (CONTINUED)
REMUNERATION REPORT – Audited
EPS targets for outstanding Current LTI awards
The Current LTI awards granted to Executives in FY2016 and FY2017 are subject to an EPS hurdle. As explained in section 6, the EPS hurdle is measured against targets set by reference to Ramsay’s EPS guidance to the market for each year of the performance period. The table below sets out the EPS targets for FY2016 and FY2017 and compares this to the actual EPS achieved in each year.
% of Performance Rights subject to the EPS hurdle to vest
% increase in EPS for FY2016 over FY2015
% increase in EPS for FY2017 over FY2016
% increase in EPS for FY2018 over FY2017
0% Less than 11% Less than 9% Less than 7%
25% 11% 9% 7%
50% 12% 10% 8%
75% 13% 11% 9%
90% 14% 12% 10%
100% 15% 13% 11%
FY2016 FY2017
Actual EPS growth achieved (% year on year increase)
17.7% 13.0%
Actual EPS growth achieved (cents per share)
231.4 261.4
Based on Ramsay’s EPS guidance for FY2018 and the performance against targets for FY2016 and FY2017:
50% of the EPS component for the FY2016 Current LTI award will vest if EPS for FY2018 is 264.2 cents per share, and
100% of the EPS component for the FY2016 Current LTI award will vest if EPS for FY2018 meets or exceeds 284.9 cents per share.
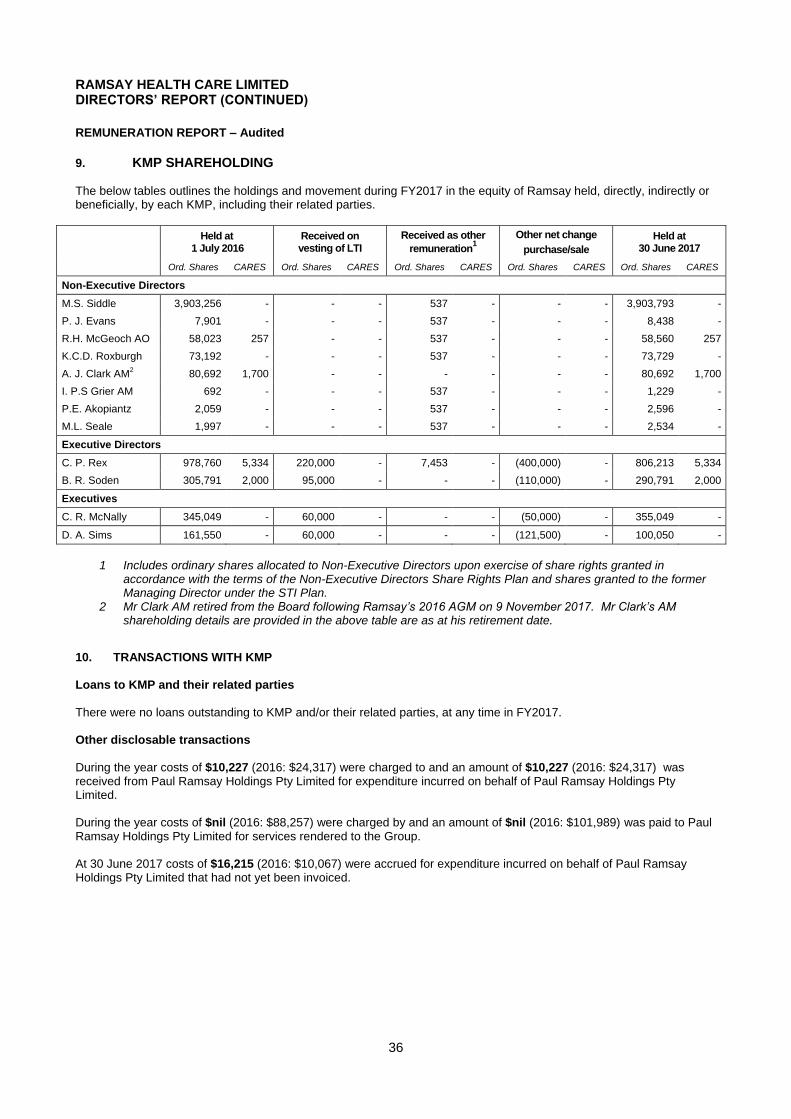
36
RAMSAY HEALTH CARE LIMITED DIRECTORS’ REPORT (CONTINUED)
REMUNERATION REPORT – Audited
9. KMP SHAREHOLDING
The below tables outlines the holdings and movement during FY2017 in the equity of Ramsay held, directly, indirectly or beneficially, by each KMP, including their related parties.
Held at
1 July 2016 Received on vesting of LTI
Received as other
remuneration1
Other net change
purchase/sale
Held at 30 June 2017
Ord. Shares CARES Ord. Shares CARES Ord. Shares CARES Ord. Shares CARES Ord. Shares CARES
Non-Executive Directors
M.S. Siddle 3,903,256 - - - 537 - - - 3,903,793 -
P. J. Evans 7,901 - - - 537 - - - 8,438 -
R.H. McGeoch AO 58,023 257 - - 537 - - - 58,560 257
K.C.D. Roxburgh 73,192 - - - 537 - - - 73,729 -
A. J. Clark AM2 80,692 1,700 - - - - - - 80,692 1,700
I. P.S Grier AM 692 - - - 537 - - - 1,229 -
P.E. Akopiantz 2,059 - - - 537 - - - 2,596 -
M.L. Seale 1,997 - - - 537 - - - 2,534 -
Executive Directors
C. P. Rex 978,760 5,334 220,000 - 7,453 - (400,000) - 806,213 5,334
B. R. Soden 305,791 2,000 95,000 - - - (110,000) - 290,791 2,000
Executives
C. R. McNally 345,049 - 60,000 - - - (50,000) - 355,049 -
D. A. Sims 161,550 - 60,000 - - - (121,500) - 100,050 -
1 Includes ordinary shares allocated to Non-Executive Directors upon exercise of share rights granted in
accordance with the terms of the Non-Executive Directors Share Rights Plan and shares granted to the former Managing Director under the STI Plan.
2 Mr Clark AM retired from the Board following Ramsay’s 2016 AGM on 9 November 2017. Mr Clark’s AM shareholding details are provided in the above table are as at his retirement date.
10. TRANSACTIONS WITH KMP Loans to KMP and their related parties There were no loans outstanding to KMP and/or their related parties, at any time in FY2017. Other disclosable transactions During the year costs of $10,227 (2016: $24,317) were charged to and an amount of $10,227 (2016: $24,317) was received from Paul Ramsay Holdings Pty Limited for expenditure incurred on behalf of Paul Ramsay Holdings Pty Limited. During the year costs of $nil (2016: $88,257) were charged by and an amount of $nil (2016: $101,989) was paid to Paul Ramsay Holdings Pty Limited for services rendered to the Group. At 30 June 2017 costs of $16,215 (2016: $10,067) were accrued for expenditure incurred on behalf of Paul Ramsay Holdings Pty Limited that had not yet been invoiced.

37
RAMSAY HEALTH CARE LIMITED DIRECTORS’ REPORT (CONTINUED)
DIRECTORS’ MEETINGS The number of meetings of Directors (including meetings of committees of Directors) held during the year and the numbers of meetings attended by each Director were as follows:
Board Meetings Committee Meetings
Scheduled Audit Risk Management
Remuneration Nomination
Number of Meetings held: 16 7 5 7 14
Number of meetings attended / (eligible to attend)
M. S. Siddle 16 (16) - - 7 (7) 14 (14)
P. J. Evans 16 (16) 7 (7) 5 (5) 7 (7) -
C. P. Rex 13 (14) - 5 (5) - -
B. R. Soden 14 (14) - 5 (5) - -
A. J. Clark AM * 4 (4) 3 (3) - - -
I. P. S. Grier AM 16 (16) - 4 (5) - -
R. H. McGeoch AO 16 (16) - - 7 (7) 13 (14)
K. C. D. Roxburgh 16 (16) 7 (7) 5 (5) - 13 (14)
P. Akopiantz 16 (16) 7 (7) - - 14 (14)
M. Seale 16 (16) - 4 (5) - -
* : Mr. Clark AM retired on 9 November 2016
COMMITTEES
As at the date of this report, the Company had the following four committees: Committee Directors who are members
Audit Committee Messrs Evans (c), Roxburgh and Ms Akopiantz Risk Management Committee Messrs Evans (c), Grier Roxburgh, Soden and Ms Seale Remuneration Committee Messrs McGeoch (c), Evans and Siddle Nomination Committee Messrs McGeoch (c), Siddle and Roxburgh
(c) : Designates the chairman of the committee AUDITORS’ INDEPENDENCE DECLARATION
The written Auditors’ Independence Declaration in relation to the audit of the financial report has been included at page 39 and forms part of this report.
INDEMNIFICATION OF AUDITOR
As part of the Company’s terms of engagement with Ernst & Young, the Company has agreed to indemnify Ernst & Young against certain liabilities to third parties arising from their engagement as auditor. The indemnity does not extend to any liability resulting from a negligent, wrongful or wilful act or omission by Ernst & Young.
ROUNDING
The amounts contained in this report and in the financial report have been rounded off to the nearest thousand unless otherwise specified under the option available to the Company under ASIC Corporations (Rounding in Financial / Directors’ Reports) Instrument 2016/191. The Company is an entity to which the Class Order applies.
38
RAMSAY HEALTH CARE LIMITED DIRECTORS’ REPORT (CONTINUED)
ENVIRONMENTAL REGULATION AND PERFORMANCE
The consolidated entity holds licences from the Environment Protection Regulatory Bodies applicable to Hospitals for the maintenance of a safe environment. The Directors are not aware of any breaches of these licences.
NON-AUDIT SERVICES
The following non-audit services were provided by the entity’s auditor, Ernst & Young. The Directors are satisfied that the provision of non-audit services is compatible with the general standard of independence for auditors imposed by the Corporations Act 2001. The nature and scope of each type of non-audit service provided means that auditor independence was not compromised.
Ernst & Young received or are due to receive the following amounts for the provision of non-audit services:
Tax services $ 606,447 Other services $ 423,082
Signed in accordance with a resolution of the Directors. M.S. SIDDLE C.R. McNALLY Chairman Managing Director Sydney, 12 September 2017

39
A member firm of Ernst & Young Global Limited
Liability limited by a scheme approved under Professional Standards Legislation
Auditor’s Independence Declaration to the Directors of Ramsay Health Care Limited As lead auditor for the audit of Ramsay Health Care Limited for the financial year ended 30 June 2017, I declare to the best of my
knowledge and belief, there have been:
a) no contraventions of the auditor independence requirements of the Corporations Act 2001 in relation to the audit; and
b) no contraventions of any applicable code of professional conduct in relation to the audit.
This declaration is in respect of Ramsay Health Care Limited and the entities it controlled during the financial year.
Ernst & Young
Doug Bain
Partner
12 September 2017
Ernst & Young
200 George Street
Sydney NSW 2000 Australia
GPO Box 2646 Sydney NSW 2001
Tel: +61 2 9248 5555
Fax: +61 2 9248 5959
ey.com/au

40
A member firm of Ernst & Young Global Limited
Liability limited by a scheme approved under Professional Standards Legislation
Independent Auditor's Report to the Members of Ramsay Health Care Limited
Report on the Audit of the Financial Report
Opinion We have audited the financial report of Ramsay Health Care Limited (the Company) and its subsidiaries (collectively the Group),
which comprises the consolidated statement of financial position as at 30 June 2017, the consolidated statement of comprehensive
income, consolidated statement of changes in equity and consolidated statement of cash flows for the year then ended, notes to the
financial statements, including a summary of significant accounting policies, and the directors' declaration.
In our opinion, the accompanying financial report of the Group is in accordance with the Corporations Act 2001, including:
a) giving a true and fair view of the consolidated financial position of the Group as at 30 June 2017 and of its consolidated
financial performance for the year ended on that date; and
b) complying with Australian Accounting Standards and the Corporations Regulations 2001.
Basis for Opinion We conducted our audit in accordance with Australian Auditing Standards. Our responsibilities under those standards are further
described in the Auditor’s Responsibilities for the Audit of the Financial Report section of our report. We are independent of the
Group in accordance with the auditor independence requirements of the Corporations Act 2001 and the ethical requirements of the
Accounting Professional and Ethical Standards Board’s APES 110 Code of Ethics for Professional Accountants (the Code) that are
relevant to our audit of the financial report in Australia. We have also fulfilled our other ethical responsibilities in accordance with the
Code.
We believe that the audit evidence we have obtained is sufficient and appropriate to provide a basis for our opinion.
Key Audit Matters Key audit matters are those matters that, in our professional judgment, were of most significance in our audit of the financial report
of the current year. These matters were addressed in the context of our audit of the financial report as a whole, and in forming our
opinion thereon, but we do not provide a separate opinion on these matters. For each matter below, our description of how our audit
addressed the matter is provided in that context.
We have fulfilled the responsibilities described in the Auditor’s Responsibilities for the Audit of the Financial Report section of our
report, including in relation to these matters. Accordingly, our audit included the performance of procedures designed to respond to
our assessment of the risks of material misstatement of the financial report. The results of our audit procedures, including the
procedures performed to address the matters below, provide the basis for our audit opinion on the accompanying financial report.
Ernst & Young
200 George Street
Sydney NSW 2000 Australia
GPO Box 2646 Sydney NSW 2001
Tel: +61 2 9248 5555
Fax: +61 2 9248 5959
ey.com/au
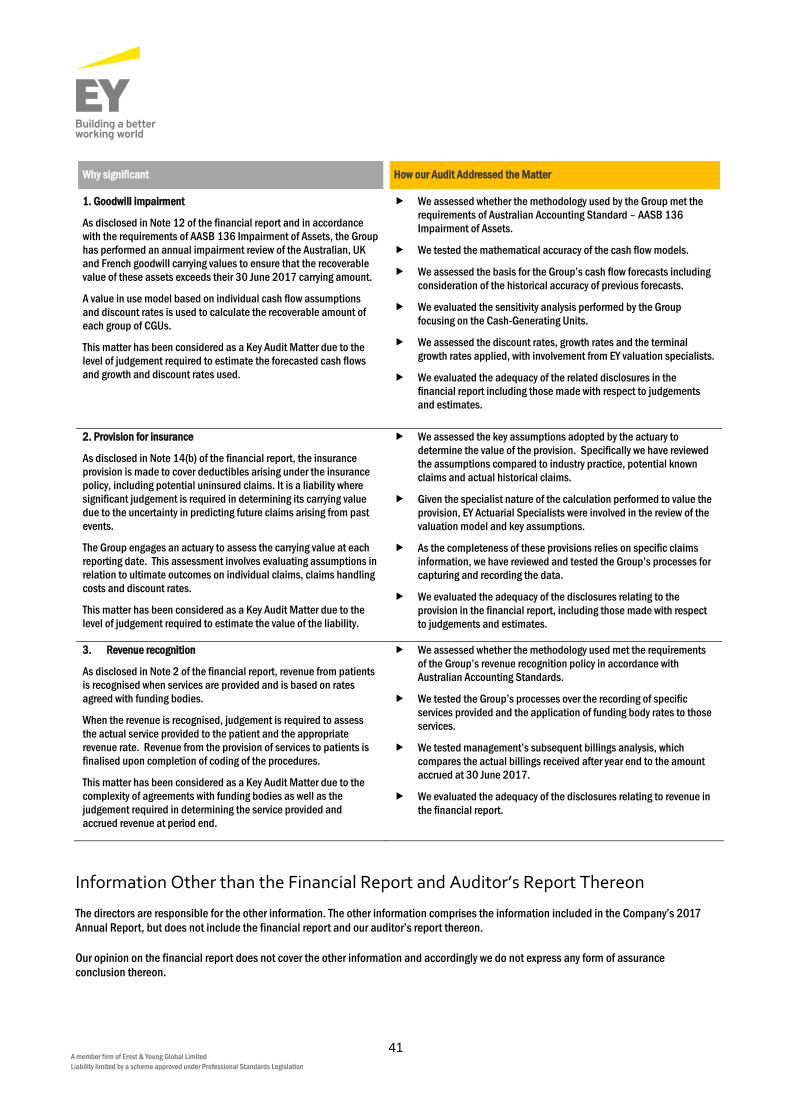
41
A member firm of Ernst & Young Global Limited
Liability limited by a scheme approved under Professional Standards Legislation
Why significant How our Audit Addressed the Matter
1. Goodwill impairment
As disclosed in Note 12 of the financial report and in accordance
with the requirements of AASB 136 Impairment of Assets, the Group
has performed an annual impairment review of the Australian, UK
and French goodwill carrying values to ensure that the recoverable
value of these assets exceeds their 30 June 2017 carrying amount.
A value in use model based on individual cash flow assumptions
and discount rates is used to calculate the recoverable amount of
each group of CGUs.
This matter has been considered as a Key Audit Matter due to the
level of judgement required to estimate the forecasted cash flows
and growth and discount rates used.
We assessed whether the methodology used by the Group met the
requirements of Australian Accounting Standard – AASB 136
Impairment of Assets.
We tested the mathematical accuracy of the cash flow models.
We assessed the basis for the Group’s cash flow forecasts including
consideration of the historical accuracy of previous forecasts.
We evaluated the sensitivity analysis performed by the Group
focusing on the Cash-Generating Units.
We assessed the discount rates, growth rates and the terminal
growth rates applied, with involvement from EY valuation specialists.
We evaluated the adequacy of the related disclosures in the
financial report including those made with respect to judgements
and estimates.
2. Provision for insurance
As disclosed in Note 14(b) of the financial report, the insurance
provision is made to cover deductibles arising under the insurance
policy, including potential uninsured claims. It is a liability where
significant judgement is required in determining its carrying value
due to the uncertainty in predicting future claims arising from past
events.
The Group engages an actuary to assess the carrying value at each
reporting date. This assessment involves evaluating assumptions in
relation to ultimate outcomes on individual claims, claims handling
costs and discount rates.
This matter has been considered as a Key Audit Matter due to the
level of judgement required to estimate the value of the liability.
We assessed the key assumptions adopted by the actuary to
determine the value of the provision. Specifically we have reviewed
the assumptions compared to industry practice, potential known
claims and actual historical claims.
Given the specialist nature of the calculation performed to value the
provision, EY Actuarial Specialists were involved in the review of the
valuation model and key assumptions.
As the completeness of these provisions relies on specific claims
information, we have reviewed and tested the Group’s processes for
capturing and recording the data.
We evaluated the adequacy of the disclosures relating to the
provision in the financial report, including those made with respect
to judgements and estimates.
3. Revenue recognition
As disclosed in Note 2 of the financial report, revenue from patients
is recognised when services are provided and is based on rates
agreed with funding bodies.
When the revenue is recognised, judgement is required to assess
the actual service provided to the patient and the appropriate
revenue rate. Revenue from the provision of services to patients is
finalised upon completion of coding of the procedures.
This matter has been considered as a Key Audit Matter due to the
complexity of agreements with funding bodies as well as the
judgement required in determining the service provided and
accrued revenue at period end.
We assessed whether the methodology used met the requirements
of the Group’s revenue recognition policy in accordance with
Australian Accounting Standards.
We tested the Group’s processes over the recording of specific
services provided and the application of funding body rates to those
services.
We tested management’s subsequent billings analysis, which
compares the actual billings received after year end to the amount
accrued at 30 June 2017.
We evaluated the adequacy of the disclosures relating to revenue in
the financial report.
Information Other than the Financial Report and Auditor’s Report Thereon The directors are responsible for the other information. The other information comprises the information included in the Company’s 2017
Annual Report, but does not include the financial report and our auditor’s report thereon.
Our opinion on the financial report does not cover the other information and accordingly we do not express any form of assurance
conclusion thereon.

42
A member firm of Ernst & Young Global Limited
Liability limited by a scheme approved under Professional Standards Legislation
In connection with our audit of the financial report, our responsibility is to read the other information and, in doing so, consider
whether the other information is materially inconsistent with the financial report or our knowledge obtained in the audit or otherwise
appears to be materially misstated.
If, based on the work we have performed, we conclude that there is a material misstatement of this other information, we are
required to report that fact. We have nothing to report in this regard.
Responsibilities of the Directors for the Financial Report The directors of the Company are responsible for the preparation of the financial report that gives a true and fair view in accordance
with Australian Accounting Standards and the Corporations Act 2001 and for such internal control as the directors determine is
necessary to enable the preparation of the financial report that gives a true and fair view and is free from material misstatement,
whether due to fraud or error.
In preparing the financial report, the directors are responsible for assessing the Group’s ability to continue as a going concern,
disclosing, as applicable, matters relating to going concern and using the going concern basis of accounting unless the directors
either intend to liquidate the Group or to cease operations, or have no realistic alternative but to do so.
Auditor's Responsibilities for the Audit of the Financial Report Our objectives are to obtain reasonable assurance about whether the financial report as a whole is free from material misstatement,
whether due to fraud or error, and to issue an auditor’s report that includes our opinion. Reasonable assurance is a high level of
assurance, but is not a guarantee that an audit conducted in accordance with the Australian Auditing Standards will always detect a
material misstatement when it exists. Misstatements can arise from fraud or error and are considered material if, individually or in
the aggregate, they could reasonably be expected to influence the economic decisions of users taken on the basis of this financial
report.
As part of an audit in accordance with the Australian Auditing Standards, we exercise professional judgment and maintain
professional scepticism throughout the audit. We also:
Identify and assess the risks of material misstatement of the financial report, whether due to fraud or error, design and
perform audit procedures responsive to those risks, and obtain audit evidence that is sufficient and appropriate to provide a
basis for our opinion. The risk of not detecting a material misstatement resulting from fraud is higher than for one resulting
from error, as fraud may involve collusion, forgery, intentional omissions, misrepresentations, or the override of internal
control.
Obtain an understanding of internal control relevant to the audit in order to design audit procedures that are appropriate in
the circumstances, but not for the purpose of expressing an opinion on the effectiveness of the Group’s internal control.
Evaluate the appropriateness of accounting policies used and the reasonableness of accounting estimates and related
disclosures made by the directors.
Conclude on the appropriateness of the directors’ use of the going concern basis of accounting and, based on the audit
evidence obtained, whether a material uncertainty exists related to events or conditions that may cast significant doubt on
the Group’s ability to continue as a going concern. If we conclude that a material uncertainty exists, we are required to draw
attention in our auditor’s report to the related disclosures in the financial report or, if such disclosures are inadequate, to
modify our opinion. Our conclusions are based on the audit evidence obtained up to the date of our auditor’s report.
However, future events or conditions may cause the Group to cease to continue as a going concern.
Evaluate the overall presentation, structure and content of the financial report, including the disclosures, and whether the
financial report represents the underlying transactions and events in a manner that achieves fair presentation.

43
A member firm of Ernst & Young Global Limited
Liability limited by a scheme approved under Professional Standards Legislation
Obtain sufficient appropriate audit evidence regarding the financial information of the entities or business activities within
the Group to express an opinion on the financial report. We are responsible for the direction, supervision and performance of
the Group audit. We remain solely responsible for our audit opinion.
We communicate with the directors regarding, among other matters, the planned scope and timing of the audit and significant audit
findings, including any significant deficiencies in internal control that we identify during our audit.
We also provide the directors with a statement that we have complied with relevant ethical requirements regarding independence,
and to communicate with them all relationships and other matters that may reasonably be thought to bear on our independence, and
where applicable, related safeguards.
From the matters communicated to the directors, we determine those matters that were of most significance in the audit of the
financial report of the current year and are therefore the key audit matters. We describe these matters in our auditor’s report unless
law or regulation precludes public disclosure about the matter or when, in extremely rare circumstances, we determine that a matter
should not be communicated in our report because the adverse consequences of doing so would reasonably be expected to outweigh
the public interest benefits of such communication.
Report on the Audit of the Remuneration Report
Opinion on the Remuneration Report
We have audited the Remuneration Report included in the directors' report for the year ended 30 June 2017.
In our opinion, the Remuneration Report of Ramsay Health Care Limited for the year ended 30 June 2017, complies with section
300A of the Corporations Act 2001.
Responsibilities
The directors of the Company are responsible for the preparation and presentation of the Remuneration Report in accordance with
section 300A of the Corporations Act 2001. Our responsibility is to express an opinion on the Remuneration Report, based on our
audit conducted in accordance with Australian Auditing Standards.
Ernst & Young
Doug Bain
Partner
Sydney
12 September 2017
RAMSAY HEALTH CARE LIMITED

44
RAMSAY HEALTH CARE LIMITED
DIRECTORS' DECLARATION In accordance with a resolution of the Directors of Ramsay Health Care Limited, we declare that: In the opinion of the Directors: (a) the financial statements and notes of Ramsay Health Care Limited are in accordance with the Corporations Act
2001, including:
(i) giving a true and fair view of its financial position as at 30 June 2017 and of its performance for the year ended on that date; and
(ii) complying with Accounting Standards (including the Australian Accounting Interpretations) and the
Corporations Regulations 2001. (b) the financial statements and notes also comply with International Financial Reporting Standards as disclosed in
the Overview note. (c) there are reasonable grounds to believe that the Company will be able to pay its debts as and when they
become due and payable. (d) this declaration has been made after receiving the declarations required to be made to the Directors in
accordance with section 295A of the Corporations Act 2001 for the financial year ended 30 June 2017. (e) as at the date of this declaration, there are reasonable grounds to believe that the members of the Closed
Group identified in Note 21 will be able to meet any obligations or liabilities to which they are or may become subject, by virtue of the Deed of Cross Guarantee.
On behalf of the Board M.S. SIDDLE C.R. McNALLY Chairman Managing Director Sydney, 12 September 2017

CONSOLIDATED INCOME STATEMENT FOR THE YEAR ENDED 30 JUNE 2017
45
Note
2017 $000
2016 $000
Revenue and other income Revenue from services 2 8,705,368 8,684,116 Interest income 1,787 7,081 Other income - income from the sale of development assets - 2,153 Other income - net profit on disposal of non-current assets 120 4,201
Total revenue and other income 8,707,275 8,697,551
Employee benefit and contractor costs 3 (4,545,594) (4,486,757) Occupancy costs 3 (661,645) (678,752) Service costs (256,511) (303,720) Medical consumables and supplies (1,998,074) (2,005,754) Depreciation, amortisation and impairment 3 (375,544) (384,074) Cost of goods sold - book value of development assets sold - (1,026)
Total expenses, excluding finance costs (7,837,368) (7,860,083) Share of profit of joint venture 14a 13,146 9,966
Profit before tax and finance costs 883,053 847,434 Finance costs 3 (133,388) (138,498)
Profit before income tax 749,665 708,936 Income tax 13 (198,669) (197,674)
Net profit for the year 550,996 511,262
Attributable to non-controlling interest 62,049 60,965 Attributable to owners of the parent 488,947 450,297
550,996 511,262
Earnings per share (cents per share) Basic earnings per share
Profit (after CARES dividend) 5 236.5 217.6
Diluted earnings per share
Profit (after CARES dividend) 5 234.9 216.1
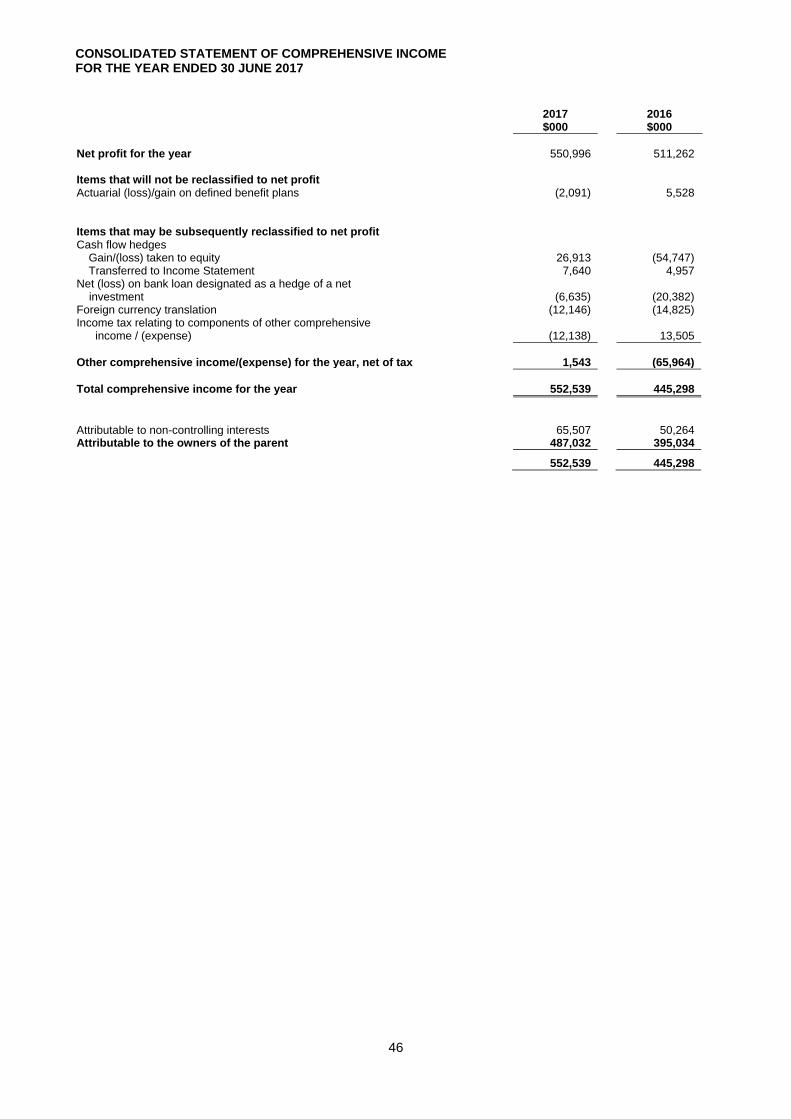
CONSOLIDATED STATEMENT OF COMPREHENSIVE INCOME FOR THE YEAR ENDED 30 JUNE 2017
46
2017 $000
2016 $000
Net profit for the year 550,996 511,262 Items that will not be reclassified to net profit Actuarial (loss)/gain on defined benefit plans (2,091) 5,528 Items that may be subsequently reclassified to net profit Cash flow hedges
Gain/(loss) taken to equity 26,913 (54,747) Transferred to Income Statement 7,640 4,957
Net (loss) on bank loan designated as a hedge of a net investment (6,635) (20,382) Foreign currency translation (12,146) (14,825) Income tax relating to components of other comprehensive income / (expense) (12,138) 13,505
Other comprehensive income/(expense) for the year, net of tax 1,543 (65,964)
Total comprehensive income for the year 552,539 445,298
Attributable to non-controlling interests 65,507 50,264 Attributable to the owners of the parent 487,032 395,034
552,539 445,298
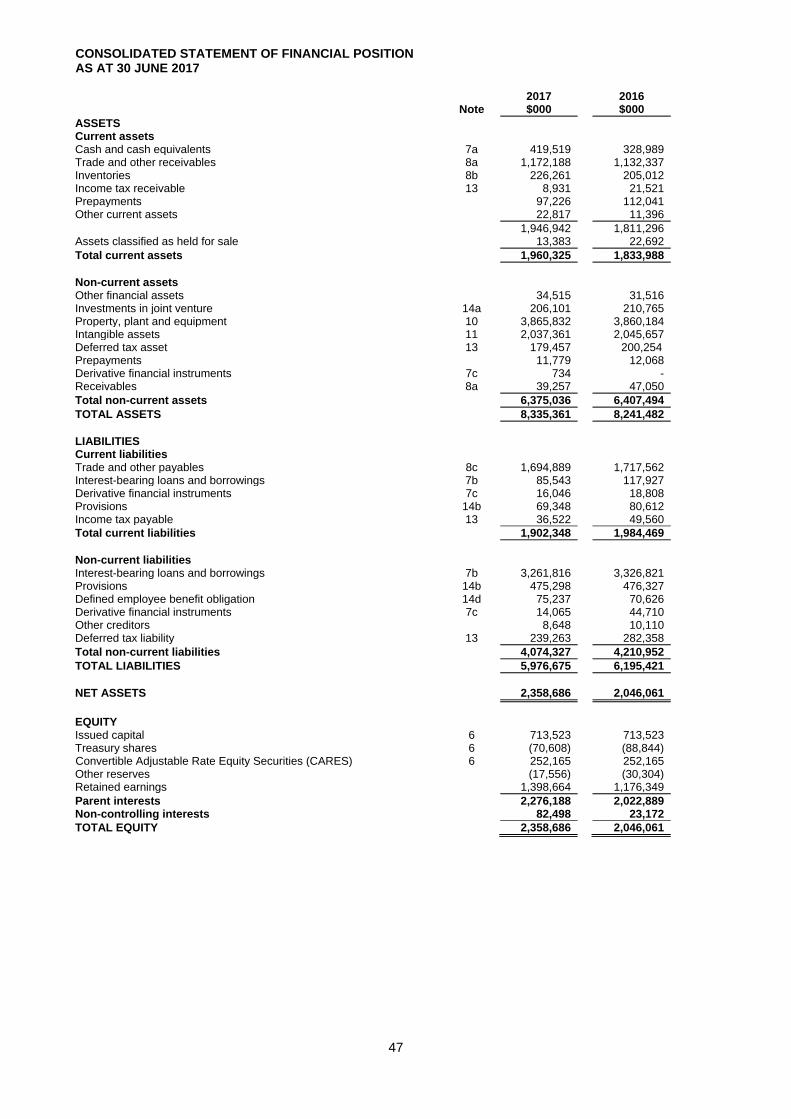
CONSOLIDATED STATEMENT OF FINANCIAL POSITION AS AT 30 JUNE 2017
47
Note
2017 $000
2016 $000
ASSETS Current assets Cash and cash equivalents 7a 419,519 328,989 Trade and other receivables 8a 1,172,188 1,132,337 Inventories 8b 226,261 205,012 Income tax receivable 13 8,931 21,521 Prepayments 97,226 112,041 Other current assets 22,817 11,396
1,946,942 1,811,296 Assets classified as held for sale 13,383 22,692
Total current assets 1,960,325 1,833,988
Non-current assets Other financial assets 34,515 31,516 Investments in joint venture 14a 206,101 210,765 Property, plant and equipment 10 3,865,832 3,860,184 Intangible assets 11 2,037,361 2,045,657 Deferred tax asset 13 179,457 200,254 Prepayments 11,779 12,068 Derivative financial instruments 7c 734 - Receivables 8a 39,257 47,050
Total non-current assets 6,375,036 6,407,494
TOTAL ASSETS 8,335,361 8,241,482
LIABILITIES Current liabilities Trade and other payables 8c 1,694,889 1,717,562 Interest-bearing loans and borrowings 7b 85,543 117,927 Derivative financial instruments 7c 16,046 18,808 Provisions 14b 69,348 80,612 Income tax payable 13 36,522 49,560
Total current liabilities 1,902,348 1,984,469
Non-current liabilities Interest-bearing loans and borrowings 7b 3,261,816 3,326,821 Provisions 14b 475,298 476,327 Defined employee benefit obligation 14d 75,237 70,626 Derivative financial instruments 7c 14,065 44,710 Other creditors 8,648 10,110 Deferred tax liability 13 239,263 282,358
Total non-current liabilities 4,074,327 4,210,952
TOTAL LIABILITIES 5,976,675 6,195,421
NET ASSETS 2,358,686 2,046,061
EQUITY Issued capital 6 713,523 713,523 Treasury shares 6 (70,608) (88,844) Convertible Adjustable Rate Equity Securities (CARES) 6 252,165 252,165 Other reserves (17,556) (30,304) Retained earnings 1,398,664 1,176,349
Parent interests 2,276,188 2,022,889 Non-controlling interests 82,498 23,172
TOTAL EQUITY 2,358,686 2,046,061

CONSOLIDATED STATEMENT OF CHANGES IN EQUITY FOR THE YEAR ENDED 30 JUNE 2017
48
Issued Capital
(Note 6.1) $000
Treasury Shares
(Note 6.2) $000
CARES
(Note 6.3) $000
Other Reserves
$000
Retained Earnings
$000
Non-controlling interests
$000
Total
$000
As at 1 July 2015 713,523 (80,190) 252,165 23,926 955,114 (26,744) 1,837,794
Total Comprehensive Income - - - (56,395) 451,429 50,264 445,298
Dividends paid - - - - (230,194) (4,503) (234,697)
Shares purchased for executive performance share plan
- (45,837) - - - - (45,837)
Treasury shares vesting to employees
- 37,183 - (37,183) - - -
Share based payment expense for employees
- - - 39,348 - - 39,348
Acquisition of subsidiary/non-controlling interest
- - - - - 4,155 4,155
As at 30 June 2016 713,523 (88,844) 252,165 (30,304) 1,176,349 23,172 2,046,061
As at 1 July 2016 713,523 (88,844) 252,165 (30,304) 1,176,349 23,172 2,046,061
Total Comprehensive Income - - - (762) 487,794 65,507 552,539
Dividends paid - - - - (265,479) (6,924) (272,403)
Shares purchased for executive performance share plan
- (27,426) - - - - (27,426)
Treasury shares vesting to employees
- 45,662 - (45,662) - - -
Share based payment expense for employees
- - - 59,172 - - 59,172
Share capital issued
- - - - - 618 618
Acquisition of subsidiary
- - - - - 125 125
As at 30 June 2017 713,523 (70,608) 252,165 (17,556) 1,398,664 82,498 2,358,686
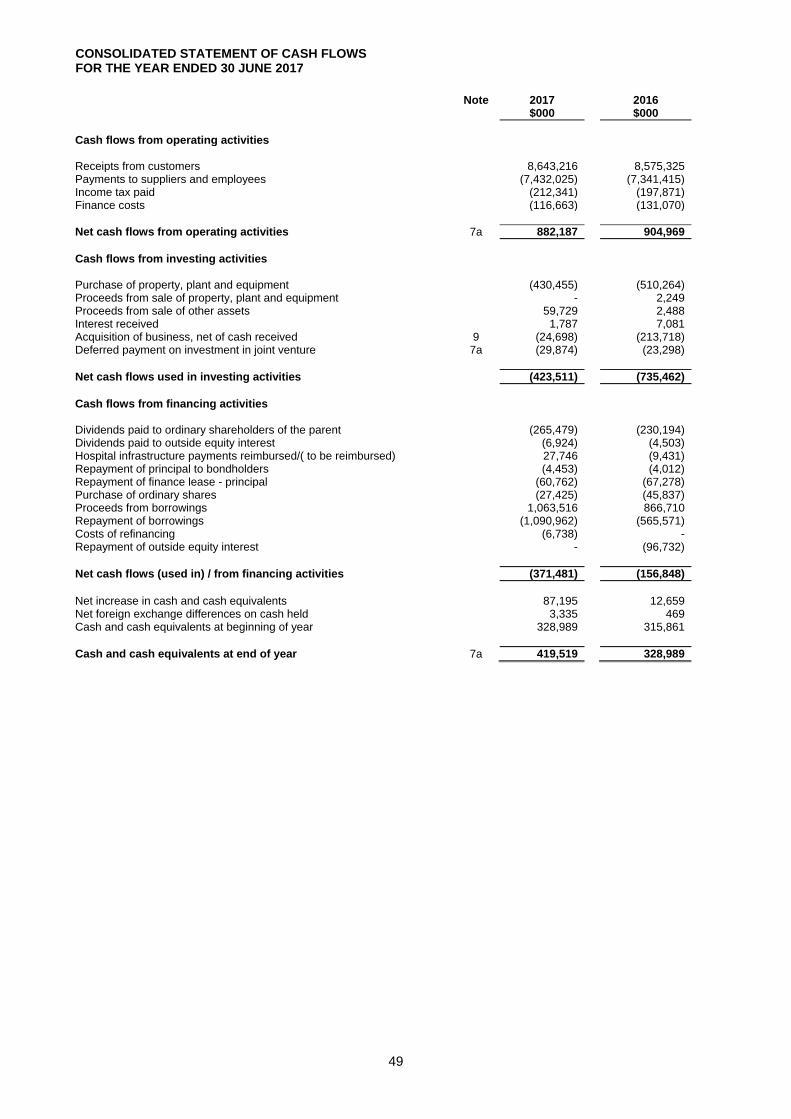
CONSOLIDATED STATEMENT OF CASH FLOWS FOR THE YEAR ENDED 30 JUNE 2017
49
Note 2017
$000 2016
$000
Cash flows from operating activities Receipts from customers 8,643,216 8,575,325 Payments to suppliers and employees (7,432,025) (7,341,415) Income tax paid (212,341) (197,871) Finance costs (116,663) (131,070)
Net cash flows from operating activities 7a 882,187 904,969
Cash flows from investing activities Purchase of property, plant and equipment (430,455) (510,264) Proceeds from sale of property, plant and equipment - 2,249 Proceeds from sale of other assets 59,729 2,488 Interest received 1,787 7,081 Acquisition of business, net of cash received 9 (24,698) (213,718) Deferred payment on investment in joint venture 7a (29,874) (23,298)
Net cash flows used in investing activities (423,511) (735,462)
Cash flows from financing activities Dividends paid to ordinary shareholders of the parent (265,479) (230,194) Dividends paid to outside equity interest (6,924) (4,503) Hospital infrastructure payments reimbursed/( to be reimbursed) 27,746 (9,431) Repayment of principal to bondholders (4,453) (4,012) Repayment of finance lease - principal (60,762) (67,278) Purchase of ordinary shares (27,425) (45,837) Proceeds from borrowings 1,063,516 866,710 Repayment of borrowings (1,090,962) (565,571) Costs of refinancing (6,738) - Repayment of outside equity interest - (96,732)
Net cash flows (used in) / from financing activities (371,481) (156,848)
Net increase in cash and cash equivalents 87,195 12,659 Net foreign exchange differences on cash held 3,335 469 Cash and cash equivalents at beginning of year 328,989 315,861
Cash and cash equivalents at end of year 7a 419,519 328,989
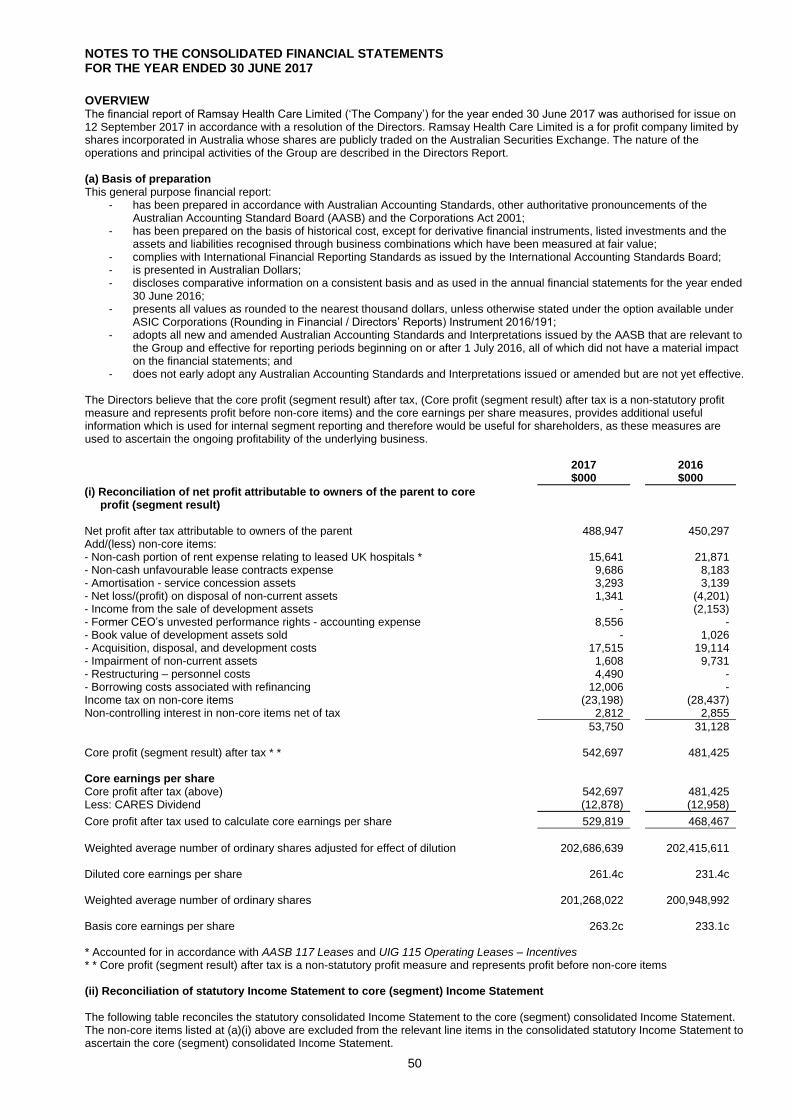
NOTES TO THE CONSOLIDATED FINANCIAL STATEMENTS FOR THE YEAR ENDED 30 JUNE 2017
50
OVERVIEW The financial report of Ramsay Health Care Limited (‘The Company’) for the year ended 30 June 2017 was authorised for issue on 12 September 2017 in accordance with a resolution of the Directors. Ramsay Health Care Limited is a for profit company limited by shares incorporated in Australia whose shares are publicly traded on the Australian Securities Exchange. The nature of the operations and principal activities of the Group are described in the Directors Report. (a) Basis of preparation This general purpose financial report:
- has been prepared in accordance with Australian Accounting Standards, other authoritative pronouncements of the Australian Accounting Standard Board (AASB) and the Corporations Act 2001;
- has been prepared on the basis of historical cost, except for derivative financial instruments, listed investments and the assets and liabilities recognised through business combinations which have been measured at fair value;
- complies with International Financial Reporting Standards as issued by the International Accounting Standards Board; - is presented in Australian Dollars; - discloses comparative information on a consistent basis and as used in the annual financial statements for the year ended
30 June 2016; - presents all values as rounded to the nearest thousand dollars, unless otherwise stated under the option available under
ASIC Corporations (Rounding in Financial / Directors’ Reports) Instrument 2016/191; - adopts all new and amended Australian Accounting Standards and Interpretations issued by the AASB that are relevant to
the Group and effective for reporting periods beginning on or after 1 July 2016, all of which did not have a material impact on the financial statements; and
- does not early adopt any Australian Accounting Standards and Interpretations issued or amended but are not yet effective. The Directors believe that the core profit (segment result) after tax, (Core profit (segment result) after tax is a non-statutory profit measure and represents profit before non-core items) and the core earnings per share measures, provides additional useful information which is used for internal segment reporting and therefore would be useful for shareholders, as these measures are used to ascertain the ongoing profitability of the underlying business. 2017
$000 2016
$000
(i) Reconciliation of net profit attributable to owners of the parent to core profit (segment result)
Net profit after tax attributable to owners of the parent 488,947 450,297 Add/(less) non-core items: - Non-cash portion of rent expense relating to leased UK hospitals * 15,641 21,871 - Non-cash unfavourable lease contracts expense 9,686 8,183 - Amortisation - service concession assets 3,293 3,139 - Net loss/(profit) on disposal of non-current assets 1,341 (4,201) - Income from the sale of development assets - (2,153) - Former CEO’s unvested performance rights - accounting expense 8,556 - - Book value of development assets sold - 1,026 - Acquisition, disposal, and development costs 17,515 19,114 - Impairment of non-current assets 1,608 9,731 - Restructuring – personnel costs 4,490 - - Borrowing costs associated with refinancing 12,006 - Income tax on non-core items (23,198) (28,437) Non-controlling interest in non-core items net of tax 2,812 2,855
53,750 31,128 Core profit (segment result) after tax * * 542,697 481,425 Core earnings per share Core profit after tax (above) 542,697 481,425 Less: CARES Dividend (12,878) (12,958)
Core profit after tax used to calculate core earnings per share 529,819 468,467
Weighted average number of ordinary shares adjusted for effect of dilution 202,686,639 202,415,611 Diluted core earnings per share 261.4c 231.4c Weighted average number of ordinary shares 201,268,022 200,948,992 Basis core earnings per share 263.2c 233.1c * Accounted for in accordance with AASB 117 Leases and UIG 115 Operating Leases – Incentives * * Core profit (segment result) after tax is a non-statutory profit measure and represents profit before non-core items (ii) Reconciliation of statutory Income Statement to core (segment) Income Statement The following table reconciles the statutory consolidated Income Statement to the core (segment) consolidated Income Statement. The non-core items listed at (a)(i) above are excluded from the relevant line items in the consolidated statutory Income Statement to ascertain the core (segment) consolidated Income Statement.

NOTES TO THE CONSOLIDATED FINANCIAL STATEMENTS FOR THE YEAR ENDED 30 JUNE 2017
51
OVERVIEW (CONTINUED)
(a) Basis of preparation (continued) (ii) Reconciliation of statutory Income Statement to core (segment) Income Statement (continued)
Statutory Consolidated Income
Statement $000
Non-core items as listed at
(a)(i) $000
Core (segment) Consolidated
Income Statement
$000
For the year ended 30 June 2017 Revenue from services 8,705,368 - 8,705,368 Interest income 1,787 - 1,787 Other income - net profit on disposal of non-current assets 120 - 120
Total revenue and other income 8,707,275 - 8,707,275 Employee benefit and contractor costs (4,545,594) 13,046 (4,532,548) Occupancy costs (661,645) 25,327 (636,318) Service costs (256,511) 18,856 (237,655) Medical consumables and supplies (1,998,074) - (1,998,074) Depreciation, amortisation and impairment (375,544) 4,901 (370,643)
Total expenses, excluding finance costs (7,837,368) 62,130 (7,775,238) Share of profit of joint venture 13,146 - 13,146
Profit before tax and finance costs 883,053 62,130 945,183 Finance costs (133,388) 12,006 (121,382)
Profit before income tax 749,665 74,136 823,801 Income tax (198,669) (23,198) (221,867)
Net profit for the year 550,996 50,938 601,934
Attributable to non-controlling interest 62,049 (2,812) 59,237 Attributable to owners of the parent 488,947 53,750 542,697
550,996 50,938 601,934
For the year ended 30 June 2016 Revenue from services 8,684,116 - 8,684,116 Interest income 7,081 - 7,081 Other income - income from the sale of development assets 2,153 (2,153) - Other income - net profit on disposal of non-current assets 4,201 (4,201) -
Total revenue and other income 8,697,551 (6,354) 8,691,197 Employee benefit and contractor costs (4,486,757) - (4,486,757) Occupancy costs (678,752) 30,054 (648,698) Service costs (303,720) 19,114 (284,606) Medical consumables and supplies (2,005,754) - (2,005,754) Depreciation, amortisation and impairment (384,074) 12,870 (371,204) Cost of goods sold - book value development assets sold (1,026) 1,026 -
Total expenses, excluding finance costs (7,860,083) 63,064 (7,797,019) Share of profit of joint venture 9,966 - 9,966
Profit before tax and finance costs 847,434 56,710 904,144 Finance costs (138,498) - (138,498)
Profit before income tax 708,936 56,710 765,646 Income tax (197,674) (28,437) (226,111)
Net profit for the year 511,262 28,273 539,535
Attributable to non-controlling interest 60,965 (2,855) 58,110 Attributable to owners of the parent 450,297 31,128 481,425
511,262 28,273 539,535

NOTES TO THE CONSOLIDATED FINANCIAL STATEMENTS FOR THE YEAR ENDED 30 JUNE 2017
52
OVERVIEW (CONTINUED) (b) New Accounting Standards and Interpretations Accounting Standards and Interpretations issued but not yet effective
Reference Title Summary Impact on Group Financial Report
AASB 9, and relevant amending standards
Financial Instruments
Application date of standard: 1 January 2018 Application date for Group: 1 July 2018
AASB 9 replaces AASB 139 Financial Instruments: Recognition and Measurement.
Except for certain trade receivables, an entity initially measures a financial asset at its fair value plus, in the case of a financial asset not at fair value through profit or loss, transaction costs.
Debt instruments are subsequently measured at fair value through profit or loss (FVTPL), amortised cost, or fair value through other comprehensive income (FVOCI), on the basis of their contractual cash flows and the business model under which the debt instruments are held.
There is a fair value option (FVO) that allows financial assets on initial recognition to be designated as FVTPL if that eliminates or significantly reduces an accounting mismatch.
Equity instruments are generally measured at FVTPL. However, entities have an irrevocable option on an instrument-by-instrument basis to present changes in the fair value of non-trading instruments in other comprehensive income (OCI) without subsequent reclassification to profit or loss.
For financial liabilities designated as FVTPL using the FVO, the amount of change in the fair value of such financial liabilities that is attributable to changes in credit risk must be presented in OCI. The remainder of the change in fair value is presented in profit or loss, unless presentation in OCI of the fair value change in respect of the liability’s credit risk would create or enlarge an accounting mismatch in profit or loss. All other AASB 139 classification and measurement requirements for financial liabilities have been carried forward into AASB 9, including the embedded derivative separation rules and the criteria for using the FVO.
The incurred credit loss model in AASB 139 has been replaced with an expected credit loss model in AASB 9. The requirements for hedge accounting have been amended to more closely align hedge accounting with risk management, establish a more principle-based approach to hedge accounting and address inconsistencies in the hedge accounting model in AASB 139.
The Group is continuing to assess the classification and measurement of certain financial assets (classified as ‘other current assets’ and ‘other financial assets’ on the Consolidated Statement of Financial Position) under AASB 9. The classification and measurement of all other financial assets and financial liabilities are not expected to change on adoption of AASB 9. The Group is also continuing to assess the impact of the new expected credit loss impairment model on its trade and other receivables, however given the historic value of receivable write-offs it is not expected to be significantly different. The new hedge accounting requirements will not have any significant impact on the results. Further information will be provided in future financial reports as management finalises its assessment.
AASB 15, and relevant amending standards
Revenue from Contracts with Customers Application date of standard: 1 January 2018 Application date for Group: 1 July 2018
AASB 15 replaces all existing revenue requirements in Australian Accounting Standards (AASB 111 Construction Contracts, AASB 118 Revenue, AASB Interpretation 13 Customer Loyalty Programmes, AASB Interpretation 15 Agreements for the Construction of Real Estate, AASB Interpretation 18 Transfers of Assets from Customers and AASB Interpretation 131 Revenue – Barter Transactions Involving Advertising Services) and applies to all revenue arising from contracts with customers, unless the contracts are in the scope of other standards, such as AASB 117 (or AASB 16 Leases, once applied).
The core principle of AASB 15 is that an entity recognises revenue to depict the transfer of promised goods or services to customers in an amount that reflects the consideration to which an entity expects to be entitled in exchange for those goods or services. An entity recognises revenue in accordance with the core principle by applying the following steps: (a) Step 1: Identify the contract(s) with a customer (b) Step 2: Identify the performance obligations in the
contract (c) Step 3: Determine the transaction price (d) Step 4: Allocate the transaction price to the performance
obligations in the contract (e) Step 5: Recognise revenue when (or as) the entity
satisfies a performance obligation
Based on management’s initial assessments, the adoption of AASB 15 is not expected to result in a material impact on the Group’s financial statements. The Group’s largest revenue stream relates to patient revenue. Performance obligations to individual patients are generally satisfied over a short term, and fees charged are on a fixed price (generally on a per day basis) depending on the type of patient service. Management considers there is insignificant uncertainty over the revenue and cash flows relating to patient revenue.
The Group is continuing to analyse the specific requirements of AASB 15 as applied to other less significant revenue arrangements.
Further information will be provided in future financial reports as management finalises its assessment.
.

NOTES TO THE CONSOLIDATED FINANCIAL STATEMENTS FOR THE YEAR ENDED 30 JUNE 2017
53
OVERVIEW (CONTINUED) (b) New Accounting Standards and Interpretations (continued)
Reference Title Summary Impact on Group Financial Report
AASB 16 Leases Application date of standard: 1 January 2019 Application date for Group: 1 July 2019
AASB 16 requires lessees to account for all leases under a single on-balance sheet model in a similar way to finance leases under AASB 117 Leases. The standard includes two recognition exemptions for lessees – leases of ’low-value’ assets (e.g., personal computers) and short-term leases (i.e., leases with a lease term of 12 months or less). At the commencement date of a lease, a lessee will recognise a liability to make lease payments (i.e., the lease liability) and an asset representing the right to use the underlying asset during the lease term (i.e., the right-of-use asset). Lessees will be required to separately recognise the interest expense on the lease liability and the depreciation expense on the right-of-use asset. Lessees will be required to remeasure the lease liability upon the occurrence of certain events (e.g., a change in the lease term, a change in future lease payments resulting from a change in an index or rate used to determine those payments). The lessee will generally recognise the amount of the remeasurement of the lease liability as an adjustment to the right-of-use asset. Lessor accounting is substantially unchanged from today’s accounting under AASB 117. Lessors will continue to classify all leases using the same classification principle as in AASB 117 and distinguish between two types of leases: operating and finance leases.
The Group is continuing to evaluate the impact of adopting AASB 16, and expects to provide further information in future financial reports as management finalises its assessment. Disclosures of the nature of the Group’s existing operating leases, as well as the aggregate of the Group’s operating lease commitments on a gross basis is provided in note 17(ii). The accounting for finance leases existing at the date of initial application, 1 July 2019, will be unchanged. Disclosures of the Group’s finance leases is provided in note 17(i). The Group is continuing to analyse the transition approaches under AASB 16, and expects to apply the modified retrospective approach. This requires the cumulative effect of initially applying AASB 16 recognised as an adjustment to equity at 1 July 2019. Comparatives are not restated. The Group is also continuing to evaluate the practical expedients and specific transition requirements. These include: relief from reassessing whether a contract contains a lease as defined in AASB 16; exemptions for low value and short-term leases; and specific options available under the modified retrospective transition approach.
AASB 2016-1 Amendments Australian Accounting Standards – Recognition of Deferred Tax Assets for Unrealised Losses Application date of standard: 1 January 2017 Application date for Group: 1 July 2017
This Standard makes amendments to AASB 112 Income Taxes to clarify the accounting for deferred tax assets for unrealised losses on debt instruments measured at fair value.
The adoption of this new amendment will not have any material impact on the financial report.
AASB 2016-2 Amendments Australian Accounting Standards – Disclosure Initiative: Amendments to AASB 107 Application date of standard: 1 January 2017 Application date for Group: 1 July 2017
The amendments to AASB 107 Statement of Cash Flows are part of the IASB’s Disclosure Initiative and help users of financial statements better understand changes in an entity’s debt. The amendments require entities to provide disclosures about changes in their liabilities arising from financing activities, including both changes arising from cash flows and non-cash changes (such as foreign exchange gains or losses).
The group is currently evaluating the impact of the new accounting standard on future disclosures in the financial report.
AASB 2016-5
Amendments to Australian Accounting Standards – Classification and Measurement of Share-based Payment Transactions Application date of standard: 1 January 2018 Application date for Group: 1 July 2018
This Standard amends AASB 2 Share-based Payment, clarifying how to account for certain types of share-based payment transactions. The amendments provide requirements on the accounting for:
► The effects of vesting and non-vesting conditions on the measurement of cash-settled share-based payments
► Share-based payment transactions with a net settlement feature for withholding tax obligations
► A modification to the terms and conditions of a sharebased payment that changes the classification of the transaction from
The adoption of the amendments will not have any material impact on the financial report.

NOTES TO THE CONSOLIDATED FINANCIAL STATEMENTS FOR THE YEAR ENDED 30 JUNE 2017
54
OVERVIEW (CONTINUED) (b) New Accounting Standards and Interpretations (continued)
Reference Title Summary Impact on Group Financial Report
IFRIC 23
(Australian-equivalent Interpretation not yet issued
Uncertainty over Income Tax Treatments Application date of standard: 1 January 2019 Application date for Group: 1 July 2019
The Interpretation clarifies the application of the recognition and measurement criteria in IAS 12 Income Taxes when there is uncertainty over income tax treatments. The Interpretation specifically addresses the following:
► Whether an entity considers uncertain tax treatments separately
► The assumptions an entity makes about the examination of tax treatments by taxation authorities
► How an entity determines taxable profit (tax loss), tax bases, unused tax losses, unused tax credits and tax rates
► How an entity considers changes in facts and circumstances.
The group is currently evaluating the impact of the new accounting standard.
(c) Basis of consolidation The consolidated financial statements comprise the financial statements of Ramsay Health Care Limited and its subsidiaries (‘the Group’) as at and for the period ended 30 June each year. Control is achieved when the Group is exposed, or has rights, to variable returns from its involvement with the investee and has the ability to affect those returns through its power over the investee. When the Group has less than a majority of the voting or similar rights of an investee, the Group considers all relevant facts and circumstances in assessing whether it has power over an investee, including:
The contractual arrangement with the other vote holders of the investee
Rights arising from other contractual arrangements
The Group’s voting rights and potential voting rights. The Group re-assesses whether or not it controls an investee if facts and circumstances indicate that there are changes to one or more of the three elements of control. Consolidation of a subsidiary begins when the Group obtains control over the subsidiary and ceases when the Group loses control of the subsidiary. Assets, liabilities, income and expenses of a subsidiary acquired or disposed of during the year are included in the Consolidated Financial Statements from the date the Group gains control until the date the Group ceases to control the subsidiary. Profit or loss and each component of Other Comprehensive Income (OCI) are attributed to the equity holders of the parent of the Group and to the non-controlling interests, even if this results in the non-controlling interests having a deficit balance. When necessary, adjustments are made to the financial statements of subsidiaries to bring their accounting policies into line with the Group’s accounting policies. All intra-group assets and liabilities, equity, income, expenses and cash flows relating to transactions between members of the Group are eliminated in full on consolidation. A change in the ownership interest of a subsidiary, without a loss of control, is accounted for as an equity transaction. If the Group loses control over a subsidiary, it derecognises the related assets (including goodwill), liabilities, non-controlling interests and other components of equity while any resultant gain or loss is recognised in profit or loss. Any investment retained is recognised at fair value.
(d) Significant accounting judgements, estimates and assumptions In applying the Group’s accounting policies, management has made a number of judgements, estimates and assumptions concerning the future. The key judgements, estimates and assumptions that are material to the financial statements relate to the following areas:
- Recognition of revenue, refer note 2; - Recognition of land and buildings at fair value in a business combination, refer note 9; - Estimation of useful lives of property, plant and equipment and intangible assets, refer note 10 and note 11; - Impairment testing of goodwill, refer note 12; - Income tax losses and deferred tax, refer note 13; - Medical malpractice provision, refer note 14b; - Defined employee benefit obligations, refer note 14d; and - Share based payment transactions, refer note 16.

NOTES TO THE CONSOLIDATED FINANCIAL STATEMENTS FOR THE YEAR ENDED 30 JUNE 2017
55
OVERVIEW (CONTINUED) (e) Current versus non-current classification The Group presents assets and liabilities in the Consolidated Statement of Financial Position based on current/non-current classification. An asset is current when it is:
Expected to be realised or intended to be sold or consumed in the normal operating cycle
Expected to be realised within twelve months after the reporting period
Held primarily for trading, or
Cash and cash equivalent unless restricted from being exchanged or used to settle a liability for at least twelve months after the reporting period.
All other assets are classified as non-current. A liability is current when:
It is expected to be settled in the normal operating cycle
It is due to be settled within twelve months after the reporting period
Held primarily for trading, or
There is no unconditional right to defer the settlement of the liability for at least twelve months after the reporting period.
The Group classifies all other liabilities as non-current. Deferred tax assets and liabilities are classified as non-current assets and liabilities. (f) Foreign currency translation Both the functional and presentation currency of Ramsay Health Care Limited and its Australian subsidiaries is Australian dollars (A$). Each entity in the Group determines its own functional currency and items included in the financial statements of each entity are measured using that functional currency. Transactions in foreign currencies are initially recorded in the functional currency by applying the exchange rates ruling at the date of the transaction. Monetary assets and liabilities denominated in foreign currencies are retranslated at the rate of exchange ruling at the reporting date. Non-monetary items that are measured in terms of historical cost in a foreign currency are translated using the exchange rate as at the date of the initial transaction. Non-monetary items measured at fair value in a foreign currency are translated using the exchange rates at the date when the fair value was determined. The functional currencies of the overseas subsidiaries are: British pounds for Ramsay Health Care (UK) Limited; and Euro for Ramsay Générale de Santé SA. As at the reporting date the assets and liabilities of the overseas subsidiaries are translated into the presentation currency of Ramsay Health Care Limited at the rate of exchange ruling at the reporting date and the Income Statements are translated at the weighted average exchange rates for the year. The exchange differences arising on the translation are taken directly to a separate component of equity.
On disposal of a foreign entity, the deferred cumulative amount recognised in equity relating to that particular foreign operation is recognised in the Income Statement. (g) Financial instruments – initial recognition and subsequent measurement (i) Financial assets Initial recognition and measurement Financial assets within the scope of AASB 139 are classified as receivables. The Group determines the classification of its financial assets at initial recognition. All financial assets are recognised initially at fair value plus, in the case of financial assets not recorded at fair value through profit or loss, transaction costs that are attributable to the acquisition of the financial asset. Subsequent measurement The subsequent measurement of financial assets depends on their classification as described below: Loans and receivables Loans and receivables are non-derivative financial assets with fixed or determinable payments that are not quoted in an active market. After initial measurements, such financial assets are subsequently measured at amortised cost using the effective interest rate (EIR), less impairment. Amortised cost is calculated by taking into account any discount or premium on acquisition and fees or costs that are an integral part of their EIR. The EIR amortisation is included in finance income in the Income Statement. The losses arising from impairment are recognised in the Income Statement in finance costs for loans and in Service Costs for receivables.

NOTES TO THE CONSOLIDATED FINANCIAL STATEMENTS FOR THE YEAR ENDED 30 JUNE 2017
56
OVERVIEW (CONTINUED) (g) Financial instruments - initial recognition and subsequent measurement (continued) Derecognition A financial asset (or, where applicable, a part of a financial asset or part of a group of similar financial assets) is derecognised when:
The rights to receive cash flows from the asset have expired.
The Group has transferred its rights to receive cash flows from the asset or has assumed an obligation to pay the received cash flows in full without material delay to a third party under a “pass-through” arrangement; and either (a) the Group has transferred substantially all the risks and rewards of the asset, or (b) the Group has neither transferred nor retained substantially all the risks and rewards of the asset, but has transferred control of the asset.
When the Group has transferred its rights to receive cash flows from an asset or has entered into a pass-through arrangement, it evaluates if and to what extent it has retained the risks and rewards of ownership. When it has neither transferred nor retained substantially all of the risks and rewards of the asset, nor transferred control of the asset, the asset is recognised to the extent of the Group’s continuing involvement in the asset. In that case, the Group also recognises an associated liability. The transferred asset and the associated liability are measured on a basis that reflects the rights and obligations that the Group has retained. Continuing involvement that takes the form of a guarantee over the transferred asset is measured at the lower of the original carrying amount of the asset and maximum amount of consideration that the Group could be required to repay. (ii) Impairment of financial assets The Group assesses, at each reporting date, whether there is objective evidence that a financial asset or a group of financial assets is impaired. A financial asset or a group of financial assets is deemed to be impaired if there is objective evidence of impairment as a result of one or more events that has occurred since the initial recognition of the asset (an incurred ‘loss event’) and that loss event has an impact on the estimated future cash flows of the financial asset or the group of financial assets that can be reliably estimated. Evidence of impairment may include indications that the debtors or a group of debtors is experiencing significant financial difficulty, default or delinquency in interest or principal payments, the probability that they will enter bankruptcy or other financial reorganisation and observable data indicating that there is a measurable decrease in the estimated future cash flows, such as changes in arrears or economic conditions that correlate with defaults. (iii) Financial liabilities Initial recognition and measurement Financial liabilities within the scope of AASB 139 are classified as financial liabilities at fair value through profit or loss, loans and borrowings, or as derivatives designated as hedging instruments in an effective hedge, as appropriate. The Group determines the classification of its financial liabilities at initial recognition. All financial liabilities are recognised initially at fair value and, in the case of loans and borrowings, net of directly attributable transaction costs. The Group’s financial liabilities include trade and other payables, loans and borrowings, and derivative financial instruments. Derecognition A financial liability is derecognised when the obligation under the liability is discharged or cancelled, or expires. When an existing financial liability is replaced by another from the same lender on substantially different terms, or the terms of an existing liability are substantially modified, such an exchange or modification is treated as the derecognition of the original liability and the recognition of a new liability. The difference in the respective carrying amounts is recognised in the Income Statement. (iv) Offsetting of financial instruments Financial assets and financial liabilities are offset and the net amount is reported in the Consolidated Statement of Financial Position if there is a currently enforceable legal right to offset the recognised amounts and there is an intention to settle on a net basis, to realise the assets and settle the liabilities simultaneously. The Group has not offset any financial assets and liabilities for the years ended 30 June 2016 and 2017.

NOTES TO THE CONSOLIDATED FINANCIAL STATEMENTS FOR THE YEAR ENDED 30 JUNE 2017
57
I. RESULTS FOR THE YEAR 1. SEGMENT INFORMATION Identification of reportable segments The Group has identified its operating segments based on the internal reports that are reviewed and used by the Managing Director and the Board of Directors (the chief operating decision makers) in assessing performance and in determining the allocation of resources. The operating segments are identified by management based on the country in which the service is provided, as this is the Group’s major risk and has the most effect on the rate of return, due to differing currencies and differing health care systems in the respective countries. The Group has three reportable operating segments being Asia Pacific, UK and France. Discrete financial information about each of these operating businesses is reported to the Managing Director and his management team on at least a monthly basis. Types of services The reportable operating segments derive their revenue primarily from providing health care services to both public and private patients in the community. Accounting policies and inter-segment transactions Transfer prices between operating segments are on an arm’s length basis in a manner similar to transactions with third parties. Segment revenue, segment expense and segment results include transfers between the segments. These transfers are eliminated on consolidation. The accounting policies used by the Group in reporting segments are the same as those contained throughout the accounts and in prior periods.
Asia Pacific
$000 UK
$000 France $000
Total $000
Year ended 30 June 2017 Revenue Revenue from services 4,721,286 755,286 3,228,796 8,705,368
Total revenue before intersegment revenue 4,721,286 755,286 3,228,796 8,705,368 Intersegment revenue 4,374 - - 4,374
Total segment revenue 4,725,660 755,286 3,228,796 8,709,742
Earnings before interest, tax, depreciation and amortisation (EBITDA)
1
812,548 113,220 388,151 1,313,919
Depreciation and amortisation (149,951) (35,011) (185,681) (370,643) Profit on disposal of non-current assets 120 - - 120
Earnings before interest and tax (EBIT) 2
662,717 78,209 202,470 943,396 Interest (119,595) Income tax expense (221,867)
Segment (core) net profit after tax 3 601,934
Attributable to non-controlling interest (59,237)
Segment (core) net profit after tax, attributable to owners of the parent
4
542,697 Non-core items net of tax (53,750)
Net profit attributable to owners of the parent
488,947
1 "EBITDA" is a non-statutory profit measure and represents profit before interest, tax, depreciation, amortisation and non-core items.
2 "EBIT" is a non-statutory profit measure and represents profit before interest, tax and non-core items.
3 "Segment (core) net profit after tax" is a non-statutory profit measure and represents profit before non-core items.
4 "Segment (core) net profit after tax attributable to owners of the parents" is a non-statutory profit measure and represents profit before
non-core items that are attributable to the owners of the parent

NOTES TO THE CONSOLIDATED FINANCIAL STATEMENTS FOR THE YEAR ENDED 30 JUNE 2017
58
I. RESULTS FOR THE YEAR (CONTINUED)
1. SEGMENT INFORMATION (CONTINUED)
2017 $000
2016
$000
(i) Segment revenue reconciliation to Income Statement
Total segment revenue 8,709,742 8,690,272 Inter segment sales elimination (4,374) (6,156) Interest income 1,787 7,081 Other income - income from the sale of development assets - 2,153 Other income - profit on disposal of non-current assets 120 4,201
Total revenue and other income 8,707,275 8,697,551
(ii) Segment net profit after tax reconciliation to Income Statement The executive management committee meets on a monthly basis to assess the performance of each segment by analysing the segment’s Earnings before interest and tax (EBIT). A segment’s core net profit after tax excludes income and expenses from non-core items. Refer to the Overview note for the reconciliation of net profit attributable to owners of the parent to core profit (segment result) after tax.
Asia Pacific
$000 UK
$000 France $000
Total $000
Year ended 30 June 2016 Revenue Revenue from services 4,413,623 873,839 3,396,654 8,684,116
Total revenue before intersegment revenue 4,413,623 873,839 3,396,654 8,684,116 Intersegment revenue 6,156 - - 6,156
Total segment revenue 4,419,779 873,839 3,396,654 8,690,272
Earnings before interest, tax, depreciation and amortisation (EBITDA)
1
719,548 130,262 419,144 1,268,954
Depreciation and amortisation (137,143) (39,399) (194,662) (371,204) (Loss) on disposal of non-current assets (687) - - (687)
Earnings before interest and tax (EBIT) 2
581,718 90,863 224,482 897,063 Interest (131,417) Income tax expense (226,111)
Segment (core) net profit after tax 3 539,535
Attributable to non-controlling interest (58,110)
Segment (core) net profit after tax, attributable to owners of the parent
4
481,425 Non-core items net of tax (31,128)
Net profit attributable to owners of the parent 450,297
1 "EBITDA" is a non-statutory profit measure and represents profit before interest, tax, depreciation, amortisation and non-core items.
2 "EBIT" is a non-statutory profit measure and represents profit before interest, tax and non-core items.
3 "Segment (core) net profit after tax" is a non-statutory profit measure and represents profit before non-core items.
4 "Segment (core) net profit after tax attributable to owners of the parents" is a non-statutory profit measure and represents profit before
non-core items that are attributable to the owners of the parent
Asia Pacific UK France Adjustments & Eliminations Total
As at 30 June 2017 $000 $000 $000 $000 $000
Assets & liabilities Segment assets 4,978,619 1,466,665 3,203,570 (1,313,493) 8,335,361
Segment liabilities (2,352,656) (715,038) (2,908,981) - (5,976,675)
As at 30 June 2016
Assets & liabilities
Segment assets 4,870,350 1,465,806 3,286,895 (1,381,569) 8,241,482
Segment liabilities (2,436,835) (723,831) (3,034,755) - (6,195,421)

NOTES TO THE CONSOLIDATED FINANCIAL STATEMENTS FOR THE YEAR ENDED 30 JUNE 2017
59
I. RESULTS FOR THE YEAR (CONTINUED) 2. REVENUE
2017 $000
2016 $000
Revenue from patients 8,582,649 8,566,598 Rental income 38,189 36,493 Income from ancillary services 84,530 81,025
Revenue from services 8,705,368 8,684,116
Revenue is recognised and measured at the fair value of the consideration received or receivable to the extent it is probable that the economic benefits will flow to the Group and the revenue can be reliably measured. The following specific recognition criteria must also be met before revenue is recognised: Revenue from patients Revenue from patients is recognised on the date on which the services were provided to the patient. Interest Revenue is recognised as interest accrues using the effective interest method. This is a method of calculating the amortised cost of a financial asset and allocating the interest income over the relevant period using the effective interest rate (EIR), which is the rate that exactly discounts estimated future cash receipts through the expected life of the financial asset to the net carrying amount of the financial asset. Rental income Rental income is accounted for on a straight-line basis over the lease term. Contingent rental income is recognised as income in the periods in which it is earned. Lease incentives granted are recognised in the Income Statement as an integral part of the total rental income. Income from ancillary services Income from ancillary services is recognised on the date the services are provided to the customer. Income from sale of development assets Income from sale of development assets is recognised when the risks and rewards of ownership are transferred.
3. EXPENSES
2017
$000 2016
$000
(a) Depreciation Depreciation - Plant and equipment 238,089 238,788 Depreciation - Buildings 114,695 112,535
Total depreciation 352,784 351,323
(b) Amortisation
Service concession assets 6,690 6,533 Development cost 14,462 16,487
Total amortisation 21,152 23,020
(c) Impairment Impairment - Plant and equipment 1,487 2,499 Impairment – Land and buildings 121 7,232
Total impairment 1,608 9,731
(d) Operating lease costs and incentive Lease costs included in occupancy costs expenses
417,023 430,488
The amount charged to the Income Statement in respect of operating lease costs for the Group under IFRS has an adverse impact on reported profit relating to the treatment of deferred rent from leases with annual fixed increments in rent. The accounting for this is as follows: Reduction in operating profit resulting from accounting in accordance with AASB 117 Leases and UIG 115 Operating Leases – Incentives
(15,641) (21,871)
Ramsay Health Care (UK) Limited has entered into 30 year term lease agreements for the rent of hospital properties. The lease agreements have fixed annual increases of 2.75% per annum. Where leases have fixed annual increases and not variable annual increases, AASB 117 requires that straight line accounting be applied. The cash rent paid for the year ended 30 June 2017 was lower than the rent expensed by $15,641,000 (2016: $21,871,000). The ongoing effect of the difference between cash rent paid and rent expense will be separately identified at each period.

NOTES TO THE CONSOLIDATED FINANCIAL STATEMENTS FOR THE YEAR ENDED 30 JUNE 2017
60
I. RESULTS FOR THE YEAR (CONTINUED) 3. EXPENSES (CONTINUED)
2017
$000 2016
$000
(e) Employee benefit and contractor costs
Wages and salaries 3,730,109 3,676,679 Workers’ compensation 19,392 23,168 Superannuation 169,729 155,036 Termination benefits 13,697 8,699 Social charges and contributions on wages and salaries 439,949 461,051 Other employment 122,838 125,882 Share-based payments (expenses arising from transactions accounted for
as equity-settled share-based payment transactions)
49,880
36,242
4,545,594 4,486,757
(f) Finance costs Interest expense 117,395 129,652 Finance charges – Lease liability 5,735 9,686 Borrowing costs associated with refinancing 12,006 -
135,136 139,338 Finance cost - unwinding of discount and effect of changes in discount rates
on deferred consideration
701
3,206 Finance costs capitalised (2,449) (4,046)
133,388 138,498
(g) Recognition and Measurement Finance costs include interest, amortisation of discounts or premiums related to borrowings and other costs incurred in connection with the arrangement of borrowings. Financing costs are expensed as incurred unless they relate to a qualifying asset. A qualifying asset is an asset which generally takes more than 12 months to get ready for its intended use or sale. In these circumstances, the financing costs are capitalised to the cost of the asset. Where funds are borrowed by the Group for the acquisition or construction of a qualifying asset, the amount of financing costs capitalised are those incurred in relation to that borrowing. 4. DIVIDENDS Parent
2017 $000
2016 $000
(a) Dividend on ordinary shares paid during the year: (i) Interim dividend paid
Franked dividends – ordinary (53.0 cents per share) (2016: 47.0 cents per share)
107,103 94,977
(ii) Previous year final dividend paid
Franked dividends – ordinary (72.0 cents per share) (2016: 60.5 cents per share)
145,498 122,259
252,601 217,236
(b) Dividend proposed and not recognised as a liability:
Current year final dividend proposed Franked dividends – ordinary (81.5 cents per share) (2016: 72.0 cents per share)
164,696 145,498
(c) Dividends declared and paid during the year on CARES: Current year interim and previous year final dividend paid
Franked dividends - CARES 12,878 12,958
(d) Dividends proposed and not recognised as a liability on CARES:
Final dividend proposed
Franked dividends - CARES 6,210 6,670

NOTES TO THE CONSOLIDATED FINANCIAL STATEMENTS FOR THE YEAR ENDED 30 JUNE 2017
61
I. RESULTS FOR THE YEAR (CONTINUED) 4. DIVIDENDS (CONTINUED) Parent
2017 $000
2016 $000
(e) Franking credit balance The amount of franking credits available for the subsequent financial year are:
- franking account balance as at the end of the financial year at 30% (2016: 30%)
514,698
450,524
- franking credits that will arise from the payment of income tax payable as at the end of the financial year *
15,545
14,302
530,243 464,826 The amount of franking credits available for future reporting periods: - impact on the franking account of dividends proposed or declared before
the financial report was authorised for issue but not recognised as a distribution to equity holders during the period
(73,245)
(65,215)
456,998 399,611
* As Ramsay Health Care Ltd and its 100% owned subsidiaries have formed a tax consolidated group, effective 1 July 2003, this represents the current tax payable for the Australian group. The tax rate at which paid dividends have been franked is 30% (2016: 30%). $170,906,000 (2016: $152,169,000) of the proposed dividends will be franked at the rate of 30% (2016: 30%). 5. EARNINGS PER SHARE Basic earnings per share amounts are calculated by dividing net profit for the year attributable to ordinary equity holders of the parent (after deducting the CARES dividend) by the weighted average number of ordinary shares outstanding during the year. Diluted earnings per share amounts are calculated by dividing the net profit attributable to ordinary equity holders of the parent (after deducting the CARES dividend) by the weighted average number of ordinary shares outstanding during the year plus the weighted average number of ordinary shares that would be issued on the conversion of all the dilutive potential ordinary shares into ordinary shares.
2017 $000
2016 $000
Net profit for the year attributable to the owners of the parent 488,947 450,297 Less: dividend paid on Convertible Adjustable Rate Equity Securities (CARES) (12,878) (12,958)
Profit used in calculating basic and diluted (after CARES dividend) earnings per share 476,069 437,339
2017
Number of Shares
2016
Number of Shares
Weighted average number of ordinary shares used in calculating basic earnings per share 201,268,022 200,948,992 Effect of dilution – share rights not yet vested (a) 1,418,617 1,466,619
Weighted average number of ordinary shares adjusted for the effect of dilution 202,686,639 202,415,611
(a) The share rights granted to Executives but not yet vested, have the potential to dilute basic earnings per share. There have been no other transactions involving ordinary shares or potential ordinary shares between the reporting date and the date of completion of these financial statements.
2017 Cents per
Share
2016 Cents per
Share
Earnings per share - basic (after CARES dividend) for the year 236.5 217.6 - diluted (after CARES dividend) for the year 234.9 216.1

NOTES TO THE CONSOLIDATED FINANCIAL STATEMENTS FOR THE YEAR ENDED 30 JUNE 2017
62
II. CAPITAL – FINANCING HOW THE GROUP MANAGES ITS CAPITAL – FINANCING When managing capital, management’s objective is to ensure the entity will be able to continue as a going concern as well as to maintain optimal returns to shareholders and benefits for other stakeholders. Management also aims to maintain a capital structure that ensures sufficient funds are available for capital expenditure and growth strategies whilst at the same time striving for the lowest cost of capital available to the entity. The Company may raise or retire debt, change the amount of dividends to be paid to shareholders, return capital to shareholders, issue new shares or sell assets to reduce debt in order to achieve the optimal capital structure. The Group’s capital is comprised of equity plus net debt. Net debt is calculated as interest bearing liabilities plus derivatives relating to debt, less cash assets. During 2017, dividends of $265,479,000 (2016: $230,194,000) were paid. For the year ended 30 June 2017 fully franked ordinary dividends of 134.5c (2016: 119.0c) per share were declared (Interim dividend of 53.0c, Final dividend of 81.5c). These dividends represented a payout ratio of approximately 51% of Core Earnings per Share of 261.4c. Management’s target for dividends for 2018 - 2021, subject to ongoing cash needs of the business, are increased in line with the growth in Core Earnings per Share and management intends to maintain a dividend payout ratio of approximately 50% of Core Earnings per Share, subject to future funding requirements. The group monitors its capital structure primarily by reference to its leverage ratio whereby debt levels are assessed relative to the cash operating profits (*EBITDA) of the Group that are used to service debt. This ratio is calculated as Net Debt/EBITDA and is 2.2 times for the year ended 30 June 2017 (2016: 2.5 times). The Group has committed senior debt funding until July 2018 and November 2021 (please refer to Note 7d for further information in relation to these borrowings). As such, these subsidiaries have to comply with various financial and other undertakings in particular the following customary financial undertakings:
Total Net Leverage Ratio (Net Debt/*EBITDA)
Interest Cover Ratio (*EBITDA/ Net Interest)
Minimum Shareholders Funds The wholly owned Subsidiaries of the Group (except certain dormant subsidiaries) are not and have not been in breach of any of the financial and other undertakings of the Senior Debt Facility Agreement. Note: *EBITDA is Earnings Before Interest, Tax, Depreciation and Amortisation. Details of Capital – Financing are as follows:
Note
2017 $000
2016 $000
Equity 6 2,358,686 2,046,061 Net Debt 7 2,957,217 3,179,277
5,315,903 5,225,338
6. EQUITY
Note 2017 $000
2016 $000
Share capital 6.1 713,523 713,523 Treasury shares 6.2 (70,608) (88,844) Convertible Adjustable Rate Equity Securities (CARES) 6.3 252,165 252,165 Other reserves (17,556) (30,304) Retained earnings 1,398,664 1,176,349 Non-controlling interests 82,498 23,172
2,358,686 2,046,061
2017
$000 2016
$000
6.1 Ordinary Shares
(a) Issued and paid up capital 202,081,252 ordinary shares fully paid (30 June 2016: 202,081,252 ordinary shares fully paid) 713,523 713,523

NOTES TO THE CONSOLIDATED FINANCIAL STATEMENTS FOR THE YEAR ENDED 30 JUNE 2017
63
II. CAPITAL – FINANCING (CONTINUED) 6. EQUITY (CONTINUED) 6.1 Ordinary Shares (Continued) (b) Terms and conditions of issued capital Ordinary Shares Ordinary shares have the right to receive dividends as declared and, in the event of winding up the Company, to participate in the proceeds from the sale of all surplus assets in proportion to the number of and amounts paid up on shares held. Ordinary shares entitle their holder to one vote, either in person or by proxy, at a meeting of the Company. (c) Recognition and Measurement Ordinary shares are classified as equity. Incremental costs directly attributable to the issue of new shares or options are shown in equity as a deduction, net of tax, from the proceeds. 6.2 Treasury Shares 2017
$000 2016
$000
1,109,430 ordinary shares (30 June 2016: 1,470,702)
70,608
88,844
Nature & Purpose Treasury shares are shares in the Group held by the Employee Share Plans and are deducted from equity. 6.3 Convertible Adjustable Rate Equity Securities (CARES)
2017 $000
2016 $000
(a) Issued and paid up capital 2,600,000 CARES shares fully paid (30 June 2016: 2,600,000 CARES shares fully paid) 252,165 252,165

NOTES TO THE CONSOLIDATED FINANCIAL STATEMENTS FOR THE YEAR ENDED 30 JUNE 2017
64
II. CAPITAL – FINANCING (CONTINUED) 6. EQUITY (CONTINUED) 6.3 Convertible Adjustable Rate Equity Securities (CARES) (continued) (b) Terms and conditions of CARES Issuer Ramsay Health Care Limited Security Convertible Adjustable Rate Equity Securities (CARES) which are a non-cumulative, redeemable and
convertible preference shares in Ramsay. Face Value $100 Per CARES. Dividends The holder of each CARES is entitled to a preferred, non-cumulative, floating rate dividend equal to:
Dividend Entitlement = Dividend Rate x Face Value x N 365 where: N is the number of days in the Dividend Period The payment of Dividends is at the Directors’ discretion and is subject to there being funds legally available for the payment of Dividends and the restrictions which apply in certain circumstances under the financing arrangements. If declared, the first Dividend will be payable on each CARES in arrears on 20 October 2005 and thereafter on each 20 April and 20 October until CARES are converted or exchanged.
Dividend Rate The Dividend Rate for each Dividend Period is calculated as: Dividend Rate = (Market Rate + Margin) x (1-T) where: The Market Rate is the 180 day Bank Bill Swap Rate applying on the first day of the Dividend Period expressed as a percentage per annum. The Margin for the period to 20 October 2010 was 2.85% per annum. It was determined by the Bookbuild held on 26 April 2005. T is the prevailing Australian corporate tax rate applicable on the Allotment Date. As Ramsay did not convert or exchange by 20 October 2010 the Margin was increased by a one-time step up of 2.00% (200 basis points) per annum.
Step-up One-time 2.00% (200 basis points) step-up in the Margin at 20 October 2010 Franking Ramsay expects the Dividends paid on CARES to be fully franked. If a Dividend is not fully franked, the
Dividend will be grossed up to compensate for the unfranked component. If, on a Dividend Payment Date, the Australian corporate tax differs from the Australian corporate tax rate on the Allotment Date, the Dividend will be adjusted downwards or upwards accordingly.
Conversion or exchange by Ramsay
CARES have no maturity. Ramsay may convert or exchange some or all CARES at its election for shares or $100 in cash for each CARES on 20 October 2010 and each Dividend Payment Date thereafter. Ramsay also has the right to:
convert or exchange CARES after the occurrence of a Regulatory Event; and
convert CARES on the occurrence of a Change in Control Event. Ramsay cannot elect to convert or exchange only some CARES if such conversion or exchange would result in there being less than $50 million in aggregate Face Value of CARES on issue.
Conversion Ratio The rate at which CARES will convert into Shares will be calculated by reference to the market price of Shares during 20 business days immediately preceding, but not including, the conversion date, less a conversion discount of 2.5%. An adjustment is made to the market price calculation in the case of a Change in Control Event. The Conversion Ratio for each CARES will not be greater than 400 shares.
Ranking CARES rank equally amongst themselves in all respects and are subordinated to all creditors but rank in priority to Shares.
Participation Unless CARES are converted into Shares, CARES confer no rights to subscribe for new shares in any fundraisings by Ramsay or to participate in any bonus or rights issues by Ramsay.
Voting Rights CARES do not carry a right to vote at general meeting of Ramsay except in limited circumstances.
7. NET DEBT
Note
2017 $000
2016 $000
Cash assets 7a 419,519 328,989 Interest bearing liabilities - current 7b (85,543) (117,927) Interest bearing liabilities - non-current 7b (3,261,816) (3,326,821) Derivative net assets / (liabilities) - debt related 7c (29,377) (63,518)
(2,957,217) (3,179,277)

NOTES TO THE CONSOLIDATED FINANCIAL STATEMENTS FOR THE YEAR ENDED 30 JUNE 2017
65
II. CAPITAL – FINANCING (CONTINUED) 7a. CASH AND CASH EQUIVALENTS
2017 $000
2016 $000
Cash at bank and on hand 419,519 328,989
Cash at bank earns interest at floating rates based on daily bank deposit rates. Short-term deposits are made for varying periods of between one day and three months, depending on the immediate cash requirements of the Group, and earn interest at the respective short-term deposit rates. Recognition and Measurement Cash and short-term deposits in the Statement of Financial Position comprise cash at bank and in hand and short-term deposits with an original maturity of three months or less. For the purposes of the Statement of Cash Flows, cash and cash equivalents consist of cash and cash equivalents as defined above, net of outstanding bank overdrafts and restricted cash. Reconciliation to Statement of cash flows For the purposes of the Statement of cash flows, cash and cash equivalents comprise the following at 30 June
Cash at bank and on hand 419,519 328,989
Reconciliation of net profit after tax to net cash flows from operations
Net profit after tax for the year 550,996 511,262 Adjustments for: Share of profit of joint venture (13,146) (9,966) Depreciation, amortisation and impairment 375,544 384,074 Interest received (1,787) (7,081) Share based payments expense 49,880 36,242 Net loss/(gain) on disposal of non-current assets 1,221 (4,641) Changes in assets & liabilities Deferred tax (10,135) (5,541) Receivables (62,152) (108,791) Other assets (2,214) (3,878) Creditors and accruals 32,792 127,960 Provisions (11,314) (8,832) Inventory (23,960) (11,183) Tax provisions (3,538) 5,344
Net cash from operating activities 882,187 904,969
Disclosure of financing facilities Refer to Note 7d. Joint Venture On 1 July 2013, Ramsay acquired a 50% equity ownership in a joint venture with Sime Darby Berhad (a Malaysian listed company) through the contribution of our Indonesian assets and cash payments to Sime Darby Berhad over 3 years. On 1 July 2016, $30 million (1 July 2015: $23 million) deferred payment was paid to Sime Darby Berhad. As at 30 June 2017, no deferred payment remained.

NOTES TO THE CONSOLIDATED FINANCIAL STATEMENTS FOR THE YEAR ENDED 30 JUNE 2017
66
II. CAPITAL – FINANCING (CONTINUED) 7b. INTEREST BEARING LOANS AND BORROWINGS 2017 2016 $000 $000
Current Secured liabilities: - Loans - bondholders (i) 4,897 4,361 - Lease liabilities (ii) 62,131 63,373 - Bank loan (iii) 18,515 20,133 Unsecured liabilities: - Deferred consideration (iv) - 30,060
85,543 117,927 Non-current Secured liabilities: - Loans – bondholders (i) - 4,897 - Lease liabilities (ii) 183,381 196,114 - Bank loan (iii) 1,451,579 1,461,332 Unsecured liabilities: - Bank loan (iii) 1,626,856 1,664,478
3,261,816 3,326,821
Total 3,347,359 3,444,748
(i) Loan - bondholders. This loan is carried at the principal amount less any repayments. It is secured by a fixed and floating charge over the assets of the entity issuing the bonds, principally the receivable from the Government. (ii) Lease liabilities are effectively secured by the leased asset. Further information is set out in Note 17. (iii) Further information on bank loans is set out in Note 7d. (iv) Deferred consideration. These are deferred amounts payable to Sime Darby Berhad for Ramsay’s 50% equity interest in the Ramsay Sime Darby Health joint venture. Further information is set out in Note 7a. Fair values Interest bearing loans and borrowings are evaluated by the Group based on parameters such as interest rates, specific country risk factors, individual creditworthiness of the counterparties and the other risk characteristics associated with the underlying debts. Unless disclosed below, the carrying amount of the Group’s current and non-current borrowings approximate their fair value. The fair values have been calculated by discounting the expected future cash flows at prevailing market interest rates depending on the type of borrowings. At reporting date, the market interest rates vary from 1.615% to 1.705% (2016: 1.845% to 1.96%) for Australia, 0.2524% to 0.3067% (2016: 0.512% to 0.558%) for UK and -0.373% to -0.331% (2016: -0.364% to -0.286%) for France respectively. The fair value of the interest bearing loans and borrowings was estimated using the level 2 method valuation technique in which the lowest level of input that is significant to the fair value measurement is directly or indirectly observable. Set out in the table below is a comparison by carrying amounts and fair value of the Group’s Interest bearing loans and borrowings. 2017 2016
Carrying Amount
$000
Fair Value $000
Carrying Amount
$000
Fair Value $000
Bank loans 3,096,950 3,143,184 3,145,943 3,205,134 Lease liabilities 245,512 273,225 259,487 279,998 Bondholders 4,897 4,993 9,258 9,732 Deferred consideration - - 30,060 30,060
3,347,359 3,421,402 3,444,748 3,524,924
The fair values disclosed are the Directors’ estimate of amounts that will be payable by the Group.

NOTES TO THE CONSOLIDATED FINANCIAL STATEMENTS FOR THE YEAR ENDED 30 JUNE 2017
67
II. CAPITAL – FINANCING (CONTINUED) 7b. INTEREST BEARING LOANS AND BORROWINGS (CONTINUED) Interest rate, foreign exchange & liquidity risk Details regarding interest rate, foreign exchange and liquidity risk is disclosed in Note 15. Assets pledged as security The carrying amounts of assets pledged as security for non-current interest bearing liabilities are set out in the following table:
2017 $000
2016 $000
Finance lease Leased assets 397,780 401,403 Fixed and floating charge Receivables 2,585 7,118 Shares in subsidiaries 1,515,332 823,596
Total non-current assets pledged as security 1,915,697 1,232,117
Defaults & breaches During the current and prior years, there were no defaults or breaches on any of the loans. Subsequent Measurement Loans and borrowings After initial recognition, interest bearing loans and borrowings are subsequently measured at amortised cost using the EIR method. Gains and losses are recognised in profit or loss when the liabilities are derecognised as well as through the EIR amortisation process. Amortised cost is calculated by taking into account any discount or premium on acquisition and fees or costs that are an integral part of the EIR. The EIR amortisation is included in finance costs in the Income Statement. 7c. DERIVATIVE FINANCIAL INSTRUMENTS
2017 $000
2016 $000
Non - current assets Interest rate derivative contracts – cash flow hedges 734 -
Current liabilities Interest rate derivative contracts – cash flow hedges (16,046) (18,808)
Non - current liabilities
Interest rate derivative contracts – cash flow hedges (14,065) (44,710)
(i) Instruments used by the Group Derivative financial instruments are used by the Group in the normal course of business in order to hedge exposure to fluctuations in interest and foreign exchange rates. (i) Interest rate swaps and forward foreign exchange contracts – cash flow hedges Interest bearing loans in Australian Dollar of the Group currently bear an average variable interest rate of 1.742% (2016: 1.955%). Interest bearing loans in GBP of the Group currently bear an average variable interest rate of 0.30% (2016: 0.56%). Interest bearing loans in Euro of the Group currently bear an average variable interest rate of -0.332% (2016:- 0.297%). In order to reduce the variability of the future cash flows in relation to the interest bearing loans, the Group has entered into Australian Dollar, GBP and Euro interest rate swap contracts under which it has a right to receive interest at variable rates and to pay interest at fixed rates. Swaps in place cover approximately 72% (2016: 78%) of the principal outstanding.

NOTES TO THE CONSOLIDATED FINANCIAL STATEMENTS FOR THE YEAR ENDED 30 JUNE 2017
68
II. CAPITAL – FINANCING (CONTINUED) 7c. DERIVATIVE FINANCIAL INSTRUMENTS (CONTINUED) (i) Instruments used by the Group (continued) While the Group also enters into other foreign exchange forward contracts with the intention to reduce the foreign exchange risk of expected sales and purchases, these other contracts are not designated in hedge relationships and are measured at fair value through profit or loss. (ii) Interest rate risk Information regarding interest rate risk exposure is set out in Note 15. (iii) Credit risk Credit risk arises from the potential failure of counterparties to meet their obligations at maturity of contracts. This arises on derivative financial instruments with unrealised gains. Management constantly monitor the fair value of favourable contracts outstanding with any individual counterparty. Management only deal with prime financial institutions with appropriate credit rating in order to manage its credit risk. (iv) Recognition and Measurement The Group uses derivative financial instruments such as interest rate swaps to hedge its risks associated with interest rates. Such derivative financial instruments are initially recognised at fair value on the date on which a derivative contract is entered into and are subsequently remeasured to fair value. Derivatives are carried as assets when the fair value is positive and as a liability when the fair value is negative. Any gains or losses arising from changes in the fair value of derivatives are taken directly to profit or loss, except for the effective portion of cash flow hedges, which is recognised in Other Comprehensive Income, and later classified to profit and loss when the hedge item affects profit or loss. For the purposes of hedge accounting, hedges are classified as:
fair value hedges when they hedge the exposure to changes in the fair value of a recognised asset or liability;
cash flow hedges when they hedge exposure to variability in cash flows that is attributable either to a particular risk associated with a recognised asset or liability or to a highly probable forecast transaction or the foreign currency risk in an unrecognised firm commitment; or
hedges of a net investment in a foreign operation. At the inception of a hedge relationship, the Group formally designates and documents the hedge relationship to which the Group wishes to apply hedge accounting and the risk management objective and strategy for undertaking the hedge. The documentation includes identification of the hedging instrument, the hedged item or transaction, the nature of the risk being hedged and how the entity will assess the hedging instrument’s effectiveness in offsetting the exposure to changes in the hedged item’s fair value or cash flows attributable to the hedged risk. Such hedges are expected to be highly effective in achieving offsetting changes in fair value or cash flows and are assessed on an ongoing basis to determine that they actually have been highly effective throughout the financial reporting periods for which they were designated.

NOTES TO THE CONSOLIDATED FINANCIAL STATEMENTS FOR THE YEAR ENDED 30 JUNE 2017
69
II. CAPITAL – FINANCING (CONTINUED) 7c. DERIVATIVE FINANCIAL INSTRUMENTS (CONTINUED) (iv) Recognition and Measurement (continued) Hedges that meet the strict criteria for hedge accounting are accounted for as follows: (i) Cash flow hedges The effective portion of the gain or loss on the hedging instrument is recognised directly in Other Comprehensive Income in the cash flow hedge reserve, while any ineffective portion is recognised immediately in the Income Statement as other operating expenses. The Group uses interest rate swap contracts as hedges of its exposure to fluctuations in interest rates. Amounts recognised as Other Comprehensive Income are transferred to profit or loss when the hedged transaction affects profit or loss, such as when the hedged financial income or financial expense is recognised. When the hedged item is the cost of a non-financial asset or non-financial liability, the amounts recognised as Other Comprehensive Income are transferred to the initial carrying amount of the non-financial asset or liability. If the forecast transaction or firm commitment is no longer expected to occur, the cumulative gain or loss previously recognised in equity is transferred to the Income Statement. If the hedging instrument expires or is sold, terminated or exercised without replacement or rollover, or if its designation as a hedge is revoked, any cumulative gain or loss previously recognised in Other Comprehensive Income remains in Other Comprehensive Income until the forecast transaction or firm commitment affects profit or loss. (ii) Bank loan designated as a hedge of a net investment The bank loan designated as a hedge of a net investment in a foreign operation is accounted for in a similar way to cash flow hedges. Gains or losses on the hedging instrument (Bank Loan) relating to the effective portion of the hedge are recognised directly in equity, while any gains or losses relating to the ineffective portion are recognised in profit or loss. On disposal of the foreign operation, the cumulative value of any such gains or losses recognised directly in equity is transferred to the Income Statement. Subsequent Measurement For financial instruments not traded in an active market, the fair value is determined using appropriate valuation techniques. Such techniques may include:
Using recent arm’s length market transaction
Reference to the current fair value of another instrument that is substantially the same
A discounted cash flow analysis or other valuation models (v) Fair Value of Derivative Financial Instruments The fair value of the derivative financial instruments was estimated using the level 2 method valuation technique and is summarised in the table above.
The most frequently applied valuation techniques include forward pricing and swap models, using present value calculations. The models incorporate various inputs including the credit quality of counterparties, foreign exchange spot and forward rates and interest rate curves. The changes in counterparty credit risk had no material effect on the hedge effectiveness assessment for derivatives designated in hedge relationships. Recognition and Measurement The Group measures financial instruments, such as, derivatives, at fair value at each balance sheet date. Fair value is the price that would be received to sell an asset or paid to transfer a liability in an orderly transaction between market participants at the measurement date. The fair value measurement is based on the presumption that the transaction to sell the asset or transfer the liability takes place either:
In the principal market for the asset or liability, or
In the absence of a principal market, in the most advantageous market for the asset or liability The principal or the most advantageous market must be accessible by the Group. The fair value of an asset or a liability is measured using the assumptions that market participants would use when pricing the asset or liability, assuming that market participants act in their economic best interest. A fair value measurement of a non-financial asset takes into account a market participant's ability to generate economic benefits by using the asset in its highest and best use or by selling it to another market participant that would use the asset in its highest and best use.

NOTES TO THE CONSOLIDATED FINANCIAL STATEMENTS FOR THE YEAR ENDED 30 JUNE 2017
70
II. CAPITAL – FINANCING (CONTINUED) 7c. DERIVATIVE FINANCIAL INSTRUMENTS (CONTINUED) (v) Fair Value of Derivative Financial Instruments (continued) The Group uses valuation techniques that are appropriate in the circumstances and for which sufficient data are available to measure fair value, maximising the use of relevant observable inputs and minimising the use of unobservable inputs. Information about the valuation techniques and inputs used in determining the fair value of various assets and liabilities are disclosed in the relevant notes. All assets and liabilities for which fair value is measured or disclosed in the financial statements are categorised within the fair value hierarchy, described as follows, based on the lowest level input that is significant to the fair value measurement as a whole: Level 1 Quoted (unadjusted) market prices in active markets for identical assets or liabilities
Level 2 Valuation techniques for which the lowest level input that is significant to the fair value measurement is directly or indirectly observable
Level 3 Valuation techniques for which the lowest level input that is significant to the fair value measurement is unobservable
For assets and liabilities that are recognised in the financial statements on a recurring basis, the Group determines whether transfers have occurred between Levels in the hierarchy by re-assessing categorisation (based on the lowest level input that is significant to the fair value measurement as a whole) at the end of each reporting period. There were no transfers between Level 1 and Level 2 or between Level 2 and Level 3 during the year. The notional principal amounts and period of expiry of the interest rate derivatives contracts are as follows:
2017 $000
2016 $000
0-1 years 701,600 280,758 1-2 years 248,699 753,164 2-3 years 593,615 249,142 3-5 years 1,185,317 1,832,295
2,729,231 3,115,359
The interest rate derivatives require settlement of net interest receivable or payable each 90 or 180 days. They are settled on a net basis. The swaps are measured at fair value and all gains and losses attributed to the hedged risk are taken directly to equity and re-classified to the Income Statement when the interest expense is recognised. Hedge of net investments in foreign operations Included in bank loans at 30 June 2017 is a GBP borrowing of £244,100,000 (2016: £117,000,000) which has been designated as a hedge of the net investment in the UK subsidiary. It is being used to hedge the Group’s exposure to changes in exchange rates on the value of its net investment in the UK operations. Gains or losses on the retranslation of this borrowing are transferred to equity to offset any gains or losses on translation of the net investment in the UK subsidiary. A net gain on the bank loan designated as a hedge of the net investment in a subsidiary of $18,165,000 (2016: net gain $29,477,000) was recognised in equity during the year. Included in bank loans at 30 June 2017 is a Euro borrowing of €160,700,000 (2016: €366,640,000) which has been designated as a hedge of the net investment in the French subsidiary. It is being used to hedge the Group’s exposure to changes in exchange rates on the value of its net investment in the French operations. Gains or losses on the retranslation of this borrowing are transferred to equity to offset any gains or losses on translation of the net investment in the French subsidiary. A net loss on the bank loan designated as a hedge of the net investment in a subsidiary of $12,279,000 (2016: net loss $51,797,000) was recognised in equity during the year.

NOTES TO THE CONSOLIDATED FINANCIAL STATEMENTS FOR THE YEAR ENDED 30 JUNE 2017
71
II. CAPITAL – FINANCING (CONTINUED) 7d. BORROWINGS Terms and Conditions Ramsay and its wholly owned subsidiaries
Refinancing of senior debt facilities
In November 2016, Ramsay and its wholly owned subsidiaries (except some dormant and special purpose subsidiaries) (Ramsay Funding Group) refinanced the Syndicated Facility Agreement, which was entered into in November 2011 and subsequently amended in December 2013, June 2014 and March 2015 (Previous SFA). This refinancing also involved the Ramsay Funding Group entering into a Common Terms Deed Poll (CTDP), governed under English law, which contains the covenant package, group guarantee and other common terms and conditions for all of Ramsay Funding Group’s senior debt facilities and bilateral facilities. Ramsay refinanced the A$ senior debt tranches in the Previous SFA, via a “migration”, into a new senior debt facility agreement and refinanced in full, the senior debt £ and € tranches in the Previous SFA. A description of each facility is provided at point (ii) below. Set out below is a summary of key changes to the Previous SFA terms and conditions:
(i) Key changes to terms and conditions The terms and conditions in the CTDP, senior debt facilities and bilateral facilities provide significant enhancements compared to those in the Previous SFA and bilateral facilities. Terms and conditions that were significantly improved are detailed below:
Funding flexibility for growth strategy – debt funding all or some of Ramsay’s growth strategy is permitted provided the financial and other undertakings stipulated in the CTDP continue to be fully satisfied. This provides greater flexibility, speed and optionality to debt fund all or some of Ramsay’s growth strategy, particularly acquisitions to be made through future joint ventures or franchise agreements.
“Financial accommodation” - more flexibility around monies that may be loaned to non- wholly owned subsidiaries, provided the financial and other undertakings stipulated in the CTDP continue to be fully satisfied
Tenor - tenor on the previous £ and € debt facilities was refreshed and extended to 5 years, i.e., November 2021. (Under the Previous SFA one third of these facilities matured in 3 years, i.e., July 2018 and the remainder matured in 5 years, i.e., May 2020)
Pricing - the margins on the new £ and € debt facilities are significantly lower than the margins payable under the Previous SFA. The Commitment fee rate payable is also lower than the rate that was payable under the Previous SFA
Access to offshore debt markets - the CTDP is governed under English law. This allows the Ramsay Funding Group to access the more liquid and deeper offshore debt markets, particularly the UK and European debt markets. The new £ and € debt facilities were funded by banks out of the UK, Europe, Asia and Australia
Upsizing and / or accessing additional senior debt facilities and bilateral facilities The Ramsay Funding Group is able to use the terms and conditions negotiated and documented in the CTDP, to either upsize existing senior debt and bilateral facilities or obtain new additional senior debt and bilateral facilities, provided the financial and other undertakings stipulated in the CTDP continue to be fully satisfied. Consequently the Ramsay Funding Group does not have to re-negotiate terms and conditions with the existing lenders in order to obtain additional senior debt facilities and bilateral facilities, (provided the financial and other undertakings stipulated in the CTDP continue to be fully satisfied).
(ii) Senior debt facilities
A$ 1,200,000,000 Syndicated Facility Agreement
o the 3 year A$ 400,000,000 revolving tranche under the Previous SFA ; and
o the 5 year A$ 800,000,000 revolving tranche under the Previous SFA were “migrated” into a new Ramsay A$ syndicated facility agreement.
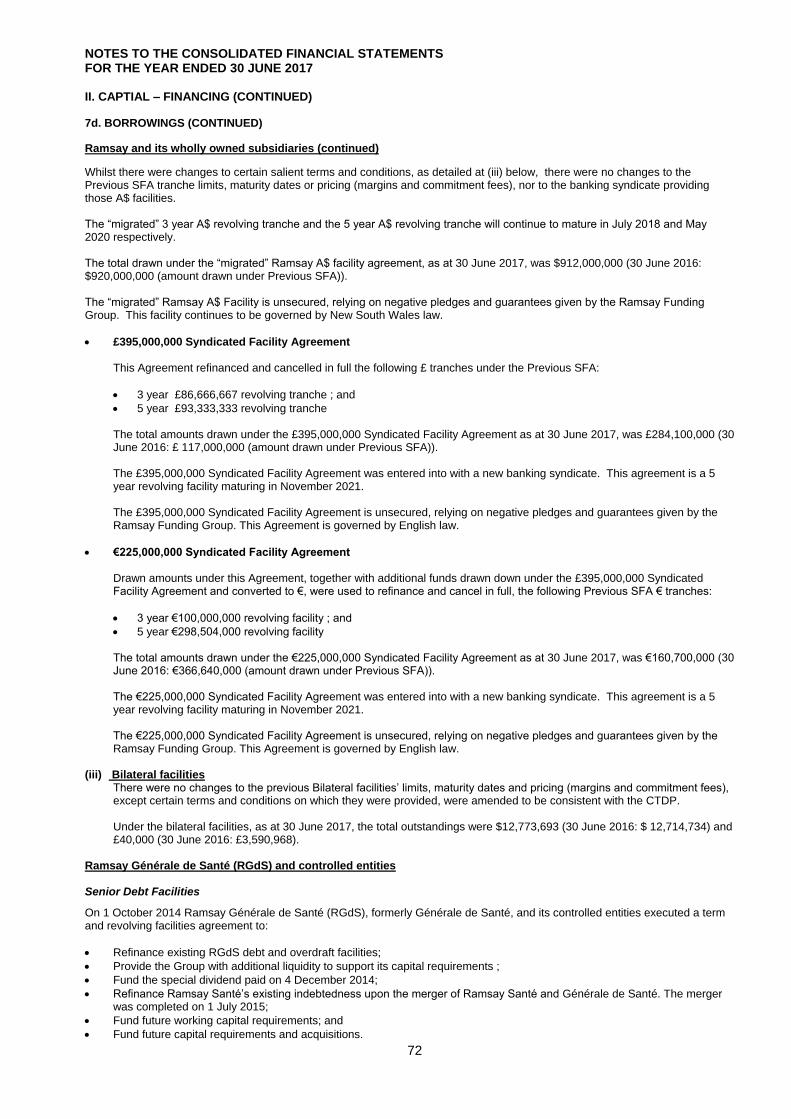
NOTES TO THE CONSOLIDATED FINANCIAL STATEMENTS FOR THE YEAR ENDED 30 JUNE 2017
72
II. CAPTIAL – FINANCING (CONTINUED) 7d. BORROWINGS (CONTINUED)
Ramsay and its wholly owned subsidiaries (continued)
Whilst there were changes to certain salient terms and conditions, as detailed at (iii) below, there were no changes to the Previous SFA tranche limits, maturity dates or pricing (margins and commitment fees), nor to the banking syndicate providing those A$ facilities.
The “migrated” 3 year A$ revolving tranche and the 5 year A$ revolving tranche will continue to mature in July 2018 and May 2020 respectively.
The total drawn under the “migrated” Ramsay A$ facility agreement, as at 30 June 2017, was $912,000,000 (30 June 2016: $920,000,000 (amount drawn under Previous SFA)).
The “migrated” Ramsay A$ Facility is unsecured, relying on negative pledges and guarantees given by the Ramsay Funding Group. This facility continues to be governed by New South Wales law.
£395,000,000 Syndicated Facility Agreement This Agreement refinanced and cancelled in full the following £ tranches under the Previous SFA:
3 year £86,666,667 revolving tranche ; and
5 year £93,333,333 revolving tranche The total amounts drawn under the £395,000,000 Syndicated Facility Agreement as at 30 June 2017, was £284,100,000 (30 June 2016: £ 117,000,000 (amount drawn under Previous SFA)). The £395,000,000 Syndicated Facility Agreement was entered into with a new banking syndicate. This agreement is a 5 year revolving facility maturing in November 2021. The £395,000,000 Syndicated Facility Agreement is unsecured, relying on negative pledges and guarantees given by the Ramsay Funding Group. This Agreement is governed by English law.
€225,000,000 Syndicated Facility Agreement
Drawn amounts under this Agreement, together with additional funds drawn down under the £395,000,000 Syndicated Facility Agreement and converted to €, were used to refinance and cancel in full, the following Previous SFA € tranches:
3 year €100,000,000 revolving facility ; and
5 year €298,504,000 revolving facility
The total amounts drawn under the €225,000,000 Syndicated Facility Agreement as at 30 June 2017, was €160,700,000 (30 June 2016: €366,640,000 (amount drawn under Previous SFA)). The €225,000,000 Syndicated Facility Agreement was entered into with a new banking syndicate. This agreement is a 5 year revolving facility maturing in November 2021. The €225,000,000 Syndicated Facility Agreement is unsecured, relying on negative pledges and guarantees given by the Ramsay Funding Group. This Agreement is governed by English law.
(iii) Bilateral facilities
There were no changes to the previous Bilateral facilities’ limits, maturity dates and pricing (margins and commitment fees), except certain terms and conditions on which they were provided, were amended to be consistent with the CTDP.
Under the bilateral facilities, as at 30 June 2017, the total outstandings were $12,773,693 (30 June 2016: $ 12,714,734) and £40,000 (30 June 2016: £3,590,968).
Ramsay Générale de Santé (RGdS) and controlled entities
Senior Debt Facilities
On 1 October 2014 Ramsay Générale de Santé (RGdS), formerly Générale de Santé, and its controlled entities executed a term and revolving facilities agreement to:
Refinance existing RGdS debt and overdraft facilities;
Provide the Group with additional liquidity to support its capital requirements ;
Fund the special dividend paid on 4 December 2014;
Refinance Ramsay Santé’s existing indebtedness upon the merger of Ramsay Santé and Générale de Santé. The merger was completed on 1 July 2015;
Fund future working capital requirements; and
Fund future capital requirements and acquisitions.

NOTES TO THE CONSOLIDATED FINANCIAL STATEMENTS FOR THE YEAR ENDED 30 JUNE 2017
73
II. CAPITAL – FINANCING (CONTINUED)
7d. BORROWINGS (CONTINUED) Senior Debt Facilities (continued) The debt facilities limits total €1,015,000,000 (2016: €1,045,000,000) comprising: (i) Term Loan B facilities totalling €840,000,000 (2016: €870,000,000 (ii) a revolving working capital facility of €100,000,000 (2016: €100,000,000); and (iii) a capex / acquisition facility of €75,000,000 (2016: €75,000,000). The total amount drawn under the debt facilities as at 30 June 2017 was €880,000,000 (2016: €910,000,000). These debt facilities have a maturity of six years and are repayable as a bullet on maturity. The lenders to these debt facilities only have recourse to RGdS and certain RGdS controlled entities. The debt facilities are secured by first ranking pledges over certain material companies, granted only by RGdS and certain RGdS controlled entities. Guarantees have also been provided and are provided only by RGdS and certain RGdS controlled entities. Subsequent to year end on 11 August 2017, RGdS successfully completed an Amend and Extend of these Senior Debt Facilities with improved terms and conditions and a 2 year extension of the maturity date to 3 October 2022. Other Interest Bearing Loans
At 30 June 2017 a loan to bondholders of $4,896,793 (2016: $9,251,181) was outstanding. This loan arose as a result of the securitisation of the Joondalup leases between Joondalup Hospital Pty Limited and Joondalup Health Campus Finance Limited. This loan is carried at the principal amount less any repayments. It is secured by a fixed and floating charge, being the receivable from the Government (refer note 8a). III. ASSETS AND LIABILITIES OPERATING AND INVESTING HOW THE GROUP MANAGES ITS OVERALL FINANCIAL POSITION The Group manages its overall financial position by segregating its balance sheet into two categories; Assets and Liabilities – Operating and Investing and Capital – Financing. Assets and Liabilities – Operating and Investing is managed at both the site and group level while Capital – Financing (refer to section II) is managed centrally. Details of Assets and Liabilities – Operating and Investing are as follows:
Note 2017 $000
2016 $000
Working Capital 8 (296,440) (380,213) Property, plant and equipment 10 3,865,832 3,860,184 Intangible assets 11 2,037,361 2,059,957 Current and deferred tax assets/(liabilities) 13 (87,397) (110,143) Other assets/(liabilities) (203,453) (204,447)
5,315,903 5,225,338
8. WORKING CAPITAL
Note 2017 $000
2016 $000
Trade and other receivables (current) 8a 1,172,188 1,132,337 Inventories 8b 226,261 205,012 Trade and other payables 8c (1,694,889) (1,717,562)
(296,440) (380,213)
8a. TRADE AND OTHER RECEIVABLES 2017
$000 2016
$000
Current Trade and other receivables 1,219,779 1,169,222 Allowances for impairment loss (47,591) (36,885)
1,172,188 1,132,337 Non-current
Receivable from the Government in respect of the availability charge for the operation of a privately operated public hospital 2,920
6,801
Rental property bonds receivable 29,922 33,032 Other 6,415 7,217
39,257 47,050
Total 1,211,445 1,179,387

NOTES TO THE CONSOLIDATED FINANCIAL STATEMENTS FOR THE YEAR ENDED 30 JUNE 2017
74
III. ASSETS AND LIABILITIES OPERATING AND INVESTING (CONTINUED) 8a. TRADE AND OTHER RECEIVABLES (CONTINUED)
(i) Allowances for impairment loss
A provision for impairment loss is recognised when there is objective evidence that an individual receivable is impaired. Movements in the provision for impairment loss were as follows: 2017
$000 2016
$000
At 1 July (36,884) (28,830) Charge for the year (20,369) (16,968) Acquisition of subsidiary - (1,260) Foreign exchange translation 727 1,282 Amounts written off 8,935 8,892
At 30 June (47,591) (36,884)
(ii) Ageing analysis At 30 June, the ageing analysis of trade receivables is as follows: Total
$000
Neither past due nor impaired
$000
0-30 Days PDNI* $000
31-60 Days PDNI* $000
61-90 Days PDNI* $000
91+ Days PDNI* $000
Considered impaired
$000
2017 1,259,036 792,287 129,185 112,606 104,647 72,720 47,591
2016 1,216,272 809,405 113,834 116,629 99,524 39,996 36,884
*PDNI – Past due not impaired Receivables past due but not considered impaired are: $419,158,000 (2016: $369,983,000). Payment terms on these amounts have not been re-negotiated as based on the credit history of receivables past due not considered impaired, management believes that these amounts will be fully recovered. This is due to the fact that the Group mainly deals with the Government and creditworthy Health Funds. (iii) Related party receivables For terms and conditions of related party receivables refer to Note 19. (iv) Fair value
Due to the short term nature of the current receivables, the carrying value approximates fair value. The carrying values of the discounted non-current receivables approximates their fair values. (v) Credit risk
The maximum exposure to credit risk for current receivables is their fair value. Collateral is not held as security. The Group’s credit risk is low in relation to trade debtors because the majority of transactions are with the Government and Health Funds. The maximum exposure to credit risk for non-current receivables at the reporting date is the higher of the carrying value and fair value of each class of these receivables. The majority of the non-current receivables are assessed as low risk.
(vi) Foreign exchange & interest rate risk
Details regarding foreign exchange and interest rate risk exposure are disclosed in Note 15.
(vii) Terms & conditions
The non-current receivables from the Government in respect of the availability charge for the operation of a privately operated public hospital will be fully repaid by June 2018.
8b. INVENTORIES
2017 $000
2016 $000
Amount of medical supplies to be consumed in providing future patient services – at cost 202,741 183,848 Development assets to be sold that are currently under construction – at cost 23,520 21,164
226,261 205,012

NOTES TO THE CONSOLIDATED FINANCIAL STATEMENTS FOR THE YEAR ENDED 30 JUNE 2017
75
III. ASSETS AND LIABILITIES OPERATING AND INVESTING (CONTINUED)
8b. INVENTORIES (CONTINUED)
(i) Inventory expense
Medical supplies recognised as an expense for the year ended 30 June 2017 totalled $1,998,074,000 (2016: $2,005,754,000) for the Group. This expense has been included in the medical consumables and supplies in the Income Statement. The cost of development assets sold which has been recognised as an expense for the year ended 30 June 2017 totalled $nil (2016: $1,026,000) for the Group. This expense has been included in Cost of goods sold – book value of development assets sold in the Income Statement.
(ii) Recognition and Measurement
Inventories are recorded using the FIFO method and are valued at the lower of cost and net realisable value. Net realisable value is the estimated selling price in the ordinary course of business, less estimated costs of completion and the estimated costs necessary to make the sale.
Inventories include medical supplies to be consumed in providing future patient services, and development assets, including medical suites to be sold, that are currently under construction.
8c. TRADE AND OTHER PAYABLES 2017
$000 2016
$000
Trade payables 743,143 787,534
Sundry creditors and accrued expenses 312,200 291,628
Employee and Director entitlements 638,888 637,265
Other payables 658 1,135
1,694,889 1,717,562
(i) Fair values Trade payables are non-interest bearing and are normally settled on 30-60 day terms. Due to the short term nature of these payables, their carrying value is assumed to approximate their fair value. (ii) Interest rate, foreign exchange & liquidity risk Details regarding interest rate, foreign exchange and liquidity risk exposure are set out in Note 15. 9. BUSINESS COMBINATIONS Other Acquisitions – 2017 Ramsay has acquired other businesses within the healthcare sector. The amounts recognised for these business combinations in the financial statements for the year ended 30 June 2017 have been determined on a provisional basis only: $000
Fair value of identifiable net assets 1,341 Non-controlling interest (125) Goodwill arising on acquisition 24,361
Acquisition date fair value of consideration transferred – cash paid 25,577
Direct costs relating to the acquisition included within service costs
1,895
The cash outflow on acquisition is as follows:
Net cash acquired with the subsidiary 879 Cash Paid (25,577)
Net consolidated cash outflow (24,698)

NOTES TO THE CONSOLIDATED FINANCIAL STATEMENTS FOR THE YEAR ENDED 30 JUNE 2017
76
III. ASSETS AND LIABILITIES OPERATING AND INVESTING (CONTINUED)
9. BUSINESS COMBINATIONS (CONTINUED) Other Acquisitions – 2016 Ramsay has acquired other businesses within the healthcare sector. The amounts recognised for these business combinations in the financial statements for the year ended 30 June 2016 are as follows:
HPM – 2016
In December 2015 and January 2016, Ramsay Générale de Santé acquired 99.69% of the share capital of Hôpital Privé Métropole (HPM). The fair values of the identifiable assets and liabilities of HPM as at the date of acquisition are as follows:
$000
Cash 12,750 Accounts Receivable 28,836 Inventory 2,481 Corporate tax receivable 2,121 Other assets 3,916 Property, plant and equipment 112,785 Intangible assets 4,402 Other financial assets 3,974 Creditors and accruals (54,387) Interest-bearing liabilities (53,828) Provisions and other liabilities (8,240) Deferred income tax liability (7,809)
Fair value of identifiable net assets 47,001 Non-controlling interest (4,114) Goodwill arising on acquisition 163,934
206,821
Acquisition date fair value of consideration transferred Cash paid 206,821
206,821
Direct costs relating to the acquisition - included within service costs 2,447 The cash outflow on acquisition is as follows: Net cash acquired with the subsidiary 12,750 Cash paid (206,821)
Net consolidated cash outflow (194,071)
The goodwill of $163,934,000 comprises the value of synergies expected to be achieved as a result of combining HPM with the rest of the Group, as well as intangible assets that do not qualify for separate recognition.
This acquisition provides a number of strategic benefits consistent with Ramsay’s growth strategy and enables the Group to reinforce its market leadership in the Lille metropolitan area in France. None of the goodwill recognised is expected to be deductible for income tax purposes. The goodwill balance represents goodwill attributable to the parent only.
The Group has elected to measure the non-controlling interests in the acquiree at their proportionate share in the recognised amounts of the acquiree’s identifiable net assets. The non-controlling interests in the acquiree at the time of the business combination represent 0.31% of the share capital of HPM and other non-controlling interests within the HPM group.
The fair value of the acquired receivables amounts to $28,836,000. The gross contractual amount receivable is $30,096,000, however only the fair value amount of $28,836,000 is expected to be collected.
The results of HPM from acquisition to 30 June 2016 were not material and therefore were not disclosed separately.
The revenue and results of the total Ramsay Group for the year ended 30 June 2016, as though HPM was acquired on 1 July 2015, would not be significantly different to the Group results as reported.
$000
Fair value of identifiable net assets 2,902 Non-controlling interest (40) Goodwill arising on acquisition 16,785
Acquisition date fair value of consideration transferred 19,647
The cash outflow on acquisition is as follows Cash paid (19,647)

NOTES TO THE CONSOLIDATED FINANCIAL STATEMENTS FOR THE YEAR ENDED 30 JUNE 2017
77
III. ASSETS AND LIABILITIES OPERATING AND INVESTING (CONTINUED) 9. BUSINESS COMBINATIONS (CONTINUED)
Recognition and Measurement Business combinations are accounted for using the acquisition method. The consideration transferred in a business combination shall be measured at fair value, which shall be calculated as the sum of the acquisition date fair values of the assets transferred by the acquirer, the liabilities incurred by the acquirer to former owners of the acquiree and the equity issued by the acquirer, and the amount of any non-controlling interest in the acquiree. For each business combination, the acquirer measures the non-controlling interest in the acquiree either at fair value or at the proportionate share of the acquiree's identifiable net assets. Acquisition-related costs are expensed as incurred. When the Group acquires a business, it assesses the financial assets and liabilities assumed for appropriate classification and designation in accordance with the contractual terms, economic conditions, the Group’s operating or accounting policies and other pertinent conditions as at the acquisition date. This includes the separation of embedded derivatives in host contracts by the acquiree. Any contingent consideration to be transferred by the acquirer will be recognised at fair value at the acquisition date. Contingent consideration classified as an asset or liability that is a financial instrument and within the scope of AASB 139 Financial Instruments: Recognition and Measurement, is measured at fair value with changes in fair value recognised either in profit or loss or as a change to Other Comprehensive Income. If the contingent consideration is not within the scope of AASB 139, it is measured in accordance with the appropriate AASB. Contingent consideration that is classified as equity is not remeasured and subsequent settlement is accounted for within equity.
Key Estimates and Assumptions The Group recognises the identifiable assets and liabilities of acquired businesses at their acquisition date fair values. Where a significant amount of land and buildings are recognised in the acquired business, the fair value will be determined by an external valuer using an approach relevant to the private healthcare market in that country.

NOTES TO THE CONSOLIDATED FINANCIAL STATEMENTS FOR THE YEAR ENDED 30 JUNE 2017
78
III. ASSETS AND LIABILITIES OPERATING AND INVESTING (CONTINUED) 10. PROPERTY, PLANT AND EQUIPMENT
Land & Buildings
$000
Plant & Equipment
$000
Assets Under Construction
$000
Total
$000
Cost
At 30 June 2015 3,130,947 1,951,141 134,259 5,216,347
Additions 34,378 165,105 318,399 517,882
Acquisition of subsidiary 80,264 31,852 623 112,739
Disposals (7,219) (109,056) - (116,275)
Assets reclassified as held for sale (22,823) - - (22,823)
Transferred from assets under construction 158,788 22,584 (181,372) -
Exchange Differences 9,732 (25,271) (7,604) (23,143)
At 30 June 2016 3,384,067 2,036,355 264,305 5,684,727
Additions 27,284 178,712 217,903 423,899
Acquisition of subsidiary - 168 - 168
Disposals (90,292) (137,211) - (227,503)
Assets reclassified from held for sale 8,986 - - 8,986
Transferred from assets under construction 83,373 80,262 (163,635) -
Exchange Differences (27,484) (3,646) (3,143) (34,273)
At 30 June 2017 3,385,934 2,154,640 315,430 5,856,004
Depreciation and Impairment
At 30 June 2015 (476,269) (1,148,272) - (1,624,541)
Depreciation charge for the year (112,535) (238,788) - (351,323)
Disposals 4,533 109,056 - 113,589
Assets reclassified as held for sale 9,104 (7,232) 10,021
- (2,499)
- - -
9,104
(9,731) 38,359
Impairment
Exchange Differences 28,338
At 30 June 2016 (572,378) (1,252,165) - (1,824,543)
Depreciation charge for the year (114,695) (238,089) - (352,784)
Disposals 38,851 135,255 - 174,106
Impairment (121) (1,487) - (1,608)
Exchange Differences 3,130 11,527 - 14,657
At 30 June 2017 (645,213) (1,344,959) - (1,990,172)
Net Book Value
At 30 June 2017 2,740,721 809,681 315,430 3,865,832
At 30 June 2016 2,811,689 784,190 264,305 3,860,184
The carrying value of property, plant and equipment held under finance leases and hire purchase contracts at 30 June 2017 is $397,781,000 (2016: $401,403,000) Leased assets and assets under hire purchase contracts are pledged as security for the related finance lease and hire purchase liabilities. (a) Recognition and Measurement Property, plant and equipment is stated at cost less accumulated depreciation and any accumulated impairment losses. Such cost includes the cost of replacing parts that are eligible for capitalisation when the cost of replacing the parts is incurred. Depreciation is calculated, consistent with the prior year, on a straight-line basis over the estimated useful life of the assets as follows:
Buildings and integral plant – 40 years – 60 years
Leasehold improvements – over lease term
Plant and equipment, other than plant integral to buildings – various periods not exceeding 10 years The assets’ residual values, useful lives and amortisation methods are reviewed, and adjusted if appropriate, at each financial year end.
NOTES TO THE CONSOLIDATED FINANCIAL STATEMENTS FOR THE YEAR ENDED 30 JUNE 2017
79
III. ASSETS AND LIABILITIES OPERATING AND INVESTING (CONTINUED) 10. PROPERTY, PLANT AND EQUIPMENT (CONTINUED) (a) Recognition and Measurement (continued) (i) Impairment The carrying values of property, plant and equipment are reviewed for impairment at each reporting date, with the recoverable amount being estimated when events or changes in circumstances indicate that the carrying value may be impaired. The recoverable amount of property, plant and equipment is the higher of fair value less costs to sell and value in use. In assessing value in use, the estimated future cash flows are discounted to their present value using a pre-tax discount rate that reflects current market assessments of the time value of money and the risks specific to the asset. For an asset that does not generate largely independent cash inflows, recoverable amount is determined for the cash-generating unit to which the asset belongs, unless the asset's value in use can be estimated to be close to its fair value. An impairment exists when the carrying value of an asset or cash-generating unit exceeds its estimated recoverable amount. The asset or cash-generating unit is then written down to its recoverable amount. Impairment losses are recognised in the Income Statement in the expense category Depreciation, amortisation and impairment. An assessment is also made at each reporting date as to whether there is any indication that previously recognised impairment losses may no longer exist or may have decreased. If such indication exists, the recoverable amount is estimated. A previously recognised impairment loss is reversed only if there has been a change in the estimates used to determine the asset’s recoverable amount since the last impairment loss was recognised. If that is the case the carrying amount of the asset is increased to its recoverable amount. That increased amount cannot exceed the carrying amount that would have been determined, net of depreciation, had no impairment loss been recognised for the asset in prior years. Such reversal is recognised in profit or loss. After such a reversal the depreciation charge is adjusted in future periods to allocate the asset’s revised carrying amount, less any residual value, on a systematic basis over its remaining useful life. (ii) Derecognition & disposal An item of property, plant and equipment is derecognised upon disposal or when no further future economic benefits are expected from its use or disposal. Any gain or loss arising on derecognition of the asset (calculated as the difference between the net disposal proceeds and the carrying amount of the asset) is included in Income Statement in the year the asset is derecognised. (b) Key Estimates and Assumptions Useful lives of assets are estimated based on historical experience. The useful life of assets are assessed annually and adjusted where deemed necessary.

NOTES TO THE CONSOLIDATED FINANCIAL STATEMENTS FOR THE YEAR ENDED 30 JUNE 2017
80
III. ASSETS AND LIABILITIES OPERATING AND INVESTING (CONTINUED) 11. INTANGIBLE ASSETS (i) Reconciliation of carrying amounts at the beginning and end of the period
Goodwill
$000
Service Concession Assets $000
Development Costs^
$000
Total
$000
Cost
At 30 June 2015 1,779,621 94,130 83,714 1,957,465
Additions - 593 26,699 27,292
Disposals - - (242) (242)
Acquisition of a subsidiary 180,719 - 5,884 186,603
Exchange differences (27,072) - (934) (28,006)
At 30 June 2016 1,933,268 94,723 115,121 2,143,112
Additions - 1,274 8,113 9,387
Disposals (4,573) - (3,277) (7,850)
Acquisition of a subsidiary 24,361 - - 24,361
Exchange differences (15,612) - (344) (15,956)
At 30 June 2017 1,937,444 95,997 119,613 2,153,054
Amortisation and Impairment
At 30 June 2015 - (28,312) (46,104) (74,416)
Amortisation charge for the year - (6,533) (16,487) (23,020)
Disposals - - 79 79
Exchange differences - - (98) (98)
At 30 June 2016 - (34,845) (62,610) (97,455)
Amortisation charge for the year - (6,690) (14,462) (21,152)
Disposals - - 3,026 3,026
Exchange differences - - (112) (112)
At 30 June 2017 - (41,535) (74,158) (115,693)
Net Book Value
At 30 June 2017 1,937,444 54,462 45,455 2,037,361
At 30 June 2016 1,933,268 59,878 52,511 2,045,657
^ Mainly internally generated software costs (ii) Goodwill – Recognition and Measurement Goodwill acquired in a business combination is initially measured at cost being the excess of the cost of the business combination over the Group’s interest in the net fair value of the acquiree’s identifiable assets, liabilities and contingent liabilities. The key factor contributing to the goodwill relates to the synergies existing within the acquired businesses and also expected to be achieved as a result of combining these facilities with the rest of the Group. Following initial recognition, goodwill is measured at cost less any accumulated impairment losses. Goodwill is determined to have an indefinite life. Goodwill is reviewed for impairment, annually or more frequently if events or changes in circumstances indicate that the carrying value may be impaired. For the purpose of impairment testing, goodwill acquired in a business combination is, from the acquisition date, allocated to each of the Group’s cash-generating units, or groups of cash-generating units, that are expected to benefit from the synergies of the combination, irrespective of whether other assets or liabilities of the Group are assigned to those units or groups of units. Each unit or group of units to which the goodwill is so allocated such that:
It represents the lowest level within the Group at which the goodwill is monitored for internal management purposes; and
Is not larger than an operating segment determined in accordance with AASB 8 Operating Segments.

NOTES TO THE CONSOLIDATED FINANCIAL STATEMENTS FOR THE YEAR ENDED 30 JUNE 2017
81
III. ASSETS AND LIABILITIES OPERATING AND INVESTING (CONTINUED) 11. INTANGIBLE ASSETS (CONTINUED) (ii) Goodwill – Recognition and Measurement (continued) Impairment is determined by assessing the recoverable amount of the cash-generating unit (group of cash-generating units), to which the goodwill relates. When the recoverable amount of the cash-generating unit (group of cash-generating units) is less than the carrying amount, an impairment loss is recognised. When goodwill forms part of a cash-generating unit (group of cash-generating units) and an operation within that unit is disposed of, the goodwill associated with the operation disposed of is included in the carrying amount of the operation when determining the gain or loss on disposal of the operation. Goodwill disposed of in this manner is measured based on the relative values of the operation disposed of and the portion of the cash-generating unit retained. Impairment losses recognised for goodwill are not subsequently reversed. (iii) Intangible assets – Recognition and Measurement Intangible assets acquired separately are measured on initial recognition at cost. The cost of an intangible asset acquired in a business combination is its fair value as at the date of acquisition. Following initial recognition, intangible assets are carried at cost less any accumulated amortisation and any accumulated impairment losses. Internally generated intangible assets, excluding capitalised development costs, are not capitalised and expenditure is charged against profits in the year in which the expenditure is incurred. The useful lives of intangible assets are assessed to be either finite or indefinite. Intangible assets with finite lives are amortised over the useful life and assessed for impairment whenever there is an indication that the intangible asset may be impaired. The amortisation period and the amortisation method for an intangible asset with a finite useful life is reviewed at least at each financial year end. Changes in the expected useful life or the expected pattern of consumption of future economic benefits embodied in the asset are accounted for by changing the amortisation period or method, as appropriate, which is a change in accounting estimate. The amortisation expense on intangible assets with finite lives is recognised in the Income Statement. Intangible assets with indefinite useful lives are tested for impairment annually either individually or at the cash-generating unit level consistent with the methodology outlined for goodwill impairment testing. Such intangibles are not amortised. The useful life of an intangible asset with an indefinite life is reviewed each reporting period to determine whether indefinite life assessment continues to be supportable. If not, the change in the useful life assessment from indefinite to finite is accounted for as a change in an accounting estimate and is thus accounted for on a prospective basis.
Service Concession Assets Development Costs (mainly internally developed software costs)
Useful lives Finite Finite
Amortisation method used Amortised over the period of the lease Amortised over the period of expected future benefit from the related project on a straight line basis
Internally generated or acquired Acquired Internally generated
Impairment testing When an indication of impairment exists. The amortisation method is reviewed at each financial year end.
When an indication of impairment exists. The amortisation method is reviewed at each financial year end.
Gains or losses arising from derecognition of an intangible asset are measured as the difference between the net disposal proceeds and the carrying amount of the asset and are recognised in the Income Statement when the asset is derecognised. (iv) Service concession assets – Recognition and Measurement Service concession assets represent the Group’s rights to operate hospitals under Service Concession Arrangements. Service concession assets constructed by the Group are recorded at the fair value of consideration received or receivable for the construction services delivered. Service concession assets acquired by the Group are recorded at the fair value of the assets at the date of acquisition. All service concession assets are classified as intangible assets. To the extent that the Group has an unconditional right to receive cash or other financial assets under the Service Concession Arrangements a financial asset has been recognised. The financial asset is measured at fair value on initial recognition and thereafter at amortised cost using the effective interest rate method. The financial asset will be reflected on initial recognition and thereafter as a ‘loan or receivable’. (v) Key Estimates and Assumptions Useful lives of assets are estimated based on historical experience and the expected period of future consumption of embodied economic benefits. Adjustments to useful lives are made where deemed necessary.

NOTES TO THE CONSOLIDATED FINANCIAL STATEMENTS FOR THE YEAR ENDED 30 JUNE 2017
82
III. ASSETS AND LIABILITIES OPERATING AND INVESTING (CONTINUED) 12. IMPAIRMENT TESTING OF GOODWILL (i) Description of the cash generating units and other relevant information Goodwill acquired through business combinations has been allocated in part to individual cash generating units and part to segments as synergies are achieved from the larger Group. Management assess goodwill by aggregating cash generating units to the level of the segment for purposes of impairment testing because the goodwill relates to synergies existing within the acquired business and synergies achieved from combining acquired facilities with the rest of the Group. This is tested for impairment on an annual basis. Goodwill has been allocated to the Australian business, the UK business and the French business as follows:
Australia
UK France Total 2017
$000 2016 $000
2017 $000
2016 $000
2017 $000
2016 $000
2017 $000
2016 $000
Carrying amount of goodwill 1,053,120 1,031,256 256,171 268,350 628,153 633,662 1,937,444 1,933,268
(ii) Key Estimates and Assumptions The recoverable amount of the Australian business, the UK business and the French business has been determined based on a value in use calculation using cash flow projections as at 30 June 2017 based on financial budgets approved by senior management covering the following financial year and applying a growth factor to the following four years. Key assumptions used in the value in use calculations are as follows: Australia UK France % % %
Extrapolated growth factor (Year 5+) 2017 3.0 2.0 1.0 2016 3.0 2.0 1.0
Pre-tax discount rate
2017 10.9 6.5 7.7 2016 11.0 6.5 8.7
Key inputs in value in use calculations are:
Budgeted margins – the basis used to determine the value assigned to the budgeted margins is the average margin achieved in the year immediately before the budgeted year, increased for expected efficiency improvements. Thus values assigned to margins reflects past experience and expected efficiency improvements. The margins are driven by consideration of future admissions and occupancy case mix across all facilities within the Group based on past experiences and management’s assessment of growth.
Tax rates have been estimated at 30% for Australian operations, and 19% - 34.4% for overseas operations consistent with the current local tax legislation.
Discount rates – discount rates reflect management’s estimate of the time value and the risks specific to each of the cash generating units that are not already reflected in the cash flows. This is the benchmark used by management to assess operating performance and to evaluate future investment proposals. In determining appropriate discount rates for each unit, regard has been given to the weighted average cost of capital of the entity as a whole and adjusted for country and business risk specific to the unit.
Growth rate estimates – they are based on management’s internal estimates of long term growth rates for each of the cash generating units.
Management has performed sensitivity testing by Cash Generating Unit (CGU) and on the aggregated CGU’s based on assessing the effect of changes in hospital occupancy rates, health fund rates, wage increases, revenue growth rates and discount rates.
For Australia, the United Kingdom and France, management do not consider that any reasonably likely changes in hospital occupancy rates, health fund rates, wage increases, revenue growth rates and discount rates would result in the carrying value of goodwill exceeding the recoverable amount.

NOTES TO THE CONSOLIDATED FINANCIAL STATEMENTS FOR THE YEAR ENDED 30 JUNE 2017
83
III. ASSETS AND LIABILITIES OPERATING AND INVESTING (CONTINUED) 13. TAXES 2017
$000 2016
$000
(a) Income tax expense The major components of income tax expense are: Income Statement
Continuing operations: Current income tax
Current income tax charge 222,825 225,202 Adjustments in respect of previous years (1,289) (7,837)
Deferred income tax
Relating to origination and reversal of temporary differences (22,737) (28,474) Adjustments in respect of deferred income tax of previous years (130) 8,783
Income tax expense reported in the Income Statement 198,669 197,674
(b) Numerical reconciliation between aggregate tax expense recognised in the
Income Statement and tax expense calculated per the statutory income tax rate
A reconciliation between tax expense and the product of the accounting profit before income tax multiplied by the Group’s applicable income tax rate is as follows:
Accounting profit before tax 749,665 708,936
At the Parent Entity’s statutory income tax rate of 30% (2016: 30%) 224,899 212,681 Expenditure not allowable for income tax purposes 9,184 4,757 Amounts not assessable for income tax purposes (34,406) (17,692) Impact of changes in foreign tax rates on deferred tax balances (26,357) (13,540) Other French income tax expense 18,803 18,245 Foreign tax rate adjustment due to differences in rates between Australia and Other
Countries 3,140 7,750 Other 3,406 (14,527)
198,669 197,674
Income tax expense reported in the consolidated Income Statement 198,669 197,674
(c) Recognised tax assets and liabilities
2017 2017 2016 2016 $000 $000 $000 $000
Current
income tax Deferred
income tax Current
income tax Deferred
income tax
Opening balance (28,039) (82,104) (15,841) (105,227) (Charged)/ credited to income (221,536) 22,867 (217,365) 19,691 Credited to equity - (1,947) - 17,353 Payments 221,176 - 201,477 - Exchange differences 817 887 1,569 (5,843) Acquisition and disposal of subsidiary (9) 491 2,121 (8,078)
Closing balance (27,591) (59,806) (28,039) (82,104)
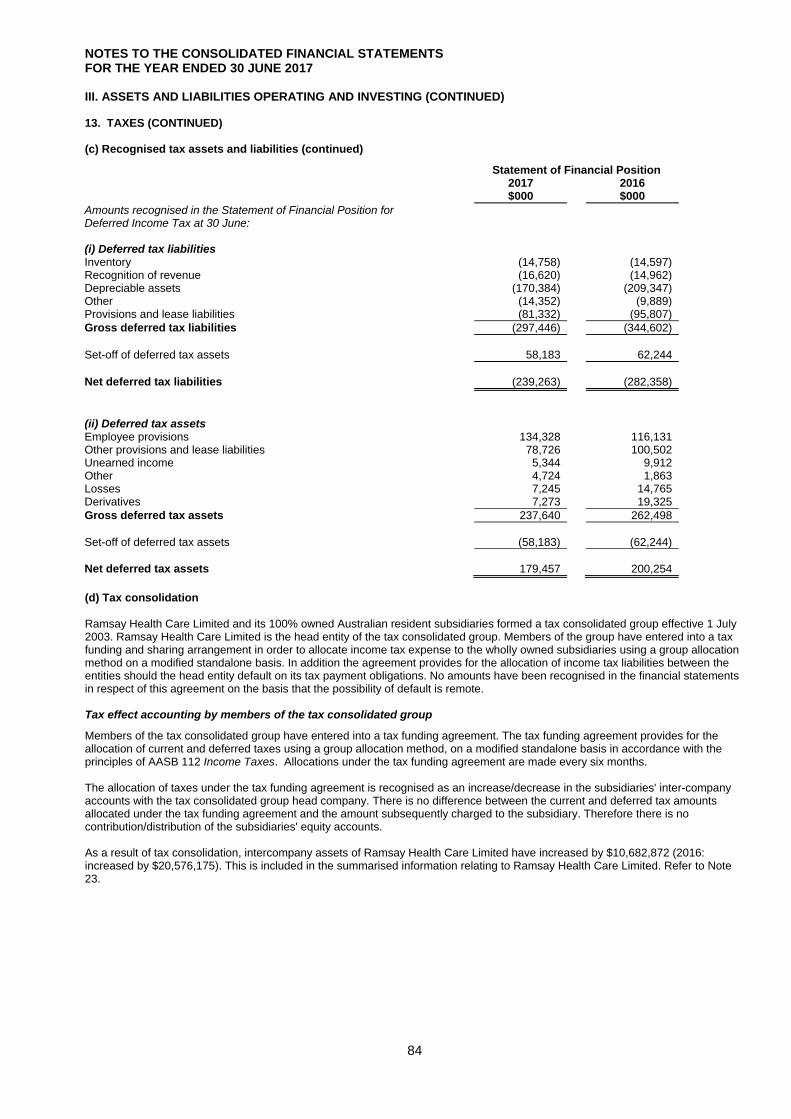
NOTES TO THE CONSOLIDATED FINANCIAL STATEMENTS FOR THE YEAR ENDED 30 JUNE 2017
84
III. ASSETS AND LIABILITIES OPERATING AND INVESTING (CONTINUED) 13. TAXES (CONTINUED) (c) Recognised tax assets and liabilities (continued)
Statement of Financial Position 2017
$000 2016
$000
Amounts recognised in the Statement of Financial Position for Deferred Income Tax at 30 June:
(i) Deferred tax liabilities Inventory (14,758) (14,597) Recognition of revenue (16,620) (14,962) Depreciable assets (170,384) (209,347) Other (14,352) (9,889) Provisions and lease liabilities (81,332) (95,807)
Gross deferred tax liabilities (297,446) (344,602)
Set-off of deferred tax assets 58,183 62,244
Net deferred tax liabilities (239,263) (282,358)
(ii) Deferred tax assets Employee provisions 134,328 116,131 Other provisions and lease liabilities 78,726 100,502 Unearned income 5,344 9,912 Other 4,724 1,863 Losses 7,245 14,765 Derivatives 7,273 19,325
Gross deferred tax assets 237,640 262,498
Set-off of deferred tax assets (58,183) (62,244)
Net deferred tax assets 179,457 200,254
(d) Tax consolidation Ramsay Health Care Limited and its 100% owned Australian resident subsidiaries formed a tax consolidated group effective 1 July 2003. Ramsay Health Care Limited is the head entity of the tax consolidated group. Members of the group have entered into a tax funding and sharing arrangement in order to allocate income tax expense to the wholly owned subsidiaries using a group allocation method on a modified standalone basis. In addition the agreement provides for the allocation of income tax liabilities between the entities should the head entity default on its tax payment obligations. No amounts have been recognised in the financial statements in respect of this agreement on the basis that the possibility of default is remote. Tax effect accounting by members of the tax consolidated group
Members of the tax consolidated group have entered into a tax funding agreement. The tax funding agreement provides for the allocation of current and deferred taxes using a group allocation method, on a modified standalone basis in accordance with the principles of AASB 112 Income Taxes. Allocations under the tax funding agreement are made every six months. The allocation of taxes under the tax funding agreement is recognised as an increase/decrease in the subsidiaries' inter-company accounts with the tax consolidated group head company. There is no difference between the current and deferred tax amounts allocated under the tax funding agreement and the amount subsequently charged to the subsidiary. Therefore there is no contribution/distribution of the subsidiaries' equity accounts. As a result of tax consolidation, intercompany assets of Ramsay Health Care Limited have increased by $10,682,872 (2016: increased by $20,576,175). This is included in the summarised information relating to Ramsay Health Care Limited. Refer to Note 23.

NOTES TO THE CONSOLIDATED FINANCIAL STATEMENTS FOR THE YEAR ENDED 30 JUNE 2017
85
III. ASSETS AND LIABILITIES OPERATING AND INVESTING (CONTINUED) 13. TAXES (CONTINUED) (e) Income Tax - Recognition and Measurement Current tax assets and liabilities for the current and prior periods are measured at the amount expected to be recovered from or paid to the taxation authorities. The tax rates and tax laws used to compute the amount are those that are enacted or substantively enacted by the reporting date. Deferred income tax is provided on all temporary differences at the reporting date between the tax bases of assets and liabilities and their carrying amounts for financial reporting purposes. Deferred income tax liabilities are recognised for all taxable temporary differences except:
when the deferred income tax liability arises from the initial recognition of goodwill or of an asset or liability in a transaction that is not a business combination and that, at the time of the transaction, affects neither the accounting profit nor taxable profit or loss; or
when the taxable temporary difference is associated with investments in subsidiaries, associates or interests in joint ventures, and the timing of the reversal of the temporary difference can be controlled and it is probable that the temporary difference will not reverse in the foreseeable future.
Deferred income tax assets are recognised for all deductible temporary differences, carry-forward of unused tax assets and unused tax losses, to the extent that it is probable that taxable profit will be available against which the deductible temporary differences and the carry-forward of unused tax credits and unused tax losses can be utilised, except:
when the deferred income tax asset relating to the deductible temporary difference arises from the initial recognition of an asset or liability in a transaction that is not a business combination and, at the time of the transaction, affects neither the accounting profit nor taxable profit or loss; or
when the deductible temporary difference is associated with investments in subsidiaries, associates or interests in joint ventures, in which case a deferred tax asset is only recognised to the extent that it is probable that the temporary difference will reverse in the foreseeable future and taxable profit will be available against which the temporary difference can be utilised.
The carrying amount of deferred income tax assets is reviewed at each reporting date and reduced to the extent that it is no longer probable that sufficient taxable profit will be available to allow all or part of the deferred income tax asset to be utilised. Unrecognised deferred income tax assets are reassessed at each reporting date and are recognised to the extent that it has become probable that future taxable profit will allow the deferred tax asset to be recovered. Deferred income tax assets and liabilities are measured at the tax rates that are expected to apply to the year when the asset is realised or the liability is settled, based on tax rates (and tax laws) that have been enacted or substantively enacted at the reporting date. Income taxes relating to items recognised directly in equity are recognised in equity and not in the Income Statement. Deferred tax assets and deferred tax liabilities are offset only if a legally enforceable right exists to set off current tax assets against current tax liabilities and the deferred tax assets and liabilities relate to the same taxable entity and the same taxation authority. (f) Other taxes – Recognition and Measurement Revenues, expenses and assets are recognised net of the amount of GST except:
where the GST incurred on a purchase of goods and services is not recoverable from the taxation authority, in which case the GST is recognised as part of the cost of acquisition of the asset or as part of the expense item as applicable; and
receivables and payables are stated with the amount of GST included.
The net amount of GST recoverable from, or payable to, the taxation authority is included as part of receivables or payables in the Statement of Financial Position. Cash flows are included in the Statement of Cash Flows on a gross basis and the GST component of cash flows arising from investing and financing activities which is recoverable from, or payable to, the taxation authority are classified as operating cash flows.
(g) Key Estimates and Assumptions
In determining the Group’s deferred tax assets and liabilities, management is required to make an estimate about the availability of future taxable profits and cash-flows. Changes in circumstances will alter expectations, which may impact the amount of tax losses and temporary differences recognised.
(h) Tax losses At 30 June 2017, there is $5,726,854 (2016: $5,726,854) of capital losses carried forward for which a deferred tax asset has not been recognised. As it is not probable they will be used in the foreseeable future, they have not been recognised.

NOTES TO THE CONSOLIDATED FINANCIAL STATEMENTS FOR THE YEAR ENDED 30 JUNE 2017
86
III. ASSETS AND LIABILITIES OPERATING AND INVESTING (CONTINUED)
14a. INVESTMENT IN JOINT VENTURE The Group has a 50% interest in Ramsay Sime Darby Health Care Sdn Bhd (RSDH), a joint venture involved in operating hospitals and day surgery facilities across Malaysia and Indonesia. The Group’s interest in RSDH is accounted for using the equity method in the consolidated financial statements.
2017 $000
2016 $000
Investment in joint venture at beginning of period 210,765 211,573 Share of profit of joint venture 13,146 9,966 Foreign currency translation and other equity movements (17,810) (10,774)
206,101 210,765
Recognition and Measurement A joint venture is a type of joint arrangement whereby the parties that have joint control of the arrangement have rights to the net assets of the joint venture. Joint control is the contractually agreed sharing of control of an arrangement, which exists only when decisions about the relevant activities require unanimous consent of the parties sharing control. The considerations made in determining significant influence or joint control are similar to those necessary to determine control over subsidiaries. The Group’s investment in a joint venture is accounted for using the equity method. Under the equity method, the investment in a joint venture is initially recognised at cost. The carrying amount of the investment is adjusted to recognise changes in the Group’s share of net assets of the joint venture since the acquisition date. Goodwill relating to the joint venture is included in the carrying amount of the investment and is neither amortised nor individually tested for impairment. The Income Statement reflects the Group’s share of the results of operations of the joint venture. Any change in OCI of those investees is presented as part of the Group’s OCI. In addition, when there has been a change recognised directly in the equity of the joint venture, the Group recognises its share of any changes, when applicable, in the statement of changes in equity. Unrealised gains and losses resulting from transactions between the Group and the joint venture are eliminated to the extent of the interest in the joint venture. The aggregate of the Group’s share of profit or loss of a joint venture is shown on the face of the Income Statement outside operating profit and represents profit or loss after tax and non-controlling interests in the subsidiaries of the joint venture. The financial statements of the joint venture are prepared for the same reporting period as the Group. When necessary, adjustments are made to bring the accounting policies in line with those of the Group. After application of the equity method, the Group determines whether it is necessary to recognise an impairment loss on its investment in the joint venture. At each reporting date, the Group determines whether there is objective evidence that the investment in the joint venture is impaired. If there is such evidence, the Group calculates the amount of impairment as the difference between the recoverable amount of the joint venture and its carrying value, then recognises the loss as ‘Share of profit of joint venture’ in the Income Statement. Upon loss of joint control over the joint venture, the Group measures and recognises any retained investment at its fair value. Any difference between the carrying amount of the joint venture upon loss of joint control and the fair value of the retained investment and proceeds from disposal is recognised in profit or loss.

NOTES TO THE CONSOLIDATED FINANCIAL STATEMENTS FOR THE YEAR ENDED 30 JUNE 2017
87
III. ASSETS AND LIABILITIES OPERATING AND INVESTING (CONTINUED) 14b. PROVISIONS
2017 $000
2016 $000
Current Restructuring provision 4,764 4,764 Unfavourable contracts 6,768 10,244 Insurance provision 12,159 13,152 Legal and compliance provision 27,386 38,699 Deferred lease provision 370 300 Other provisions 17,901 13,453
69,348 80,612
Non-current Non-current employee and Director entitlements 32,880 31,522 Deferred lease provision 260,159 254,886 Unfavourable contracts 33,083 27,909 Insurance provision 105,269 114,556 Restructuring provision 15,175 12,515 Legal and compliance provision 20,644 22,261 Other provisions 8,088 12,678
475,298 476,327
Total 544,646 556,939
(i) Recognition and Measurement Provisions are recognised when the Group has a present obligation (legal or constructive) as a result of a past event, it is probable that an outflow of resources embodying economic benefits will be required to settle the obligation and a reliable estimate can be made of the amount of the obligation. Where the Group expects some or all of a provision to be reimbursed, for example under an insurance contract, the reimbursement is recognised as a separate asset but only when the reimbursement is virtually certain. The expense relating to any provision is presented in the Income Statement net of any reimbursement. If the effect of the time value of money is material, provisions are determined by discounting the expected future cash flows at a pre-tax rate that reflects current market assessments of the time value of money and, where appropriate, the risks specific to the liability. Where discounting is used, the increase in the provision due to the passage of time is recognised as a finance cost. (ii) Movements in provisions
Deferred
lease $000
Restructuring
$000
Insurance
$000
Unfavourable contracts
$000
Legal and compliance
$000
Other provision
$000
Total
$000
At 30 June 2016 255,186 17,279 127,708 38,153 60,960 26,131 525,417 Arising during the year
18,524
5,927 14,778 9,711 8,439 5,360 62,739
Utilised during the year
(542)
(966) (7,896) (7,284) (8,711) (1,856) (27,255)
Exchange differences
(12,639)
37 (125) (729) (199) (74) (13,729)
Unused amounts reversed
-
(2,338) (17,037) - (12,459) (4,273) (36,107)
Discount rate adjustment
-
- - - - 701 701
At 30 June 2017 260,529 19,939 117,428 39,851 48,030 25,989 511,766
Current 2017 370 4,764 12,159 6,768 27,386 17,901 69,348
Non-current 2017 260,159 15,175 105,269 33,083 20,644 8,088 442,418
260,529 19,939 117,428 39,851 48,030 25,989 511,766
Current 2016 300 4,764 13,152 10,244 38,699 13,453 80,612
Non-current 2016 254,886 12,515 114,556 27,909 22,261 12,678 444,805
255,186 17,279 127,708 38,153 60,960 26,131 525,417

NOTES TO THE CONSOLIDATED FINANCIAL STATEMENTS FOR THE YEAR ENDED 30 JUNE 2017
88
III. ASSETS AND LIABILITIES OPERATING AND INVESTING (CONTINUED) 14b. PROVISIONS (CONTINUED) (iii) Nature and timing of provisions Restructuring provision The restructuring provision primarily relates to:
the restructuring of the Group subsequent to the purchase of acquisitions in the prior years. The restructuring plan was drawn up and announced to the employees during the year of acquisition;
restructuring of entities with the Group, announced prior to acquisition; and
land rich duties payable. Insurance provision Insurance policies are entered into to cover the various insurable risks. These policies have varying levels of deductibles. The medical malpractice provision is made to cover deductibles arising under the Medical Malpractice Insurance policy, including potential uninsured and ‘Incurred but not Reported’ claims. (i) Key Estimates and Assumptions This provision is actuarially assessed at each reporting period using a probability of sufficiency between 80% - 95% based on differing exposures to risk. The greatest uncertainty in estimating the provision is the costs that will ultimately be incurred which is estimated using historical claims, market information and other actuarial assessments. Included in the insurance provision is an amount for claiming handling expenses at between 10% - 20% of the estimated Ramsay claim cost. Employee leave benefits (i) Wages, salaries, annual leave & sick leave Liabilities for wages and salaries, including non-monetary benefits, annual leave and accumulating sick leave expected to be settled within 12 months of the reporting date are recognised in other payables in respect of employees' services up to the reporting date. They are measured at the amounts expected to be paid when the liabilities are settled. Liabilities for non-accumulating sick leave are recognised when the leave is taken and are measured at the rates paid or payable. (ii) Long service leave The liability for long service leave is recognised in the provision for employee benefits and measured as the present value of expected future payments to be made in respect of services provided by employees up to the reporting date using the projected unit credit method. Consideration is given to expected future wage and salary levels, experience of employee departures, and periods of service. Expected future payments are discounted using market yields at the reporting date on corporate bonds with terms to maturity and currencies that match, as closely as possible, the estimated future cash outflows. Deferred lease provision The deferred lease provision is recognised in accordance with AASB117 Leases for contracts where there is a fixed, not variable annual increase written into the lease, requiring the lease costs to be straight lined over the 30 year lease term. The provision represents the excess of rent expensed over the rent paid. The leases are due to expire in 2037. Unfavourable contracts Ramsay holds contracts with various lessors for up to twenty one years. As at acquisition these contracts were not at market rates and as such were considered unfavourable. These unfavourable contracts were not recognised as a liability in the books of the acquiree but have been assigned a fair value and recognised as a liability on acquisition. The leases are due to expire in 2037. Legal and compliance provision The legal and compliance provision primarily relates to amounts provided for litigation that is currently in the court process or a matter under review by a relevant authority. 14c. SUPERANNUATION COMMITMENTS The Group contributes to industry and individual superannuation funds established for the provision of benefits to employees of entities within the economic entity on retirement, death or disability. Benefits provided under these plans are based on contributions for each employee and for retirement are equivalent to accumulated contributions and earnings. All death and disability benefits are insured with various life insurance companies. The entity contributes to the funds at various agreed contribution levels, which are not less than the statutory minimum.
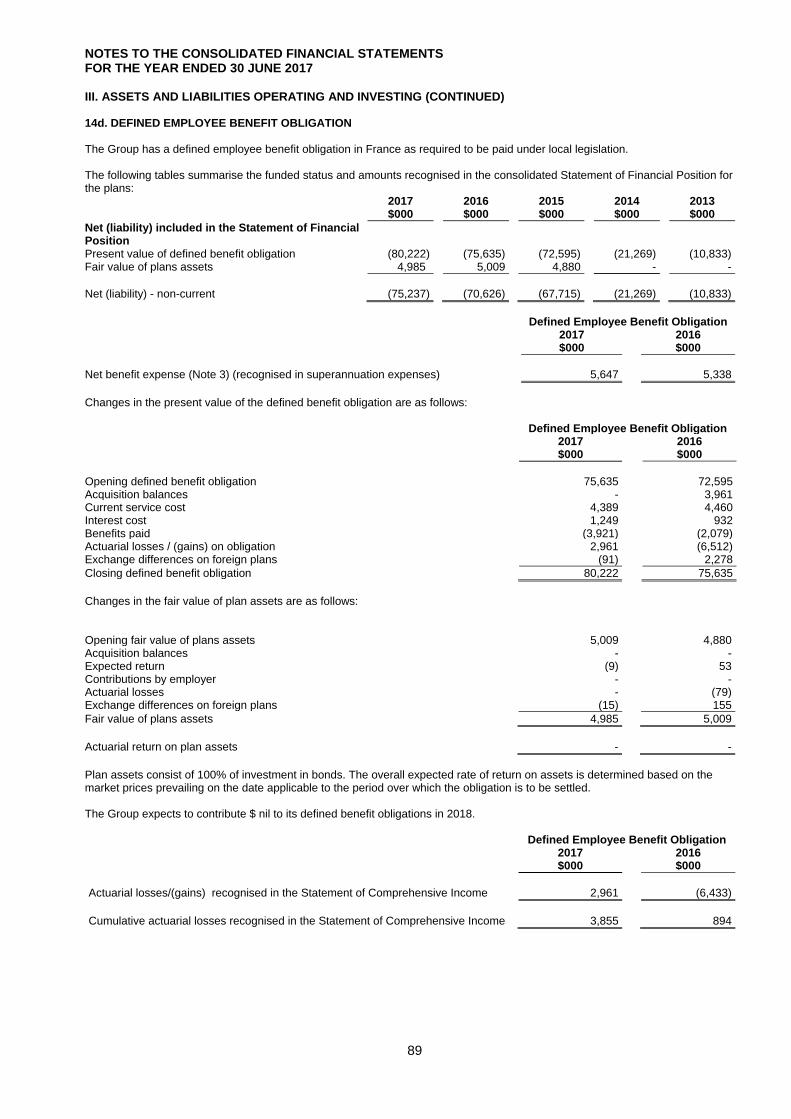
NOTES TO THE CONSOLIDATED FINANCIAL STATEMENTS FOR THE YEAR ENDED 30 JUNE 2017
89
III. ASSETS AND LIABILITIES OPERATING AND INVESTING (CONTINUED) 14d. DEFINED EMPLOYEE BENEFIT OBLIGATION The Group has a defined employee benefit obligation in France as required to be paid under local legislation. The following tables summarise the funded status and amounts recognised in the consolidated Statement of Financial Position for the plans: 2017
$000 2016
$000 2015
$000 2014
$000 2013 $000
Net (liability) included in the Statement of Financial Position
Present value of defined benefit obligation (80,222) (75,635) (72,595) (21,269) (10,833) Fair value of plans assets 4,985 5,009 4,880 - -
Net (liability) - non-current (75,237) (70,626) (67,715) (21,269) (10,833)
Defined Employee Benefit Obligation 2017
$000 2016 $000
Net benefit expense (Note 3) (recognised in superannuation expenses) 5,647
5,338
Changes in the present value of the defined benefit obligation are as follows:
Defined Employee Benefit Obligation 2017
$000 2016
$000
Opening defined benefit obligation 75,635 72,595 Acquisition balances - 3,961 Current service cost 4,389 4,460 Interest cost 1,249 932 Benefits paid (3,921) (2,079) Actuarial losses / (gains) on obligation 2,961 (6,512) Exchange differences on foreign plans (91) 2,278
Closing defined benefit obligation 80,222 75,635
Changes in the fair value of plan assets are as follows:
Opening fair value of plans assets 5,009 4,880 Acquisition balances - - Expected return (9) 53 Contributions by employer - - Actuarial losses - (79) Exchange differences on foreign plans (15) 155
Fair value of plans assets 4,985 5,009
Actuarial return on plan assets - -
Plan assets consist of 100% of investment in bonds. The overall expected rate of return on assets is determined based on the market prices prevailing on the date applicable to the period over which the obligation is to be settled. The Group expects to contribute $ nil to its defined benefit obligations in 2018.
Defined Employee Benefit Obligation 2017
$000 2016
$000
Actuarial losses/(gains) recognised in the Statement of Comprehensive Income 2,961 (6,433)
Cumulative actuarial losses recognised in the Statement of Comprehensive Income 3,855 894
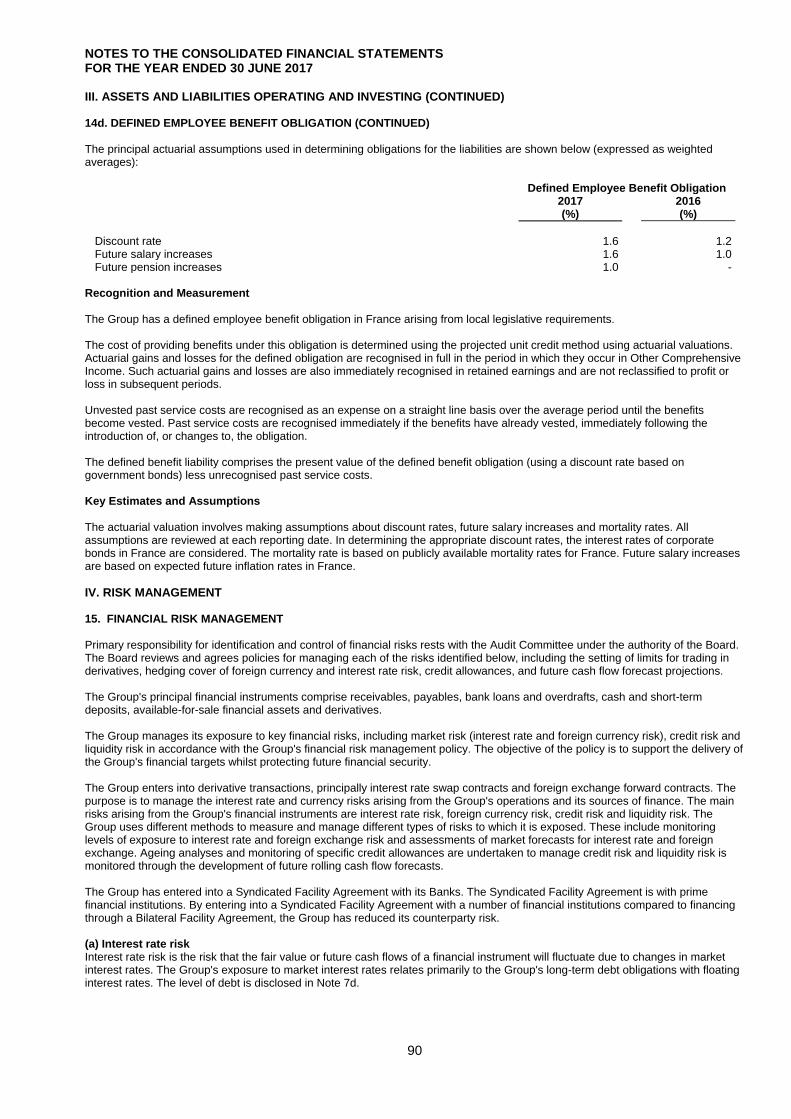
NOTES TO THE CONSOLIDATED FINANCIAL STATEMENTS FOR THE YEAR ENDED 30 JUNE 2017
90
III. ASSETS AND LIABILITIES OPERATING AND INVESTING (CONTINUED) 14d. DEFINED EMPLOYEE BENEFIT OBLIGATION (CONTINUED) The principal actuarial assumptions used in determining obligations for the liabilities are shown below (expressed as weighted averages): Defined Employee Benefit Obligation 2017
(%) 2016 (%)
Discount rate 1.6 1.2 Future salary increases 1.6 1.0 Future pension increases 1.0 -
Recognition and Measurement The Group has a defined employee benefit obligation in France arising from local legislative requirements. The cost of providing benefits under this obligation is determined using the projected unit credit method using actuarial valuations. Actuarial gains and losses for the defined obligation are recognised in full in the period in which they occur in Other Comprehensive Income. Such actuarial gains and losses are also immediately recognised in retained earnings and are not reclassified to profit or loss in subsequent periods. Unvested past service costs are recognised as an expense on a straight line basis over the average period until the benefits become vested. Past service costs are recognised immediately if the benefits have already vested, immediately following the introduction of, or changes to, the obligation. The defined benefit liability comprises the present value of the defined benefit obligation (using a discount rate based on government bonds) less unrecognised past service costs. Key Estimates and Assumptions The actuarial valuation involves making assumptions about discount rates, future salary increases and mortality rates. All assumptions are reviewed at each reporting date. In determining the appropriate discount rates, the interest rates of corporate bonds in France are considered. The mortality rate is based on publicly available mortality rates for France. Future salary increases are based on expected future inflation rates in France.
IV. RISK MANAGEMENT 15. FINANCIAL RISK MANAGEMENT Primary responsibility for identification and control of financial risks rests with the Audit Committee under the authority of the Board. The Board reviews and agrees policies for managing each of the risks identified below, including the setting of limits for trading in derivatives, hedging cover of foreign currency and interest rate risk, credit allowances, and future cash flow forecast projections. The Group's principal financial instruments comprise receivables, payables, bank loans and overdrafts, cash and short-term deposits, available-for-sale financial assets and derivatives. The Group manages its exposure to key financial risks, including market risk (interest rate and foreign currency risk), credit risk and liquidity risk in accordance with the Group's financial risk management policy. The objective of the policy is to support the delivery of the Group's financial targets whilst protecting future financial security. The Group enters into derivative transactions, principally interest rate swap contracts and foreign exchange forward contracts. The purpose is to manage the interest rate and currency risks arising from the Group's operations and its sources of finance. The main risks arising from the Group's financial instruments are interest rate risk, foreign currency risk, credit risk and liquidity risk. The Group uses different methods to measure and manage different types of risks to which it is exposed. These include monitoring levels of exposure to interest rate and foreign exchange risk and assessments of market forecasts for interest rate and foreign exchange. Ageing analyses and monitoring of specific credit allowances are undertaken to manage credit risk and liquidity risk is monitored through the development of future rolling cash flow forecasts. The Group has entered into a Syndicated Facility Agreement with its Banks. The Syndicated Facility Agreement is with prime financial institutions. By entering into a Syndicated Facility Agreement with a number of financial institutions compared to financing through a Bilateral Facility Agreement, the Group has reduced its counterparty risk. (a) Interest rate risk Interest rate risk is the risk that the fair value or future cash flows of a financial instrument will fluctuate due to changes in market interest rates. The Group's exposure to market interest rates relates primarily to the Group's long-term debt obligations with floating interest rates. The level of debt is disclosed in Note 7d.
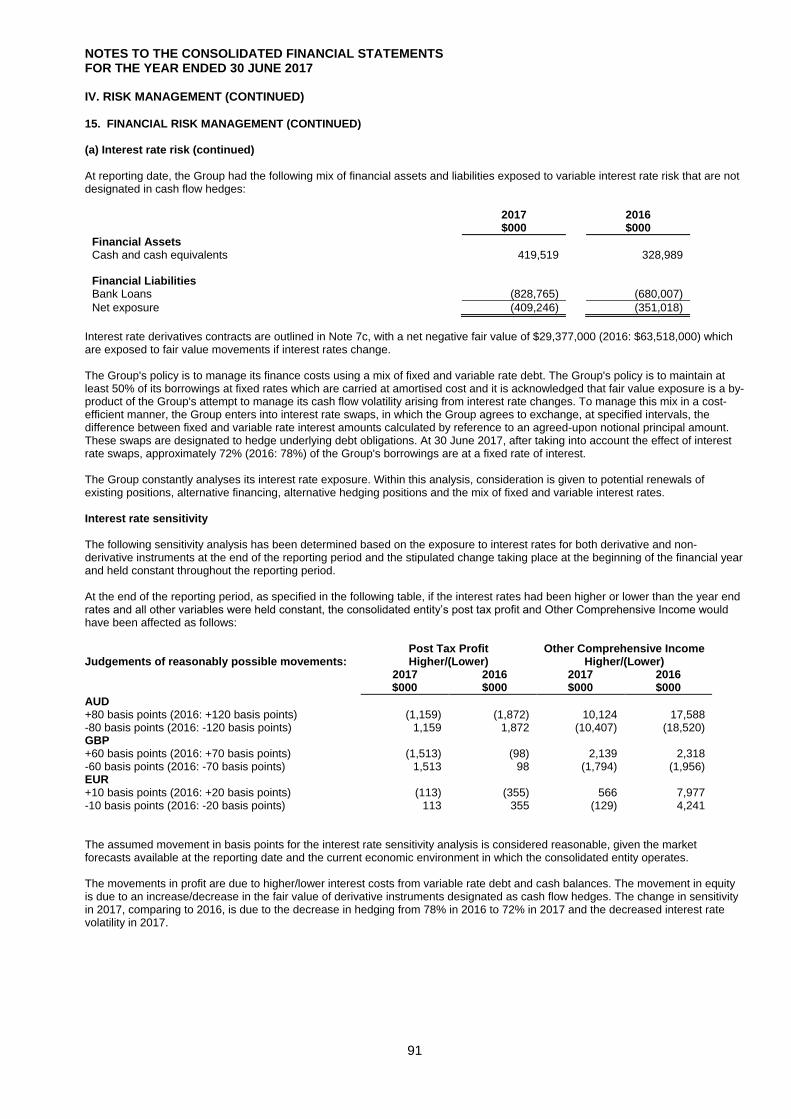
NOTES TO THE CONSOLIDATED FINANCIAL STATEMENTS FOR THE YEAR ENDED 30 JUNE 2017
91
IV. RISK MANAGEMENT (CONTINUED) 15. FINANCIAL RISK MANAGEMENT (CONTINUED) (a) Interest rate risk (continued) At reporting date, the Group had the following mix of financial assets and liabilities exposed to variable interest rate risk that are not designated in cash flow hedges:
2017 2016 $000 $000
Financial Assets Cash and cash equivalents 419,519 328,989 Financial Liabilities Bank Loans (828,765) (680,007)
Net exposure (409,246) (351,018)
Interest rate derivatives contracts are outlined in Note 7c, with a net negative fair value of $29,377,000 (2016: $63,518,000) which are exposed to fair value movements if interest rates change. The Group's policy is to manage its finance costs using a mix of fixed and variable rate debt. The Group's policy is to maintain at least 50% of its borrowings at fixed rates which are carried at amortised cost and it is acknowledged that fair value exposure is a by-product of the Group's attempt to manage its cash flow volatility arising from interest rate changes. To manage this mix in a cost-efficient manner, the Group enters into interest rate swaps, in which the Group agrees to exchange, at specified intervals, the difference between fixed and variable rate interest amounts calculated by reference to an agreed-upon notional principal amount. These swaps are designated to hedge underlying debt obligations. At 30 June 2017, after taking into account the effect of interest rate swaps, approximately 72% (2016: 78%) of the Group's borrowings are at a fixed rate of interest. The Group constantly analyses its interest rate exposure. Within this analysis, consideration is given to potential renewals of existing positions, alternative financing, alternative hedging positions and the mix of fixed and variable interest rates. Interest rate sensitivity The following sensitivity analysis has been determined based on the exposure to interest rates for both derivative and non-derivative instruments at the end of the reporting period and the stipulated change taking place at the beginning of the financial year and held constant throughout the reporting period. At the end of the reporting period, as specified in the following table, if the interest rates had been higher or lower than the year end rates and all other variables were held constant, the consolidated entity’s post tax profit and Other Comprehensive Income would have been affected as follows:
Judgements of reasonably possible movements: Post Tax Profit Higher/(Lower)
Other Comprehensive Income Higher/(Lower)
2017 2016 2017 2016 $000 $000 $000 $000
AUD +80 basis points (2016: +120 basis points) (1,159) (1,872) 10,124 17,588 -80 basis points (2016: -120 basis points) 1,159 1,872 (10,407) (18,520) GBP +60 basis points (2016: +70 basis points) (1,513) (98) 2,139 2,318 -60 basis points (2016: -70 basis points) 1,513 98 (1,794) (1,956) EUR +10 basis points (2016: +20 basis points) (113) (355) 566 7,977 -10 basis points (2016: -20 basis points) 113 355 (129) 4,241
The assumed movement in basis points for the interest rate sensitivity analysis is considered reasonable, given the market forecasts available at the reporting date and the current economic environment in which the consolidated entity operates. The movements in profit are due to higher/lower interest costs from variable rate debt and cash balances. The movement in equity is due to an increase/decrease in the fair value of derivative instruments designated as cash flow hedges. The change in sensitivity in 2017, comparing to 2016, is due to the decrease in hedging from 78% in 2016 to 72% in 2017 and the decreased interest rate volatility in 2017.
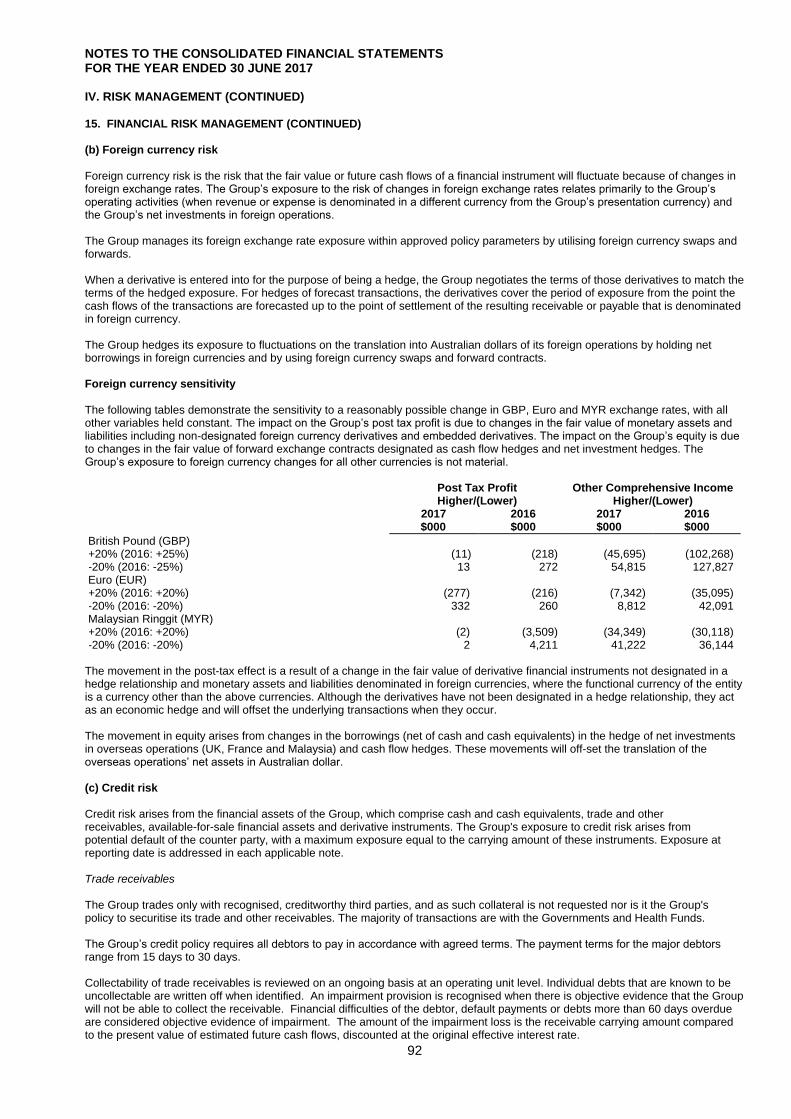
NOTES TO THE CONSOLIDATED FINANCIAL STATEMENTS FOR THE YEAR ENDED 30 JUNE 2017
92
IV. RISK MANAGEMENT (CONTINUED) 15. FINANCIAL RISK MANAGEMENT (CONTINUED) (b) Foreign currency risk Foreign currency risk is the risk that the fair value or future cash flows of a financial instrument will fluctuate because of changes in foreign exchange rates. The Group’s exposure to the risk of changes in foreign exchange rates relates primarily to the Group’s operating activities (when revenue or expense is denominated in a different currency from the Group’s presentation currency) and the Group’s net investments in foreign operations. The Group manages its foreign exchange rate exposure within approved policy parameters by utilising foreign currency swaps and forwards. When a derivative is entered into for the purpose of being a hedge, the Group negotiates the terms of those derivatives to match the terms of the hedged exposure. For hedges of forecast transactions, the derivatives cover the period of exposure from the point the cash flows of the transactions are forecasted up to the point of settlement of the resulting receivable or payable that is denominated in foreign currency. The Group hedges its exposure to fluctuations on the translation into Australian dollars of its foreign operations by holding net borrowings in foreign currencies and by using foreign currency swaps and forward contracts. Foreign currency sensitivity The following tables demonstrate the sensitivity to a reasonably possible change in GBP, Euro and MYR exchange rates, with all other variables held constant. The impact on the Group’s post tax profit is due to changes in the fair value of monetary assets and liabilities including non-designated foreign currency derivatives and embedded derivatives. The impact on the Group’s equity is due to changes in the fair value of forward exchange contracts designated as cash flow hedges and net investment hedges. The Group’s exposure to foreign currency changes for all other currencies is not material.
Post Tax Profit Higher/(Lower)
Other Comprehensive Income Higher/(Lower)
2017 2016 2017 2016 $000 $000 $000 $000
British Pound (GBP) +20% (2016: +25%) (11) (218) (45,695) (102,268) -20% (2016: -25%) 13 272 54,815 127,827 Euro (EUR) +20% (2016: +20%) (277) (216) (7,342) (35,095) -20% (2016: -20%) 332 260 8,812 42,091 Malaysian Ringgit (MYR) +20% (2016: +20%) (2) (3,509) (34,349) (30,118) -20% (2016: -20%) 2 4,211 41,222 36,144
The movement in the post-tax effect is a result of a change in the fair value of derivative financial instruments not designated in a hedge relationship and monetary assets and liabilities denominated in foreign currencies, where the functional currency of the entity is a currency other than the above currencies. Although the derivatives have not been designated in a hedge relationship, they act as an economic hedge and will offset the underlying transactions when they occur. The movement in equity arises from changes in the borrowings (net of cash and cash equivalents) in the hedge of net investments in overseas operations (UK, France and Malaysia) and cash flow hedges. These movements will off-set the translation of the overseas operations’ net assets in Australian dollar. (c) Credit risk Credit risk arises from the financial assets of the Group, which comprise cash and cash equivalents, trade and other receivables, available-for-sale financial assets and derivative instruments. The Group's exposure to credit risk arises from potential default of the counter party, with a maximum exposure equal to the carrying amount of these instruments. Exposure at reporting date is addressed in each applicable note. Trade receivables The Group trades only with recognised, creditworthy third parties, and as such collateral is not requested nor is it the Group's policy to securitise its trade and other receivables. The majority of transactions are with the Governments and Health Funds. The Group’s credit policy requires all debtors to pay in accordance with agreed terms. The payment terms for the major debtors range from 15 days to 30 days. Collectability of trade receivables is reviewed on an ongoing basis at an operating unit level. Individual debts that are known to be uncollectable are written off when identified. An impairment provision is recognised when there is objective evidence that the Group will not be able to collect the receivable. Financial difficulties of the debtor, default payments or debts more than 60 days overdue are considered objective evidence of impairment. The amount of the impairment loss is the receivable carrying amount compared to the present value of estimated future cash flows, discounted at the original effective interest rate.

NOTES TO THE CONSOLIDATED FINANCIAL STATEMENTS FOR THE YEAR ENDED 30 JUNE 2017
93
IV. RISK MANAGEMENT (CONTINUED) 15. FINANCIAL RISK MANAGEMENT (CONTINUED) (c) Credit risk (continued) The Group’s credit risk is spread across a number of Health Funds and Governments. Whilst the Group does have significant credit risk exposure to a single debtor or group of related debtors, the credit quality of these debtors is considered high, as they are either Health Funds, governed by the prudential requirements of APRA, or Governments. The credit quality of financial assets that are neither past due nor impaired is considered to be high, due to the absence of defaults, and the fact that the Group deals with creditworthy Health Funds and the Government. Management has also put in place procedures to constantly monitor the exposures in order to manage its credit risk. Financial instruments and cash deposits Credit risks related to balances with banks and financial institutions are managed by Ramsay Group Treasury in accordance with Board approved policies. Such policies only allow financial derivative instruments to be entered into with high credit quality financial institutions with a minimum long-term credit rating of A- or better by Standard & Poor’s. In addition, the Board has approved the use of these financial institutions, and specific internal guidelines have been established with regard to limits, dealing and settlement procedures. Limits are set to minimise the concentration of risks and therefore mitigate financial loss through potential counterparty failure. The investment of surplus funds is made only with approved counterparties and within credit risk in relation to derivatives undertaken in accordance with the consolidated entity’s hedging and risk management activities. The Group does not hold any credit derivatives to off-set its credit risk exposure. The Group’s maximum exposure for financial derivative instruments is noted in the liquidity table below. (d) Liquidity risk Liquidity risk arises from the financial liabilities of the Group and the Group’s subsequent ability to meet their obligations to repay their financial liabilities as and when they fall due. The Group's objective is to maintain a balance between continuity of funding and flexibility through the use of bank overdrafts, bank loans and finance leases. To monitor existing financial assets and liabilities as well as to enable an effective controlling of future risks, Ramsay has established management reporting covering its worldwide business units that reflects expectations of management’s expected settlement of financial assets and liabilities. The Group continually reviews its liquidity position including cash flow forecasts to determine the forecast liquidity position and maintain appropriate liquidity levels. The table below summarises the maturity profile of the Group’s financial liabilities based on contractual undiscounted payments.
On
demand Less than 3 months
3 to 12 months
1 to 5 years
> 5 years Total
$000 $000 $000 $000 $000 $000
Year ended 30 June 2017 Trade and other payable - (1,682,645) - - - (1,682,645) Interest-bearing loans and borrowings - (32,666) (126,525) (3,188,282) (40,059) (3,387,532) Financial derivatives - (4,412) (11,983) (13,474) - (29,869)
- (1,719,723) (138,508) (3,201,756) (40,059) (5,100,046)
Year ended 30 June 2016 Trade and other payable - (1,704,028) - - - (1,704,028) Interest-bearing loans and borrowings - (26,012) (86,983) (3,344,599) (21,791) (3,479,385) Deferred consideration - (30,060) - - - (30,060) Financial derivatives - (4,559) (14,369) (46,883) - (65,811)
- (1,764,659) (101,352) (3,391,482) (21,791) (5,279,284)

NOTES TO THE CONSOLIDATED FINANCIAL STATEMENTS FOR THE YEAR ENDED 30 JUNE 2017
94
IV. RISK MANAGEMENT (CONTINUED) 15. FINANCIAL RISK MANAGEMENT (CONTINUED) (d) Liquidity risk (continued) The disclosed financial derivative instruments in the above table are the gross undiscounted cash flows. However, those amounts may be settled gross or net. The following table shows the corresponding reconciliation of those amounts to their carrying amounts.
On
demand Less than 3 months
3 to 12 months 1 to 5 years > 5 years Total
Year ended 30 June 2017 $000 $000 $000 $000 $000 $000
Inflows - 2,736 8,376 27,442 - 38,554 Outflows - (7,148) (20,359) (40,916) - (68,423)
Net - (4,412) (11,983) (13,474) - (29,869) Discounted at the applicable interbank rates - (4,119) (11,927) (13,331) - (29,377)
Year ended 30 June 2016 Inflows - 3,260 9,249 31,171 - 43,680 Outflows - (7,819) (23,618) (78,054) - (109,491)
Net - (4,559) (14,369) (46,883) - (65,811) Discounted at the applicable interbank rates - (2,881) (14,307) (46,330) - (63,518)
V. OTHER INFORMATION 16. SHARE BASED PAYMENT PLANS Executive performance rights plan (equity) An executive performance rights scheme was established in January 2004 where Ramsay Health Care Limited may, at the discretion of the Board, grant rights over the ordinary shares of Ramsay Health Care Limited to executives of the consolidated entity. The rights are issued for nil consideration and are granted in accordance with the plan’s guidelines established by the Directors of Ramsay Health Care Limited. The rights cannot be transferred and will not be quoted on the ASX. Non-executive directors are not eligible for this plan. Information with respect to the number of rights granted under the executive performance rights plan is as follows: 2017 2016
Number of Rights
Weighted Average
Fair Value Number of
Rights
Weighted Average
Fair Value
Balance at beginning of year 1,982,207 2,055,000 - granted 608,401 $61.44 644,743 $55.47 - vested (663,000) $31.06 (717,536) $20.82 - forfeited - - - -
Balance at end of year 1,927,608 1,982,207
Exercisable at end of year - -
The following table summarises information about rights held by participants in the executive performance rights plan as at 30 June 2017: Number of Rights Grant Date Vesting Date
(1) Weighted Average
Fair Value (2)
313,169 13-Nov-14 31-Aug-17 $38.58 366,831 13-Nov-14 31-Aug-17 $49.95 279,512 13-Nov-15 31-Aug-18 $46.98 359,695 13-Nov-15 31-Aug-18 $61.96 264,747 10-Nov-16 31-Aug-19 $50.95 343,654 10-Nov-16 31-Aug-19 $69.53
1,927,608
(1)
The vesting date shown is the most likely vesting date subject to full satisfaction of the respective performance conditions. (2)
Fair value at grant date

NOTES TO THE CONSOLIDATED FINANCIAL STATEMENTS FOR THE YEAR ENDED 30 JUNE 2017
95
V. OTHER INFORMATION (CONTINUED) 16. SHARE BASED PAYMENT PLANS (CONTINUED) Key Estimates and Assumptions Performance rights are issued for nil consideration and are granted in accordance with the plan’s guidelines established by the Directors of Ramsay Health Care Limited. The fair value of share rights with TSR performance conditions are estimated on the date of grant using a Monte Carlo model. The fair value of share rights with non-market performance conditions are estimated at the date of grant using the Black Scholes Option Pricing model. The following weighted average assumptions were used for grants made on 13 November 2014, 13 November 2015 and 10 November 2016.
Granted 10-Nov-16
Granted 13-Nov-15
Granted 13-Nov-14
Dividend yield 1.85% 1.83% 1.91%
Expected volatility 22.5% 22.5% 22.5%
Historical volatility 22.0% 21.2% 21.7%
Risk-free interest rate 1.76% 2.2% 2.9%
Effective life of incentive right 3 years 3 years 3 years
The dividend yield reflects the assumption that the current dividend payout will continue with no anticipated increases. The expected life of the rights is based on historical data and is not necessarily indicative of exercise patterns that may occur. The expected volatility reflects the assumption that the historical volatility is indicative of future trends, which may also not necessarily be the actual outcome. Recognition and Measurement The Group provides benefits to employees (including Directors) of the Group in the form of share-based payment transactions, whereby employees render services in exchange for shares or rights over shares (‘equity-settled transactions’). There is currently one plan in place to provide these benefits, being the Executive Performance Rights Plan (Equity-settled transactions), which provides benefits to senior executives and Directors. The cost of these equity settled transactions with employees is measured by reference to the fair value at the date at which they were granted. The fair value is determined by an external valuer using the Monte Carlo and the Black Scholes models. In valuing equity-settled transactions, no account is taken of any performance conditions, other than conditions linked to the price of the shares of Ramsay Health Care Limited (‘market conditions’). Equity-settled transactions The cost of equity-settled transactions is recognised, together with a corresponding increase in equity (Share Based Payment Reserve), over the period in which the performance conditions are fulfilled, ending on the date on which the relevant employees become fully entitled to the award (‘vesting date’). The cumulative expense recognised for equity-settled transactions at each reporting date until vesting date reflects: (i) The extent to which the vesting period has expired and (ii) The number of awards that, in the opinion of the Directors of the Group, will ultimately vest. This opinion is formed based on the
best available information at reporting date. No adjustment is made for the likelihood of market performance conditions being met as the effect of these conditions is included in the determination of fair value at grant date. Treasury Shares Shares in the Group held by the Executive Performance Share Plan are classified and disclosed as Treasury shares and deducted from equity.
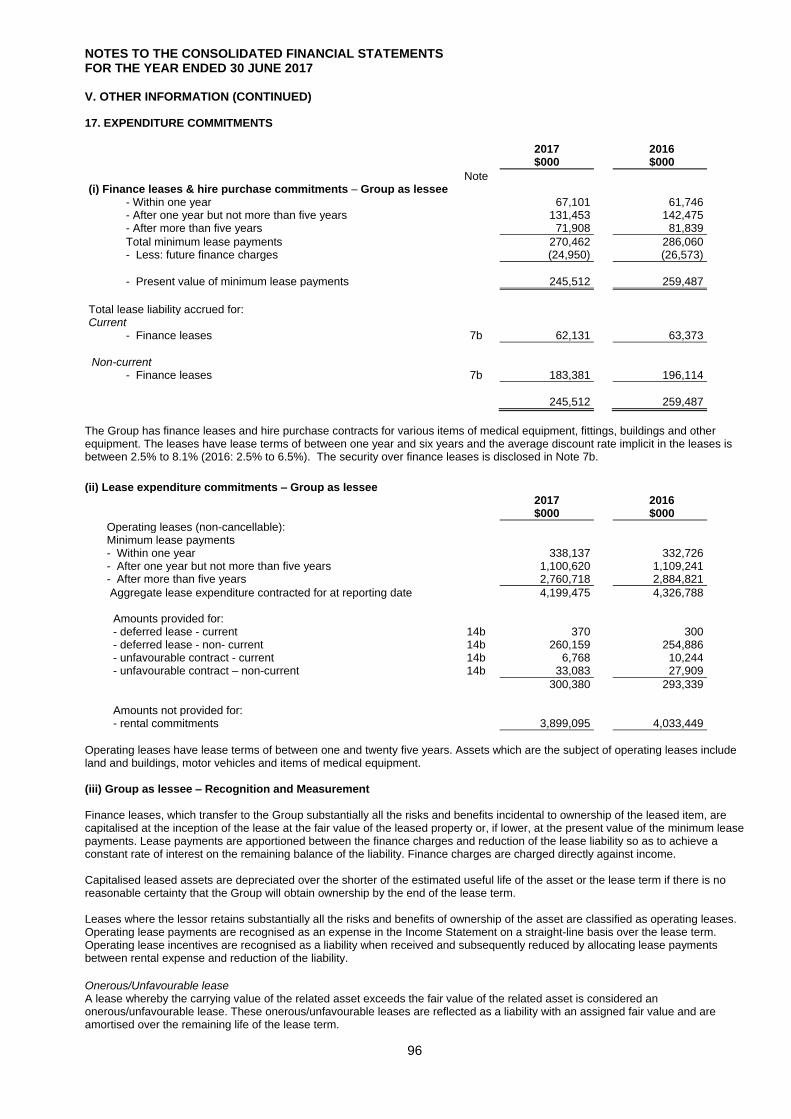
NOTES TO THE CONSOLIDATED FINANCIAL STATEMENTS FOR THE YEAR ENDED 30 JUNE 2017
96
V. OTHER INFORMATION (CONTINUED) 17. EXPENDITURE COMMITMENTS 2017
$000 2016
$000
Note (i) Finance leases & hire purchase commitments – Group as lessee
- Within one year 67,101 61,746 - After one year but not more than five years 131,453 142,475 - After more than five years 71,908 81,839
Total minimum lease payments 270,462 286,060 - Less: future finance charges (24,950) (26,573)
- Present value of minimum lease payments 245,512 259,487
Total lease liability accrued for: Current
- Finance leases 7b 62,131 63,373
Non-current
- Finance leases 7b 183,381 196,114
245,512 259,487
The Group has finance leases and hire purchase contracts for various items of medical equipment, fittings, buildings and other equipment. The leases have lease terms of between one year and six years and the average discount rate implicit in the leases is between 2.5% to 8.1% (2016: 2.5% to 6.5%). The security over finance leases is disclosed in Note 7b.
(ii) Lease expenditure commitments – Group as lessee
2017
$000 2016
$000
Operating leases (non-cancellable): Minimum lease payments - Within one year 338,137 332,726 - After one year but not more than five years 1,100,620 1,109,241 - After more than five years 2,760,718 2,884,821
Aggregate lease expenditure contracted for at reporting date 4,199,475 4,326,788
Amounts provided for: - deferred lease - current 14b 370 300 - deferred lease - non- current 14b 260,159 254,886 - unfavourable contract - current 14b 6,768 10,244 - unfavourable contract – non-current 14b 33,083 27,909
300,380 293,339 Amounts not provided for: - rental commitments 3,899,095 4,033,449
Operating leases have lease terms of between one and twenty five years. Assets which are the subject of operating leases include land and buildings, motor vehicles and items of medical equipment. (iii) Group as lessee – Recognition and Measurement Finance leases, which transfer to the Group substantially all the risks and benefits incidental to ownership of the leased item, are capitalised at the inception of the lease at the fair value of the leased property or, if lower, at the present value of the minimum lease payments. Lease payments are apportioned between the finance charges and reduction of the lease liability so as to achieve a constant rate of interest on the remaining balance of the liability. Finance charges are charged directly against income. Capitalised leased assets are depreciated over the shorter of the estimated useful life of the asset or the lease term if there is no reasonable certainty that the Group will obtain ownership by the end of the lease term. Leases where the lessor retains substantially all the risks and benefits of ownership of the asset are classified as operating leases. Operating lease payments are recognised as an expense in the Income Statement on a straight-line basis over the lease term. Operating lease incentives are recognised as a liability when received and subsequently reduced by allocating lease payments between rental expense and reduction of the liability.
Onerous/Unfavourable lease A lease whereby the carrying value of the related asset exceeds the fair value of the related asset is considered an onerous/unfavourable lease. These onerous/unfavourable leases are reflected as a liability with an assigned fair value and are amortised over the remaining life of the lease term.
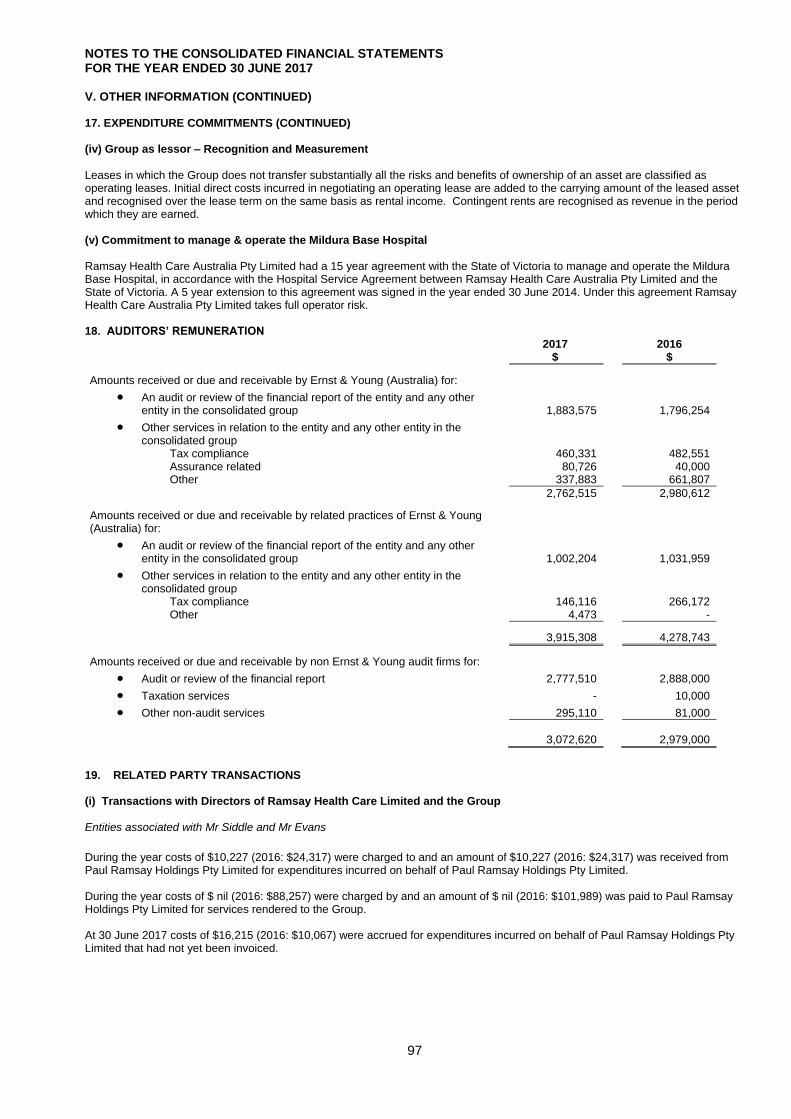
NOTES TO THE CONSOLIDATED FINANCIAL STATEMENTS FOR THE YEAR ENDED 30 JUNE 2017
97
V. OTHER INFORMATION (CONTINUED) 17. EXPENDITURE COMMITMENTS (CONTINUED) (iv) Group as lessor – Recognition and Measurement Leases in which the Group does not transfer substantially all the risks and benefits of ownership of an asset are classified as operating leases. Initial direct costs incurred in negotiating an operating lease are added to the carrying amount of the leased asset and recognised over the lease term on the same basis as rental income. Contingent rents are recognised as revenue in the period which they are earned. (v) Commitment to manage & operate the Mildura Base Hospital Ramsay Health Care Australia Pty Limited had a 15 year agreement with the State of Victoria to manage and operate the Mildura Base Hospital, in accordance with the Hospital Service Agreement between Ramsay Health Care Australia Pty Limited and the State of Victoria. A 5 year extension to this agreement was signed in the year ended 30 June 2014. Under this agreement Ramsay Health Care Australia Pty Limited takes full operator risk. 18. AUDITORS’ REMUNERATION 2017
$ 2016
$
Amounts received or due and receivable by Ernst & Young (Australia) for:
An audit or review of the financial report of the entity and any other entity in the consolidated group
1,883,575 1,796,254
Other services in relation to the entity and any other entity in the consolidated group
Tax compliance 460,331 482,551 Assurance related 80,726 40,000 Other 337,883 661,807
2,762,515 2,980,612
Amounts received or due and receivable by related practices of Ernst & Young (Australia) for:
An audit or review of the financial report of the entity and any other entity in the consolidated group
1,002,204 1,031,959
Other services in relation to the entity and any other entity in the consolidated group
Tax compliance 146,116 266,172 Other 4,473 -
3,915,308 4,278,743
Amounts received or due and receivable by non Ernst & Young audit firms for:
Audit or review of the financial report 2,777,510 2,888,000
Taxation services - 10,000
Other non-audit services 295,110 81,000
3,072,620 2,979,000
19. RELATED PARTY TRANSACTIONS (i) Transactions with Directors of Ramsay Health Care Limited and the Group
Entities associated with Mr Siddle and Mr Evans
During the year costs of $10,227 (2016: $24,317) were charged to and an amount of $10,227 (2016: $24,317) was received from Paul Ramsay Holdings Pty Limited for expenditures incurred on behalf of Paul Ramsay Holdings Pty Limited. During the year costs of $ nil (2016: $88,257) were charged by and an amount of $ nil (2016: $101,989) was paid to Paul Ramsay Holdings Pty Limited for services rendered to the Group. At 30 June 2017 costs of $16,215 (2016: $10,067) were accrued for expenditures incurred on behalf of Paul Ramsay Holdings Pty Limited that had not yet been invoiced.

NOTES TO THE CONSOLIDATED FINANCIAL STATEMENTS FOR THE YEAR ENDED 30 JUNE 2017
98
V. OTHER INFORMATION (CONTINUED) 19. RELATED PARTY TRANSACTIONS (CONTINUED) (ii) Compensation of key management personnel
2017 $
2016 $
Non-Executive Directors Short term 2,750,035 2,866,050 Post-employment 180,043 205,384
2,930,078 3,071,434
Executive Directors Short term 6,920,238 6,846,360 Post-employment 135,385 135,798 Performance/Incentive rights 23,291,750 12,833,064
30,347,373 19,815,222
Executives Short term 2,672,631 2,627,784 Post-employment 83,730 84,159 Performance/Incentive rights 5,707,175 4,932,141
8,463,536 7,644,084
Total Short term 12,342,904 12,340,194 Post-employment 399,158 425,341 Performance/Incentive rights 28,998,925 17,765,205
41,740,987 30,530,740
20. SUBSEQUENT EVENTS There have been no significant events after the reporting date that may significantly affect the Group’s operations in future years, the results of these operations in future years or the Group’s state of affairs in future years.

NOTES TO THE CONSOLIDATED FINANCIAL STATEMENTS FOR THE YEAR ENDED 30 JUNE 2017
99
V. OTHER INFORMATION (CONTINUED) 21. INFORMATION RELATING TO SUBSIDIARIES Name
Country of Incorporation
% Equity Interest 2017 2016
RHC Nominees Pty Limited ^ Australia 100% 100% RHC Developments Pty Limited ^ Australia 100% 100% Ramsay Health Care Investments Pty Limited ^ Australia 100% 100% Ramsay Hospital Holdings Pty Limited ^ Australia 100% 100% Ramsay Hospital Holdings (Queensland) Pty Limited ^ Australia 100% 100% Ramsay Finance Pty Limited ^ Australia 100% 100% Ramsay Aged Care Holdings Pty Limited ^ Australia 100% 100% Ramsay Aged Care Properties Pty Limited ^ Australia 100% 100% RHC Ancillary Services Pty Limited ^ Australia 100% 100% Linear Medical Pty Limited ^ Australia 100% 100% Newco Enterprises Pty Limited ^ Australia 100% 100% Sydney & Central Coast Linen Services Pty Limited ^ Australia 100% 100% Benchmark Healthcare Holdings Pty Limited ^ Australia 100% 100% Benchmark Healthcare Pty Limited ^ Australia 100% 100% AHH Holdings Health Care Pty Limited ^ Australia 100% 100% AH Holdings Health Care Pty Limited ^ Australia 100% 100% Ramsay Centauri Pty Limited ^ Australia 100% 100% Alpha Healthcare Pty Limited ^ Australia 100% 100% Ramsay Health Care Australia Pty Limited ^ Australia 100% 100% Donvale Private Hospital Pty Limited ^ Australia 100% 100% The Benchmark Hospital Group Pty Limited ^ Australia 100% 100% Dandenong Valley Private Hospital Pty Limited ^ Australia 100% 100% Benchmark – Surrey Pty Limited ^ Australia 100% 100% Benchmark – Peninsula Pty Limited ^ Australia 100% 100% Benchmark – Donvale Pty Limited ^ Australia 100% 100% Benchmark – Windermere Pty Limited ^ Australia 100% 100% Benchmark – Beleura Pty Limited ^ Australia 100% 100% Beleura Properties Pty Limited ^ Australia 100% 100% Affinity Health Holdings Australia Pty Limited ^ Australia 100% 100% Affinity Health Finance Australia Pty Limited ^ Australia 100% 100% Affinity Health Pty Limited ^ Australia 100% 100% Affinity Health Foundation Pty Limited ^ Australia 100% 100% Affinity Health Holdings Indonesia Pty Limited ^ Australia 100% 100% Hospitals of Australia Pty Limited ^ Australia 100% 100% Glenferrie Private Hospital Pty Limited^ Australia 100% 100% Relkban Pty Limited ^ Australia 100% 100% Relkmet Pty Limited ^ Australia 100% 100% Votraint No. 664 Pty Limited ^ Australia 100% 100% Votraint No. 665 Pty Limited ^ Australia 100% 100% Australian Medical Enterprises Pty Limited ^ Australia 100% 100% AME Hospitals Pty Limited ^ Australia 100% 100% Victoria House Holdings Pty Limited ^ Australia 100% 100% C&P Hospitals Holdings Pty Limited ^ Australia 100% 100% HCoA Hospital Holdings (Australia) Pty Limited ^ Australia 100% 100% AME Properties Pty Limited ^ Australia 100% 100% AME Superannuation Pty Limited ^ Australia 100% 100% Attadale Hospital Property Pty Limited ^ Australia 100% 100% Glengarry Hospital Property Pty Limited ^ Australia 100% 100% Hadassah Pty Limited ^ Australia 100% 100% Rannes Pty Limited ^ Australia 100% 100% Hallcraft Pty Limited ^ Australia 100% 100% Jamison Private Hospital Property Pty Limited ^ Australia 100% 100% Affinity Health (FP) Pty Limited ^ Australia 100% 100% Armidale Hospital Pty Limited ^ Australia 100% 100% Caboolture Hospital Pty Limited ^ Australia 100% 100% Joondalup Hospital Pty Limited ^ Australia 100% 100% Joondalup Health Campus Finance Limited Australia 100% 100% Logan Hospital Pty Limited ^ Australia 100% 100% Noosa Privatised Hospital Pty Limited ^ Australia 100% 100% AMNL Pty Limited ^ Australia 100% 100% Mayne Properties Pty Limited ^ Australia 100% 100% Port Macquarie Hospital Pty Limited ^ Australia 100% 100% HCoA Operations (Australia) Pty Limited ^ Australia 100% 100% Hospital Corporation Australia Pty Limited ^ Australia 100% 100% Dabuvu Pty Limited ^ Australia 100% 100%
^ Entities included in the deed of cross guarantee as required for the class order

NOTES TO THE CONSOLIDATED FINANCIAL STATEMENTS FOR THE YEAR ENDED 30 JUNE 2017
100
V. OTHER INFORMATION (CONTINUED) 21. INFORMATION RELATING TO SUBSIDIARIES (CONTINUED)
Name Country of
Incorporation % Equity Interest
2017 2016 HOAIF Pty Limited ^ Australia 100% 100% HCA Management Pty Limited ^ Australia 100% 100% Malahini Pty Limited ^ Australia 100% 100% Tilemo Pty Limited ^ Australia 100% 100% Hospital Affiliates of Australia Pty Limited ^ Australia 100% 100% C.R.P.H Pty Limited ^ Australia 100% 100% Hospital Developments Pty Limited ^ Australia 100% 100% P.M.P.H Pty Limited ^ Australia 100% 100% Pruinosa Pty Limited ^ Australia 100% 100% Australian Hospital Care Pty Limited ^ Australia 100% 100% Australian Hospital Care (Allamanda) Pty Limited ^ Australia 100% 100% Australian Hospital Care (Latrobe) Pty Limited ^ Australia 100% 100% Australian Hospital Care 1988 Pty Limited ^ Australia 100% 100% AHC Foundation Pty Limited ^ Australia 100% 100% AHC Tilbox Pty Limited ^ Australia 100% 100% Australian Hospital Care (Masada) Pty Limited ^ Australia 100% 100% Australian Hospital Care Investments Pty Limited ^ Australia 100% 100% Australian Hospital Care (MPH) Pty Limited ^ Australia 100% 100% Australian Hospital Care (MSH) Pty Limited ^ Australia 100% 100% Australian Hospital Care (Pindara) Pty Limited ^ Australia 100% 100% Australian Hospital Care (The Avenue) Pty Limited ^ Australia 100% 100% Australian Hospital Care Retirement Plan Pty Limited ^ Australia 100% 100% eHealth Technologies Pty Limited ^ Australia 100% 100% Health Technologies Pty Limited ^ Australia 100% 100% Rehabilitation Holdings Pty Limited ^ Australia 100% 100% Bowral Management Company Pty Limited ^ Australia 100% 100% Simpak Services Pty Limited ^ Australia 100% 100% APL Hospital Holdings Pty Limited ^ Australia 100% 100% Alpha Pacific Hospitals Pty Limited ^ Australia 100% 100% Health Care Corporation Pty Limited ^ Australia 100% 100% Alpha Westmead Private Hospital Pty Limited ^ Australia 100% 100% Illawarra Private Hospital Holdings Pty Limited ^ Australia 100% 100% Northern Private Hospital Pty Limited ^ Australia 100% 100% Westmead Medical Supplies Pty Limited ^ Australia 100% 100% Herglen Pty Limited ^ Australia 100% 100% Mt Wilga Pty Limited ^ Australia 100% 100% Sibdeal Pty Limited ^ Australia 100% 100% Workright Pty Limited ^ Australia 100% 100% Adelaide Clinic Holdings Pty Limited ^ Australia 100% 100% eHospital Pty Limited ^ Australia 100% 100% New Farm Hospitals Pty Limited ^ Australia 100% 100% North Shore Private Hospital Pty Limited ^ Australia 100% 100% Phiroan Pty Limited ^ Australia 100% 100% Ramsay Health Care (Asia Pacific) Pty Limited ^ Australia 100% 100% Ramsay Health Care (South Australia) Pty Limited ^ Australia 100% 100% Ramsay Health Care (Victoria) Pty Limited ^ Australia 100% 100% Ramsay Health Care Services (QLD) Pty Limited ^ Australia 100% 100% Ramsay Health Care Services (VIC) Pty Limited ^ Australia 100% 100% Ramsay Health Care Services (WA) Pty Limited ^ Australia 100% 100% Ramsay Pharmacy Retail Services Pty Limited^ Australia 100% 100% Ramsay International Holding Company Pty Limited Australia 100% 100% Ramsay Professional Services Pty Limited ^ Australia 100% 100% Ramsay Diagnostics (No. 1) Pty Limited ^ Australia 100% 100% Ramsay Diagnostics (No. 2) Pty Limited ^ Australia 100% 100% Ramsay Health Care (UK) Limited UK 100% 100% Ramsay Health Care UK Finance Limited UK 100% 100% Ramsay Health Care Holdings UK Limited UK 100% 100% Ramsay UK Properties Limited UK 100% 100% Independent British Healthcare (Doncaster) Limited UK 100% 100% Ramsay Diagnostics UK Limited UK 100% 100% Ramsay Health Care UK Operations Limited UK 100% 100% Ramsay Health Care Leasing UK Limited Guernsey 100% 100% Ramsay Générale de Santé SA* France 50.9% 50.9%
^ Entities included in the deed of cross guarantee as required for the class order * Ramsay Générale de Santé SA owns a number of subsidiaries, none of which are individually material to the Group

NOTES TO THE CONSOLIDATED FINANCIAL STATEMENTS FOR THE YEAR ENDED 30 JUNE 2017
101
V. OTHER INFORMATION (CONTINUED) 22. CLOSED GROUP Entities subject to class order Pursuant to Class Order 98/1418, relief has been granted to the entities in the table of subsidiaries in Note 21, (identified by ^) from the Corporations Act 2001 requirements for preparation, audit and lodgement of their financial reports. As a condition of the Class Order, these entities entered into a Deed of Cross Guarantee on 22 June 2006 or have subsequently been added as parties to the Deed of Gross Guarantee by way of Assumption Deeds dated 24 April 2008, 27 May 2010, 24 June 2011, 20 October 2015 and 17 December 2015. The effect of the deed is that Ramsay Health Care Limited has guaranteed to pay any deficiency in the event of winding up of a controlled entity or if they do not meet their obligations under the terms of overdrafts, loans, leases or other liabilities subject to the guarantee. The controlled entities have also given a similar guarantee in the event that Ramsay Health Care Limited is wound up or if it does not meet its obligation under the terms of overdrafts, loans, leases or other liabilities subject to the guarantee. The consolidated Income Statement and Statement of Financial Position of the entities that are members of the Closed Group are as follows: Closed Group 2017 2016 Consolidated Income Statement $000 $000
Profit from operations before income tax 585,595 519,414 Income tax expense (167,967) (150,440)
Net profit for the year 417,628 368,974
Retained earnings at the beginning of the year 980,325 839,921 Retained earnings adjustments for additions of entities into the class order - 1,625 Dividends provided for or paid (265,479) (230,195)
Retained earnings at the end of the year 1,132,474 980,325
Consolidated Statement of Financial Position ASSETS Current Assets Cash and cash equivalents 95,383 100,724 Trade and other receivables 599,330 573,281 Inventories 111,274 100,949 Prepayments 20,860 18,177 Other current assets 2,889 2,362
Total Current Assets 829,736 795,493
Non-current Assets Other financial assets 627,467 627,068 Investments in joint ventures 206,101 210,765 Intangible assets 1,076,893 1,082,584 Deferred tax asset 115,779 112,355 Property, plant and equipment 2,042,601 1,986,210 Prepayments 11,779 12,068 Derivative financial instruments 734 - Non-current receivables 37,129 23,939
Total Non-current Assets 4,118,483 4,054,989
TOTAL ASSETS 4,948,219 4,850,482
LIABILITIES Current Liabilities Trade and other payables 846,064 849,103 Interest-bearing loans and borrowings 2,711 30,129 Provisions 37,884 42,496 Derivative financial instruments 8,282 10,377 Income tax payable 15,463 18,357
Total Current Liabilities 910,404 950,462
Non-current Liabilities Interest-bearing loans and borrowings 1,321,540 1,345,962 Provisions 153,437 163,774 Derivative financial instruments 7,200 23,561
Total Non-current Liabilities 1,482,177 1,533,297
TOTAL LIABILITIES 2,392,581 2,483,759
NET ASSETS 2,555,638 2,366,723

NOTES TO THE CONSOLIDATED FINANCIAL STATEMENTS FOR THE YEAR ENDED 30 JUNE 2017
102
V. OTHER INFORMATION (CONTINUED) 22. CLOSED GROUP (CONTINUED) Closed Group 2017 2016 EQUITY $000 $000
Issued capital 713,523 713,523 Treasury shares (70,608) (88,844) Convertible Adjustable Rate Equity Securities (CARES) 252,165 252,165 Retained earnings 1,132,474 980,325 Other reserves 528,084 509,554
TOTAL EQUITY 2,555,638 2,366,723
23. PARENT ENTITY INFORMATION 2017 2016 Information relating to Ramsay Health Care Limited $000 $000
Current assets 1,102,747 1,064,190 Total assets 1,254,937 1,205,709 Current liabilities (19,246) (21,631) Total liabilities (19,246) (21,631) Issued capital (713,523) (713,523) Other equity (522,168) (470,555)
Total shareholders’ equity (1,235,691) (1,184,078) Net profit for the year after tax 285,333 216,008
As a condition of the class order (set out in Note 22), Ramsay Health Care Limited has guaranteed to pay any deficiency in the event of winding up of a controlled entity or if they do not meet their obligations under the terms of overdrafts, loans, leases or other liabilities subject to guarantee. 24. MATERIAL PARTLY- OWNED SUBSIDIARIES Ramsay Générale de Santé SA (formerly Générale de Santé SA) has a material non-controlling interest (NCI): This entity represents the French segment for management and segment reporting. Financial information in relation to the NCI is provided below: (a) Proportion of equity interest and voting rights held by non- controlling interests
Refer to Note 21 which discloses the equity interest held by the Ramsay Group. The remaining equity interest is held by the non-controlling interest. Voting rights for Ramsay Générale de Santé at 30 June 2017 are 51.5% (2016: 50.3%). The remaining interest is held by the non-controlling interest.
(b) Accumulated balances of non-controlling interests Refer to the Consolidated Statement of Changes in Equity
(c) Profit allocated to non-controlling interests Refer to the Consolidated Income Statement
(d) Summarised Statement of Profit or Loss and Statement of Financial Position for 2017 and 2016 Refer to Note 1. The French segment consists only of this subsidiary that has a material non-controlling interest.
(e) Summarised cash flow information
2017 $000
2016 $000
Operating 244,342 232,117 Investing (84,051) (354,245) Financing (61,851) 88,285
Net increase/(decrease) in cash and cash equivalents 98,440 (33,843)

ATTACHMENT 1 – RAMSAY HEALTH CARE LIMITED DIRECTORS & COMPANY SECRETARY FOR THE YEAR ENDED 30 JUNE 2017 OR THE YEAR EN 30 June 2016
103
Michael S Siddle Chairman Appointed 27/05/14 (Appointed as a Director 26/5/75)
Mr Michael Siddle was appointed as Chairman of the Company on 27 May 2014, having formerly been Deputy Chairman for 17 years and a founding director. He has built up significant knowledge of the business and the private hospital industry after starting with the Company in 1968. Mr Siddle has extensive experience in the management of private hospitals and has been integrally involved in Ramsay Health Care’s successful expansion through construction, mergers and acquisitions. He serves as a member of the Company’s Remuneration Committee and is Chair of the Nomination Committee.
Mr Siddle was a director of Prime Media Group Limited, one of Australia’s largest regional television and radio operators, from April 1985 to November 2015.
Mr Siddle is also a trustee of the Paul Ramsay Foundation. In addition to Ramsay Health Care Limited, during the last three years Mr Siddle has also served as a director of the following listed company:
Prime Media Group Limited (Retired November 2015)
Peter J Evans FCA Deputy Chairman Appointed 27/05/14 (Appointed as a Director 29/12/90)
Mr Peter Evans was appointed as Deputy Chairman of the Company on 27 May 2014, having formerly served as a Non-Executive Director since his appointment to the Board in 1990. Mr Evans began working with Ramsay Health Care in 1969. He is a Chartered Accountant who was in public practice for over 20 years with predecessor firms of KPMG. He has specialised in the financial management of hospitals and has had extensive experience in the health care field for 45 years. Mr Evans is Chairman of both the Company’s Audit and Risk Management Committees and is also a member of the Remuneration Committee.
Mr Evans is also a trustee of the Paul Ramsay Foundation and has been actively involved with several other charitable organisations over many years.
In addition to Ramsay Health Care Limited, during the last three years Mr Evans has also served as a director of the following listed company:
Prime Media Group Limited (Retired November 2014)
Craig McNally Managing Director & CEO Appointed 03/07/17
Mr Craig McNally was appointed Managing Director and Chief Executive Officer of Ramsay Health Care (Ramsay) on 3 July 2017, after serving seven years with Ramsay Health Care as Chief Operating Officer and 22 years prior to this in various roles including Head of Global Strategy and European Operations.
Mr McNally is one of Ramsay’s longest serving Executives having commenced with the Company in 1988. He was initially employed as a Hospital Executive in Ramsay’s Sydney-based mental health facilities, before taking over divisional responsibility for acute medical and surgical hospitals in the early nineties.
In 1995, he became Ramsay’s Head of Strategic Development, and for the last two decades has been responsible for the development and implementation of Ramsay’s growth strategy including brownfield expansions, international market assessments, mergers and acquisitions and new business strategies. As the Company’s chief negotiator and deal-maker he has been at the forefront of all the major acquisitions and deals completed by Ramsay Health Care. His unique ability to assess the opportunities and risks associated with new business ventures and to evaluate their ‘strategic fit’, as well as his sound judgement and insight, has ensured the Company’s successful growth both domestically and internationally.
In his role as head of Ramsay’s UK, European and Asian businesses, Mr McNally has been responsible for leading these teams through the challenging acquisition and merger phases and ensuring their successful integration with Ramsay Health Care and adoption of The Ramsay Way culture.

ATTACHMENT 1 – RAMSAY HEALTH CARE LIMITED DIRECTORS & COMPANY SECRETARY FOR THE YEAR ENDED 30 JUNE 2017 ENDED 30 June 201
104
Bruce R Soden B.Comm CA FAICD Group Finance Director Appointed 02/01/97
Mr Bruce Soden Group Finance Director and Chief Financial Officer of the Company, a role he has held since early 1997. Mr Soden is responsible for all financial operations and corporate governance functions of the business including treasury, banking and finance, legal and company secretariat, investor relations and group accounting and taxation. Over his extensive time with the Group, Mr Soden has led the company’s capital management strategy through many critical milestones including the acquisition of the privatised Department of Veteran Affairs hospitals Hollywood (1994) and Greenslopes (1995), Ramsay’s listing on the ASX in 1997, the company-transforming acquisition of Affinity Health Care in 2005, each of the international mergers and acquisitions and all debt and equity raisings.
Since listing and under Mr Soden’s financial leadership, Ramsay’s enterprise value has grown from under $400 million in 1997 to approximately $17 Billion currently.
Mr Soden is also a member of the Board’s Risk Management Committee.
Mr Soden is a Director of Ramsay Générale de Santé, a publicly listed hospital operator in France in which Ramsay Health Care (UK) Limited has a controlling interest, and he is also a Director of Ramsay Sime Darby Health Care, the Company’s joint venture with Sime Darby.
Prior to being appointed Group Finance Director in 1997, Mr Soden was Finance Director and Chief Financial Officer of Ramsay’s operating entities. Prior to that he spent four years based in New Orleans as Director and Senior Vice President of Ramsay Health Care Inc, a listed US health care company.
Before joining Ramsay in 1987, Mr Soden was a financial consultant for a major global accounting firm for 11 years.
I Patrick S Grier AM MAICD Non-Executive Director Appointed 01/07/08
Mr Pat Grier has been employed as an executive in the private health care industry for more than 25 years. In June 2008, he retired as Chief Executive Officer of Ramsay Health Care Limited after joining the Company in 1988 and serving at the helm since 1994. During this time, he oversaw the successful float of Ramsay Health Care Limited on the Australian Stock Exchange in 1997 and growth in annual revenues from approximately $200 million to more than $3 billion (2008 financial year). He oversaw a series of successful transforming acquisitions which saw Ramsay Health Care Limited grow to become one of Australia’s most respected and largest private hospital operators.
Prior to joining Ramsay, he was a Hospital CEO with Hospital Corporation Australia.
He has served as both President and Chairman of the Australian Private Hospitals Association for over 10 years and sits on a number of industry committees. He has been one of the main architects of the balanced health care system in Australia and for his contribution to the health care sector was awarded the Order of Australia. Mr Grier served as an Executive Director on the Ramsay Health Care Board for 12 years and from 1 July 2008 continues as a non-executive Director.
Mr Grier was a member of the Skin Cancer Network Advisory Board. He was previously Chairman of the Opal Health Care.
In addition to Ramsay Health Care Limited, during the last three years Mr Grier has also served as a director of the following listed companies:
Estia Health Limited (Appointed November 2014)
Prime Media Group Limited (Retired November 2014)

ATTACHMENT 1 – RAMSAY HEALTH CARE LIMITED DIRECTORS & COMPANY SECRETARY FOR THE YEAR ENDED 30 JUNE 2017 ENDED 30 June 201
105
Rod H McGeoch AO LLB MAICD Non-Executive Director Appointed 03/07/97
Mr Rod McGeoch is a past Chairman of Corrs Chambers Westgarth, a leading Australian law firm and has been a solicitor for 40
years. He was Chief Executive of Sydney's successful bid for the 2000 Olympic Games and served on the Sydney Organising
Committee for the Olympic Games until November 1998. Mr McGeoch is also a past Chairman of SKYCITY Entertainment Group
Limited.
Currently Mr McGeoch is Chairman of Vantage Private Equity Growth Limited, Chairman of Chubb Insurance Australia Limited,
BGP Holdings Plc Malta and is also Deputy Chairman of the Sydney Cricket & Sports Ground Trust. Mr McGeoch also holds a
number of honorary positions. In 1990 he was awarded Membership of the Order of Australia for services to Law and the
Community and in 2013, also awarded an Officer of the Order of Australia for distinguished service to the Community through
contributions to a range of organisations and to sport, particularly through leadership in securing the Sydney Olympic Games. He is
also a director of Destination NSW. In January 2013, Mr McGeoch was appointed Honorary Consul General of Luxembourg in
Australia.
In addition to Ramsay Health Care Limited, during the last three years Mr McGeoch has also served as a director of the following listed company:
SKYCITY Entertainment Group Limited (Appointed September 2002) (Resigned October 2014)
Kerry C D Roxburgh BCom MBA MSAFAA
Non-Executive Director
Appointed 03/07/97
Mr Kerry Roxburgh is a Practitioner Member of the Stockbrokers and Financial Advisers Association of Australia.
He is currently the Lead Independent non-executive Director of Ramsay Health Care Ltd, and a non-executive director of the
Medical Indemnity Protection Society and of MIPS Insurance Ltd.
He is Chairman of Eclipx Group Limited and of Tyro Payments Ltd.
In 2000 he completed a 3 year term as CEO of E*TRADE Australia (a business that he co-founded in 1997), becoming its non-
executive Chairman until June 2007, when it was acquired by the ANZ Bank. Prior to this appointment he was an Executive Director
of Hong Kong Bank of Australia Group (now HSBC Australia Ltd) where for 10 years from 1986, he held various positions including
Head of Corporate Finance and Executive Chairman of the group’s stockbroker, James Capel Australia. Until 1986 Mr Roxburgh
was in practice for more than 20 years as a Chartered Accountant.
Until 31 December 2015, he was Chairman of Tasman Cargo Airlines Pty Ltd and Deputy Chairman of Marshall Investments Pty.
Ltd.
In addition to Ramsay Health Care Limited, during the last three years Mr Roxburgh also served as a director of the following listed
companies:
Eclipx Group Limited (Appointed March 2015) (Currently Chairman)
Charter Hall Limited (Retired November 2014)
ATTACHMENT 1 – RAMSAY HEALTH CARE LIMITED DIRECTORS & COMPANY SECRETARY FOR THE YEAR ENDED 30 JUNE 2017 ENDED 30 June 201
106
Patricia Akopiantz BA MBA
Non-Executive Director
Appointed 28/04/15
Ms Patricia Akopiantz has over 30 years’ experience in consumer-facing businesses in Australia and overseas. She has been a
non-executive director for the last 15 years and has served on numerous boards including Coles Group, AXA Asia Pacific and
Energy Australia.
Previously, she was with McKinsey & Company where she helped lead the Retail and Consumer Goods Practice and advised a
range of clients on strategy. Her executive career included roles as General Manager Marketing at David Jones and Vice President
for an American apparel manufacturer. She has an MBA from Harvard Business School.
In addition to Ramsay Health Care, Ms Akopiantz currently serves as the Chairman of AMP Bank Limited and as a non-executive
director on the Board of AMP Limited. She is also Chairman of AMP’s People and Remuneration Committee and a Member of AMP
Limited’s Nominations and Governance Committee and Risk Committee. Ms Akopiantz is also on the Board of the Belvoir Theatre
Company.
In addition to Ramsay Health Care Limited, during the last three years, Ms Akopiantz has also served as a director of the following
listed company:
AMP Limited (Appointed March 2011)
Margaret Seale BA FAICD
Non-Executive Director
Appointed 28/04/15
Ms Margaret (Margie) Seale is a Non-Executive Director and serves as a member of the Risk Management Committee. Ms Seale
also has current directorships at Telstra Corporation Limited, Bank of Queensland Limited and Scentre Group Limited. She is a
member of the Audit Committee for Telstra, a member of each of the Technology and Remuneration Committees for Bank of
Queensland and a member of each of the Audit and Risk and Human Resources Committees at Scentre Group.
Ms Seale is a professional non-executive director with 25 years’ experience in senior executive roles in Australia and overseas in
the global publishing, health and consumer goods industries, doing business in Asia and across multinational markets.
In her most recent executive role, Ms Seale was Managing Director of Random House Australia and New Zealand and President,
Asia Development for Random House globally. She stepped down from Random House in November, 2012 but remained on the
board until 2016, including a period of time as Non-Executive Chair of the newly formed Penguin Random House Australia and New
Zealand. During her time as Managing Director, the publishing industry transitioned from an entirely print world to a mixed print and
digital environment. Prior to this she held national sales and marketing roles in a number of industries.
In 2015 Ms Seale founded philanthropic literary travel company, Ponder & See.
Ms Seale was educated at the University of Sydney.
In addition to Ramsay Health Care Limited, during the last three years, Ms Seale has also served as a Director of the following
listed companies:
Telstra Corporation Limited (Appointed May 2012);
Bank of Queensland Limited (Appointed January 2014); and
Scentre Group Limited (Appointed February 2016).

ATTACHMENT 1 – RAMSAY HEALTH CARE LIMITED DIRECTORS & COMPANY SECRETARY FOR THE YEAR ENDED 30 JUNE 2017 ENDED 30 June 201
107
John D C O'Grady LLB FAICD Group General Counsel & Company Secretary Appointed 23/01/07
Mr John O’Grady has a background as a corporate and commercial lawyer and is admitted to practice in New South Wales. He is a Fellow of the Australian Institute of Company Directors (AICD). He has served as a non-executive director of a number of boards, including the Defence Housing Authority (DHA) and the Major Events Board in South Australia. Prior to joining Ramsay in January 2007, he was in private practice with a strong corporate governance focus and experience in contract negotiation, finance and corporate law.
Mr O’Grady heads up the Global Legal team and has responsibility for coordinating Risk Management throughout the Group. He also provides input into all major acquisitions of the Ramsay Group globally and advises the Board and Executive on corporate governance.
Mr O’Grady also has Group responsibility for all company secretarial functions, including liaising with the ASX, ASIC and other regulatory bodies.