rainfed agriculture in a semi-arid tropical climate
TRANSCRIPT

RAINFED AGRICULTURE IN A SEMI-ARID TROPICAL CLIMATE
Aspects of land- and watermanagement for red soils in India
India's great potential for more food production is in its drylands.
Ch. Krishnamoorthy, S.L. Chowdhury and E.D. Spratt (1974)
0000 0078

Promotoren: ir. L. Horst, hoogleraar in de irrigatie
dr.ir. W.H. van der Molen, hoogleraar in de agrohydrologie

(^fO©^\, L02i
F. P. Huibers
RAINFED AGRICULTURE INASEMI -ARID
TROPICAL CLIMATE
Aspects of land-and watermanagement for red soils in India
LAîOw.'.-J V» KOt; » .-.iCliOGL WAGEN If« GEN
PROEFSCHRIFT
ter verkrijging van de graad van doctor in de landbouwwetenschappen, op gezag van de rector magniticus, dr. C.C. Oosterlee, in het openbaar te verdedigen op vrijdag 22 maart 1985 des namiddags te vier uur in de aula van de Landbouwhogeschool te Wageningen
\&il' ^<U OM^-^3

Voor Ingrid,
Loek en Stefan

HNOf^O^iT)«^
3 R O P O S I T I O N S
The conclusion that "55 - 70% of the seasonal rainfall on Alfisols either runs off or drains to deeper layers" is incorrect. S.A. El-Swaify, T.S. Walker and S.M. Virmani (1984). Dryland management alternatives and research needs for Alfisols in the semi-arid tropics: 14.
By including seeders with precision metering as attachments to the bullockdrawn wheeled tool carrier, as suggested by ICRISAT, an unnecessary, troublesome and expensive element is added to an otherwise practical unit.
Systems indicated as "reduced tillage" and "no-tillage", as developed in North-American agriculture, suggest being simple and energy saving compared to "conventional tillage". In reality they belong to the most highly developed and capital intensive agricultural systems and are of very limited use to developing countries.
In the sphere of applied research, the collection, adaptation and combination of available know-how may often lead to a faster, cheaper, better and more widely applicable result, compared to the initiation of new experimentation. In this respect international agricultural research institutes have an important role to play.
Considering the large number of widely differing interpretations of the terms "farming system" and "farming systems research" it is clear that the use of such terms is more often based on opportunism than on a scientific approach.
In situations where the crop cover does not extend over the entire soil surface it is necessary to model separately the processes of transpiration and evaporation. Jury, W.A. (1979). Water transport through soil, plant and atmosphere. In A.E. Hall, G.H. Cannell and H.W. Lawton (eds.): Agriculture in semi-arid environments.
In the semi-arid tropics, probably more than in other climatic regions, irrigation water does not have the scarcity value it should have on the basis of socio-economic considerations. Distortions may be caused by technical reasons, as well as by local elitism and political interests.
In low-input agriculture small-holders are, in general, the most efficient users of resources. Development plans should take more note of this.
In general, energy can be supplied more efficiently and at lower costs when it is decentrally generated. It is in the interest of many developing countries if the involved technology, required by such a strategy, is further developed and adapted.
10. Inkomende telefoongesprekken krijgen vaak ten onrechte een voorkeursbehandeling.
P. Huibers. Rainfed agriculture in a semi-arid tropical climate. Aspects of land- and watermanagement for red soils in India. Wageningen, 22 March 1985.

PREFACE
On the basis of an agreement between the Government of the Netherlands
(Directorate General for International Co-operation, DGIS) and the Inter
national Crops Research Institute for the Semi-Arid Tropics (ICRISAT), I
worked as an associate expert within the Farming Systems Research Program
of ICRISAT in Hyderabad, India, for a period of four years. This has given
me the opportunity to get acquainted with the semi-arid region of India,
its people, the institute and the research on land- and watermanagement.
After this period, both DGIS and the Agricultural University of Wageningen
enabled me to proceed with the subject of land- and watermanagement and to
compile and complete my research with the writing of this thesis. For all
this support I am very thankful.
The idea to write this thesis was conceived during the early part of my
research work at ICRISAT. It started as an initiative of Dr. B.A. Krantz,
at that time the head of the Farming Systems Research Program, and was
supported by Dr. J. Kampen, then leader of the Land- and Watermanagement
Subprogram. At that moment, the decision to proceed was positively in
fluenced by the conception that it could result in the incorporation of
aspects of rainfed agriculture into the study "tropische cultuurtechniek"
at the Agricultural University Wageningen, which was historically almost
exclusively oriented towards irrigated agriculture. I am glad to note that
indeed the interest for and activities on this subject have increased
tremendously in recent years. To a large extent this should be attributed
to the activities of a group of students who suggested the introduction of
a course element on rainfed agriculture.
I appreciate the role of my promotors. At an early stage, contact was made
with prof. ir. L. Horst, who showed great interest in my work and since then
has continued to support me, also by enabling me to work at his depart
ment. His suggestion to request prof. dr. ir. W.H. van der Molen to take part
as promotor proved to be very valuable. Van der Molen's interest in the

VI
subject and his long-standing experience as promotor has helped me much to
improve on earlier drafts of this thesis.
During the period of experimentation, I have depended on many persons (too
many to name individually) who I would like to thank for their collabora
tion. Among the scientists of the Land- and Watermanagement Subprogram I am
especially obliged to Mr. K.L. Srivastava, who for all years since 1981
functioned as a pleasant and efficient contact person. I would like to
thank all field assistants I worked with, especially Mr. P. Kistaiah, the
late Mr. Y. Buchi Reddy and Mr. L. Nageshwara Rao. My appreciation also
goes to Dr. M.B. Russell, with whom I had extended discussions on the
subject. I am grateful to Dr. S.M. Miranda, head of the Land- and Water-
management Subprogram between 1980 and 1982, for his support and hospita
lity during my later visit to ICRISAT.
I further acknowledge the technical support and advices of Mr. S.K. Sharma
and his crew, the co-operation of Mr. S.R. Patel, who worked with me for
some time and the experimental work done by ir. S.J. Weststeyn during the
1982 rainy season on which results I also draw.
While writing this thesis I have made fruitful use of comments and help
given by ir. N.V. Vink, prof. dr. ir. H. Luning, ir. W.B. Hoogmoed and
others. I am thankful to them.
Much technical work is to be done before the final printing of a thesis.
Mrs. F. Jacobs-Wien did a seemingly endless job in typing most of the
drafts, Mrs. J. Millican took care of the English correction, while
Mr. F. van Ernst drew the figures. My thanks to all of them. For the final
typing I am obliged to Mrs. M. van Hunen who worked hard to finish in
time.
I feel grateful to my mother and my late father who valued education high
ly-
I have appreciated the interest shown by many.
Particularly I am indebted to Ingrid for her continuing encouragement and
help.

VII
CONTENTS PAGE
CHAPTER 1 INTRODUCTION
CHAPTER 2 RAINFED AGRICULTURE: ITS OCCURRENCE AND
DEVELOPMENT
2.1.
2.2.
2.3.
2.4.
2.5.
2.6.
2.7.
2.8.
Agriculture: Its Early Development 7
Agricultural Development in Modern Times 8
Soil and Water 9
Irrigated Agriculture 10
Irrigated versus Rainfed Agriculture 10
Rainfed Agriculture and Erosion 12
Land- and Watermanagement in Rainfed Agriculture 13
The Watershed Approach 13
CHAPTER 3 THE SEMI-ARID TROPICS AND ITS AGRICULTURE 15
3.1.
3.2.
3.3.
3.4.
Definition of the Semi-Arid Tropics (SAT) 15
Description of the Red Soils 19
Common Cropping Systems 21
The Water Component: Availability, Drainage,
Irrigation 26
CHAPTER 4 WATER-MANAGEMENT SYSTEMS IN ARID- AND SEMI-ARID
AREAS 28
4.1.
4.2.
4.2.1.
4.2.2.
4.2.3.
4.2.4.
4.3.
General
Systems of Water Diversion and -Collection
Water Harvesting
Agricultural Water Harvesting
Runoff Farming
Runoff Collection
Techniques of in situ Water Conservation
28
29
31
32
33
34
35

VIII
CONTENTS (cont.) PAGE
4.4.
4.5.
Crop Management in Semi-Arid Tropical Agri
culture 36
Appraisal of Watermanagement Systems for Red
Soils 37
CHAPTER 5 THE WATER MOVEMENT IN RAINFED AGRICULTURE 43
5.1.
5.2.
5.2.1.
5.2.2.
5.3.
5.3.1.
5.3.2.
5.3.3.
5.4.
5.4.1.
5.4.2.
5.4.3.
A Flow Chart for Water Movement 43
Rainfall Characteristics of Hyderabad, India 48
The Rainfall Distribution 49
Intensities of Rainstorms 52
The Profile Water 53
Infiltration of Red Soils 53
Evapotranspiration 58
Crop-Available Profile Moisture 60
Excess Rainfall and Depression Storage 62
Micro-Depressions 64
Mini-Depressions 66
Macro-Depressions 67
CHAPTER 6 APPROACHES TO INFLUENCE THE WATER-BALANCE AND
THEIR EFFECTS 68
6.1.
6.1.1.
6.1.1.1.
6.1.1.2.
6.1.1.3.
6.1.2.'
6.1.3.
6.1.4.
6.2.
Influencing the Profile Water Balance 68
Infiltration Inducement 69
Primary Tillage and its Effect on Infiltration 70
Secondary Tillage and its Effect on Infiltration 73
Maintaining Infiltrability through Crop Cover
and Mulches 77
Reducing Evapotranspiration 81
The Effects of the Surface Configuration on
Soil Moisture and Plant Establishment 82
Soil Moisture at Start of Cropping Season 84
Influencing the Field Water-Balance 85

IX
CONTENTS (cont.) PAGE
6.2.1.
6.2.2.
6.2.3.
6.2.4.
6.3.
6.3.1.
The Effects of Depression Storage 86
The Effect of the Surface Configuration of the
Field 89
Hydraulic Properties of Different Furrow Shapes 92
The Effects of Size and Shape of the Field 96
Influencing the Watershed Water-Balance 97
Contour-Bunding 98
CHAPTER 7 EROSION AND SOIL LOSS OF RED SOILS 103
7.1.
7.2.
7.3.
7.4.
7.5.
Definition and Description 103
Occurrence of Erosion in Red Soils 105
Qualitative Aspects of Soil Erosion 106
The Influence of Field Characteristics on
Erosion and Soil Loss 109
Agronomic Practices to Reduce Erosion and Soil
Loss 112
CHAPTER 8 RUNOFF COLLECTION 113
8.1.
8.2.
8.3.
8.4.
8.5.
8.6.
General 113
Reservoirs: Design, Seepage and Evaporation 113
Location of Reservoir 115
Use of Collected Water 117
Availability of Water over Time 119
Construction of Reservoirs 123
CHAPTER 9 ASPECTS OF WATERSHED DEVELOPMENT AND MANAGEMENT 126
9.1.
9.2.
9.3.
9.4.
General
The Zone of Recharge
The Zone of Discharge
The Agricultural Watershed
126
128
129
130

CONTENTS (cont.) PAGE
9.4.1.
9.4.2.
9.4.2.1.
9.4.2.2.
9.4.2.3.
9.4.2.4.
9.4.3.
9.5.
General 130
Options for Development of an Agricultural
Watershed 131
General 131
Option 1: Protection of the Agricultural Water
shed 132
Option 2 : Development of the Agricultural Water
shed to Increase its Productivity 133
Tillage and Crop-management 135
Execution of Development Plans 135
Concluding Remarks 137
CHAPTER 10 SUMMARY 139
CHAPTER 11 SAMENVATTING 144
APPENDICES
1. Profile Description of Typical Shallow and
Medium-Deep Alfisol.
2. Calculation Procedure of Profile Water Lines.
3. Frequency of Occurence of Different Storm-Sizes
over Time for Hyderabad, India.
4. Infiltration Measurements.
5. The Measurement of Surface Roughness.
6. The Calculation of Surface Storage.
7. The Animal-Drawn Wheeled Tool Carrier.
8. Observations on the Effects of Two Methods for
Primary Tillage.
-9. Influence of Surface Configuration on Runoff and
Soil Loss.
150
152
154
155
157
158
160
162
163

XI
CONTENTS (cont.) PAGE
10. The Effects of Secondary Tillage on Runoff and
Surface Roughness. 165
11. The Effects of Surface Configuration on Soil Moisture
and Plant Establishment. 169
12. Observations on the Effect of Depression Storage
on Runoff. 171
13. Hydraulic Measurments on Differently Shaped
Furrows. 172
14. The Water-Balance near a Contour-Bund. 175
15. The Influence of Contour-Bunds on Crop Yield. 178
REFERENCES 181
GLOSSARY 191
CURRICULUM VITAE 192
ABSTRACT 193

- 1 -
CHAPTER 1 INTRODUCTION
For millions of people in semi-arid tropical regions rainfed agriculture
means a harsh fight for survival. They rely on agricultural systems that
are generally traditionally organised. For crop-growth, the local precipi
tation is the only source of water, and its availability further depends on
the moisture acceptancy and crop-available storage capacity of the soil
profile. Rainfed agriculture differs from irrigated agriculture where,
through a more or less man-controlled transport and distribution of water,
its availability for crop-growth is secured to a certain level. Likewise it
differs from dry farming, (common for some arid regions), where rainfed
crop production is no longer possible (UNESCO, 1977), but where techniques
are used that concentrate water in time or in place (Chapter 4), to enable
local crop production.
Contrary to other systems, rainfed agriculture completely depends on the
local precipitation as water source and, as in dry farming, the profile to
store it. But the high variability of rainfall, typical of a semi-arid
tropical climate results in the occurrence of low rainfall years and dry
spells during the rainy season (Section 5.2.), affecting crop-growth adver
sely.
The semi-arid tropical zones cover part or all of 48 less-developed coun
tries. Extended areas can be found in Africa, north and south of the
Sahara, and in India (Ryan and Binswanger, 1980). Among the developed
countries Australia obviously has an extended semi-arid tropical region. It
is useful to differentiate between the semi-arid tropical regions of the
world on the basis of their population density (table 1.1.), depicting
India as by far the most densely populated part.
But, apart from the difference in population pressure, there are differ
ences in farming systems, the latter defined as the entity of available

Table 1.1. Area and population of some semi-arid tropical regions
Region
Asia . (India+' Africa South of Australie
+) Major
Saha
irri
ra
Geographical Area
1,000 km2
2,200 1,700
11,500 1,920
gation schemes exc luded
Rural Population
million
300 260
157 1
Population Density
inhabitants/km2
136 153)
14 < 1
Adapted from Ryan and Associates (1975).
technology, the decisions the farmers make and the circumstances that
influence these.
In the African semi-arid tropical zones, for example, there was, until
recently, an abundance of land. In many locations, availability of land is
no major constraint even nowadays. Much of the area is used for grazing and
animal husbandry forms an important resource. Arable cropping mostly takes
place at a low level of technology based on the traditional system of
shifting cultivation that used to be an adequate technique to maintain
reasonable fertility and to provide soil protection.
In India livestock forms a different and less important component of the
farming system. Most farmers do own some animals for the sake of milk-
production, draft and manure. The relatively high population has always
forced the farmers to follow a system of farming in which all suitable land
was cropped yearly. The steep increase of the population in the course of
this century, caused new areas to be brought under cultivation, bringing
about an inbalance between forests and cultivated land and an increase in
the cereal component at the expense of legumes, resulting in a depletion of
the soil nutrients and a poorer feed for draft-animals (Krishnamoorthy,
1974).
In Australia (Bowden, 1979), an agricultural minority produces for a non-
agricultural majority. Such a situation allows for a farming system based
on mechanisation and scientific usage and exploitation of the environment.
An important characteristic of such a system is the presence of infra
structure and buffer capacity of the non-agricultural sector that is able
to support the agricultural sector during periods of stress.
Much of the semi-arid tropical zone of the world is inhabited and taken
into agricultural use. Historically, this can be understood by the rela-

- 3 -
tively favourable living conditions of these areas, compared to the more
humid areas, infested by vector-borne diseases and the more arid areas that
by their water shortage lacked the conditions to produce food.
Per hectare production levels in the semi-arid tropical areas are generally
low, which is not only related to the frequently sub-optimal availability
of water. A range of economic and social factors, like an increased food
demand and the introduction of cash crops (Mascarenhas, 1968, cited by
Jackson, 1977) have forced the farmers in many regions to leave their
traditional systems which were much more well-oriented towards maintaining
fertility and also produced surplus as relief for bad rainfall years
(Krishnamoorthy). At present, many such areas are characterized by frequent
food shortage and poverty, forcing producers towards an attitude oriented
at risk avoiding and decreasing their means to invest.
Traditional agriculture, based on a long history of experience and decision
making is, as Schultz (1964) explains, in a state of equilibrium, in which
the (traditional) factors of production available are used as efficiently
as possible under the prevailing circumstances. This idealized situation,
however, hardly exists today. Although much of the agriculture still de
pends on traditional knowledge, social values and inputs, other circum
stances are disrupting this state of equilibrium more and more. Bowden
(1979) even states: "None of the present dryland (rainfed) farming systems
are in balance with the environment as they deplete more and more of the
resource base". This remark deserves our full attention. Leaving aside the
question whether or not all present farming systems should be blamed, it is
true that, at an alarming rate, land has been and still is being converted
into arable fields that do not have the proper characteristics for this
use, either by its topography or its physical or chemical properties; and
that traditional farming systems, proven to be able to maintain the soil as
natural resource, have been replaced by systems that deplete it under
pressure of the need for more production; and that techniques have been
introduced into traditional systems without proper care or knowledge of
their long-term consequences on the environment.
People do need food and additional production to take care of their other
basic needs like clothing, housing, medicare and education. It is their
right to work the land to try to get this. It is painfull to see that,
while making use of this right, the natural resources are being over-
stressed, resulting is declining productivity.
Much of the cultivated land in the semi-arid tropics is vulnerable to
degradation. This is especially true for the sandy and sandy loam soils,

- 4 -
generally called the red soils, the most widespread soil type in the semi-
arid tropics (Sanchez, 1976), and on which soil-type I want to concentrate.
Red soils have a low aggregate stability, resulting in slaking of the
aggregates upon wetting, an easy formation of a crust upon drying, com
paction of the top layer and a flattening of the surface when exposed to
rainfall. These processes reduce the permeability of the topsoil and reduce
the capacity of surface storage. The consequent surface runoff causes high
levels of erosion, bringing down the useful profile depth and fertility.
Over the years this results in poorer plant growth, meaning lower yields
and even less protection against the raindrop impact. In this spiral of
events the soil and water are important factors. And water is clearly the
least predictable, sometimes being short, affecting crop-growth, sometimes
in excess, acting as a threat to the valuable soil and soil-fertility.
With annual rainfall amounts from roughly 500 mm to more than 1,000 mm
sufficient water seems to be available for reasonable to good yields of
most crops (the actual water requirements of most crops are much lower
(Hall et.al., 1979)). Even the high level of potential evaporation in this
climate could hardly counteract this, as water losses through direct evapo
ration are relatively low during the rainy season due to cloudiness, re
duced temperatures, early topsoil drying and protection by the vegetative
cover. Other characteristics of the rainfall, however, its variability over
the years, its high intensity and its uneven distribution over the season,
exert a negative influence on the water availability, and are most pro
nounced for red soils. Rainstorms with intensities exceeding the infiltra-
bility cause the build-up of free water on top of the soil surface. Apart
from a generally small amount of water that is caught in surface depress
ions, the rest of the water will run off and be lost for the crop. As a
contrast to the generally high infiltrability of sandy soils, the actual
infiltrability of the red soils can be low and frequently below rainfall
intensities, because of the slaking of the surface layer. Prolonged dry
spells affect crop growth if insufficient moisture is stored in the rooted
profile for the crop to draw from. Again, the red soils should be consid
ered as problem soils as their depth is frequently low as is their moisture
retention capacity.
Against these negative characteristics, positive ones can also be placed.
The low water retention capacity causes a deeper infiltration of small
amounts of rain, which, in specific circumstances, could allow for a faster
availability of water in the rooted part of the profile. It also reduces
the total amount of water that is lost by direct evaporation. Red soils
have the further advantage that they permit an early access to the field
after rain, being easy to work when moist.

- 5 -
As indicated earlier, the circumstances that cause the generally low level
and instability of production are manifold and complex. Some of them are
related to the environmental conditions, others are man-made. And although
it clearly is not just the water availability that determines the farmer's
destiny, it can be stated that, aiming at improving production in the
present situation, an important approach would be to try to both secure a
better availability of water throughout the growing season as well as to
make the most efficient use of it. For the latter, crop adaptation, -rota
tion and -management are important in reaching these goals, as they have
always been used by the farmers of the semi-arid tropics. Present day know
ledge of breeding techniques and of fertilization and plant protection only
add to their potentials.
In the field of land- and watermanagement a contribution could be made in
providing the necessary techniques to improve the water availability
through reducing water losses, through increasing the system's water stor
age capacity and through transfer of water in place or time. It could also
improve the soil-plant environment by taking care of good drainage and
allowing for proper and timely tillage. Besides this, activities on land-
and watermanagement include design and management measures to protect the
soil against degradation by erosion and the provision of an appropriate
infrastructure, supportive to agricultural activities.
Among the research institutes that concentrate on the improvement of rain-
fed agriculture in the semi-arid tropics is the International Crops
Research Institute for the Semi Arid Tropics with headquarters near
Hyderabad, India, from here onwards referred to as "ICRISAT". Part of its
efforts are concentrated around the crop improvement and crop-related
programmes, having a special mandate for the improvement of Sorghum, Pearl
Millet, Groundnut, Chickpea and Pigeonpea, (ICRISAT, 1977), all crops
typically grown in the semi-arid tropics and, internationally, mostly
disregarded before. Besides this, ICRISAT has a strong Farming Systems
Program as well as a Socio-economic and a Training Program.
Evidently, although ICRISAT has set the efforts for improving rainfed
agriculture in the semi-arid tropics in a concentrated and world-wide
context, national reasearch organisations have preceded it and still are
major contributors in many countries, mostly focussing their attention on
adaptive research. For the Indian situation the All India Co-ordinated
Research Project on Dryland Agriculture (AICRPDA) should be mentioned,
representing a nationwide chain of research centres of which the first
started work over fifty years ago.

Within the Farming Systems Research Program of ICRISAT attention has been
concentrated for many years on research into improvement of the management
of the deep Vertisols. A system has been evolved that includes the use of
improved varieties, fertilizer, bullock-drawn equipment and land manage
ment. The system has great potential for increasing food production, at the
same time reducing erosion, for many parts of the semi-arid tropics. Al
though a range of constraints, most of them in the sphere of farmer's group
action and credit facilities still have to be solved, the envisaged ap
proach deserves detailed evaluation at a regional level.
The concentration of research attention towards the Vertisols, at the same
time obscured management problems that are more specific for the red soil
areas. One might say that research was mostly climate oriented rather than
soil oriented. It was only later that it was realized that the red soils
management in the climatic conditions of the semi-arid tropics would possi
bly need a different research approach.
In this presentation I want to give such an approach, viewed from the
possibilities of influencing the availability of water under the climatic,
socio-economic and topographical conditions encountered in many of the red
soils areas of India. It is placed in the context of more general as well
as historical techniques for water management, for which the applicability
to the red soil areas is discussed.
Research data in this presentation originate mainly from my work at
ICRISAT-station and some of its village research locations in India. In the
Farming System Research Program and, more specifically, the Land- and
Watermanagement subprogram to which I was assigned, research is done wher
ever possible in an integrated way. This also means that individual re
searchers can frequently make use of each other's findings and observa
tions, an approach on which I also draw. Research aimed at improving rain-
fed agriculture is no field for individuals, but does require close co
operation and the understanding of many disciplines. This seems most true
if research is oriented at aspects of land- and watermanagement, which are
always parts of a more complex system, and are difficult to separate from
it. This presentation, therefore, should also be seen as a synthesis of
ideas, observations, measurements, options and discussions, drawn from many
people; for the way in which they are used here, I certainly bear the
responsibility.

- 7 -
CHAPTER 2 RAINFED AGRICULTURE: ITS OCCURRENCE AND DEVELOPMENT
2.1. Agriculture: Its Early Development
In its simplest form, agriculture is an activity to produce food. It is a
technique in which a single or a few types of plants are nursed on a piece
of land, limited in area, which is prepared for it. The beginnings of
agriculture are thought to date back to about 10,000 years B.C. (Reed,
1977). The scale of hypotheses on the driving force for man to shift from
hunting and gathering to agriculture were reviewed by Cohen (1977), who
concluded that this change could only be accounted for by assuming that
hunting and gathering populations had exhausted all possibilities for
increasing their food supply within the constraints of their life-style. If
so, it can be understood that, as Lawton and Wilke (1979) state, a "surpri
sing number of early agricultural economies developed in drier regions of
the world".
While primitive agriculture was solely oriented towards production for own
survival, a change occurred at the time mean production started to exceed
food requirements. This happened in dry areas where agriculture could make
use of additional water, brought to the fields through controlled or uncon
trolled means (Section 4.1.). Trading the excess yield, and changing pro
duction patterns to include non-food crops, made agriculture much more of
an enterprise. Optimizing production became more and more important and
historic societies with a relative advantage in agricultural production,
could develop important political powers. The greater freedom of diseases
in semi-arid areas compared to the more humid zones, together with a better
diet, were probably the cause of more powerful political entities in these
regions than elsewhere, with higher population densities (Bowden, 1979).
Apart from its role as food producer and its economic importance, agricul
ture should be seen as a part of the ecological environment. This aspect

tends to manifest itself as a longer term relation, as improvements of or
damages to the environment are expressed in changes of net benefits in
production mostly only after years or tens of years. Agriculture changed
the natural environment through overgrazing by domesticated animals, clear
ing of forests, introduction of alien weedy species, soil erosion and the
destruction of native fauna. Inherent in the system is a higher but uncer
tain production level, variable over the years, as yields depend on weath
er, weed competition, plagues and diseases.
Agricultural activities could even affect the pure existence of the soci
ety. Referring to a publication of Lowdermilk (1953), Hudson (1971) remarks
that "studies on the effect of erosion on early civilizations have shown
that a major cause of the downfall of many flourishing empires was soil
degradation".
2.2. Agricultural Development in Modern Times
Attention given by governments in modern times to agricultural development
differs. It is in turn intensively supported or largely neglected. Invest
ments in agricultural infrastructure generally pay-off slowly, particularly
if development projects include long term protection of the production fac
tors soil and water. A faster recovery of the capital only proves possible
through a drastic change in the traditional production pattern, which very
often disrupts the social, economic and/or ecological equilibrium of the
existing form of agriculture. The consequences of this are not always
foreseen or understood.
A slower, un-forced development can also have strong negative effects. The
increase of population density in many agricultural areas has been, and
still is the reason for expanding agriculture beyond the capacity of the
environment at the level of available technology. Land not really suitable
for crop production is taken into use as the produce of the more suitable
land cannot fulfill the food requirements. For this reason, many of the
shallow red soils in India have been converted into arable land and grass
land areas are overgrazed. A similar trend can be seen in the influence of
an expansion of the area under cash crops. Competition for land results in
taking less-productive areas into use. Further increase of population may
lead to an increase of the cereal component at the expense of legumes,
leading to a depletion of the soil nutrients, and poorer feed for the
draft-animals (Krishnamoorthy et.al., 1974). The most general consequence
of this is a further deterioration of the land, mainly through leaching and

- 9 -
erosion. Even optimal stands of row crops can never give the same protec
tion against erosive rains as a good natural vegetation.
In India, this trend towards decreasing mean production levels per hectare
could just be balanced by the farmer's accepted new techniques during the
last fifty years. Relating to data given by Randhawa and Venkateswarlu
(1980), present farmer's yield levels compare with those obtained at re
search centres in the thirties. Meanwhile, production potential has jumped
to values that are a multiple of these, which are, however, only reached
under optimal conditions.
2.3. Soil and Water
The soil profile, as the medium for root-growth has an important function
in the acceptance, storage and release of water and plant-nutrients. Al
though these characteristics are strongly related to the physical factors
of soil (texture and structure), their actual values also depend on exter
nal factors, like crop (depth of rooting), climate and management.
Soil-profiles that can be deeply rooted and are characterized by a high
percentage of crop available water, have a buffer-capacity, making them
less dependent on the rainfall distribution. An example is formed by the
deep and clayey Vertisols of many semi-arid areas. More sandy soils and
shallow soils, on the contrary, have a much lower retention capacity and
the distribution of rain should therefore be regular enough to avoid crop
water stress. An example of these are the shallow red soils, also common in
semi-arid tropical regions.
Infiltrability of the profile is another important differentiation between
soil types in respect to their water balance. While coarse-textured soils
tend to have higher infiltration rates, the slaking of the unstable surface
aggregates could create surface sealing that reduces the infiltration of
water considerably. This is typical of the red soils. Rainstorms with an
intensity exceeding this reduced infiltration rate will partly run off,
even when the profile is not saturated.
Most agriculture in the world is rainfed, which means that the crop fully
depends on the local precipitation for its water supply. In areas where the
rainfall exceeds the potential evaporation only during a certain period of
the year, rainfed crop production is roughly limited to that period for

- 10 -
soils, that have a moderate to low moisture retention capacity, like the
red soils. The semi-arid tropics are an example of this where on average,
only 2 to 4*5 months of the year can be considered as humid (Section 3.1.).
Under certain conditions, mainly determined by the presence of soils with a
high storage capacity of water available for plants, the cropping period
could be chosen directly after the humid season. The high variability of
rainfall, common in these areas and the incidently high intensities of
rainstorms, make water an important and unpredictable parameter, sometimes
being short, sometimes in excess and often aggresive in its erosive power.
2.4. Irrigated Agriculture
If (temporary) shortage of moisture from precipitation makes crop produc
tion impossible, risky or unproductive, the availability of water, trans
ferred from other sources to the location of shortage, could improve the
agricultural potentials considerably. This happens in natural conditions
(flood plains) or can be done by artificial means (irrigation).
In arid areas no permanent agriculture is possible without import of water.
In semi-arid areas it is, but irrigation would make it possible to increase
and stabilise production, and extend the growing season to include more
crops per year or enable introduction of more water requiring crops.
In the semi-arid tropics, easily accesible water resources are insufficient
for widespread irrigation. Locally, near rivers or in areas with an ample
groundwater supply, technical developments could be conceived that make
this water available for crop production. Implementation of such irrigation
lay-outs would generally require a high level of capital investment per
unit volume of water, that would only be economically feasible if produc
tion was not hampered by further restrictions like poor quality soils or
irregular topography. In much of the semi-arid tropics, irrigation would
become too expensive to be paid for by the projected increase of produc
tion.
2.5. Irrigated versus iRainfed Agriculture
A number of modern inputs can, technically seen, be easily introduced into
any environment like selected seeds, machinery and chemicals. The pay-off
of such inputs could be high but is often brought down by a limiting water

- 11 -
supply. Irrigation, therefore, is considered as having a snowball effect on
agricultural production in areas with marginal or insufficient water-
supply, and attempts to increase agricultural production often concentrate
on the introduction of irrigation systems.
The high development- and operation costs of irrigation systems frequently
force the users to produce crops with a maximum economic profitability,
that can be traded in order to pay for water-rates and other costs, even
if, as stated by Carruthers and Clark (1981), levied rates are mostly below
real costs. In irrigated agriculture a shift can be observed towards a few
commercial crops, reducing the diversity of the agro-ecosystem (Murton,
1980).
Depending on the availability of the resources land, water and capital,
irrigation lay-outs are bound to be restricted to an area limited in size
and therefore project-oriented. The combination of concentrated develop
ment, high capital input, drastic change in production pattern and great
economic interest of many parties involved, easily lead to personal and
political involvement, and risk making the execution of an irrigation
project an object of prestige. This often causes a lack of interest in the
development of surrounding areas. As a consequence of this, the relatively
small irrigated areas receive the lion's share of resources like fertili
zers and extension services, initially allocated for the whole region, and
seasonally draw labourers and small farmers through higher wages from
rainfed areas, leaving their own crops uncared for (Jodha, 1978).
A similar effect can be observed on a much smaller scale where farmers have
their land partly irrigated, partly rainfed. Rao (1978) observed that the
farmers "neglect the rainfed area to reap the benefits of the irrigated
land". According to Sanghi and Rao (1982), in the Hyderabad region, India,
the 10 per cent area under irrigated crops usually receives 90 per cent of
the farmers resources and attention.
As a contrast to irrigation, rainfed agriculture in droughty areas has
always received much less attention. In water limited agriculture, the use
of improved inputs does not seem to pay off well and is risky. Farmers in
developing countries, often producing at subsistence level are mostly
unable to obtain the necessary capital, and cannot afford to take risks.
Therefore they tend to keep on working according to their traditional
systems, using the same implements, seeds and fertilizer.

- 12 -
Moreover, development of rainfed areas in semi-arid tropical regions would
include expenditures that are oriented towards resource conservation rather
than directly productive aims. Improvement of the productivity of rainfed
areas does not automatically include the possibility of introducing cash-
crops; much of the extra produce of food crops might be directly consumed
to make good existing food deficits, while the marketable part will not
always meet a purchasing power.
Yet, leaving aside the complications of economic interests, a well-balanced
introduction of improved technologies has proved able to increase produc
tion of rainfed crops tremendously on the experimental stations (Kanwar,
1980), and likewise at farmer's level distinct yield advantages have also
been observed (ICRISAT, 1982). Although yield increases in rainfed agri
culture on hectare basis will never be as impressive as those attained
through irrigation, the potential of irrigation is restricted by the avail
ability of recoverable water. The importance of rainfed agriculture is
different, because of its main orientation towards the production of sub
sistence crops and because of its huge area that could benefit from im
proved technologies.
2.6. Rainfed Agriculture and Erosion
Soil erosion is a problem strongly related to rainfed agriculture. Wind and
water, the main erosive factors, have free play on land that is unprotected
by natural vegetation. Crops, esp. if rainfed, provide a lower level of
protection and for only part of the year. Extending agricultural land leads
to the incorporation of more erosion-susceptible areas, that were left
before because of poor quality or topography.
Realising the need for sufficient production land, erosion control measures
have to be taken within the system of farming. In this, improving agricul
tural production and reducing erosion may go side by side. Better crop
growth can decrease erosion through better canopy development and higher
water use, giving better protection to the soil surface and reducing runoff
respectively. Better erosion control along with water conservation improves
the basic resources for crop production.

- 13 -
2.1. Land and Watermanagement in Rainfed Agriculture
In this study, attention is focussed on the land- and watermanagement of
red soil areas in the semi-arid tropical climate of India. This is part of
a general objective of institutions like ICRISAT and AICRPDA to develop
rainfed farming systems that increase the agricultural output and stabilize
it in terms of yearly variability and long term productivity.
A major constraint a farmer faces is the uncertainty of timely availability
of sufficient moisture. As already indicated, the low profile storage of
red soils and their poor water intake, make this moisture availability
aspect more important than with some other soil types in the same climate.
The effects of a more secure moisture availability could go much further
than the simple (unifactoral) water-crop growth relation. It might open up
the possibility of introducing improved varieties with higher yield poten
tial under improved conditions of fertilization and plant protection. This,
on the other hand, does need a well-managed and uniform crop environment,
much more so than with local varieties.
Methods to influence the water availability can be split into two ap
proaches, either oriented towards conserving rainwater in situ by improving
the infiltration and storage capacity of the profile, or a system in which
excess water is collected and stored for later use. The first approach is
limited to the level of profile storage capacity, the second has no such
limitation, and a potentially long carry-over effect but requires higher
investments.
2.8. The Watershed Approach
The important role water plays in rainfed agriculture, being short or in
excess, makes it useful to select what we will call a watershed as a hydro-
logical unit of attention. Strictly speaking, a watershed is the topogra
phic division between two areas from where surface runoff contributes to
different river systems or lakes. In American literature the term water
shed, however, is being used to indicate the undivided area, from which
runoff water collects at one point. In this definition, watershed is in a
sense synonymous with catchment area or drainage basin (Institute of Hydro
logy, 1982). These terms, however, are generally used to indicate the total
runoff contributing area of a river or lake which could be a complex sys
tem. A watershed could also be defined as an area that forms a topographi-

- 14 -
cal unit with a single drainage outlet, forming part of a much larger
drainage basin (Smith and Woolhiser, 1971). Further refinement of the
watershed definition is done incidently on the basis of size range (Rao,
1980), but as there is no universal agreement on this, it remains necessary
to define the terms whenever used.
In this study attention is concentrated around "small agricultural water
sheds", not exceeding about 20 ha in size, that are completely or for the
most part in use for annual crop production (See also Chapter 9). As a
consequence of the small area involved and of the objective of runoff
manipulation, the important hydrologie features of such watersheds are
precipitation, infiltration, evaporation, percolation and surface runoff.
It should be remarked that, in the area studied, subsoil water movement is
not important as useful aquifers do not exist. Water leaving a watershed
area as subsurface flow, if taking place at all, should therefore be con
sidered as percolation loss, while subsurface inflow is not considered.

- 15
CHAPTER 3 THE SEMI-ARID TROPICS AND ITS AGRICULTURE
3.1. Definition of the Semi-Arid Tropics (SAT)
Most systems of climate classification are based on air temperature and
precipitation. The criterion developed by Koppen (1936) in defining the
tropics is widely used. He selected the 18°C isotherm, indicating the mean
temperature of the coldest month as the lower limit. The tropics, there
fore, do not experience cold periods and crops requiring heat to mature,
can be grown throughout the year if water is no constraint (Virmani et.al. ,
1980).
Availability of moisture is not only dependent on the amount of preci
pitation. Classification systems have different ways of indicating the
moisture availability, in order to define the humidity or aridity of an
area in the course of a year. Thornthwaite (1948) proposed a waterbalance
concept, based on potential évapotranspiration and precipitation, defining
a moisture index (I_) as:
100 S - 60 D I m = * h " °-6 * a = < 3 - X -)
with: S = Mean annual moisture surplus (mm/a).
D = Mean annual moisture deficit (mm/a).
PE = Potential evaporation (mm/a).
I, = Humidity index (-).
I = Aridity index (-).
A semi-arid area has a moisture index range of -40 to -20. Moisture surplus
and deficit are calculated on the basis of a number of assumptions. The

- 16 -
moisture index, I , gives a greater weight to the humidity index
I. = 100 S/PE than to the aridity index I = 100 D/PE, indicating that
water surplus in one season may to a certain extent compensate water defi
cit in another.
In an adjusted system (Thornthwaite and Mather, 1955), the procedure for
computing the water balance was changed, increasing the assumed moisture
holding capacity of the profile from 100 mm to 300 mm, related to vegeta
tion and soiltype, and introducing a different function for soil moisture
depletion during a dry period. Humidity index and aridity index are now
given equal weight, so that,
100 S - 100 D Im = (3.2.)
PE
with a range of -67 to -33 for the semi-arid areas. Although frequently
referred to, the accuracy of Thornthwaite's classification system is re
stricted and not very satisfactory for semi-arid tropical regions (Barry
and Chorley, 1976).
Another, less complicated, technique for classifying climatic areas is
described by Troll (1965). His approach is based on the duration of the
humid season. For this, a month is defined as humid if the mean precipita
tion exceeds mean potential evaporation. Semi-arid areas are defined as
thorn savannah belt (dry semi-arid) if the number of consecutive humid
months is 2 to 4^, or dry savannah belt (wet and dry semi-arid) with 4^ to
7 humid months.
Hargreaves (1971) defined a moisture availability index (MAI) based on
estimated potential evaporation and amount of rainfall expected at a 75%
probability level of exceedance, based on monthly values,
P (75%) MAI = (3.3. )
PE
with: P (75%) = Amount of precipitation exceeded in 75% of the cases
(mm/month).
PE = Mean potential evaporation (mm/month).

- 17 -
Three or four consecutive months showing a MAI exceeding 0.34 define a
semi-arid climate, in which the production of crops with 3 to 4 months
growing period is possible.
For a further delineation of the tropical areas of India and the world,
ICRISAT has selected Troll's classification. Potential evaporation is
computed by Penman's method (Penman, 1948). This methodology requires a
simple base data set, available for a large number of locations.
Figure 3.1. shows the semi-arid areas of India, based on this classifica
tion, differentiating between the "wet and dry" semi-arid zones and the
"dry" semi-arid zones. Following this methodology, however, some areas of
the west and the east coast are included that would be better classified as
humid or sub-humid (Krishnan, 1980).
From an agricultural point of view the crucial characteristics of a semi-
arid area are its aridity for the major part of the year and an annual
potential évapotranspiration that exceeds annual precipitation (Sanchez,
1976). The occurrence and level of rainfall is only just sufficient for
growing good crops which makes the semi-arid areas a special case in agri
cultural research and management. From this it appears that, using Troll's
classification, semi-aridity should be limited to areas experiencing 2 to
4H humid months as is also done by Krantz (1981). The areas with 4H to
7 humid months, indicated as "wet and dry semi-arid" should then be classi
fied as semi-humid or subhumid, with different agricultural potentials and
problems.
A shortcoming of Troll's classification system seems to be that a month is
generally too long a period to consider for its humidity or aridity. If
looked at from the point of availability of water for crop growth, a humid
period adds water to the rooted soil-profile, which acts as a moisture
storage system. During an arid period the crop uses (part of) this stored
water. Within both the periods defined as humid or arid wet and dry inter
vals occur, that replenish and dessicate the soil-profile respectively.
Total net quantity of water that goes into storage during wet periods also
depends on the available profile storage capacity and on the infiltration
characteristics of the profile, so that, apart from the rainfall distribu
tion, intensities of rainstorms are also important parameters that deter
mine the actual moisture storage. The length of a standard period should,
therefore, also be related to percentage infiltration, the moisture buffer
capacity of the rooted soil profile and the water requirement of the crop.
Higher crop available profile storage capacities and better infiltration
would increase the length of such a period. For red soils, with a profile
water retention capacity of about 100 mm, this period should probably not
be more than about two weeks.

- 18 -
Figure 3.1. Semi-arid tropical areas in India (shaded areas), according to Troll's classification. Adapted from ICRISAT (1980a)

- 19 -
The different systems of classification mentioned above are all oriented
towards crop water availability rather than on single parameters like
temperature or precipitation. As the availability of water is a complex
system, not only based on climatic factors but also on other factors like
soil, vegetation and management, it is clear that even such systems are
bound to be general in nature. Local variations in for example profile
depth would never divert that location to a different climatic group,
although such variations are very important for the local producers.
In this perspective, this study should also be seen: although, as a gener
alization, it is delineated to a semi-arid tropical environment, its appli
cability ought to be evaluated in a farmer's field.
3.2. Description of the Red Soils
The red sandy soils around Hyderabad, India, belong to the order of Alfi-
sols, with associated Entisols and Inceptisols. These and similar soils are
widespread in semi-arid tropical environments. They are developed from pink
granites, granitoid gneisses, quartzites, sandstones etc. and are charac
terized by a high percentage of coarse and fine sand particles (Rajan and
Rao, 1978). The clay in these soils is predominantly the kaolinitic, non-
swelling type. The depth of the A-horizon varies from only a few to 30 cm
and has a sandy loam or loamy sand texture, sometimes stony. In Alfisols a
hard and clayey B-horizon (argillic horizon), red to dark red in colour at
varying depth and of varying thickness occurs, underlain by a gravelly
disintegrated rock subsoil, in India known as "murrum". Entisols and In
ceptisols lack such strong horizon development (IRRI, 1974). Moisture
content at saturation amounts to about 20% vol., and 8% vol. at permanent
wilting point. The total depth of the profile varies strongly, partly due
to the high levels of erosion that have occurred in many of the Alfisol
areas. The profile water retention capacity varies, in arable land normally
from 75 - 125 mm, sometimes lower than 75 mm, generally not higher than
150 mm (ICRISAT, 1978). The soils are moderately well drained with reason
able hydraulic conductivity. The pH ranges from 5.5 to 7.0. Alfisols are
low in all bases, usually low in nitrogen, phosphorus and sometimes zinc.
Potassium-level is usually medium to high. As in all red soils cation
exchange capacity ranges from 10-20 m.e./100 g for medium deep soils but is
less than 10 m.e./100 g for shallow ones. Organic carbon percentage is low
(Sastry and Mathur, 1972; Virmani et.al., 1976). Appendix 1 shows typical
profiles of a shallow and medium deep Alfisol respectively, at the research
station of ICRISAT.
V

- 20 -
The red soils cover the largest area of the semi-arid tropics (Sanchez,
1976). Apart from India these soils are found in semi-arid regions of many
other countries, like Angola, Brasil, Cameroun, Chad, Dahomey, Ghana, Mali,
Nigeria, Sudan, Togo, Burkino Fasso (formerly Upper Volta), Zambia, etc.
(Cocheme and Franquin, 1967). In semi-arid tropical India alone there are
about 70 million hectares of them (Raychaudhuri and Rajan, 1963; Kampen,
1975), covering more than 40% of the semi-arid tropical regions in the
country. If one estimates the percentage of cropped area of the Indian red
soils at 70 (Section 3.3.), this would amount to an area of 50 million hec
tares.
Apart from the most sandy parts, red soils are too hard when dry to culti
vate with animal traction. If cultivated with the help of a tractor, the
topsoil tends to pulverize or break-up into large and hard clods. In moist
conditions, however, the management of these soils is easy.
The sandy and silty nature of the topsoil gives rise to a low stability of
the aggregates. Wetting and the impact of raindrops disintegrate surface
aggregates easily. This disintegration strongly affects the movement of
water. Firstly, it decreases the surface roughness, thereby reducing the
surface depression storage capacity, the effect of which is discussed in
Chapter 6 in more detail. A second effect of this disintegration is a
reduction of infiltration through the easy formation of a surface crust.
As an explanation of this process, fine material is thought to be loosened
and washed into surface pores, reducing their volume, whereas raindrop im
pact compacts the toplayer. A further reduction of the permeability may
take place by the deposition of suspended material after the rain has
ceased (Mclntyre, 1958 a), aggrevated by suction forces which arrange the
soil particles at the soil-atmosphere interface in a dense packing (Morin
et. al., 1981). The resulting crust, therefore, consists of two distinct
layers (Mclntyre), being a thin skin seal of oriented clay and silt parti
cles, according to Tacket and Pearson (1965) of about 0.1 mm and a washed-
in region of varying depth. Rawitz et.al. (1981) at this point differen
tiate between a crust and an underlaying cemented layer. Evidently, the
presence of a crust reduces the potential infiltration rate of the surface,
a value frequently referred to as "infiltration-capacity", but rightfully
defined by Hillel (1974) as the "infiltrability" (Section 5.1.). This
reduction was measured by Kirkby (1980) to be at least by a factor ten.
Several factors can be mentioned which influence the density of the formed
crust. Outstanding among them are the kinetic energy of the rainfall reach
ing the soil surface and soil-characteristics like texture, structure-
stability and moisture content, although the precise relations between them

- 21 -
are not entirely clear (Gerard, 1965; Tacket and Pierson, 1965; Lemos and
Lutz, 1957).
Crust formation not only has a negative effect on the infiltration but the
hardening of the toplayer also affects the ease and the quality of sub
sequent intercultivations. Moreover, if a hardening of the toplayer occurs
immediately after the seeding operation, this may hamper emergence. Looking
at it in this way, Klay (1983) concludes that, in general, crust formation
under the Indian semi-arid conditions seems much less of a problem than in
most African areas. This difference could both be attributed to the more
vulnerable soil in Africa and to the occurrence of higher intensity rain
storms (Hoogmoed and Stroosnijder, 1984).
3.3. Common Cropping systems
Forty-two percent of India's geographical area is used for permanent culti
vation (Goverment of India, 1979). For the semi-arid parts of India this
percentage is much higher and in many of the semi-arid districts the culti
vated area amounts even to 70 - 90% of the geographical area (Randhawa and
Venkateswarlu, 1980). This does not necessarily mean that all of this area
can be considered as suitable for permanent production, but the high popu
lation density in this part of the world and the low production levels
force the inhabitants to use every possible piece of land for food produc
tion.
Common crops are the ones that are grown for own consumption or the local
market in the first place, followed by cash crops if they have a high rela
tive gross margin ' compared to the food crops, like some oil-seeds. In the
red soils, crops are grown during the monsoon season ("kharif"), possibly
extending into the post-monsoon season, making use of residual moisture.
The choice of crops thereby depends on soil quality, soil depth and rain
fall characteristics. Common foodgrains grown in the red soil areas of
semi-arid India are "jowar" or sorghum (Sorghum vulgare), "bajra" or pearl
millet (Pennisetum tuphoideum), "raji" or finger millet (Eleusine corocana)
and a number of minor millets (Setaria spp.). These crops have a reasonable
level of drought resistance, which is even better for the millets than for
sorghum. As the latter is preferred by the farmers, it is common practise
in drought prone areas to grow a mixture of sorghum and millets both at
+) "gross margin" is defined as the production value minus variable costs.

- 22 -
full plant population. Depending on the actual rainfall of the season one
of the two crops will produce the best yield.
Apart from the foodgrains, pulses and oil-seeds are grown in the red soil
areas. Of the pulses red gram (Cajanus cajan) green gram (Phaseolus
aureus), black gram (Phaseolus mungo), horse gram (Dolichos biflorus) and
cowpea (Vigna catiang) are the most common. The important oil-seed-crops
for red soils are groundnut (Arachis hypogaea), sesame (Sesamum indicum),
rape (Brassica napus), mustard (Brassica nigra) and castor (Ricinus
communis) (Arakeri, 1962).
The most important crops grown under rainfed conditions on the red soils of
semi-arid India and their gross average yield are listed in table 3.1. The
last column indicates their relative importance for rainfed production. The
table also shows the importance of food grains and pulses, occupying 75% of
the total cropped area of India. Crop choice is also related to farm size.
The smaller the units, the more the cultivators tend to grow for their own
consumption. Small farmers also have a significantly higher extent of
intercropping than large farmers (Jodha, 1981). And last but not least, the
farmer needs a produce of fodder for his cattle. The level of production
balances around the farmer's own minimum food requirement and often stays
below this.
Table 3.1. Important rainfed crops in red soil areas of semi-arid India and their yields.
Crop Gross Average Yield Percentage Rainfed
kg/ ha
(1) (2) (3)
80 80
60-70 100 90 90 90 90 90
* Crops mostly or exclusively grown on red soils
Sources: (1) Derived from Government of India, Reference annual (1979) (2) Quoted from Kanwar (1980) (3) Randhawa and Venkateswarlu (1980)
Sorghum Pearl Millet* Finger Millet* Small Millets* Red gram Other grams Groundnut* Castor* Sesame*
730 430
1090 440 720 660 840 350 210
840 510
670
790

- 23 -
In the semi-arid areas of India, the land/man ratio amounts to 0.67 person
per hectare on a geographical basis. Distribution of sizes of operational
holdings is given in table 3.2. for India as a whole and for the semi-arid
states. The skewed distribution of the holdings is evident. The high land
pressure, which is still increasing and the sub-optimal environmental con
ditions (soil and climate) do not allow for more than subsistence farming
for most operational units. Input levels are bound to be low as most farm
ers are not in a position to save and invest to improve their agricultural
system or even part of it.
More often than not crops are grown in intercropping systems. Under condi
tions of rainfed farming at subsistence level, the growing of crops in
mixtures matches the available resources in maintaining low but relatively
stable production (Andrews and Kassam, 1976). In low and uncertain rainfall
areas the yield advantages of mixtures over sole crops can often be ex
plained by a difference in water-use pattern over the growing season of the
component crops, so that part of the mixture makes the best use of the
actual moisture availability of a particular season. In higher rainfall
areas intercropping may allow for a better utilization of space and time
(Andrews and Kassam).
Sanchez generalises the reasons for intercropping systems being more pro
ductive as follows (Sanchez, 1976):
a better utilization of available solar radiation;
higher efficiency in utilizing soil or fertilizer applied nutrients,-
fewer problems with weeds, pests, and disease control;
better use of available manual labour and other low-energy technology.
Table 3.2. Size distribution operational holdings.
Size class
(ha)
< 0.2 0.2 - 0.4 0.4 - 1
1 - 2 2 - 4 4 - 1 0
10 - 20 > 20
INDIA
households
(%)
36+> 6
16 16 14 9 2 1
area
(%)
0.3 1.0 5.6
12.3 20.7 31.2 17.3 11.6
SAT-states
households
(%)
35+> 4
15 15 15 12 3 1
area
(%)
0.2 0.7 4.6
10.4 19.7 31.1 20.1 13.2
+) About 80% of this group might be considered as landless Adapted from Ryan et.al. (1975)

- 24 -
Among other reasons, the preference for mixed cropping could also be di
rected by the wish of the farmer to grow all elementary crops for his own
consumption or by the need for crop adaptation to local differences in his
field. In this respect, a differentation can be made between the following
systems:
mixed intercropping: different crops, broadcasted or row-planted, are
sown, managed and harvested simultaneously;
row intercropping: different crops are sown simultaneously, but in
distinct rows. Cultivation of the different crops might vary slightly,
harvest differs in operation and generally also in time;
strip intercropping: different crops are grown simultaneously in strips,
wide enough to permit independent cultivation, but narrow enough for the
crops to interact agronomically;
patch intercropping: different crops are grown on different patches in
the same field. Sowing, cultivation and harvesting is done indepen
dently;
relay intercropping: a second crop (or crop combination) is planted
between a standing crop (or crop combination).
The difference between these systems is not always distinct. Moreover, the
farmer may use combinations of the above mentioned systems.
Systems of sequential cropping are not very common in the red soils, except
in situations where (supplemental) irrigation is available. Ratooning of
crops (the cultivation of crop regrowth after harvest) is sometimes prac
tised in situations of heavy drought injury to a standing crop.
Mean production figures (table 3.1. ) are low due to poor production fac
tors, erratic rainfall makes even this low yield uncertain. Although the
figures for smaller regions or individual fields will come out much higher,
for SAT-India as a whole, the co-efficient of variation of yields for
sorghum is 9.4%, for the millets 22.2%. This higher variability of millet-
yields is directly related to the fact that they are primarily grown in
areas with lower average annual rainfall, where consequently the probabili
ty of drought is much higher (Ryan and Binswanger, 1980).
Use of chemical fertilizer in rainfed agriculture is low. Of the total
Indian fertilizer use, which increased from 16 kg/ha in 1973 - 1974
(Agrawal, 1980) to an average of 31 kg/ha in 1979 - 1980 (Tandon, 1981),
nearly 80% was used for rice, wheat, sugarcane and cotton, mainly irri
gated crops. More than half of the Indian farmers do not use fertilizers at
all (Tandon). Most farming households are already in debt (Arakeri et.al.,

- 25 -
1962) and cannot afford more credit in view of the risk of crop failure if
rains do not support the standing crop. Moreover, the local varieties
generally used for the foodgrains, do not have the high yield potential as
modern varieties have. A shift to modern varieties with chemical ferti
lizer, however, would require a more stable production environment and
technology in respect to crop protection, factors most small and marginal
farmers can not guarantee. Fertilization, therefore, in most rainfed food
grain production is restricted to the use of farm yard manure. However, of
the total production of dung not more than 18-30% is used as manure
(Sopher, 1980), with a strong preference for cash crops (castor, ground
nut), which means, that for the foodgrain production only marginal quanti
ties of farm yard manure remain available.
For land preparation, sowing and intercultivation locally manufactured
implements, drawn by bullocks or buffalo's are commonly used. Use of trac
tors is almost entirely concentrated outside the rainfed SAT-areas
(Binswanger, 1978). Depending on soil type, rainfall pattern and antici
pated crop, different tillage-systems are used (Rastogi, 1980).
In the red soils, where cereals are grown in monoculture or in combination
with pulses, sowing is done as early as possible, i.e. immediately after
the first good rain, wetting the profile to a depth of about 30 cm, around
the beginning of the monsoon. Primary tillage is in some areas restricted
to two or three passes with a so-called blade-harrow after the occurrence
of a pre-monsoon shower. In other cases a ploughing operation, with wooden
or iron ploughs is done every year or in alternate years. Cash crops, like
castor and groundnut, are generally planted somewhat later, to gain time
for a better primary tillage and to be more sure of continuing rains. Use
of indigenous seed-drills is common, or otherwise a technique is used in
which the seeds are put into a small furrow by hand, and earthed with the
next pass of the plough.
Intercultivation for weed control and breaking of the crusted topsoil is
done with a blade-harrow one to three times during the early part of the
growing season. In addition to this, one handweeding might be done in the
cash crops. Use of herbicides in rainfed crop production in semi-arid India
is negligible, mostly because the present weed control practices appear to
be adequate under the present cropping system (Shetty, 1980).
To deal with the unpredictability of the rainfall, be it a delayed onset of
the monsoon, prolonged dry spells, or an early cessation of the rain, and
to avoid complete crop failure "drought strategies" are recommended

- 26 -
(Krishnamoorthy et. al. , 1974; Singh, 1977). These recommendations, to be
adopted for individual regions, would include suggestions for a change of
crop or crop-variety, thinning to reduced plant stand and ratooning of the
standing crop (see Section 4.4.).
3.4. The Water-component: Availability, Drainage, Irrigation
The relatively low water retention capacity of red soils and the erratic
distribution of rainfall in the semi-arid tropical regions cause uncertain
ties in moisture availability and therefore make rainfed agriculture un
stable and risky. Length of the growing season is determined by the dura
tion of the rainy season, supplemented with the period in which crops can
fulfill their transpiration requirements from profile stored water. The
lower the mean rainfall and the shallower the profile, the higher is the
probability of drought injury during the growing season, for a certain
crop. In that case, the moisture in the profile becomes limiting to ade
quately support the crop for its transpiration needs during an interval of
insufficient rainfall. This problem is also related to the seasonal rain
fall distribution (Section 5.2.1.). On the other hand, sufficient profile
storage capacity could counteract the adverse effects of a too dry period
in situations where earlier more abundant rainfall could have been stored.
Complete crop failure, however, caused by moisture shortage, is not un
common in parts of India, especially not in a number of areas that for that
reason have been officially indicated by the government as "drought-prone".
Whereas water can be a problem because of its scarcity at one moment in the
season, it may be excessive during another as a consequence of long dura
tion and/or highly intensive storms, resulting in ponding and surface
runoff. High intensities of rainfall also act destructively on the soil
surface aggregates, resulting in a hardening and sealing of the topsoil.
This process by turns might reduce the infiltration, particularly in de
pressions where sedimentation of fine particles is concentrated. Runoff can
cause great damage to the fields because of related soil transport and
washing out of organic matter and nutrients. In the red soils, although
sandy by nature, stagnation of water for one or more days may occur. In
agricultural fields, where depressions are of such size and shape that the
plants are located in them, this waterlogging may directly or indirectly
adversely affect the crop. Moreover, insufficient drainage prohibits the
farmer from entering the field for some time.

- 27 -
Irrigation could secure the water availability and as such stabilize and
increase the agricultural production in the semi-arid zones. The red soils
are suitable for most irrigated crops, with the possible exception of rice,
because of the high percolation losses. However, while at this stage,
irrespective of soil type, about 25% of the cultivated area in India is
irrigated (Randhawa and Venkateswarlu, 1980) and a further development of
irrigation is foreseen, the maximum area that can ever be covered will
never exceed 40-50% of the cultivated area of India (Sarma, 1982), so that
at least half of India's agricultural fields will always remain dependent
on the local precipitation as the only water source.
In semi-arid tropical zones with a secure but limited availability of
irrigation water, it would seem obvious to use this for supplementary irri
gation of upland crops. Yields of crops could be secured through small
watergifts, bridging periods of drought, which would create an important
increase in average yield. Experience in India has shown however, that,
whenever irrigation water was made available, the cropping pattern changed
to high-valued crops, even in situations where the system was originally
designed for protective irrigation of upland crops. This is caused by a
combination of technical and non-technical factors and strenghtened by the
difference in pay-off between upland and irrigated crops (Anonymous, 1962,
cited by Jodha, 1978; Krishnamoorthy et.al., 1974), resulting in an uneven
distribution of the available water over the command area, in favour of the
head-enders (Malhotra, 1984).
A similar controversy can also be seen in the traditional tank-irrigation
systems, common in South-India. Surface runoff water is collected and
stored in reservoirs from which lower fields are irrigated, but this is
mainly for rice production. Water use could be as high as 1,000 mm per
cropping cycle (Agrawal, 1980) or even more under poor management systems,
a volume of water that could serve at least a tenfold area, if used for
supplementary irrigation of rainfed crops.
These examples show a less than optimal use of the scarce production
factor, water, at least from the point of view of food crop production. It
is clear that, in such situations, an overall improvement of crop produc
tion could be attained by better management of the available water. How
this can be achieved depends on a number of factors, that include the
physical condition of the area, the availability of techniques and the
level of organisation. In subsequent chapters a number of such factors are
described in more detail to try and give a better idea of the problems and
possible solutions related to the water availability under the conditions
of rainfed agriculture in the semi-arid tropics.
28 -
CHAPTER 4 WATER MANAGEMENT SYSTEMS IN ARID AND SEMI-ARID AREAS
4.1. General
The terms "dry farming" and "rainfed farming" in (sub) tropical areas are
interchanged by many authors and are generally not well defined. Both terms
are frequently used simply to distinguish from irrigated farming, without
giving them a clear meaning. "Dry farming" is sometimes defined (ICRISAT,
1979) or implicitly used (Arnon, 1972) as a system of agriculture in arid
areas made possible by conservation of water in situ, by a technique of
water harvesting or runoff diversion. Other authors use the term "rainfed"
for conditions where mean annual precipitation exceeds a certain critical
amount, depending on the climate, above which non-irrigated agriculture is
more or less stable, using the term "dry land" for non-irrigated locations
with lower rainfall, and consequently undependable yields. Ten Have (1977),
for example, refers to a limit of 800 mm of mean annual precipitation for
tropical areas with summer rainfall to be exceeded for practising rainfed
agriculture. To allow for dry farming, Wallen (1966) and also Ten Have set
the limit at 500 mm for areas with summer rainfall and 250-300 mm for areas
with predominantly winter rains.
A common characteristic in all definitions of dry farming and rainfed
farming is that they both depend on precipitation rather than irrigation
for water supply and that varieties of crops are grown that have a low
yield response to water deficit, compared to the high producing varieties
grown under irrigated conditions that are also most sensitive in their
response to water (Doorenbos and Kassam, 1979). Yet, a distinction between
the two could be made on the basis of the expected sufficiency of local
precipitation to raise the crop without additional water. Where a system of
dry farming is used, agriculture would have been unproductive or even
impossible in most of the years without one of the special dry farming
techniques as for example fallowing alternate years, as practiced in the
Great Plains, (Greb et.al. , 1967), runoff farming as in Tunisia (Amami,

- 29 -
1979) or agricultural water harvesting, well-known in ancient and modern
Israel (Evenari et. al. 1971), i.e. techniques through which more water is
made available to the crop than is received by it from rainfall on the
occupied area during its growing cycle. On the contrary, in rainfed farming
systems some level of crop production is possible in most years without
such import of water. This still implies that water shortage could be a
reason for poor yields or even crop failure in single years and that appli
cation of water in addition to infiltrated rain would generally increase
production.
According to this differentiation, dry farming systems are to be practiced
in arid regions, rainfed farming systems in the semi-arid and wetter areas.
4.2. Systems of Water Diversion and Collection
Since historical times, people have made use of surface runoff, lead by
natural conditions to locations where the water could be used for agri
culture. But man-made constructions intended to divert runoff are also
age-old, as are techniques to increase runoff from catchment areas for
subsequent use.
Shortage occurred where there was a need for water in excess of the local
precipitation, which could not be replenished by other sources, like a
river. In some locations the quantity of local precipitation was too low
for human existence, in other areas a concentration of water enabled a *
strong economic development.
Activities oriented at water diversion and collection can be split up
according to technique and specific objective. A useful separation in
systems could be made, which depends on whether or not a technique is used
to:
induce runoff in the catchment area;
divert the runoff to a selected area;
store the water in excess of profile retention.
With these differentiations in mind, the following systems can be defined:
Water harvesting: A system of inducing runoff by treating a catchment area
(Myers-, 1975). In historical lay-outs the runoff is diverted to a storage
reservoir and mainly or exclusively used for human consumption or as drink
ing water for their livestock.

- 30 -
Another water harvesting system, referred to as the system of Agricultural
Water Harvesting or Micro-Catchment, on which much research has been done
in recent years (Boers and Ben-Asher, 1982) concentrates on runoff induce
ment in small plots or strips. There, the runoff concentrates at one side
of the plot or strip, infiltrates and directly contributes to the available
moisture in the rooted profile of an individual productive shrub, tree or
crop row.
Runoff farming, or water spreading: A system in which runoff water from a
treated (Myers) or untreated (Lawton and Wilke, 1979) catchment area is
directly diverted to - or held back in - lower located agricultural fields,
each runoff event serving as a water-gift.
Runoff collection: A system aiming at collection and storage of precipita
tion in excess of infiltration mostly from productive areas, with the aim
of using this water at a later stage as supplementary or full irrigation in
the same or a different area, mostly nearby the location of storage. Runoff
collection is classified by Lawton and Wilke as a water conservation rather
than a water harvesting technique.
Other systems Among other systems, floodwater farming makes use of the runoff concen
trated by natural watersheds in a river system, that overflows at times of
high discharge, sometimes flooding huge areas in floodplains or deltas. The
water may be kept impounded for some time by constructing earthen dams
around the fields. Such areas are rich in clay and fertile by yearly depo
sition of suspended material and crops are grown on residual moisture,
often supplemented by groundwater. The difference between runoff farming
and floodwater-farming lies in the fact that in the former system a more or
less clearly defined, relatively small and possibly treated area contri
butes water at each runoff producing occasion, while in the case of flood-
water-farming the contributing area is supposed to be much larger, un
treated and remote.
An important system with the emphasis on water diversion is the "chain of
wells", better known as "qanats". This system dates back to 1,000 B.C., but
a great many of them are still in use today in countries like Iran and
Afganisthan, where they are a very important water supply to the dry but
fertile valley lands. Vertical head wells into the water bearing layers of
an alluvial fan collect water that is subsequently transported through a
gently downward sloping underground tunnel to a lower point on the surface.

- 31
A series of vertical shafts connecting the tunnel with the
act as ventilation and entry for maintenance (Nat. Acad. Sei
Kuros, 1984). Inasfar as qanats provide a more or less
water, not directly dependent on the local precipitation,
classified as irrigation farming, which distinguishes them
mentioned earlier, that are characterised by an uncontroll
ability.
4.2.1. Water Harvesting
ground surface
U.S.A., 1974;
flow of
ir use can be
itrom the systems
d water avail-
permanent
thei
Water harvesting systems are always based on runoff
contributing area. Historically, such systems were develop
where annual rainfall quantities were too low for any
existence. In the Negev-desert, underground cisterns have
storage of harvested water for consumption, dating back
(Evenari et.al., 1971). Clearing of the contributing are
construction of stone strips is seen by Evenari as a
increase the runoff efficiency, which is the collected runo
age of rain.
inducement in the
d in arid areas
ettled form of
been found for
to 1,000 B.C.
of stones and
used to
as a percent-
technique
J'f
In recent research projects modern techniques and material
attempt to accomplish the same (Fink et.al., 1980).
simplest activity, Hillel (1974) indicates five techniques
from an area:
eradication of vegetation and removal of surface intones, also to
permit the formation of a crust;
smoothing of the catchment area, to reduce the stagnation of water in
depressions;
compaction of the top layer, to decrease infiltration
dispersion of soil colloids with sprayable solutions (if sodium salts,
to induce crusting;
impregnation of the surface with sealing and binding materials
(sprayable petroleum products) to create a water repellent and stable
coating.
are used in an
from the
induce runoff
Starting
to
The purpose is to avoid stagnation of water in micro-depressions and to
decrease infiltration in the area. Both intend to lower the threshold re
tention, i.e. the amount of precipitation needed to initiate runoff (Fink
et.al., 1979). The soils of the northern Negev-region, prove to be speci-

- 32 -
fically suited for water harvesting, because of their loamy nature with a
high pH- and ESP-value, factors affecting the aggregate stability negati
vely and favouring crust-formation. The importance of this is made clear by
Rawitz and Hillel (1971) who found that the distribution of rainfall inten
sities for this area is strongly skewed towards lower values, a condition
otherwise unfavourable for water-harvesting.
4.2.2. Agricultural Water Harvesting
The system of agricultural water harvesting, more commonly referred to as
micro-catchments is also based on the inducement of runoff. It differs from
water harvesting, however, in respect to the application of the harvested
water (which is restricted to agricultural use), the size of individual
catchment areas (which are small, serving the water needs of individual
trees (Evenari, et.al., 1971), shrubs (Fink and Ehrler, 1979) or crop rows
(Gardner, 1975)) and consequently in respect to lay-out, as agricultural
water harvesting does not require any diversion, transport facility, silt
trap or storage of water.
Runoff efficiency is much higher than for the larger catchment areas used
in water harvesting lay-outs, for which the figures, given by Shanan and
Tadmor (1979), are indicative (table 4.1.).
A differentiation, according to lay-out, can be made (Shanan and Tadmor)
between:
Catchment b a s i n , w i th an i n d i v i d u a l p l o t s i z e , depending on mean p r e c i p i t a t i o n , of up t o 200-300 m2, s e r v i ng t h e water needs of a s i n g l e t r e e or s h rub .
R u n o f f - s t r i p s , where water c o l l e c t s from one or two s i d e s i n t he l i n e of a row crop wi th a r a t i o of wa ter c o n t r i b u t i n g a r ea t o p r oduc t i on a r ea of 4 : 1 t o 20 : 1.
Table 4 .1 . Annual runoff related to area of catchment in Negev-desert: annual rainfall 100 mm
Size of Catchment Area
(ha)
< 0.02 5 - 1 0
300 - 500
Average Annual Runoff
(mm)
10 - 30 4 - 1 0
1
Derived from Shanan and Tadmor (1979)

- 33 -
Treatment of a catchment area requires a high input in lay-out and mainte
nance and costs of water are consequently high (Oron et. al., 1983). Runoff
efficiency can be increased by the use of dispersion agents or impregnation
of the surface in the catchment area, but a glance at the costs involved,
as given by Frasier (1975) shows the impractibility of a wide application.
For many years to come, their usage will be restricted to small, developed
locations, for growing high valued crops, like fruits and vegetables.
4.2.3. Runoff Farming
In runoff farming crops receive runoff water from adjacent treated or un
treated areas. The individual fields are usually small, may be located in
natural catchment areas and may be enclosed by borders to contain and
conserve the water (Lawton and Wilke, 1979).
Runoff farming and flood control are very much related approaches in arid
and semi-arid areas, as both are oriented at constructing systems that in
tercept (excessive) runoff. A runoff-farming system forces the water to
contribute to crop growth instead of letting it drain out of the area.
Water spreading systems as described for Pakistan (Nat. Acad. Sei. U.S.A.,
1974), and the contour-bund system widely applied in India (Rama Rao,
1974), both serve purposes of flood control and water conservation be it
that in the latter case an emphasis is laid on the flood- and erosion-
control and that the water, as far as possible is kept in place rather than
diverted to a different area.
In arid regions the water is always lead to a receiving area which is much
smaller than the contributing part. Evenari et.al. (1971) describe the
individual terraced wadi's and the runoff farms of a size up to 5 culti
vated hectares, which are surrounded by barren hillsides from where water
is diverted for direct watergifts. Of the 100 ancient runoff farms studied,
the average ratio of catchment area to cultivated area was 20. In India,
similar systems existed in West-Rajasthan, called "khadi", dating back to
the 15th century (Kolarkar et.al., 1983).
A modern runoff farming system (Jones and Häuser, 1975) is the conservation
bench terrace, originally developed by Zingg and Häuser (1959). Levelled
contour benches, constructed with a terrace ridge to keep water impounded,
receive runoff water from a contributing area that is kept at the original
landslope. Actual dimensions depend on slope, soil, land use and antici-

- 34 -
pated runoff. This system looks very similar to that of runoff strips
described in section 4.2.2., but differs in the fact that the catchment
area is not treated to induce runoff, so that it should not be considered
as a water harvesting system.
4.2.4. Runoff Collection
Contrary to water harvesting, runoff collection is a passive system in as
far as inducement of runoff is concerned. The runoff contributing area is
left for its original use, and excess rain is generally allowed to follow
the natural drainage path. At a location suitable for the purpose, a valley
or depression is closed by an earthen or masonry dam, which creates a
reservoir or "tank". The objective of this is mostly to enable the growth
of irrigated crops, that have a high relative yield advantage over rainfed
upland crops, especially where the latter are grown in shallow soils or in
regions with low rainfall.
Runoff collection and storage are meant to concentrate water on an areal
basis and transfer it in time. In India, on average about 17% of the total
irrigated area is served by tanks (Singh, 1974). In individual districts
this figure may be much higher, especially in the southern states. Most
tanks are in the smaller size range. Ludden (1978), for a district in Tamil
Nadu State, mentions 2,000 out of 2,500 tanks as smaller than 40 hectares,
this figure being the average size. Out of 41,000 tanks in the state
Karnataka, with an average command area of 21 hectares, 16,000 serve an
area of less than 4 hectares (Sundar and Rao, 1982).
Storage involves high percolation and evaporation losses and reservoir
dimensions are chosen to secure a maximum stored quantity, spilling excess
runoff water in few years. The production efficiency of the runoff water,
in terms of the percentage of the runoff water that ultimately becomes
available for tranpiration by a crop, is low.
In traditional lay-outs the use of collected water is commonly restricted
to irrigate rice downstream of the reservoir (Sharma and Helweg, 1982;
Doherty, 1982), a water demanding crop with a high economic and social
value. Application of water can easily be done by gravity, length of con
veyance channels is restricted and soils are best in the valley bottoms.

- 35 -
Yet, in well-managed runoff collection systems upland crop production can
also benefit from it, if the silt deposits, removed from the reservoir
bottom to maintain its capacity, are returned to the fields of the catch
ment area. Such techniques, traditional for many parts of Southern India
(Sopher, 1980) can be seen as a symbiosis between rainfed farming in the
catchment area and irrigated crop production in the valley.
However, many (especially small) tanks have fallen into disuse (Von Oppen
and Subba Rao, 1980). The decay of the tank irrigation systems should at
least partly be seen in the changes in organisational structure that have
occured since India's indépendance. Before 1947 many of the smaller tanks
were the private property of powerful individuals and the society was
organised by a strong dependancy of agricultural labourers on this local
elite. Changes in property rights and social dependancies since then seem
to have been instrumental in a decline of many of the tank-irrigation
systems. The poor farmers preferred the cultivation of a small piece of
rainfed land, that they had acquired as their own, to continuing to depend
on the land owners in an unfavourable tenant-like situation in the irri
gated area (Doherty, 1982). In other situations, the management of the tank
system was entrusted to public bodies that were not supplied sufficient
budget to properly maintain the system.
4.3. Techniques of in situ Water Conservation
There are also techniques that are oriented at the in situ conservation of
water that is in excess of direct infiltration and surface retention. These
differ from the previous systems in as far as they do not envisage diver
sion or prolonged surface storage. Their aim is to hamper the surface flow
of excess water and to prolong the time available for infiltration, thereby
reducing the runoff component of the area in question.
This can be attained by the system of tied ridging, which aims at keeping
all or part of the excess water near the crop, by damming created furrows
at regular intervals (FAO, 1966). Another approach follows the construction
of so-called contour-bunds, which are earthen dams, located at regular
height intervals, that are laid out on the contour hooked up with side-
bunds. Such contour-bunds are similar to "level terraces", "ridge type
terraces" or "absorptive type terraces" (Gupta et.al. , 1971). Surface
runoff water stagnates behind these bunds up to a level that is fixed by a
spillway.
- 36 -
Both techniques of tied ridging and contour-bunding are frequently used in
semi-arid tropical regions, the former mostly in Africa, the latter in
India. They will be dicussed in more detail in Chapter 6.
4.4. Crop Management in Semi-Arid Tropical Agriculture
In the absence of the possibility of supplementary irrigation the need
arises to practise agriculture on the basis of techniques that maximize the
rainfall use efficiency, defined by Kampen (1975) as the agricultural
production in relation to annual precipitation. Gardner and Gardner (1983)
remark that, to combat the effects of drought in rainfed agriculture,
agricultural solutions might well be the best in the long term, where
engineering solutions become more and more expensive or otherwise unaccep
table.
In India, research on rainfed farming systems started as early as 1926
(Basu, 1954). In 1970, the All India Co-ordinated Research Project for
Dryland Agricultural (AICRPDA) was established by the Indian Council of
Agricultural Research (ICAR) comprising 23 research centres and repre
senting different soil and climate regions in India (Krishnamoorthy et.al. ,
1974). In these centres special emphasis is given to the development of
techniques of farming and to the selection of suitable crops, crop varie
ties and crop combinations, including their fertilization and tillage
requirements. Many of the recommendations tested by these centres are
derived from early work done at the Sholapur dry farming research centre,
which resulted in the so-called "Bombay dry farming method" (Rama Rao,
1962; Joshi et.al. , 1980), recommending deep ploughing, contour bunding,
field levelling, manuring, contour cultivation, the use of wide row spa
cing, limited plant density and several intercultivations. The impact on
productivity, however, was marginal due to the unavailability of suitable
genetic material that would better match the rainfall pattern (Singh,
1982).
More recent advice, therefore, includes the use of such improved varieties
of drought escaping or drought resistant crops and chemical fertilizers,
stressing the need for proper weed control and good sowing methods. Even
then, "drought strategies" are important to deal with the consequences of
an unpredictable rainfall pattern. Ruthenberg (1976) compiled a number of
recommendations that were earlier given by Krishnamoorthy:

- 37 -
If the onset of the rains is delayed then other varieties, crops,
crop mixtures, seed rates, and fertilizer applications have to be
chosen.
If gaps in rainfall (during the humid season) occur, then the capa
city for re-sowing should be available, weeding has to be done more
carefully, ratooning of millets and sorghum can be practised (the
first growth is cut as fodder and the ratoon crop produces the grain)
and fertilizer application has to be split.
If the rains stop too early, then moisture demanding plants of the
crop mixture ought to be removed; the crop of maize and sorghum may
be saved by removal of the lower leaves.
What these recommendations have in common is, that they are all based on
the condition of easy availability of inputs like labour and capital,
which, however, will generally not be the case with the majority of small
farmers.
4.5. Appraisal of Water Management Systems for Red Soils
In arid and semi-arid tropical regions a major direct constraint for opti
mal crop production in most years, is the availability of water. In arid
regions it is availability as such, in semi-arid tracts it is more often
availability in time, mean seasonal precipitation being basically suffi
cient. Development of rain depending systems that increase crop production,
therefore, should be oriented at water diversion towards restricted areas
(water harvesting systems) in the arid parts and at optimal in situ water
utilization in the semi-arid parts, a differentiation that coincides with
that of dry farming and rainfed farming (section 4.1.).
Runoff farming and agricultural water harvesting, typical dry farming
techniques, increase the average quantity of available water in the cropped
area, but its variability remains high. The systems will even have a higher
variability of water inflow (rain plus diverted runoff) as would occur in
their absence, because runoff percentage usually increases with rainfall.
As the variability of precipitation is already appreciable, such systems
are only effective if the profile water retention capacity is sufficiently
high to store the incidently large amounts of water received. This makes
these systems suitable for restricted areas of deep and clayey soils.
In the semi-arid tropics the higher mean precipitation provides sufficient
water on a seasonal basis for an adapted crop in most years, thus elimi-

- 38 -
nating the need for additional inflow. There, as far as the availability of
water is concerned, the distribution of rainfall is more significant than
its total, at least, if a set minimum amount occurs (Morin and Matlock,
1974). In other words, water availability is a problem of irregular distri
bution rather than seasonal shortage. It cannot be solved by increasing the
amount of inflow, if the system lacks storage capacity. However, if suffi
cient capacity is available, as in the case of the deep Vertisols in India,
simple in situ water conservation through monsoon-fallowing already permits
the growing of a so-called "rabi"-crop (post-monsoon season crop) on this
stored water. This system, therefore, is independent of the distribution of
the earlier rains. This is obviously not the case for crops grown during
the rainy season.
The sandy and often shallow red soils, however, lack the storage capacity
to allow the cultivation of post-monsoon crops or to benefit from a system
providing additional inflow. Therefore, a system of in situ water conser
vation and subsequent cropping would not be practical to escape the effects
of the variability of rainfall. For the same reason, water conservation
through contour-bunding can also not counteract the irregular distribution
of rainfall: excess water concentrates in only a minor part of the cropped
field where the small profile water storage capacity will soon be filled,
but still be insufficient to support crop growth during a subsequent
drought. Tied ridging in red soils might be useful up to some (easily
reached) point of profile water saturation, but neither will be able to
conserve enough moisture to bridge long dry spells.
Considering this, the only useful alternative for red soils under these
climatic conditions is a lay-out that enables collection of excess water in
surface reservoirs or ponds during wet periods, using this water for sup
plementary irrigation during dry spells." Understandably, such system will
only work when the reservoir has had sufficient inflow before the moment
water is required. Such inflow stems from watershed runoff, which depends
on a large number of variables, like actual rainfall, management practices
and on characteristics that are intrinsic to the particular catchment.
+) Although this approach of water conservation is traditional for extended areas of deep Vertisols in India, proving to be workable within the climatic conditions and farmers' constraints, important disadvantages are high soil loss rates and a low precipitation efficiency. Therefore, such systems should be abandoned in favour of adapted monsoon-cropping systems (Anonymous, 1981).
°) This does not exclude the need to firstly try and replenish the soil profile and to reduce unproductive water losses from the profile (section 6.1.).

- 39 -
To get an idea of the applicability of this approach, profile water bal
ances were calculated, based on actual rainfall, measured runoff and as
sumed values for evaporation and transpiration (Appendix 2). The calcula
tion was made for two levels of (assumed) profile storage (PS). Whenever
the profile was saturated, any additional infiltration was considered as
being lost by percolation to deeper layers.
The resulting lines of available water in the soil profile and the cumu
lative runoff, potentially available for storage, are shown in
figures 4.1. - 4.3. These refer to an Alfisol field of 0.4 ha (RW-3H) and
for the years 1979 through to 1981. In the figures, periods of crop water
stress, as defined in Appendix 2, show clearly. It appears, that the in
adequacy of shallow profiles (those with PS = 75 mm) to hold the infiltra
ted water, results in higher percolation losses and an earlier profile
depletion as compared to deeper profiles (figure 4.1. ) . Consequently, in
terms of alleviating stress periods, crops grown on shallow profiles would
benefit most from additional water gifts during the growing season.
As far as the potential for water collection is concerned, the variability
of runoff over the years is considerable. In a relatively dry year like
1979 (figure 4. 2. ) and without any runoff during the first 100 days or so,
a runoff collection system would not be of any help. But in most years,
runoff can be expected even during the early part of the season. The wet
year 1981 (figure 4.1. ) actually shows a high amount of runoff in the first
half of the season, followed by a stress period. In other years, however,
(1980, figure 4.3.) runoff is present, but the quantities involved are
small. This stresses the need for careful collection and use of this water.
In such situations the behaviour of fields or areas as related to their
size can be of considerable importance. Comparing the cumulative runoff
from a 0.4 hectare field and a neighbouring 4 hectare subwatershed, experi
encing the same rainfall, the higher runoff level from the smaller area is
clear (table 4. 2. ) .
Table 4.2. Observed runoff (mm) from similarly treated 4 ha watershed and 0.4 ha field (mean figures of two areas both) during the period June till October, for three years.
Year
1979 1980 1981
Précipitât (mm)
660 720
1.000
ion Runoff (mm)
4 ha watershed
90 80
180
0.4 ha field
90 110 240

40 -
MM
PS = 75 MM
140
120
100
80
60
40
20
n
-
-
-
-
_L / 1 1 1
•* Period of reduced transpiration \ /
—*• Period of severe water-stress
PS = 150 MM
v ^ - -N
1
MM HO
I
120
100
80
60
40
20
0
Total rainfall : 1000 mm
_flj dil
Cumulative runoff
Imn M JILII iffllih n, IL 0 nniüll rJl ÜU1 10 20 30 40 50 60 70 80 90 100 110 120
DAY NUMBER
Figure 4.1. Calculated available moisture for profiles with storage capacity (PS) of 75 mm and 150 mm respectively (June-September, 1981).

41 -
100 i -
MM
MM
KO
120
100
80
60
40
20
O
KO 1
120
100
80
60
40
20
O
Period of reduced transpiration
Period of severe water-stress
Total rainfall : 635 n
Jk
PS = 75 MM
PS = 150 MM / /
Cumulative r u n o f f -
 10 20 30 40 50 60 70 80 90 100 110 120
DAY NUMBER
Figure 4.2. Calculated available moisture for profiles with storage capacity (PS) of 75 mm and 150 mm respectively (June-September, 1979).

42 -
MM 10Q
80
60
40
20
0
- f\ - 1 SJ_
1 Ï 1
\ y \
X / v^
PS
/ \ 1 \
: 75 MM
f \ -y x7' ' -" '
MM 140 -
120
100
SO
60
40
20
0
MM
Period of reduced transpiration
Period of severe water-stress
PS = 150 MM
140
120
100
ÖU
60
40
20
n
~ Total rainfall : 730 mm
^i 0
I I â J to
I _ _ _ J
L
^ r ! Cumulative runoff
Î1 1 r Lj—nJLlL 1
10 20 30 40 50 60 70 80 90 100 110 120
DAY NUMBER
Figure 4 . 3 . Calculated ava i lab le moisture for p r o f i l e s with s torage capac i ty (PS) of 75 mm and 150 mm respec t ive ly (June-September, 1980).

- 43
CHAPTER 5 THE WATER MOVEMENT IN RAINFED AGRICULTURE
5.1. A Flow Chart for Water Movement
The single primary source of water in rainfed agriculture is the local
precipitation. As we restrict ourselves in this study to the tropical
regions, we can assume that transport and storage will always take place in
the liquid or vapour phase.
The geographical area under investigation is restricted to small agricul
tural watersheds, as defined in section 2.8., deprived from the possibility
of recovering groundwater for agricultural use. Deep drainage and percola
tion of water, therefore, are considered as losses in the water balance.
Import of water as source of supplemental irrigation is not considered.
Apart from negligible quantities of dew, the input is the local rainfall
only.
Figure 5.1. is a simple flow chart, indicating the water movement in such a
rainfed agricultural system with surface water collection and re-utiliza
tion, under the restrictions given above. Its objective is to indicate the
general relation between precipitation and the crop available moisture,
which is the water temporarily stored in the soil profile as far as it can
be used by the crop for transpiration.
Precipitation Precipitation falls in storms of different sizes and intensities and at
unpredictable times of occurrence (section 5.2.). These factors, together
with particulars of the crop including its growing stage, infiltrability of
the profile, topography and land-management factors, define the way the
water moves.
Interception After the rain has ceased, part of the precipitation remains on the vegeta-

- 44
( crop available V moisture precipitation
—©- infiltration\
/subsurface/ drainage / flow /
-<D- depression storage
5
/surface, flow /
'surface runoff
interception
surface retention
surface detention
losses J-
' evaporation
'reservoir/ storage /
-©-
'percolation/
dead storage/
conserved storage
/application/ losses /
process /input/output/
Figure 5.1. The water movement in a rainfed agricultural system.

- 45 -
tion surface and on organic mulches and residues lying on the soil surface.
This amount is known as interception. The total quantity of interception is
of course strongly dependent on the percentage and density of crop cover
and the presence of a litter layer. At crop establishment stage the inter
ception by the crop cover is still negligible. But even with a fully devel
oped annual crop the quantity of water retained will be restricted to a few
millimeters only. The intercepted water will drip or evaporate from the
surfaces (Blake, 1975). Interception can have a large influence on the
water balance of forests (Linsley, 1949), especially in climates with
frequent rains of low intensity. For annual crops it is less important and
can be described as a simple subtraction of the total quantity of precipi
tation in the early stage of a rainstorm. It has no significant influence
on the intensity of precipitation reaching the soil surface, but may
strongly reduce the kinetic energy of the raindrops. Through this latter
effect interception may help in maintaining the infiltrability of the soil
profile by protecting the topsoil-structure.
Infiltration The precipitation that reaches the soil surface will partly or completely
infiltrate into the soil profile. The maximum rate at which the water
enters the soil at a certain time is fixed by the infiltrability, defined
by Hillel (1974) as the infiltration flux when water at atmospheric pres
sure is made freely available at the soil surface. This means that:
I = P if P < I (5.1.) a r r max x '
1 = 1 if P > I (5.2.) a max r - max v '
with I = Actual infiltration rate (mm/h)
P = Precipitation rate (mm/h)
I = Infiltrability (Maximum infiltration rate) (mm/h)
The infiltrability is determined by the texture and structure of the soil,
and its moisture content (section 5.3.1.), showing a variation over short
and longer periods of time within the growing season. The infiltrated water
adds to the profile-storage which is the reservoir from where a growing
crop will take the water required for transpiration.
Losses from Profile Part of the water held by the top layer of the profile, however, evaporates
under the influence of the energy-influx at the soil-surface.
Another sink may be formed by weeds, that directly compete with the crop
for transpiration.

- 46
evaporation
infi ltration
^^m surface retention (micro-depression storage)
'///7 depression storage (mini-and macro-depression storage]
_ ^ surface detention (dynamic storage I
Figure 5.2. The water balance at the soil surface: retention, detention and depression storage.
Water i n f i l t r a t e d i n excess of t h e maximum p r o f i l e s t o r age c a p a c i t y cannot be he ld and w i l l , under i n f l uence of g r a v i t a t i o n a l f o r c e s , move downward, l e av ing t he a rea from where r o o t s could p o s s i b l y e x t r a c t i t . This wa te r , cons ide red as deep d r a i nage , w i l l add t o t h e groundwater r e s e r v e , l o c a l l y o r , a f t e r h o r i z o n t a l t r a n s p o r t , e l s ewhere . In t h e s t ud i ed s i t u a t i o n , deep d ra inage of wa te r , when no t r ega ined by c a p i l l a r y r i s e , i s a l o s s - f a c t o r .
Surface Retention and Depression Storage
I f t he i n t e n s i t y of p r e c i p i t a t i o n a t any moment exceeds t h e i n f i l t r a b i l i t y of t h e p r o f i l e , excess water w i l l s t a r t b u i l d i n g up on top of t h e s o i l s u r f a c e . Grav i ty w i l l f o rce t h i s wa ter t o move, fo l lowing t h e l o c a l s l o p e . P a r t of t h i s wa te r , however, w i l l immediately be t r apped i n m i c ro -dep r e s s i o n s , which a r e c l o sed d r a i n s , formed by f r e sh or weathered s u r f ace a gg re ga t e s and o rgan ic m a t e r i a l (figure 5.2.).
This phenomenon i s known as t h e s u r f ace r e t e n t i o n of wa ter or m i c ro -dep r e s s i on s t o r age (table 5.1.).
After t h e l o c a l m i c ro -dep re s s ions a r e f i l l e d t o c a p a c i t y , excess water w i l l s t a r t t o f low. Not a l l of t h i s water w i l l l e ave t h e a rea cons ide red as p a r t
Table 5 .1. The different levels of depression storage
micro-depressions mini-depressions macro-depressions
typical horizontal examples distances
1 - 10 mm 10 - 50 cm
> 1 m
depressions formed by aggregates tied furrows, implement marks topographical depressions, contourbunds
- 47 -
of it could be caught in larger depressions within the cropped field.
In this study, a further differentiation is made between mini- and macro-
depressions (table 5.1.). Mini-depressions, often purposely created or
maintained and mostly located outside the crop rows, have such a size that
they will remain present during the crop growth unless intentionally re
moved. Macro-depressions will either be of natural origin, formed by topo
graphic undulations, or purposely created to restrict field outflow. They
have a more permanent character, cover a much larger area than mini-depres
sions and consequently do interfere with the growing crop.
While depressions are filled up during periods that rainfall intensity is
in excess of infiltrability, the reverse process starts whenever rainfall
intensity falls below the infiltrability of the profile. Emptying of de
pressions through infiltration continues after cessation of rain. Part of
the water stored is also removed by evaporation.
Surface Flow and Surface Detention While, during a period of rainfall excess, the micro-depressions are filled
up, surface flow in the field begins. This water, moving as free water over
the soil surface, will start filling up mini- and macro-depressions, if
present, while an increasing part will contribute to the outflow of the
field. This process goes to the point that all available depressions are
filled to capacity and additional excess rainfall is moving towards the
drainage channels. This volume of moving water, producing surface runoff,
is known as surface detention (Horton, 1940). After the rainfall excess is
over and consequently the source of overland flow stops, part of this
surface detention will continue to create runoff, while another part may
infiltrate.
Surface Runoff Surface runoff is that part of the excess rain that ultimately leaves an
area as free flowing water. One must distinguish between field runoff and
watershed runoff, the latter being a combination of fields with a common
drainage channel. Per unit area, field runoff always exceeds watershed
runoff, and the difference may be considerable. In natural conditions,
surface runoff is lost as a source of water for crop production or any
other purpose in the area of origin.
Reservoir Storage Construction of reservoirs makes it possible to collect and store surface
runoff and utilize it at a later date. If the location of the reservoir is
at some distance downstream, the net inflow of the reservoir equals outflow
- 48 -
of the field or fields minus losses, caused by water stagnation and infil
tration in the connecting waterways.
Reservoir Losses
Losses during storage consist of evaporation losses and percolation losses,
which are related to reservoir characteristics, climatic conditions and
time. In addition, losses may occur through transpiration by emerging or
floating aquatic weeds. Of the water remaining at the time it is required
for irrigation, part is not recoverable from the reservoir, the so-called
dead storage.
Available Water Part of the original precipitation is directly available for the crop; from
any excess at best only part can be conserved for irrigation at a later
stage of the season through collection of runoff and storage in reservoirs
or from recovery of groundwater. In the area described only the first
method is feasible.
Distribution of rain and storm intensities are the major uncontrollable
variables. Topsoil condition could be controlled to some extent and much of
the reservoir losses could be avoided but only at high costs.
The available water in the reservoir could be transported to a (cropped)
field. As in all irrigation, application losses occur at this stage.
5.2. Rainfall Characteristics of Hyderabad, India
The semi-arid tropics have a monsoon-type of climate with a dry season in
winter and a wet season in summer. Characteristics of the wet season, as
starting time and duration, amount, distribution and reliability of rain
fall, may restrict the crop choice or limit its yield potential under rain-
fed conditions (Webster and Wilson, 1966). The relations between monthly
values of potential évapotranspiration and rainfall are used to provide
guidelines for the climatic suitability of a location for certain types of
rainfed agriculture (section 3.1.).
Mean annual rainfall in semi-arid tropical India as a whole, a summer rain
fall area, varies roughly from 500 to 1,200 mm '. Figure 3.1. (chapter 3)
+) Values derived from Krishnan (1975), table 2: "Moisture, Aridity Indices and Seasonal Distribution of Rainfall in Semi-Arid Regions". In winter rainfall areas, semi-aridity occurs at much lower amounts of rainfall. Winter rains, however, are more common for subtropical and temperate regions.

- 49 -
shows the rainfall isohyets of the Indian subcontinent. The variability-
over the years, however, is high. The coefficient of variation is 20 - 30%
(Virmani et.al. , 1980b) with a higher value for the drier areas (Jones
et.al., 1981). The mean annual precipitation for Hyderabad, India, located
at 17°27' N and 78°28' E at an altitude of 545 meters, is around 760 mm,
with measured extremes of 320 mm (1972) and 1,400 mm (1917) during the
period of observation (figure 5. 3. ) and a coefficient of variation of 26%.
Dependable precipitation, defined by Hargreaves (1975) as the amount of
rainfall having a specified probability of occurrence, for Hyderabad
amounts to 400 mm/year at a 75% probability level. For the growing season,
calculated from June 1st to October 1st, this figure is about 350 mm.
5.2.1. The Rainfall Distribution
The rainy season in India is confined to the period from April through to
October. In general, the ratio of rainy season rain to annual rain is
related to the latitude of the location (Krishnan, 1975). For Hyderabad
(latitude 17"27' N) this value is 88%. Rainfall occurring outside the rainy
season is generally of no practical use, as storm sizes are too low to
increase the soil moisture reserve. Incidentally a good wetting of the top
soil before April would enable a tillage operation.
U00
1200-
1000
o 800 Mean
Figure 5.3 Annual r a i n f a l l a t Hyderabed, India ; 1901-1977. Derived from Virmani e t . a l . (1980b).

- 50 -
The rainy season, as opposed to the dry season, is the period in which at
least some useful precipitation can be expected. This definition is based
on the expectation that at some point in the early part of the rainy season
rains will exceed and subsequently continue to exceed the actual evapora
tion losses from the bare soil (Webster and Wilson, 1966), so that the
crops can be sown and seedlings may survive. As the transpiration of a
newly established crop remains low for some time, due to their restricted
leaf area (Dancette and Hall (1979)) and likewise, crop water requirements
at the end of the growing season are low again due to ripening, the rainy
season can be indicated as a period that starts earlier and ends later than
the period defined as humid. It includes a part or all of the pre-monsoon
season, the monsoon season and the post-monsoon season. During the former,
Hyderabad receives 11% of the total annual rainfall, whereas 77% falls
during the latter two. In some years, however, precipitation in the pre-
monsoon season might be partly conserved, if water penetrates the profile
below the layer contributing to direct evaporation (section 6.1.).
During the monsoon potential évapotranspiration rates drop sharply, due to
the decrease of solar radiation and temperature. The start of this humid
period is uncertain and could deviate up to four weeks from its mean date
(Arnon, 1972). Monthly mean potential évapotranspiration rates stay below
the mean amounts of rainfall (figure 5.4.). Considering shorter periods
Figure 5.4. Precipitation (P) and potential evaporation (PE); monthly means for Hyderabad, India.

51 -
within this humid period, this is not necessarily true, and most locations
in India are even characterized by the occurrence of a dry spell in August.
Yet, such a relatively short dry spell is still considered as part of the
humid season (Jackson, 1977). The seasonal distribution of rain for
Hyderabad is illustrated by the 3-week moving average rainfall
(figure 5.5. (a ) ) . Again, a dry spell in mid-August is clearly shown. The
frequency of occurrence of different storm size intervals on a weekly basis
is given in Appendix 2, whereas the percentage contribution of different
storm sizes to total rainfall, in 3-week moving periods, is graphically
indicated in figure 5.5.(b).
The figure shows an increasing representation of bigger size storms in the
course of the humid season. While, for example, 40% of the rainfall in the
early weeks of the humid season occurs in storms of over 20 mm, this is
about 60% by the end of September at a similar total rainfall figure. Storm
sizes are important parameters, as, on the one hand very small storms are
hardly effective for crop growth and most water will evaporate directly
without contributing to soil moisture and crop transpiration, while on the
other hand bigger storms may give rise to high runoff percentages and
erosion.
(mm) 40-
30-
20-
10
°/o
60-
50-
40-
30
< 20mm
n — i — r "i—i—i—i—i—r
A S
i—r "i—r
Figure 5.5. The seasonal distribution of rainfall as 3-week moving averages for Hyderabad, India, (a) Weekly rainfall, (b) Percentage contribution of storms smaller than 20 mm to all rain.

- 52 -
5.2.2. Intensities of Rainstorms
The intensity of a rainstorm is defined as the amount of precipitation per
unit of time and is generally expressed in mm/h. It is an important para
meter in the water movement. If the intensity of rainfall at a certain
moment exceeds the infiltrability of the profile, excess water may lead to
runoff and transport of soil. Moreover, the intensity of a rainstorm deter
mines its kinetic energy. High kinetic energy may result in severe aggre
gate destruction, surface compaction and soil splash.
Most storms can be divided into intervals with more and less intense rain
fall. Intervals with a high rainfall intensity will, to a large extent,
characterise the erosivity of the storm. Particularly during these inter
vals the kinetic energy reaches its highest levels.
Intensities of rainstorms are, therefore, often expressed on the basis of
intervals of 5, 10, 15, 30 or 45 minutes. Intensities of storms are then
given as the maximum precipitation during any such interval within the
rainstorm.
A storm can also be identified by its Weighed Mean Intensity (W.M.I.),
defined as
1 n W.M.I. = - i P. . I. (mm/h) (5.4.)
P i=l 1 1
with P. and I . t h e r a i n f a l l and i t s i n t e n s i t y r e s p e c t i v e l y for each of n
i n t e r v a l s . The i n t e r v a l s a r e chosen as p e r i od s of c o n s t a n t i n t e n s i t y as
r ead from t h e r a i n f a l l c h a r t s . C h a r a c t e r i s t i c for t h i s e xp r e s s i on i s t h e
i n c l u s i o n of t h e t o t a l s torm s i z e , P.
I f r e l a t e d t o runoff , ( p a r t i c u l a r l y wi th t he u n s t ab l e r ed s o i l s ) , t h i s ex p r e s s i o n g ives a more a c cu r a t e d e s c r i p t i o n of a s torm, as t he runoff p r o ducing c h a r a c t e r of a s torm does no t h e av i l y depend on t h e extreme i n t e n s i t y of i t s i n t e r v a l s (Chapter 6).
+ ) An estimate of rainstorm energy, E, , can be made with the help of an empirical formula as developed by Wischmeier (1958): E = 11.9 + 8.73 log I (MJ . ha . mm ) (5.3.) with I = Rainfall intensity in mm/h. The erosivity of the total rainstorm is subsequently defined as the product of total rainstorm energy and the maximum 30-minutes intensity. This yields the EI-.-index, which in many situations has been proven to give a good correlation with observed soil loss (Hudson, 1971).
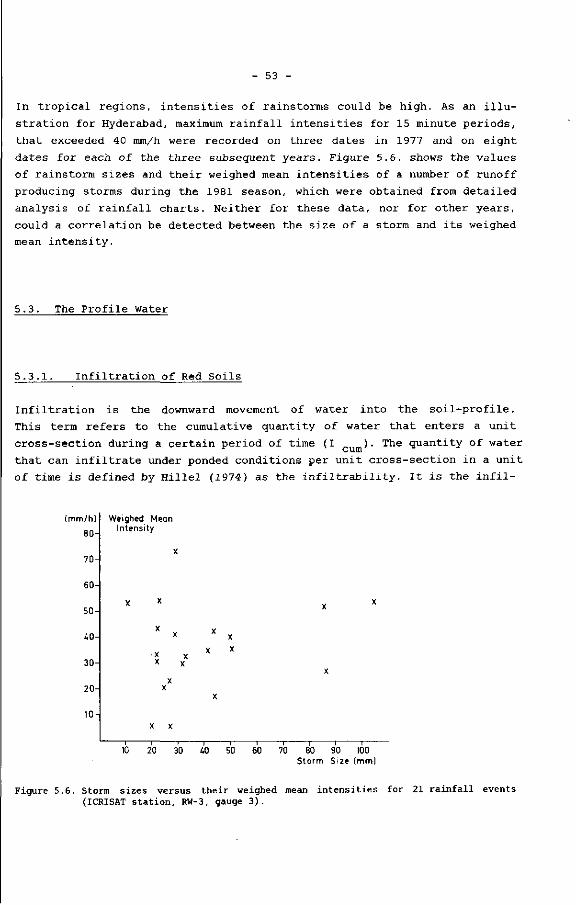
- 53 -
In tropical regions, intensities of rainstorms could be high. As an illu
stration for Hyderabad, maximum rainfall intensities for 15 minute periods,
that exceeded 40 mm/h were recorded on three dates in 1977 and on eight
dates for each of the three subsequent years. Figure 5.6. shows the values
of rainstorm sizes and their weighed mean intensities of a number of runoff
producing storms during the 1981 season, which were obtained from detailed
analysis of rainfall charts. Neither for these data, nor for other years,
could a correlation be detected between the size of a storm and its weighed
mean intensity.
5.3. The Profile Water
5.3.1. Infiltration of Red Soils
Infiltration is the downward movement of water into the soil-profile.
This term refers to the cumulative quantity of water that enters a unit
cross-section during a certain period of time (I _ u m ) - The quantity of water
that can infiltrate under ponded conditions per unit cross-section in a unit
of time is defined by Hillel (1974) as the infiltrability. It is the infil-
(mm/hi
80-
70-
60-
50-
40-
30-
20-
10-1
Weighed Intens
X
Mean ty
X
X
X X
x x x X
X X
X X
X
X
X
X
X
X
X
X
10 20 30 40 50 60 70 80 90 100 Storm Size (mml
Figure 5.6. Storm sizes versus their weighed mean intensities for 21 rainfall events (ICRISftT station, RW-3, gauge 3 ) .

- 54 -
tration flux density, when water is made freely available at the soil sur
face and at atmospheric pressure
dl cum 1 - 4 . = (5.5. ) inst. ,. v ' dt
This value decreases with increasing profile moisture content up to a
constant value at saturation (If), inherent to the texture, structure and
density of the soil. The general shape of an infiltrability curve for an
initially dry soil shows a high value at the moment water application
starts, followed by a more or less sharply decreasing interval and ap
proaching a constant value - the final infiltration rate.
Profiles with layers of different texture or structure are non-uniform and
have a final infiltrability determined by the vertical saturated conducti
vity of the horizon with the lowest permeability, assuming that no horizon
tal flow occurs. Moreover, sharp boundaries separating horizons will act,
upon wetting, as a barrier for water transmission under unsaturated condi
tions .
Profiles of most red soils are inhomogeneous. Alfisols are characterized by
an argillic B-horizon whereas the Entisols are stratified due to their
layerwise deposition (IRRI, 1974). Spotwise variability is high through
erosion and sedimentation over the years, influencing the depth of the
A-horizon. Infiltration measurements, therefore, are always biased, as no
location can be selected which is representative for a larger area. Other
general errors encountered in infiltration measurements are lateral subsur
face flow and the fact that water is applied as a layer on the surface. On
the one hand, this induces a hydraulic pressure hardly present during
rainfall. On the other hand it might promote air entrapment, which reduces
the infiltration rate.
The problems of lateral flow and local variability can partly be solved by
choosing a larger area for the infiltration measurements and by surrounding
this area with a buffer-zone. At ICRISAT, square metal frames of size
1.5 x 1.5 m are used for this purpose, with a second frame of 2.44 x 2.44 m
placed around it, creating a buffer-zone of about 45 cm (ICRISAT, 1976).
Figure 5.7., line 1, shows the measured infiltrability of an Alfisol pro
file against time, using such infiltration frame.
Tricker (1978) studied the accuracy of single ring infiltrometers. To
compensate for lateral flow, he measured total wetted volume and wetted
volume below the cyclinder in laboratory experiments. This enables the

55 -
I . (mm/h) inst.
ISO
140-
120-
100-
80-
60-
40-
20-
F la t c u l t i v a t e d f i e l d , single r ing measurements
- Bedded f i e l d , s ing le r ing measurements
* ) a f ter correct ion for l a t e ra l f l ow I see t ex t )
160 180 200 220 240 t ime (min.)
20 40 60 80 100 120 140
Figure 5.7. Inf i l t rabi l i ty of Alsifol profiles at ICRISAT station (RW-3F).
c a l c u l a t i o n of t he t r u e v e r t i c a l i n f i l t r a t i o n , assuming t h e same mois tu re
c on t en t a l l over t he we t ted volume of s o i l , t h rough:
V c
( ) ( 5 . 6 . )
With: f = corrected infiltration (cm/h);
f = measured infiltration (cm/h);
V = wetted volume below cylinder (cm3);
V. = total wetted volume (cm3).
A multiple regression analysis based on his experiments resulted in the
equation:
log f = 0.46 log f - 0.64 log t + 1.08 (R = 0.98) (5.7.) 3 c m
where log = decimal logarithm, and
t = time from beginning of infiltration (min).

- 56 -
With additional measurements he showed that the use of this equation as
correction procedure would yield outcomes, rarely deviating more than 20%
from real values, even for layered soils. Deviation of measured values from
true infiltrability decreased when using larger size cylinders. A cylinder
diameter of 15 cm was recommended as a further increase hardly reduced the
error of measurement.
Lines 2 and 3 in figure 5.7. show the infiltrability of an Alfisol based on
a number of such 15 cm-cylinder measurements, corrected according to Equa
tion 5.7. Measurements were done in the tilled area as well as in the
traffic area of both bedded and flat cultivated fields; each object had
four or five replicates. Individual infiltration values were corrected
according to the described regression equation and are listed in appen
dix 4. The lines 2 and 3 in figure 5.7. were composed of the mean values of
the two zones, giving double weight to the measurements in the tilled zone,
which covers approximately double the area compared to the traffic zone. As
can be seen the resulting lines correspond reasonably well with the much
larger infiltrometer frames (line 1), which evidently supports the use of
single rings for practical reasons.
Compaction of the traffic zone reduces infiltrability. At all times, mea
sured infiltration rates in the traffic zone were about 40% lower than in
the adjacent tilled area (Appendix 4). This difference proved to be highly
significant. Figure 5.8. depicts this situation for the corrected infil
tration-cylinder measurements. The overall effect of the reduced infiltra
bility of the traffic zone might be even stronger as excess water tends to
collect in this part of the field, specifically in the case of a bed-and-
furrow surface configuration.
The infiltration measurements discussed so far are executed by applying a
layer of stagnant water on top of the soil surface, which, as already
mentioned, is not representative of the conditions occurring during rain
fall. In the experiments the full surface area was constantly exposed to
the water. Moreover, compaction of the topsoil due to raindrop impact did
not occur, which otherwise leads to reduced infiltration.
Small plot experiments of a size of 2 by 1.5 meter, described in Appen
dix 11, which were sprinkled at an intensity of about 18 mm/h, showed a
large variation in mean infiltration rates, but were never higher than
16 mm/h. Instantaneous infiltration rates dropped to a value of about
7 mm/h within 90 minutes after initiation of rainfall. Such figures seem
far more realistic under field conditions: Rainstorms with an intensity of
20 mm/h mostly result in runoff, although the infiltration curves of

57 -
figures 5.7. and 5.8. would indicate that this would almost never occur.
This discrepancy, also described by Langford et.al. (1970), concentrates on
the initial stage of wetting, and is mainly caused by the effects of aggre
gate breakdown under rainfall impact (Ellison, 1945). Entrapped air
(Jarrett and Fritton, 1978), influences infiltration in the opposite direc
tion, but at a different rate. More often than not, initial infiltration
rates, measured by flooding techniques yield higher values than those
obtained through measurements with simulated rainfall.
Final infiltration rates, however, are much less sensitive to the methodo
logies used. In earlier measurements this final rate for Alfisols was
already found as 7.7 ± 3.7 mm/h on basis of 8 measurements with the
1.5 x 1.5 meter infiltrometer in two locations at ICRISAT's research sta
tion (ICRISAT, 1977), which is of the same order as those found in the
infiltration cylinders.
16Q-I
140-
120
100-
80-
60-
40-
20-
Cultivated Zone of F lot F ie ld
Cul t ivated Zone of Bedded F ie ld
Traff ic Zone Bedded F ie ld
Traf f ic Zone F l a t F i e l d
20 40 60 80 100 120 140 160 180 200 220 time I min.)
Figure 5.8. Infiltrability of cultivated zone and traffic zone of an Alfisol, after correction for lateral flow.

- 58 -
Total field infiltration, though strongly related to the infiltrability,
also depends on other factors, as can be understood from figure 5.1. Sur
face storage of water, which is the combined effect of depression storage,
surface retention and surface detention, increases the time available for
infiltration while surface slaking reduces this storage capacity and in
duces crust formation upon drying which leaves the surface in a low per
meable condition (section 6.1.1.).
5.3.2. Evapotranspiration
Mean annual potential évapotranspiration (ET ) for Hyderabad, India, is
reported to be about 1,750 mm (Virmani et.al. , 1980b). As Dancette and
Hillel (1979) illustrate for data obtained in a similar monsoon-climate at
Bambey, Senegal, variation of potential évapotranspiration between years is
small compared with the large variation of annual rainfall. For Hyderabad,
highest mean daily rates are measured during the hot and dry summer season,
with an average of 7 mm/day for the month of May (Figure 5.4.), followed by
a sharp drop upon the onset of the monsoon season. Winter-values are also
relatively low. Single day values could be much higher (over 10 mm/day),
while the values go down to as low as 3 mm for rainy days.
Maximum évapotranspiration (ET ) is defined as the maximum actual évapo
transpiration of an actively growing crop, if availability of water and
crop cover are no restriction. Its value depends on micro-meteorological
conditions, such as temperature, radiation, humidity and wind, and crop
characteristics such as density and aerodynamic roughness of the crop.
ET -values can be measured with the help of a number of different apin c
proaches. Tanner (1967) classified these into water-balance or hydrologie
methods, micrometeorological methods and empirical methods.
Values of actual évapotranspiration (ET ) are generally lower and mostly
only a fraction of the potential rates. Transpiration can only take place
if transpiring plants are present, evaporation depends on the availability
of water at the evaporating surface. Shortly after rainfall, water inter
cepted by the crop canopy or mulch material and water stagnating in de
pressions is available for evaporation. Otherwise, all water contributing
to the actual évapotranspiration originates from the soil profile.
Actual évapotranspiration during the growing season could approximate the
maximum rates in a well-watered field with fully developed crop canopy. As
the level of available soil moisture decreases, actual évapotranspiration
will decline. The value of ET then not only depends on the level of avail-

59 -
able moisture, but also on the atmospheric demand and on the rate of pro
file water delivery (Holmes and Robertson, 1963). Shaw (1980) presented a
diagram of this relative rate of ET as influenced by the available moisture
and the type of demand (Figure 5.9.). The figure is based on data obtained
in an earlier experiment on maize plants grown in containers filled with a
sandy clay loam (Denmead and Shaw, 1962). The observations relate to the
period that the roots were still growing, so that a displacement of the
curves towards the left can be anticipated towards the end of the growing
season.
Part of the water retained will be lost through direct evaporation at the
surface. The level of this evaporation initially approaches the evaporation
from a free water surface, Later on, it is controlled by capillary trans
port which is a much slower process. Finally, it is gradually taken over by
the extremely slow process of vapour transport through nearly dry soil.
Simple relationships for Alfisols to estimate the daily evaporative loss
during short periods after rainfall were used by Singh and Russell (1979)
E* = E /t (t = 1, 2, 3, 10) (5.8.)
E = E* (5.9.)
100 90 80 70 60 50 40 30 20 10 0 °/o Available soil moisture
Figure 5.9. Relative transpiration rates for different levels of atmospheric demand-Derived from Shaw (1980).

- 60 -
with:
E* = evaporation from a bare soil (mm/day);
E = open pan evaporation (mm/day);
t = number of days after recharging rain (-);
E = soil evaporation under a crop canopy (mm/day);
R /R = fraction of net radiation energy received by the soil sur
face (-).
Equation 5.8. is valid for the evaporation starting from the end of rain,
thus including the first stage of evaporation, when the surface is still
wet and evaporation proceeds at an energy-limited rate (Jury, 1966). Rela
tions given by several others (Black et.al. 1969; Ritchie, 1972; Tanner and
Jury, 1976) are of the form:
E c u m = CVt (5.10.)
with:
E = cumulative evaporation (mm);
C = parameter related to soil physical characteristics.
This form is meant to describe the evaporation in its "second stage"
(Ritchie) or "falling rate" (Tanner and Jury) after the topsoil has dried.
Black observed this relation in sandy soils for the complete range of
drying.
Equation 5.8., when compared to Equation 5.10. suggests a higher evapora
tion during the first 6 days after wetting, but a lower rate later on.
According to Russell, (personal communication), the high evaporative demand
in the semi-arid tropics and the sandy nature of the Alfisols justify the
use of Equation 5.8. This was experimentally confirmed by Vollebergh (1984)
on the basis of evaporation measurements, using small buried tubes, at
ICRISAT station. With these experiments he also observed the extremely
short duration of the first stage drying for an Alfisol, always less than a
day.
5.3.3. Crop-Available Profile Moisture
The soil profile is the medium of root growth giving mechanical support to
the plant and acting as a reservoir for nutrients and moisture. Looking at
the moisture aspects, there are a number of physical characteristics, based
on texture, structure and depth of the profile, that determine the pro-

- 61
file's usefulness and effectiveness as moisture reservoir under certain
climatic and topographic conditions. The corner stones of this are the
infiltration, the water storage and water-release.
Infiltrability of the profile is influenced by structure and texture,
layering and surface stability and determines the rate of acceptance of
water. Surface topography, including local slope and depression storage
influences the time available for water to infiltrate (section 5.4.).
The amount of water that remains in a profile some time after complete
wetting is defined as field capacity, generally expressed as a layerwise
volumetric percentage. Only part of this stored water is available for
transpiration as the water, held at suctions above 15 bar (permanent wil
ting point) cannot be extracted by plant-roots. The rate of extraction by
roots depends on the soil capillary conductivity which decreases rapidly as
soil suction rises (Russell, 1973). Level of available water, therefore,
also depends on the rooting pattern, rooting depth and transpiration rate
and is therefore related to crop characteristics and actual climatic con
ditions. Moreover, moisture stored below the rooted profile can move upward
in dry periods. A generalised water availability profile for medium deep
and deep red soils would have the shape shown in figure 5.10.
Volumetric water content
40-
80-
120-
160-
Deep Alfisol
29 mm
40
\
N. 28
B — IS
15 /
10 /
-A
26 mm
\ . 33
B -
\
18
12
\
- A
Medium Al f isol
0.04 0.12 0.20 0.28 0.04 0.12 0.20 0.28
A : Moisture content at f i e ld capacity B : Moisture content at w i l t i n g point
Figure 5.10. Available water profiles for a deep and medium deep Alfisol. ICRISAT (1978).

- 62 -
The total quantity of available moisture differs at each location; it
ranges from as low as 50 mm for very shallow red soils to about 150 mm for
the deep ones. The consequences of the level of profile storage are two
fold. Firstly, shallow soils show a much higher incidence of crop water
stress, as they have a low buffer capacity. Secondly, length of the growing
season is shorter mainly because of the absence of a reasonable amount of
residual moisture at the end of the rainy season. For Hyderabad conditions,
Virmani et.al. (1980 b) estimated the length of the growing season at 15
and 19 weeks for an available water storage capacity of 50 and 150 mm
respectively, based on a 75% probability.
Water losses through evaporation are highest immediately after rainfall in
a field lacking cover. Equation 5.8., section 5.3.2., implies that the
cumulative evaporation between storms equals twice or thrice the daily
potential evaporation for intervals of 4 and 11 days respectively. Addi
tional dry days do not add much to the total evaporation. Rainfall pattern
(frequency and storm-sizes), therefore, determines to a large extent the
absolute quantity of direct evaporation.
Direct evaporation from the soil is the major water consumer before sowing
(apart from transpiration by weeds) and at the early stage of crop growth a
severe competitor for the emerging crop. At this stage both evaporative
demand and transpiration by seedlings depend on water from the same layer
of the profile. As the roots elongate and crop canopy develops the compe
tition for water shows a different picture:
- water requirement for transpiration increases ;
evaporation losses are diminished under the protective cover of the crop
canopy;
the depth from which water is used becomes larger as the bulk of evapo
rative water-loss takes place from the upper 20-30 cm (Henderson, 1979)
whereas roots tend to grow much deeper.
The competition for water is now indirect; the amount of water lost from
the topsoil by evaporation has to be replenished by the next storm before
deeper layers get additional inflow. Weeds are also active competitors at
this stage and should be controlled.
5.4. Excess Rainfall and Depression Storage
Each time the intensity of rainfall exceeds the actual infiltrability at
some point in the field, free water will start building up on that spot. If
this spot is higher than its surroundings water will flow to an adjacent

- 63 -
lower place, where it either infiltrates or adds to the excess water there.
If a point is surrounded by areas of a higher elevation, the excess water
will stagnate in this depression. The water level rises as long as rainfall
and inflow from elsewhere exceed infiltration. This continues until the
water rises high enough to overtop the rim of the depression; from this
stage onward, additional water will flow out, either to fill neighbouring
depressions or to add to surface runoff.
Mitchell and Jones (1978) as well as Moore and Larson (1979) identify three
stages in the process of rainfall, depression storage and runoff:
A build-up of depression storage without runoff;
Additional storage, accompanied by runoff;
Maximum depression storage, with all excess water contributing to run
off.
Linsley et.ai. (1949) expect the duration of the first stage to be ex
tremely short, but its actual length will depend on local conditions.
Overland flow begins at the very moment that the infiltrability of the soil
profile is exceeded. This process starts at one point and will subsequently
include an increasing number of points, unless the rainfall intensity is
barely higher than the infiltration rate. A field is covered with a large
number of micro depressions, and most of the initial flowing water will
reach such depressions before it can leave the area. Moreover, as the water
originates from spots with the lowest local infiltration, or the highest
local rainfall (spots oriented at wind direction), it may pass through
other locations with more favourable infiltration conditions soon after it
started flowing. Depression storage, therefore, may cause an appreciable
time-lag in runoff, esp. if rainfall intensity is not much larger than the
actual infiltration rate.
To understand the behaviour of depression storage, it should be realised
that, as listed by Linsley et.al. (1949):
Each depression has its own capacity or maximum depth;
- After each depression is filled to capacity, further inflow is balanced
by outflow, infiltration and evaporation;
- Depressions of various sizes are both superimposed and interconnected.
In other words, any large depression encompasses many interconnected
smaller ones;
Each depression, until completely filled, has its own drainage area.
As mentioned in section 5.1. three levels of depression storage can be
distinguished in the field: micro-depression storage, mini-depression
storage, and macro-depression storage. These levels differ in individual

- 64 -
capacity, frequency of occurrence, stability and whether or not they can be
created with tillage. These characteristics determine the effectiveness of
the depression storage of a field for water conservation under a given
rainfall regime.
5.4.1. Micro-depressions
Micro-relief depressions or micro-depressions are small. They can be of
natural origin, but in agricultural fields they are mostly created by
tillage. Between the structural elements formed free water can be trapped.
Therefore micro-depressions are connected to the tillage process: they are
easily destroyed or displaced as their dimensions are small compared to
those of the tillage implements. They are easily destroyed by the process
of slaking during rainfall.
Surface roughness is a measure related to the presence and size of such
micro-depressions and related to the level of micro-depression storage or
surface retention (Monteith, 1974). This effect on infiltration is diffi
cult to measure, as the creation of roughness by tillage goes along with
the breaking of the surface crust, both have a similar effect on infiltra-
bility. Similary, the reduction of depression storage by slaking is accom
panied by crust formation. After destruction of the surface aggregates by
rain, smooth and shallow micro-depressions are left. Their capacity to
retain water is low. Because of their shallowness, it is strongly related
to the local slope of the surface. In flat cultivated fields this slope
roughly equals the natural slope, but in bedded fields it is mainly fixed
by the shape of the bed. Comparing these two situations, it is clear that
this stable micro-depression storage capacity is far higher on flat culti
vated fields than on bedded fields.
As indicated by Allmaras et. al. (1966) and by Burwell et.al. (1966) a
differentiation should be made between oriented roughness, consisting of
undulations in the surface relief related to the direction of tillage and
random roughness, which is the random occurrence of surface peaks and
depressions not oriented in any specific direction. In contrast to oriented
roughness, random roughness produces closed depressions, responsible for
the micro-depression storage of a field (Appendix 5).
The potential water storage in surface mirco-depressions is constantly
changed during a growing season by rain, wind and cultivation (Gayle and
Skaggs, 1978). It basically depends on roughness, configuration and orien-

- 65 -
tation of the small depressions with respect to slope direction. Monteith
(1974) and Gayle and Skaggs have made direct measurements of surface stor
age by sealing the soil surface in small plots after cultivation and ap
plying water until runoff has occurred.
Monteith envisaged correlation of level of depression storage to measured
random roughness. Although he found a reasonable relationship between these
factors in his experiments, he states that such regression may not be
generally applicable, apparently also because he did not exclude the orien
ted roughness in his measurements. Moreover, in concurrent experiments by
trying to correlate surface storage with runoff characteristics he found a
very low relationship between them for soils that break down easiliy. His
conclusions, therefore, remain in generalised terms, stating that the
higher the roughness index, the higher the surface storage, the greater the
time to initial runoff and the lower the total runoff in the first 30 min
utes after commencement of rain.
Gayle and Skaggss intended to show the level of micro-storage for culti
vated soils and its change during the year. Highest values, from 14 to
23 mm, were found for an organic soil immediately after primary tillage
with a disk-plough. Weathering and secondary cultivation lowered this
micro-storage to values below 1 mm, for different soil types at the end of
the season (Figure 5.11.).
Several researchers also tried to estimate a value for depression storage
through mathematical methods (Appendix 6).
A major decrease of random roughness or surface storage is reported to take
place in the first 10 to 15 minutes of the rainstorm (Monteith), in the
first few minutes of rainfall (Mitchell and Jones, 1978; Moore and Larson,
disked-wheat seeded
Figure 5.11. Example of the annual variation in micro-depression storage (surface retention) for a sandy loam soil. Derived from Gayle and Skaggs (1978).
- 66 -
1979) or prior to initial runoff (Burwell et.al., 1966). For Alfisols an
early decrease was also observed for an unprotected surface, related to
storm characteristics and the occurrence of runoff (Appendix 10). Reduction
of the depression storage might be stronger than that of roughness, as
flowing water might open up outlets.
5.4.2. Mini-depressions
Mini-depressions are defined here as clearly visible topographic irregular
ities of the soil surface extending over distances around 10-50 cm. Most
commonly, mini-depressions in agricultural fields are unintended marks of
wheels, draft animals or implements. During field operations they might be
removed or recreated. Such mini-depressions may contain an appreciable
depth of water individually, but their low density of occurrence makes them
relatively less important in the total depression storage capacity of a
field.
Mini-depressions, however, could also be made intentionally and at a much
higher density, through the creation of surface relief. In this case appre
ciable storage can be created. Such depressions do not exceed the distance
between rows or plants in horizontal dimensions.
Well-known man-made mini-depressions are created through the technique of
tied-ridging or basin listing, the English and American equivalent respec
tively (Russell, 1973), and also called furrow-damming (Clark and Jones,
1981). This system is useful in low rainfall areas, where dry spells are
interrupted by storms with intensities that are usually higher than infil
tration rates. In this system the field lay out is in ridges with the
furrows or alternate furrows (Lyle and Dixon, 1977) dammed at regular
intervals. Thus small basins are created in which excess water will stag
nate. Although siltation of these basins will reduce their infiltrability,
most of the ponded water will increase the amount of profile moisture,
while a lesser part evaporates.
Crops are sometimes grown at the bottom of the furrow, in highly permeable
soils, but as prolonged water stagnation would damage most plants, planting
on the ridge is preferred. Moreover intercultivation of the crops becomes
problematic where furrows are cropped, unless this is done by hand.

- 67 -
5.4.3. Macro-depressions
Natural macro-depressions are formed by undulations of the land surface and
cannot be removed without special effort (Gayle and Skaggs, 1978). The
distance over which such depressions exist, is less than the dimensions in
agricultural fields. But within the field, macro-depressions could cover an
appreciable area and cause ponding of water. The creation of a surface
configuration, like furrowing, confines the stagnating water to the fur
rows, thus reducing the storage capacity. Under otherwise similar topo
graphic conditions, furrowed fields have a distinctly lower macro-depres
sion storage than flat fields.
Stagnating water in these macro-depressions could interfere with normal
agricultural practices, partly physically, especially where some level of
mechanised farming is used, partly physiologically, as water concentration
in these spots and insufficient drainage interferes with normal plant
growth.

68 -
CHAPTER 6 APPROACHES TO INFLUENCE THE WATER-BALANCE AND THEIR EFFECTS
6.1. Influencing the Profile Water-balance
The maximum crop available water stored in the rooted profile is usually
defined as its moisture content between field capacity and permanent wil
ting point (Bolt et. al. , 1970) and is a function of a number of soil char
acteristics. Actual availability over time is fixed by the in- and outflow
components, forming the profile water-balance or profile water budget.
The variation of stored water may be represented by an equation of the form
A S = I - D - ET (6.1.)
with:
A S = change in profile moisture content (mm);
I = infiltration (mm);
D = drainage beyond reach of rooted profile (mm);
ET = évapotranspiration (mm);
if lateral flow of water in the rooted profile is disregarded.
Under the conditions of rainfed farming in the red soils of the semi-arid
tropics, part of the precipitation runs off as infiltrability of these
soils is often lower than rainfall intensities. To increase the quantity of
moisture available for productive transpiration by a crop under these
conditions, infiltration (I) should be maximized while avoidable losses
within the ET-factor, in casu direct evaporation from the soil surface and
transpiration by weeds, should be minimized. Deep drainage (D) is a loss
factor in situations where this water is not recoverable. This was the case
in the situation studied.
- 69 -
6.1.1. Infiltration Inducement
Susceptibility of the soil profile for water intake is determined by the
presence and distribution of pores and cracks (Russell, 1973), the channels
of flow. The presence of pores, the porosity, can be physically defined as
the percentage volume of voids in a unit volume of soil. It is also the
parameter determining the water holding capacity of the tilled layer, the
so-called plough layer storage of water (Larson, 1964). Porosity is higher
in a well-aggregated loose soil, while compaction reduces it.
The distribution of pores in medium and heavy textured soils depends on the
soil structure, defined by Lai (1979) as the arrangement of primary parti
cles into aggregates. The soil structure cannot be measured directly, but
is important for water transport as it is a representation of the size,
distribution and continuity of the individual pores.
The infiltration into a soil profile is influenced by the permeability of
its least permeable layer. Such a layer could be of natural origin, as for
example a clayey horizon in an otherwise sandy soil or induced as a plough
layer. But in practice, especially during high rainfall events and under
non-saturated profile conditions, infiltration is determined by the surface
characteristics rather than by the hydraulic properties of the deeper
layers (Edwards, 1982). A prominent restrictive layer for infiltration in
the red soils can be formed through compaction of the top layer and sealing
under influence of raindrop impact and wetting (section 3.2.). Permeability
of this layer is shown to be far less than the value below such a crust
(Mc. Intyre, 1958 b). By avoiding its formation or breaking the crust if
already formed, infiltrability of the profile can be increased.
Permeability of a soil profile is also increased by the presence of vegeta
tion (Cannel and Weeks, 1979). Growing roots also penetrate less permeable
layers and profile boundaries, forming continuous pores and leaving chan
nels for water transport after dying. Edwards observed that in a permanent
vegetation on a non-tilled soil, preservation of micro-channels in the
profile, and also crop residues, reduced runoff to a mere 5% of the quanti
ty occurring in a similar cultivated field, although the porosity decreased
from 50% to 40% in the non-tilled treatment.
A well developed crop canopy also moderates the soil temperature, preven
ting total dissication of the topsoil, which would otherwise make it hydro
phobic. This also favours biological activity in this layer, inducing the
creation of micro-channels. A similar effect is attained through mulching
(Lai, 1976).

- 70 -
Unless changed through the execution of specialised and costly deep culti
vation, the texture of the profile and its separate layers may be consider
ed as given. But the structure is liable to change within the growing
season or over the years. The latter occurs throughout the rooted profile
as a long term process based on biological activity - including rooting -,
enrichment by organic matter and demineralization. Seasonal changes are due
to field operations and atmospheric influences, including gravitational
forces and raindrop impact. These changes are restricted to the tilled
layer (through cultivation) or even to the upper few centimeters (through
rainfall impact), increasing or decreasing the infiltrability respectively.
Techniques of primary tillage, secondary tillage and protection of the land
surface with a crop or with mulches, and their influence on infiltrability
are discussed in the following sections.
6.1.1.1. Primary Tillage and its Effect on Infiltration
Primary tillage can only be executed when the field is in a suitable mois
ture condition. From the point of draft availability it would be optimal to
execute the primary tillage operation immediately after harvest. Against
this stands the alternative labour occupation for post-harvest activities.
But even so, the red soils would often be too dry and consequently too hard
to work. As an alternative, primary tillage should be executed immediately
following a soaking rainfall which can be expected to occur during the
pre-monsoon period.
Increase of porosity of the tilled layer can be tremendous and the duration
of this effect may last, be it at decreasing importance, throughout the
growing season. As Henderson (1979) describes, an increase of porosity of
10% to 20 cm depth increases infiltration by up to 20 mm for a single
storm, under the assumption that voids are completely filled with water
once the rainfall rate exceeds the subsoil infiltration rate and that the
porosity lasts throughout the storm. A measurable residual effect of a deep
tillage operation in the subsequent year should not be expected (Vittal
et. al. , 1983).
In an observation at ICRISAT, two systems of primary tillage of a permanent
raised bed of 1.50 m width (measured as furrow-to-furrow distance) were
compared on the effect of water conservation. All operations were executed
with a bullock-drawn wheeled tool-carrier with attached implements as
described in Appendix 7.

71 -
System 1 This system of primary tillage for permanent raised beds was initiated at
ICRISAT and originally meant for the Vertisol areas (ICRISAT, 1981)
(figure 6. 1. (a)) .
It is a strip-ploughing operation that consists of cutting and turning
inwards of the sides of the existing bed with the help of a left and right
hand mold-board plough, transporting the soil to the centre. If done imme
diately after harvest, this operation can be executed with bullock-drawn
equipment even in these clayey soils. In one or two additional operations
the bed is shaped again and ready for seeding.
This system has been transferred to Alfisols without major modifications.
Although such strip tillage system could also benefit red soils areas from
the viewpoint of flexibility of operations it might not be effective enough
to create the best plant environment. To improve on this, these structural
ly inert soils seem to require a higher intensity of cultivation (Charreau,
1977).
System 2
An alternative system of primary tillage was developed by Klay (1983) and
experimentally introduced for use in red soil areas. It is denoted as
intensive tillage. It is also based on the permanency of the location of
A
El A
K A
© ®
Figure 6.1. Primary tillage systems for red soils, (a) system 1: reduced tillage, (b) system 2: intensive tillage. Derived from Klay (1983).

- 72 -
furrows and beds and includes the following steps of operation (fig
ure 6. 1. (b)):
A ridger opens up the bed at the centre turning the soil both sides.
Right and left hand ploughs spaced about 60 cm apart cut two strips on
either side of the bed and transport the soil towards the centre, fil
ling up the furrow created in the first operation.
The same operation is repeated with the ploughs at about 90 cm apart.
A spring-tyne cultivator and ridgers at 150 cm apart are used to finish
the shape of the bed.
This system covers the full width of the bed.
A comparison was made between two adjacent plots of 4 beds with a length of
80 meters, that were tilled according to systems 1 and 2 respectively.
Details on lay-out and observations are given in Appendix 8. During the
period of observation a 20% reduction in runoff was measured for the inten
sively tilled beds of system 2. This reduction should be attributed to the
higher porosity of the tilled layer, which makes the profile more recep
tive to water as well as to the better crop development in this plot.
The bulk density was measured on samples taken from the 2 - 7 cm depth. The
intensive system of primary tillage yielded an extra porosity over the
standard system of:
pa - pb 1.55 - 1.48 X 100% = X 100% = 2.7% (6.2.)
p 2.65
With:
pa = bulk density plot A (system 1) (g/cm3).
pb = bulk density plot B (system 2) (g/cm3).
p = particle density (g/cm3).
which, assuming the same difference over the top 15 cm, represents an
additional water storage capacity of 15 x 0.027 = 0.4 cm = 4 mm.
It should be noted here, that the observations on bulk density were done
towards the end of the rainy season and consequently represent the residual
effect of the primary tillage executed some 2^ months earlier.
It should be realised, however, that the surface conditions may also be a
limiting factor for infiltration. The usefulness of the extra porosity,
therefore, is highest in situations where porosity would otherwise have
been restrictive, i.e. either in situations of long duration, low intensity

- 73 -
rainfall or at higher intensity rainfall when the surface crust is broken
by recent cultivation.
Soil loss, measured as suspended material in the runoff water seemed to be
highest from the intensively tilled plot, but insufficient data and the
inaccurate method of sampling do not allow for definite conclusions.
As quality of plant stand has a definite effect on infiltration, primary
tillage can also indirectly influence infiltration by enabling a faster
development of the crop. This gives better protection against rainfall
impact and is accompanied by deeper rooting. Willcocks (1981) reports this
effect in two ways, one, showing an increase of sorghum yields with depth
of primary tillage and secondly, between two systems of shallow tillage,
through showing the superiority of a poly-disc tillage over sweep tillage.
He ascribes the latter difference to the creation of a corrugated interface
with the undisturbed soil of the profile. This causes lines of weakness
through which roots penetrate more easily. These effects were observed for
a ferruginous sandy loam soil. For a less dense and more sandy soil the
deep loosening appeared unnecessary.
6.1.1.2. Secondary Tillage and its Effect on Infiltration
Secondary tillage could be defined as the cultivation practice executed
after seeding of a crop, and is therefore synonymous with intercultivation.
It is a shallowly executed operation as the residual effects of the earlier
primary tillage do not require additional deep loosening. Moreover, to
avoid mechanical damage to the emerging or standing crop, secondary tillage
is bound to be restricted in depth and lateral soil transport.
In contrast to primary tillage, secondary tillage is repeated several
times, generally up to the moment the density or height of the crop pro
hibits further entry into the field. This means that a decrease of its
effects can be counteracted by a renewed cultivation, until the crop-canopy
forms a more or less effective protection of the surface.
Shallow cultivation fulfills several objectives, such as:
the control of weeds;
incorporation of fertilizer;
creation of a 'dust-mulch' to reduce evaporation;
- breaking of crust or compacted toplayer to promote infiltration;
creation of surface roughness for micro-storage.

- 74 -
The last two objectives are aimed at improving the infiltration. The break-
ing-up of the top layer by shallow cultivation increases the infiltrability
of the profile. It also creates micro-depression storage which allows more
time for infiltration of excess rainfall. The effect on infiltration is the
same for both mechanisms and is difficult to separate (Burwell and Larson,
1969) .
The influence of tillage on the soil-physical conditions is a reversible
one and subsequent rain destructs (part of) the created structure again,
reducing its effectiveness and necessitating a repetition of the tillage
operation.
There are more factors that determine whether or not a cultivation is ap
propriate. Crop stage has been mentioned already, but accessibility of the
field and availability of time as competitive to other activities and costs
involved should also be considered.
Additionally, the question could be asked as to how far more frequent
tillage reduces the stability of the aggregates formed, inducing an easier
decay of structure by raindrop impact. In this respect, Johnson et. al.
(1979) stated that overtillage reduced the surface roughness. This ques
tion, however, relates to the natural stability of the aggregates. While
mechanically applied forces tend to disrupt the natural stability, soils
that are naturally unstable, like the red soils, can hardly be further
disrupted by mechanical action.
Table 6.1. shows the influence of intercultivation on runoff and soil loss,
measured for two series of ten runoff plots, each 45 m2, in August -
September 1980 (Appendix 9). While no cultivation was done during this
period in the series II plots, a shallow cultivation was executed in
series I in the middle of the reported period. This cultivation proved to
reduce runoff considerably at least for the subsequent two storms. With
continuing rain, however, the runoff level increased again. The amount of
soil transported by the runoff water was higher than for the plots left
uncultivated. The rate at which this accelerated soil loss may occur after
intercultivation, is unpredictable, as it depends, among other factors, on
the size, sequence and intensity of storms. From the table it seems that in
this specific situation, the benefits of increased infiltration through
intercultivation have to be paid for by higher soil losses. However, this
will not always be so, as periods between storms will generally be longer.
Over the season one may expect a reduction of soil loss through cultiva
tion, also because of a better crop development and earlier surface protec
tion under the influence of water conservation.

75
Table 6.1. Runoff (mm) and soil loss (t/ha) from 45 m2 plots. (RW-3F, 1980). Plot series I : with shallow cultivation end of August (n = 6). Plot series II : without intermediate cultivation (n = 5).
Date »+) T+>
Plot Series I
Runoff Soil Loss
Plot Series II
Runoff Soil Loss
mm/h t/ha t/ha
same treatment
30-7 6-8
13-8 14-8 20-8
23 22 13 13 56
24 24 21 30 25
6.1 7.2 1.5 3.7 5.8
0.42 0.40 0.10 0.22 0.38
5.7 6.7 1.7 3.3
10.6
0.27 0.30 0.06 0.14 0.53
Subtotal 24.3 1.52 28.0 1.30
cultivation no cultivation
2-9 3-9 6-9
18-9
30 20 30 12
152 25 31 12
0 1.6
15.0 6.1
0 0.12 0.62 0.07
11.1 7.1
> 20 4.5
0.11 0.07 0.17 0.16
Subtotal 22.7 0.82 > 42 0.51
+ ) P = Precipitation WMI = Weighed Mean Intensity of storm.
A more elaborate experiment was executed during the 1982 rainy season
Objectives were to get a better insight into the influence of secondary
tillage on runoff and the stability of the surface roughness induced.
Details on lay-out and observations are described in Appendix 10. On the
basis of runoff measurements for 7 storms, regression lines could be de
rived, indicating the runoff as influenced by cultivation, storm size and
rain intensity. Figure 6.2. shows the runoff from cultivated plots as
percentage of runoff from the uncultivated controls.
With this information and the distribution of rainstorm sizes over the year
(section 5.2.1.) we can estimate the expected conservation of water through
repeated cultivation of a fallow field. For a wide range of storm-sizes
rainfall quantity and weighed mean intensity of the storm were not related
(section 5.2.2.). For this calculation therefore, we assume a W.M.I, of
+) The experimental work was carried out by Mr. S.J. Weststeyn as a thesis-subject. His participation is acknowledged.

76 -
100 % 90
80
70-
60
50-
40-
30
20
10
Runoff from cultivated fields Runoff from uncultivated fields
-x 100
W.M.I = 60 mm/h
W.M.I. = 40 mm/h /
/ / / /
/ W.M.I =20 mm/h
/
20 30 40 50 60 70 80 Precipitation (mm)
Figure 6.2. Runoff from cultivated fields as a percentage of runoff from uncultivated fields for different storm sizes and intensities.
40 mm/h for all storms, which is on the safe side. Small storms might have
a lower intensity which would give a higher level of water conservation;
for bigger storms, even if their intensity exceeded 40 mm/h, the behaviour
would be similar for all intensities. The result of these calculations is
shown in figure 6.3. as a 3-week moving average (histogram (a)) and as
total conservation (line (b)).
Illustrative as they are, these figures can have no absolute value, as they
relate to an unrealistic situation. The fields are unprotected against
raindrop impact and have a higher moisture content than can be expected in
a cropped situation. Both factors would otherwise lead to a higher infil-
trability than used in the calculations leading to figure 6.3. The latter
does show, however, the large influence of cultivation and the need to con
sider its frequency as well as surface protection.
Reliefmeter measurements during these experiments proved the instability of
the tillage-induced roughness for this Alfisol. While a cultivation was
seen to bring the Random Roughness Index (RRI), as defined in Appendix 5,
to a value of 6 - 8 mm, a single runoff producing storm could reduce it
again to 2 - 3 mm (figure 6.4.). This reduction, partly related to the
amount of rainfall, did not depend on the number of previous cultivations.

77 -
weekly water conservation (mm)
cumulative water conservation (mm)
Figure 6.3. Theoretical water conservation through repeated superficial cultivation in a fallow Alfisol. (a) weekly values, (b) cumulative values.
In other words : the frequent cultivations did not reduce a form of natural
stability (Appendix 10). In practice, this means, as stated before, that
repeated shallow cultivation has no appreciable effect on the stability of
soil structure. To maximize water conservation, it should be repeated after
a runoff producing rain, at least as long as no protection is given to the
field through a crop canopy or a mulch.
6.1.1.3. Maintaining Infiltrability through Crop Cover and Mulches
The role of a crop canopy in protecting the surface structure is related to
its capacity to decrease the velocity and size of the raindrops during
heavy storms. In this way, it reduces the kinetic energy that reaches the
soil surface. Its effectiveness depends on the sizes, shape and density of
the leaves. During the period of crop cover and -transpiration, the infil
trability of the profile will also remain higher because of biological
activity and use of water.
As a measure of crop cover the leaf area index (LAI) is usually taken. An
alternative, used here, is the percentage of light interception which is
measured at ICRISAT for different (inter) crops. Figure 6.5. gives a number

- 78
Date Rainfall between RRI measurements (mm)
21/7
54 mm
27/7
62 mm
30/7
36 mm
13/8
RRI 2.7

- 79
Figure 6.4. Random roughness index (RR1) of an Alfisol (RW-3C), as created by superficial cultivation (horizontal arrows) and subsequently decreased by rainfall (vertical arrows).
RRI = 3.2 RRI = 4.1

80
80
70
j 60 O"
I 50 CL 0> O
S 40-c _ 30-.c en
^ 20-
10-
Sole Sorghum
— Sorghum/Pigeonpea Intercrop
Sole Pigeonpea
Sole Pearl M i l le t
—J-
2 4 6 8 10 12 14 16 18 20 22 weeks after emergence
Figure 6.5. Light interception for some cropping systems at Hyderabad, India. Adapted from Natarajan and Willey (1981); Reddy and Willey (1981).
of such lines to show the periods and levels of protection one may expect
from different crops or crop-combinations.
During periods of low cover, tillage is needed to maintain or increase
infiltrability. The major benefits of secondary tillage for water conserva
tion, can be expected between the first rains and full canopy development
and again directly after removal of a component in an intercrop. These
periods coincide with occasions on which secondary cultivation is possible
and is also necessary for weed control.
Figure 6.5. also shows the differences in cover provided by various crops.
Choice of crops (including crop combinations and varieties) and optimiza
tion of their growth environment are important in obtaining early cover.
Mulching, the application of (organic) material on the soil surface has
been proven to give another effective protection, especially during the
period of incomplete plant cover. Many authors have reported significant
increase of infiltration through mulching (Mannering and Meyer, 1963;
Unger, 1975; Lai, 1975). Apart from the direct effects on maintaining
infiltrability through surface protection, mulching also reduces soil
erosion, whereas repeated mulching and incorporation of the organic ma
terial will improve the topsoil structure, through an increase of biologi
cal activity (Vleeschauwer et. al. 1980). An increase of the profile reten
tion capacity through frequent application of organic material, is shown to

- 81 -
be insignificant (Russell, 1973). Although some of the reported data are
impressive and worth bearing in mind, the reality of rainfed farming in
semi-arid tropical regions generally does not allow for the use of organic
material in the required quantities due to its alternative applications as
fodder, construction material or fuel (FAO, 1977; Asseldonk and Stolwijk,
1983). Jones and Wild (1975) in this respect also mention the risk of a
carry-over of insect-pests and the uneconomic nature of the operation.
Another method is the vertical placement of straw or other material in
slots. This approach aims at a local inducement of infiltration. Clearly,
required quantities of organic material are much less than in the case of
surface mulching. Benefits of such use are reported by Rao et.al. (1977)
for Southern India in an area of extremely low rainfall and heavy Vertisols
with low infiltrability. The technique is costly, also in view of the fast
decomposition of the material under tropical conditions. So far, it seems
an acceptable water conservation method only if other approaches have no
effect.
Live mulch or smother crops, apart from their own production potential,
could have positive effects on infiltration, erosion reduction and weed
suppression. Competition for available water in the profile, however, makes
them less suitable for use on the red soils of the semi-arid tropics.
6.1.2. Reducing Evapotranspiration
Evaporation from the soil surface and transpiration of weeds are loss-
factors in the profile waterbalance. The latter can be minimized by timely
cultivation. Amounts of water lost through evaporation are high immediately
after wetting of the soil surface, especially if this surface is unprotec
ted. By stimulating a good canopy development evaporative losses over much
of the rainy season will be decreased whereas a protection throughout the
rainy season could be created through the application of sufficient mulch.
However, apart from the problem of availability of sufficient mulching
materials, mentioned before, large quantities of mulch hamper mechanical
operations. Henderson (1979) also indicates that rain interception by
partially decomposed mulch will be appreciable, where the water is largely
evaporated later on.
Reduction of evaporation can also be achieved by shallow cultivation,
creating a "soil-mulch" or "dust-mulch" (Féodoroff and Rafi, 1963). This
disrupts the continuity of pores, changing the upward water movement by

- 82 -
capillary flow, to the much slower process of vapour diffusion. It could be
argued that cultivation induces evaporation as it brings moist soil to the
surface, creates a higher surface roughness, increasing contact with the
atmosphere, and reduces the surface albedo. Nevertheless Linden (1982) came
to the conclusion that changes in hydraulic properties of the soil were of
more importance. For unstable soils, like the red soils, such cultivation
might be even more effective. According to Welling (1965), their dense
packing results in higher rates of upward water movement, compared to more
aggregated soils.
A cultivation will promote complete and fast dissication of a thin top
layer. The low water retention capacity of the red soils leads to deeper
wetting. Thus it becomes more likely that useful amounts of water can be
conserved in this way.
6.1.3. The Effects of Surface Configuration on Soil Moisture and Plant
Establishment
In traditional agricultural systems in semi-arid India, crops are grown in
flat cultivated fields. Introduction of a different surface configuration
like ridges or beds, influences the surface water movement. The effects of
this on a field scale and their consequences will be discussed in sec
tion 6.2.
In a separate experiment, observations were made to detect the local influ
ence of the surface configuration. Differences in moisture content of the
top soil and observed crop growth are supposed to reflect a different
runoff performance and a different internal drainage of the top soil. In
four replications, therefore, flat plots were compared to bedded plots in
respect to layerwise profile moisture content, root growth and development
of foliage (Appendix 11).
The season was extremely wet, especially during the second half of August,
when no sampling could be done. Yet, no clear differences could be observed
in soil moisture between the two land management treatments (figure 6.6.).
On most dates, however, observed values are close to or at field capacity
for both treatments (Appendix 11). During the period of about two weeks in
August that could not be sampled, drainage might have been inferior in the
flat cultivated plots, resulting in waterlogging.

- 83
34-1 @ Moisture at 0-10 cm (% vol.)
32-
30
28-
26-
24
22
(b) Moisture at 10-30 cm (%vol. )
September
Q Precipitation (mm)
Figure 6.6. Profile moisture content under two surface configurations (RA-10, 1978).
In r e s p e c t t o crop growth a t l e a s t , a much s lower development was observed for t h e f l a t c u l t i v a t e d p l o t s , as can be seen i n f i gu r e 6 . 7 . for r o o t growth and t a b l e 6 . 2 . for f o l i a g e development. The e f f e c t was temporary and was made up by subsequent growth.
depth , 0
(Cm) 20
Sept. 27
Figure 6 .7 . Comparison of root growth between f l a t (shaded) and bedded p l o t s (RA-10, 1978).

- 84 -
Table 6.2. Leaf-area and corresponding dry matter weight of a 50 cm Pearl Millet row for two different surface configurations and three replications. (ICRISAT, RA-10, 1978)
Sept. 7 Flat Broadbeds
Sept. 16 Flat Broadbeds
Sept. 27 Flat Broadbeds
Leaf
1
250 730
1965 2087
1815 1723
area (cm2)
2
260 1200
650 2830
1317 1588
3
150 525
740 2265
1298 1217
Mean
220 818
1118 2394
1477 1509
Dry matter weight
1
1.6 4.2
12.7 15.6
50.6 34.9
2
1.7 6.8
5.1 17.8
23.8 43.2
(g)
3
0.9 2.9
4.9 14.6
22.8 26.6
Mean
1.4 4.6
7.6 16.0
32.4 34.9
6.1.4. Soil Moisture at the Start of the Cropping Season
Precipitation falling before the growing season can be stored in the pro
file. Losses occur through evaporation and possibly transpiration by weeds.
A shorter interval between rains causes more storage through a reduction in
évapotranspiration by increased cloudiness, lower temperatures and deeper
infiltration. For Hyderabad, during the months of April and May, so called
pre-monsoon showers can be expected, yielding an average of 50 mm of rain.
Over half of this rain occurs in showers of less than 20 mm, which, as a
consequence of the high evaporative demand during this period, do not
contribute to the moisture reserve, unless several showers occur within a
few days.
After moistening to a depth of at least 15-20 cm the topsoil has become
sufficiently soft to allow a primary tillage operation. Normal tillage
depth is 10-15 cm. Subsequently, the rough and open ploughed layer will
loose most of its stored water by evaporation. After a few more showers,
when the top 30 cm of the profile has become moist, farmers will start
sowing most of their crops. At this moment about 50 mm is stored. If early
rains are scarce and time proceeds, sowing is done at a lower degree of
moistening.
On red soils, water loss through evaporation is restricted to the top 20 to
30 cm of the profile. In this respect figure 6.8. is illustrative.

- 85
-4-
-8-
12-
16-
20-
24-
28-
1?-
Nov Dec. 20 24 28 2 6 10 14 18 22 26 30
\ \ \^s* 'v. 75-cm depth
\ \ \ \ ^ ^ / \ \ \ \ 6 0 - c m depth
\ ^ \ ^ £ 5 - c m depth
\ > _ 30-cm depth
\ 15-cm depth
\
\ \
Figure 6.8. Capillary potentials under nonirrigated pearl millet on an Alfisol. Derived from ICRISAT (1978).
Moistening of deeper layers is not very probable during much of the pre-
monsoon period, but may occur in certain years. In these cases it contrib
utes to the moisture reserve available during the early part of the humid
season.
6.2. Influencing the Field Water-Balance
Apart from increasing the infiltrability of the soil as discussed under
6.1.1., water conservation could also be promoted by keeping excess water
on the soil surface. Total infiltration, therefore, is raised by increasing
depression storage (Linsley, 1949) and by all measures that slow down the
flow velocity of surface runoff.
Measures that influence the infiltration automatically have their effect on
the field water-balance. Excess water, however, has to be drained to avoid
waterlogging. The surface drainage pattern of a field is strongly influ
enced by topographical factors. These include the size, shape and slope of
the field as well as the direction of furrows, or the presence of natural
drainage ways. Topographic features determine the time of concentration of
runoff from the field, which influences the level of peak flow at the
outlet point. Higher peak flows require higher capacities of drainage
channels and structures to prevent overtopping and erosion.

The creation of a surface configuration on a field can have a number of
objectives including its influence on the movement of water. The choice of
a bed-and-furrow configuration, for example, could be based on the follow
ing considerations:
The bed, being the crop-management zone is created as a loose soil body
and is not compacted by traffic, keeping infiltration and aeration
optimal. Less hardening also allows for an easier cultivation. As this
is a zonal tillage, energy and time are saved with most operations.
The use of beds favours an early drainage of the topsoil after heavy
rain through its higher topographical location, and specifically avoids
stagnation of water in crop rows at locations in the field where macro-
depressions occur.
Using the furrows as guidance for draft animals and wheeled equipment,
allows field operations to be executed fast and accurately in respect to
lining and depth regulation.
The presence of furrows makes the construction of mini-depression stor
age within the furrows and outside the crop rows possible.
The construction of furrows makes it possible to influence the total
travel distance for runoff water and its flow-velocity, by means of
selecting the direction of the furrows (determining their slope) and
their density, shape and size.
The presence of the furrows enables efficient supplementary irrigation.
Consequences of a bed-and-furrow system, that should be considered as
negative compared to the equivalent of flat cultivation, comprise:
The decrease of effective micro-depression storage on beds as a conse
quence of their generally crowned shape.
The concentration of runoff water in the most compacted, so least perme
able, parts of the field, the furrows, accelerating the rate of runoff
in non-cracking soils, particularly at small runoff events.
The need for adjusted equipment.
6.2.1. The Effects of Depression Storage
The availability of depression storage capacity in a field can strongly
affect the volume of runoff. At field-scale the three types of depression
storage (micro-, mini- and macro-) (section 4.1.) could all be present.
While the micro-depression storage is related to the surface roughness
(section 6.1.1.2.), the other forms are influenced by the surface configu
ration given to the field, or by other lay-out features.

- 87 -
The influence of the surface configuration on mini- and macro-depression
storage is qualitatively shown in an experiment on an Alfisol at the
ICRISAT-station (Appendix 12) where runoff from artificial rain was mea
sured from 16 small plots with 4 different surface configurations, as
schematically shown in figure 6.9.
The surface micro-structure was smooth for all plots due to earlier rain
fall and not cultivated during the observation period. Runoff for three
applications of rain at different dates and with different duration was
measured.
The extreme variation in measured runoff between the replicates render the
observed differences between treatments as not-significant. Still, as
figure 6.10. shows, one can detect a tendency that, for small storms, the
wave-type of surface configuration, which lacks storage capacity, has a
higher runoff than the flat treatment characterised by the occurrence of
depressions.
The surface configurations indicated as B and D are intermediate in this
respect. At higher runoff events the differences disappear: depression
storage causes a single subtraction of runoff per storm (or part of a
storm), and does not influence the infiltration rate.
In contrast to micro-depressions, mini-depressions are more persistent and
their effect on runoff may persist during most of the growing season. The
capacity of such mini-depressions, expressed in mm of waterlayer is gener-
i A = Flat 1
B = Standard Bed-and Furrow
C = Wave- type Bed-and Furrow j
U = (J • Addi t ional bmal l hurrows t
150 cm Figure 6.9. Schematic cross-sections of different surface configurations.
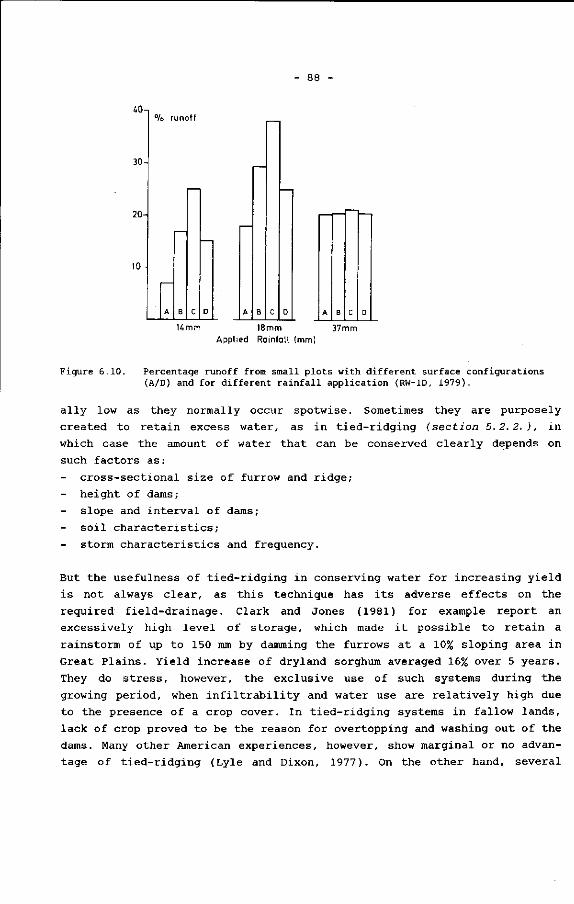
«h
30
20-
10-
°/o runoff
Kmm 18mm Applied Rainfall (mm)
37mm
Figure 6.10. Percentage runoff from small plots with different surface configurations (A/D) and for different rainfall application (RW-1D, 1979).
ally low as they normally occur spotwise. Sometimes they are purposely
created to retain excess water, as in tied-ridging (section 5.2.2.), in
which case the amount of water that can be conserved clearly depends on
such factors as :
cross-sectional size of furrow and ridge;
height of dams;
slope and interval of dams;
soil characteristics;
storm characteristics and frequency.
But the usefulness of tied-ridging in conserving water for increasing yield
is not always clear, as this technique has its adverse effects on the
required field-drainage. Clark and Jones (1981) for example report an
excessively high level of storage, which made it possible to retain a
rainstorm of up to 150 mm by damming the furrows at a 10% sloping area in
Great Plains. Yield increase of dryland sorghum averaged 16% over 5 years.
They do stress, however, the exclusive use of such systems during the
growing period, when infiltrability and water use are relatively high due
to the presence of a crop cover. In tied-ridging systems in fallow lands,
lack of crop proved to be the reason for overtopping and washing out of the
dams. Many other American experiences, however, show marginal or no advan
tage of tied-ridging (Lyle and Dixon, 1977). On the other hand, several

- 89 -
positive results are reported from African experience. Starting with
Faulkner (1944), who reported spectacular yield increases through tied-
ridging for former Tanganyika, presently Tanzania, and Nigeria, also others
(Peat and Brown, 1960; Dagg and Mc. Cartney, 1968; Lawes, 1961) report
increases of yield by tied-ridging. The beneficial effects relate to sea
sons with below average rainfall; Adverse effects of standing water out
weigh this advantage in wet years (Lawes, 1961).
Moreover, flowing water could over-top the small dams or the ridges them
selves, leading to their destruction and a sudden release of water. To
avoid this the storage capacity should be high enough to contain the maxi
mum single storm expected. This makes the system unsuitable for many areas
where expected runoff events are high or insufficient storage volume can be
created, for example if contour furrowing cannot be accomplished accurately
(Faulkner). A general awareness of this risk of over-topping and conse
quently uncontrolled flow seems to exist. Kowal (1970) adds other disadvan
tages to the indiscriminate use of tied-ridging, like problems of traffica-
bility and waterlogging.
Earlier experiments at ICRISAT on tied-ridging did not show any positive
effect on crop yield, indeed because too little storage volume could be
created in view of the slope irregularities and instability of the soils.
6.2.2. The Effects of the Surface Configuration of the Field
Surface configuration has a direct effect on the level of mini- and macro-
depression storage in a field (section 6.2.1.). On top of this, differences
in surface configuration may strongly influence the drainage of a field
both in respect to aeration of the cropped zone as well as in respect to
the flow pattern of excess water. Differences in surface configuration,
therefore, may affect runoff and indirectly crop yield.
Runoff measurements from cropped fields, similar in shape and size
(0.4 ha), but with different surface configurations, have been made for a
number of years at ICRISAT-station. A summary of these observations is
given in table 6.3., indicating the total seasonal runoff as percentage of
the total precipitation during the same period.
The table shows that runoff from flat cultivated fields is generally lower
than from bedded fields. Such difference would be in agreement with the
tendency denoted in the earlier mentioned small plot observations

- 90
Table 6.3. Seasonal runoff as percentage of seasonal rainfall for two land management systems, 1979 - 1981 (ICRISAT, RW-3FH)
Plot number Average per treatment
Treatment*' F B B F - F B
1979 (660 mm)
Treatment Runoff (%) 13.5 15.9 13.1 10.5 - 12.0 14.5
1980 (720 mm) Treatment B - F B F F B Runoff (%) 15.4 - 12.8 19.1 12.0 12.4 17.2
1981 (1095 mm) Treatment B F B - F F B Runoff (%) 28.3 20.5 19.5 - 15.5 18.0 23.9
+) F = Flat cultivated B = Bed-and-furrow
o) Size of individual plots was about 0.4 hectare
(section 6.2.1. ) inasfar as runoff would mainly originate from small runoff
events. In that case, the higher level of stagnating water in flat culti
vated fields would account for a high percentage runoff reduction.
Looking at the ratio's of runoff from flat plots and bedded plots for
individual storms on Alfisols (figure 6.11. ) , it can be seen that this
ratio increases with increasing storm size. With small runoff producing
storms, this ratio remains well below unity, indicating a higher runoff
from the bedded plots. ' As storm size increases, runoff from flat and
bedded fields tends to become more similar. The scatter in figure 6.11. is
caused by the variations of factors like antecedent moisture, rainfall
intensity and crop stage. Surprisingly, some of the deviating values,
encircled in the figure, originate from runoff events that occurred shortly
after cultivation and without appreciable crop cover. On these dates, the
surface roughness is similar in both treatments and the related micro-
depression storage is still dominant over differences in mini- and macro-
depressions caused by land shaping. Therefore, differences between flat and
bedded fields do not show clearly with such a rough surface.
Differences in runoff between plots with a different surface configuration
and under natural rainfall were also monitored on smaller experimental
+ ) It should be noted that the opposite is true for Vertisols where runoff from flat fields is larger than from beds.

91 -
1.20-, ratio F/B
1.00
80
.60
.40-
.20-
c^2 of'
&" (of'o dx5
X XA 4 AO i
O A 4
°X
x 1979 o 1980 4 1981
1. 28-9-1979 2. 5-11-1979 3. 12-6-1980 4. 18-6-1981 5. 5-10-1981 6. 7-10-1981
20 30 40 (mm) 50
Figure 6.11. Ratio's of stormwise runoff from a f lat cultivated field and a bedded field (F/B) as dependent on height of runoff. (Field sizes 0.4 ha).
p l o t s (Appendix 9). The comparison between t he t r e a tmen t s A ( f l a t c u l t i v a t i o n ) and B (beds wi th narrow furrows) was based on t h e mean v a lues of two and f i ve p l o t s of 45 m2 r e s p e c t i v e l y . For f i ve runoff p roducing s torms t h e d i f f e r e n c e s i n runoff can be p r e s en t ed i n r e l a t i o n t o t h e s torm c h a r a c t e r i s t i c s a s :
runoff A/runoff B = 0.82 + 0.02 P - 0 .01 W.M.I. (R = 0.92) (6.3.)
with:
P
W.M.I.
= Precipitation (mm)
= Weighed Mean Intensity (mm/h)
Looking at the land shaping factors that influence the runoff, it can be
seen that a difference in depression storage has a relatively stronger
effect with small storms than with higher rainfall (see earlier).
Surface configuration, however, also influences the detention (sec
tion 5.1.). Fields with straight and narrow flow channels will have less

- 92 -
possibility of detaining water. With a higher wetted perimeter additional
infiltration may occur and consequently less runoff. With low discharges
flow channels are always small, so that differences between surface confi
gurations in respect to detention are not apparent.
In the regression as given above, the co-efficients that go along with
rainfall quantity (P) and intensity (W.M.I.), depend on the differences in
depression storage and detention respectively of the compared configura
tions. The co-efficient for the rainfall quantity (+ 0.02) indicates the
effect of a higher depression storage capacity of the flat cultivated
plots. The co-efficient that goes along with the intensity (- 0.01) is an
indication of the higher detention of the flat cultivated plots as compared
to the bedded plot: at higher runoff rates the wetted perimeter increases
most for the flat plots. Of course, equation 6.3. should not be extra
polated beyond the values from which it was derived, as the left hand ratio
should tend to one at infinite P.
Crop Yield
The field scale plots were also monitored for their rainy season crop yield
(table 6.4.). After excluding the variability between years and plots, the
yield of the flat cultivated plots seemed to be slightly higher than from
the bedded fields. This difference, however, was far from significant. ' At
first sight, this might seem strange in a situation where shortage of water
is considered as one of the major limitations. Higher runoff would, as one
would feel, result in distinctly lower yields. It should be realised,
however, that in a relatively dry year, the difference in runoff is also
low, and could hardly create a yield difference. In wetter years, the
difference in runoff may become appreciable, but water availability might
not be a major problem for any system. Moreover, differences in availabe
water will influence crop yield, particularly if occurring during a dry
spell. In our case, however, such differences are spread all over the
season and obviously have little effect.
6.2.3. Hydraulic Properties of Different Furrow Shapes
Reporting the data on the influence of furrows on the outflow of an agri-
+) Production costs, however, were highest in the flat cultivated fields. For reason of comparison, improved implements were used for both treatments, wherever possible. For the flat cultivated fields, however, most operations required more time for execution.

93
Table 6 .4. Yield of rainy season crop for two land management systems in f i e ld scale experiments (RW-3FH)
1978 (Sorghum) + )
Treatment Yield (t/ha)
1979 (Sorghum) Treatment Yield (t/ha)
1980 (Pearl Millet) Treatment Yield (t/ha)
1981 (Sorghum) Treatment Yield (t/ha)
Plot
1
F 3.49
F 3.12
B 2.03
B 2.63
number
2
B 2.33
B 2.40
F 1.96
3
B 3.80
B 2.52
F 1.42
B 1.25
4
F 2.93
F 2.76
B 1.78
5
B 1.77
F 1.43
F 2.02
+) F = Flat cultivated B = Bed-and-furrow
c u l t u r a l f i e l d , no f u r t h e r s p e c i f i c a t i o n s were g iven on t h e c h a r a c t e r i s t i c s of t h e furrows t hemse lves . Observa t ions were made i n f i e l d s where a " s t a n dard" l a y - o u t of bed-and-furrow was used, and t h i s was compared t o t h e system of f l a t c u l t i v a t i o n . The shape and t he s i z e of t h e furrow, however, has an impor tan t i n f l uence on i t s h yd r au l i c p r o p e r t i e s and consequen t ly on t h e f i e l d runoff . An exper iment was done t o quan t i fy t h i s h yd r au l i c behavi ou r of two furrow t ypes (figure 6.12. ) .
Figure 6.12. Cross-sections of two different shapes of beds, measured 6 weeks after sowing of a sorghum-pigeonpea intercrop.

- 94 -
For this, a known discharge of water was released at the upper end of
50 meter long furrows and outflow was measured as well as the wet cross-
sections at intervals of 10 meter (Appendix 13).
Outflow figures from wide furrows were distinctly lower than from narrow
furrows with the same inflow. This can be explained by the difference in
losses: the wet perimeter of the wide furrows is larger (figure 6.13.). The
higher wet cross section of the wide furrow also causes a lower flow veloc
ity.
From these measurements an estimate can also be made of the hydraulic
roughness of the furrow. Assuming Manning's flow equation is applicable:
D2/3 a/2 (6.4.)
with:
Q =
A =
R =
S =
K =
discharge (m3. sec )
wet cross sectional area (m2)
hydraulic radius (m)
slope (-) . . 1/3 roughness co-efficient (m '
the calculated value of the roughness co-efficient K equals about 14 for
the narrow furrows and might be a bit lower for lower flow rates. For wider
furrows, with a water depth of only a few centimeters, K-values are around
7, and still lower at lower discharges.
The conditions in which the measurements were made differ from those during
rainfall runoff; in the latter case the water losses from the wet furrows
will be negligible, whereas in our experiment they were often 50% or more.
A = 59 cm2
B = 36 cm V = 5.1 cm/sec.
5cm Wilde Furrow
water level
Figure 6 .13.
A = 102 cm2
B = 62 cm V = 2.7 cm/sec.
Characteristics of two types of furrows during flow of 17 1/min. (A = wet cross-section, P = wetted perimeter, V = flow velocity).

- 95
Moreover, along the furrow the volume of water increases during rainfall
runoff, which is opposite to the flow conditions in the experiment.
An important difference is the concurrent influence of the depression
storage on top of the beds during rainfall. Comparing beds-and-furrows
which do not differ in furrow-to-furrow distance, beds with a wider furrow
are less wide themselves and tend to have a more crowned shape. This, of
course, will reduce the surface storage capacity on the bed. This gives an
effect opposite to the effects of the furrow shape. The difference in
furrow behaviour, therefore, is not clearly observed during natural runoff
situations. Comparing mean outflow from 5 narrow with 8 wide furrows with
slopes ranging from 0.3 to 0.5% and for 8 runoff producing storms, the
outflow differed less than 10% (Appendix 13). But, although this is true
for the total runoff, on the basis of individual storms and related to
their size and intensity, differences between the two shapes of bed-and-
furrow appear again, as depicted in figure 6.14.
It can be concluded therefore that the overall effect of the shape of the
furrow on runoff depends on the rainfall-runoff characteristics of the area
in a particular season. With small size storms, the influence of depression
storage reduces runoff; this gives better conservation in the combination
of narrow furrows and a wide bed. The furrow characteristics show their
influence during higher and more intense rainfall and conservation is
better with wide furrows. Under the conditions of Hyderabad and as a
runoff B runoff C
1.5-
1.0-
W.M.I, [mrn/h
t 10 20 30 40 50 60
rainfall (mm)
Figure 6.14. Ratio of observed runoff from narrow vs wide furrows (B/C) related to rainfall quantity (P) and intensity (W.M.I.) for 50 meter long furrows (RW-1C),1979, described as: B/C = 0.72 + 0.004 P + 0.010 W.M.I. (R = 0.92).

- 96 -
season's average, these two opposite effects tend to balance. But, rea
lising the unequal distribution of heavy rainfall over the season, with a
concentration later in the season, the crop would probably benefit more
from a runoff reduction early in the season when the storms are smaller.
This would favour the use of a type of bed-and-furrow with a maximum bed
width. The bed should be shaped as level as possible to increase depression
storage. The furrows should be made narrow in that case. A minimum size,
however, is required to deal with the expected runoff and to avoid exces
sive flow velocities that would cause erosion. The measured K - Manning
values could be used to estimate the minimum furrow-size required, and the
longest permissible furrow length.
6.2.4. The Effects of Size and Shape of the Field
Within the field, a restriction of length of single furrows is advisable to
avoid erosion in the lower stretch. Practical experience has shown that, at
a mean slope of 0.4% in the direction of furrow, a length of 75 meters
should be considered as the maximum advisable for standard beds. Flow
velocities at the lower stretch of such a furrow can be estimated at
0.1 m/s at a high runoff intensity of 40 mm/h from 1.50 m wide beds. Field
drains and outlet should be designed following criteria related to the
expected height of peak flow.
Understandably, field size is an important parameter, but also its shape,
as both determine the time of concentration (T ) of runoff. T can be c c
estimated from the empirical formula given by Kirpich (1940, cited by
Raadsma and Schulze, 1974) L
T = 0.0195 . ( ) 0.770 (6.5.) c VH/L
with:
L = maximum length of travel (m)
H = difference in elevation between most remote point and outlet (m)
For a 0.5 ha field, with a natural slope of 2%, the time of concentration
would range from about 5 to 8 minutes (figure 6.15.).
For the range presumed in figure 6.15, the variation in T , from 5 to
8 minutes, corresponds with a ratio in expected maximum rainfall intensi
ties of 1.33 (Jones et.al. , 1981). This ratio, if inserted in a runoff
equation like the rational formula (Dickinson, 1980)

- 97
Tc(min)
7 -
6 -
5
4 -|
O 30 40 50 60 70 width of field (m)
Figure 6 .15. Time of concentrat ion (T ) as r e l a t ed to the width of a rectangular 0.5 ha f i e l d . C
Q = 0 . 0027 X C X I x A P
( 6 . 6 . )
w i t h :
Q = Peak Runoff Rate (m3/sec)
C = Runoff Co-efficient
I = Mean Rainfall Intensity over a period equal to Time of Concentration
(mm/h)
A = Area (ha)
results in the same ratio in peak flow.
6.3. Influencing the Watershed Water-Balance
Under otherwise similar conditions, the surface outflow of a watershed,
expressed as m3/ha decreases with the increase in area covered (Shanan and
Tadmor, 1979). Surface runoff water is held back in depressions or infil
trates, particularly if passing through watershed parts that are receiving
less intense rainfall at that time.
The peak flow in m3/s per hectare will decrease with increasing area as
well as with a more elongated shape of the watershed. This can be under
stood from the reduced probability of receiving a high intensive rainstorm,
covering all the contributing area, and from the increased time of concen
tration (T ) for larger or more elongated areas. In small watersheds the
second factor is the most important.
In many natural watersheds appreciable quantities of surface runoff water
are stored in extended shallow depressions from where it partly infiltrates

- 98 -
and partly evaporates. Some of such depressions could retain water for long
periods of time. The waterbalance of a catchment could also be influenced
by man-made constructions. Total surface runoff is increased by improving
the surface drainage, or decreased by increasing infiltrability (by cul
tural measures), increasing the length of flow of the water (through diver
sions) or through the creation of storage capacity. The latter can be
achieved by different means, like:
Damming "oriented" depressions (furrows, valley's).
Construction of excavated reservoirs.
Construction of (contour) bunds.
Local topographic and agronomic conditions, possibilities of subsequent use
of stored water and involved costs determine which is the most suitable
alternative, if the major aim is reduction of outflow.
A useful distinction between the different techniques to create storage
capacity could be made on the basis of their location within the watershed:
near the crop (tied-ridging);
in the lower part of individual fields (bunds);
outside the field or group of fields, (excavated reservoir);
at the lower reaches of the watershed (dammed natural depressions or
valley's, "tanks").
The place where the water is stored, also influences its availability for
irrigation, the location of the benefiting area and the level of control.
Moreover, involved costs of construction and maintenance as well as safety
of the system are distinctly different. In qualitative terms, important
factors that characterize these differences are summarized in table 6.5.
6.3.1. Contour-Bunding
Since the inception of research on rainfed farming in India, measures have
been proposed to decrease the amount of surface outflow of water and soil
from agricultural fields. In this respect, most attention has been given to
contour-bunds (section 4.3.). Through these bunds, most of the surface
runoff water and eroded soil particles are kept in the upstream area,
reducing runoff on a watershed scale and simultaneously conserving water in
the zones of submergence and seepage (figure 6.16. (a)).
Design criteria have changed over time, incorporating field experience, and
depend on soil type and rainfall pattern (Rao, 1962).

- 99 -
Table 6.5. Characteristics of 4 levels of waterstorage systems for Alfisol-areas
(1) (2) (3) (4)
Example
Required land area
Benefitting area
Benefitting crops
Benefitting period
Reduction watershed outflow
Near crop
Tied ridging
none
All field
In field
Bunds
5 - 10%
Part of field
Standing crop Standing crop
Drought period - do following stagnation
moderate/high high
Complications in field
Major water-losses
Water control
Capital costs
Variable costs
Risk of failure
waterloggi overtoppir
Some percc tion
none
none
moderate
very high
ng g
la-
waterlogging
Moderate to high percola tion
mostly none
low
low
high
Outside field
Small reservoirs
10%
(Part of) area within watershed
Standing and/ or subsequent crop
Any subsequent drought and/ or subsequent crop
Outside agricultural watershed
Large reservoirs ("Tanks")
Downstream of watershed
Subsequent crop
Following filling of reservoir
moderate/high none
High percola- Percolation; high tion; high eva- evaporation poration
good good
very high high
low-moderate low
low moderate
Since independence, 21 million hectares of agricultural land has been
"bunded" in India at a cost of about Rs 250/- per hectare, constituting 90%
of the total expenditure on soil conservation of agricultural land (Bali,
1980). But the lay-out of a watershed area based on contourbunds has not
always been successful. In the first place, many farmers object to the loss
of productive land, the division of their fields and to the curved lines of
the bunds, which are very often a consequence of proper lay-outs (Bali,
1980). As a result, it is often not feasible for the executing agency to
follow the recommendations required for an optimal lay-out. Secondly,
prolonged water stagnation near the bunds could damage the crop and prohib
it timely cultural operations (Gupta, et.al . , 1971) while the bunds are a

100
(a) : Cross-Section
E 2
£ '• o
.« 0
(b) : Yield of Sorghum and Pigeonpea. ICRISAT-station, | RW-3B (1978-1979)
- 2.8 a
~. 2.4-
.S 2.0 > £ 1.6 Sf 1.2 o
0.8
0.4-
0 10 20
Figure 6.16. Longitudinal section of a contour-bunded field and of i t s yield.
30 40 -10 0 horizontal distance (meter)
source of weed i n f e s t a t i o n , r e s u l t i n g i n d i s app rova l by t he c u l t i v a t o r s .
This adds t o t he a l r e ady e x i s t i n g maintenance p roblems.
Although contourbunds could be s u i t a b l e for r educ ing peak flow, improper c o n s t r u c t i o n and poor maintenance might l e ad t o l o c a l b r each ing , th rough which h igh volumes of water a r e suddenly r e l e a s e d . This causes more damage t o t h e f i e l d s than would have been t h e case w i thou t bunds (Nanjundappa, 1981) . Breaches do occur most e a s i l y i n V e r t i s o l a r e a s , where t he swe l l i ng and s h r i nk i ng of t h e mon tmor r i l l on i t e c l ay make bunds u n s t a b l e
+) Construction of contourbunds, therefore, is no longer advocated for these areas. Instead "graded bunds", which are constructed at a direction slightly deviating from the contour, are advised, together with the construction of grassed waterways. Such bunds hold less water during runoff producing rains, as they s tar t draining immediately and dry out soon after cessation of rain. Their main function is runoff retardation.
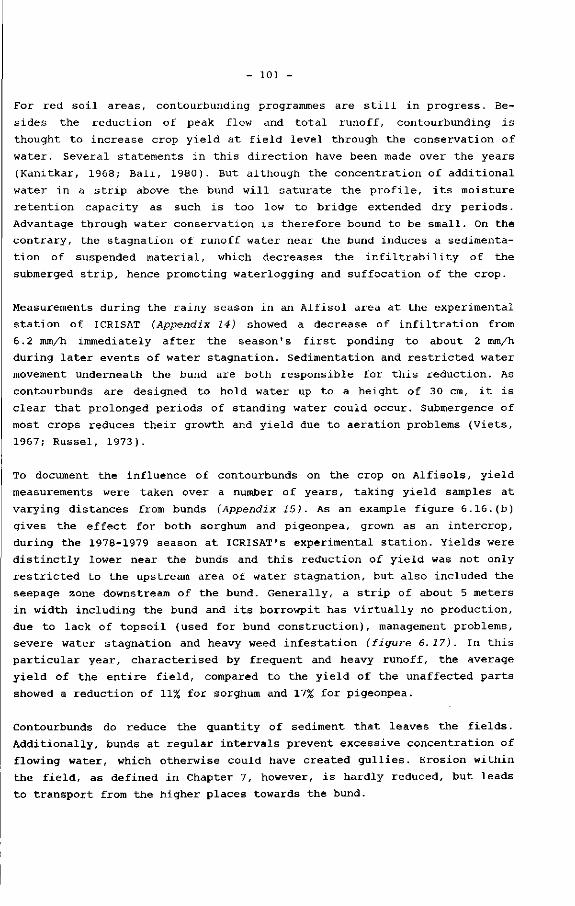
- 101 -
For red soil areas, contourbunding programmes are still in progress. Be
sides the reduction of peak flow and total runoff, contourbunding is
thought to increase crop yield at field level through the conservation of
water. Several statements in this direction have been made over the years
(Kanitkar, 1968; Bali, 1980). But although the concentration of additional
water in a strip above the bund will saturate the profile, its moisture
retention capacity as such is too low to bridge extended dry periods.
Advantage through water conservation is therefore bound to be small. On the
contrary, the stagnation of runoff water near the bund induces a sedimenta
tion of suspended material, which decreases the infiltrability of the
submerged strip, hence promoting waterlogging and suffocation of the crop.
Measurements during the rainy season in an Alfisol area at the experimental
station of ICRISAT (Appendix 14) showed a decrease of infiltration from
6.2 mm/h immediately after the season's first ponding to about 2 mm/h
during later events of water stagnation. Sedimentation and restricted water
movement underneath the bund are both responsible for this reduction. As
contourbunds are designed to hold water up to a height of 30 cm, it is
clear that prolonged periods of standing water could occur. Submergence of
most crops reduces their growth and yield due to aeration problems (Viets,
1967; Rüssel, 1973).
To document the influence of contourbunds on the crop on Alfisols, yield
measurements were taken over a number of years, taking yield samples at
varying distances from bunds (Appendix 15). As an example figure 6.16.(b)
gives the effect for both sorghum and pigeonpea, grown as an intercrop,
during the 1978-1979 season at ICRISAT's experimental station. Yields were
distinctly lower near the bunds and this reduction of yield was not only
restricted to the upstream area of water stagnation, but also included the
seepage zone downstream of the bund. Generally, a strip of about 5 meters
in width including the bund and its borrowpit has virtually no production,
due to lack of topsoil (used for bund construction), management problems,
severe water stagnation and heavy weed infestation (figure 6.17). In this
particular year, characterised by frequent and heavy runoff, the average
yield of the entire field, compared to the yield of the unaffected parts
showed a reduction of 11% for sorghum and 17% for pigeonpea.
Contourbunds do reduce the quantity of sediment that leaves the fields.
Additionally, bunds at regular intervals prevent excessive concentration of
flowing water, which otherwise could have created gullies. Erosion within
the field, as defined in Chapter 7, however, is hardly reduced, but leads
to transport from the higher places towards the bund.

- 102 -
Figure 6.17. Poor plant stand near newly constructed contour-bund.

- 103
CHAPTER 7 EROSION AND SOIL LOSS OF RED SOILS
7.1. Definition and Description
Soil erosion is defined as the superficial removal of soil particles or the
removal of a soil-mass under influence of water, wind and gravity. Most
authors differentiate between geological erosion, as part of the process of
soil formation, -transport and -sedimentation, and accelerated erosion,
when this process is influenced by man, and results in an increased erosion
rate. In agriculture, soil erosion comprises a loss of productive soil. In
some situations the visible consequences could be very impressive. This
includes the removal of soil from a field or area (formation of gullies),
the transport of detached material (mud-streams, dust-bowl) or its deposi
tion (siltation of reservoirs). These visible aspects of soil erosion,
-transport and -sedimentation, often seem to overshadow qualitative fac
tors.
Topsoil, the most valuable section of the profile is, as a consequence of
its exposition, most vulnerable to erosive forces. Within this toplayer the
soil particles are loosened and transported over short distances by rain
drop splash, whereas the loose particles are susceptible to being washed
out by the flowing water, as was observed by Ellison (1945). During the
transport phase a further sorting takes place, as, the coarser the mate
rial, the earlier it will be deposited with a decrease of velocity of the
transporting agent (wind or water). This selective process also implies a
more than proportional removal of humus and nutrients from a field.
While erosion itself is a phenomenon that occurs within a defined area, be
it a watershed, a field or a crop-row, soil loss, as a result of erosion,
could be defined as the outflow of soil material from a certain area.
Wischmeier (1976) in this respect uses the term sediment yield for a field
or watershed as the sum of soil losses on slope segments minus occurring
depositions. If one uses the amount of soil loss as a measure of severity

- 104 -
of soil erosion in the contributing area, one should also try to include
the amount of local sedimentation especially in non-productive areas like
waterways.
A special case is the erosion and transport of soil material from a raised
bed into the adjacent furrow, as far as it does not leave this furrow by
subsequent transport. Reshaping of the bed-and-furrow as a normal cultiva
tion practice returns all or part of this material to its original loca
tion, so that this amount should not be denoted as soil loss.
Red soils are highly susceptible to water-erosion. Because of their low
aggregate stability (section 3. 2. ) they are easily dispersed into elemen
tary soil particles: the concurrent surface sealing induces surface runoff
and consequently transport of material. Following Baur's definitions (Baur,
1952), the most common form of erosion in flat cultivated fields is sheet
erosion, described as "the removal of a fairly uniform layer of soil or
material from the land surface by the action of rainfall and runoff"
(Figure 7.1. ) .
A transition to rill erosion, defined as "the removal of soil by running
water with formation of shallow channels that can be smoothened out com
pletely by cultivation", occurs if slopes are getting longer or steeper. It
could be observed, therefore, in the lower part of flat cultivated fields,
but also incidentally at the shoulders of raised beds, anywhere in the
field, if a concentrated flow of water takes place.
Figure 7.1. Example of erosion in an Alfisol field.

105
7.2. Occurrence of Erosion in Red Soils
Rainfall in the semi-arid tropics enhances detachment and transport of soil
through its uneven distribution and high intensities. In periods with
concentrated rainfall percentage of runoff increases. The higher the inten
sity of a rainstorm, the higher its kinetic energy (Wischmeier et.al. ,
1958) which causes more destructive impact on the surface aggregates.
Because of the low infiltrability of the red soils, an appreciable part of
the rainfall during intense showers will run off after the available de
pressions have been filled, transporting the detached soil particles.
Erratic distribution of the rainfall could mean heavy rain in the early
part of the growing season, when the fields are still unprotected. But also
prolonged wet spells could be expected, with continuous rain on a saturated
profile. In both such situations, soil loss rates could be high. It is
clear from many tropical situations, that a major part of the annual soil
loss takes place during a restricted number of rainstorms.
In the view of Pierce et. al. (1983) the decline in productivity of red
soils by erosion (referred to as "eroding productivity"), would take place
as conceptualized in figure 7.2. for deep (B) and for shallow (C) soils.
Specifically in the shallow soils, there is an urgent need to restrict the
soil loss to a minimum. "Acceptable" soil loss levels are of the same order
as the rate of annual soil formation, thus maintaining a balance in profile
depth and -quality (Schertz, 1983). Long term improvement of many
of the red soil areas could only be achieved by keeping the soil loss at
still lower levels.
Reported soil loss figures for red soils show a wide variation over the
years. The validity of such data also depends on the method of observation.
Soil loss figures as available for Alfisol areas near Hyderabad, India, are
Favourable surface and subsoi l hor izons
Favourable surface and unfavourable subsoil horizons
Favourable surface and consol idated or coarse fragment subsoi l horizons
Accumulated erosion (time)
Figure 7.2. Concept of eroding productivity. Derived from Pierce and Larson (1983).

- 106 -
estimated on the basis of water samples collected manually during runoff.
As a 4-year average figure Vijayalakshmi et. al. (1982) report a soil loss
of about 2.5 t/ha for differently cropped fields. At ICRISAT-station, for
watersheds of about 4 ha a slightly lower mean figure
(2.2 t/ha) was observed during a 4-year period, over the years ranging from
less than 1.0 up to 3.5 t/ha (ICRISAT, Reports of work). These figures give
an indication of the level of soil loss from such areas. But the inaccurate
measurement technique (handsampling) as well as the location of sampling
(at some distance downstream of the field) suggest that in the field itself
the actual erosion might even be more serious. This suggestion can be
verified in contour-bunded fields, by observing the rate at which fresh
ly-made borrow-pits are being filled up. An often quoted period of four to
five years would correspond with an average deposition of 40 to 50 t/ha per
year. Under such conditions one may speak of a high level of "internal"
sediment yield, occuring simultaneously with a much lower "external" soil
loss.
7.3. Qualitative Aspects of Soil Erosion
Apart from the amount of soil transported within the field or leaving the
field, its composition should also be considered. A comparison was made
between the texture of the top soil of a 4 ha watershed and the texture of
material sedimented in a reservoir directly below its outflow point
(table 7.1.) (Pathak, personal communication). In this lay-out all water
shed runoff entered the reservoir without passing a sand trap. The much
finer texture of the material deposited in the reservoir is explained by a
higher erodibility of the fine fraction and preferential sedimentation of
the coarse material on its way towards the watershed outflow point.
The washing-out of finer particles during the erosion process can also be
illustrated with data obtained from the 10 x 4.5 meter runoff plots at
ICRISAT station, described earlier (Appendix 9). In these measurements a
separation is made between the soil that was caught in the sediment trap at
Table 7.1. Particle size distribution (%) of in situ and sedimented soil
Topsoil Watershed Tank Bottom
< 2
18 63
2-20
6 22
Size class
20-200
24 11
(|jm)
200-2000
46 2
> 2000
6 2

- 107 -
the end of the plots and soil particles that remained in suspension in the
receiving barrels. Of the latter, a good estimate could be obtained of the
quantity involved by taking water samples from the collected runoff. Sus
pended material was allowed to settle and was dried and weighed. Plotwise,
however, this yielded too little material for a texture analysis. This was
done by pooling samples collected up to August 7 and a second set from
August 13 onwards. The particle size distribution of both trapped and
suspended material was determined by the hydrometer method (American Soci
ety for Testing and Materials D 422; Bouyoucos, 1961). The analysis of the
two combined samples from the suspended material shows the extremely high
representation of fine particles, particularly during the earlier part of
the season (table 7.2.).
The texture of the eroded material was compared with that of the original
top soil. This was done by calculating the ratio of the percentage clay
plus silt (fraction < 50 um) in the trapped and suspended material to the
percentage < 50 um in the top soil. This ratio is also referred to as
"dispersion coefficient" (Kowal, 1970 b) and can serve as an indicator for
the selective erosion. If we suppose a similar composition within both
fractions < 50 um, their ratio indicates the amount of top soil involved
in the erosion processes
For the material caught in the sediment trap, this ratio was slightly above
1.0, with a maximum of 1.6 shortly after cultivation (figure 7.3.).
Table 7.2. Average tenture of top soil, trapped sediment and material in suspension for two periods during the growing season (%). (RW-3F, 1980).
Original top soil
Before August 7 : trapped suspended
After August 13: trapped suspended
< 2
10
18 59
19 48
2-20
6
4 27
5 18
Size class
20-200
28
21 13
23 13
(um)
200-2000
48
53 1
50 21
> 2000
8
4 0
3 0
< 50
18
24 93
26 73
+) A related index was used by Lai (1976): the Erosion Ratio, defined as:
(silt + clay) % ( s e d i m e n t ) , (silt + clay) % (gravel + sand) % v (gravel + sand) %
This Erosion Ratio indicates the same tendency, but cannot be directly used to calculate the amount of top soil involved in the process.

108 handweeding
2.8
2.4
2.0-
1.6-
0.8-
M trapped sediment
H all sediment
Date
Storm size (mm) Weighed Mean
Intensity (mm/h) Material in
suspension (g/l)
23/7 34
110
30/7
23
24
6/8 22
24
3.5
13/8 13
21
14/8 19/8 20/8 2/9 3/9 13 118 56 30 20
6/9 18/9 30 12
21 29
1.6 0.8
25 152 25
0.9 2.2 3.5 4.7 Figure 7.3. Dispersion co-efficient (fraction < 50 um in sediment/fraction < 50 um of
original top soil) over the growing season for small runoff plots (RW-3F, 1980).
However, if we include the material in suspension, ratio's were often
higher than 2.0 (figure 7.3.). Therefore, suspended material has a great
influence and should always be included in such considerations. In our
experiments data on the composition of suspended outflow was scarce, but
the tendency is clear.
Both ratio's depicted in figure 7.3. are marked by a rise after hand wee
ding. This effect is caused by an enrichment of the exposed surface with
erodible, fine fractions, partly through mixing of the surface layer,
partly by the breaking up of relatively stable aggregates. A cultivation
creates a less protected surface, more susceptible to the impact of rain
drops. This trend was the same for the different surface configurations
that were compared in the experiment and data for figure 7.3. are therefore
lumped over the treatments.
Actual values, however, differed is so far as the values for the dispersion
coefficient of the trapped sediment that were obtained from the flat cul
tivated plot (treatment A) were consistently only 2/3 of those of the other
plots. A possible explanation for this might be the difference in flow
pattern between the treatments. The more concentrated flow in furrowed
plots causes higher flow velocities and a higher representation of stable
soil aggregates in the transported material, thus yielding the finer par
ticles in the trapped material.
The distinct increase of the finer fraction in the eroded material immedi
ately after a cultivation was also measured by Gilley et. al. (1976) in
rainulator tests on 22 x 4 meter plots, in North Dakota, USA. For a sandy
clay loam they observed an erosion ratio of 1.14 for untilled plots and

- 109 -
2.31 for 5-7 cm deep tilled plots respectively.
The height of the erosion ratio clearly depends on the presence of fine
particles that can be removed. Other dependencies are difficult to prove.
However, on basis of the available figures, and excluding the data obtained
immediately after handweeding, there seems to be some correlation between
the erosion ratio and the amount of runoff (r = 0.27) but no correlation at
all could be observed with the intensity of rainfall (r = 0.08). This might
support the assumption that the higher erodibility of the fine particles in
these unstable soils is mainly caused by the "washing-out" effect of flow
ing water, these soils being dispersed already by the lowest raindrop
impact '. Zachar (1982) describes this phenomenon as laminar erosion. It is
characterised by a low kinetic energy of the flowing water, washing away
only the finest soil particles. Higher runoff amounts consequently would
have a lower selective action. For an Alfisol, the result of such process
is shown in figure 7.4. Soil samples from the surface, in the cross section
of a bed-and-furrow, were analysed. The preferential removal of the finer
fraction was greatest at those locations where surface flow concentrates,
mostly in the furrows ( location 1 and 7 ) and to a minor extent between the
crop rows (locations 3 and 5).
7.4. The Influence of Field Characteristics on Erosion and Soil Loss
Topographic factors influence the processes of erosion and soil transport
within a field. This is partly related to the difference in exposure of the
topsoil to erosive factors; bedded fields are in this respect more erodible
than flat cultivated fields, due to the ample presence of easily erodible
strips, formed by the steeply sloping shoulders of the beds.
Surface configuration also determines the flow pattern of the surface
runoff. Flow-velocity is a crucial factor as this influences the tractive
force of flowing water, the quantity of sediment it can contain and the
particle size it can move (Meyer and Monke, 1965). A higher flow velocity
increases these capacities exponentially.
+) Yet, in soils with a higher aggregate stability, this will be different. There, higher levels of raindrop impact are needed to disperse the aggregates into erodible particles. This was explained by Meyer and Monke (1965) on the basis of observations in laboratory experiments, where raindrops induced splash and increased the turbulence of the runoff. This increased the sediment availability and runoff carrying capacity for small particles.

- 1 1 0 -
Cross-section of Bed - and- Furrow
Location
1 2 3 4 5 6 7
< 2
12 17 12 12 14 17 10
1
© / >
® ® © ® ®
2-20
4 8 5 6 6 6 3
Size class (|jm)
20-200 200-200
22 26 28 29 28 27 31
62 47 53 49 49 47 54
©
> 2000
1 2 2 4 3 3 2
Figure 7.4. Particle size distribution (%) of top soil (0-1 cm) across a raised bed (RW-3F, September 1978).
However, this does not always imply a proportional increase in sediment
content of the runoff water as, at some point, the forces that separate
soil particles to be transported will generally become a limiting factor
(Carson, 1971). Likewise the sediment content per unit volume of runoff
decreases with an increase of duration of runoff, as reported by Ellison
(1945) and Emmett (1970, cited by Carson).
Scouring action and transport capacity of the runoff can be minimized by
keeping the flow velocity as low as possible. In an existing field, this
can often be attained by reducing the slope in the direction of flow by
construction of narrowly spaced furrows parallel or nearly parallel to the
contour. Size and shape of furrows have an additional influence on the flow
characteristics (section 6.2.3.); in this respect wide furrows have advan
tages .
For a certain drainage channel, like a furrow, flow velocities also increase
with a higher volume of runoff, be it less than proportional. Flow veloci
ties can, therefore, be influenced by changing the size of the catchment
area or its runoff production.
Local depressions, as can be encountered in flat cultivated fields (sec
tion 6.2.1.), have a major influence on soil loss as they reduce the runoff
quantity. In bedded fields a sedimentation of eroded material, and espec
ially of its coarser fraction, is induced by a reduction of flow velocity

- Ill -
by the construction of low graded furrows. The ultimate effect on soil
loss, however, appears to be different for the two situations and to depend
on the height of the runoff.
Reduction of runoff and consequently soil loss, as caused by depressions in
flat fields is, in relative terms, highest for low runoff events. On the
contrary, for prolonged runoff its effectiveness decreases. And although
reduction of flow velocity makes sense at extremely high runoff rates, to
avoid scouring action, below such a critical value the concentrated flow in
furrows makes the delivery of soil material to be transported the limiting
factor in the process. With a higher intensity, therefore, soil loss from
flat plots increases more than from bedded plots.
These effects can be shown on the basis of the already mentioned small plot
experiments. The ratio of soil loss from the flat plots (A) and the fur
rowed plots (B) for individual storms could be related to their rainfall
quantity and intensity (Appendix, 9, figure A.2.(b)) ' . For the low rain
fall events with low intensities the measured soil loss from the flat
cultivated plots was less than from furrowed plots. At higher runoff
events, however, the opposite was observed.
Differences between treatments would be expected to even out if summarized
over an entire season. Yet, in line with the small plot experiments, total
sediment yield from flat cultivated field-scale areas was lower than from
Table 7.3. Runoff and soil loss from field scale plots (about 0.4 ha) for two surface configurations and two years
runoff soil loss sediment content
(mm) (t/ha) (kg/mm)
1979 (662 mm) Flat
Beds
89 70
105 87
224 169 213 309
0.4 0.4 0.7 0.7
3.8 2.7 2.5 4.7
4.5 5.8 6.5 8.5
1981 (1094 mm) Flat
Beds
17.0 16.1 11.8 15.3
+) Runoff from these plots was measured as volume, rather than as rate. As all reported rainfall events were runoff producing, it was assumed here that their intensities were also reflected in the intensities of runoff.

- 112 -
bedded areas in a year with well-distributed rain (1979) while is was not
for a much wetter year (1981) (Table 7.3.). The differences in average
sediment content of the runoff for the two years are even more illustra
tive.
7.5. Agronomie Practices to Reduce Erosion and Soil Loss
Keeping in mind the causative factors of water erosion and soil loss, i.e.
the destructive impact of rainfall on the soil surface, the scouring effect
of flowing water and the transport capacity of runoff, agronomic practices
should be directed against these effects. Efforts, therefore, should be
made to maximize infiltration and to protect the surface against the ero
sive influences of rainfall impact and flowing water.
In red soils, that have an inherent lack of structure, tillage has an im
portant role to play. Its positive influence on infiltration, discussed in
section 6.1.1., helps to reduce erosion. Heavy runoff, however, can reverse
this effect. Following heavy rains, increased soil loss might be encoun
tered from freshly tilled areas compared to areas with an undisturbed
surface. Fortunately, the probability of heavy and continuous rain is
highest in the latter part of the rainy season, during the period of full
canopy development.
An important approach to combating erosion is the combination of all prac
tices that establish a well developed crop before the periods of most
aggresive rainfall. Within this scope, one should think of the choice of
suitable crops or crop combinations, selection of suitable varieties and
fertilization, and also of appropriate techniques and implements for caring
for the crop. Mulching could be an outstanding method of providing more
protection and reducing soil transport. But, as mentioned earlier, availa
bility of suitable materials will generally be an insurmountable problem.
For this reason, trials with mulching were not carried out.

- 113 -
CHAPTER 8 RUNOFF COLLECTION
i.1. General
With the alternation of too wet and too dry periods of the semi-arid trop
ics within a growing season, one obviously considers the possibilities of
transferring excess water during a wet period to a subsequent period of
water shortage. If the soil profile has insufficient storage capacity, this
could be done by collecting and storing runoff water in a constructed
reservoir. Required lay-out would furthermore consist of field outlets,
waterways connecting to the reservoir and a spillway.
As a warning against simplifying the picture, Krimgold (1945) has already
made it clear that a primary consideration in the design should be the
dependability of the water inflow, with the proper and full utilization of
that water next in line. The reservoir capacity should therefore be based
on the inflow that can be expected to occur during the majority of years.
This assures a certain availability of water and an economic use of the
lay-out. Storage capacity might be still lower in some relatively wet
areas, if an optimal use of water is already envisaged at lower volumes.
Under semi-arid tropical conditions, of all soil types, red soils might be
the most qualified for a runoff collection system, because of their high
runoff generating nature and their generally low profile water retention
capacity, which makes them drought sensitive.
8.2. Reservoirs: Design, Seepage and Evaporation
A large catchment area and a downstream water use allow for a flexible
selection of the reservoir site, generally a valley that can be dammed.
Alternatively the reservoir has to be constructed within the agricultural

- 114 -
part of a watershed. If this is the case it should be constructed by exca
vation, using the excavated soil for the embankment. Although a depression
or piece of low quality land is preferable, more often than not the con
struction will be at the cost of productive land.
Where land is in short supply, a design with a maximum storage/area ratio
is crucial. Moreover, to minimize earthmoving, a maximization of the stor
age/ excavation ratio should be pursued. This could be done by locating the
reservoir at some distance below the outflow point of its catchment area,
allowing runoff water to enter the reservoir via a raised channel. (Sharma
and Helweg, 1982; Burton, 1965).
The effective capacity of a reservoir, defined as the volume of water
ultimately available for irrigation, also depends on the level of water-
losses, which take place through seepage and evaporation. As both loss-
factors are continuous processes, the duration of storage is an important
determinant. For a certain volume stored the shape of the reservoir deter
mines the area over which seepage and evaporation take place. This area has
the lowest value for a reservoir with a spherical shape.
Pepper (1976) studied a number of earthen dams, concluding that seepage
through them is governed by a relatively thin sealing layer of soil at the
boundary of the excavation. Such seals develop as suspended clay is carried
in the seepage water, blocking the soil pores. The seepage rate is further
more related to depth of water, exerting the pressure height. In line with
the observations by Pepper, Alfisols and probably most other red soils do
have some good properties that help avoid extremely high seepage rates. The
low percentage of clay, mostly kaolinite, avoids the formation of cracks
upon drying, so that the surface remains in good shape over the dry season.
Through siltation of fine silt and clay particles and the washing-in pro
cess into the sandy structure, permeability of bottom and sides is reduced
considerably in the course of a few years as was observed at ICRISAT-
station and also reported by Vijayalakshmi (1982) for 2 other locations in
India. Seepage rates, however, could still remain too high if no additional
measures are taken. Most techniques to attain this are, regretfully, either
too expensive to apply or prove to be insufficiently effective. Cluff
(1981) lists a number of seepage control measures including chemical treat
ments, use of bentonite, soil cement, synthetic membrames, concrete and
asphalt lining. From his projection it is clear that all such treatments
are still undergoing further research as all have their specific problems,
be it durability, availability of material or skill, apart from the costs
involved. Research on cheap sealants, mostly mixtures of soil with cow dung
or cement show meagre results (Vijayalakshi, 1982). Incidentally, perco
lation rates can be reduced considerably, but a major problem seems to be

- 115 -
the maintainance of the lining over the years, following a number of wet
ting and drying cycles. Use of sodium-carbonate to reduce percolation
(Reginato, et.al. , 1973) is well-known and often considered as a cheap and
efficient method, but its usefulness is based on dispersion of clay and
therefore less applicable in the sandy Alfisol areas.
On the same lines, reduction of evaporation from the reservoir is difficult
to attain. Methods to achieve this through the application of reflective
floating material or surface films of oil or fatty alcohols are costly and
unstable because of wind action. Use of mechanical covers might be more
promising from a technical point of view, but prove to be far too expensive
for agricultural use (Cluff, 1981; Nicolaichuk, 1978). The single feasible
approach to keeping evaporation losses at the lowest, would be to minimize
the surface area of the reservoir. In a more advanced lay-out, this could
be idealized in a compartmented reservoir (Cluff, 1979; 1981), where, after
the rains have stopped, stored water is concentrated in a decreasing number
of compartments by pumping. Such a system could probably be feasible in
situations where water is required throughout the rest of the dry season
for livestock or other intensive uses.
Specifications for the construction of reservoirs should be followed in
respect to the allowable slope of the sides and compaction of the dykes
that are related to material constants, being the local soil characteris
tics in the case of a dug-out, unlined, reservoir. Sufficient free-board
should be allowed in order to avoid breaches through wave-action caused by
flood flows or wind. In this respect, it is important that spillways are
designed at the right location and with sufficient capacity. Carreker
(1945) warned already that "inadequate spillways have probably more often
been the cause of pond failure, than has poor dam construction". Detailed
description of small dam- and reservoir construction can be found in sever
al publications, including Kieft (1973), Soil Conservation Service (1977;
1981) and Costa et.al. (1983). For reservoir construction that includes the
use of lining material, reference is made to Costa et.al. (1981; 1982) and
Mueller and Karunaratne (1982).
8.3. Location of Reservoir
In deciding upon the construction of small surface reservoirs conflicts
might arise in respect to the size and location of the reservoir, which are
partly related to their intended use. A major controversy exists over which
area in a watershed is going to benefit from the collected water. From a

- 116 -
physical point of view it would appear most logical to design a cascading
series of reservoirs, where water collected from the one area is to be used
for irrigating the adjacent lower stretch. Application of water could be
done via a gravitational lay-out. Size of the reservoir and its contribu
ting area could be chosen on the basis of technical, topographical and
organizational considerations, which would generally favour the construc
tion of a smaller number of larger reservoirs, reducing the construction
costs per hectare, and lowering evaporation and percolation losses by a
lower wetted surface/volume ratio. Realising the mostly small land holdings
in India, such lay-out would involve a number of farmers per reservoir. It
would therefore divide the ownership of the water and that of the land from
where the water is collected. If the farmer in the water generating area is
not the same person who owns the field benefitting from it, he might be
reluctant to co-operate in a proper lay-out and maintenance of the system.
But even if both the contributing and benefitting part of the watershed
were farmed by the same person, the risk of the farmer neglecting water
conservation measures in the upper part would still exist. As a matter of
fact water conservation in his upper field would go at the cost of water
availability in his lower area. This attitude could be aggrevated by dif
ferences in land quality.
A different system would result from a scheme in which collected water is
used in the area it originates from. Consequences related to the size of
the system in respect to construction costs and water losses would be simi
lar to those mentioned for the cascading system. Application costs of the
water would be higher as lifting of water is required. If, however, the
area of such system is kept very small (say 0.25 - 0.50 ha), a completely
different picture of water collection and utilization emerges. Now, for a
farmer, the possibility of recycling water is created, which is evidently
supplemental to his efforts to conserve rainfall in the same field. He
would, therefore, be in a position to implement techniques that are both
aiming at the best field practices for conserving water in situ, and at a
good and efficient surface drainage and water collection. As the collected
water is at his own disposal, this would lead to most efficient field
application methods and it could easily be anticipated that the availabil
ity of water close to the field would lead to an earlier and more frequent
use of it. This is also more likely in view of the higher collection effi
ciency for such small catchment areas, resulting in an earlier and higher
availability of stored water (section 4. 5. ) .

- 117 -
8.4. Use of Collected Water
As outlined in section 8.3. a choice, concerning size and location of a
reservoir could be made, roughly speaking between a small reservoir serving
an individual field and a higher capacity reservoir collecting its water
from a much larger (sub-) watershed area. To a large extent such a choice
would be based on the anticipated utilization of the water. In field scale
reservoirs, collected water would be used in the first place for supplemen
tary gifts during dry spells in the rainy season. Larger reservoirs would
serve to collect water mainly to extend the growing season or to enable the
growing of a post-rainy season crop.
Local mean rainfall and its distribution and soil characteristics are
important physical parameters at the base of such a choice. The rainfall
pattern of Hyderabad, India alone would still leave this choice open, as
the probability of a prolonged dry spell is not extremely high (Kampen,
1975). Concerning soil characteristics, shallow Alfisols would bias the
choice towards field scale reservoirs, as they are already sensitive to
short dry spells with a higher probability of occurence, while for deep
Alfisols the option for larger reservoirs would appear to be more appropri
ate, providing water for a sequential crop, as a supplement to the profile-
stored water. (Compare figures 4.1. - 4.3., section 4.5.).
Using collected water in the first place for supplementary irrigation
during the rainy season limits the required capacity of the reservoir to a
level that is based on the runoff expected during the period prior to an
expected dry spell. On the*basis of this constraint its capacity could be
in the order of 350 - 400 m3/ha for Hyderabad conditions, based on an aver
age of 10 - 15% runoff during the first half of the rainy season. This
quantity of water would be sufficient to supplement the profile water for
at least one week, if efficiently applied. Refilling of the reservoir can
be expected before the end of September, more so because runoff percentage
is higher later in the season (15 - 20%). This water could either be used
for another supplementary irrigation before maturing of the rainy season
crop, if possible and thought necessary, or for a sequential crop. Possibi
lities for such use would include an irrigation to stimulate ratooning,
irrigation of an intercrop component or a series of water gifts of a se
quential crop on part of the area.
Incidental experiences with small water gifts at ICRISAT reveal the impres
sive yield increases that could be attained. All observations, however,
refer to deep Alfisols. Therefore, in several other years no supplemental
water was needed during the rainy season, when the profile provided suffi-

118
c i e n t bu f f e r c a p ac i t y , which may no t be expected for shal low s o i l s . Y ie ld advantages due t o i r r i g a t i o n of a r a i ny season crop were r e po r t ed for 2 y ea r s (table 8.1(a)) '. For two f u r t h e r yea r s ICRISAT r e p o r t s p o s i t i v e r e s u l t s wi th a p p l i c a t i o n of small water g i f t s on A l f i s o l s i n t h e p o s t - r a i n y season . (Table 8.1(b)).
Leaving a s i de t he da t a on p e a r l m i l l e t and sunflower t he water u t i l i z a t i o n e f f i c i e n c i e s for both r a i ny season and p o s t - r a i n y season supplementary i r r i g a t i o n proved t o be h igh .
Table 8.1: ICRISAT's observations on yield effect of supplementary irrigation on deep Alfisols.
(a) Rainy season
Year
1973 - 1974
1974 - 1975
(b) Post-rainy
1975 - 1976
1977 - 1978°)
Crop
Sorghum Pearl Millet Sunflower
Sorghum Sorghum Pearl Millet Pearl Millet Sunflower Sunflower Maize
season
Tomato Safflower
Sorghum Sorghum Sorghum Ratoon Sorghum Ratoon Sorghum Ratoon Sorghum
H
2 2 2
1 2 1 2 1 2 1 2
2 1
ater gift
(mm)
x 50X^ x 50X( x 50 X )
x 50 x 50 x 50 x 50 x 50 x 50 x 50 x 50
x 25 x 25
75 100 200 75
100 200
Yield
control
(t/ha)
4.87 3.34 1.12
2.76
2.89
0.65
4.08
12.5 1.04
0.18
1.17
irrigated
(t/ha)
5.25 3.48 1.33
3.29 3.87 2.87 2.95 0.74 0.76 4.47 5.00
23.4 1.38
0.83 1.37 1.57 2.02 2.31 2.57
W.U.E.
(kg/ha. mm)
8 0 6
11 11 0 0 2 1 8 9
200 13
9 12 7
11 11 7
+) Water Utilization Efficiency, defined as the harvested yield per unit of water. (Doorenbos and Kassam, 1979).
x) Second water gift was immediately followed by 37 mm of rain. °) No details about distribution of water gifts available.
Sources: ICRISAT (1974; 1975; 1976; 1978)
In a different location at ICRISAT-station a single 50 mm water-gift on August 23, 1974, resulted in an impressive increase of yield from 2,960 kg/ha to 5,750 kg/ha for maize (Krantz, personal communication).

- 119
Figure 8 . 1 . L i t t l e water may have impressive e f fec t s (supplementary i r r i g a t i o n of sorghum).
T h e s e f i g u r e s compare v e r y w e l l w i t h e x p e c t e d e f f i c i e n c i e s f o r i r r i g a t e d
a g r i c u l t u r e , a s g i v e n by Doo r enbo s and Kassam ( 1979 ) (table 8.2).
Q u a n t i t i e s o f w a t e r r e q u i r e d f o r p o s t - r a i n y s e a s o n i r r i g a t i o n w i l l b e
h i g h e r t h a n f o r r a i n y s e a s o n s u p p l e m e n t a r y i r r i g a t i o n . C o n s e q u e n t l y , i f i t
i s c h o s e n t o i r r i g a t e p o s t - r a i n y s e a s o n c r o p s , l a r g e r s i z e r e s e r v o i r s a r e
n e e d e d t h a t a r e a b l e t o s t o r e t o t a l s e a s o n ' s r u n o f f . E s t i m a t e d maximum
c a p a c i t y wou ld b e i n t h e o r d e r o f 1100 m 3 / h a u n d e r Hyde r a b ad c o n d i t i o n s ,
b a s e d on a mean r u n o f f p e r c e n t a g e b e t w e e n 15 a nd 20 a t a t o t a l s e a s o n a l
r a i n f a l l o f 600 mm.
8 . 5 . A v a i l a b i l i t y o f Wa t e r o v e r Time
I n th"=> c a s e o f w a t e r c o l l e c t i o n w i t h e n v i s a g e d u s e d u r i n g t h e p o s t - r a i n y
s e a s o n , d u r a t i o n o f s t o r a g e o f a t l e a s t p a r t o f t h e c o l l e c t e d w a t e r i s
Table 8 .2: Water U t i l i z a t i on Efficiences (W.U.E.) as obtained under optimal condit ions in respect to crop- and watermanagement
Crop W.U.E.
kg/ha. mm
Sorghum Sunflower Maize Tomato Safflower
6 - 1 0 3 - 5 8 - 1 6
100 - 200 2 - 5
Adapted fron Doorenbos and Kassam (1979)

- 120 -
relatively long, resulting in high losses through percolation and evapora
tion. Together with inevitable application losses and a subtraction for
dead storage, it will be clear that in most situations only a part of the
runoff-contributing watershed can benefit from the collected water. Yet,
such a system does allow for more concrete planning than a system oriented
at supplementary irrigation of rainy season crops, as distribution of
runoff over the season hardly affects the total water-availability by the
end of the season. Furthermore, a reservoir that was not completely full
would still allow for a proper use, be it on a reduced area.
Aiming at irrigation during the rainy season, a smaller reservoir would be
designed allowing a certain level of overflow in some or most of the years.
This, however, would mainly happen in the later part of the season. The
reservoir should be able to retain sufficient water in the first half of
the growing season.
The change in storage of water in a reservoir (AS) at a chosen interval
can be computed according:
A S = Q + P - E - D - I - O (8.1.)
with: Q = inflow
P = Precipitation
E = Evaporation
D = Percolation
I = Water extraction for irrigation
O = Overflow
which should all be expressed in m3.
Storage at the end of the interval i (S) equals:
Si = Si _ ± + A S (8.2. )
Kramer (1974) presented a method of analysis to arrive at a failure proba
bility, defined as the chance of depleting a reservoir at too early a
stage, based on long term rainfall/runoff data. His calculations are di
rected towards a situation where the period till the next inflow has to be
bridged with a predetermined required volume of water. Assuming a flexible
water requirement, which would be determined by actual shortage and would
be partly adjustable via crop choice and size of area irrigated, a much
more complicated picture would result from such analysis.
Following equation 8.1 a much simpler calculation of in- and outflow compo
nents of a reservoir resulted in figures 8.2 and 8.3.
Figure 8.2 gives the calculated stored volume of water in a reservoir with

- 121 -
6-1 Stored volume (x 1000m3
5-
2-
— D : 5 l /m per day
D; 10 l / m z per day
-120 (mm)
•100
60
40
20
Figure 8.2. Calculated stored volume of water for a 5 ha watershed reservoir, aiming at post-rainy season use, and for different rates of percolation (D).
200-,
150-
100-
50-
D=0 j D=5 l/m2day-' / D=10l/m2day-' / /
/ /
1 / 1
1
1
A /
J# ^ / ' '
(0)
lb)
Ic)
(a)
(b)
Ic)
" v v "~—s. (o)
\ \ lb) \ \ \
V
\ \ Id
la)
(b)
(c) H
-40
(mm
-30
-20
-10
M N
Figure 8.3. Calculated stored volume of water (lines) and volume in excess of reservoir storage (bars) in a 0.5 ha field reservoir, aiming at supplementary irrigation during the rainy season, and for different rates of percolation.
a 5 ha catchment a r ea i n t h e course of a r a i ny s eason . F igure 8.3 g ives t h e s e f i gu r e s for a " f i e l d - s c a l e " r e s e r v o i r w i th a c a p a c i t y of 192 m3 and a catchment of 0 .5 ha . The f i gu r e s a r e based on mean monthly r a i n f a l l for Hyderabad, runoff p e r cen t ages assumed a t an average of 15 and 20% for t h e

- 122 -
first and second half of the rainy season respectively and an evaporation
from the reservoir equaling 90% of pan evaporation figures. As stated ear
lier, a smaller area will yield more runoff than a larger catchment. For
comparitive reasons, the figures 8.2 and 8.3, however, are drawn on the
basis of the same runoff yield, irrespective of the size of the catchment
area.
In both figures, line (a) assumes that no seepage occurs, so that the
reservoir losses are restricted to the evaporation component. Lines (b) and
(c) refer to similar reservoirs with a seepage rate of 5 (lines (b)) and 10
(lines (c)) 1 day- 1 m~2 respectively for their submerged areas.
In accordance with the anticipated use of the smaller type, water for
irrigation is available in August, which could deplete the reservoir. This
is made up by subsequent inflow.
Seepage and evaporation constitute the losses from storage in these unlined
reservoirs. Their effect over the period of storage can be visualised by
indicating the ratio of available water at a certain moment to the volume
of inflow till that time, denoted as the efficiency of storage (Figure 8.4.
(a) and (b)).
E= 0 D= 0 E=0 D=0 00n
% 90-
80H
70-
60-
50-
40-
30-
20-
© + + 4- + + -t- + -
D - 0
/
/ / X°=j° /
D : I. m"2. day"'
® D=0
JD=10
J J A S 0 N D
Figure 8.4. Efficiency of storage (volume of available water as percentage of the total inflow till date) over time for assumed levels of seepage (D): (a) watershed scale reservoir with sufficient storage capacity to collect total expected season's runoff (b) field scale reservoir, with restricted storage capacity and with use of water or overflow during the rainy season. (E = Evaporation).

- 123 -
In the case of the field-scale reservoir, available water constitutes the
volume of stored water plus the amount of water indicated as excess water
in figure 8.3., assuming that this could have been used for irrigation. In
figure 8.4., the three curved lines represent the storage efficiencies
resulting from reservoirs with seepage rates of 0,5 and 10 mm/day respec
tively. Evaporation (mm/m2) is taken as an un-reduced rate for these three
cases, related to pan evaporation.
The low storage efficiency for the larger reservoir in June and July is due
to the relatively extended surface area of a small volume of water stored
and the resulting high losses. Seepage from the larger reservoir, when
filled, is lower than from the smaller reservoir per unit of volume stored,
because of a more favourable storage/wetted area ratio. The apparently
higher storage efficiencies later on for the smaller reservoirs are in
fluenced by the inclusion of the excess water component, supposedly used
for irrigation. This water is not stored and does not contribute to the
losses.
It appears that for the larger reservoirs with a low seepage rate of
5 mm/day, about 20% of the orginally stored water is lost by seepage during
the period June up to November, similar to the volume lost by evaporation.
As the period of irrigation from such a reservoir can be anticipated, so
can expected losses by seepage. A comparison between the costs of seepage
reduction and the benefits of the water saved, is made relatively easily
for a specific situation, as the latter is mainly based on a water-yield
relation.
Benefits of lining the field scale reservoirs are more difficult to pre
dict. While, in the first half of the monsoon season, seepage per unit of
volume stored is lower than in the larger reservoir, lining could further
reduce it. Its benefits, could be high if the lining helps in making suf
ficient water available to bridge dry spells, reducing the risks of com
plete crop failure.
8.6. Construction of Reservoirs
In India the construction of un-lined reservoirs could be executed at
relatively low costs. If done largely by hand, most of the costs involved
would be for labour, which has a low opportunity cost, if the work can be
executed in a period without much agricultural activity. ICRISAT's experi
ence has taught that, in an Alfisol area, the construction of a 5,100 m3
tank could be done at the cost of Rs 0.95+) per m3 storage (ICRISAT, 1978).

- 124 -
Construction costs of reservoirs not only depends on the availability of
labour and/or equipment, but also on the alternative use of the occupied
land and on labour and material required for auxiliary structures. Seepage
reduction can be achieved by a variety of measures, varying in efficiency
and costs involved. They are location specific, as they depend on the local
availability of required material and skill.
Costs of reservoirs should also be seen in relation to the frequency of use
of the created storage capacity. In a situation where water is used exclu
sively some time after the rain has ceased, the volume of water, available
for irrigation, is less than the storage capacity of the reservoir. Its
frequency of use is, therefore, always less than one per year. If, however,
water from a reservoir is already used during the rainy season, allowing
the reservoir to fill up again, the frequency of use of the created volume
increases.
Table 8.3. Details on two differently sized reservoirs
Type of reservoir Watershed Field
(ha. (n.3)
(m2) (%)
(m2)
mm)
(m3/m2)
122 6,099
1,810 3
2,038
2
6
99
38 192
133 2.7
161
1.19
Catchment area (ha) 5.0 0.5
Reservoir volume
Surface area reservoir
Area of sides + bottom
Volume/Wetted area
+) Calculated on the basis of an inverse cone segment, with side slopes 1 : 1 , and radius at bottom and top of 4.5 and 6.5 meters respectively for the field-scale reservoir, 20 and 24 meters resp. for the watershed-scale reservoir.
In table 8.3 some technical details are given, referring to the two reser
voir systems discussed earlier. Construction costs of such reservoirs per
m3 of water ultimately used, depend on a number of factors. Denoting the
costs for earth moving as "x" per m3, for lining as "y" per m 2 and for
auxiliary structures as "z" per m 3 storage, the total costs per m3 of water
used can be approximated by:
h' 1 US$ = Rs 10/-

125
1 1 1 (- . x + - . y + z) . - (8.3.) a b c
with a = storage/excavation ratio of the reservoir
b = ratio of reservoir volume versus wetted area
c = frequency of use per year
In a comparison between the two reservoirs, we may assume a similar value
for the factors a, x, y and z. The value of "b" (volume/wetted area) would
be lowest for the smaller reservoir, but this might be made good by a
higher "c"-value (frequency of use). If so, this makes the two systems
similar in ultimate water costs. If we assume the costs of earth moving at
Rs 1/- per m3 and that of lining at Rs 10/- per m2, this would result in a
cost of Rs 6/- per m3 of water, excluding the costs of auxiliary struc
tures .
Such costs seem to be compatitive with the costs of water in many irriga
tion systems, while the observed water use efficiencies also compare fa
vourably.

126 -
CHAPTER 9 ASPECTS OF WATERSHED DEVELOPMENT AND MANAGEMENT
9.1. General
In its commonly used definition a natural watershed from ridge to outflow
point could cover an appreciable area of land and would generally include a
range of soil-types or -qualities, vegetation and land-uses. In the topo-
sequence or catena of such watershed one would consequently expect to en
counter a range of human activities. Simplified, a toposequence for semi-
arid tropical areas could be indicated as a (natural) vegetation of trees,
shrubs and grasses at the top, an agricultural part with rainfed crops in
the middle and economically higher valued crops in the lower and wetter
part of the watershed, possibly irrigated.
From an hydrological point of view this sequence would coincide with a
water-recharging area, water-transmission area and a water-discharging area
respectively.
Geologically seen these zones are characterized by a decreasing level of
erosion and increasing sedimentation.
The middle part of a watershed is the area that is normally used for rain-
fed agriculture, that is (or could be) under permanent cultivation of
annual crops without being supplemented by inflow of water in addition to
precipitation. It has higher agricultural potentials than the upper reach
of the watershed, but is far more susceptible to the vagaries of nature
(resulting in erosion and droughts) than the lower area.
In a rolling type of landscape, as is very common in semi-arid India,
(relative) topographic heights and depressions exist within this agricul
tural zone. By these height differences sub-watersheds are formed within
the potentially cropped area. These could be denoted as agricultural (sub-)
watersheds, as is common in the vocabulary of ICRISAT.

- 127 -
Agricultural (sub-(watersheds are restricted in size and none of the fore-
mentioned divisions in zones can be made. In the area studied aquifers are
almost absent and percolation and sub-surface flow of water will mostly be
irrelevant for the concerned area. Its hydrological behaviour can be des
cribed with factors that are related to precipitation, profile storage and
surface runoff, with percolation as a loss-factor. Because of the exclusion
of the subsurface flow component it is possible to change the area of an
agricultural watershed by adjusting the surface drainage pattern. This
could be done, aiming at creating a more homogeneous or better shaped area
or at subdividing the area in order to lower the runoff volume or peak
flow. It could be an unintended consequence of the construction of runoff
obstructions like a reservoir or a road. This way agricultural watersheds
become more or less artificially created units.
Under conditions of subsistence farming a watershed area would have to sup
port a community of people in most or all of their basic requirements,
which include such necessities as a place to live, water supply, grazing
land, arable land, fuel supply and infra-structure. Watershed development
and management, therefore, are concepts that could imply a wide range of
activities.
A well-balanced use of the natural resources of a watershed area as under
traditional occupation, however, is not compatible with the increasing
population densities, as have been occurring in many parts of the world and
very distinctly in India. With an almost stable productivity on area basis,
increasing requirements for food and introduction of cash crops could only
be attained through extending the food-producing area to less suitable
parts of the watershed. Increased demand for fuel has been depriving the
natural vegetation of trees and woody shrubs. Increase in number of cattle
and decrease of availability of grazing land has been causing overgrazing
and deterioration of the land. Through all this the protection of land by
natural or otherwise suitable vegetation has been diminishing, thus in
creasing runoff and erosion.
In this situation, there is an urgent need to take measures that will stop
a further loss of the natural resources soil and water and that can possi
bly increase the productivity of the area.
Firstly, this requires an evaluation of the land, its present use and its
potentials. A list of questions as given by FAO (1976) and supplemented by
Beek (1978) could serve as a basis for a comprehensive land use planning:
- How is the land currently managed, and what will happen if present
practices remain unchanged?

- 128 -
- What improvements in management practices, within the present use, are
possible?
- What other uses of land are physically possible and economically and
socially relevant?
Which of these uses offer possibilities of sustained production or other
benefits?
What adverse effects, physical, economic or social, are associated with
each use?
What recurrent inputs are necessary to bring about the desired produc
tion and minimize the adverse effects?
- What are the benefits of each form of use?
What changes in the condition of the land are feasible and necessary,
and how can they be brought about?
What non-recurrent inputs are necessary to implement these changes?
Such evaluation indicates the irrelevance of restricting oneself to the in
dication of suitability based on technical and soil-physical considerations
alone. The actual use of the different watershed parts should serve as a
guidance for planning. Within each catagory, then, improved practices
should be recommended for further implementation.
9.2. The Zone of Recharge
Measures taken in the zone of recharge (the upper part of the watershed)
should in the first place be oriented at inducing infiltration to provide
more moisture for the local vegetation. This could be achieved both by
improving the permanent vegetative cover and, until optimum growth is
reached, by the creation of depression storage by engineering measures and
land management. Infiltration beyond profile storage capacity may ultima
tely replenish the groundwater in the downstream area while it also further
reduces the contribution to torrential surface flow over larger areas.
Additional interventions could be oriented at impeding runoff through
measures like diversions and dams. These measures lower the soil transport
capacity of the runoff water and reduce the inflow at lower stretches of
the watershed. Under conditions of a well-developed permanent vegetation,
runoff might be negligible in much of the semi-arid and sub-humid areas
during most storms and even without additional measures (Kowal, 1970).
Incidental storms, however, could still cause appreciable runoff, for which
a safe disposal is needed.

- 129 -
In many situations, the upper part of a watershed is mainly destined as a
source of fuel and as grazing land. Increase of production per unit area
could often be achieved by proper selection of grass and tree species and
proper care and protection of the vegetation. This requires a strong in
volvement of the users of the area in supporting development and avoiding
renewed exhaustion. Problems may arise where such watershed parts are com
mon property. An organizational structure is a pre-requisite to guarantee a
permanent controlled use. To set conditions for such co-operation it should
be ensured that the production capacity is high enough to satisfy the
users, or that alternative sources are developed or provided to reduce the
demand up to the level of the area's bearing capacity. Alternative sources
could, for example, consist of an alternative energy supply or an increase
of the fodder production at the agricultural parts of the watershed.
9.3. The Zone of Discharge
In the lower stretch of a watershed one may expect a higher intensity of
agricultural activities, as the soils (through deposition) tend to be
better than at higher elevations in respect to fertility and crop water
availability. In many parts of India concentration of water in this area,
both as subsurface flow and surface flow, enables the growing of irrigated
crops, even such water demanding crops like rice and sugarcane.
The runoff collection and subsequent irrigation of a crop like rice seems,
at least physically, to be a poor approach in a semi-arid tropical area
given its low efficiency of water use compared to many other crops (Puttana,
1983). The higher and more secure yield per hectare, combined with a rela
tively cheap and easy to maintain lay-out, however, make such a system a
profitable alternative over rainfed production and over irrigating other
crops, for an individual farmer ' (based on the gross margin per ha or
per m3 of water).
In this situation, longer term effects on overall productivity and system's
stability are not incorporated. The higher parts of a watershed function as
the catchment for the lower parts. Improper management of the upper reaches
will first of all increase runoff. This would seemingly benefit the lower
area because of a higher water availability, but the related increase of
peak-flows endangers the lay-out and may cause breaching of reservoir dams.
+) Data on reservoir supported rice production for a number of locations in Southern India, however, show a rapid deterioration of the system under the present conditions of management (section 4.2.4.)

- 130 -
Moreover, higher runoff increases the amount of soil carried by the water,
particularly from poorly protected contributing areas, causing additional
siltation in the reservoir.
Yet, reservoirs and wells in the zone of discharge depend on the inflow
from the upper reaches of the watershed. Measures that change the hydrology
of the contributing area, may clash with the interests of the irrigation
systems. As far as water is recovered from wells, additional infiltration
in the upper reaches will only be beneficial for groundwater replenishment
but if the irrigation system is reservoir based, a reduction of inflow will
have its impact on the availability of irrigation water. This is most
relevant in watersheds where most or all of the catchment area consists of
cultivated land.
In southern India, however, part of the inflow into reservoirs originates
from rocky areas, so that runoff retardation in the cropped parts of a
watershed will have little, if any, adverse influence on the irrigation
system.
9.4. The Agricultural Watershed
9.4.1. General
On areal basis, the central zone of a watershed is generally by far the
most important part for agricultural production. Although incidentally
farmers may have a (small) piece of irrigated land in addition, most farm
ers of semi-arid India fully depend on their fields in this part of the
watershed. Here we find the agricultural (sub-)watersheds that, apart from
some exceptions, do not possess any form of additional water supply over
the local rainfall.
A high variation of soil quality exists both interregionaly as intra-re-
gionaly, and even within an agricultural watershed major differences in
quality can be observed between fields, mainly related to their topographi
cal location and level of erosion. Regional differences in rainfall quanti
ty and its distribution add to the diversity in suitability for production
of individual fields.
Commonly, the natural main surface drainage pattern forms the basis of a
watershed lay-out. Individual agricultural fields, varying in size and of
irregular shape fill up the whole area. They are separated from each other

- 131 -
by small bunds or by other marks. Some parts, mostly of poor quality, are
government-owned and designated as common grazing land. Shallow drainage
ways frequently cross cultivated fields. Scattered trees and bushes may
grow on pieces of bad land, alongside tracks and on bunds. Depending on
soil quality and rainfall pattern different crops or crop combinations are
grown, which also determine the level of use of manure and/or fertilizer.
Loss of organic matter and nutrients through the washing-out effect of
surface runoff could locally be high.
In many areas a drastic change in the watershed lay-out can be observed
through the construction of contour-bunds. Through these bunds runoff water
is partly held back and ponded in the field, partly routed into more or
less protected drainage ways (Section 5.3.1.).
9.4.2. Options for Development of an Agricultural Watershed
9.4.2.1. General
An overall watershed development plan should be based on the objective to
increase the productivity of the concerned area at an acceptable level of
stability and with due consideration for the technical, social and finan
cial limitations met by the farmers. Stability of production over the years
is a prerequisite for co-operation of subsistence farmers. Stability,
however, also refers to the long term conservation of the soil resource
which, due to their weak and uncertain economic position, is normally out
of subsistence farmers's scope.
Watershed development, therefore, is an activity that, to some extent, goes
beyond the direct responsibilities of the individual farmers and even the
group of them. It rather concerns the regional or national authorities. An
individual farmer, at the most, can be expected to apply techniques that
are oriented towards the conservation of soil and water within his field.
In a co-operative structure, he could be involved in the construction and
maintenance of watershed bases activities, as long as this proves to be
beneficial for his own production. However, activities that are not short
term production oriented are not in the direct interest of subsistence-
level farmers, who can not afford to invest in them.

- 132 -
Viewing the red soil areas in semi-arid tropical India, characterized by
their sensitivity to drought and their high erodibility, two development
approaches on land- and watermanagement seem to be available. The simplest
approach would comprise only a minor adaptation of the traditional system
of farming, but would be strongly oriented at runoff control from water
sheds to stop further deterioration through erosion (Section 9.4.2.2.).
Such approach, however, also lacks potentials for distinctly increasing
production.
The other approach would be based on the introduction of a renewed system
of cultivation, aiming at an overall watershed development and protection,
including water collection for supplementary irrigation (Section 9.4.2.3.).
The latter can be seen as the approach envisaged by ICRISAT.
9.4.2.2. Option 1: Protection of the Agricultural Watershed
From the foregoing chapters, it may have become clear that for the red soil
areas and for small fields in particular, a system of flat cultivation can
not always be considered as inferior to a system of bedded cultivation as
experimented with by ICRISAT, under otherwise similar conditions. In re
spect to runoff and soil loss, flat cultivated fields may even be consi
dered slightly superior to the bedded system, although this might not al
ways be true in areas that are wetter than Hyderabad or in relatively wet
years. (Section 6.2.). Moreover, this difference might be removed by a more
intensive tillage of the bedded plots (Section 6.1.1.1.). As flat cultiva
ted fields lack the provision of a controlled drainage system, problems,
however, will arise in larger fields and with big runoff producing storms.
Another characteristic of flat cultivated fields is the presence of macro
depressions (Section 4.4.3.) that could be the reason for waterlogging
during wet periods, suffocating the crop and hampering field operations. At
the same time, however, such depressions serve as temporary water storage,
thereby reducing the runoff from many small storms, conserving water. A
system of flat cultivation is traditional for India and is normally exe
cuted with extremely cheap implements .
+) It should be noted here, that the reported comparisons between flat cultivated and bedded fields on runoff, soil loss and crop yield, are related to the surface configuration only. For the sake of comparison, use was made of improved implements for both systems. In referring to the system of flat cultivation as it is traditional for India, the use of traditional implements, local crop varieties and crop management is assumed.

- 133 -
Watershed improvement under these conditions and constraints, would be
concentrated on an improvement of the surface drainage and runoff control,
to make the best of the traditional techniques and to protect the indivi
dual fields. This can be arrived at by a number of measures:
Individual fields should be restricted in size to avoid excessive flow
within the field.
The fields should be protected against inflow of surface runoff from
higher areas.
A proper choice of field boundaries is required, so that, to its maximum
possible, the direction of one boundary coincides with the envisaged
direction of cultivation (slightly off the contour) while another coin
cides with a natural drainage line, if present.
Within the fields excessive water stagnation should be avoided by an
appropriate levelling.
Field runoff should be diverted to a protected waterway, avoiding pro
longed stagnation in the field. If held back in the field for a short
duration (say less than about 12 hours), this could be beneficial in
repect to water conservation and reduction of runoff volume and peak
flow.
The total area under bunds (mainly to retard and divert runoff water)
and waterways might go up to some 10% of the watershed-area. Bunds,
therefore, should be made productive by growing trees on them.
Main drainage ways should be protected by a grass vegetation or other
wise and, where necessary, provided with drop structures.
Development of an agricultural watershed on these lines is a minimum re
quirement for controlling erosion, but it has little improvement on the
water availability for crop growth.
9.4.2.3. Option 2: Development of the Agricultural Watershed to Increase
its Productivity
Production levels under traditional systems of farming are low and the
measures that were discussed in the foregoing paragraph would hardly con
tribute to raising them. Introduction of improved varieties and fertiliza
tion would be restricted in such systems to the best soils, as insufficient
profile depth creates a high risk of crop failure in drought periods.
- 134 -
The productivity of most of the red soils in the semi-arid tropics could
only be distinctly increased and better secured if watershed development,
apart from protection, includes the creation of water storage capacity in
excess of that of the soil profile (Section 4.5. ) . This could be done by
the construction of small reservoirs in which runoff water is collected and
that serve as a source for supplementary irrigation (Chapter 8). Such
lay-out, however, requires high development costs and should therefore be
based on the use of improved varieties that have a high response to the
improved water availability. Such varieties have to be supported by suffi
cient fertilization and optimal field conditions. The latter refer to a
suitable and homogeneous topography and surface drainage, required to
enable accurate and speedy operations and an early entry into the field
after heavy rain. Where traditional techniques and implements can not
guarantee such proper conditions, they have to be replaced by an adapted
system. Experience at ICRISAT suggests that the use of a bedded surface
configuration would be better able to provide these field conditions
(Section 6.2.).
For the development of an agricultural watershed the use of a bed-and-fur-
row configuration in the individual fields has several implications. The
fields can be made larger than with flat cultivation as the presence of the
furrows already provides sufficient safeguard against excessive concentra
tion of runoff. Only the length of individual furrows should be restricted
to say 60 to 70 meters. Although water stagnation in macro-depressions will
be confined to furrows and not directly damage the crop, land levelling is
still required as the water in the furrows would delay entry into the
field. The number of bunds could be lower and their size smaller compared
to flat cultivated areas and would not have any other function than as
border and footpath.
In a watershed design it should be included that the slope in the direction
of the furrow is restricted to a minimum, just allowing a free outflow of
water. Practical experience has shown that a mean slope of 0.4% can be
considered optimal, as at lower design values frequent backsloping would
occur. Uniformity of shape and size of the bed over the field is another
important aspect, necessary for an optimal performance of subsequent field
operations.
The shape of the bed and the furrow also determine the depression storage
capacity on top of the bed (Section 6.2.1.) and the flow characteristics of
the furrow (Section 6.2.3.). On the basis of experiments on 1.50 m wide
beds preference would go to a shape with narrow furrows and a level bed, at
least for Hyderabad conditions.

- 135 -
9.4.2.4. Tillage and Crop-Management
Although mostly restricted in its capacity, the soil profile remains a most
important and efficient reservoir for storing moisture. However, adverse
characteristics of the red soils often hamper infiltration, causing extra
runoff and soil loss. More than the surface configuration, appropriate
tillage could improve on this.
From different experiments measures to improve the water entry into the
profile can be derived. These include an intensive primary tillage which
increases the plough layer storage (Section 5.1.1.1.). Although for the
described system of intensive tillage the number of passes increases, the
draft requirement for individual passes is nominal, at least in a bedded
surface configuration. A similarly intensive tillage in flat cultivated
fields, however, appeared to be impossible. Intercultivation to break the
crust and to create a rough surface was found to conserve water, but its
effects were of short duration and required an early repetition (Sec
tion 5. 1. 1.2.) .
Above all, extreme care should be given to crop establishment and manage
ment. In his study on the influences of tillage, Klay (1983) states that
"poor and uneven stands is one of the major causes of low crop yields in
the semi-arid tropics", while he also refers to severe yield reduction by
weeds during the early period of crop growth, caused by competition for
water and nutrients. Where growth conditions are improved, these aspects
become even more urgent. In that case the use of a uniform bed-and-furrow
configuration, together with improved implements seems required, as simpler
techniques can hardly guarantee sufficiently good performance.
9.4.3. Execution of Development Plans
As stated before, watershed development in the semi-arid tropics should
serve the objectives of both resource protection and increased productivi
ty. Although the latter is not the least important, it should only be aimed
at in combination with the former; created increase of production potential
should not be endangered by subsequent erosion. Measures concentrating on
resource protection only may well be executed as a single (or major)
objective. In this case there is almost no question of short term profita
bility and although the land users should be involved in planning, execu
tion and maintenance, the involved costs should not be passed on to them.

- 136 -
In the other situation, however, the farmers are much more a party in
development as they should agree and be able to work in a renewed watershed
lay-out, with other techniques and at a higher level of costly inputs. The
farmers should be willing and available to provide knowledge, labour,
capital and co-operation at the required level. Even if a sufficient avail
ability of inputs is secured from outside and the profitability of the
system has been proven, the individual farmer remains with the uncertainty
of continuing support from outside and continuing co-operation from within
the area. New dependencies may strengthen his doubt.
Development plans, therefore, should first of all be based on ability and
willingness to cooperate. Doherty (1982) sets limits to possibilities for
"group action" in semi-arid India, both in respect to the number of parti
cipants as well as to the duration. Following his line of thought, water
shed development plans, if properly sized, could well be organised and
executed by groups of farmers in India. For long term management and main
tenance, however, other institutions should be created.
To improve the productivity in rainfed agriculture, supported by a renewed
system of land- and watermanagement, interventions in existing land proper
ties can not always be avoided. Land consolidation is required or at least
very helpful in order to come to an optimal design of surface drainage and
the best shapes and sizes of individual fields and the location of reser
voirs .
The benefits of watershed development for the individual farmers in rainfed
red soil areas are very difficult to estimate. Most construction work
involved, apart from that of reservoir construction, relates to watershed
protection and can not be considered to yield direct benefits.
An important part of the construction of protection works consist of earth
work. The greater part of this, if not all, can be done with handlabour, as
under Indian conditions the labour surplus outside the growing season makes
its opportunity cost low. Activities that directly relate to a farmer's own
field and its productivity could possibly be done with family labour. In
such a situation the construction of small reservoirs, for example, can be
cheap and consequently be made profitable.
Sharma et. al. (1983) calculated the benefit/cost ratio of small, lined
reservoirs in Uttar Pradesh (India) that were recently constructed and
still being constructed by individual farmers. Only after exluding the cost
of family labour, the ratio came above unity.
- 137 -
The farmer's major expenses comprise the cost of equipment and a much
higher level of variable costs for seed and fertilizer. The yield poten
tials under such a system are also high if sufficient water is available
when required. The always present risk of crop-failure, that forces subsis
tence farmers to low-inp.ut systems, should be compensated by an appropriate
guarantee, possibly given by a system of rural work programs.
9.5. Concluding Remarks
The ICRISAT-concept of watershed development in order to stimulate pro
ductivity of rainfed agriculture in the semi-arid tropics is basically
sound. Point-wise it aims at:
creating an optimal profile condition for crop growth;
ascertaining accuracy and timeliness in all field operations;
using crop varieties and cropping systems with a high yield potential,
rightly supported by fertilization and crop protection;
stimulating in situ water conservation;
protecting the area against degradation through erosion;
collecting excess water for subsequent use.
The translation towards a system of watershed development, based on a
bedded field lay-out, the use of a bullock-drawn wheeled tool carrier with
attachments and modern varieties appears to combine these aims and to
respond well in medium-deep and deep Vertisol areas. Water collection and
re-utilization, however, do not seem to be a pertinent profitable technique
in view of the already high profile water retention capacity of the Verti-
sols. Otherwise, this system appears to be able to remove a number of
constraints that are met in the traditional system of management and
strongly related to surface drainage and timely operations. This even makes
it possible to grow a rainy season crop in extended areas that are left
fallow during the humid period in more traditional systems.
It has not long been appreciated that the physical constraints of the red
soils for an innovative system of production, are different from those of
the Vertisols under identical climatic conditions. Red soils are always
rainy season cropped and field accessibility is much less of a problem.
Loss of water through runoff, however, is a more serious problem as it
starts to occur much earlier in the season than from Vertisols. Another
problem is the low profile's capacity to store water.

- 138 -
The land management system with the use of a bedded surface configuration
might also for red soils be beneficial in respect to quality of field
operations, control of excessive runoff and possibility for efficient
irrigation. When transferred to the red soils as such, however, it induces
runoff in small storm events rather than conserves water as observed in
Vertisols.
In red soil areas, with the possible exception of the deep soils, the major
constraint relates to timely water availability. A system aiming at a
"break-through" in productivity could therefore only be reached if this
water is provided.
A large number of questions remain unanswered. Some of them could possibly
be attended to in subsequent research. To assess an overall value for the
feasibility of the approach as a whole, experimental lay-outs at farmer's
level are required for long-term evaluation. Farmers should be given the
opportunity to become experienced in working in a renewed system and to
develop their own decision criteria for managing the system.

139
CHAPTER 10 SUMMARY
Rainfed agriculture is defined as the production of field crops that
completely depend on the local precipitation for their water supply.
Although in the semi-arid tropics the mean annual precipitation might seem
to be sufficient to grow (adapted) crops, its variability over the years
and its erratic distribution over the season pose problems. During rela
tively dry periods, the crop might suffer from moisture stress, at other
times excessive rainfall occurs, causing water logging and erosion. This
creates specific problems for crop production. The red soils, as a general
indication of a group of mainly sandy loam soils, including Alfisols, have
a low profile water storage capacity, often aggravated by their shallow
ness. Therefore, they generally lack sufficient buffer capacity to transfer
water from a rainy period to a subsequent period of insufficient rainfall.
Thereby, red soils have a poorly developed structure and the aggregates of
the topsoil are easily dispersed upon wetting, resulting in a surface
sealing. Raindrop impact causes a further compaction of the top layer.
Under these adverse conditions, the infiltrability of the red soils will be
strongly reduced and frequently surface runoff occurs well before the
profile is saturated, even early in the rainy season.
Production levels under such water-limited conditions are bound to be low.
Yet, millions of people in the semi-arid tropics depend on them. In trop
ical India alone, the area of red soils that is yearly cropped can be
estimated at as much as 50 million hectares. Common food-crops are mostly
local varieties of sorghum, millets and grams, with average yield levels
well below 1 t/ha. Important cash crops include groundnut, castor and
sesame, with similarly low yields. Expansion of agricultural fields, in the
case of red soils mainly under the pressure of population growth has been
bringing less suitable areas under permanent cultivation and worsening crop
rotation over the last 50 years or so. This leads to a further impover
ishment of the soils.

- 140 -
Shortage of sufficient water at the right time has always been a problem
the farmers in the drier regions of the world have had to face. Depending
on the land conditions and climate, different systems have been developed in
order to tackle this problem. Some techniques are briefly described (chap
ter 4). Unfortunately, most techniques are based on the availability of a
high retention capacity of the profile to store water, which makes such
system unsuitable for red soil areas.
In national and international agricultural research, attention is in the
first place focussed on the development and introduction of modern crop
varieties in combination with the use of synthetic fertilizer. Suitable
varieties are the ones that have a higher yield potential and relatively
good properties in respect to drought resistance or -avoidance as well as a
minimum susceptibility to pests and diseases. Additional attention is given
to beneficial crop combinations in respect to efficient water and nutrient
use.
More than the traditional cultivars, improved varieties require uniformly
good growth conditions for optimal production. Moreover, higher demands are
set for accurate and timely soil- and crop management, including seed bed
preparation, seeding, fertilizer placement and mechanical weed control. As
the technology that is traditional for the rainfed areas of India can not
fulfill all these requirements at the proper level, introduction of imp
roved implements and land management appears necessary. In combination with
this there is the assumption that observed problems on excessive runoff,
local water stagnation and high erosion could be dealt with much better in
a bedded field than in the traditionally flat cultivated fields.
At ICRISAT (International Crops Research Institute for the Semi-Arid
Tropics), Hyderabad, India, these assumptions have lead to the introduction
on experimental scale of such field lay-outs together with bullock-drawn
wheeled tool carriers. For the sandy Alfisols the system of ridges was
abandoned soon after introduction, because they proved unstable and dif
ficult to handle with most field operations. The system of a bed-and-furrow
configuration, however, continued to be used and seemed workable in com
bination with the improved equipment. However, in contrast to its per
formance on Vertisols, the system when used on the Alfisols appeared to
result in higher runoff and soil loss compared to flat cultivated fields.
In this study for which experimental work was done at the ICRISAT research
station, a number of observations are reported that helped to validate
assumptions on the runoff characteristics of red soils and to understand
the reasons for the differences between surface treatments in this respect.

- 141 -
As the infiltrability of red soils is easily reduced to low values through
surface sealing, the surface depression storage proves to become an impor
tant parameter that influences the cumulative infiltration, as it most
effectively prolonges the time of residence of the water in the field and
therewith the time available for infiltration.
Micro-depression storage (or surface retention) is related to the surface
roughness and can be appreciable directly after cultivation. Under the
influence of (heavy) rain , however, a rapid and almost complete decline of
it can be observed (section 6.1.1.2), mainly due to the low stability of
the top soil. Only shallow depressions will be left, which on top of a more
or less crowned shaped bed have little or no storage capacity, while they
do have at least some in a flat cultivated field.
Mini-depressions, as formed by unintended marks and irregularities, are
much more stable but have a low storage capacity. Mini-depressions could
also be created purposely, for example by damming furrows at intervals,
which is only feasible on bedded fields. Under the conditions of Hyderabad,
they do not prove effective.
Macro-depressions, as far as they are formed by topografie undulations
within the field, also pose a difference between flat cultivated and bedded
fields, as in the latter the stagnation of the water is restricted to the
furrows. This can be a major advantage of the use of beds, as prolonged
stagnation of water, resulting from continuing rain, will adversely affect
most crops in the waterlogged areas.
Mainly by the differences in depression storage between flat and bedded
fields, their runoff performance is also different; actual differences
thereby depend on size and intensity of individual storms (section 6.2.2.).
At the same time, approaches to reduce runoff and erosion from bedded
fields were searched for. In this respect a much more intense system of
primary tillage, as compared to the usual way of ploughing beds at ICRISAT,
earlier proposed by Klay (1983) proved to increase infiltration (sec
tion 6.1.1.). A significant difference in bulk density of the top soil was
measured even by the end of the growing season.
The influence of the shape of the bed-and-furrow on runoff behaviour was
observed and hydraulic roughness co-efficients of the furrows calculated
(section 6.2.3.). Again, as with the difference between flat and bedded
fields, the pros and cons of a certain shape and size of the furrow also
depend on the expected storm sizes. For Hyderabad, however, preference goes
to narrow furrows along with a level bed. This is also the shape that is
easiest to handle with bullock-drawn implements.

- 142 -
Observation on erosion and soil loss (chapter 7) stressed the need to
differentiate between the local loss of soil within a field and the ulti
mate sediment yield at a measuring point. The necessity to include the
composition of transported material in comparison to that of in situ mate
rial is made clear and its difference expressed as "dispersion co
efficient" . Measurements on the texture of eroded material over the season,
showed the occasionally high values of this dispersion co-efficient. The
high contribution of suspended material, particularly for red soils, in
total soil-loss was obvious from the experiments.
Although a more intense system of tillage, both in respect to depth and
frequency, might well be able to decrease runoff, the maximum storage
capacity of red soil profiles may often become a limiting factor. Most red
soils have a profile retention capacity below 150 mm of crop available
water, frequently even below 100 mm. In many years, this will prove to be
too low a reserve to adequately support a standing crop during the droughty
periods that can be expected to occur in the semi-arid tropics. Observa
tions at ICRISAT are referred to (section 8.3.), where small amounts of
water, applied as supplementary irrigation during periods of stress, resul
ted in considerable yield increases. But small water gifts that supported
the growth of an additional post-rainy season crop also proved to be very
effective. As far as no other source of water is available but the local
precipitation, water for supplementary irrigation has to be drawn from
earlier rainfall excess that has lead to surface runoff and has been col
lected in (excavated) reservoirs. Chapter 8 describes two alternatives for
such an approach. Firstly, a runoff collection and water re-utilization
system could be based on the collection of all season's expected runoff
leaving the choice open, depending on the season, to use this water to
break dry spells or to support a subsequent crop, possibly on a reduced
area. Such a system would be based on reservoirs, with a storage capacity
of say 5,000 - 6,000 m3 for a 5 ha area (100 - 120 mm on area basis). The
second system would be based on a field-scale water collection. Here, the
envisaged storage capacity would amount to a much lower value of, say,
40 mm on area basis, or 200 m3 for a 0.5 ha field. In this latter approach
collected runoff mainly serves as a source for supplementary irrigation
during dry spells.
A choice between the two systems is complicated and, among others, depends
on local precipitation, soil depth, grown or envisaged crops and available
technology. Yet, a number of small reservoirs might well have some distinct
advantages over a single larger one. These relate to a higher water collec
tion efficiency, increasing the probability of a filled reservoir at the
time the water is needed and to the possibility for small farm units

- 143 -
(0.5 ha) to use the water at the right moment, using simple (and cheap)
means for water lifting and transport. The relatively higher seepage from
small reservoirs, c.q. the relatively higher costs for lining them, might
be made good by a higher frequency of use, as the reservoir will mostly be
filled up again after water extraction.
In watershed development in red soil areas in the semi-arid tropics atten
tion is generally directed to both resource protection and increase of
productivity. Only the former could possibly be considered as a single
objective. In the combined objective, the land users have to drasticly
change their systems of farming, as traditional technology already uses the
environment to its optimum. Introduction of modern crop varieties and
fertilization, costly inputs, should go along with an optimum management of
the land, the soil and the water. Watershed development in this context is
only possible if farmers are able and willing to spend knowledge, labour,
capital and co-operation at the required level.
For reaching this goal, relevant groups of farmers should be organised to
enable co-operation in necessary land consolidation and construction work.
For longer term maintenance work and for the organisation of machine pool
ing etc., separate bodies are required.

- 144 -
CHAPTER 11 SAMENVATTING
Regenafhankelijke landbouw is gedefinieerd als de produktie van gewassen
die voor hun watervoorziening volledig afhankelijk zijn van de lokale
neerslag. Hoewel de gemiddelde jaarneerslag in de semi-aride tropen vol
doende hoog lijkt te zijn voor de verbouw van een (aangepast) gewas, geeft
de variatie ervan over de jaren en de onregelmatige verdeling binnen het
seizoen aanleiding tot problemen. Een gewas kan schade ondervinden door
vochttekort door relatief droge perioden terwijl op een ander moment over
vloedige regenval optreedt met stagnerend water en erosie als gevolg. Dit
veroorzaakt specifieke problemen voor gewasproduktie. De rode gronden, als
een algemene aanduiding van een groep voornamelijk zanderige leemgronden,
waaronder Alfisolen, hebben een laag vochtvasthoudend vermogen, versterkt
door hun vaak ondiepe profielen. Daarom missen ze over het algemeen vol
doende buffercapaciteit om water over te dragen van een natte periode naar
een opvolgende periode met onvoldoende neerslag. Daarbij komt dat de rode
gronden een slecht ontwikkelde structuur hebben en dat de aan de oppervlak
te blootgestelde aggregaten makkelijk uiteen vallen bij bevochtiging,
resulterend in de vorming van een korst. De inslag van regendruppels ver
oorzaakt een verdere verdichting. Onder deze ongunstige omstandigheden
wordt de infiltratiesnelheid van de rode gronden sterk verlaagd met als
gevolg dat vaak oppervlakkige afstroming plaatsvindt zonder dat het profiel
verzadigd is, zelfs vroeg in het regenseizoen.
Onder dergelijke omstandigheden van beperkte beschikbaarheid van water zijn
de opbrengsten logischerwijs laag. Toch zijn miljoenen mensen in de semi-
aride tropen ervan afhankelijk. Alleen al in tropisch India, kan het areaal
aan rode gronden dat jaarlijks verbouwd wordt geschat worden op niet minder
dan 50 miljoen hectare. Gebruikelijke voedselgewassen zijn over het alge
meen de lokale variëteiten van sorghum, giersten en peulvruchten, met
gemiddelde opbrengsten ver onder de 1 t/ha. Belangrijke handelsgewassen

- 145 -
worden gevormd door aardnoot, castor en sesam, met eveneens lage opbreng
sten. Uitbreiding van het landbouw-areaal, wat de rode gronden aangaat
vooral onder de druk van bevolkingsgroei, heeft gedurende ruwweg de laatste
50 jaar geleid tot ingebruikname van minder geschikte gebieden voor perma
nente akkerbouw en heeft de kwaliteit van de gewasrotatie verslechterd. Dit
leidt tot een verdere verarming van de bodems.
Gebrek aan voldoende water op het juiste moment is een probleem waarmee de
boeren in de drogere gebieden van de wereld altijd al geconfronteerd zijn
geweest. Afhankelijk van terreinomstandigheden en klimaat, zijn verschil
lende systemen ontwikkeld om dit probleem te ondervangen. Enkele technieken
worden in het kort beschreven (Hoofdstuk 4). Ongelukkigerwijs zijn de
meeste technieken gebaseerd op de beschikbaarheid van een hoog water vast
houdend vermogen van het profiel om water op te slaan, waardoor zulke
systemen ongeschikt zijn voor gebieden met rode gronden.
In nationaal en internationaal landbouwkundig onderzoek is de aandacht op
de eerste plaats gericht op het ontwikkelen en introduceren van moderne
gewasvariëteiten gecombineerd met het gebruik van kunstmest. Geschikte
variëteiten hebben een hogere opbrengstpotentie en relatief goede eigen
schappen op het gebied van droogtetolerantie of -vermijding, met daarbij
een minimale vatbaarheid voor plagen en ziektes. Daarnaast wordt aandacht
gericht op gunstige gewascombinaties voor een efficiënt gebruik van water
en voedingsstoffen.
Meer dan de traditionele cultivars, vereisen verbeterde variëteiten uniform
goede groeiomstandigheden voor optimale produktie. Bovendien worden er
hogere eisen gesteld aan een nauwkeurige en bijtijdse verzorging van bodem
en gewas, zoals bij zaaibedbereiding, zaaien, toedienen van kunstmest en
mechanische onkruidbestrijding. Omdat de technologie die traditioneel is
voor de regenafhankelijke landbouwgebieden in India niet voldoende aan al
deze behoeftes tegemoet kan komen, blijkt de introductie van verbeterde
werktuigen en veldinrichting noodzakelijk te zijn. Gecombineerd hiermee
wordt aangenomen dat waargenomen problemen van buitensporige afstroming,
lokale waterstagnatie en hoge erosie veel beter aangepakt kunnen worden in
een veldinrichting met bedden en voren dan in de traditioneel vlak geculti
veerde velden.
Bij ICRISAT (International Crops Research Institute for the Semi-Arid
Tropics), Hyderabad, India, hebben deze aannames geleid tot de invoering op
experimentele schaal van een dergelijke veldinrichting, samen met een door
twee trekdieren voortbewogen werktuigraam. Voor de zanderige Alfisolen werd
het systeem van smalle ruggen alweer snel verlaten, omdat de ruggen insta-

- 146 -
biel bleken te zijn en moeilijk te bewerken bij de meeste operaties. Het
systeem van bedden bleef echter in gebruik en leek bruikbaar in combinatie
met de verbeterde werktuigen. Echter, in tegenstelling tot gebruik op
Vertisolen, bleek dit systeem op Alfisolen te resulteren in een verhoogde
afstroming en bodemverlies in vergelijking tot vlak gecultiveerde velden.
In deze studie, waarvoor experimenten werden gedaan op het onderzoekssta-
tion van ICRISAT, worden een aantal waarnemingen gerapporteerd die hebben
geholpen om aannames aangaande afstromingskarakteristieken van rode gronden
op hun waarde te taxeren, en om in dit verband de oorzaken te begrijpen
voor de verschillen tussen oppervlaktebehandelingen.
Omdat de infiltratie van rode gronden snel en sterk achteruit gaat door de
vorming van een korst, blijkt de oppervlakkige berging in depressies een
belangrijke parameter te worden die de cumulatieve infiltratie bepaalt,
omdat deze op de meest effectieve wijze de verblijfstijd van het water in
het veld verlengt en daarmee de tijd beschikbaar voor infiltratie.
De berging in micro-depressies (of oppervlakteretentie) is gerelateerd aan
de oppervlakteruwheid en kan aanzienlijk zijn direct na een bewerking.
Onder invloed van (zware) regen, kan echter een snelle en bijna volledige
afname ervan waargenomen worden (paragraaf 6.1.1.2), vooral vanwege de lage
stabiliteit van de bovengrond. Alleen ondiepe depressies zullen overblij
ven, die op een min of meer afgerond bed weinig of geen bergingscapaciteit
hebben, terwijl ze in een vlak gecultiveerd veld tenminste enige berging
hebben.
Mini-depressies, voorzover gevormd door toevallige afdrukken en onregelma
tigheden, zijn veel stabieler, maar hebben een lage bergingscapaciteit.
Mini-depressies kunnen ook opzettelijk gecreëerd worden, bijvoorbeeld door
voren op regelmatige afstanden af te sluiten, wat alleen relevant is in
velden met bedden. Onder de omstandigheden van Hyderabad blijken zij niet
effectief te zijn.
Macro-depressies, voorzover zij worden gevormd door topografische hoogte
verschillen binnen het veld, geven ook aanleiding tot een verschil tussen
vlak bewerkte velden en velden met bedden, omdat in het laatste geval de
stagnatie van het water beperkt is tot de voren. Dit kan een belangrijk
voordeel zijn van het gebruik van bedden, omdat langdurige waterstagnatie
op die plekken, als gevolg van aanhoudende regen, de meeste gewassen na
delig zal beïnvloeden.
Vooral door de verschillen in berging in depressies tussen vlak bewerkte
velden en velden met bedden, is hun afstroming ook verschillend; feitelijke
verschillen zijn daarbij afhankelijk van grootte en intensiteit van indivi
duele regenbuien (paragraaf 6.2.2.).

- 147 -
Gelijktijdig is er gezocht naar benaderingen die de afstroming en erosie
van het beddensysteem konden verminderen. Wat dit betreft, bleek een sys
teem van primaire grondbewerking dat veel intensiever is in vergelijking
tot de op ICRISAT gebruikelijke manier van het ploegen van de bedden,
eerder voorgesteld door Klay (1983), de infiltratie te verhogen (para
graaf 6.1.1.)- Zelfs tegen het eind van het groeiseizoen werd een signifi
cant verschil in dichtheid van de bovengrond gemeten.
De invloed van de vorm van het bed en de vore op de afstroming werd geobser
veerd en coëfficiënten voor de hydraulische ruwheid berekend (paragraaf
6.2.3.). Net als bij het verschil tussen vlakke velden en velden in bedden,
hangen de vóór- en nadelen van een bepaalde vorm en afmeting van de vore
ook weer af van de te verwachten bui-groottes. Voor Hyderabad gaat de
voorkeur echter naar nauwe voren samen met een vlak bed. Dit geeft ook de
vorm die het eenvoudigste te behandelen is met werktuigen met ossen-
tractie.
Waarnemingen op het gebied van erosie en bodemverlies (hoofdstuk 7) bena
drukten de noodzaak om een onderscheid te maken tussen het lokale bodem-
verlies binnen een veld en de uiteindelijke sediment-opbrengst bij een
meetpunt. De noodzaak om de samenstelling van getransporteerd materiaal te
includeren in vergelijking tot dat van het in situ materiaal wordt duidelijk
gemaakt en het verschil uitgedrukt als 'dispersie-coëfficiënt'. Bepaling
van de textuur van geërodeerd materiaal over het seizoen, toonde de soms
hoge waardes van deze dispersie-coëfficiënt. De hoge bijdrage van materiaal
in suspensie, in het bijzonder voor rode gronden, aan het totale bodemver
lies, kwam bij de experimenten duidelijk naar voren.
Hoewel een intensiever bewerkingssysteem, zowel wat diepte als wat frequen
tie aangaat, in staat zal kunnen zijn om afstroming te verlagen, kan de
bergingscapaciteit van de rode gronden vaak een beperkende factor worden.
De meeste rode gronden hebben een bergingscapaciteit voor gewas beschikbaar
bodemvocht kleiner dan 150 mm, vaak zelfs minder dan 100 mm. In vele jaren
zal dit een geringe reserve blijken te zijn om een gewas adequaat te onder
steunen gedurende de periodes van onvoldoende neerslag, zoals die in de
semi-aride tropen verwacht kunnen worden. Er wordt verwezen naar waarnemin
gen bij ICRISAT (paragraaf 8.3), waar kleine hoeveelheden water, toegediend
als supplementaire irrigatie gedurende periodes van watertekort, resulteer
den in aanzienlijke opbrengststijgingen. Maar ook kleine watergiften ter
ondersteuning van de groei van een additioneel gewas, aansluitend aan de
regentijd, bewezen zeer effectief te zijn. Voorzover er geen andere bron
voor water aanwezig is dan de lokale regenval, moet water voor supplemen
taire irrigatie geput worden uit eerder opgetreden overschotten van regen,
die hebben geleid tot oppervlakkige afstroming en wat verzameld is in

- 148 -
(gegraven) reservoirs. Hoofdstuk 8 beschrijft twee alternatieven van deze
benadering. Als eerste kan een systeem van wateropslag en hergebruik geba
seerd zijn op het verzamelen van de totale hoeveelheid te verwachten af
stroming gedurende het regenseizoen. Het gebruik van dit water ligt niet
vast en kan, afhankelijk van het seizoen, aangewend worden om droogteperio
des te doorbreken of om een volgend gewas te ondersteunen, mogelijkerwijs
op een beperkt oppervlak. Een dergelijk systeem zou gebaseerd zijn op
reservoirs met een opslagcapaciteit van zeg 5.000 - 6.000 m3 voor een
gebied van 5 ha (100 - 120 mm op oppervlaktebasis). Een tweede mogelijk
systeem zou gebaseerd zijn op wateropvang op veldniveau. In dit geval, zou
de te voorziene opslagcapaciteit veel lager liggen, misschien 40 mm op
gebiedsbasis, oftewel 200 m3 voor een veld van 0.5 ha. Bij deze laatste
benadering dient het opgevangen water vooral als bron voor supplementaire
irrigatie gedurende droogte-intervallen.
Een keuze tussen de twee systemen is gecompliceerd en hangt onder andere af
van de lokale neerslag, bodemdiepte, verbouwde of voorziene gewassen en
beschikbare technologie. Toch zou een aantal kleine reservoirs enige duide
lijke voordelen kunnen hebben boven een enkel groter reservoir. Deze voor
delen zijn gerelateerd aan een hogere efficiëntie van wateropvang, waarmee
de waarschijnlijkheid vergroot wordt dat het reservoir gevuld is op het
tijdstip dat er water nodig is en aan de mogelijkheid voor kleine landbouw-
eenheden (0,5 ha) om het water op het juiste moment te gebruiken met behulp
van eenvoudige (en goedkope) middelen van wateropvoer en transport. De
relatief hogere percolatie van kleine reservoirs, c.q. de relatief hogere
kosten voor bekleding van de reservoirs, zouden gecompenseerd kunnen worden
door een hogere frequentie van gebruik, gezien het feit dat het reservoir
meestal weer opgevuld zal raken na eerdere wateronttrekking.
Bij de ontwikkeling van vanggebieden in regio's met rode gronden in de
semi-aride tropen is de aandacht over het algemeen gericht op zowel be
scherming van het gebied als op een verhoging van de produktiviteit. Alleen
de eerste doelstelling zou mogelijkerwijs als losstaand doel beschouwd
kunnen worden. In de gecombineerde benadering moeten de landgebruikers hun
systeem van landbouw drastisch veranderen, omdat de traditionele technolo
gie de omgeving al optimaal gebruikt. Introductie van moderne gewasvarië
teiten en bemesting, dure inputs, moet samengaan met een optimaal gebruik
van het land, de bodem en het water. In deze context is de ontwikkeling van
een vanggebied alleen maar mogelijk als de boeren in staat zijn om kennis,
arbeid, kapitaal en samenwerking te besteden op het benodigde niveau.
Om dit doel te bereiken, moeten relevante groepen van boeren georganiseerd
worden om samenwerking voor de noodzakelijke landverkaveling en construe-

- 149 -
tiewerk mogelijk te maken. Voor onderhoudswerk op de langere termijn en
voor de organisatie van het gezamenlijk gebruik van werktuigen, enz., zijn
afzonderlijke organisatiestructuren nodig.

- 150 -
APPENDIX 1
Profile Description of Typical Shallow and Medium Deep Alfisol
(a) Shallow. (Location: ICRISAT, RA-18, Patancheru, A.P. India)
Horizon Depth Description (cm)
A 0-15 Reddish brown (5YR 6/4 dry); yellowish red (5YR 4/6 moist); coarse sandy loam; single grain with few medium very weak, subangular blocky peds; dry loose, moist very friable; few fine inped roots; few fine pores in undisturbed peds; clear smooth boundary.
BC 15-26,5 (Stoney) gravelly sandy clay loam with common medium to coarse iron concretions; dry hard, moist friable; few fine exped roots; abrupt smooth boundary.
R 26,5 + Parent Rock.
Drainage and Permeability: Moderately rapid with moderate permeability. Placement - Fine loamy hyperthermic family of Ustochrept.
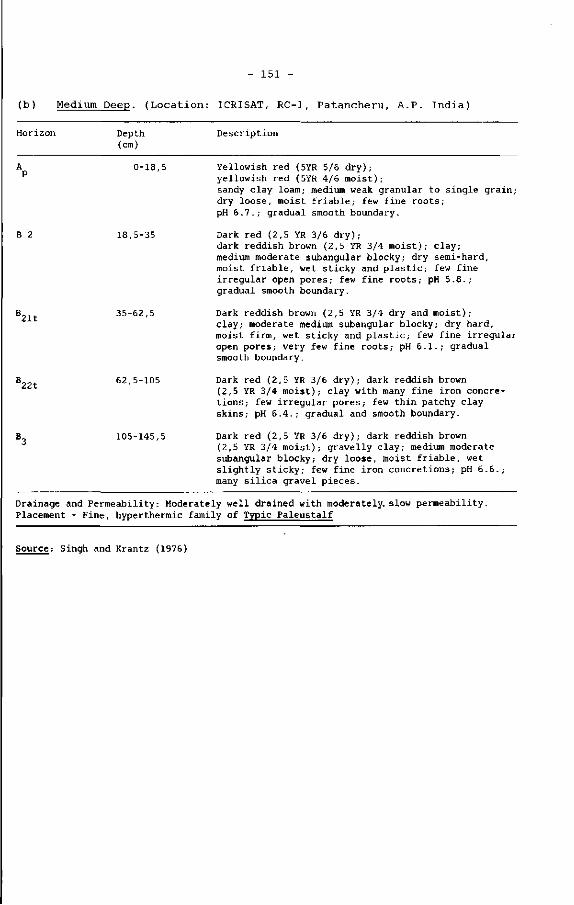
151
( b ) Medium Deep . ( L o c a t i o n : ICRISAT, RC-1 , P a t a n c h e r u , A . P . I n d i a )
Horizon Depth (cm)
Descript ion
B 2
21t
0-18,5
18,5-35
35-62,5
Yellowish red (5YR 5/6 dry); yellowish red (5YR 4/6 moist); sandy clay loam; medium weak granular to single grain ; dry loose, moist friable; few fine roots ; pH 6.7.; gradual smooth boundary.
Dark red (2,5 YR 3/6 dry); dark reddish brown (2,5 YR 3/4 moist); clay; medium moderate subangular blocky; dry semi-hard, moist friable, wet sticky and plastic; few fine irregular open pores; few fine roots; pH 5.8.; gradual smooth boundary.
Dark reddish brown (2,5 YR 3/4 dry and moist); clay; moderate medium subangular blocky; dry hard, moist firm, wet sticky and plastic; few fine irregular open pores; very few fine roots; pH 6.1.,- gradual smooth boundary.
22t 62,5-105
105-145,5
Dark red (2,5 YR 3/6 dry); dark reddish brown (2,5 YR 3/4 moist); clay with many fine iron concretions; few irregular pores; few thin patchy clay skins; pH 6.4.; gradual and smooth boundary.
Dark red (2,5 YR 3/6 dry); dark reddish brown (2,5 YR 3/4 moist); gravelly clay; medium moderate subangular blocky; dry loose, moist friable, wet slightly sticky,- few fine iron concretions; pH 6.6.,-many silica gravel pieces.
Drainage and Permeability: Moderately well drained with moderately, slow permeability. Placement - Fine, hyperthermic family of Typic Paleustalf
Source: Singh and Krantz (1976)

- 152 -
APPENDIX 2
Calculation Procedure of Profile Water Lines
To arrive at the profile water lines as depicted in figures 4.1. through to
4.3., section 4.5., a calculation procedure was used, based on actual
precipitation and measured runoff values, supplemented with assumed values
for evaporation and transpiration. A computer programme was developed to
calculate daily values of the storage component, STOR(I), which were after
wards substituted in 3-day moving averages, as shown in the figures.
For the calculation, a period of 120 days, starting June 1st, was divided
into five intervals, related to date of sowing (NZ) (table A.I.). To each
period a value for potential evaporation (E ) and potential transpiration
(T ) was assigned. Actual evaporation (E ) was assumed to be about half the
potential rate in the situation of consecutive wet days, as such a period
is characterised by a higher level of cloudiness, lower temperature and
higher air humidity. Otherwise, the actual daily evaporation rate was
calculated according to the formula:
Ea = Eo/N (mm/day) (A.l.)
with N the number of days since last rainfall (section 5.3.2.). Cumulative
evaporation for consecutive dry days, however, was not allowed to exceed
the amount of precipitation of the previous storm.
Transpiration was assumed to be at the potential level (T = T ) as long as
sufficient profile storage was available. Available moisture in deeper
profiles will generally be distributed over more depth than in more shallow
profiles. Consequently, the profile moisture content at which the availabil
ity of water starts to be restrictive for optimal crop transpiration will
be higher for deeper profiles. Dependent on this profile storage capacity,
a threshold value for freely available water was fixed at the value:
0.25 PS + 20 (mm), with PS as the assumed profile storage (mm), available
for transpiration. When, after crop establishment, the actual profile
storage came below this value, actual transpiration was assumed to stay
behind the potential rate, according:
T = f x T , (A.2.)
STOR (I) with f = (A.3.)
0.25 x PS + 20
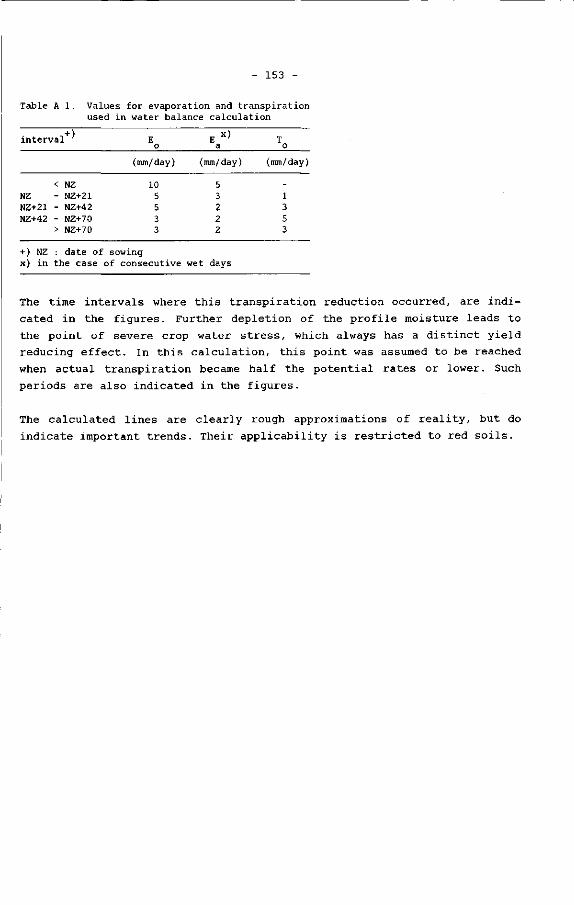
153 -
Table A.l. Values for evaporation and transpiration used in water balance calculation
+ ) xü interval ' E E ' T
o a o
(mm/day) (ram/day) (mm/day)
< NZ NZ - NZ+21 NZ+21 - NZ+42 NZ+42 - NZ+70
> NZ+70
10 5 5 3 3
5 3 2 2 2
-1 3 5 3
+) NZ : date of sowing x) in the case of consecutive wet days
The time intervals where this transpiration reduction occurred, are indi
cated in the figures. Further depletion of the profile moisture leads to
the point of severe crop water stress, which always has a distinct yield
reducing effect. In this calculation, this point was assumed to be reached
when actual transpiration became half the potential rates or lower. Such
periods are also indicated in the figures.
The calculated lines are clearly rough approximations of reality, but do
indicate important trends. Their applicability is restricted to red soils.

- 154
APPENDIX
F r e q u e n c y
(Hyd
Heek from
Apri l
May
June
July
Aug.
Sept.
Oct.
Nov.
3
of O c c u r r e n c e
s r a b a d , I n d i a
2 9
16 23 30
7 14 21 28
4 11 18 25
2 9
16 23 30
6 13 20 27
3 10 17 24
1 8
15 22 29
5 12 19
5-10
5 8
12 12 9 9 9
16 18 21 28 31 43 40 47 51 44 54 37 43 32 37 46 37 51 35 27 16 14 17
9 11 4 7
: 1901
10-15
4 3 6 4 5 0 4
10 8 8
12 20 19 20 24 27 39 26 20 21 28 26 18 24 22 15
6 19 11
7 10 13
6 1
o f D i f f e r e n t
- 1970)
15-20
2 4 0 1 2 2 1
10 4
10 9
11 17 16 13 20 17 22 14 18
8 13 14 15 12 18
9 9 9 3 4 3 2 1
Storm
20-30
4 4 3 3 2 3 3 6 5 5 8
20 19 20 13 21 20 20 11 15 23 19 18 16 17 12 8 5 8
10 7 6 0 2
Sto rm S i z e s
s ize i n t e r va l
i n Weekly
s (mm)
30-40 40-50
1 2 2 2 1 0 3 1 2 4 3 4
10 6 8
13 13 7 5 7 6 7
10 11 11 12 4 5 5 3 2 1 1 0
0 1 0 1 0 0 0 2 0 4 2 6 8 4 6 7 8 3 4 4 2 7 9 4 9 6 1 4 1 1 1 0 0 1
P e r i o d s
50-60 60-80
0 0 0 0 1 0 0 1 0 2 1 4 3 3 0 2 5 5 2 2 2 3 3 5 6 2 0 1 4 0 0 0 1 0
0 0 1 0 0 0 1 0 0 1 2 0 1 1 2 3 2 0 1 1 6 1 2 8 2 2 3 1 2 3 2 0 1 2
> 80
0 0 0 0 0 0 0 0 0 0 1 2 1 1 2 0 0 1 1 0 2 2 3 1 2 5 2 0 0 1 2 0 0 0

155
APPENDIX 4 Infiltration Measurements Using 15 cm Single Rings
Values shown were obtained after correction for lateral flow (see text,
section 5.3.1. Equation. 5.7.)
(a) Bedded Field (RW-3F, plot 7)
Time elapsed (min.)
2.5 7.5
15 25 45 90
150 210 270
(1)
39.2 11.7
6.8 4.3 2.8 1.7 1.2 0.9 0.8
Cultiva
(2)
42.3 15.8 9.3 6.5 4.2 2.6 1.8 1.4 1.2
Corrected Infiltrat
ted zone
(3)
34.8 11.3
7.0 4.8 2.8 1.6 1.1 0.9 0.8
(4)
44.4 18.0 10.8 7.7 4.6 2.8 1.9 1.4 1.2
ion Rates
(1)
--
4.1 2.8 1.8 1.0 0.7 0.5 0.4
(cm/h)
Traffic
(2)
-9.4 5.3 3.7 2.4 1.4 1.0 0.8 0.6
zone
(3)
-10.1 6.3 4.3 2.7 1.5 1.1 0.9 0.7
(4)
--
4.8 3.2 2.0 1.1 0.8 0.6 0.5
(b) Flat Cultivated Field (RW-3F, plot 5)
Time elapsed (min.)
2.5 7.5
15 25 45 90
150 210 270
(5)
47.8 15.2
9.2 6.3 3.9 2.3 1.6 1.3 1.1
Corre cted Infiltration Rates
Cultivated zone
(6)
41.4 17.2 10.4 7.2 4.9 3.0 2.1 1.6 1.3
(7)
42.5 15.4
9.6 6.5 3.9 2.4 1.6 1.2 1.0
(8)
36.3 15.8 10.0 7.2 4.8 3.1 2.2 1.7 1.5
(9)
44.0 17.2 11.6 8.1 5.3 3.3 2.3 1.8 1.5
(cm/h)
(5)
--
4.7 3.2 2.0 1.1 0.8 0.6 0.5
Traffic zone
(6)
-10.8
6.5 4.1 2.7 1.6 1.1 0.9 0.8
(7)
-11.7
6.7 4.4 2.8 1.6 1.1 0.8 0.7
(8)
-10.4
6.1 4.0 2.5 1.6 1.1 0.9 0.8
(9)
-10.1 6.7 4.3 3.0 2.0 1.4 1.1 1.0
(c) The measured infiltration rates can be described well by the formula
proposed by Kostiakov (1932):
I = A . t cum B (A.4.)
with:
I = cumulated infiltration at time t (mm);
t = infiltration time (min.);
A = cumulative infiltration at t = 1;
B = dimensionless exponent.

- 156 -
The infiltration measurements shown in figure 5.7. of section 5.3.1.
can consequently be described as :
0 52
^um = 7"9 x fc " „ <r = °-"> :cum = 20"6 x ^Z <r = °-") 'cun, = 2 0"3 x fc <r = °-99)
(A.4.(a))
(A.4.(b))
(A.4.(c))
The infiltration curves also obey the equation proposed by Philip
(1957):
I = S . t2 + A . t cum (A.5.)
with:
I = cumulative infiltration at time t (cm); cum S = sorptivity (cm. sec" ) ,-
t
A
time (sec);
constant.
and can be described as :
cum I cum
I
=
=
=
0.1244
0.2049
0.1936
t 2 - 0 1,
t 2 - 0
t*2 - 0
00014
0007 .
0008 .
t
t
(r = 0.97)
(r = 0.98)
(r = 0.96)
(A.5.(a))
(A.5.(b))
(A.5.(c))

- 157 -
APPENDIX 5
The Measurement of Surface Roughness
The value for the random roughness is based on height measurements of a
large number of points in a grid. For this purpose a micro-relief meter is
used. In its simplest form it consists of a support frame in a fixed posi
tion and a line of measuring pins. The latter can move horizontally over
the support frame. At each setting one line of heights can be measured with
the pins resting on the soil surface and the top of the pins indicating the
heights. After a line of measurements, the pins are lifted and shifted to a
next position.
Many relief-meters cover an area of 1 m2, build-up of 20 lines or posi
tions, each line measuring 20 points of elevation. In this way 400 measure
ments are done in the usual 5 x 5 cm grid (Burwell et.al. , 1963; Allmaras
et.al., 1966, Moore and Larson, 1979). Monteith (1974) used a grid of
2,5 cm. Mitchell and Jones (1976) also recommend this denser grid on the
basis of their analysis of models to quantify the depression storage
through micro-relief measurements.
Different calculation methods are used to convert the point measurements
into a roughness index. Kuipers (1957) defined the random roughness index
(RRI) as
RRI = 100 log s (A.6.)
with s = standard deviation of the measured heights in cm.
Burwell et.al. (1963) assumed a log normal distribution of the heights and
defined the random roughness index as the standard deviation of their
logarithms. Differences between the computation methods, however, prove to
be small (Dexter, 1977; Linder, 1979). Preference goes to the simple tech
nique of defining the random roughness as the standard deviation of the
measured heights, without log transformation.
To remove the oriented roughness, the standard deviation of the height
measurements of individual lines, in the direction of tillage, is calcu
lated, after correction for the general slope (Allmaras et.al., 1966). The
mean standard deviation of all lines is then defined as the random rough
ness .

- 158 -
APPENDIX 6
The Calculation of Surface Storage
Mitchell and Jones (1976) investigated five methods of computing storage
from point measurement data. They compared these computation methods with
water displacement measurements of artificial surfaces and concluded that
most methods give an adequate outcome. The simplest computation method,
therefore, is recommended and used by them in further experiments. This
method, for a surface in level condition and for point-measurements in a
1-inch grid, may be represented by:
m n I I
i=l j=l s r = -l .1 ( H r " H a ) (A-7- )
with:
S = accumulated surface storage below a reference height (inches 3 ) .
i,j = rows and columns of point measurements.
H = reference height (inches).
H = point measurements of height on soil surface (inches).
and: H r > H .
Subsequently, out of 15 depth-storage models considered and compared on the
basis of accuracy and practicality of use, they selected the relation:
S = a . D b ( A. 8. )
with:
S = storage (inches).
D = depth above the lowest point on the surface (inches).
a,b = equation parameters.
The parameters are described in a number of prediction equations, related
to relief and soil characteristics on the basis of laboratory- and field-
studies .
Moore et.al. (1980) modelled surface storage and runoff from small experi
mental plots based on the direction of flow from individual grid-points and
storage in individual depressions. They followed the sequence of events as
identified by Linsley et.al. (see section 5.4.) and the flow approach as
used by Seginer (1971). Comparing measurements before and after a simulated
rain revealed a 40 to 45% decrease in surface storage caused by the rain.
Ploughing increased the maximum storage from 3.2 mm to 11.2 mm on average.

- 159 -
They also found maximum micro-relief storage after rainfall (S ) and that
before rainfall (S ) to be related, according:
S = -0.523 + 0.627 S (A.9.) mp m
This equation explained 77 percent of the variance and is significant at
the 1 percent level.

- 160 -
APPENDIX 7
The Animal-Drawn Wheeled Tool Carrier
An improved system of farming often requires more timely, more precise and
sometimes new types of field operations compared to traditional systems.
Often this can not be accomplished with the traditional implements. Parti
cularly in a field lay-out with a bed-and-furrow configuration (chapter 6)
the use of a "wheeled tool carrier" is inevitable for proper cultivation.
"A wheeled tool carrier consists of a frame mounted on two wheels with a
beam or drawpole to which a bullock yoke is fastened. The basic frame has a
toolbar onto which a variety of implements can be attached with simple
clamps. The working depth can be adjusted to meet operational requirements.
A mechanical lifting mechanism is provided to raise the implement into a
transport position and lower it into the working position" (ICRISAT,
1981).
At ICRISAT's research station the animal-drawn tool carriers have been
succesfully used for conducting all operations of tillage, planting and
interrow cultivation on up to 60 ha Vertisols and 30 ha of Alfisols for the
last ten years or so, as well as for land smoothing and drainage-way con
struction (Kampen, 1980) (Figure A. 1. ) .
The characteristics of the use of such equipment, on Alfisols, along with a
permanent bed-and-furrow system, are related to a much faster ploughing
operation, that can be restricted to the cropped zone; a deeper ploughing
through an easier running of the equipment; an accurate placement of seed
in both vertical and horizontal direction, several rows at a time; an
Figure A.l. A bullock-drawn wheeled tool carrier, making 1,50 m wide beds

- 161 -
accurate and fast inter-row weed control and secondary cultivation. Such
characteristics could be beneficial or even a prerequisite in systems of
farming that include the use of improved varieties and fertilization.
The major drawback for small farmers is the high cost of the equipment.
Even a simple wheeled tool carrier, along with basis implements would cost
as much as Rs 7000/- (Bansal and Thierstein, 1982). Supposingly, such a set
would be capable to cultivate an area of 14 ha per year, and to provide
transport in addition to field operations. Bansal and Thierstein derive the
cost with such combined use at Rs 150/- per hectare per year.
It is much more difficult to indicate the economic benefits of the use of
such improved equipment. But introduction of it would never be economical
if it did not go along with the use of other new inputs, that distinctly
increase the production levels. Moreover, ultimate costs will depend on the
intensity of use, a factor that is also determined by the way a co-opera
tive use by a group of farmers can be organised.
+) Rs 10/- = 1 US$

1 6 2
APPENDIX 8
O b s e r v a t i o n s o n t h e E f f e c t s o f Two M e t h o d s f o r P r i m a r y T i l l a g e
To e n a b l e t h e s e o b s e r v a t i o n s , t w o a d j a c e n t p l o t s o f 6 x 8 0 m e t e r s , l o c a t e d
i n t h e a r e a m a r k e d RW-3C, w e r e t i l l e d a c c o r d i n g t o a z o n a l a n d i n t e n s i v e
s y s t e m r e s p e c t i v e l y ( s y s t e m s 1 a n d 2 , s e e text, section 6.1.1.1.). A l l b e d s
h a d b e e n c r o p p e d f o r t w o p r e v i o u s y e a r s a n d h a d t h e s a m e m a n a g e m e n t h i s
t o r y . A p a r t f r o m t h e s y s t e m o f p r i m a r y t i l l a g e , a l l o t h e r f a c t o r s w e r e k e p t
t h e s a m e f o r b o t h p l o t s . R u n o f f w a s m e a s u r e d w i t h a " I 5 . 9 O 0 " V - n o t c h w e i r
( B o s , 1 9 7 6 ) w i t h a u t o m a t i c w a t e r l e v e l r e c o r d e r , a n d a r a i n g a u g e w a s p l a c e d
w i t h i n t h e e x p e r i m e n t a l a r e a .
T a b l e A . 3 . g i v e s o b s e r v a t i o n s o n t h e r a i n f a l l a n d r u n o f f f o r t h e t w o t r e a t
m e n t s , i n d i c a t i n g a d i s t i n c t r e d u c t i o n i n r u n o f f a f t e r i n t e n s i v e t i l l a g e .
T a b l e A . 4 . g i v e s s o m e c o m p a r a t i v e d a t a o n b u l k d e n s i t y , p l a n t h e i g h t a n d
g r a i n y i e l d , w h i c h f i g u r e s a r e a l l i n f a v o u r o f t h e i n t e n s i v e t i l l a g e -
s y s t e m .
Tab l e A . 3 . E f f e c t of i n t e n s i t y of p r i m a r y t i l l a g e on i n f i l t r a t i o n and r u no f f
Date R a i n f a l l Runoff
System 1 System 2
(mm) (mm) (mm)
30 -07 -80 14 -08 -80 19 -08-80 20 -08 -80 03 -09 -80 06 -09 -80 24 -09 -80
2 3 . 6 1 6 . 4
1 14 . 8 7 2 . 6 2 2 . 5 3 1 . 1 14 .7
1.2 3 . 1
2 7 . 4 2 1 . 8 1.5 5 . 2 0 . 3
1 .1 2 . 2
2 2 . 1 1 7 . 2 1.4 4 . 4 0 . 3
T o t a l 295.7 60.5 48.7
+) For explanation see t e x t , s ec t ion 6 . 1 . 1 . 1 .
Table A.4. Summary of observations on bulk dens i ty , p l an t height and grain y i e ld for two d i f f e ren t ly t i l l e d s o i l s
dry bulk densi ty p l an t height grain y i e ld
(g.cm ) (cm) (kg.ha )
date System 1 System 2
19-09-80 1.55 1.48
27-08-80 133.5 142.2
14-10-80 1500 1840
S.E. C.V. (%)
± 0.019 4
± 0.018 5
± 79 17

- 163 -
APPENDIX 9
Influence of Surface Configuration on Runoff and Soil Loss. Small plot
Experiments
During the 1980 rainy season runoff and soil-loss were measured from
10 x 4.5 meters plots. 20 Of such plots were located in the RW-3F -area at
ICRISAT-station. The surface slope in longitudinal direction was 0.4% and
for each plot total runoff per storm could be measured by partial collec
tion of the water in buried drums. First, the runoff water passed through a
silt-trap, provided with five outlet tubes, one of which was connected to a
drum with a free storage of about 180 liters. The outflow of the tubes was
calibrated at different discharges. This set-up allowed the measurement of
runoff quantities up to 20 mm per event, after which the drum had to be
emptied again.
The experiment was designed to compare runoff and soil loss from plots with
a different surface configuration. Two configurations were compared: flat,
and beds with narrow furrows, further indicated as treatments A and B
respectively. The plots were planted with a sorghum-pigeonpea intercrop.
Data from some of the plots are not reported as their outcomes were influ
enced by insufficient capacity of the main drainage way at high discharges,
or incidentally by breaches of bunds. Still, the data show a high vari
ability, connected to the inhomogenity of the experimental area and of the
red soils in general (table A.5.).
Table A.5. Runoff and soil-loss for small plots with different surface configuration (see text) for five rainstorms (1980, RW-3F)
Date
Flat
(a;
30-7
6.2 5.3
> Runoff (mm)
6-8 13-8 14-8
6.6 1.8 3.8 5.3 1.3 2.6
20-8
10.0 10.7
3C
0. 0.
1-7
35 13
(b)
6-
0 0
Soil loss
•8
.39
.14
13-8
0.06 0.04
(t/ha
14-8
0.23 0.06
)
2C
0. 0.
1-8
73 37
Beds
Ratio
6.5 6.8 4.5 7.4 5.3
0.94
8.4 7.3 5.6
10.0 7.8
0.76
1.7 2.0 1.0 1.7 1.4
0.99
4.0 5.3 2.4 4.2 3.6
0.82
5.0 7.5 5.9 6.5 6.0
1.67
0.58 0.52 0.37 0.29 0.31
0.58
0.59 0.56 0.33 0.28 0.42
0.61
0.20 0.17 0.08 0.06 0.04
0.45
0.31 0.26 0.20 0.17 0.11
0.69
0.60 0.44 0.54 0.20 0.40
1.26
(c) Rainfall characteristics
date 30-7
rainfall (mm) 23 W.M.I, (mm/h) 24
6-8
22 24
13-8
13 21
14-8
13 30
20-8
56 25

- 164 -
Under otherwise similar conditions, the effect of surface configuration on
the occurrence of runoff and soil loss is related to the amount and inten
sity of a rainstorm. How the treatments compare, shows clearly through the
calculation of multiple linear regressions with rainfall amount and inten
sity as independent variables, and as dependent variables the ratio's of
runoff and soil loss of the two treatments respectively (figure A. 2. ) .
Obviously, runoff from flat plots as related to bedded plots, increases
with increasing storm size and decreases with higher intensities within the
range of observed storms (section 6.2.2. ) . In respect to measured soil
loss, however, the ratio between the two treatments becomes higher both
with bigger storms as well as with higher intensities (section 7.4.).
1.5-
1.0-
0.5-
Runoff A Runoff B
©
1.5
0.5-
Soil loss B
20 40 60 20 Precipitation (mm)
40 60
Figure A.2. Regression lines relating the ratio's of runoff (figure a) and soil loss (figure b) from a flat (A) and bedded (B) surface configuration, to rainfall characteristics (P = Precipitation (mm), W.M.I. = Weighed Mean Intensity (mm/h)). (a) A/B = 0.82 + 0.02 P - 0.01 W.M.I. (R = 0.92). (b) A/B = -0.38 + 0.02 P + 0.03 W.M.I. (R = 0.98).

- 165 -
APPENDIX 10
The Effects of Secondary Tillage on Runoff and Surface Roughness
The influences of tillage on infiltration and surface flow are complex and
difficult to separate: A cultivation simultaneously breaks a crust, creates
storage volume in the topsoil, induces surface micro-depression storage and
increases resistance to surface flow. These effects may be partially or
considerably removed as soon as the next storm occurs, depending on its
size and intensity.
What can be measured is (1) the overall effect of a tillage operation on
runoff and (2) the loss of surface roughness caused by rainfall and runoff.
In this specific experiment runoff from natural rainfall was measured from
two adjacent plots during much of the rainy season. The area on which the
plots were located had been under identical cultivation for four preceding
years and had been laid out in a bed-and-furrow configuration during that
period. Each of the two plots consisted of 20 beds of 1.50 m width and had
a length of 60 meters. Measured slope in furrow direction was 0.8% .
To observe the influences of tillage and structure destruction by rainfall
at its clearest the plots were left fallow. Both plots received the same
intensive primary tillage described as system 2 in section 6.1.1.1. Follow
ing each of the first two runoff producing rainfall events after field
lay-out, a shallow cultivation was executed. This enabled a check to be
made to see whether the two plots were comparable in their rainfall-runoff
characteristics. From the third runoff producing storm onwards an in
creasing difference in cultivation was created by leaving an increasing
number of randomly chosen beds uncultivated in one of the plots (plot B),
whereas the other plot (plot A) was completely cultivated after each rain.
This implies, that of plot B area-wise only 80, 60, 40 and 20% was culti
vated after storms 3 through to 6 respectively, and completely left uncul
tivated thereafter (table A. 6. ) .
Table A.6. gives relevant figures on observed rainfall and runoff. The last
column, giving runoff values for a not-cultivated situation, are derived
from the measured values of plots A and B. For this calculation it was as
sumed that tillage improved infiltration for the subsequent storm only and
had no effect on later events.
+ ) The area had been originally laid out at this relatively steep slope for experimental reasons. Redirecting the fields towards the advisable slope of 0.4% would have disturbed the area to an unacceptable level.

- 166 -
Table A.6.
Storm Number
1 2 3 4 5 6 7 8 9
Runoff
Date
8-7 26-7 29-7 2-9 7-9
14-9 21-9 22-9 28-9
as related
P+>
(mm)
26.7 41.4 49.8 25.0 33.5 53.7 21.8 12.4 29.1
to superfi
W.M.I
(mm
41 32 53 28 30 59 18 8
72
_ + )
/h)
:ial cultivation (ICRISAT
Fraction cultivated plot B
-
f
1 1 0.8 0.6 0.4 0.2 0 0 0
cultivated
(mm)
A
(2.4) (4.0) 16.7 2.8 4.8
23.9 0.4 0.2 7.4
RW-3C,
Runoff
partly cultiva
(mm)
B
(2.6) (3.9) 17.7 5.6 7.4
30.4 2.6 2.2 9.6
1982)
ted not . cultivated
(mm)
Bl
--21.7 9.8 9.1
32.0 2.6 2.2 9.6
+) P = Precipitation W.M.I. = Weighed Mean Intensity
B - f x A x) Calculated as
1 - f
Multiple regression analysis, relating measured cq. calculated runoff per
storm from the cultivated and not-cultivated field respectively as depen
dent variables, and storm size and its intensity as independent variables,
gave :
YA = YA = YB = YB =
-10.38 + 0.57 Xx
-10.48 + 0.53 X± + 0.039 X2
-9.55 + 0.68 Xj
-9.59 + 0.68 X + 0.002 X,
r = 0.95
R = 0.95
r = 0.95
R = 0.95
(A.10.(a))
(A.10.(b))
(A.ll.(a))
(A.ll.(b))
With:
YA =
X2 =
Runoff from cultivated area (mm);
Runoff from not-cultivated area (mm);
Precipitation (mm);
Weighed Mean Intensity (mm/hr).
Actual runoff for the two treatments increases with increasing storm size
(Equations A.10.(a), A.ll.(a)). Inclusion of the storm intensity as inde
pendent variable (X_) did not improve the regression (Equations A.10.(a),
A.10.(b)). From the equations and within the range of storms observed, it
is clear that the rainfall intensity has an insignificant weight in deter
mining the runoff from an individual field. However, this is different if
we look at runoff differences between treatments. A stormwise comparison of

- 167 -
the observed runoff reduction, expressed as:
Y A (A.12)
Z = 1 - — Y B
with rainfall parameters X. and X_ resulted in the regression line:
Z = 1.09 - 0.007 X - 0.009 X 2 (R = 0.97), (A.13.)
that now shows a similar weight for both rainfall amount as well as inten
sity. It is also seen that the fraction runoff reduction through culti
vation could be very high for small storms.
More insight into the runoff reduction seems to be achieved by calculating
the runoff reduction from the equations A.10.(b) and A.ll.(b) for different
intensities. The resulting lines (see text figure 6.2. ) both show the
increase of runoff percentage with increasing storm-size as well as with
increasing intensity. Figure 6.2. also indicates that at high rainfall the
intensity does not play an important role.
Figure A.3.(a) gives values of the Random Roughness Index (R.R.I) in mm,
for each date of observation before and just after cultivation. Total
rainfall since the earlier cultivation is indicated in figure A.3.(b). The
slightly higher values for R.R.I, at the early dates indicate the presence
of larger clods remaining from the primary tillage operation. This part of
the roughness does not contribute to the level of depression storage.
Clearly, lowest values of the R.R.I, are reached following the higher rain
fall events (like those on July 30, September 14 and 28). R.R.I, as mea
sured at the end of the season did not differ much between plots with dif
ferent frequency of cultivation (table A. 7.). Obviously, an increased num
ber of cultivations does not significantly decrease the aggregate stabil
ity.
Figure A.3.(c) is illustrative of the decrease of roughness after cultiva
tion by the effect of a single storm: after the first storm an equilibrium
is reached which is not affected by following rainfall.
Table A.7. Surface roughness of a fallowed Alfisol by the end of the rainy season
Number of earlier cultivations 3 4 5 6 R.R.I., 28-09-1982 (mm) 2.9 2.1 2.5 2.7

- 168 -
i 5
3 -
\ \ \
\ \
\ l \ \
\ \ \
®
^ sJ \
"1 1 1 1 1 ~1 1 1 1
E 75-
= 50-D
.1 25-o n n n
( ©
E E 6
5-
4-
3-
— r~ <n .— ïr. _i OJ
— OJ
Figure A.3. Change of random roughness index in time for a fallow Alfisol with (figure a) and without (figure c) repeated cultivation. Figure (b) indicates intermediate rainfall.

169
APPENDIX 11
Effects of Surface Configuration on Soil Moisture and Plant Establishment
An experiment was laid out to compare two surface configurations, flat and
broadbeds. Individual plots had a size of 4.5 by 26 meters with four repli
cations. A pearl millet crop was planted on August 2nd. During the subse
quent two months gravimetric moisture sampling was done up to a depth of
30 cm and at 5 cm vertical intervals on a total of 13 dates (.table A. 8. ) .
Measurements on layerwise root density at 10 cm intervals, on leaf area and
its dry matter weight were done on three occasions (see text,
section 6.1.3., table 6.2. and figure 6.7.).
The soil had a rather dense packing, with bulk density values of about
1.5 - 1.7 in the top 5 cm and 1.8, incidentally 1.9, below. Corresponding
ly, the pore fraction of the different layers can be calculated as being of
the order of 40% for the top 5 cm and about 30% below that. Field capacity
must be less than this value and from the figures in table A.8. it is clear
that on most dates the profiles are at field capacity and even approximate
the point of saturation. Reduction of plant growth due to insufficient
aeration is to be expected in such situations. It apparently occurred most
heavily on the flat cultivated plots (see text section 6.1.3.).
Table A.8. Volumetric water content (%) for different layers at different dates for two land management treatments (RA-10, 1978)
depth
(cm)
Flat 0-5 5-10
10-15 15-20 20-25 25-30
Beds 0-5 5-10
10-15 15-20 20-25 25-30
+) Given
Augus
2
21 28 27 26 28 28
22 29 26 27 29 28
value
t
5
24 30 25 25 23 24
24 28 25 27 27 27
s are
9
24 30 27 26 27 24
22 31 29 25 26 24
mean
12
21 27 25 25 27 27
18 28 27 25 25 23
values
31
26 30 26 29 30 29
31 32 27 27 28 26
of four
September
6
29 30 31 29 27 29
25 30 28 27 30 30
9
21 25 21 23 25 26
27 30 25 23 25 25
replications
12
23 22 22 22 24 24
23 22 21 22 24 26
with
16
26 28 26 22 23 25
26 29 30 29 28 25
three
19
31 31 28 26 28 26
31 32 32 29 26 26
23
33 30 27 26 27 25
32 32 27 27 30 31
sub-samples
27
32 35 31 26 27 25
34 36 32 29 29 23
each
30
22 28 24 25 27 26
22 25 25 25 28 25

- 170 -
The frequent rainfall during the month of September kept the soil almost
saturated. Under these circumstances no differences between the treatments
could be established. Therefore also, the difference in water use from the
flat and bedded treatments, as would be expected from the difference in
crop development, could also not be traced.

- 171 -
APPENDIX 12
Observations on the Effects of Depression Storage on Runoff. Sprinkled Plots
For this experiment small runoff plots were used of 2 x 1.5 meter. They
were bordered by metal sheets, driven into the soil to a depth of about
10 cm and with an outlet at the lower side. The plots were located in a 2%
sloping area while their longitudinal direction coincided with a 0.4%
slope. Artificial rain could be applied by a set of 13 sprinklers, tested
to apply a constant rainfall intensity of 18 mm/h with a co-efficient of
uniformity (Christiansen) of more than 90%. Runoff from individual plots
was measured through collection of the water in buried buckets, that were
emptied when full or weighed when partly full. The lay-out of the 16 plots,
with 4 treatments, was made with a randomised block design.
The experiment could only be run on three dates, with different initial
moisture condition of the soil. Apart from this difference in antecedent
moisture the variability in soil characteristics of the area and possibly
errors connected to lay-out of the experiment also influenced the measure
ments. The data, therefore, also show a high variation within the treat
ments and observed differences were not significant. However, the trend
that differences in depression storage influence runoff at lower rainfall
only, is clearly evident, as it was hoped to show (see text,
section 5. 2.1.).
In general, the high variability of soil characteristics within a field
might be accounted for as an important constraint in experiments to measure
individual components of the water movement. Small plots cannot be consid
ered as representative for a larger area. With larger sized plots both the
application of artificial rainfall and the accuracy of measurements present
difficulties. (Sibie, 1971; Sharp and Holtan, 1940).

- 172 -
APPENDIX 13
Hydraulic Measurements on Differently Shaped Furrows
A known and constant discharge of water was released at the top of two
narrow and two wide furrows of 50 meters in length. Outflow at the lower
end was monitored. In each furrow two or three different discharges were
applied. The inflow was regulated using calibrated siphons taking the water
from a barrel in which the water level was kept at a near constant level.
Inflow was continued until a constant outflow was measured. The cross-sec
tions of the furrows at 10, 20, 30 and 40 meters from the top were measured
with a relief meter with pins at 2.5 cm interval; the height of flowing
water was monitored with a point-gauge. Table A.9. lists the inflow rates
that were being used and the observed outflow.
On the basis of detailed surveys of the longitudinal section of the fur
rows, the relative heights of the points of measurement were also known.
Together with the measurements on depth of the flowing water, the hydraulic
slope at two points in each furrow was estimated. An estimate of the local
discharge was based on the difference between in- and outflow and on the
assumption that infiltration was related to the differences in wet peri
meter. Values were used in the Manning flow equation, which yielded the
values K for different discharges and different cross-sections
(table A. 10. ) .
From the same and similar furrows runoff was measured during natural rain
fall. Outflow from single furrows was measured with the help of a cali
brated slotted device and buried 200 liter drum. The capacity of this
measurement structure did not exceed 10 mm per storm. Details on rainfall
and runoff are given in table A.11.
Table A.9. Equilibrium inflow and outflow rates of differently shaped furrows (RW-1C, 1979)
Plot Furrow Inflow (1/s) Outflow (1/s) number shape
(1) (2) (3) (1) (2) (3)
Outflow
(1)
55 45
28 28
(2)
63 50
40 46
(%)
(3)
85 -
65 58
11 B 17 B
10 C 13 C
narrow narrow
wide wide
0.33 0.30
0.33 0.33
0.63 0.58
0.58 0.58
0.88
0.88 0.88
0.18 0.40 0.75 0.14 0.29
0.09 0.23 0.58 0.09 0.27 0.52

- 173 -
Table A.10. Calculated values for hydraulic roughness of two types of furrows in an Alfisol ("K-Manning"), for different inflow rates
Plot number
Distance from top
(m)
Narrow furrows 17 20
30 11 20
30
Wide furrows 13 20
30 10 20
30
Inflow rate at top (1/s)
0.33 0.58 0.88
Hydraulic roughness (K-Manning)
(m ' s )
11.1 9 . 8
14.9 10.8
5 .4 5 .3 3 . 3
18.6 13.1 14.3 14.3
7 . 4 8 .6 5 . 1
--
15.5 16.9
7 . 2 9 . 6 7 . 5
Comparing the mean runoff from narrow and wide furrows per storm, it is
seen that their ratio stays below unity for low intensive storms (those
with a weighed mean intensity not exceeding 20 mm/h). For more intensive
storms the ratio B/C exceeds unity. This relation has been worked out
further, using multiple linear regression, as:
B/C = 0.72 + 0.004 P + 0.010 WMI (R = 0.92)
(see also text, figure 6.13., section 6.2.3.).
(A.14.)

- 174 -
Table A.11. Runoff from two types of furrows; B: narrow, C: wide. (RW-1C, 1979)
furrow type
B C
plot number
6
8
11
14
17
B (ave C (ave
ratio
5
7
9 10
12 13
15 16
rage) : rage) :
B/C :
Rainfall (mm): W.M.I (mm/h):
28/7
-10
---
7.8 -
9.8 6.1 8.4 -
7.?. 10
9.5 7.7
1.23
36 32
28/8
6.0 1.5 1.8 -
3.9 4.2 4.5 -
3.9 4.8 3.5 4.2 5.8
4.2 3.9
1.08
34 36
11/9
-4.6 4.4 -
7.1 6.7 7.0 5.5 9.1 8.9 6.7 8.1 7.6
7.0 6.8
1.03
22 24
date
14/9
runoff
10 7.9 6.8 -
10 8.4 8.3 5.7 8.6
10 8.7
10 9.1
8.8 8.5
1.04
32 25
25/9
(mm)
2.2 2.3 1.0 1.6 2.8 1.9 1.9 2.2 1.2 2.3 1.9 2.4 1.1
1.8 2.0
0.90
10 18
26/9
3.2 3.1 1.0 2.5 3.8 2.3 1.8 4.3 0.6 2.9 2.0 3.2 0.9
2.2 2.6
0.85
17 8
1/10
2.6 2.5 0.9 2.4 3.1 2.5 1.8 2.5 0.8 2.5 2.2 1.8 0.9
2.0 2.0
1.00
17 20
5/11
5.8 4.8 2.0 4.0 5.3 9.3
10 8.1 3.3 8.5 6.5 8.7
10
7.5 6.1
1.23
30 41

- 175 -
APPENDIX 14
The Water-Balance near a Contour-Bund
In the 1980 monsoon season, stagnating water could be observed during a
total of 10-15 days for different bunds in sub-watershed RW-3B. An auto
matic water level recorder, located near the spillway of one of the bunds
registered the fluctuations of the level of the ponded water. Evaporation
from the standing water was measured with the help of an evaporation pan,
located in the area of submergence near the same bund. Through an accurate
land survey the relation between water level and stored volume behind the
bund was deduced.
For the bund under observation the maximum quantity of water that could be
held, amounted to 17 mm on total field basis. Any excess runoff would
overflow a spillway and leave the area. On the basis of the observations,
table A.12. could be constructed, indicating the quantity of stored water,
expressed as mm over the entire field. Of the total of 84 mm runoff water,
47 mm or 56% was temporary stored within the bunded field. Most of this
water (85-90%) infiltrated, 10-15% evaporated.
The longest period of water stagnation occurred from August 18 till 26.
Details of the water balance during this period are given in figure A.4. On
August 18 field runoff amounted to 27 mm, of which 17 mm was stored behind
Table A.12.
Date
Runoff water kept behind bund 2 (RW-3B) or discharging (1980)
Rain Water stagnating Flow through spillway
(mm) (mm) (mm)
14-6 15-6 21-7 22-7 29-7
5-8 13-8 14-8 18-8
19-8
1-9 2-9 5-9
18-9 24-9
(a) (b) (a) (b)
16.0 8.0 9.5
31.2 20.0 17.0 12.0 12.8 16.0 86.0 11.2 44.0 30.5 14.5 28.0 16.5 15.5
2.0 1.9 0.7 2.6 1.5 2.4 1.0 2.8 1.7
16.4 10.4 3.8 1.1 26.0 0.9 1.9 4.5 0.5 1.5
Total 47.2 + 36.4 = 83.6 % of season's rainfall 6.3 + 4.9 = 11.2

176 -
overflow spillway
!io.J ifnrn
16-
14-
12-ai
a 10-Î
o» 8-c
Ö 6-c O)
S 4-t / l
2-
1 1
\ \
r
i 260 | mm
si max imum re tent ion capac i ty
© 20 22 23 24 25 26
August, 1980
180-
160-
1 140-
£ 120H c 'o «< 100-
| 80-
20 21 August, 1980
infiltration (mm/hl
© 18 19 20 21 22 23 24 25 26
August, 1980
Figure A.4. Water balance near a contour-bund during the period of August 18-26, 1980. (RW-3B, field 2 ) . (a) Stagnating water (mm on total area base), (b) cumulative rainfall (mm), (c) infiltration in ponded area (mm/h)

- 177 -
the bund and 10 nun was removed through the spillway. The runoff caused by
the subsequent rain one day later, however, came almost completely to
field outflow, as only 1 mm of storage capacity had become available at
that time. This indicates the importance of sufficient outlet- and waterway
capacity, even in contour-bunded areas.
The rate of recession of the standing water, mainly through infiltration,
varies strongly during the season. During the period under consideration,
infiltration rate came down to 1 mm/h, while it had been observed to be
about 6 mm/h earlier in the season. In periods of extended flooding, obser
ved infiltration rates are distinctly lower than in periods with minor
ponding. This can also be seen in figure A.4.(c) where infiltration rates
become higher again by the end of the period of ponding. The lower infil
tration may be explained by a restriction of the lateral flow component
underneath the bund. With a lower area ponded, its relative importance
decreases.

- 178 -
APPENDIX 15
The Influence of Contour-Bunds on Crop-Yield
Figures A.5. and A.6. depict observed yield levels across contour-bunded
fields at ICRISAT station for two years. Each point indicates the local
yield at a certain distance from the bund and is based on three or four
yield samples of 12 m2 each per field.
The bunds were constructed in 1978 in a 2.5 ha sub-watershed (RW-3B),
dividing this area into four fields. The vertical interval between the
bunds was 90 cm, height of the bunds 60 cm with a spillway at 30 cm height.
During the first season after construction, characterised by prolonged wet
spells, an overall yield reduction was observed for both sorghum and
pigeonpea (section 6.3.1.). This was partly ascribed to water stagnation,
partly to the loss of productive land under the bunds and borrow-pits. To
try to exclude the latter effect, borrow-pits near three of the bunds were
filled with top soil before the next growing season, leaving the other
bunded field as a control.
Figure A.5. shows the yields in the subsequent season (1979). Although
pearl millet yield was lowest in the remaining borrow-pit area of field 4
(figure A.5.(a)), a higher than average yield could be observed near the
bunds in field 2 (figure A. 5. (i>)). This favourable situation, however,
should also be seen in the context of the rainfall pattern of that specific
year. Hardly any runoff occurred before the harvest of the pearl millet
crop. Only after that date and with a maturing sorghum crop (fields 1 and
3), a wet period occurred with a few days water stagnation. Such short
period of water stagnation, however, does not affect sorghum adversely
(Doggett, 1970). Even so, the higher yield near the bunds could only ba
lance the yield reduction, caused by the loss of land (Figure A.5.(c)).
In contrast to sorghum, pearl millet is more sensible to waterlogging
(Purseglove, 1972). This came out clearly in the 1980 season in which year
a period of water stagnation occurred in August (Appendix 14). Yield of
pearl millet was very much reduced, particularly near the lower bund
(Figure A. 6. ) .

- 179 -
a
; at
— i
-o Of
a.
1.8-
1 5 -
1.2-
09-
0.6-
0.3-
-//-la] field 4, with existing borrow-pit
(c) fields 1 • 3, borrow-pits f i l led
2 5 10 20 30
(dI Cross-section contour-bunded field - Distance in meter
Figure A.5. : Yield of pea r l m i l l e t and sorghum ( t / ha ) across four contour-bunded f i e l d s , second year a f t e r cons t ruc t ion , with borrow-pits f i l l e d in f i e l d 1, 2 and 3 . (RW-3B, 1979).

- 180 -
2.1-
1 1.8
Z IS
V .•= 1.2 5. •C 0.9-o m
o- 0.6
0.3- [l — / / —
Cross-section contour-bunded field - Distance in meter
Figure A.6. : Yield of pea r l m i l l e t ( t / ha ) across contour-bunded f i e l d s 2 and 4 (RW-3B, 1980).

- 181 -
REFERENCES
Agrawal, A.N. (1980) Indian agriculture. Problems, progress and prospects. Vikas Publishing House, Sahibadad, India.
Allmaras, R.R., R.E. Burwell, W.E. Larson and R.F. Holt (1966). Total porosity and random roughness of the interrow zone as influenced by tillage. Conservation Research Report no. 7. Agricultural Research Service USDA, Washington, U.S.A.
Amami, S. El. (1979). Utilization of runoff waters: The "Meskats" and other techniques in Tunisia. African Environments, 3,3/4: 107-120.
Andrews, D.J. and A.H. Kassam (1976). The importance of multiple cropping in increasing world food supplies. In: Multiple cropping. Proc. of a symposium in Knoxville, Tennessee, Aug. 1975, M. Stelly ed., ASA Special Publication No. 27: 1-10.
Anonymous (1962). Maharastra state irrigation commission report. Government of Maharastra, Bombay, India.
Anonymous (1981). Improving the management of India's deep black soils. In: Proc. of the seminar on management of deep black soils for increased production of cereals, pulses and oilseeds, New Delhi, 21 May 1981. International Crops Research Institute for the Semi-Arid Tropics, Patancheru, India.
Arakeri, H.R., G.V. Chalem, P. Satyanarayana and R.L. Donahue (1962). Soil management in ^ India. Asia Publishing House, Bombay, India. <Arnon, I. (1972). Crop production in dry regions. Vol. 1: Background and principles. ' Leonard Hill, London, U.K. Asseldonk, J.S.O. van and H.J.J. Stolwijk (1983). Energievoorziening in ruraal Bangladesh.
Landbouwkundig Tijdschrift 95, 7/8: 21-28. American Society for Testing and Materials. Standard method for particle-size analysis of
soils. ASTM D 422. Bali, J.S. (1980). Soil and water conservation on agricultural lands. Key paper presented
at the National symposium on soil conservation and water management in 1980. Indian Association of Soil and Water Conservationists (March 12-13, 1980). Central Soil and Water Conservation and Training Institute, Dehradun, India.
Bansal, R.K. and G.E. Thierstein (1982). Animal drawn multi-purpose tool carriers. Agric. Mechanization in Asia, Africa and Latin America 13,4: 27-36.
Barry, R.G. and R.J. Chorley (1976). Atmosphere, weather and climate. E.L.B.S. and Methuen, U.K.
Basu, J.K. (1954). The Indian Council of Agricultural Research, Silver Jubilee Souvenir-1920-1954. Dec. 1954. ICAR, New Delhi, India, 61-64.
| Baur, A.J. (1952). Soil and water conservation glossary. J. Soil and Water Cons. 7: 41-52, 1 93-104, 144-156.
Beek, K.J. (1978). Land evaluation for agricultural development. Publication 23, International Institute for Land Reclamation and Improvement (ILRI), Wageningen, the Netherlands.
Binswanger, H.P. (1978). The economics of tractors in South Asia. An analytical review. Agric. Development Council, New York and ICRISAT, Hyderabad, India.
Black, T.A., W.R. Gardner and G.W. Thurtell (1969). The prediction of evaporation, drainage and soil water storage for a bare soil. Soil Sei. Soc. Amer. Proc. 33: 655-660.
Blake, G.J. (1975). The interception process. In: Prediction in catchment hydrology. National Symposium on Hydrology, 25-27 November 1975, T.G. Chapman and F.X. Dunin eds., Australian Academy of Science, Canberra, Australia.
Boers, Th.M. and J. Ben-Asher (1982). A review of rainwater harvesting. Agric. Water Man. 5: 145-158.
Bolt, G.H., A.R.P. Janse and F.F.R. Koenigs (1970). Algemene bodemkunde, deel II: Bodemnatuurkunde. Syllabus kandidaatscollege Landbouwhogeschool, Wageningen, the Netherlands.
Bos, M.G. ed. (1976). Discharge measurement structures. Publication 20, International Institute for Land Reclamation and Improvement (ILRI), Wageningen, the Netherlands.
Bouyoucos, G.J. (1961). Hydrometer method improved for making particle size analyses of soils. Agronomy J.53: 464-465.
Bowden, L. (1979). Development of present dryland farming systems. In: Agriculture in semi-arid environments, Ecological Studies 34, Hall, A.E. et al. eds.. Springer Verlag, Berlin-Heidelberg, Germany: 45-72.

- 182 -
Burton, J.R. (1965). Water storage on the farm. A manual of design, construction and operation for Australian conditions. Vol 1: Project planning. Water Research Foundation of Australia, Bull. no. 9, vol 1.
Burwell, R.E., R.R. Allmaras and M. Amemiya (1963). A field measurement of total porosity and surface microrelief of soils. Soil Sei. Soc. Proc. 27: 697-700.
Burwell, R.E. and W.E. Larson (1969). Infiltration as influenced by tillage induced random roughness and pore space. Soil Sei. Soc. Amer. Proc. 33: 449-452.
Cannell, G.H. and L.V. Weeks (1979). Erosion and its control in semi-arid regions. In: Agriculture in semi-arid environments, Ecological Studies 34, Hall, A.E. et al. eds., Springer Verlag, Berlin-Heidelberg, Germany: 238-256.
Carreker, J.R. (1945). Construction and management of ponds. Agric. Engineering 26: 63-64. Carruthers, I. and C. Clark (1981). The economics of irrigation. Liverpool University
Press, Liverpool, U.K. Carson, M.A. (1971). The mechanics of soil erosion. Monograph 4 in Spatial and
Environmental Systems Analysis, R.J. Chorley and D.W. Harvey eds., Pion Ltd., London, U.K.
I Carter, C E . and J.R. Carreker (1969). Controlling water erosion with graded rows. Trans. I ASAE 12,5: 677-680.
Charreau, C. (1977). Some controversial technical aspects of farming systems in semi-arid West-Africa. In: Proceedings of an international symposium on rainfed agriculture in semi-arid regions, Riverside, California, April 17-22, 1977, Univ. of California, Riverside, California, U.S.A.
Clark, R.N. and O.R. Jones (1981). Furrow dams for conserving rainwater in a semi-arid climate. In: A.S.A.E. Crop production with conservation in the 80's, Proceedings of the ASAE Conference Dec. 1-2, 1980, ASAE, St. Joseph, Michigan, U.S.A.
Cluff, C.B. (1979). The use of the compartmented reservoir in water harvesting agrisystems. In: Arid lands plant resources. Proceedings of the international arid lands conference on plant resources, J.R. Goodin and D.K. Nortington, eds., Texas Tech. Univ., Int. Center for Arid and Semi-Arid Land Studies (ICASALS), Lubbock, Texas, U.S.A.
Cluff, C.B. (1981). Surface storage for water-harvesting agrisystems. In: Rainfall collection for agriculture in arid and semi-arid regions. Proceedings of a workshop, University of Arizona, Tucson, Sept. 10-12, 1980, G.R. Dutt et al., Commonwealth Agricultural Bureaux, Slough, U.K.
iCocheme, J. and P. Franquin (1967). A study of the agroclimatology of the semi-arid area | south of the Sahara in West-Africa. FAO, Rome, Italy.
Cohen, M.N. (1977). The food crisis in prehistory: overpopulation and the origins of agriculture. Yale Univ. Press, New Haven, U.S.A.
Costa, J., J. de Lange and C. Pieck (1981). Irrigation water storage tanks made of brickwork; a manual for design and construction. SWD, Amersfoort, the Netherlands.
Costa, J., J. de Lange and C. Pieck (1982). Irrigation water storage tanks made of ferrocement; a manual for design and construction. SWD, Amersfoort, the Netherlands.
Costa, J., C. Pieck and J. Tromp (1983). Irrigation water storage tanks made of earth bunds with various linings; a manual for design and construction. SWD, Amersfoort, the Netherlands.
Dagg, M. and J.C. McCartney (1968). The agronomic efficiency of the NIAE mechanised tied ridge system of cultivation. Expl. Agric. 4: 279-294.
Dancette, C. and A.E. Hall (1979). Agroclimatology applied to water management. In: Agriculture in semi-arid environments. Ecological Studies 34, Hall, A.E. et al. eds., Springer Verlag, Berlin-Heidelberg, Germany, 98-118.
Denmead, O.T. and R.H. Shaw (1962). Availability of water to plants as affected by soil moisture content and meteorological conditions. Agronomy J. 54: 385-390.
Dexter, A.R. (1977). Effect of rainfall on the surface microrelief of tilled soil. J. of Terramechanics 14: 11-22.
Dickinson, W.T. (1980). Determination of runoff from agricultural areas. Publication no. 52, Ministry of Agriculture and Food, Ontario, Canada.
Doggett, H. (1970). Sorghum. Longman's and Green Company, London, U.K. Doherty V.S. (1982). Tank irrigation in crosscultural perspective. Economics Program
Progress Report 36, ICRISAT Patancheru, India. Doorenbos, J. and A.H. Kassan (1979). Yield response to water, Irrigation and Drainage
Paper No. 33. FAO, Rome, Italy. | Edwards, W.M. (1982). Predicting tillage effects on infiltration. ASA Special Publication | no. 44, Amer. Soc. of Agronomy, Madison, USA: 105-115.

- 183 -
[Ellison, W.D. (1945). Some effects of raindrops and surface-flow on soil erosion and I infiltration. Trans. Amer. Geophysical Union 26, III: 415-429.
Emmett, W.W. (1970). The hydraulics of overland flow on hillslopes. U.S. Geol. Surv. Profess. Papers, 662 A.
Evenari, M., L. Shanan and N.H. Tadmer (1971). The Negev: The challenge of a desert. Harvard Univ. Press, Cambridge, Mass, U.S.A.
I FAO (1966). Equipment and methods for tied ridge cultivation. Informal working I bulletin 28, FAO, Rome, Italy. FAO (1976). A framework for land evaluation. Soils Bulletin No. 32. FAO, Rome, Italy. FAO (1977). Assessing soil degradation. Soils Bulletin No. 34. FAO, Rome, Italy. Faulkner, O.T. (1944). Experiments on ridged cultivation in Tanganyika and Nigeria.
Trop. Agric. 21,9: 177-178. Fink, D.H. and W.L. Ehrler (1979). Runoff farming for Jojoba. Arid Land Plant Resources,
Proc. Int. Arid Lands Conf. Plant Resources. Int. Center for Arid and Semi-Arid Land Studies, Texas Tech. Univ., Lubbock, TX. 212-214, U.S.A.
Fink, D.H., G.W. Frasier and L.E. Myers (1979). Water harvesting treatment evaluation at Granite Reef. Water Resources Bull. 15: 861-873.
Fink, D.H., G.W. Frasier and K.R. Cooley (1980). Water harvesting by wax-treated soil surfaces: progress, problems and potential. Agric. Water Man. 3,2: 125-134.
Frasier, G.W. (1975). Proceedings of the water harvesting symposium, Phoenix, Arizona, March 26-28, 1974. ARS W-22, Agricultural Research Service, U.S. Department of Agriculture.
Gardner, H.R. (1975). An analysis of the efficiency of microwatershed systems. In: Proceedings of the water harvesting symposium Phoenix, Arizona, March 26-28, 1974, ARS W-22, G.W. Frasier ed.: 244-250.
iGardner, W.R. and H.R. Gardner (1983). Principles of water management under drought I conditions. Agric. Water Man. 7: 143-155. Gayle, G.A. and R.W. Skaggs (1978). Surface storage on bedded cultivated lands.
Transactions ASAE, 21: 101-104, 109. I Gerard, C.J. (1965). The influence of soil moisture, soil texture, drying conditions and I exchangeable cation on soil strength. Proc. of the Soil Sei. Soc. Amer. 29: 641-645.
Gilley, J.E., G.W. Gee and A. Bauer (1976). Particle size distribution of eroded spoil materials. Farm Research 34,2: 35-36.
Government of India (1979). India, A Reference Annual-1979. Publications Division, Ministry of Information and Broadcasting, New Delhi, India.
Greb, B.W., D.E. Smika and A.L. Black (1967). Effect of straw mulch rates on soil water storage during summer fallow in the Great Plains. Soil Se. Soc. Amer. Proc. 31: 556-559.
Gupta, S.K., D.C. Das, K.G. Tejwani, S. Chittaranjan and Srinivas (1971). Mechanical measures of erosion control. In: Soil and Water Conservation Research 1956-1971. Indian Council of Agricultural Research (ICAR), New Delhi, India: 146-182.
iGupta, U.S. (1975). Physiological aspects of dryland farming. (Haryana Agric. Univ.
( Hissar), Oxford & IBH Publishing Co, New Delhi, India. Hagan, R.M., H.R. Haise and T.W. Edminster (1967). Irrigation of agricultural lands.
Agronomy Series No. 11, ASAE, Wisconsin, U.S.A.
I Hall, A.E., K.W. Foster and J.G. Waines (1979). Crop adaptation to semi-arid environments. In: Agriculture in semi-arid environments. Ecological Studies 34, Hall, A.E., G.H. Cannell and H.W. Lawton eds. Springer Verlag, Berlin-Heidelberg, Germany: 148-179.
Hargreaves, G.H. (1971). Precipitation dependability and potential for agricultural production in Northeast Brazil. Publication No. 74-D-159, EMBRAPA and Utah State University (USA).
»Hargreaves, G.H. (1975). Water requirements manual for irrigated crops and rainfed | agriculture. Bull. Utah State Univ, U.S.A. .Have, H. ten (1977). Aspecten van dry farming in semi-aride tropische gebieden. Beknopt ' collegedictaat, nov. 1977. Landbouwhogeschool, Wageningen, the Netherlands. , Henderson, D.w. (1979). Soil management in semi-arid environments. In: Agriculture in I semi-arid environments, Ecological Studies 34, Hall, A.E. et al. eds. Springer ' Verlag, Berlin-Heidelberg, Germany: 224-237. jHillel, D. (1974). Infiltration and runoff as affected by soil conditions. Final Research , Report, Fac. of Agric, Hebrew Univ. Rehovot, Israel. Holmes, R.M. and G.W. Robertson (1963). Application of the relationship between actual and
potential évapotranspiration in dryland agriculture. Trans. ASAE 6,1: 65-67.

- 184 -
|Hoogmoed, W.B. and L. Stroosnijder (1984). Crust formation on sandy soils in the Sahel. I I. Rainfall and infiltration. Soil and Tillage Research, 4: 5-23. Horton, R.E. (1940). An approach toward a physical interpretation of infiltration
capacity. Soil Science Society Proceedings 5: 399-417. | Hudson, N. (1971). Soil conservation. B.T. Batsford Ltd, London, U.K.
ICRISAT (1974). Annual report 1973-1974. Hyderabad, India. ICRISAT (1975). Annual report 1974-1975. Hyderabad, India. ICRISAT (1976). Annual report 1975-1976. Hyderabad, India. ICRISAT (1977a). Annual report 1976-1977. Hyderabad, India. ICRISAT (1977b). This is ICRISAT. ICRISAT, Hyderabad, India. ICRISAT (1978). Annual report 1977-1978. Hyderabad, India. ICRISAT (1979). Glossary of terms. Prepublication issue. ICRISAT (1980a). Annual report 1978-1979. Patancheru, A.P., India. ICRISAT (1980b). Climatic classification: A consultants1 meeting, 14-16 April, 1980,
ICRISAT center, Patancheru, A.P., India. ICRISAT (1980c). Proceedings of the international workshop on socio-economic constraints
to development of semi-arid tropical agriculture, 19-23 February 1979, Hyderabad, India.
ICRISAT (1981). Annual report 1979-1980. Patancheru, A.P., India. ICRISAT (1982). Annual report 1981. Patancheru, A.P., India. ICRISAT (1983). Annual report 1982. Patancheru, A.P., India. Institute of Hydrology (1982?). Research Report 1978-1981. Wallingford, Oxfordshire, U.K. IRRI (1974). An agro-climatic classification for evaluating cropping systems potentials
in S.E. Asia rice growing areas. Int. Rice Res. Inst., Los Bahos, Laguna, Philippines.
Jackson, I.J. (1977). Climate, water and agriculture in the tropics, Longman, London, U.K. Jarrett, A.R. and D.D. Fritton (1978). Effect of entrapped soil air on infiltration.
Trans. ASAE, 21,5: 901-906. Jodha, N.S. (1978). Production patterns and dynamics of resource use in arid and semi-arid
tropical India. Paper presented at CILS-Mali Seminar on "Optimizing agricultural production systems", Febr. 22-March 1, 1978, Bamako, Mali. ICRISAT, Economics program, Hyderabad, India.
IJodha, N.S. (1981). Intercropping in traditional farming systems. In: ICRISAT, Proceedings I of the international workshop on intercropping, 10-13 Jan. 1979, Hyderabad,
India: 282-291. Johnson, C.B., J.V. Mannering and W.C. Moldenhauer (1979). Influence of surface roughness
and clod size and stability on soil and water losses. Soil Sei. Soc. Am. J. 43: 772-777.
Jones, K.R., 0. Berney, D.P. Carr and E.C. Barret (1981). Arid zone hydrology for agricultural development. Irrigation and Drainage Paper No. 37. FA0, Rome, Italy.
Jones, O.R. and V.L. Häuser (1975). Runoff utilization for grain production. In: Proceedings of the water harvesting symposium, Phoenix, Arizona, March 26-28, 1974, G.W. Frasier, ed., ARS W-22, Agricultural Research Service, U.S. Department of Agriculture: 277-283.
Joshi, A.B., N.D. Patil and N.K. Umrani (1980). The drought-prone areas of Maharastra. In: Proceedings of the international symposium on development and transfer of technology for rainfed agriculture and the SAT farmer, 28 Aug. - 1 Sept. 1979, ICRISAT, Patancheru A.P., India: 221-225.
I Jury, W.A. (1979). Water transport through soil, plant and atmosphere. In: Agriculture in semi-arid environments, Ecological Studies 34, A.E. Hall, et al. eds. Springer Verlag, Berlin-Heidelberg, Germany: 180-199.
I Kampen, J. and associates (1975). Soil and water conservation and management in farming systems research for the semi-arid tropics. In: International workshop on farming
1 systems, Nov. 18-21, 1974, ICRISAT, Hyderabad, India: 3-43. Kampen, J. (1980). Farming systems research and technology for the semi-arid tropics. In:
I Proceedings of the international symposium on development and transfer of technology | for rainfed agriculture and the SAT Farmer, 28 Aug. - 1 Sept. 1979, ICRISAT,
Patancheru A.P., India: 39-56. Kanitkar, N.V. (1968). Dry farming in India. ICAR, New Delhi. Kanwar, J.S. (1980). Research at ICRISAT - an overview. In: Proceedings of the
international symposium on development and transfer of technology for rainfed agriculture and the SAT farmer, 28 Aug. -1 Sept. 1979, ICRISAT, Patancheru A.P., India: 5 - 1 0 .

- 185 -
Kieft, H. (1973). Kleine reservoirs; een kennis-inventarisatie aangaande de problematiek rond planning, ontwerp, constructie en beheer van kleine waterreservoirs, o.a. toepasbaar in heuvelgebieden. Scriptie, vakgroep Weg- en Waterbouwkunde en Irrigatie. Landbouwhogeschool, Wageningen, the Netherlands.
Kirkby, M.J. (1980). Modelling water erosion processes. In: Soil erosion, M.J. Kirkby and R.P.C. Morgan eds., Wiley, Cambridge, U.K.: 183-216.
Kirpich, Z.P. (1940). Time of concentration of small agricultural watersheds. Civ. Eng. (N.Y.) 10,6.
• Klay, M.C. (1983). Analysis and evaluation of tillage on an Alfisol in a semi-arid tropical region of India. Proefschrift, Wageningen, the Netherlands.
Kolarhar, A.S., K.N.K. Murthy and N. Singh (1983). "Khadin", a method of harvesting water for agriculture in the Thar-desert. J. of Arid Environment, 6,1: 59-66.
Koppen, W (1936). Das geographische System des Klimas. In: Handbuch des Klimatologie. W. Koppen and R. Geiger, eds., Gelerender Borntrager, Berlin, Germany. Bd 1, Teil C.
Kostiakov (1932). Transactions 6th Comm. Intern. Soil Sei. S o c , part A: 17-21. Kowal, J. (1970). The hydrology of a small catchment basin at Samaru, Nigeria,
III Assessment of surface runoff under varied land management and vegetation cover. The Nigerian Agricultural J. 7,1: 120-133.
Kowal, J. (1970b). The hydrology of a small catchment basin at Samaru, Nigeria. IV. Assessment of soil erosion under varied land management and vegetation cover. The Nigerian Agricultural J. 7,2: 134-147.
Kramer, Larry A. (1974). Irrigation storage probabilities of small reservoirs. J. of the Irrigation and Drainage Division ASCE 100 No. IR4: 485-494.
I Krantz, B.A. (1981). Water conservation, management and utilization in semi-arid lands. In: Advances in food-producing systems for arid and semi-arid lands, Manassah, J.T. and C T . Briskey, eds., Academic Press, London, U.K. Part A: 339-378.
Krimgold, D.B. (1945). What is there to know about farm ponds? Agricultural Engineering, 26: 283-284.
Krishnamoorthy, Ch., S.L. Chowdhury and E.D. Spratt (1974). New horizons for dry farming in the rainfed tropics - Results of the All India Co-ordinated Research Project on Dryland Agriculture. Presentation on the FAO/UNDP Expert Consultation Meetings on the use of improved technology for food production in rainfed areas of tropical Asia. Hyderabad, India, Nov. 24-30, 1974.
Krishnan, A. (1975). Some climatological features of the semi-arid tropical regions of the world. In: International workshop on farming systems, Nov. 18-21, 1974, ICRISAT, Hyderabad, India: 53-91.
Krishnan, A. (1980). Agroclimatic classification methods and their application to India. In: Climatic classification: a consultants1 meeting, 14-16 April, 1980, ICRISAT, Patancheru, A.P., India: 59-88.
Kuipers, H. (1957). A relief-meter for soil cultivation studies. Neth. J. Agric. Sei. 5: 255-262.
Kuros, G.R. (1984). Qanats - A 3000 year-old Iranian invention for the development of groundwater supplies. 12th Congress on Irrigation and Drainage, special session on history of irrigation. Colorado State Univ., Fort Collins, Colorado, U.S.A.
. Lal, R. (1975). Role of mulching techniques in tropical soil and water management. Intern. I Inst, of Tropical Agriculture ( U T A ) , Technical Bulletin No. 1, Ibadan, Nigeria. .Lal, R. (1976). Soil erosion problems on an Alfisol in Western Nigeria and their control. I U T A Monograph No. 1, U T A , Ibadan, Nigeria.
Lal, R. (1979). Physical characteristics of soils of the tropics: Determination and ' management. In: Soil physical properties and crop production in the tropics, Lal, R. ' and D.J. Greenland eds., Wiley, Chicester, U.K.: 7-44. Langford, K.J., R.J. Mayer and A.K. Turner (1970). Studies on infiltration and overland
flow for natural surfaces. IASH-Unesco, Symposium on the results of research on representative and experimental basins. Wellington (N.Z.): 645-652.
Larson, W.E. (1964). Soil parameters for evaluating tillage needs and operations. Soil Sc. Soc. Proc. 28: 118-122.
. Lawes, D.A. (1961). Rainfall conservation and the yields of sorghum and groundnut in I Northern Nigeria. Expl. Agric. 29: 307-318. Lawton, H.W. and P.J. Wilke (1979). Ancient agricultural systems in dry regions. In:
Agriculture in semi-arid environments. Ecological Studies 34, Hall, A.E. et al. eds., Springer Verlag, Berlin-Heidelberg, Germany: 1-41.
Lemos, P. and J.F. Lutz (1957). Soil crusting and some factors affecting it. Soil Sei. Soc. Proc. 21: 485-491.
- 186 -
Linden, D.R. (1979). Model tot predict soil water storage as affected by tillage practices. Ph. D.-thesis, Univ. of Minnesota, St. Paul, U.S.A.
Linden, D.R. (1982). Predicting tillage effects on evaporation from the soil. In: ASA Special Publication no. 44, Amer. Soc. of Agronomy, Madison, USA: 117-131.
Linsley, R.K., M.A. Kohier and J.L.H. Paulus (1949). Applied hydrology. McGraw-Hill, New York, U.S.A.
Lowdermilk, W.C. (1953). Conquest of the land through seven thousand years. Agric. Inf. Bull. 99, United States Department of Agriculture.
Ludden, D. (1978). Patronage and irrigation in Tamil Nadu: a long-term view. Indian Economic and Social History Review 16: 347-365.
Lyle, W.M. and D.R. Dixon (1977). Basin tillage for rainfall retention. Transactions ASAE 1977: 1013-1017, 1021.
Malhotra, S.P. (1984). Distribution of canal waters - without and with Warabandi model. WAMANA 4, 1: 1; 20-23.
iMannering, J.V. and L.D. Meyer (1963). The effect of various rates of surface mulch on I infiltration and erosion. Proc. Am. Soc. Soil Sei. 27,1: 84-86. Mascarenhas, A.C. (1968). Aspects of food shortages in Tanganyika (1925-1945).
J. Geographical Association of Tanzania 3: 37-59. Mclntyre, D.S. (1958a). Soil splash and the formation of surface crusts by raindrop
impact. Soil Science 85: 261-266. Mclntyre, D.S. (1958b). Permeability measurements of soil crusts formed by raindrop
impact. Soil Science 85: 185-189. Meyer, L.D. and E.J. Monke (1965). Mechanics of soil erosion by rainfall and overland
flow. Trans. ASAE 8,4: 572-577; 580. Mitchell, J.K. and B.A. Jones Jr. (1976). Micro-relief surface depression storage:
Analysis of models to describe the depth-storage function. AWRA Water Resources Bulletin 12,6: 1205-1222.
Mitchell, J.K. and B.A. Jones Jr. (1978). Micro-relief surface depression storage: changes during rainfall events and their application to rainfall-runoff models. Water Resources Bulletin 14: 777-802.
Monteith, N.H. (1974). The role of surface roughness in runoff. Soil Cons. J.: 42-45. Moore, I.D. and C.L. Larson (1979). Estimating micro-relief surface storage from point
data. Transactions of the ASEA, 22: 1073-1077. Moore, I.D., C.L. Larson and D.C. Slack (1980). Predicting infiltration and micro-relief I surface storage for cultivated soils. Water Resources Res. Center, Bulletin 102, i Univ. of Minnesota, Minnesota, U.S.A. Morin, J., Y. Benyamini and A. Michaeli (1981). The effect of raindrop impact on the I dyamics of soil surface crusting and water movement in the profile. J. of , Hydrology 52: 321-335. Morin, J. and Y. Matlock (1974). Desert strip farming-computer simulation of ancient
techniques. Proceedings Water Harvesting Symposium, Phoenix, Arizona, U.S.A.: 141-150.
Moroney, M.J. (1975). Facts from figures. Penguin Books, Harmondsworth, U.K. Mueller, A.M. and A.D.M. Karunaratna (1982). Construction manual for ferro-soil-crete
tanks. Wind energy unit, Water resources board, Sri Lanka. Murton, B.J. (1980). South Asia. In: World systems of traditional resource management,
G.A. Klee ed., Winston, London, U.K.: 67-100. Meyers, L.E. (1975). Water harvesting 2000 B.C. tot 1974 A.D. In: Proceedings of the water
harvesting symposium, Phoenix, Arizona, March 26-28, 1974, Frasier, G.W. ed., ARS, W-22, Agr. Res. Serv., U.S. Department of Agriculture: 1-7.
I Nanjundappa, D.M. (1981). Inaugural address. Panel discussion on soil and water conservation in red and black soils. ICAR, Bangalore, India.
Natarajan, M. and R.W. Willey (1981). Growth studies in sorghum/pigeonpea intercropping | with particular emphasis on canopy development and light interception. ICRISAT: , Proceedings of the International Workshop on Intercropping, 10-13 Jan 1979, ' Hyderabad, India: 180-187. Nat. Acad. Sei. (1974). More water for arid lands. National Academy of Sciences,
Washington D.S., U.S.A. Nicholaichuk, W. (1978). Evaporation control on farm-size reservoirs. J. Soil and Water
Conservation 33,4: 185-188. Oppen, M. von and K.V. Subba Rao (1980). Tank irrigation in semi-arid tropical India.
ICRISAT Economic Program Progress Report 9, Patancheru, A.P., India. Oron, G., J. Ben. Asher, A. Issar and Th. M. Boers (1983). Economic evaluation of water
harvesting in microcatchments. Water Resources Research 19: 1099-1105.

- 187 -
Pauw, E. de (1983). The concept of dependable growing period and its modelling as a tool for land evaluation and agricultural planning in the wet and dry tropics. Pédologie 32: 329-348.
Peat, J.E. and K.J. Brown (1960). Effect of management on increasing crop yields in the I Lake Province of Tanganyika. East African Agriculture and Forestry J. 26: 103-108. Penman, H.L. (1948). Natural evaporation from open water, bare soil and grass. Proceedings
Royal Society, Series A, 193: 120-145. Pepper, R.G. (1976). Seepage from small earthen dams. Austr. J. Soil Research 15: 39-50.
/Philip, J.R. (1957). The theory of infiltration: 4. Sorptivity and algebraic infiltration ( equations. Soil Science 84: 257-264.
Pierce, F.J., W.E. Larson, R.H. Dowdy and W.A.P. Graham (1983). Productivity of soils: assessing long-term changes due to erosion. J. Soil and Water Conservation 38,1: 39-44.
Purseglove, J.W. (1972). Tropical crops, Monocotyledons. Longman, London, U.K. Puttanna, Leelambike (1983). Water management in rice in India: a review of research.
WAMANA 3,4 (1983): 1; 6-22. Raadsma, S. and F.E. Schulze (1974). Surface field drainage systems. In: ILRI, / Publication 16: Drainage principles and applications, vol. IV: Design and management
of drainage systems. International Institute for Land Reclamation and Improvement, | Wageningen, the Netherlands: 67-121. Rajan, Govinda S.V. and H.G. Gopala Rao (1978). Studies on soils of India. Vikas,
New Delhi, India. | Rama Rao, M.S.V. (1962). Soil conservation in India. ICAR, New Delhi, India.
Randhawa, N.S. and J. Venkateswarlu (1980). Indian experiences in the semi-arid tropics: Prospect and retrospect. In: Proceedings of the international symposium on development and transfer of technology for rainfed agriculture and the SAT farmer, 28 Aug. - 1 Sept. 1979, ICRISAT, Patancheru A.P., India: 207-220.
Rao, M.S., V. Ranga Rao, M. Ramachandran and R.C. Agnihotri (1977). Effect of vertical mulch on moisture conservation and yield of sorghum in Vertisols. Agric. Water Man. 1: 333-342.
Rao, Ranganatha (1980), In: Seminar on strategy for mass mobilisation and people's participation in the implementation of watershed management programme, New Delhi, India.
Rao, V.N. (1978). Linking irrigation with development. Economic and Political Weekly 13,24.
Rastogi, B.K. (1980). Cropping patterns, farming practices and economics of major crops in selected dryland farming regions of India. In: Proceedings of the international workshop on socio-economic constraints to development of semi-arid tropical agriculture, 19-23 February 1979, ICRISAT, Hyderabad India: 25-36.
Rawitz, E. and D. Hillel (1971). A method for characterizing the runoff potential of rainfall in water harvesting schemes. Water Resources Research 7: 401-405.
Rawitz, E., W.B. Hoogmoed and Y. Morin (1981). Development of criteria and methods for \ improving the efficiency of soil management and tillage operations, with special
reference to arid and semi-arid regions. Final Report on Research Acitivities in \ Israel, Mali and Holland, the Hebrew Univ. of Jerusalem, Fac. of Agric, Jerusalem,
Israel. Rayachaudhuri, S.P. and S.V. Govinda Rajan (1963). Soils of India. ICAR, New Delhi, India. Reddy, M.S. and R.W. Willey (1981). A study of pearl millet/groundnut intercropping with
particular emphasis on the efficiencies of leaf canopy and rooting pattern. ICRISAT: Proceedings of the International Workshop on Intercropping, 10-13 Jan. 1979, Hyderabad, India: 202-209.
Reed, C.A. (1977). Origins of agriculture. Mouton, The Hague, the Netherlands. Reginato, R.J., F.S. Nakayama and J.B. Miller (1973). Reducing seepage from stock tanks
with uncompacted, sodium-treated soils. J. Soil and Water Conservation 28: 214-215. Ritchie, J.T. (1972). Model for predicting evaporation from a row crop with incomplete
cover. Water Resources Research 8: 1204: 1213. Russell, E.W. (1973). Soil conditions and plant growth. Longman, London, U.K. Ruthenberg, H. (1976). Farming systems in the tropics. Oxford University Press, Oxford,
U.K. Ryan, J.G. and associates (1975). Socio-economic aspects of agricultural development in
the semi-arid tropics. In: International workshop on farming systems, Nov. 18-21, 1974, ICRISAT, Hyderabad, India: 389-431.
Ryan, J.G. and H.P. Binswanger (1980). Socio-economic constraints to agricultural development in the semi-arid tropics and ICRISAT's approach. In: Proceedings of the

- 188 -
international symposium on development and transfer of technology for rainfed agriculture and the SAT farmer, 28 aug. - 1 Sept. 1979, ICRISAT, Patancheru A.P., India: 57-67.
/Sanchez, P.A. (1976). Properties and management of soils in the tropics. John Wiley and ( Sons, New York, U.S.A.
Sanghi, N.K. and S.B.P. Rao (1982). Operational research in dryland agriculture. In: A decade of dryland agricultural research in India 1971-80, ICAR, AICRPDA, Hyderabad, India: 212-231.
Sarma, J.S. (1982). Agricultural policy in India: Growth with equity. IDRC 201 e., Ottawa, Ont., Candada.
Sastry, Kumara V.V. and Balakaran Mathur (1972). Soils of Andhra Pradesh. In: Soils of India, The Fertiliser Association of India.
Saxton, K.E., D.K. Mc Cool and R.I. Papendick (1981). Slot mulch for runoff and erosion control. J. of Soil and Water Conservation 36,1: 44-47.
Schertz, D.L. (1983). The basis for soil loss tolerances. J. of Soil and Water Conservation 38,1: 10-15.
Schultz. T.W. (1964). Transforming Traditional Agriculture. Yale University Press, New Haven, Conn. U.S.A.
Seely, E.H. (1976). Floodwater retarding structure yield runoff. Trans. ASAE, 19: 520-523. Seginer, I. (1971). A model for surface drainage of cultivated fields. J. of Hydrology 13:
139-152. Shanan, L. and N.H. Tadmor (1979). Micro-catchment systems for arid zone development; a
handbook for design and construction. Jerusalem, Hebrew University. Centre of Int. Agr. Coop. Min. Agric. Rehovot, Israel.
Sharma, P.N. and O.J. Helweg (1982). Optimal design of small reservoir systems. J. of the Irrigation and Drainage Division: 108, IR 4: 250-264.
Sharma, V.K., T.S. Bhogla and R.P. Gangwar (1983). Economic evaluation of tank irrigation in Khachar watershed in Uttar Pradesh hills. WAMANA 3,2: 16-19.
Sharp, A.L. and H.N. Holtan (1940). A graphical method of sprinkled plot hydrographs. Trans. Amer. Geophysical Union 12: 558-570.
Shaw, R.H. (1980). Modeling crop yields using climatic data. In: Proceedings of the international workshop on the agroclimatological research needs of the semi-arid tropics, 22-24 Nov. 1978, ICRISAT, Hyderabad, India: 154-161.
.Shetty, S.V.R. (1980). Some agro-economical aspects of improved weed management systems in Indian semi-arid tropics. Proc. 1980 British Crop Protection Conference - Weeds:
I 899-910. Sibie, D.R. (1971). Bepaling van de infiltratiesnelheid van een aantal bodemprofielen op
het CELOS-terrein. CELOS - Rapport no. 48, Landbouwhogeschool, Wageningen, Nederland.
Singh, Jasbir (1974). An agricultural atlas of India: A geographical analysis. Kurukshe-tra. India.
ISingh, P. and M.B. Russell (1979). Water balance and profile moisture loss patterns of an I Alfisol. Agronomy J. 71, Nov/Dec: 963-966. .Singh, R.P. (1977). Dryland farming technology. In: Desert eco-system and its improvement,
H.S. Mann, ed., Central Arid Zone Research Institute, Monograph No. 1, Jodhpur, India: 202-212.
Singh, R.P. (1982). Dryland research in retrospect and focus in the seventies. A decade of dryland agricultural research in India 1971-1980, ICAR/AICRPDA, Hyderabad, India: 1-6.
Singh, S. and B.A. Krantz (1976). A brief description of the soils of ICRISAT. Informal Report, ICRISAT, Hyderabad, India.
Smith, R.E. and D.A. Woolhiser (1971). Mathematical simulation of infiltrating watersheds. Hydrology Papers, Colorado State Univ. No. 47, Colorado, U.S.A.
Soil Conservation Service (1971). Ponds for water supply and recreation. Agric. handbook no. 387, U.S. Department of Agriculture, Washington, U.S.A.
Soil Conservation Service (1981). Earth dams and reservoirs. Technical release no. 60. U.S. Department of Agriculture, Washington, U.S.A.
Sopher, D.E. (1980). Indian civilization and the tropical savanna environment. In: Human ecology in savanna environments, D.R. Harris, ed., Academic Press, London, UK: 185-207.
Stewart, B.A., and J.T. Musick (1982). Conjunctive use of rainfall and irrigation in semi-arid regions. In: Advances in irrigation, Volume 1, Stewart, B.A. and J.T. Musick eds.. Academic Press, London, U.K.: 1-24.

- 189 -
Sundar, A. and P.S. Rao (1982). Farmers' participation in tank irrigation management in Karnataka. WAMANA 2,3: 1-15.
Tackett, J.L. and R.W. Pearson (1965). Some characteristics of soil crusts formed by simulated rainfall. Soil Sei. 99: 407-413.
(Tandon, H.L.S. (1981). Fertilizer use in dryland agriculture. Seminar. Tanner, C.B. (1967). Measurement of évapotranspiration. In: Irrigation of agricultural
lands. R.M. Hagan, H.R. Haise and T.W. Edminster, eds. Agronomy Series No. 11, ASAE, Wisconsin, U.S.A.: 534-574.
Tanner, C.B. and W.A. Jury (1976). Estimating evaporation and transpiration from a row crop during incomplete cover. Agronomy J. 68: 239-243.
Thierstein, G.E. (1981). The animal-drawn wheeled tool carrier. Information bulletin No. 8. ICRISAT, Patancheru, A.P., India.
Thornthwaite, C.W. (1948). An approach towards a rational classification of climate. Geographical Review 38: 55-94.
Thornthwaite, C.W. and J.R. Mather (1955). The water balance. Publications in climatology 8,1. Drexel Institute of Technology, Laboratory of Climatology, Centerton, N.J., U.S.A.
Tricker, A.S. (1978). The infiltration cylinder: Some comments on its use. Journal of Hydrology 36: 383-391.
Troll, C. (1965). Seasonal climates of the earth. In: World maps of climatology, E. Rodenwalt and H. Jusatz, eds.. Springer Verlag, Berlin, Germany: 19-28.
UNESCO (1977). Development of arid and semi-arid lands: obstacles and prospects. MAB Technical Notes no. 6, Paris, France.
I Unger, P.W. (1975). Role of mulches in dryland agriculture. In: Physiological aspects of dryland farming, U.S. Gupta (Haryana Agric. Univ. Hissar) ed., Oxford & IBH Publishing Co., New Delhi, etc., India: 237-258.
Viets, F.G. Jr. (1967). Nutrient availability in relation to soil water. In: Irrigation of agricultural lands, R.M. Hagan, H.R. Haise and T.W. Edminster, eds. Agronomy Series No. 11, ASAE, Wisconsin, U.S.A.: 458-471.
Vijayalakshmi, K., K.P.R. Vittal and R.P. Singh (1982). Water harvesting and re-use. In: A decade of dryland agricultural research in India 1971-1980, ICAR, New Delhi: 103-119.
Virmani, S.M., S. Singh and B.A. Krantz (1976). Use of soils information in planning ] agricultural development in the semi-arid tropics. An informal publication presented ' at the International Soil Seminar at Hyderabad, India, Jan. 18-22, 1976. Virmani, S.M., M.V.K. Sivakumar and S.J. Reddy (1980). Climatic classification of the
semi-arid tropics in relation to farming systems research. In: Climatic classification: A consultants' meeting, 14-16 April 1980, ICRISAT, Patancheru, A.P., India: 27-44.
Virmani, S.M., M.V.K. Sivakumar and S.J. Reddy (1980). Climatological features of the semi-arid tropics in relation to the farming systems research program. Proceedings of the international workshop on the agroclimatological research needs of the semi-arid tropics, 22-24 Nov. 1978, ICRISAT, Hyderabad, India: 5-16.
Virmani, S.M., M.V.K. Sivakumar and S.J. Reddy (1982). Rainfall probability estimates for selected locations of semi-arid India. Research Bulletin No. 1, ICRISAT, Patancheru, A.P., India.
Vittal, K.P.R., K. Vijayalakshmi and U.M.B. Rao (1983). Effect of deep tillage on dryland crop production in red soils in India. Soil and Tillage Research 3: 377-384.
Vleeschauwer, D. de, R. Lai and R. Malafa (1980). Effects of amounts of surface mulch on I physical and chemical properties of an Alfisol from Nigeria. J. of the Science of ' Food and Agriculture 31,7: 730-738.
Vollebergh, T. (1984). Evaporation from bare soil determined under field conditions with / undisturbed soil cores. M.Sc.-report, Dept. of Soil Science and Geology, Agric.
( Univ. Wageningen, the Netherlands. Wallen, C.C. (1966). Arid zone meteorology. In: Arid lands: A geographical appraisal,
E.S. Halls ed., UNESCO, Paris, France: 31-50. Webster, C.C. and P.N. Wilson (1966). Agriculture in the tropics. Longman, London, U.K. Welling, H. (1965). Der Einfluss der Stabilitaet von Bodenaggregaten auf die Verdunstung.
Diss. Giessen, W.-Germany. Willcocks, T.J. (1981). Tillage of clod-forming sandy loam soils in the semi-arid climate / of Botswana. Soil and Tillage Research 1,4: 323-350.
Wischmeier, W.H. (1976). Use and misuse of the universal soil loss equation. J. of Soil and Water Conservation 31: 5-9.

- 190 -
Wischmeier, W.H., D.D. Smith and R.E. Uhland (1958). Evaluation of factors in the soil-loss equation. Agric. Engineering 39,8: 458-462; 474.
Zachar, D. (1982). Soil erosion. Elsevier, Amsterdam, the Netherlands. Zingg, A.W. and V.L. Häuser (1959). Terrace benching to save potential runoff for
semi-arid land. Agronomy J. 51: 289-292.

- 191 -
GLOSSARY
Agricultural watershed: Here used as the indication of an area, generally not exceeding 20 ha, from which the surface runoff water collects at one determined point, and which area is mainly or exclusively in agricultural use.
AICRPDA: All India Co-ordinated Research Project on Dryland Agriculture.
Bund: Earthen wall, thrown up with local material, with a cross-sectional size that depends on its function.
Contour-bund: Earthen wall, constructed across a field or at its boundary, that follows the contour. As a rule, contour-bunds are provided with a spillway to avoid over -topping and hooked up with side-bunds at the two extremes.
Dam: A wall or bank built to keep back water, also commonly used to mean the barriers that obstruct flow in furrows (see: Tied ridging).
Diversion dam: Earthen wall that is constructed to hold surface runoff and to lead this water to a predetermined spot or channel.
Dry farming: Techniques of non-irrigated farming in arid areas, through which more water is made available to the crop than is received by it from rainfall on the occupied area during its growing cycle.
Farming system: The entity of available technology, the decisions the farmers make and the circumstances that directly influence these.
Field bund: Small earthen wall to indicate a field boundary.
Graded bund: Earthen wall constructed in a direction slightly deviating from the local contour-line and provided with an outflow.
ICRISAT: International Crops Research Institute for the Semi-Arid Tropics.
Rainfed farming: The growing of crops that fully depend on the local precipitation, occurring during the growing cycle.
Reservoir: Place where water is stored, here generally relating to an excavated pond of moderate size.
Runoff collection: The diversion of, naturally occurring, runoff water into a created reservoir.
Runoff farming: The growing of crops in fields that partly or fully depend for their water supply on the inflow of water from treated or untreated catchments.
SAT: Semi-Arid Tropics.
Sub-watershed: A part of a larger watershed area.
Tank: The usual name in India for a reservoir that is created by damming a valley in the lower reach of a watershed.
Tied ridging: A land management system in which furrows are closed at regular intervals by small earthen dams to prevent water from running off.
Water harvesting: All techniques that stimulate runoff from unproductive areas and the subsequent diversion of the runoff water to a storage reservoir (possibly the soil profile).
W.M.I.: Weighed Mean Intensity (of a rainstorm) See section 5.2.2.
Watershed: The undivided area which runoff water collects at one point.

- 192 -
Curriculum Vitae
The author was born in Rotterdam, the Netherlands, on January 7th, 1949. He
attended secondary school at the Franciscus College in Rotterdam, which he
finished in 1968. In that year, he began his studies on land- and water-
management ("tropische cultuurtechniek") at the State Agricultural Univer
sity Wageningen, the Netherlands.
During his studies he stayed for a 6-month period in Santa Cruz, Bolivia,
where he worked as assistant in soil survey and irrigation development.
After graduation in 1976, he worked as a tutor for the International Course
on Land Drainage, organised by the International Institute for Land Recla
mation and Improvement (ILRI) at Wageningen.
From March 1977 until 1981 (through a contract with the Directorate General
for International Co-operation (DGIS) of the Government of the Nether
lands), he was connected as junior scientist to the Farming Systems
Research Program of the International Crops Research Institute for the
Semi-Arid Tropics (ICRISAT) at Hyderabad, India, which institute he visited
again during July 1982. There he carried out field-experiments on aspects
of land- and watermanagement. From March 1981 he has been working at the
Department of Irrigation and Civil Engineering of the State Agricultural
University, during which period he introduced a course-element on land- and
watermanagement of rainfed farming in tropical areas.

193 -
ABSTRACT
Huibers, F.P. (1985). Rainfed agriculture in a semi-arid tropical climate.
Aspects of land- and watermanagement for red soils in India.
Doctoral thesis. Agricultural University Wageningen, the Netherlands, XI,
193 p., 111., Summary in Dutch.
Red soils in a semi-arid tropical climate pose specific problems for the
production of rainfed crops. The instability of their top soil and their
generally low profile water retention capacity induce rainfall-runoff and a
too low level of available water to bridge droughty periods within the
growing season, even in areas where mean annual rainfall seems to be suf
ficient to grow (adapted) crops. Common agricultural practices in red soil
areas of India are characterised by a low level of inputs and low yields,
typical for subsistence farming.
Techniques of land- and watermanagement that would improve the ability to
control runoff and erosion are discussed. Collection of runoff water for
subsequent use as supplementary irrigation is thought to be a prerequisite
for distinct increases in crop production and reduction of risk for the
farmers, for all but the deepest soil profiles. Approaches to improve the
productivity should include those of resource protection and should fit the
farmer's level of technology. Individual land units of small size seem most
appropriate and efficient for reaching these goals.