rainbow creek master plan update study - vaughan · city of vaughan city of vaughan storm drainage...
TRANSCRIPT

environmental sciences | wet weather flow | environmental intelligence | water resources
Rainbow Creek Master Plan update Study
cole enGineerinG GroUP ltD.
70 valleywood Drive
markham, on canaDa l3r 4t5
t. 905.940.6161 | 416.987.6161
F. 905.940.2064 | www.coleengineering.ca
Project manager. geoff masotti, P.eng.
t. 905.940.6161 ext. 254
The CiTy of Vaughan
june 2014

City of Vaughan City of Vaughan Storm Drainage SWM Master Plan Rainbow Creek Update Study
W11-259 (June 2014) Page i
Table of Contents
1.0 Introduction....................................................................................................................1 1.1. Location ............................................................................................................................1 1.2. Objectives.........................................................................................................................1 1.3. Background.......................................................................................................................2
2.0 Methodology ..................................................................................................................4
3.0 Model Parameters ..........................................................................................................5 3.1. Links and Nodes................................................................................................................5 3.2. Drainage Boundaries.........................................................................................................5 3.3. Land use............................................................................................................................6 3.4. Soils Mapping ...................................................................................................................7 3.5. Stormwater Management Facilities..................................................................................7
4.0 Models ............................................................................................................................8 4.1. Quantity Control Model....................................................................................................8 4.2. Regional Regulatory Event Model.....................................................................................9 4.3. Erosion Control Model ......................................................................................................9
5.0 Results ..........................................................................................................................10 5.1. Quantity Control Model.................................................................................................. 10 5.2. Regional Storm Model .................................................................................................... 12 5.3. Floodline Update ............................................................................................................ 14 5.4. Flood Vulnerable and Historic Flooding Locations .......................................................... 14 5.5. Erosion Control – Continuous Modeling ......................................................................... 23 5.6. Evaluation of Erosion Sites.............................................................................................. 28
6.0 Conclusions and Recommendations .............................................................................31
City of Vaughan City of Vaughan Storm Drainage SWM Master Plan Rainbow Creek Update Study
W11-259 (June 2014) Page ii
FIGURES Figure RC‐1 Humber Location Plan .......................................................................... Following the Report Figure RC‐2 Existing Conditions ............................................................................... Following the Report Figure RC‐3 Soil Map ............................................................................................... Following the Report Figure RC‐4 Historic Flooding................................................................................... Following the Report Figure RC‐5 Erosion Threshold ................................................................................ Following the Report Figure RW‐1 Locations of Recommended Flood Works ............................................ Following the Report Figure RW‐2 Locations of Recommended Erosion Works ......................................... Following the Report Figure 5‐1 Erosion Threshold Site 02..................................................................................................... 24 Figure 5‐2 Erosion Threshold Site 05..................................................................................................... 24 Figure 5‐3 Erosion Threshold Site 06..................................................................................................... 24 Figure 5‐4 Erosion Threshold Site 07..................................................................................................... 25 Figure 5‐5 Erosion Threshold Site 08..................................................................................................... 25 Figure 5‐6 Erosion Threshold Site 09..................................................................................................... 25 Figure 5‐7 Erosion Threshold Site 10..................................................................................................... 26 Figure 5‐8 Erosion Threshold Site 11..................................................................................................... 26 Figure 5‐9 Erosion Threshold Site 12..................................................................................................... 26 Figure 5‐10 Erosion Threshold Site 13 ................................................................................................... 27 Figure 5‐11 Erosion Threshold Site 14 ................................................................................................... 27
TABLES
Table 5.1 – Results of the Quantity Control Hydrology Model – 2year‐12 hour AES Design Storm .......... 10 Table 5.2 – Results of the Quantity Control Hydrology Model – 100‐year‐12hour AES Design Storm...... 11 Table 5.3 – Results of the Regional storm Hydrology model – 2031 Development conditions................. 12 Table 5.4 – Results of the Regional storm Hydrology model – 2051 Development conditions................. 13 Table 5.5 – Historic Flooding and Flood Susceptible Sites identified in the 1989 Master Drainage Plan .. 15 Table 5.6 – Summary of Recommendations for Flood Vulnerable Sites .................................................. 20 Table 5.7 – Summary of Recommendations for Sites with Erosion Problems.......................................... 30
APPENDICES
Appendix A – Drawings Appendix B – Model Parameters Appendix C – Modeling Files (2‐year, 5‐year, 100‐year and Regional Storm) Appendix D – Flood Evaluation Matrix Appendix E – Photographs of Erosion Sites

City of Vaughan City of Vaughan Storm Drainage SWM Master Plan Rainbow Creek Update Study
W11-259 (June 2014) Page 1 of 31
1.0 Introduction
In September of 2010, City of Vaughan Council adopted the new City‐Wide Official Plan, a component of the Consolidated Growth Management Strategy – 2031. The Official Plan represents an update to the City of Vaughan's community planning policies in a manner consistent with the principles of sustainability. The City of Vaughan (the City) is now proceeding with the preparation of a City‐Wide Storm Drainage / Stormwater Management (SWM) Master Plan Class Environmental Assessment Study (MPCEA) to complement the new Official Plan and direct the required storm water management infrastructure improvements to support the build‐out of the new Official Plan. As part of the SWM Master Plan, the Rainbow Creek Master Plan is being updated to support the population growth identified in the City’s OPA, specifically as it relates potential flooding and erosion impacts.
1.1. Location
Rainbow Creek is part of the Humber River Watershed. The Humber River Watershed covers approximately 900 km2, and reaches from the Niagara Escarpment to Lake Ontario. There are five (5) subwatersheds in Humber Watershed:
1) West Humber 2) Main Humber 3) East Humber 4) Lower Humber 5) Black Creek
The Rainbow Creek Subwatershed is part of the Main Humber Subwatershed. The subwatershed boundaries and existing Rainbow Creek Sub‐catchment area are illustrated in Figure RC‐1 following the report.
The Rainbow Creek Subwatershed covers approximately 48 km2 and is drained by two (2) watercourses, namely, Rainbow Creek and Robinson Creek, which merge north of Highway 7 to form Plunkett Creek. Plunkett Creek outlet’s to the Humber River North of Steeles Avenue. Most of the Rainbow Creek Subwatershed is located within the City of Vaughan, with a portion to the Northwest extending into the Town of Caledon and a portion to the west extending into the City of Brampton. As this study has been commissioned by the City as part of their growth strategies, this study has focussed on the portions of Rainbow Creek within City limits. However, certain assumptions related to growth in the City of Brampton and the Town of Caledon have been made based on the respective growth strategies as outlined in their Official Planning documentation.
1.2. Objectives
The objectives of the Rainbow Creek Master Drainage Plan update are described below:
• Recommend a storm drainage plan and SWM management criteria for Rainbow Creek and identify improvements required in the existing stormwater collection system;
• Conduct necessary field work to identify alternative SWM measures that would cost‐effectively improve the storm water runoff quantity, quality, erosion potential and reduce future maintenance requirements and flooding;

City of Vaughan City of Vaughan Storm Drainage SWM Master Plan Rainbow Creek Update Study
W11-259 (June 2014) Page 2 of 31
• Select the preferred SWM, erosion control and flood control alternative(s) to be considered for future phased implementation;
• Develop draft policies and SWM criteria to be applied to existing, new development and re‐development in the Rainbow Creek Subwatershed to help achieve identified SWM targets relating to quantity control, flood control and erosion;
• Establish / identify major system drainage patterns in areas of future development and identify pond locations and number of ponds required;
• Verify the need to proposed flood remediation works for Sites identified in 1989 MDP under existing, interim (2011) and full build out conditions of Rainbow Creek Watershed;
• Evaluate the impact of upstream development on flood vulnerable areas identified by the TRCA and make recommendations for flood remediation work;
• Identify and evaluate other flood vulnerable sites within the City of Vaughan and make recommendations for flood remediation work; and,
• Evaluate the impact of upstream development on the existing erosion problems and identify stream restoration where required.
1.3. Background
A number of studies developed within the study area by the City, the Toronto and Region Conservation Authority (TRCA) and other consultants were revised as part of this update.
These studies include:
• City of Vaughan Official Plan 2010 – Urban Strategies Inc., September 2010; • North Kleinburg‐Nashvillle Secondary Plan – The Planning Partnership in association with Plan B Natural Heritage, Bray Heritage, September 2010;
• The WVEA Plan – secondary plan for the West Vaughan Employment Area – Urban Strategies Inc., September 2010;
• Functional Servicing Report, West Vaughan Employment Area – Cole Engineering Consultants Limited, July 2012 (Draft);
• Functional Servicing Report, Kleinburg‐Nashville – Cole Engineering Consultants Limited, July 2012 (Draft);
• The City of Brampton Official Plan, October 7, 2008; • Highway 427 Industrial Secondary Plan (Area 47), Preliminary Land Use Concept, April 19, 2011;
• Brampton East Secondary Plan, Sub Area 1, The Neighbourhood of Castlemore Crossing, October 22, 2008;
• Town of Caledon Official Plan, December 31, 2008 Consolidation; • Rainbow Creek, Master Drainage Plan, Town of Vaughan – Cosburn, Patterson, Wardman Limited Consulting Engineers, December 1989;
• Rainbow Creek Erosion Assessment, City of Vaughan – Stantec, April 2002 (Revised September 2002);
• Humber River Watershed Hydrology / Hydraulics and Stormwater Management Study – Aquafor Beech Limited, April 1997;
• Humber River Watershed Hydrology Update – Aquafor Beech Limited, November 2002;

City of Vaughan City of Vaughan Storm Drainage SWM Master Plan Rainbow Creek Update Study
W11-259 (June 2014) Page 3 of 31
• Digital Floodline Mapping for the Rainbow Creek Subwatershed Summary Report – Hatch Acres, June 2006; and,
• Hydrologic Study of Impacts on Flood Flows and Mitigation of Future Development in the Humber River – AMEC Environment and Infrastructure, June 2012 (Draft).
The planning documents (Official Plans, Secondary Plans, Master Plans and Functional Servicing Reports) for the City of Vaughan, the City of Brampton and the Town of Caledon were used to map land use for 2031. Key aspects of existing studies relevant to the Rainbow Creek Master Drainage Plan Update are summarized below.
1.3.1. Rainbow Creek, Master Drainage Plan, Town of Vaughan – Cosburn, Patterson, Wardman Limited Consulting Engineers, December 1989
This is the original Rainbow Creek Master Drainage Plan and addresses hydrologic and hydraulic impacts of urban drainage on flooding, erosion, water quality and fisheries and terrestrial resources within the watershed. Prior to this report there were no requirements for runoff control for developments within the Rainbow Creek Watershed, however developers were required to secure funds with the City of Vaughan in order to prepare and implement a Master Drainage Plan for the Rainbow Creek Subwatershed.
At the time of the study only seven percent (7%) of the watershed was developed, the future committed scenario was for 13% urbanisation of the watershed and the future foreseeable land use was 36.3% urbanisation of the watershed. No specific recommendations for pond locations were made since road patterns and minor system drainage patterns had not been established. The SWM criteria established through this study are runoff control facilities to control:
• 5‐year flows to 40 L/s/ha; • 100‐year flows to 180 L/s/ha; and, • Settle out particles 40 microns in size or greater.
This report was used to identify possible areas of concern within the Rainbow Creek Sub‐catchment such as:
• Locations of historic flooding; • Flood susceptible sites; and, • Eroding sites and sites with erosion scars.
Three (3) locations of historic flooding and 12 flood susceptible sites were identified; these sites were included in the updated flood analysis for Rainbow Creek.
40 eroding sites or erosion scars were identified within the study area. The report states that no specific erosion criteria were given as there is a lack of technology to address the effectiveness of runoff control to minimize erosion. Erosion at these sites is addressed briefly in Section 5.6 of this report and in more detail in the Rainbow Creek Fluvial Geomorphological and Erosion Assessment Report, by Water’s Edge Environmental Solutions Team, December 2012.

City of Vaughan City of Vaughan Storm Drainage SWM Master Plan Rainbow Creek Update Study
W11-259 (June 2014) Page 4 of 31
1.3.2. Humber River Watershed Hydrology / Hydraulics and Stormwater Management Study – Aquafor Beech Limited, April 1997 and the Humber River Watershed Hydrology Update – Aquafor Beech Limited, November 2002
These reports update the Hydrologic and Hydraulic modeling for Rainbow Creek. The unit flow rates which are currently used as the requirement for runoff control were established in this report. These unit flow rates were used to size ponds for the 2031 and 2051 development scenarios. A map showing the area for each set of unit flow rate equations is located in Appendix B. The equations used for the Rainbow Creek sub‐watershed are:
• Q2yr (L/s/ha) = 9.506 – 0.719*LN (Area); • Q5yr (L/s/ha) = 14.652 – 1.136*LN (Area); • Q10yr (L/s/ha) = 17.957 – 1.373*LN (Area); • Q25yr (L/s/ha) = 22.639 – 1.741*LN (Area); • Q50yr (L/s/ha) = 26.566 – 2.082*LN (Area); and, • Q100yr (L/s/ha) = 29.912 – 2.316*LN (Area).
1.3.3. Digital Floodline Mapping for the Rainbow Creek Subwatershed Summary Report – Hatch Acres, June 2006
The current flood elevations for Rainbow Creek were established in this report. The Rainbow Creek portion of the HEC RAS model form this report was updated and used to delineate flood lines for Rainbow Creek.
1.3.4. Hydrologic Study of Impacts on Flood Flows and Mitigation of Future Development in the Humber River – AMEC Environment and Infrastructure, June 2012 (Draft)
This report is currently being completed for the TRCA and will provide guidance for flood flow mitigation throughout the Humber River Watershed. Given the scope of their analysis the model for the overall Humber River is less detailed than that of Rainbow Creek, however it is important for planning and regulation purposes that both models give similar results. To this end we have been working with AMEC, through the TRCA, to keep our methodology consistent with that used in the Humber River analysis. The models and methodology from the Humber River analysis were used as the base for the Rainbow Creek Hydrology Model.
2.0 Methodology
The overall Humber River Hydrology Model is currently being updated by AMEC as commissioned by the TRCA. The Draft PCSWMM model prepared by AMEC for the Humber River was obtained through the TRCA and updated with detailed information provided by the City. The modeling software (PCSWMM) and infiltration method (Green Ampt) were those used in the Humber River Model. The Links and nodes for our existing conditions were taken directly from the AMEC Model. At the time of completion of this study, the TRCA had not completed Humber River Watershed Update or determined the overall impacts of development within Vaughan on the overall Humber River. Further recommendations and/or flood management criteria may required to be considered based in the final results of TRCA’s work.
Three (3) model scenarios were used to determine the long term effects of development on the Watershed. The scenarios chosen are consistent with those used in the Draft Humber River Model.

City of Vaughan City of Vaughan Storm Drainage SWM Master Plan Rainbow Creek Update Study
W11-259 (June 2014) Page 5 of 31
The baseline scenario is used to determine the current or acceptable conditions in a watershed. The baseline scenario for the Rainbow Creek Watershed is a combination of existing land use (Figure RC‐2 following the report) and development approved in the previous City of Vaughan Official Plan. This is consistent with the baseline scenario used in the Draft Humber River Model. The land use used for the baseline condition is shown on Drawing LU‐1, located in Appendix A.
The second scenario is the projected 2031 Development condition within the City of Vaughan, Town of Caledon and the City of Brampton as per the respective growth strategies. This model is used to determine SWM criteria for developments in the current City OPA. Land use used for the 2031 scenario is illustrated on Drawing LU‐2, located in Appendix A.
The third scenario is the projected 2051 development. This scenario is not part of an official plan; it is designed to show the potential impact of full build‐out of the remaining City White Belt Lands, as shown on Drawing LU‐3, located in Appendix A. This scenario is meant to demonstrate the long term sustainability of the SWM criteria recommended in the Master Plan report.
3.0 Model Parameters
3.1. Links and Nodes
The links in PCSWMM represent the main channel and branches of Rainbow Creek, nodes represent locations where flows enter the creek. The Links and nodes for the Rainbow Creek Model were taken from the Humber River Watershed Model, (AMEC 2012). As the Rainbow Creek Model has incorporated additional detailed hydrology extra nodes were added to the model. The channel was also modified in some locations based on survey data collected by Cole Engineering.
3.2. Drainage Boundaries
The existing drainage boundaries were delineated from a digital elevation model (DEM) that was conditioned using detailed topography survey work and using Cole Engineering’s MicroDrainge tool. This tool defines the area draining to a specified point based on a DEM, stream path, flow direction and flow accumulation. The DEM surface contains topographic information and is conditioned to reflect known road crossings such as bridges and culverts. The stream path, flow direction and flow accumulation files contain data on overland flow and the small streams and ditches which collect and convey runoff. Drainage area plans for the Baseline Scenario (DAP‐1), 2031 Scenario (DAP‐2) and the 2051 Scenario (DAP‐3) are located in Appendix A. Tables listing the model parameters used for each drainage area are located in Appendix B.
For the baseline model (existing and approved development to 2012) these boundaries were updated using approved drainage area plans for existing and approved ponds with the Rainbow Creek Subwatershed.
For the 2031 model drainage boundaries in the West Vaughan Employment Area and the Kleinburg‐Nashville Development were modified to match the drainage areas in the functional servicing reports (Draft City of Vaughan Stormwater Management Master Plan, Cole Engineering Ltd., 2012).

City of Vaughan City of Vaughan Storm Drainage SWM Master Plan Rainbow Creek Update Study
W11-259 (June 2014) Page 6 of 31
For the 2051 model drainage boundaries in the White Belt Area were defined base on existing topography. These areas were further refined based on factors that would limit development such as natural features and utilities corridors.
3.3. Land use
For the purpose of this study existing land use was determined using 2011 aerial photography provided by the City. Land uses that have been approved as part of the 2008 Official Plan have been added to the existing land use in order to create a 2012 land use layer. This layer was use for the existing conditions model, as approved developments will not be subject to the SWM criteria recommended in this report. The existing land use is shown on the Existing Land Use Map (Drawing LU‐1) located in Appendix A. The parameters used in modeling each type of land use are located in Appendix B.
The 2031 land use determined using the following sources:
City of Brampton • The City of Brampton Official Plan, October 7, 2008; • Highway 427 Industrial Secondary Plan (Area 47), Preliminary Land Use Concept, April 19, 2011; and,
• Brampton East Secondary Plan, Sub Area 1, The Neighbourhood of Castlemore Crossing, October 22, 2008.
Town of Caledon • Town of Caledon Official Plan, December 31, 2008 Consolidation.
For areas within the City of Vaughan, 2031 development was based on the proposed land use for the West Vaughan Employment Area and Kleinburg‐Nashville communities. Functional Servicing Reports for these areas are being prepared as part of the ongoing City of Vaughan SWM Plan which is being prepared by Cole Engineering. The 2031 land use is shown on the 2031 Land Use Map (Drawing LU‐2), located in Appendix A.
For 2051 future full built‐out of the White Belt Lands was assumed to be fully developed. As there is no official plan for 2051, land use was assumed based on the land use for the surrounding areas. For example the White Belt Block adjacent to the commercial development was assumed to be commercial developments in 2051. Areas which are currently zoned for open space conservation, environmentally protected areas, greenbelt areas and flood line buffer zones were assumed to remain in their natural state. It was assumed that no changes would be made to the utility corridor. The 2051 land use is shown on the 2051 Land Use Map (Drawing LU‐3), located in Appendix A.
As there was no detailed design information available for the Highway 427 extension corridor it was modelled as open space for all three (3) scenarios for consistency. As the objective of this study is to determine the impacts of future growth in the City, maintaining a consistent land use for the highway lands allows for the comparison of peak flows directly related to future growth within the City and not outside influences.

City of Vaughan City of Vaughan Storm Drainage SWM Master Plan Rainbow Creek Update Study
W11-259 (June 2014) Page 7 of 31
3.4. Soils Mapping
The Green‐Ampt Hydrology method uses three (3) soil parameters, namely Hydraulic conductivity, Suction head, and, initial deficit.
These values were assigned based on Table 26.2 of the User’s Guide to SWMM5 (12th edition, 2008). Soils information was obtained from:
• The Soil Survey of York County, Report No. 19 of the Ontario soil Survey, Agriculture Canada – Research Branch in conjunction with the Ontario Ministry of Agriculture and Food, 1955; and,
• The Soil Survey of Peel County, report No. 18 of the Ontario soil Survey, Agriculture Canada – Research Branch in conjunction with the Ontario Ministry of Agriculture and Food, 1953.
Figure RC‐3, following the report, shows the soils within the Rainbow Creek Subwatershed. A table listing the soils parameters used for each soil type is located in Appendix B.
3.5. Stormwater Management Facilities
Information on the existing SWM facilities was taken from the City of Vaughan’s System Wide Maintenance Software (SWMSoft) database. SWMsoft was developed to provide easy access to all the drawings, reports, pictures, inspections and maintenance information about each facility and facility component. The inventory of SWM facilities within the City of Vaughan was previously completed by Clarifica Inc. in 2007. A total of 53 facilities with a permanent pool storage component were surveyed and added to the SWMsoft database as part of the initial survey. The City has continued to update this database as new ponds are assumed by the City.
The available information for the ponds in the SWMsoft database ranges from full reports and drawings to brief verbal descriptions. For ponds with incomplete data stage storage curves were created based on the SWMsoft survey drawings. Stage‐discharge curves were calculated using the SWM criteria that was in place at the time the pond was constructed. 12 ponds were added to the model using information from the City of Vaughan SWMsoft database. 10 additional ponds were added to the model using information on approved developments provided by the City.
Information for the three (3) existing ponds within the Town of Caledon was taken from Town of Caledon’s SWMsoft database. As with the City of Vaughan SWMsoft database not all the ponds have complete information, so stage‐storage and stage‐discharge curves were calculated based on the available information. Only one (1) pond was added to the existing conditions model for the City of Brampton; this pond is under construction as part of the neighbourhood of Castlemore Crossing. This pond represents two (2) ponds shown in the Brampton East Secondary Plan and was assumed to provide quantity and quality control for flows from Sub‐catchments BR‐01 and BR‐02.
Existing ponds are shown on the Existing Land Use Map (Drawing LU‐1), located in Appendix A. Please refer to Appendix B, for details on the references and assumptions used to model each pond.
City of Vaughan City of Vaughan Storm Drainage SWM Master Plan Rainbow Creek Update Study
W11-259 (June 2014) Page 8 of 31
For the 2031 scenario 16 ponds and 14 on‐site storage locations were added within the City of Vaughan. Design parameters for these ponds and on‐site storage units were taken from the Functional SWM Plan for the West Vaughan Employment Area and Kleinburg‐Nashville development Area. These ponds and on‐site storage areas have been designed to demonstrate a feasible design for SWM in these areas. The Visual Otthymo V‐2.4 (VO2) modeling files used to calculate the stage‐storage‐outflow curves for these ponds / on‐site storage units are located in Appendix B.
Eight (8) ponds were added to the model within the City of Brampton and the Town of Caledon. These ponds are for modeling purposes only and may not be in the locations show on Secondary plans or in the official plans for the Town of Caledon and the City of Brampton. These ponds have been added to the model so as to have the same design criteria applied to the entire watershed. The VO2 modeling files used to calculate the stage‐storage‐outflow curves for these ponds / on‐site storage units are located in Appendix B.
All 2031 ponds have been designed to control post development flows to the Unit flow rates recommended in the Humber River Watershed Hydrology / Hydraulics and S Study – Aquafor Beech Limited, April 1997. A copy of the Unit flow rate equations for Rainbow Creek is located in Appendix B.
15 ponds / storage units were added within the City of Vaughan for the 2051 scenario. The 2051 scenario is not as detailed as the 2031 modeling, locations and types of storage have not been defined for individual areas. As with the 2031 ponds the 2051 ponds / storage units have been designed to control post development flows to Unit flow rates. The VO2 modeling files used to calculate the stage‐storage‐outflow curves for these ponds / on‐site storage units are located in Appendix B.
4.0 Models
4.1. Quantity Control Model
Analysis of the Humber River Watershed as a whole (Hydrology / Hydraulics and SWM Study, Humber River Watershed, Aquafor Beech Limited, April 1997) has shown that controlling post‐development flows to pre‐development levels for tributaries draining directly to the main Branches of the Humber River will not provide the required peak flow reduction for the Humber River. In order to maintain pre‐development flows within the Humber River unit flow rates equations were developed for different locations within the Humber Watershed, which result in post to pre‐development peak flow control for the Humber River. These unit flow rates provide a consistent means of pre‐development peak flow estimation and ensure target peak flows are met within individual sub‐basins.
As Rainbow Creek is part of the Humber Watershed any changes to the quantity control requirements for Rainbow Creek would have to be evaluated in terms of there effect on the Humber River. As the analysis of the Humber River is outside the scope of the current project, the quantity control analysis has been limited to verifying that unit flow rates will provide sufficient quantity control within Rainbow Creek. The 2‐year through 100‐year 12 hour AES design storms used in the Aquafor Beech Study were used for this analysis. The results of this analysis are discussed in Section 5.1.

City of Vaughan City of Vaughan Storm Drainage SWM Master Plan Rainbow Creek Update Study
W11-259 (June 2014) Page 9 of 31
4.2. Regional Regulatory Event Model
The regulatory flood event for the Rainbow Creek sub‐catchment is Hurricane Hazel, which is the regional storm for much of Southern Ontario. Hurricane Hazel hit Southern Ontario in November 1954, the storm consisted of two (2) days of low intensity rain (2 mm/hr) followed by 13 hours of higher intensity rainfall. The first two (2) days of rain saturated soils and filled SWM facilities. Historically it has been assumed that the effect of the initial rainfall would cause pervious areas to be equivalent to impervious areas during the last day of the storm and therefore increased the impervious area would have no effect on regional flows.
In order to generate peak flows for the regional event all SWM facilities are removed from the model. This is a conservative approach based on the assumption that the initial rainfall will fill these facilities and runoff will be essentially uncontrolled during the final days of the storm. The model was run for five (5) days, to allow water from the upper reaches of the watershed to reach the outlet. The results of this analysis are discussed in Section 5.2.
4.3. Erosion Control Model
For the erosion analysis in Rainbow Creek Water’s Edge Environmental Solutions Team (Water’s Edge) was hired to calculate erosion thresholds for reaches downstream of proposed SWM facilities. These thresholds represent the flow at which erosion will begin occurring for a specific reach. Locations downstream of proposed SWM facilities were chosen as the SWM facilities will concentrate flow from a large area and release it over a longer period of time than would occur under natural conditions. This concentrated low flow can increase the length of time that erosive flow occurs if the downstream reach has a low erosion threshold.
A continuous model with 33 years of rainfall data was run and the number of exceedances (number of events generating flows which exceed the erosion threshold) and hours of exceedance (total hours the erosion threshold is exceeded) was graphed at each location. This modeling was completed for the baseline condition and then for the 2031 land use scenario with the following erosion control criteria for the proposed ponds:
• 24 hour drawdown time for the first 25 mm; • 48 hour drawdown time for the first 25 mm; • 72 hour drawdown time for the first 25 mm; • 5 mm on‐site detention; and, • 10 mm onsite detention.
The results of this modeling are discussed in Section 5.5.
City of Vaughan City of Vaughan Storm Drainage SWM Master Plan Rainbow Creek Update Study
W11-259 (June 2014) Page 10 of 31
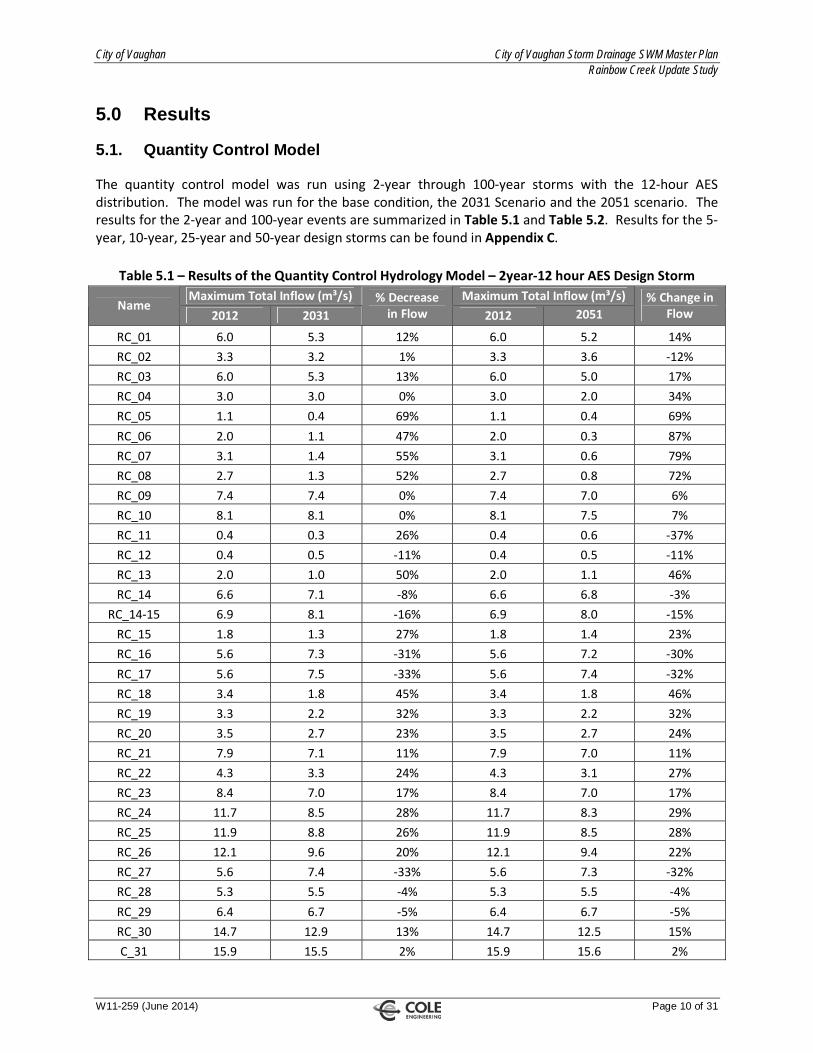
5.0 Results
5.1. Quantity Control Model
The quantity control model was run using 2‐year through 100‐year storms with the 12‐hour AES distribution. The model was run for the base condition, the 2031 Scenario and the 2051 scenario. The results for the 2‐year and 100‐year events are summarized in Table 5.1 and Table 5.2. Results for the 5‐year, 10‐year, 25‐year and 50‐year design storms can be found in Appendix C.
Table 5.1 – Results of the Quantity Control Hydrology Model – 2year‐12 hour AES Design Storm Maximum Total Inflow (m³/s) Maximum Total Inflow (m³/s)
Name 2012 2031
% Decrease in Flow 2012 2051
% Change in Flow
RC_01 6.0 5.3 12% 6.0 5.2 14% RC_02 3.3 3.2 1% 3.3 3.6 ‐12% RC_03 6.0 5.3 13% 6.0 5.0 17% RC_04 3.0 3.0 0% 3.0 2.0 34% RC_05 1.1 0.4 69% 1.1 0.4 69% RC_06 2.0 1.1 47% 2.0 0.3 87% RC_07 3.1 1.4 55% 3.1 0.6 79% RC_08 2.7 1.3 52% 2.7 0.8 72% RC_09 7.4 7.4 0% 7.4 7.0 6% RC_10 8.1 8.1 0% 8.1 7.5 7% RC_11 0.4 0.3 26% 0.4 0.6 ‐37% RC_12 0.4 0.5 ‐11% 0.4 0.5 ‐11% RC_13 2.0 1.0 50% 2.0 1.1 46% RC_14 6.6 7.1 ‐8% 6.6 6.8 ‐3%
RC_14‐15 6.9 8.1 ‐16% 6.9 8.0 ‐15% RC_15 1.8 1.3 27% 1.8 1.4 23% RC_16 5.6 7.3 ‐31% 5.6 7.2 ‐30% RC_17 5.6 7.5 ‐33% 5.6 7.4 ‐32% RC_18 3.4 1.8 45% 3.4 1.8 46% RC_19 3.3 2.2 32% 3.3 2.2 32% RC_20 3.5 2.7 23% 3.5 2.7 24% RC_21 7.9 7.1 11% 7.9 7.0 11% RC_22 4.3 3.3 24% 4.3 3.1 27% RC_23 8.4 7.0 17% 8.4 7.0 17% RC_24 11.7 8.5 28% 11.7 8.3 29% RC_25 11.9 8.8 26% 11.9 8.5 28% RC_26 12.1 9.6 20% 12.1 9.4 22% RC_27 5.6 7.4 ‐33% 5.6 7.3 ‐32% RC_28 5.3 5.5 ‐4% 5.3 5.5 ‐4% RC_29 6.4 6.7 ‐5% 6.4 6.7 ‐5% RC_30 14.7 12.9 13% 14.7 12.5 15% C_31 15.9 15.5 2% 15.9 15.6 2%

City of Vaughan City of Vaughan Storm Drainage SWM Master Plan Rainbow Creek Update Study
W11-259 (June 2014) Page 11 of 31
Table 5.2 – Results of the Quantity Control Hydrology Model – 100‐year‐12hour AES Design Storm Maximum Total Inflow (m³/s) Maximum Total Inflow (m³/s)
2012 2031 % Decrease in Flow 2012 2051
% Decrease in Flow
RC_01 19.54 16.81 14% 19.54 16.01 18% RC_02 12.68 12.62 1% 12.68 8.96 29% RC_03 18.79 16.89 10% 18.79 15.36 18% RC_04 18.01 17.49 3% 18.01 9.59 47% RC_05 4.14 0.98 76% 4.14 0.98 76% RC_06 7.13 3.41 52% 7.13 1.15 84% RC_07 12.63 4.56 64% 12.63 2.24 82% RC_08 11.23 4.32 62% 11.23 2.60 77% RC_09 38.82 36.48 6% 38.82 27.64 29% RC_10 45.97 40.28 12% 45.97 29.84 35% RC_11 5.31 2.13 60% 5.31 2.04 62% RC_12 5.86 1.69 71% 5.86 1.69 71% RC_13 9.08 5.10 44% 9.08 4.34 52% RC_14 43.84 40.51 8% 43.84 30.46 31%
RC_14‐15 46.57 43.69 6% 46.57 33.64 28% RC_15 10.19 5.63 45% 10.19 4.98 51% RC_16 44.86 47.86 ‐7% 44.86 35.88 20% RC_17 42.63 44.49 ‐4% 42.63 34.62 19% RC_18 12.62 6.39 49% 12.62 6.38 49% RC_19 14.04 7.72 45% 14.04 7.76 45% RC_20 16.23 9.79 40% 16.23 9.80 40% RC_21 25.96 19.39 25% 25.96 19.34 25% RC_22 18.56 11.98 35% 18.56 11.99 35% RC_23 27.67 18.85 32% 27.67 18.59 33% RC_24 46.52 29.04 38% 46.52 28.73 38% RC_25 47.26 30.46 36% 47.26 30.02 36% RC_26 51.35 36.34 29% 51.35 35.92 30% RC_27 39.58 40.65 ‐3% 39.58 32.58 18% RC_28 14.75 15.00 ‐2% 14.75 15.00 ‐2% RC_29 27.44 25.73 6% 27.44 26.24 4% RC_30 66.17 64.00 3% 66.17 54.26 18% RC_31 69.62 62.89 10% 69.62 58.25 16%
There is an increase in flow south of Block 61 for smaller storm events and this increase is due to the development of Bock 61. The pond design used for Block 61 is preliminary. It is recommended that the Block 61 ponds be updated once the pond design is finalized. In all other areas pond designed to unit flow rates result in flows which are no more than 5% greater then pre‐development levels and in most cases lower than pre‐development. For larger storms the unit flow rates control flows to pre‐development levels and there is no increase in runoff south of Block 61.

City of Vaughan City of Vaughan Storm Drainage SWM Master Plan Rainbow Creek Update Study
W11-259 (June 2014) Page 12 of 31
5.2. Regional Storm Model
The results of the hydrology analysis for the regional storm are presented in Table 5.3 and Table 5.4. The locations of the nodes are shown on the attached drainage area plans. These results of the hydrology update indicate that the post development flows are largely consistent with the baseline condition for both the 2031 and 2051 development scenarios. Some local changes in peak flows were observed; however these are generally within 10% of the baseline flows for the portion of the Rainbow Creek sub‐watershed located in the City of Vaughan.
Table 5.3 – Results of the Regional storm Hydrology model – 2031 Development conditions Peak Flows
Node ID Approved and Existing Conditions
(m3/s)
2031 Development
(m3/s)
Increase % Location
RC_01 42.9 42.9 ‐0.01 West Robinson Creek RC_02 25.9 25.9 0.03 West Robinson Creek RC_03 44.7 45.0 0.57 West Robinson Creek RC_04 51.5 49.5 ‐3.88 West Robinson Creek RC_05 6.1 10.5 70.84 West Robinson Creek – Brampton RC_06 10.6 9.7 ‐7.77 West Robinson Creek RC_07 18.5 21.7 17.55 West Robinson Creek – Brampton RC_08 20.8 23.2 11.38 West Robinson Creek RC_09 124.0 120.3 ‐2.99 West Robinson Creek RC_10 150.4 144.7 ‐3.77 West Robinson Creek RC_11 14.2 27.4 92.26 East Robinson Creek 1 RC_12 15.3 7.8 ‐48.80 East Robinson Creek 1 RC_13 31.5 38.6 22.39 East Robinson Creek 1 RC_14 152.2 148.4 ‐2.51 West Robinson Creek
RC_14‐15 180.2 174.2 ‐3.34 Robinson Creek RC_15 35.1 42.0 19.68 East Robinson Creek RC_16 172.8 173.8 0.56 Robinson Creek RC_17 173.9 174.8 0.50 Robinson Creek RC_18 31.2 34.1 9.44 Brampton – West Rainbow Creek RC_19 38.3 46.1 20.27 Brampton – West Rainbow Creek RC_20 48.8 54.4 11.46 Brampton – West Rainbow Creek RC_21 50.3 48.9 ‐2.82 East Rainbow Creek RC_22 52.6 58.2 10.60 Brampton – West Rainbow Creek RC_23 63.0 59.2 ‐6.00 East Rainbow Creek RC_24 130.3 141.3 8.46 Rainbow Creek RC_25 141.4 152.1 7.53 Rainbow Creek RC_26 179.3 187.2 4.40 Rainbow Creek RC_27 169.3 171.5 1.32 Robinson Creek RC_28 20.6 20.6 0.06 Unnamed Tributary RC_29 55.3 55.4 0.03 Plunkett Creek RC_30 305.6 321.1 5.07 Plunkett Creek RC_31 346.3 361.5 4.40 Plunkett Creek
Note 1: Downstream of Block 61

City of Vaughan City of Vaughan Storm Drainage SWM Master Plan Rainbow Creek Update Study
W11-259 (June 2014) Page 13 of 31
Table 5.4 – Results of the Regional storm Hydrology model – 2051 Development conditions Peak Flows
Node ID Approved and Existing Conditions (m3/s)
2031 Development
(m3/s)
Increase % Location
RC_01 42.9 43.8 1.91 West Robinson Creek RC_02 25.9 28.2 8.62 West Robinson Creek RC_03 44.7 44.0 ‐1.62 West Robinson Creek RC_04 51.5 54.1 5.01 West Robinson Creek RC_05 6.1 10.5 70.84 West Robinson Creek – Brampton RC_06 10.6 9.8 ‐7.60 West Robinson Creek RC_07 18.5 21.6 16.99 West Robinson Creek – Brampton RC_08 20.8 23.2 11.47 West Robinson Creek RC_09 124.0 128.4 3.62 West Robinson Creek RC_10 150.4 155.3 3.29 West Robinson Creek RC_11 14.2 31.3 119.48 East Robinson Creek 1 RC_12 15.3 7.8 ‐48.81 East Robinson Creek 1 RC_13 31.5 42.2 34.04 East Robinson Creek 1 RC_14 152.2 159.9 5.09 West Robinson Creek
RC_14‐15 180.2 192.5 6.77 Robinson Creek RC_15 35.1 45.2 28.53 East Robinson Creek RC_16 172.8 188.8 9.22 Robinson Creek RC_17 173.9 191.6 10.16 Robinson Creek RC_18 31.2 34.2 9.60 Brampton – West Rainbow Creek RC_19 38.3 46.2 20.49 Brampton – West Rainbow Creek RC_20 48.8 54.5 11.72 Brampton – West Rainbow Creek RC_21 50.3 48.9 ‐2.75 East Rainbow Creek RC_22 52.6 58.4 10.94 Brampton – West Rainbow Creek RC_23 63.0 59.2 ‐5.96 East Rainbow Creek RC_24 130.3 141.9 8.89 Rainbow Creek RC_25 141.4 152.7 7.96 Rainbow Creek RC_26 179.3 184.3 2.76 Rainbow Creek RC_27 169.3 186.3 10.09 Robinson Creek RC_28 20.6 20.6 0.06 Unnamed Tributary RC_29 55.3 55.4 0.03 Plunkett Creek RC_30 305.6 329.2 7.72 Plunkett Creek RC_31 346.3 369.3 6.66 Plunkett Creek
Note 1: Downstream of Block 61
The future development areas of the City of Brampton within the Rainbow Creek Subwatershed are primarily agricultural land. The assumption made for the 2031 model had converted the proposed land use for employment purposes. This is a conservative assumption and more detailed analysis as part of future study for this area is recommended to consider development density and net developable areas prior to prescribing flood controls.
City of Vaughan City of Vaughan Storm Drainage SWM Master Plan Rainbow Creek Update Study
W11-259 (June 2014) Page 14 of 31
The west branch of Rainbow Creek, located primarily in the City of Brampton, indicates the potential for some localized increases in flow for both the 2031 and 2051 scenarios. This increase is localized to the headwater reaches and becomes less apparent downstream, becoming consistent with existing flood flows shortly after crossing the Brampton City Limits (Highway 50). As an example, the percent change in flows at node RC_05 appears large, however the baseline flows are low (6.1 m3/s), which means even a small increase in flow (three (3) – four (4) m3/s) will represent a sizeable increase in terms of percentage.
The development plan for Block 61 included a re‐alignment of Rainbow Creek which results in a change of tributary drainage areas to the two (2) tributaries which flow through Block 61. This results in an increase in flow to node RC_11 and a decrease of flow at node RC_12. The confluence of the two (2) channels from Block 61 occurs just south of McGillivray Road and the increase in flow becomes less pronounced down stream of this confluence and is less than a 10% increase south of Rutherford Road. It is our understanding, based on discussion with the TRCA, that the Block 61 development will include storage for Regional Controls which were not included in this model.
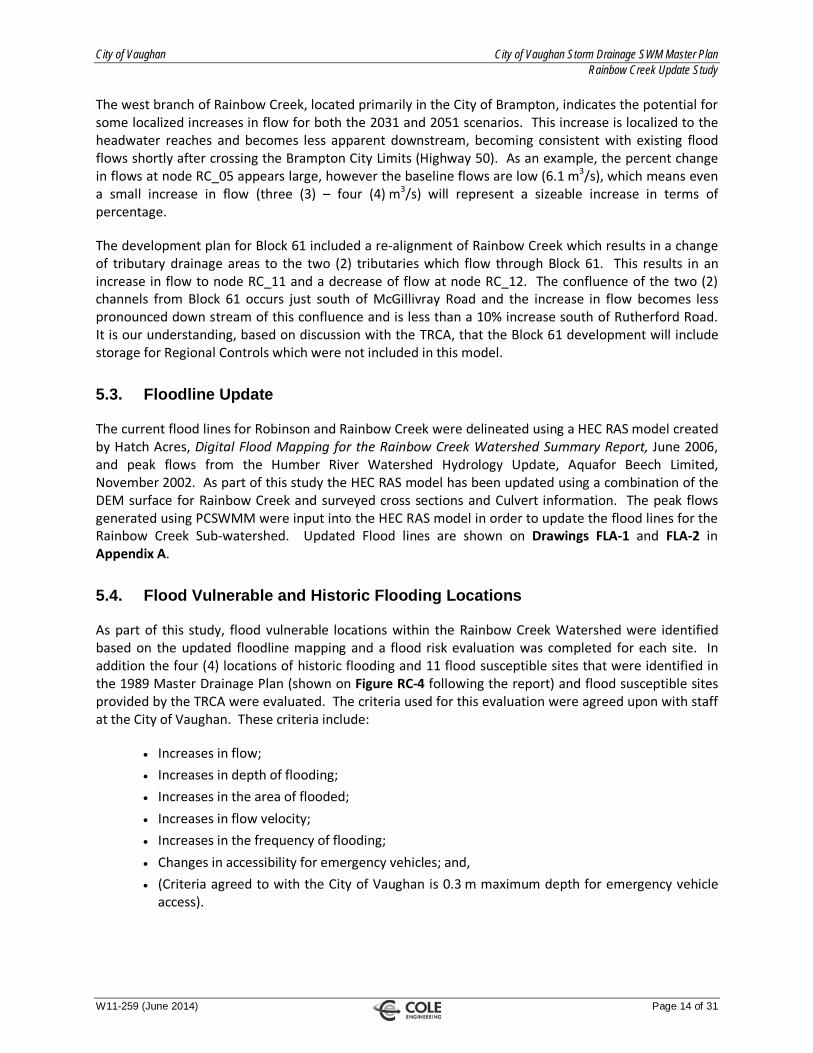
5.3. Floodline Update
The current flood lines for Robinson and Rainbow Creek were delineated using a HEC RAS model created by Hatch Acres, Digital Flood Mapping for the Rainbow Creek Watershed Summary Report, June 2006, and peak flows from the Humber River Watershed Hydrology Update, Aquafor Beech Limited, November 2002. As part of this study the HEC RAS model has been updated using a combination of the DEM surface for Rainbow Creek and surveyed cross sections and Culvert information. The peak flows generated using PCSWMM were input into the HEC RAS model in order to update the flood lines for the Rainbow Creek Sub‐watershed. Updated Flood lines are shown on Drawings FLA‐1 and FLA‐2 in Appendix A.
5.4. Flood Vulnerable and Historic Flooding Locations
As part of this study, flood vulnerable locations within the Rainbow Creek Watershed were identified based on the updated floodline mapping and a flood risk evaluation was completed for each site. In addition the four (4) locations of historic flooding and 11 flood susceptible sites that were identified in the 1989 Master Drainage Plan (shown on Figure RC‐4 following the report) and flood susceptible sites provided by the TRCA were evaluated. The criteria used for this evaluation were agreed upon with staff at the City of Vaughan. These criteria include:
• Increases in flow; • Increases in depth of flooding; • Increases in the area of flooded; • Increases in flow velocity; • Increases in the frequency of flooding; • Changes in accessibility for emergency vehicles; and, • (Criteria agreed to with the City of Vaughan is 0.3 m maximum depth for emergency vehicle access).
City of Vaughan City of Vaughan Storm Drainage SWM Master Plan Rainbow Creek Update Study
W11-259 (June 2014) Page 15 of 31
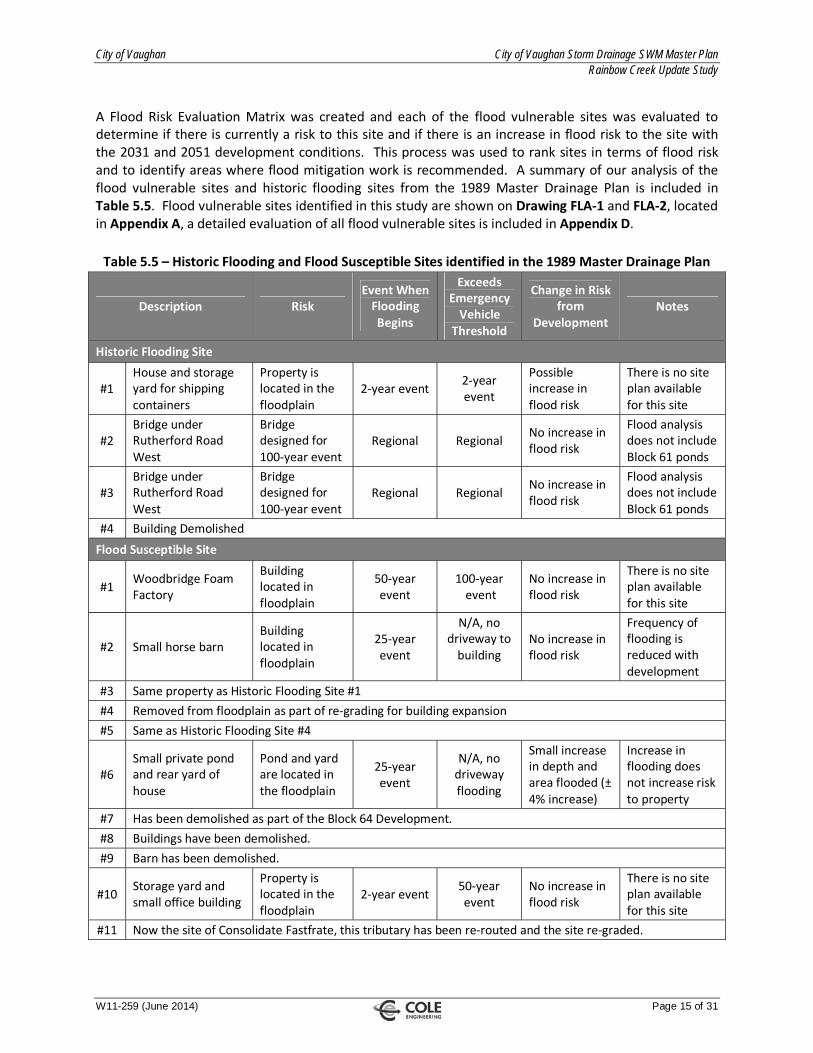
A Flood Risk Evaluation Matrix was created and each of the flood vulnerable sites was evaluated to determine if there is currently a risk to this site and if there is an increase in flood risk to the site with the 2031 and 2051 development conditions. This process was used to rank sites in terms of flood risk and to identify areas where flood mitigation work is recommended. A summary of our analysis of the flood vulnerable sites and historic flooding sites from the 1989 Master Drainage Plan is included in Table 5.5. Flood vulnerable sites identified in this study are shown on Drawing FLA‐1 and FLA‐2, located in Appendix A, a detailed evaluation of all flood vulnerable sites is included in Appendix D.
Table 5.5 – Historic Flooding and Flood Susceptible Sites identified in the 1989 Master Drainage Plan
Description Risk Event When Flooding Begins
Exceeds Emergency Vehicle
Threshold
Change in Risk from
Development Notes
Historic Flooding Site
#1 House and storage yard for shipping containers
Property is located in the floodplain
2‐year event 2‐year event
Possible increase in flood risk
There is no site plan available for this site
#2 Bridge under Rutherford Road West
Bridge designed for 100‐year event
Regional Regional No increase in flood risk
Flood analysis does not include Block 61 ponds
#3 Bridge under Rutherford Road West
Bridge designed for 100‐year event
Regional Regional No increase in flood risk
Flood analysis does not include Block 61 ponds
#4 Building Demolished
Flood Susceptible Site
#1 Woodbridge Foam Factory
Building located in floodplain
50‐year event
100‐year event
No increase in flood risk
There is no site plan available for this site
#2 Small horse barn Building located in floodplain
25‐year event
N/A, no driveway to building
No increase in flood risk
Frequency of flooding is reduced with development
#3 Same property as Historic Flooding Site #1 #4 Removed from floodplain as part of re‐grading for building expansion #5 Same as Historic Flooding Site #4
#6 Small private pond and rear yard of house
Pond and yard are located in the floodplain
25‐year event
N/A, no driveway flooding
Small increase in depth and area flooded (± 4% increase)
Increase in flooding does not increase risk to property
#7 Has been demolished as part of the Block 64 Development. #8 Buildings have been demolished. #9 Barn has been demolished.
#10 Storage yard and small office building
Property is located in the floodplain
2‐year event 50‐year event
No increase in flood risk
There is no site plan available for this site
#11 Now the site of Consolidate Fastfrate, this tributary has been re‐routed and the site re‐graded.

City of Vaughan City of Vaughan Storm Drainage SWM Master Plan Rainbow Creek Update Study
W11-259 (June 2014) Page 16 of 31
Based on our evaluation, the majority of the sites identified as flood susceptible sites do not require any flood remediation work. For most sites there is little or no increase in flood risk. For instance road crossings sized for the 100‐year event which flood during a regional storm are designated as having an acceptable level of risk. Also sites where there is flooding that does not affect buildings or accessibility to emergency vehicles are deemed to have an acceptable level of risk. Figures 1 through 14 in Appendix D show the flood vulnerable sites with a higher level of risk or an increase in flooding; recommendations for these sites are as follows:
Flood Vulnerable Road 7 (FVR #7) This is a culvert located under Highway 27, north of Langstaff Road. Under existing conditions this culvert, which is designed to pass runoff from a 100‐year storm, floods during the regional event. The depth of flooding is under a foot which would allow access for emergency vehicles. Under the 2031 the flooding remains unchanged; however the 2051 development scenario results in a flooding depth of 0.36 m, which may prohibit emergency vehicle access. We recommend that this culvert be re‐evaluated as part of the next Rainbow Creek Update Study.
Flood Vulnerable Road 14 (FVR #14), Flood Vulnerable Structure 24 (FVS #24) This site was identified in the 1989 Master Drainage Plan as Flood Susceptible Site #3 and Historic Flooding Site #1. This site includes a house located south of a storage yard for shipping containers. The creek has been filled in and realigned; the entire property is located within the floodplain. This culvert conveys flows under McGillivray Road to the realigned Creek. This section of McGillivray Road is located in the floodplain and both the road and property begin flooding at the 2‐year event. This section of road and the adjacent property becomes inaccessible to emergency vehicles during the 25‐year event. Although there is little increase in flooding depth with development there is an increase in flows and velocity. This increase in velocity, along with the high frequency of flooding in this area, warrants further investigation. We recommend that a more detailed investigation, including a detailed survey of the site, road and adjacent section of Rainbow Creek, be completed in order to determine the best solution for the flooding on this site. Recommendations for this site could include:
• Flood proofing buildings on the site; • Increasing the capacity of the realigned channel; • Raising the road and increasing the culvert size; and, • Building landforms to protect the buildings on this site.
It should be noted that this culvert is a few meters downstream of a culvert under raised CP railroad tracks. The raised railroad tracks act as a barrier and water is forced through the smaller culvert and over the road. There is visible damage to the road and to the channel downstream of this culvert and we recommend that this site be a priority for future work.
Flood Vulnerable Road 16 (FVR #16) This culvert is located under Major Mackenzie Drive, west of the CP railway and south of Block 61. The increase in flow is due to the planned realignment of Rainbow Creek as part of the Block 61 development, which will increase the tributary drainage area to this culvert. Our analysis does not include the proposed SWM facilities for Block 61, which will provide some storage for the regional event. We recommend that this culvert be re‐evaluated once the Block 61 design is approved.

City of Vaughan City of Vaughan Storm Drainage SWM Master Plan Rainbow Creek Update Study
W11-259 (June 2014) Page 17 of 31
Flood Vulnerable Road 24 (FVR #24) This culvert is located under McGillivray Road, east of Huntington Road and south of Block 61. The increase in flow is due to the Block 61 development, which will increase the flows to this culvert. The flooding at this culvert is minor (4 cm – 6 cm), only occurring under 2031 and 2051 development conditions and does not affect accessibility for emergency vehicles. Our analysis does not include the proposed SWM facilities for Block 61, which will provide some storage for the regional event. We recommend that this culvert be re‐evaluated once the Block 61 design is approved.
Flood Vulnerable Structure 1 (FVS #1) This site, located at 7231 Martin Grove Road, consists of a Private Driveway and some barns and sheds. Our analysis shows that under existing conditions this site begins to flood during a 5‐year event and becomes inaccessible to emergency vehicles during the 25‐year event. Although there is no increase in flooding with the 2031 and 2051 events, the frequency of flooding under existing conditions should be addressed. We recommend that a more detailed investigation, including a detailed survey of the site, adjacent road and adjacent portion of Rainbow Creek, be completed in order to determine the best solution for the flooding on this site. Recommendations for this site could include:
• Flood proofing buildings on the site; • Building landforms to protect the buildings on this site; and, • Increasing the size of the driveway culvert.
Flood Vulnerable Structure 6 (FVS #6) This site is the Woodbridge Foam factory located on Meeting House Road. This site was identified in the 1989 Master Plan as Flood Susceptible Site #1. Our analysis shows the building as being partially in the floodplain; however the contours from the DEM do not appear to match the site. There is no site plan available for this site. We recommend that a more detailed investigation, including a detailed survey of the site and adjacent section of Rainbow Creek, be completed in order to determine the best solution for the flooding on this site. Recommendations for this site could include:
• Flood proofing buildings on the site; and, • Building landforms to protect the buildings on this site.
Flood Vulnerable Structure 7 (FVS #7) This site includes 15 single family homes on the south end of Woodcroft Lane and Blossom Court. Under existing conditions the flooding occurs during the regional event and extends into the rear yards of 12 homes and the front yards of three (3) homes on Woodcroft Lane. Our analysis shows two (2) houses that will be impacted by flooding from rear yards. There is a small increase in flood depth due to development in the 2031 (1 cm) and 2051 (9 cm) scenarios.
It should be noted that the grades used in our analysis were based on design drawings from 1982, which were provided by the City in order to refine the DEM surface. These grades show the lots and homes were built bellow the current (TRCA, 2006) floodplain elevation of 166.51 m. These lots are privately owned and it is probable that some of the grading has been changed by the owners during the past 30 years.

City of Vaughan City of Vaughan Storm Drainage SWM Master Plan Rainbow Creek Update Study
W11-259 (June 2014) Page 18 of 31
It should also be noted that the floodplain elevation calculated for the 2051 scenario as part of this report is 166.39 m, which is lower than the current TRCA elevation of 166.51 m. Given the age of the topographic data used in this study and the nature of this development, we recommend that a more detailed investigation, including a detailed survey of the site and adjacent section of Rainbow Creek, be completed in order to determine the extent of the flooding and the best solution for the flooding on this site. This investigation should occur prior to the approval of the projected 2051 development. Recommendations for this site could include:
• Flood proofing homes impacted by rear yard flooding; • Re‐grading yards to take them out of the floodplain; and, • Building landforms.
Flood Vulnerable Structure 8 (FVS #8) This site includes nine (9) single family homes on the north end of Woodcroft Lane. Under existing conditions the flooding during the regional event extends into the rear yards of these homes, our analysis does not show any houses in this area that may be impacted by flooding from rear yards. There is a small increase in flood depth due to development in the 2031 (1 cm) and 2051 (10 cm) scenarios.
It should be noted that the grades used in our analysis were based on design drawings from 1982, which were provided by the City in order to refine the DEM surface. These grades show the lots and homes were built bellow the current (TRCA, 2006) floodplain elevation of 166.51 m. These lots are privately owned and it is probable that some of the grading has been changed by the Owners during the past 30 years.
It should also be noted that the floodplain elevation calculated for the 2051 scenario as part of this report is 166.57 m, which is lower than the current TRCA elevation of 166.84 m. Given the age of the topographic data used in this study and the nature of this development, we recommend that a more detailed investigation, including a detailed survey of the site and adjacent section of Rainbow Creek, be completed in order to determine the extent of the flooding and the best solution for the flooding on this site. This investigation should occur prior to the approval of the projected 2051 development. Recommendations for this site could include:
• Re‐grading yards to take them out of the floodplain; and, • Building landforms.
Flood Vulnerable Structure 13 (FVS #13) This site is a small horse barn located at 9290 McGillivray Road and was identified in the 1989 Master Plan as Flood Susceptible Site #2. Under existing conditions the building begins to flood during the 25‐year event and reaches a depth of 1.6 m during the regional event. There is a small increase (4 cm) in flood depth due to development in the 2031 and 2051 scenarios. With this structure being located well into the floodplain there are no practical solutions for preventing flooding. It is recommended that the building be Flood proofed to prevent damage from flooding.
City of Vaughan City of Vaughan Storm Drainage SWM Master Plan Rainbow Creek Update Study
W11-259 (June 2014) Page 19 of 31
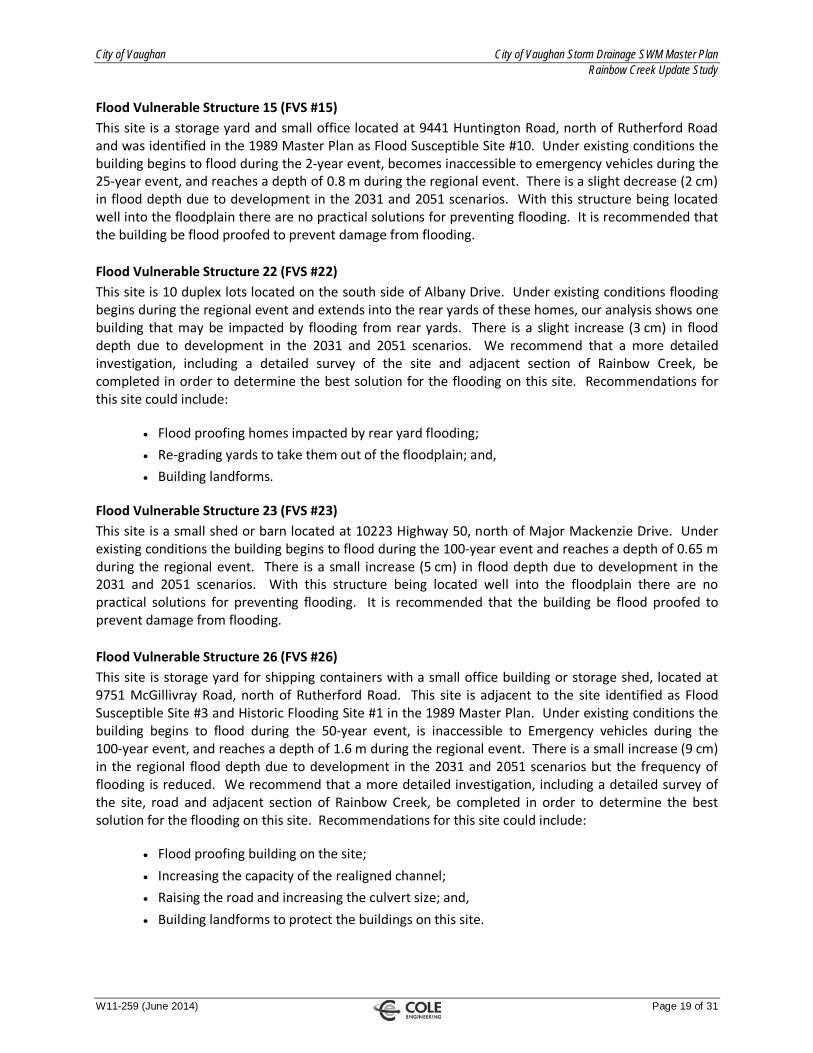
Flood Vulnerable Structure 15 (FVS #15) This site is a storage yard and small office located at 9441 Huntington Road, north of Rutherford Road and was identified in the 1989 Master Plan as Flood Susceptible Site #10. Under existing conditions the building begins to flood during the 2‐year event, becomes inaccessible to emergency vehicles during the 25‐year event, and reaches a depth of 0.8 m during the regional event. There is a slight decrease (2 cm) in flood depth due to development in the 2031 and 2051 scenarios. With this structure being located well into the floodplain there are no practical solutions for preventing flooding. It is recommended that the building be flood proofed to prevent damage from flooding.
Flood Vulnerable Structure 22 (FVS #22) This site is 10 duplex lots located on the south side of Albany Drive. Under existing conditions flooding begins during the regional event and extends into the rear yards of these homes, our analysis shows one building that may be impacted by flooding from rear yards. There is a slight increase (3 cm) in flood depth due to development in the 2031 and 2051 scenarios. We recommend that a more detailed investigation, including a detailed survey of the site and adjacent section of Rainbow Creek, be completed in order to determine the best solution for the flooding on this site. Recommendations for this site could include:
• Flood proofing homes impacted by rear yard flooding; • Re‐grading yards to take them out of the floodplain; and, • Building landforms.
Flood Vulnerable Structure 23 (FVS #23) This site is a small shed or barn located at 10223 Highway 50, north of Major Mackenzie Drive. Under existing conditions the building begins to flood during the 100‐year event and reaches a depth of 0.65 m during the regional event. There is a small increase (5 cm) in flood depth due to development in the 2031 and 2051 scenarios. With this structure being located well into the floodplain there are no practical solutions for preventing flooding. It is recommended that the building be flood proofed to prevent damage from flooding.
Flood Vulnerable Structure 26 (FVS #26) This site is storage yard for shipping containers with a small office building or storage shed, located at 9751 McGillivray Road, north of Rutherford Road. This site is adjacent to the site identified as Flood Susceptible Site #3 and Historic Flooding Site #1 in the 1989 Master Plan. Under existing conditions the building begins to flood during the 50‐year event, is inaccessible to Emergency vehicles during the 100‐year event, and reaches a depth of 1.6 m during the regional event. There is a small increase (9 cm) in the regional flood depth due to development in the 2031 and 2051 scenarios but the frequency of flooding is reduced. We recommend that a more detailed investigation, including a detailed survey of the site, road and adjacent section of Rainbow Creek, be completed in order to determine the best solution for the flooding on this site. Recommendations for this site could include:
• Flood proofing building on the site; • Increasing the capacity of the realigned channel; • Raising the road and increasing the culvert size; and, • Building landforms to protect the buildings on this site.

City of Vaughan City of Vaughan Storm Drainage SWM Master Plan Rainbow Creek Update Study
W11-259 (June 2014) Page 20 of 31
Flood Vulnerable Structure 28 (FVS #28) This culvert is located under the CP rail tracks south of McGillivray Road, east of Huntington Road and south of Block 61. This site does not flood under existing conditions. The increase in flow is due to the Block 61 Development, which will increase the flows to this culvert. The flooding at this culvert is approximately 10 – 17 cm, only occurring under 2031 and 2051 development conditions and does not affect accessibility for emergency vehicles. Our analysis does not include the proposed SWM facilities for Block 61, which will provide some storage for the regional event. We recommend that this culvert be re‐evaluated once the Block 61 design is approved.
5.4.1. Recommendations
Most of the recommendations made for flood vulnerable sites with a higher level of risk or an increase in flooding include a detailed survey to determine the extent of flooding. These studies are required because the DEM does not represent current grading in some areas of Rainbow Creek. We have updated the modeling surface with information provided by the City, but as built survey information was not available for all the sites and grading may have been changed on private properties. We have identified areas that appear to be at risk of flooding; however it is recommended that a study to determine the extent of the flood risk be completed for each of these sites prior to implementing solutions for flooding. Table 5.6 below contains a summary of the recommendations and estimated costs for studies and flood remediation works, the locations of these recommended works are shown on Figure‐RW1 following the report.
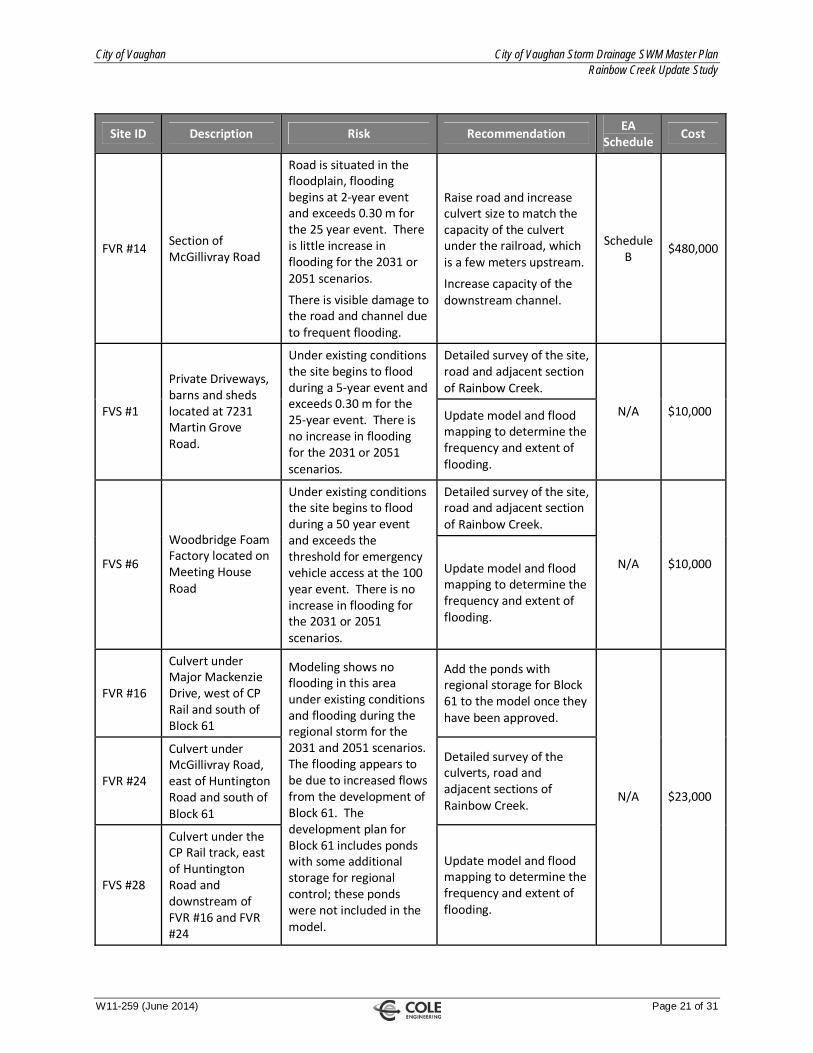
Table 5.6 – Summary of Recommendations for Flood Vulnerable Sites
Site ID Description Risk Recommendation EA Schedule Cost
FVR #7 Culvert under Highway 27, north of Langstaff Road
Flood depth for the regional event exceeds 0.30 m under the 2051 development scenario.
Culvert should be re‐evaluated as part of the next Rainbow Creek update.
N/A N/A
Detailed survey of the site, road and adjacent section of Rainbow Creek.
FVS #24 House and storage yard for shipping containers
Property is situated in the floodplain, flooding begins at 2‐year event and exceeds 0.30 m for the 25 year event. There is little increase in flooding for the 2031 or 2051 scenarios.
Update model and flood mapping to determine the frequency and extent of flooding.
N/A $10,000
Detailed survey of the site, road and adjacent section of Rainbow Creek.
FVS #26
Storage yard for shipping containers with several small office buildings and storage sheds
Both road and property are situated in the floodplain, flooding begins at the 50‐year event and reaches a depth of 1.6 m during the regional event. There is a small (9 cm) increase in flooding for the 2031 or 2051 scenarios.
Update model and flood mapping to determine the frequency and extent of flooding.
N/A $10,000
City of Vaughan City of Vaughan Storm Drainage SWM Master Plan Rainbow Creek Update Study
W11-259 (June 2014) Page 21 of 31
Site ID Description Risk Recommendation EA Schedule Cost
FVR #14 Section of McGillivray Road
Road is situated in the floodplain, flooding begins at 2‐year event and exceeds 0.30 m for the 25 year event. There is little increase in flooding for the 2031 or 2051 scenarios.
There is visible damage to the road and channel due to frequent flooding.
Raise road and increase culvert size to match the capacity of the culvert under the railroad, which is a few meters upstream.
Increase capacity of the downstream channel.
Schedule B $480,000
Detailed survey of the site, road and adjacent section of Rainbow Creek.
FVS #1
Private Driveways, barns and sheds located at 7231 Martin Grove Road.
Under existing conditions the site begins to flood during a 5‐year event and exceeds 0.30 m for the 25‐year event. There is no increase in flooding for the 2031 or 2051 scenarios.
Update model and flood mapping to determine the frequency and extent of flooding.
N/A $10,000
Detailed survey of the site, road and adjacent section of Rainbow Creek.
FVS #6
Woodbridge Foam Factory located on Meeting House Road
Under existing conditions the site begins to flood during a 50 year event and exceeds the threshold for emergency vehicle access at the 100 year event. There is no increase in flooding for the 2031 or 2051 scenarios.
Update model and flood mapping to determine the frequency and extent of flooding.
N/A $10,000
FVR #16
Culvert under Major Mackenzie Drive, west of CP Rail and south of Block 61
Add the ponds with regional storage for Block 61 to the model once they have been approved.
FVR #24
Culvert under McGillivray Road, east of Huntington Road and south of Block 61
Detailed survey of the culverts, road and adjacent sections of Rainbow Creek.
FVS #28
Culvert under the CP Rail track, east of Huntington Road and downstream of FVR #16 and FVR #24
Modeling shows no flooding in this area under existing conditions and flooding during the regional storm for the 2031 and 2051 scenarios. The flooding appears to be due to increased flows from the development of Block 61. The development plan for Block 61 includes ponds with some additional storage for regional control; these ponds were not included in the model.
Update model and flood mapping to determine the frequency and extent of flooding.
N/A $23,000

City of Vaughan City of Vaughan Storm Drainage SWM Master Plan Rainbow Creek Update Study
W11-259 (June 2014) Page 22 of 31
.
Site ID Description Risk Recommendation EA Schedule Cost
Detailed survey of the site, road and adjacent section of Rainbow Creek.
FVS #7
This site includes 15 single family homes on the south end of Woodcroft Lane and Blossom Court.
Under existing conditions the lots begins to flood during the regional event and two (2) buildings are impacted by flooding. There is a small (9 cm) increase in flooding for the 2031 or 2051 scenarios.
Update model and flood mapping to determine the frequency and extent of flooding.
N/A $12,000
Detailed survey of the site, road and adjacent section of Rainbow Creek.
FVS #8
This site includes nine (9) single family homes on the north end of Woodcroft Lane
Under existing conditions the lots begins to flood during the regional event. There is a small (10 cm) increase in flooding for the 2031 or 2051 scenarios.
Update model and flood mapping to determine the frequency and extent of flooding.
N/A $10,000
Detailed survey of the site, road and adjacent section of Rainbow Creek. Update model and flood mapping to verify the frequency, depth and extent of flooding.
FVS #13 Small horse barn located at 9290 McGillivray Road
Under existing conditions the buildings begin to flood during the 25‐year event and flooding reaches a depth of 1.6 m during the regional event. There is a small (4 cm) increase in flooding for the 2031 or 2051 scenarios.
With this structure being located well into the floodplain there are no practical solutions for preventing flooding. It is recommended that the building be Flood proofed to prevent damage from flooding.
N/A $16,000
Detailed survey of the site, road and adjacent section of Rainbow Creek. Update model and flood mapping to verify the frequency, depth and extent of flooding.
FVS #15
Storage Yard and Small office located at 9441 Huntington Road
Under existing conditions the buildings begin to flood during the 2‐year event and flooding reaches a depth of 0.8 m during the regional event. There is a small (2 cm) increase in flooding for the 2031 or 2051 scenarios.
With this structure being located well into the floodplain there are no practical solutions for preventing flooding. It is recommended that the building be Flood proofed to prevent damage from flooding.
N/A $16,000

City of Vaughan City of Vaughan Storm Drainage SWM Master Plan Rainbow Creek Update Study
W11-259 (June 2014) Page 23 of 31
.
Site ID Description Risk Recommendation EA Schedule Cost
Detailed survey of the site, road and adjacent section of Rainbow Creek.
FVS #22
This site includes 10 duplex lots on the south side of Albany Drive
Under existing conditions the lots begins to flood during the regional event and one house is impacted by flooding. There is a small (3 cm) increase in flooding for the 2031 or 2051 scenarios.
Update model and flood mapping to determine the frequency and extent of flooding.
N/A $10,000
Detailed survey of the site, road and adjacent section of Rainbow Creek. Update model and flood mapping to verify the frequency, depth and extent of flooding.
FVS #23
Small shed or barn located at 10223 Highway 50, north of Major Mackenzie Drive
Under existing conditions the buildings begin to flood during the 100‐year event and flooding reaches a depth of 0.65 m during the regional event. There is a small (5 cm) increase in flooding for the 2031 or 2051 scenarios.
With this structure being located well into the floodplain there are no practical solutions for preventing flooding. It is recommended that the building be Flood proofed to prevent damage from flooding.
$16,000
Note: FVR = Flood Vulnerable Road; FVS = Flood Vulnerable Structure
5.5. Erosion Control – Continuous Modeling
The Water’s Edge Environmental Solutions Team determined the erosion thresholds for Rainbow Creek downstream of proposed pond locations, as shown of Figure RC‐5 following the report. These thresholds represent the minimum flow at which erosion will begin to occur. As erosion is a gradual process that is associated with the more frequent lower intensity storms continuous modeling is used for this analysis. The Rainbow Creek PCSWMM model was run using 33 years of rainfall data from the Toronto Lester B. Pearson International Airport weather station. For each of these sites we recorded the duration of time that flows in Rainbow Creek exceeded the erosion threshold. This analysis was then repeated for the 2031 scenario with different erosion mitigation strategies, to determine the most effective criteria to use for erosion controls. This analysis included the following controls:
• Baseline condition; • 24‐hour drawdown of runoff from a 25 mm storm; • 48‐hour drawdown of runoff from a 25 mm storm; • 72‐hour drawdown of runoff from a 25 mm storm; • Onsite retention of the first 5 mm of rainfall for each event; • Onsite retention of the first 10 mm of rainfall for each event; and, • Onsite retention of the first 5 mm of rainfall for each event with 24‐hour drawdown of runoff from a 25 mm event.

City of Vaughan City of Vaughan Storm Drainage SWM Master Plan Rainbow Creek Update Study
W11-259 (June 2014) Page 24 of 31
The results of this analysis are presented graphically for each erosion site as shown in Figure 5‐1 through Figure 5‐11.
Duration of exceedances (ER_02)(Feb. 1965 ‐ Dec. 1997)
4523
0 hr 2135
00 hr
2143
00 hr
2155
00 hr
2131
00 hr
2131
00 hr
2135
00 hr
2131
00 hr
0
60000
120000
180000
240000
Basel ineCondition
2031‐NoEros ionControl
2031 ‐ 24hrdrawdown
2031 ‐ 48hrdrawdown
2031 ‐72hrdrawdown
2031 ‐ 5mmreta inedons i te
2031 ‐ 10mmretainedons ite
2031 ‐ 24hrdrawdown +
5mmreta inedonsi te
Duratio
n (hou
rs)
Figure 5‐1 Erosion Threshold Site 02
Duration of exceedances (ER_05)(Feb. 1965 ‐ Dec. 1997)
1348
0 hr
2365
0 hr
1904
0 hr
1746
0 hr
2319
0 hr
2291
0 hr
2365
0 hr
2333
0 hr
0
8000
16000
24000
32000
Basel ineCondi tion
2031‐NoEros ionControl
2031 ‐ 24hrdrawdown
2031 ‐ 48hrdrawdown
2031 ‐72hrdrawdown
2031 ‐ 5mmreta inedons i te
2031 ‐ 10mmretainedons ite
2031 ‐ 24hrdrawdown +
5mmretainedons ite
Duratio
n (hou
rs)
Figure 5‐2 Erosion Threshold Site 05
Duration of exceedances (ER_06)(Feb. 1965 ‐ Dec. 1997)
6952
0 hr
1170
00 hr
1332
00 hr
1450
00 hr
1089
00 hr
1087
00 hr
1170
00 hr
1090
00 hr
0
40000
80000
120000
160000
Basel ineCondition
2031‐NoErosionControl
2031 ‐ 24hrdrawdown
2031 ‐ 48hrdrawdown
2031 ‐72hrdrawdown
2031 ‐ 5mmretainedons ite
2031 ‐ 10mmreta inedons i te
2031 ‐ 24hrdrawdown +
5mmretainedons ite
Duratio
n (hou
rs)
Figure 5‐3 Erosion Threshold Site 06

City of Vaughan City of Vaughan Storm Drainage SWM Master Plan Rainbow Creek Update Study
W11-259 (June 2014) Page 25 of 31
Duration of exceedances (ER_07)(Feb. 1965 ‐ Dec. 1997)
2036
0 hr
3509
0 hr
3190
0 hr
2813
0 hr
3420
0 hr
3396
0 hr
3509
0 hr
3431
0 hr
0
10000
20000
30000
40000
BaselineCondi tion
2031‐NoEros ionControl
2031 ‐ 24hrdrawdown
2031 ‐ 48hrdrawdown
2031 ‐72hrdrawdown
2031 ‐ 5mmreta inedons i te
2031 ‐ 10mmretainedons ite
2031 ‐ 24hrdrawdown +
5mmreta inedons i te
Duratio
n (hou
rs)
Figure 5‐4 Erosion Threshold Site 07
Duration of exceedances (ER_08)(Feb. 1965 ‐ Dec. 1997)
1011
0 hr
4831
0 hr
5588
0 hr
5909
0 hr
4609
0 hr
4581
0 hr
4830
0 hr
4625
0 hr
0
20000
40000
60000
80000
Basel ineCondition
2031‐NoEros ionControl
2031 ‐ 24hrdrawdown
2031 ‐ 48hrdrawdown
2031 ‐72hrdrawdown
2031 ‐ 5mmreta inedons i te
2031 ‐ 10mmreta inedons i te
2031 ‐ 24hrdrawdown +
5mmretainedons ite
Duratio
n (hou
rs)
Figure 5‐5 Erosion Threshold Site 08
Duration of exceedances (ER_09)(Feb. 1965 ‐ Dec. 1997)
1284
0 hr
1649
0 hr
1501
0 hr
1445
0 hr
1648
0 hr
1638
0 hr
1649
0 hr
1654
0 hr
0
5000
10000
15000
20000
Basel ineCondition
2031‐NoEros ionControl
2031 ‐ 24hrdrawdown
2031 ‐ 48hrdrawdown
2031 ‐72hrdrawdown
2031 ‐ 5mmretainedons ite
2031 ‐ 10mmretainedons ite
2031 ‐ 24hrdrawdown +
5mmretainedons ite
Duratio
n (hou
rs)
Figure 5‐6 Erosion Threshold Site 09

City of Vaughan City of Vaughan Storm Drainage SWM Master Plan Rainbow Creek Update Study
W11-259 (June 2014) Page 26 of 31
Duration of exceedances (ER_10)(Feb. 1965 ‐ Dec. 1997)
2108
0 hr
7405
0 hr
9208
0 hr
7297
0 hr
7260
0 hr
7404
0 hr
1044
00 hr
7320
0 hr
0
30000
60000
90000
120000
Basel ineCondition
2031‐NoErosionControl
2031 ‐ 24hrdrawdown
2031 ‐ 48hrdrawdown
2031 ‐72hrdrawdown
2031 ‐ 5mmreta inedons i te
2031 ‐ 10mmretainedonsi te
2031 ‐ 24hrdrawdown +
5mmreta inedons i te
Duratio
n (hou
rs)
Figure 5‐7 Erosion Threshold Site 10
Duration of exceedances (ER_11)(Feb. 1965 ‐ Dec. 1997)
1036
00 hr
1143
00 hr
1211
00 hr
1269
00 hr
1133
00 hr
1132
00 hr
1143
00 hr
1133
00 hr
0
40000
80000
120000
160000
Base l ineCondition
2031‐NoEros ionControl
2031 ‐ 24hrdrawdown
2031 ‐ 48hrdrawdown
2031 ‐72hrdrawdown
2031 ‐ 5mmretainedonsi te
2031 ‐ 10mmretainedonsi te
2031 ‐ 24hrdrawdown +
5mmretainedons i te
Duratio
n (hou
rs)
Figure 5‐8 Erosion Threshold Site 11
Duration of exceedances (ER_12)(Feb. 1965 ‐ Dec. 1997)
6294
0 hr
8285
0 hr
9224
0 hr
9891
0 hr
8110
0 hr
8093
0 hr
8285
0 hr
8121
0 hr
0
30000
60000
90000
120000
Basel ineConditi on
2031‐NoErosionControl
2031 ‐ 24hrdrawdown
2031 ‐ 48hrdrawdown
2031 ‐72hrdrawdown
2031 ‐ 5mmretai nedons i te
2031 ‐ 10mmreta inedons i te
2031 ‐ 24hrdrawdown +
5mmretainedons i te
Duratio
n (hou
rs)
Figure 5‐9 Erosion Threshold Site 12

City of Vaughan City of Vaughan Storm Drainage SWM Master Plan Rainbow Creek Update Study
W11-259 (June 2014) Page 27 of 31
Duration of exceedances (ER_13)(Feb. 1965 ‐ Dec. 1997)
4068
hr
8589
hr
7435
hr
7136
hr
9277
hr
9229
hr
8588
hr
9299
hr
0
3000
6000
9000
12000
Basel ineCondition
2031‐NoEros ionControl
2031 ‐ 24hrdrawdown
2031 ‐ 48hrdrawdown
2031 ‐72hrdrawdown
2031 ‐ 5mmretainedons i te
2031 ‐ 10mmretainedons i te
2031 ‐ 24hrdrawdown +
5mmretainedonsi te
Duratio
n (hou
rs)
Figure 5‐10 Erosion Threshold Site 13
Duration of exceedances (ER_14)(Feb. 1965 ‐ Dec. 1997)
5960
0 hr
9241
0 hr
1013
00 hr
1085
00 hr
9089
0 hr
9076
0 hr
9240
0 hr
9097
0 hr
020000400006000080000
100000120000
Basel ineConditi on
2031‐NoErosionControl
2031 ‐ 24hrdrawdown
2031 ‐ 48hrdrawdown
2031 ‐72hrdrawdown
2031 ‐ 5mmretai nedons i te
2031 ‐ 10mmreta inedons i te
2031 ‐ 24hrdrawdown +
5mmretainedons i te
Duratio
n (hou
rs)
Figure 5‐11 Erosion Threshold Site 14
These results show that in general the most beneficial erosion control criteria is the on‐site retention of the first 10 mm of rainfall. Although this does not reduce the duration of erosive flows to pre‐development levels it does provide the greatest overall reduction in the duration of erosive flows. Given the low erosion thresholds in much of the Creek, it is not possible to reduce duration of post‐development erosive flows to pre‐development levels. It was also found that in many areas that using a 24, 48 or 72‐hour drawdown time for the first 25 mm of rainfall would lengthen the time that erosive flows were present in the Creek. This occurs when the erosion threshold in the Creek is low, so the release rate required to achieve a longer drawdown time is still greater then the erosion threshold. In these cases the longer draw down time results in a longer period with erosive flows. The on‐site retention of 5 mm of rainfall provides a reduction of erosive flows that is almost equal to that achieved through the on‐site retention of 10 mm. Given the difference in cost and the minimal benefit in terms of reducing hours of erosive flows it is recommended that 5 mm onsite retention be the criteria for erosion control in Rainbow Creek.

City of Vaughan City of Vaughan Storm Drainage SWM Master Plan Rainbow Creek Update Study
W11-259 (June 2014) Page 28 of 31
5.6. Evaluation of Erosion Sites
As part of the 1989 Rainbow Creek Master Plan (Cosburn Patterson Wardman Limited, December 1989) areas with existing erosion and erosion scars were identified. Although it was shown at that time that there was erosion in Rainbow Creek, the consultants felt that with the available modeling software they could not define criteria that would protect Rainbow Creek from increased erosion due to development. The report states “the technology to determine impacts of urban drainage on watercourse erosion is currently being developed and therefore remains untested”. The report recommended establishing an erosion levee on future development to address future and existing erosion problems.
For the erosion analysis in Rainbow Creek Water’s Edge Environmental Solutions Team (Water’s Edge) was hired to evaluate risk from erosion at the 40 sites identified in the previous master Plan. As part of their study Water’s Edge examined each reach of Rainbow Creek using current and historical aerial photographs. Various reaches were then walked during site inspections which took place in the winter and spring of 2012, with the intent of identifying critical zones. A more detailed analysis was completed for reaches where storm water management facilities are being considered.
In general Rainbow Creek and its Tributaries have stable and well vegetated banks which are not prone to erosion. However erosion scars were noted in some areas and Water’s Edge has identified nine (9) locations where it is recommended that existing erosion problems be monitored or addressed. These locations are as follows:
Main 1: This reach of Rainbow Creek is located between the confluence of the East Humber River and Highway 407. Erosion is occurring under the Highway 407 bridge (Photograph B1 in Appendix E), immediately downstream of the Highway 407 bridge (Photograph B2 in Appendix E) and adjacent to the Highway 407 embankment (Photograph B3 in Appendix E). The erosion under the bridge appears to be caused in part by some geotextile material that is no longer held in place. As erosion in this area has the potential of impacting Highway 407 we recommend that the existing erosion protection installation be repaired. We also recommend that a more detailed hydraulic analysis be conducted at this site to determine the extent of erosion protection required downstream of the bridge and along the Highway embankment.
Main 2: This reach of Rainbow Creek is located upstream of Highway 407 and downstream of regional Road 7. There is ongoing erosion at many of the outside bends (Photograph B4 in Appendix E illustrates a typical outside bend erosion location) however the floodplain for this reach is broad so the impact of this type of erosion is minimal. There is existing toe protection behind some residential units along this reach which should be monitored (Photograph B5 in Appendix E). Downstream of this toe protection is a sanitary crossing with terrafix bank protection (Photograph B6 in Appendix E). The terrafix protection appears to have failed at the sanitary crossing and we recommend that it be repaired or replaced.
West 1: This is a relatively long reach between Langstaff Road and the upper reach of Main 3. Most of this reach is relatively stable and well vegetated. There is a high eroding bank that contributes excess sediment to the stream (Photograph B7 in Appendix E). We recommend that the eroding bank be re‐vegetated and monitored until the vegetation is established and the bank is no longer showing signs of eroding.

City of Vaughan City of Vaughan Storm Drainage SWM Master Plan Rainbow Creek Update Study
W11-259 (June 2014) Page 29 of 31
West 2: This reach is located between Langstaff Road and the forested area located to the north of Langstaff Road. There is erosion at the upper end of this reach where the channel is actively migrating and causing bank erosion (Photograph B8 in Appendix E). There is an old beaver dam in this area which is also contributing to local bank erosion (Photograph B9 in Appendix E). As this area is currently undeveloped the erosion is not causing any problems, however once this site is developed we recommend that the Beaver dam should be removed and the banks should be stabilised.
West 3: This reach is located north of Reach West 2, and is bordered by undeveloped land. Erosion is accruing at various locations within this reach, primarily at the outside bends (Photograph B10 in Appendix E). As this reach is located on undeveloped land the erosion does not need to be addressed at this time. We recommend that a more detailed analysis of this site be carried out when the surrounding properties are developed.
East 1: East 1 is located between Langstaff Road and Reach Main 3. The lands surrounding this reach are a combination of residential and industrial sites. This reach is eroding in many locations, primarily at outside bends (Photographs B11 and B12 in Appendix E) and at the old weir located downstream of Woodbridge Avenue. We recommend toe protection be installed at outside bends and bank stabilization at the old weir. Water’s Edge noted that a contributing factor to erosion along this reach is pedestrian traffic. We recommend that a pedestrian path be installed to allow for foot traffic without further damaging the stream banks. We also recommend that signs be posted in areas where foot traffic is causing erosion in order to educate the public on the effect of pedestrian traffic on stream bank erosion.
East 4: This reach is located in farm fields to south of Rutherford Road, west of Highway 27. This section of channel is predominantly covered with gravel, cobles and some sand. This reach has erosion locations primarily at outside bends (Photograph B13 in Appendix E). We are not recommending any remediation work at his time as the adjacent lands are agricultural and the impact of the erosion will be minimal. We recommend that once this area is developed the banks should be re‐vegetated and stabilised where required.
East 5: This tributary starts at Reach East 4 and continues under Rutherford Road to just west of McGillivray Road. This reach is relatively stable and the banks are well vegetated with large trees and grasses. There are a few minor erosion locations in this reach, primarily at outside bends (Photograph B14 in Appendix E). As with Reach East 4 we are not recommending any remediation work at his time as the adjacent lands are agricultural and the impact of the erosion will be minimal. We recommend that once this area is developed the banks should be re‐vegetated and stabilised where required.
East 8: This reach begins east of Huntington Road and continues downstream to the forest area of Reach East 7. This reach is located on agricultural land and is used for watering cattle. The presence of cattle has along the banks of this reach has caused bank instability (Photograph in B15 in Appendix E). There is a large online pond in this reach (Photograph B17 in Appendix E) and the outlet of this pond is also creating some erosion issues. We recommend that the banks of this reach be stabilised when the surrounding lands are developed. We also recommend that an analysis of the online pond and its outlet be completed at that time to determine the extent of erosion protection that would be required to mitigate the damage to the banks from the pond outlet.

City of Vaughan City of Vaughan Storm Drainage SWM Master Plan Rainbow Creek Update Study
W11-259 (June 2014) Page 30 of 31
5.6.1. Recommendations
Most of the recommendations made for sites with existing erosion problems include a detailed hydraulic analysis to determine the extent of the erosion works required. This level of analysis is outside the scope of this study and is required in order to determine the scope of erosion works required at each site. The areas discussed were identified by Water’s Edge as being most likely to cause problems for existing infrastructure and future development and areas contributing excess sediment to Rainbow Creek. Table 5.7 contains a summary of the recommendations and estimated costs for studies and erosion remediation works, the locations of these recommended works are shown on Figure‐RW2 following the report.
Table 5.7 – Summary of Recommendations for Sites with Erosion Problems Reach ID Location Risk Recommendation EA
Schedule Cost
Main 1
Between the confluence of the East Humber River and Highway 407.
Erosion occurring under Highway 407 bridge and adjacent to the Highway 407 embankment.
Repair existing erosion protection installation. Schedule B $205,000
Monitor toe protection behind residential units.
N/A $10,0000 Main 2
Upstream of Highway 407 and downstream of Regional Road 7.
Terrafix protection has failed at a sanitary crossing downstream of the existing toe protection.
Repair existing terrafix installation. Schedule B $176,600
Cut bank back to a more gentle slope and install toe protection.
West 1
Between Langstaff Road and the upper reach of Main 3.
High eroding bank upstream of Highway 27 is contributing excess sediment to the stream.
Re‐vegetate eroding bank and monitor site until vegetation is well established.
Schedule B $88,500
The old beaver dam should be removed if it has been abandoned and the surrounding area should be cleaned up. West 2
Between Langstaff Road and the forested area to the north of Langstaff Road.
Old beaver dam is causing local erosion issues. Downstream of the dam the channel is actively migrating and causing bank erosion.
Erosion along this reach should be addressed as part of the Block 59 development.
Schedule B
Work to be undertaken as part of
the Block 59 development

City of Vaughan City of Vaughan Storm Drainage SWM Master Plan Rainbow Creek Update Study
W11-259 (June 2014) Page 31 of 31
Reach ID Location Risk Recommendation EA
Schedule Cost
West 3
Between the confluence of the East Humber River and Highway 407.
Erosion is occurring at various locations within the reach, primarily at outside bends
Erosion along this reach should be addressed as part of the Block 59 development.
Schedule B
Work to be undertaken as part of
the Block 59 development
Toe protection at outside bends.
Bank stabilization around the weir.
East 1
Between Langstaff Road and reach M3, upstream of the confluence with the west branch.
Erosion at several locations due to a narrow corridor, moderate channel entrenchment and pedestrian traffic. Bank erosion is also occurring at the old weir downstream of Woodbridge Avenue.
Install a pedestrian path and signs to educated the public on foot traffic causing erosion.
Schedule B $1,605,000
6.0 Conclusions and Recommendations
Based on the hydrologic analysis of the rainbow creek sub‐watershed and observations of the updated hydrologic modelling, it is suggested that:
• Quantity Control: SWM facilities designed to control flows to unit flow rates will result in post development flows which are less than or equal to pre‐development levels within Rainbow Creek for storm events ranging from the 2‐year to the 100‐year event;
• Block 61 ponds should be updated in the model once the design has been finalized to verify that they are not causing an increase in flows downstream of the site;
• Regional Controls: It is recommended that no regional controls be required for developments within the Vaughan portion of the Rainbow Creek Subwatershed;
• More detailed analysis of the Brampton portion of the Rainbow Creek Subwatershed prior to making recommendations regarding regional controls for Brampton;
• Once Complete the recommendations of the TRCA’s Humber River Watershed Update may have to be incorporated along with the recommendations of this study;
• Erosion Control: Due to the low erosion thresholds for Rainbow Creek, the recommended erosion criteria for future developments is to retain the first 5 mm of runoff on‐site. This criteria results in a reduction of the duration of the low flow events which contribute to erosion in Rainbow Creek. No extended detention is required to mitigate erosion as our analysis shows that extended detention within the Rainbow Creek Subwatershed will increase the duration of erosive flows in the creek.
• Flood Susceptible Sites: The recommended studies and mitigation work listed in Section 5.4 should be completed as funds become available.
• Erosion Sites: The recommended studies and mitigation work listed in Section 5.6 should be completed as funds become available.

CALEDON
KING
VAUGHAN
ADJALA
BRAMPTON
MONO
NORTH YORK
MARKHAM
ETOBICOKE
NEW TECUMSETH
RICHMOND HILL
YORK
ERIN
TORONTO
MISSISSAUGA
AURORAWHITCHURCH STOUFFVIL
BRADFORD WEST GWILLI
VAUGHAN
SCARBOROUGH
ORANGEVILLE
TOSORONTIO
Main Humber
West Humber
East Humber
Lower Humber
Black Creek
Rainbow Creek
FIGURERC-1SCALE 1:175,000
Rainbow CreekSubwatershed Update
November 2013
Location Map
LegendHumber River WatershedSubwatersheds
Main Humber
Lower Humber
West Humber
Black Creek
East Humber
Rainbow Creek
Watercourse
Railraod
Roads
Municipal Boundary
Humber Location Plan °
0 1,250 2,500 3,750 5,000625Meters
Humber River watershed information was taken from:· Hydrologic Study of Impacts on Flood Flows and Mitigation of Future Development in the Humber River – AMEC Environment and Infrastructure, June 2012 (Draft)

Block 47
Block 58
Block 67
Block 59
Block 50
Block 51
Block 66
Block 60
Block 65
Block 61
Block 69
Block 64
Block 57
Block 52
Block 62
Block 41
Block 68
Block 43
Highway 27
Nashville Road
Coleraine Drive
Rutherford Road
Highway 7Langstaff Road
Highway 50Highway 407
Huntington Road
Albion Vaughan Road
Kirby Road
Coun
trysid
e Driv
e
Major Mackenzie Drive WestMa
yfield R
oad
Highway 427
Cold Creek Road
Highway 50
Langstaff Road
Highway 50
West Rainbow Creek
Rainbow Creek
Robinson Creek
Plunke
tt Cree
k
East Rainbow Creek
East Robinson Creek
FIGURERC-2SCALE 1:50,000
Rainbow CreekSubwatershed Update
November 2013
Existing Conditions Map
LegendRainbow CreekDrainage BoundaryMunicipal Boundary
Existing Conditions °
Caledo
nBra
mpton
BramptonVaughan
CaledonVaughan
Vaughan
Toronto
0 340 680 1,020 1,360170Meters
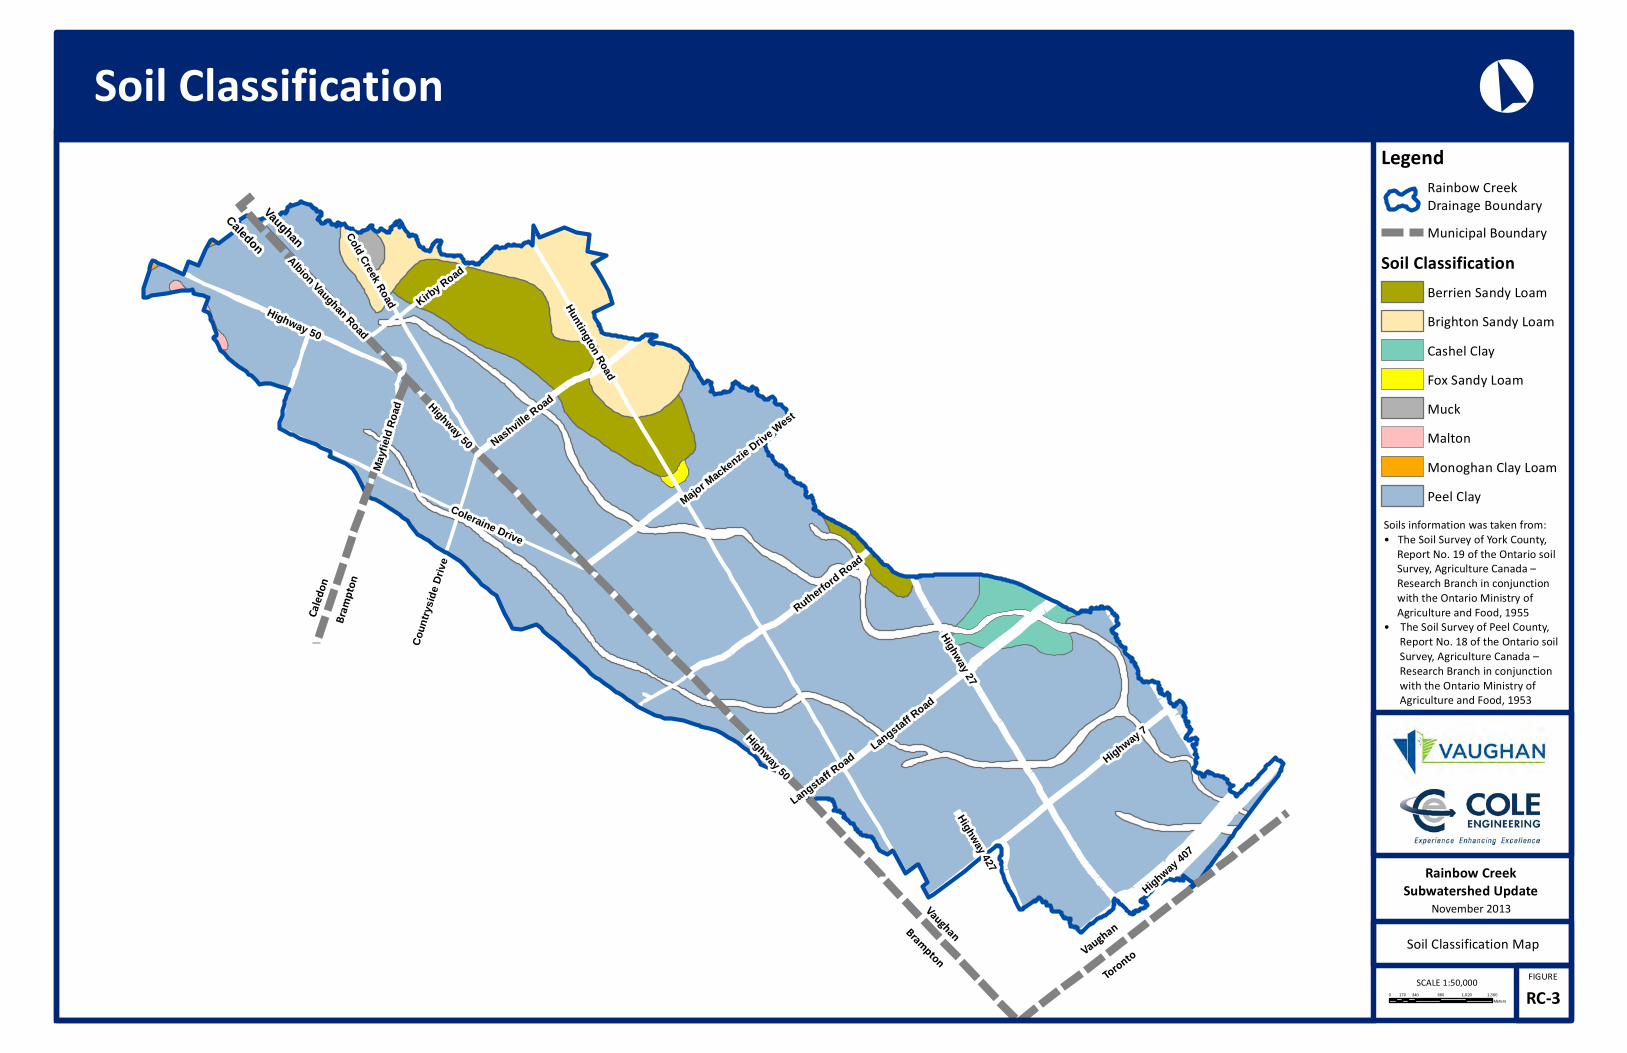
Highway 27
Nashville Road
Coleraine Drive
Rutherford Road
Highway 7Highway 50
Langstaff Road
Highway 407
Huntington Road
Albion Vaughan Road
Coun
trysid
e Driv
e
Major Mackenzie Drive West
Kirby Road
Mayfi
eld Ro
ad
Highway 427
Cold Creek Road
Highway 50
Langstaff Road
Highway 50
FIGURERC-3SCALE 1:50,000
Rainbow CreekSubwatershed Update
November 2013
Soil Classification Map
LegendRainbow CreekDrainage BoundaryMunicipal Boundary
Soil ClassificationBerrien Sandy LoamBrighton Sandy LoamCashel ClayFox Sandy LoamMuckMaltonMonoghan Clay LoamPeel Clay
Soil Classification °
Caledo
nBra
mpton
BramptonVaughan
CaledonVaughan
Vaughan
Toronto
0 340 680 1,020 1,360170Meters
Soils information was taken from:• The Soil Survey of York County, Report No. 19 of the Ontario soil Survey, Agriculture Canada – Research Branch in conjunction with the Ontario Ministry of Agriculture and Food, 1955• The Soil Survey of Peel County, Report No. 18 of the Ontario soil Survey, Agriculture Canada – Research Branch in conjunction with the Ontario Ministry of Agriculture and Food, 1953
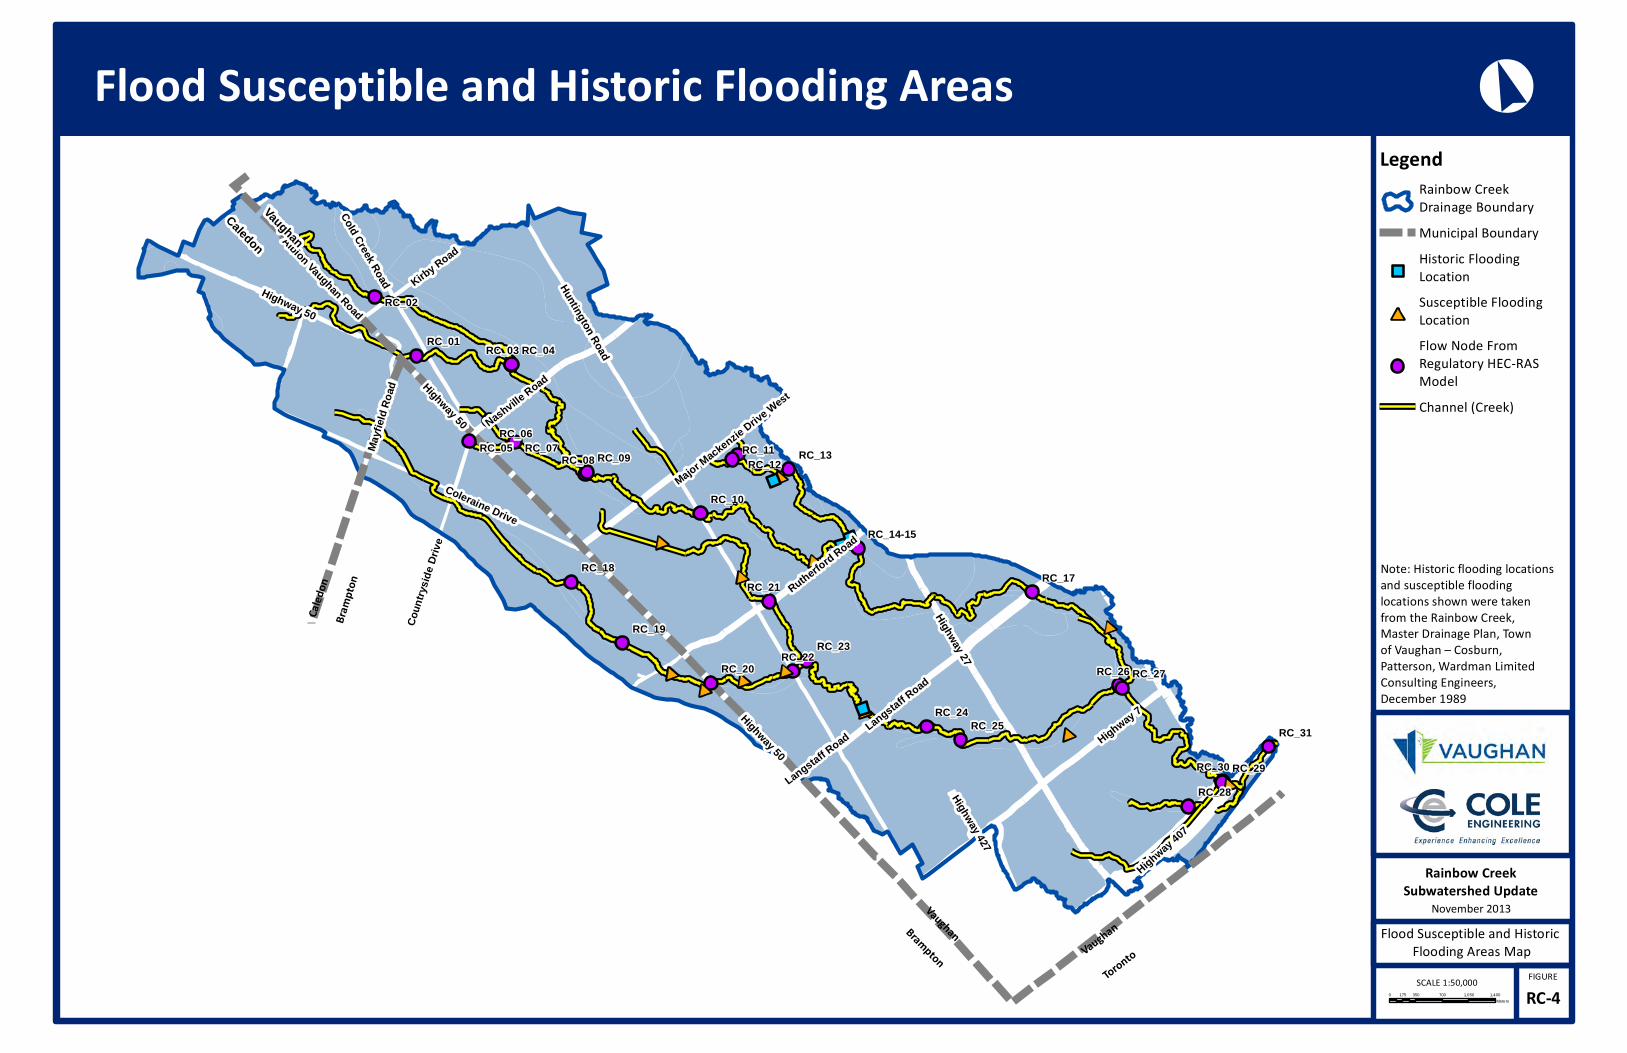
#*
#*
#*
#*
#*
#*
#*#*
#*#*
#*
#*
Highway 27
Nashville Road
Coleraine Drive
Rutherford Road
Highway 7Highway 50
Langstaff Road
Highway 407
Huntington Road
Albion Vaughan Road
Coun
trysid
e Driv
e
Major Mackenzie Drive West
Kirby Road
Mayfi
eld Ro
ad
Highway 427
Cold Creek Road
Langstaff Road
Highway 50
Highway 50
RC_29
RC_27RC_26RC_23
RC_22RC_20
RC_19
RC_18RC_17
RC_13RC_11RC_12
RC_10
RC_09RC_08
RC_06
RC_04RC_03
RC_30
RC_21
RC_25
RC_05 RC_07
RC_28
RC_02
RC_01
RC_24RC_31
RC_14-15
FIGURERC-4SCALE 1:50,000
Rainbow CreekSubwatershed Update
November 2013Flood Susceptible and Historic
Flooding Areas Map
LegendRainbow CreekDrainage BoundaryMunicipal BoundaryHistoric Flooding Location
#*Susceptible FloodingLocationFlow Node From Regulatory HEC-RAS ModelChannel (Creek)
Flood Susceptible and Historic Flooding Areas °
Caledo
nBra
mpton
BramptonVaughan
CaledonVaughan
Vaughan
Toronto
0 350 700 1,050 1,400175Meters
Note: Historic flooding locationsand susceptible floodinglocations shown were takenfrom the Rainbow Creek, Master Drainage Plan, Townof Vaughan – Cosburn, Patterson, Wardman LimitedConsulting Engineers,December 1989

Highway 27
Nashville Road
Coleraine Drive
Rutherford Road
Highway 7Highway 50
Langstaff Road
Highway 407
Huntington Road
Albion Vaughan Road
Coun
trysid
e Driv
eMajor Mackenzie Drive West
Kirby Road
Mayfi
eld Ro
ad
Highway 427
Cold Creek Road
Highway 50
Langstaff Road
Highway 50
FIGURERW-1SCALE 1:50,000
Rainbow CreekSubwatershed Update
November 2013Locations of
Recommended Erosion Works
LegendRainbow CreekDrainage BoundaryMunicipal BoundaryRainbow CreekRecommended Works
Recommended Erosion Works °
Caledo
nBra
mpton
BramptonVaughan
CaledonVaughan
Vaughan
Toronto
0 350 700 1,050 1,400175Meters
West 1West 2
West 3 East 1
Main 2 Main 1
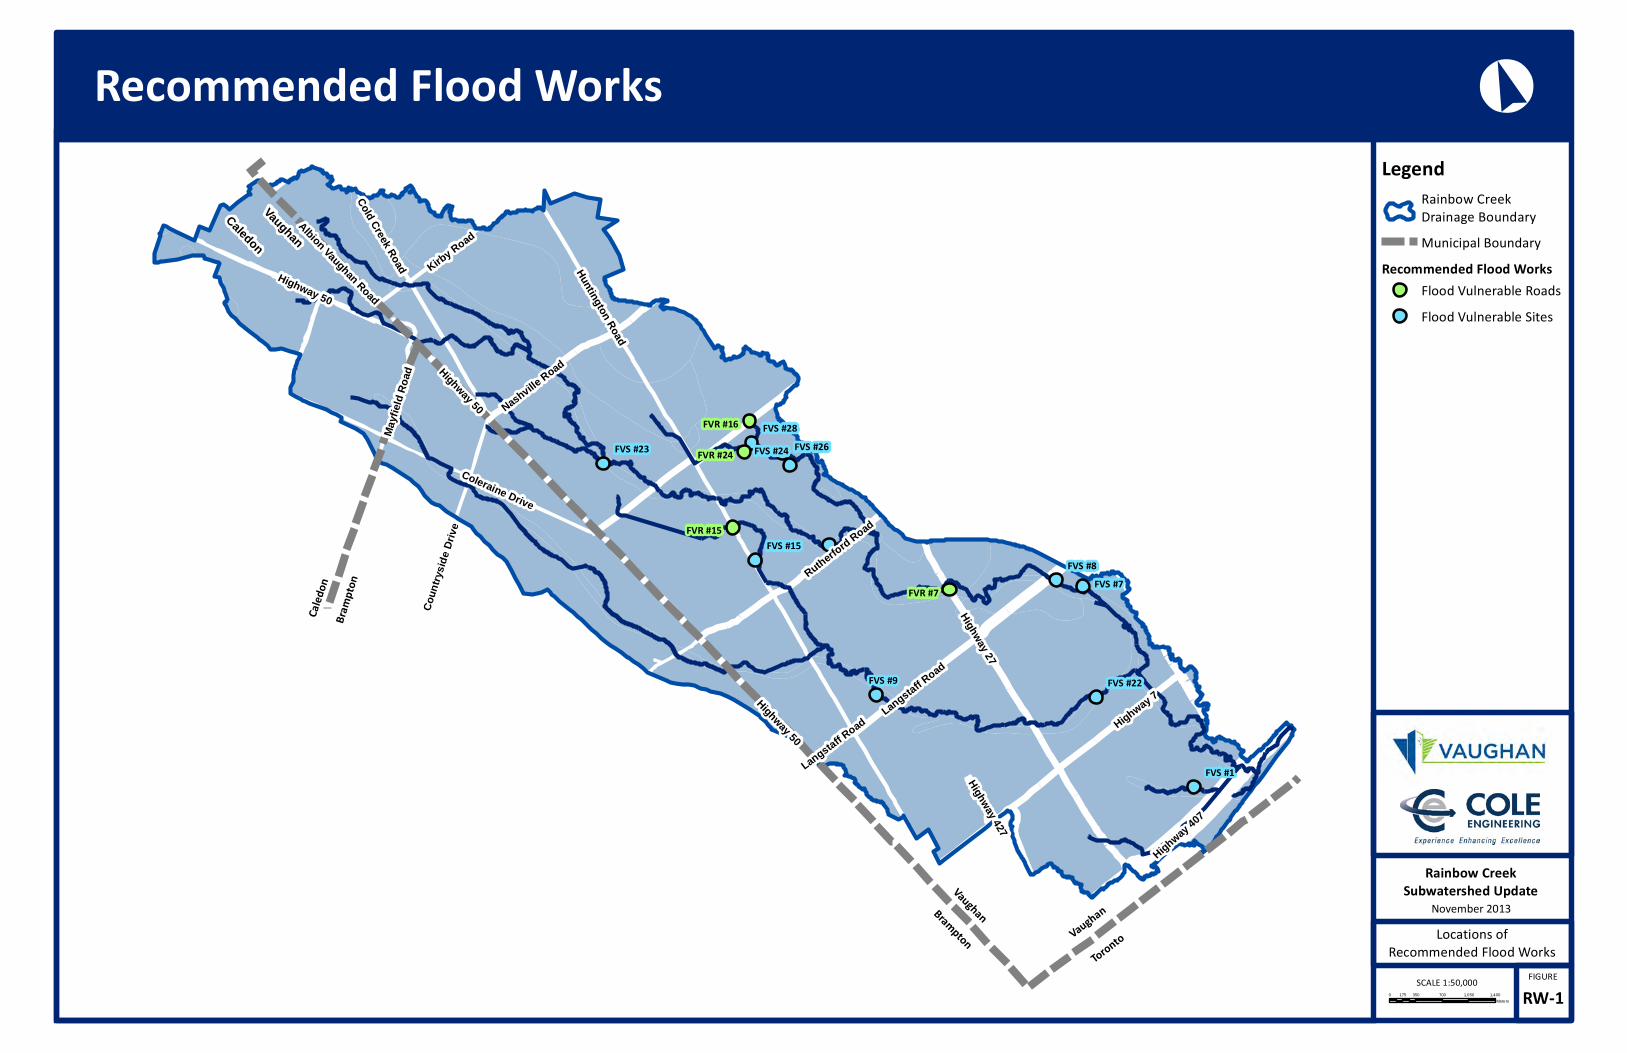
FVR #7
FVR #24
FVR #16
FVR #15
Highway 27
Nashville Road
Coleraine Drive
Rutherford Road
Highway 7Highway 50
Langstaff Road
Highway 407
Huntington Road
Albion Vaughan Road
Coun
trysid
e Driv
e
Kirby Road
Mayfi
eld Ro
ad
Highway 427
Cold Creek Road
Highway 50
Langstaff Road
Highway 50
FVS #9
FVS #8FVS #7
FVS #1
FVS #28FVS #26FVS #24FVS #23
FVS #22
FVS #15
FIGURERW-1SCALE 1:50,000
Rainbow CreekSubwatershed Update
November 2013Locations of
Recommended Flood Works
LegendRainbow CreekDrainage BoundaryMunicipal Boundary
Recommended Flood WorksFlood Vulnerable RoadsFlood Vulnerable Sites
Recommended Flood Works °
Caledo
nBra
mpton
BramptonVaughan
CaledonVaughan
Vaughan
Toronto
0 350 700 1,050 1,400175Meters

Highway 27
Nashville Road
Coleraine Drive
Rutherford Road
Highway 7Highway 50
Langstaff Road
Highway 407
Huntington Road
Albion Vaughan Road
Coun
trysid
e Driv
eMajor Mackenzie Drive West
Kirby Road
Mayfi
eld Ro
ad
Highway 427
Cold Creek Road
Highway 50
Langstaff Road
Highway 50
ER_07
ER_10
ER_11
ER_08
RC_15
ER_09 ER_02
ER_05
ER_06
RC_16
RC_14
FIGURERC-5SCALE 1:50,000
Rainbow CreekSubwatershed Update
November 2013
Erosion Threshold Location
LegendRainbow CreekDrainage BoundaryMunicipal BoundaryErosion Threshold LocationsChannel (Creek)
Erosion Threshold Locations °
Caledo
nBra
mpton
BramptonVaughan
CaledonVaughan
Vaughan
Toronto
0 350 700 1,050 1,400175Meters