rail emissions 2020-21
TRANSCRIPT

Rail Emissions 2020-21
19 August 2021
Background: This annual statistical release contains information on rail emissions for passenger and freight trains in Great Britain.
These include: Energy consumption of electricity and diesel, and estimates of total and normalised CO2e emissions from traction energy. Non-traction emissions are not included.
Passenger train data have been normalised to show the average CO2e emissions per passenger kilometre. Freight train data have been normalised to show the average CO2e emissions per net tonne kilometre of freight moved.
Source: Passenger and freight operators
Latest year: 2020-21 (April 2020 to March 2021)
Contents: Passenger train emissions – p2 Freight train emissions – p5 Transport emissions in context– p7 Annexes – p11
Responsible Statistician: L. Charlton
Public Enquiries: [email protected]
Media Enquiries: Tel: 020 7282 2094
Next publication: August 2022
Total traction electricity consumption in 2020-21 fell to 3,733 million kilowatt hours (kWh), a decrease of 12% compared with 2019-20. Total traction diesel consumption fell to 507 million litres, a decrease of 22%.
The falls in energy consumption led to a reduction in estimated carbon dioxide equivalent (CO2e) emissions, with a combined total from electricity and diesel of 2,282 kilotonnes. This is the lowest emissions level since the start of the comparable time series in 2010-11.
Passenger train emissions Electricity consumption for passenger trains decreased by 12%, and diesel consumption decreased by 26% compared with 2019-20. Emissions from electricity and diesel combined were 1,845 kilotonnes, a decrease of 23%.
Due to the effects of the pandemic, passenger kilometres fell by 81% and trains planned fell by 22% compared with 2019-20. As a result, estimated normalised CO2e emissions increased by 316% from 35.2g to 146.5g CO2e per passenger kilometre.
Freight train emissions In 2020-21 freight train diesel consumption fell by 11% to 153 million litres. Traction electricity consumption decreased 9% to 64 million kWh, compared with 2019-20.
Freight rail usage was affected by the coronavirus pandemic, but there were smaller falls in energy consumption compared to passenger trains. Estimated normalised CO2e emissions was 26.5g CO2e per tonne kilometre, a decrease of 4% from 27.5g CO2e per tonne kilometre in 2019-20.
All data tables and a quality and methodology report associated with this release are published on the rail emissions page of the ORR data portal. Key definitions are in annex 1 of this release.

Rail Emissions 2020-21
Office of Rail and Road | 19 August 2021 2
1. Passenger train emissions
There was a large increase in estimated CO2e emissions per passenger kilometre in 2020-21 – it increased by 316% to 146.5g compared with 35.2g in 2019-20. This is the highest level since the comparable time series began in 2010-11 and is around four times larger than the previous year.
Both diesel and electricity consumption for traction fell and therefore total CO2e emissions fell, due to a reduction in services. The increase in normalised CO2e emissions can therefore be attributed to the decrease in passenger kilometres.
Figure 1.1 Comparison of passenger train energy usage and emissions, Great Britain, 2019-20 and 2020-21
Measure 2019-20 2020-21 Comparison with 2019-20
Electricity consumption (million kWh)
4,189 3,669 -12%
Diesel consumption (million litres)
476 354 -26%
Trains planned (million) 7.79 6.11 -22%
Train kilometres (million)
550.8 416.1 -24%
Passenger kilometres (billion)
66.8 12.5 -81%
g/CO2e per passenger kilometre
35.2 146.5 +316%
Rail Emissions 2020-21
Office of Rail and Road | 19 August 2021 3
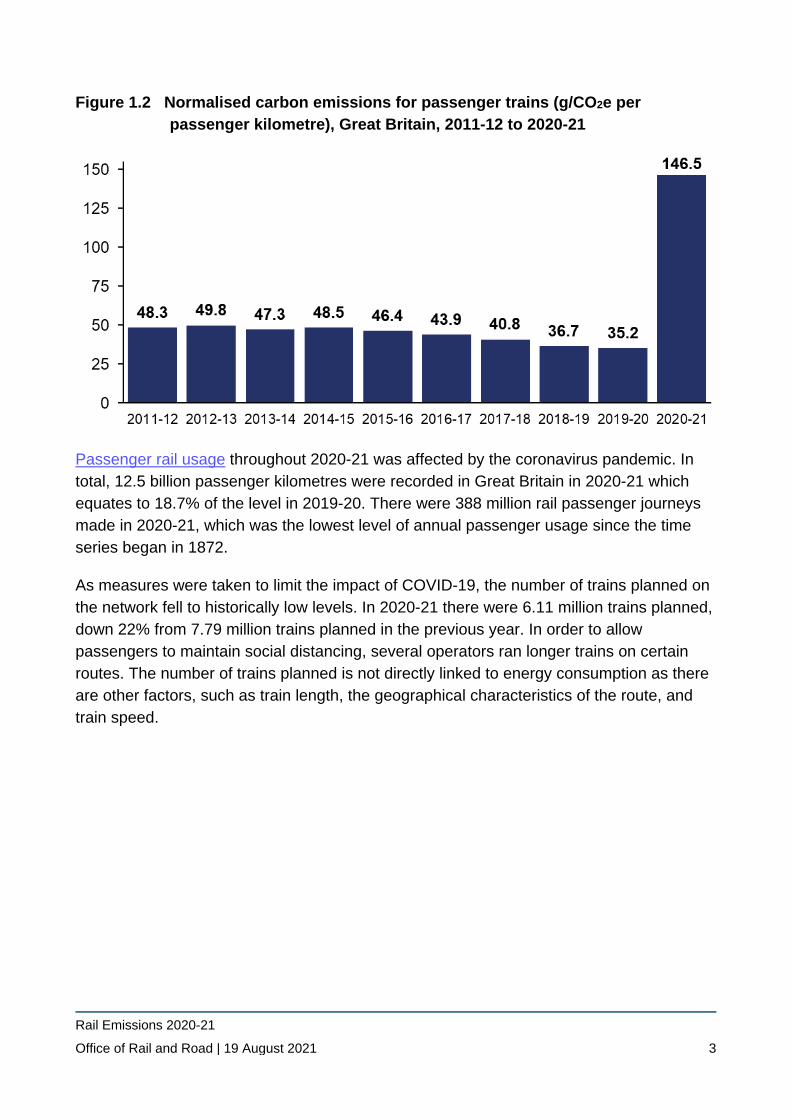
Figure 1.2 Normalised carbon emissions for passenger trains (g/CO2e per passenger kilometre), Great Britain, 2011-12 to 2020-21
Passenger rail usage throughout 2020-21 was affected by the coronavirus pandemic. In total, 12.5 billion passenger kilometres were recorded in Great Britain in 2020-21 which equates to 18.7% of the level in 2019-20. There were 388 million rail passenger journeys made in 2020-21, which was the lowest level of annual passenger usage since the time series began in 1872.
As measures were taken to limit the impact of COVID-19, the number of trains planned on the network fell to historically low levels. In 2020-21 there were 6.11 million trains planned, down 22% from 7.79 million trains planned in the previous year. In order to allow passengers to maintain social distancing, several operators ran longer trains on certain routes. The number of trains planned is not directly linked to energy consumption as there are other factors, such as train length, the geographical characteristics of the route, and train speed.

Rail Emissions 2020-21
Office of Rail and Road | 19 August 2021 4
Electricity consumption fell by 12% to 3,669 million kWh. This led to a 20% decrease in CO2e emissions from electricity, from 1,087 kilotonnes in 2019-20 to 868 kilotonnes. Since 2016-17 emissions from electricity consumption have been lower compared with emissions from diesel consumption despite increases in electricity usage. This is predominantly due to a transition towards renewable energy sources in the electricity sector in Great Britain.
There was a larger decrease in diesel consumption, which fell by 26% to 354 million litres. This resulted in 977 kilotonnes of CO2e emissions. Total emissions from both electricity and diesel passenger train consumption are the lowest figures since the comparable time series began in 2011-12.
Figure 1.3 CO2e emissions from passenger trains traction electricity and diesel consumption, Great Britain, 2011-12 to 2020-21

Rail Emissions 2020-21
Office of Rail and Road | 19 August 2021 5
2. Freight train emissions The level of CO2e emissions per freight tonne kilometre in 2020-21 decreased by 4% to 26.5g compared with 27.5g in 2019-20. Both diesel and electricity consumption for traction fell due to a reduction in freight services, although not by the same extent as passenger trains.
Freight rail usage throughout 2020-21 was affected by the coronavirus pandemic. In total, freight moved in 2020-21 fell to 15.2 billion net tonne kilometres. This was a decrease of 9% compared with 2019-20.
In 2020-21 the number of freight trains run was 189,371 which was down 10% compared with the previous year. The number of freight trains running has been on a steady downward trend since the time series began in 2003-04.
Figure 2.1 Comparison of freight train energy consumption and emissions, Great Britain, 2019-20 and 2020-21
Measure 2019-20 2020-21 Comparison with 2019-20
Electricity consumption (million kWh)
70 64 -9%
Diesel consumption (million litres)
172 153 -11%
Trains ran 209,475 189,371 -10%
Freight train kilometres (million)
33.2 29.9 -10%
Freight net tonne kilometres (billion)
16.6 15.2 -9%
g/CO2e per net freight tonne kilometre
27.5 26.5 -4%

Rail Emissions 2020-21
Office of Rail and Road | 19 August 2021 6
Figure 2.2 Normalised carbon emissions for freight trains (g/CO2e per net freight tonne kilometre), Great Britain, 2011-12 to 2020-21
Electricity consumption fell by 9% compared with 2019-20, from 70 million kWh to 64 million kWh. This was the second lowest electricity figure since the comparable time series began in 2011-12 (lowest usage was 58 million kWh in 2016-17). This led to a decrease in estimated CO2e emissions from electricity, from 18 kilotonnes in 2019-20 to 15 kilotonnes.
There was a slightly larger decrease in diesel consumption, which fell by 11% to 153 million litres. This resulted in 422 kilotonnes of CO2e emissions. Total emissions from both electricity and diesel freight train consumption are the lowest figures since the comparable time series began in 2011-12.
Figure 2.3 CO2e emissions from diesel and electricity freight train traction consumption, Great Britain, 2011-12 to 2020-21

Rail Emissions 2020-21
Office of Rail and Road | 19 August 2021 7
3. Transport emissions in context
This section provides sources of other data on transport emissions, to show rail emissions in context. The Department for Business, Energy and Industrial Strategy (BEIS) produces statistics on greenhouse gas emissions. Please note that these figures are for a different time period (calendar year 2019), with a different methodology and cover the United Kingdom. ORR statistics cover the rail network in Great Britain.
In 2019, UK emissions from the seven greenhouse gases covered by the Kyoto Protocol were estimated to be 454.8 million tonnes carbon dioxide equivalent (MtCO2e). Greenhouse gases in 2019 were estimated to be 43.8% lower than they were in 1990.
Transport was the largest emitting sector of UK greenhouse gases emissions in 2019. Transport emissions were only 4.6% lower than in 1990, as increased road traffic has largely offset improvements in vehicle fuel efficiency. The main source of emissions from this sector is the use of petrol and diesel in road transport. Carbon dioxide makes up over 99% of greenhouse gases from transport.
Figure 3.1 Proportion of greenhouse gas emissions by sector, UK, 2019
Source: Final UK greenhouse gas emissions national statistics: 1990 to 2019, BEIS

Rail Emissions 2020-21
Office of Rail and Road | 19 August 2021 8
In total, transport makes up 27% of all the UK’s CO2e emissions. The transport sector has historically been the second largest sector in terms of emissions. However, reductions over time in what was the largest sector (energy supply) mean that since 2016 transport has been the most emitting sector.
Road transport is the largest sector of emissions within transport, with passenger cars making up the majority of this. In 2019, emissions from transport were estimated to be 122.2 MtCO2e and road transport made up over 90% of this (110.7 MtCO2e).
Rail made up 1.4% of the UK’s transport CO2e emissions in 2019, but in comparison 9.5% of all passenger kilometres were made using rail. Rail emissions accounted for 0.4% of the UK’s total CO2e emissions in 2019.
Figure 3.2 Estimated emissions of carbon dioxide (MtCO2e) by transport category,
UK, 1990 to 2019
Source: Final UK greenhouse gas emissions national statistics: 1990 to 2019 BEIS Table 1.2 Not shown on graph: Buses, Mopeds & motorcycles, Road vehicle LPG and biofuel uses (all vehicles), Incidental lubricant combustion in road engines, Other mobile (Military aircraft and shipping, Aircraft support vehicles). Only includes emissions from vehicles and not from transport related infrastructure or from air conditioning.

Rail Emissions 2020-21
Office of Rail and Road | 19 August 2021 9
There are seven greenhouse gases covered under the Kyoto Protocol: carbon dioxide (CO2), methane (NH4), nitrous oxide (N2O), hydrofluorocarbons (HFCs), perfluorocarbons (PFCs), sulphur hexafluoride (SF6) and nitrogen trifluoride (NF3). Some gases have a higher global warming potential then others, so greenhouse gas emissions are expressed in terms of the million tonnes of carbon dioxide equivalent (MtCO2e). The largest contributor to global warming is carbon dioxide.
Sixth Carbon Budget The government has a legally binding Sixth Carbon Budget which aims to reduce emissions by 78% by 2035 compared to 1990 levels, and reach net zero UK carbon emissions by 2050. Net-zero means any emissions would need to be balanced by schemes to offset an equivalent amount of greenhouse gases from the atmosphere, such as planting trees or using technology like carbon capture and storage. Since 1990, the UK has reduced emissions by 44%.
Moving freight from road to rail is part of the solution and has the potential to help reduce emissions, as part of this a study showed that shifting from HGV road freight to rail could reduce greenhouse gas emissions by nearly a fifth (19%).
Figures using 2012-13 data showed that each tonne of freight transported by rail reduces carbon emissions by 76% compared to road. In 2019-20 ORR rail freight statistics showed there were 6.4 million lorry journeys avoided through transporting freight by rail rather than road. This was the lowest number of avoided lorry journeys since the time series began in 2004-05, reflecting the lower volumes of freight moved by rail in 2019-20.
New analysis showed that there are around £800m in benefits to wider society through removing around 7 million lorry journeys from the road network each year. This includes £27.9 million in social benefits each year through reduced emissions, noise, infrastructure wear and better safety outcomes.
Decarbonisation Department for Transport (DfT) published their Transport decarbonisation plan in July 2021, which sets out plans to achieve a net zero emission rail network by 2050. This will save around 21-22 MtCO2e and achieve up to £1 billion in air quality benefits between 2020 and 2050. This could be achieved by further electrification of the rail network, leading to a removal of diesel passenger trains and investment in new electric locomotives for freight. DfT also published a Rail Environment Policy statement in 2021, which sets out environmental priorities for the mainline railway.

Rail Emissions 2020-21
Office of Rail and Road | 19 August 2021 10
In 2018, DfT challenged the rail industry to remove all diesel-only trains from the network by 2040. The Scottish Government has set a target to decarbonise domestic passenger rail services by 2035. As rail traction accounts for the largest proportion of rail emissions, to achieve net-zero diesel traction will need to reduce. The alternatives to diesel passenger trains are battery, electric or hydrogen rolling stock.
Transport Scotland have published a Rail Services Decarbonisation Action Plan. This looks at how to decarbonise passenger rail services and continue to reduce carbon emissions. Scotland have emissions reduction targets set in law to reach net-zero greenhouse gas emissions by 2045. It is estimated that 76% of passenger and 45% of freight journeys in Scotland run on electric traction.
In 2020, Network Rail published a Traction Decarbonisation Network Strategy, which aims to provide recommendations for Government ‘to inform decisions required to remove diesel trains from the network, achieve net-zero legislative targets, and identify the capital works programme required to achieve this’.
Rail Safety and Standards Board (RSSB) have published as part of the Rail Industry Decarbonisation Taskforce a Final Report for the Minister for Rail. This looks at the challenge set by DfT to remove diesel only trains from service by 2040, and produces a vision for how the rail industry will decarbonise.

Rail Emissions 2020-21
Office of Rail and Road | 19 August 2021 11
4. Annexes Annex 1 — Definitions ● Traction energy refers to rolling stock (railway vehicles, including both powered and
unpowered vehicles, such as locomotives, carriages and freight wagons) on the rail network, and the energy used to power passenger and freight train movements. Non- traction emissions are excluded, such as heating and lighting in buildings, depots and stations.
● Diesel refers to gas, oil, diesel or biofuel volume (in litres) consumed in train movements.
● Electricity measures the amount of electricity consumed (in kWh) in train movements. Kilowatt hour (kWh) is a unit of energy by calculating electricity usage - one kWh is the electric energy converted by a one kW appliance used for one hour.
● Passenger kilometres are calculated by multiplying the number of passenger journeys on a particular flow by the number of corresponding train kilometres between stations.
● Net tonne kilometres measures the amount of freight moved on the railway network, taking into account the weight of the load and distance carried.
● Greenhouse gases are gases in the Earth’s atmosphere which trap heat. They allow sunlight to pass through the atmosphere, but prevent heat from sunlight leaving the atmosphere. This creates a ‘greenhouse effect’, where the Sun’s energy is trapped, which causes the Earth and in particular the oceans, to warm, the higher the amounts of greenhouse gases in the atmosphere, the warmer the Earth becomes. There are seven greenhouse gases covered under the Kyoto Protocol: carbon dioxide (CO2), methane (NH4), nitrous oxide (N2O), hydrofluorocarbons (HFCs), perfluorocarbons (PFCs), sulphur hexafluoride (SF6) and nitrogen trifluoride (NF3).
Further information on each of these measures and other definitions can be found in the quality and methodology report on the Rail Emissions page.

Rail Emissions 2020-21
Office of Rail and Road | 19 August 2021 12
Annex 2 — Quality and methodology Data sources Energy consumption data has been collected directly from train operators:
● Franchised passenger operators
● Non-franchised (open access) passenger operators
● Freight operators
● Eurostar services (UK side).
Passenger kilometre data is sourced from LENNON (Latest Earnings Networked Nationally Over Night) ticketing and revenue system and supplemented with data from train operators who have passenger journeys/kilometres recorded outside of LENNON.
Net tonne kilometres data, used for the normalisation of freight emissions, is sourced from Network Rail.
Estimates for missing data Operators provided either actual diesel and electricity traction consumption figures, or estimated figures.
For 2020-21 the following were estimated by ORR due to operators not providing data:
● Energy consumption from four freight operators. However, more than 99.8% of freight tonne kilometres are covered by the five largest freight operators who provided data.
● All 24 passenger train operators provided actual or estimated energy consumption data, so no estimates from ORR were needed.
Methodology Energy consumption data is converted into CO2e using standard conversion factors from the Department for Business, Energy and Industry Strategy (BEIS). The emission conversion factors allow activity data (for example, litres of fuel used or kWh consumed) to be converted into kilograms of CO2e.

Rail Emissions 2020-21
Office of Rail and Road | 19 August 2021 13
Revisions There have been revisions to previously published data since they were last published.
● Table 6100 - Estimates of normalised passenger and freight carbon dioxide equivalent (CO2e) emissions have been revised for four years (2016-17 to 2019-20) due to passenger kilometres and freight net tonne kilometres revisions.
● Table 6105 - Estimates of passenger and freight energy consumption and carbon dioxide equivalent (CO2e) emissions has been revised for four years (2016-17 to 2019-20) due to passenger kilometres and freight net tonne kilometres revisions. This has affected the estimates for missing diesel and electricity consumption for passenger and freight operators. The methodology is unchanged from previous years.
Further details on the revisions can be found in the Revisions log.
Further information on data sources, quality, and the methodology used to calculate the data within this release can be found in the quality and methodology report on the Rail Emissions page.
How these statistics can and cannot be used
● Monitoring and comparing electricity and diesel traction consumption by passenger and freight trains over time
● Monitoring estimated CO2e emissions from traction energy by passenger and freight trains over time
● Monitoring normalised CO2e emissions for passenger and freight trains over time
● Comparing emissions for a specific train type or route (refer to DfT journey emission comparisons data)
● Comparing emissions for a specific passenger or freight operator
● Identifying emissions for heritage or other non-mainline operators
● Calculating emissions for non-traction energy such as stations, buildings or depots
● Identifying expenditure on diesel fuel for passenger operators (refer to rail industry finance)
Rail Emissions 2020-21
Office of Rail and Road | 19 August 2021 14
Annex 3 – List of data tables associated with this release and other related statistics Data tables All data tables can be accessed on the ORR data portal free of charge in OpenDocument Spreadsheet (.ods) format. We can also provide data in csv format on request.
All tables associated with this release can be found under the Data tables heading at the bottom of the Rail Emissions page.
● Estimates of normalised passenger and freight carbon dioxide equivalent (CO2e) emissions – Table 6100
● Estimates of normalised passenger and freight energy consumption and carbon dioxide equivalent (CO2e) emissions – Table 6105
Other related ORR statistics Passenger usage data is published on the Passenger rail usage page on the data portal. This includes the number of passenger journeys, passenger kilometres by operator and train kilometres by operator.
Passenger performance data is published on the Passenger rail performance page on the data portal. This includes the number of trains planned every quarter.
Freight usage data is published on the Freight rail usage and performance page on the data portal. This includes the number of annual freight trains ran, freight moved by commodity and freight train kilometres by operator.
The Rail infrastructure and assets page on the data portal contains information on track and route length, including the proportion of the rail network which is electrified.
Environmental statistics The Department for Business, Energy & Industrial Strategy (BEIS) publish estimates of UK territorial greenhouse gas emissions.
The Department for Environmental, Food & Rural Affairs (Defra) publish data on emissions of air pollutants in the UK. This includes data for transport and railways.
The National Atmospheric Emissions Inventory (NAEI) publish the Greenhouse Gas Inventory. It covers the UK’s greenhouse gas emission estimates since 1990, broken down by industry. Rail data is included in the inventory, split into emissions from coal, freight diesel, intercity diesel and regional diesel (gas oil). There is also an interactive map which

Rail Emissions 2020-21
Office of Rail and Road | 19 August 2021 15
shows CO2e emissions by local authority with an option to filter for emissions from diesel railways.
The Office for National Statistics publish UK estimates of the different greenhouse gases and total emissions by industry, This covers the period 1990 to 2019. This data is used in UK Environmental Accounts, which measures the impact of economic activity on the environment.
There is a list on GOV.UK of resources relating to historical UK greenhouse gas emissions.
European comparisons The United Nations Framework Convention on Climate Change (UNFCCC) publishes national inventory submissions for greenhouse gas emissions.
The European Environment Agency (EEA) publishes data on greenhouse gas emissions for transport from the EU. Railway emissions, (which only include emissions from diesel trains) have halved since 1990, but they constitute a small proportion of overall transport emissions.

Rail Emissions 2020-21
Office of Rail and Road | 19 August 2021 16
Annex 4 – ORR’s statistical publications Statistical Releases This publication is part of ORR’s National Statistics accredited releases, which consist of seven annual publications: Estimates of Station Usage; Rail Industry Finance (UK); Rail Fares Index; Rail Safety Statistics; Rail Infrastructure and Assets; Rail Emissions; Regional Rail Usage; and four quarterly publications: Passenger Rail Performance; Freight Rail Usage and Performance; Passenger Rail Usage; Passenger Rail Service Complaints.
In addition, ORR also publishes a number of Official Statistics, which consist of three annual publications: Train Operating Company Key Statistics; Rail Statistics Compendium; Occupational Health; and four quarterly publications: Signals passed at danger (SPADS); Delay Compensation Claims; Disabled Person’s Railcards (DPRC); Passenger assistance.
All the above publications are available on the ORR data portal along with a list of publication dates for the next 12 months.
National Statistics The United Kingdom Statistics Authority designated these statistics as National Statistics, in accordance with the Statistics and Registration Service Act 2007 and signifying compliance with the Code of Practice for Official Statistics. National Statistics status means that official statistics meet the highest standards of trustworthiness, quality and public value.
The majority of these statistical releases were assessed in 2012 and also hold National Statistics status. Since our assessment we have improved the content, presentation and quality of our statistical releases. In addition, in July 2019 we launched our new data portal. Therefore, in late 2019 we worked with the Office for Statistics Regulation (OSR) to conduct a compliance check to ensure we are still meeting the standards of the Code. On 4 November 2019, OSR published a letter confirming that ORR’s statistics should continue to be designated as National Statistics. OSR found many positive aspects in the way that we produce and present our statistics and welcomed the range of improvements made since the statistics were last assessed. Estimates of Station Usage statistics were assessed in 2020.
For more information on how we adhere to the Code please see our compliance statements. For more details or to provide feedback, please contact the Statistics Head of Profession (Lyndsey Melbourne) at [email protected].

Rail Emissions 2020-21
Office of Rail and Road | 19 August 2021 17
© Crown copyright 2021
This publication is licensed under the terms of the Open Government Licence v3.0 except where otherwise stated.
Where we have identified any third party copyright information you will need to obtain permission from the copyright holders concerned.
This publication is available on the ORR data portal
Any media enquiries regarding this publication should be sent to us at orr.gov.uk/contact-us.