radon measurement for neutrinoless double beta decay
TRANSCRIPT
University of New MexicoUNM Digital Repository
Physics & Astronomy ETDs Electronic Theses and Dissertations
Summer 7-16-2018
Radon Measurement for Neutrinoless Double BetaDecayXavier Carlos QuintanaUniversity of New Mexico
Follow this and additional works at: https://digitalrepository.unm.edu/phyc_etds
Part of the Astrophysics and Astronomy Commons, and the Physics Commons
This Thesis is brought to you for free and open access by the Electronic Theses and Dissertations at UNM Digital Repository. It has been accepted forinclusion in Physics & Astronomy ETDs by an authorized administrator of UNM Digital Repository. For more information, please [email protected].
Recommended CitationQuintana, Xavier Carlos. "Radon Measurement for Neutrinoless Double Beta Decay." (2018). https://digitalrepository.unm.edu/phyc_etds/184

i
Xavier C. Quintana Candidate
Physics and Astronomy
Department
This thesis is approved, and it is acceptable in quality and form for publication:
Approved by the Thesis Committee:
Dinesh Loomba , Chairperson
Douglas Fields
Michael Gold
ii
RADON MEASUREMENT FOR
NEUTRINOLESS DOUBLE BETA DECAY
by
XAVIER C. QUINTANA
B.S., PHYSICS, NEW MEXICO INSTITUTE OF MINING
AND TECHNOLOGY, 2012
THESIS
Submitted in Partial Fulfillment of the
Requirements for the Degree of
Master of Science
Physics
The University of New Mexico
Albuquerque, New Mexico
July, 2018
iii
Dedication
In dedication to my beloved grandmothers, Evangeline G. Quintana and Rebecca
M. Lucero. I am eternally grateful for the many memories and lessons you have given me
over our time shared together. May this document serve as statement of your legacy.

iv
Acknowledgements
With immense gratitude, I wish to thank my advisor, Dinesh Loomba, for many
months of support and guidance in both research and academics. I wish to thank Dr.
Loomba, Dr. Fields, Dr. Gold, and Dr. Boyd for the insights and guidance during this
research project. I wish to thank my colleagues Neil McFadden and Ryan Gibbons for
their contributions to this effort.
I wish to thank members of the MAJORANA and LEGEND Collaborations for
the impactful research towards a deeper understanding of the nature of the universe. I
especially would like to acknowledge Steven Elliott, Keith Rielage, Vincent Guiseppe,
Ralph Massarczyk, Brian Zhu, and Brandon White. I wish to thank Los Alamos National
Laboratory for providing funding and equipment for this project.
I wish to thank the UNM Earth Science Department for lending a rock sample. I
also wish to thank Granite Passion for donating granite samples for testing and
measurement.
v
RADON MEASUREMENT FOR
NEUTRINOLESS DOUBLE BETA DECAY
by
Xavier C. Quintana
B.S., Physics, New Mexico Institute of Mining and Technology, 2012
M.S., Physics, University of New Mexico, 2018
ABSTRACT
This thesis details the design and operation of a high-sensitivity radon detector for
use in background radiation characterization and mitigation for the MAJORANA
DEMONSTRATOR Neutrinoless Double Beta Decay Experiment and Large Enriched
Germanium Experiment for Neutrinoless Double Beta Decay (LEGEND) Collaboration.
Understanding and mitigating background radiation is especially important in searches
for very rare nuclear processes, which utilize sensitive detectors. One such rare process is
the yet-to-be-observed neutrinoless double beta decay. Observation of this process would
imply that the neutrino is its own antiparticle, called a Majorana particle, violate lepton
number, and provide experimental constraints on the masses and mixing angles between
neutrino mass and flavor eigenstates.
vi
While most sensitive rare search experiments are placed deep underground to shield
from cosmic radiation, radon provides a significant and pervasive source of background
radiation. This background radiation could potentially make an experiment futile as any
small signal of interest could be hidden in a large amount of background events. Radon is
a decay product of both uranium and thorium, which are found in rock, soil, and many
common materials. Radon is the only daughter in the uranium and thorium decay chains
that is gaseous, so it is able to escape materials either through pores and fissures or
diffusion through the material.
Our radon detector utilizes a large electropolished stainless steel vessel to collect gas
and a high electric field to collect charged radon daughters on a silicon PIN photodiode.
Alpha particles from radon daughter decays, primarily that of 214Po, are measured with
the photodiode and a radon concentration in the gas is determined from the measured
activity. The collection efficiency, and thus calibration factor from photodiode activity to
radon activity, is determined by using air and an ore-like mineral as sources and a
Durridge RAD7 radon detector as a calibration standard. The detector also includes an in-
line emanation chamber to test the radon emanation from materials of interest. Utilization
of this detector in the construction and operation of any ultra-low background search
provides valuable quantization of ambient radon backgrounds to a sensitivity of the order
mBq/m2.
vii
Table of Contents
Dedication .......................................................................................................................... iii
Acknowledgements ............................................................................................................ iv
ABSTRACT ........................................................................................................................ v
List of Figures ..................................................................................................................... x
List of Tables .................................................................................................................. xvii
1 Theoretical Background .............................................................................................. 1
1.1 Dirac and Majorana Fermions .............................................................................. 1
1.2 Single Beta Decay ................................................................................................ 4
1.2.1 Nuclear Stability and Decay Conditions ....................................................... 7
1.3 Two-Neutrino Double Beta Decay ..................................................................... 10
1.3.1 Decay Rates and Nuclear Matrix Elements ................................................ 13
1.4 Neutrinoless Double Beta Decay ....................................................................... 14
2 Experimental Efforts for 0νββ ................................................................................... 20
2.1 Background Sources ........................................................................................... 27
3 Natural Production of Radon ..................................................................................... 30
3.1 Radon Mitigation through Material Assay ......................................................... 36
3.2 Radon Background Characterization through Material Assay ........................... 37
4 MAJORANA Demonstrator Radon Detection Chamber .......................................... 39
viii
4.1 Motivation .......................................................................................................... 39
4.2 Detector System Design ..................................................................................... 39
4.3 Principle of Operation ........................................................................................ 43
4.4 Efficiency of ion collection ................................................................................ 52
5 Detector Efficiency Measurements ........................................................................... 56
5.1 Calibration and Collection Efficiency ................................................................ 56
5.2 Room Air Measurements ................................................................................... 60
5.3 U/Th Ore Rock Measurements ........................................................................... 64
6 Intrinsic Background Characterization ...................................................................... 79
6.1 Motivation for Detector Background Characterization ...................................... 79
6.2 First Vessel Background Estimate ..................................................................... 79
6.3 Improved Background Measurement- Nitrogen Gas Flush ............................... 83
6.4 External Heat Source-Supported Boil-off .......................................................... 95
6.5 Second Immersion Heater Design ...................................................................... 99
6.6 Background Activity Measurement with LN Flush & Moderate Vacuum ...... 104
7 Investigation of Background Sources ...................................................................... 109
7.1 Vessel Leak Investigation ................................................................................ 109
7.2 Vacuum Pumping- Leak investigation ............................................................. 115
7.3 Electrical Noise Investigation- Faraday Cage .................................................. 117
ix
8 Reducing Background Activity ............................................................................... 124
8.1 Cleaning Vessel Interior ................................................................................... 124
8.2 O-Ring Replacement ........................................................................................ 128
8.3 Low Vessel Bias Voltage Test ......................................................................... 130
8.4 Re-electropolish Vessel and Clean Lid ............................................................ 132
8.5 Photodiode and Brass Screw Replacement ...................................................... 134
8.6 Removing the Stainless-Steel Inlet Pipe .......................................................... 138
8.7 Replaced Tophat and Additional Brass Screws ............................................... 139
8.8 Replaced Electropolished Stainless Steel Inlet Pipe ........................................ 141
8.9 Background Activity Measurement with Emanation Chamber ....................... 141
9 Emanation Measurement ......................................................................................... 143
9.1 First emanation run- Granite Sample #1 .......................................................... 145
9.2 Gas Flow Characterization of Emanation Chamber ......................................... 150
9.3 Granite Sample #2 ............................................................................................ 153
10 Future Work and Recommendations ................................................................... 156
11 Summary .............................................................................................................. 157
References ....................................................................................................................... 160
x
List of Figures
Figure 1: Feynman Diagrams for β- and β+Decays [10] ..................................................... 5
Figure 2: Binding Energy per Nucleon predicted by the Weizsacker Equation ................. 9
Figure 3: Line that traces the Valley of Stability .............................................................. 10
Figure 4: A=76 masses with the spin pairing term exaggerated slightly to show likely ββ
decay from 76Ge to 76Se .................................................................................................... 11
Figure 5: Feynman Diagram depicting 2νββ [10] ............................................................. 12
Figure 6: Feynman Diagram depicting 0νββ mediated by a Majorana neutrino [10]....... 15
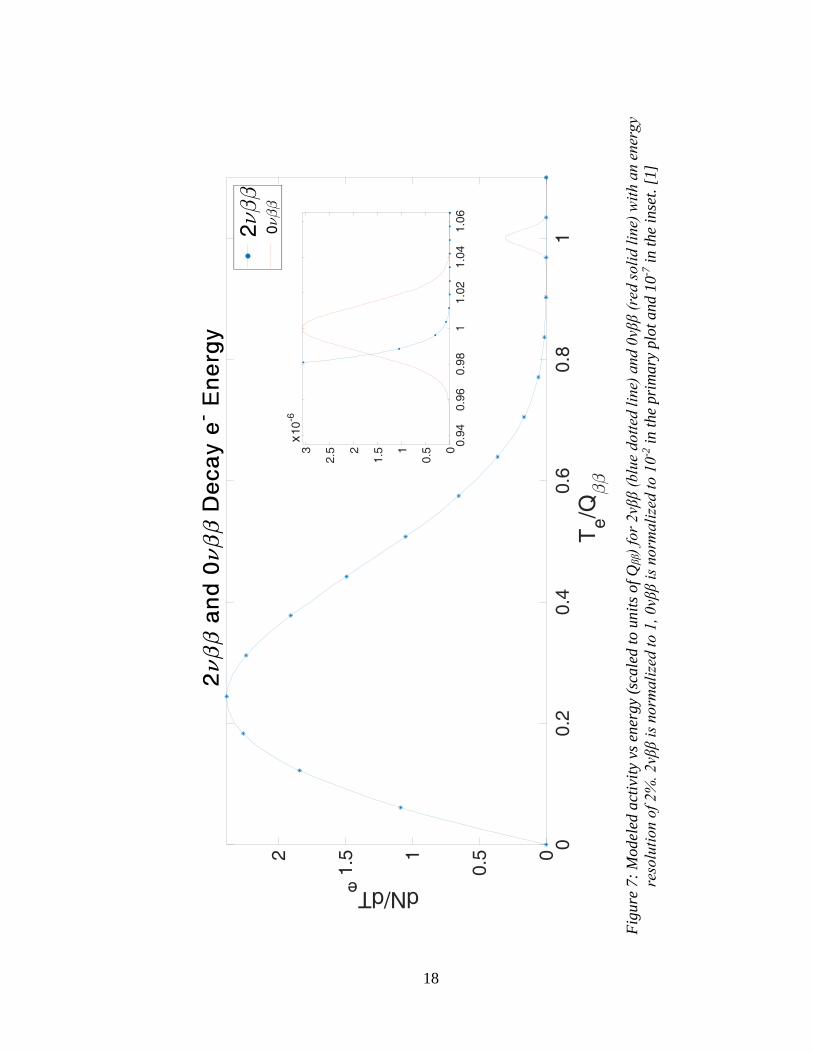
Figure 7: Modeled activity vs energy (scaled to units of Qββ) for 2νββ (blue dotted line)
and 0νββ (red solid line) with an energy resolution of 2%. 2νββ is normalized to 1, 0νββ
is normalized to 10-2 in the primary plot and 10-7 in the inset. [1] ................................... 18
Figure 8: Schematic diagram of the MAJORANA DEMONSTRATOR, including the
shielding layers and the inner detector vessel containing the 76Ge detector arrays [24] .. 26
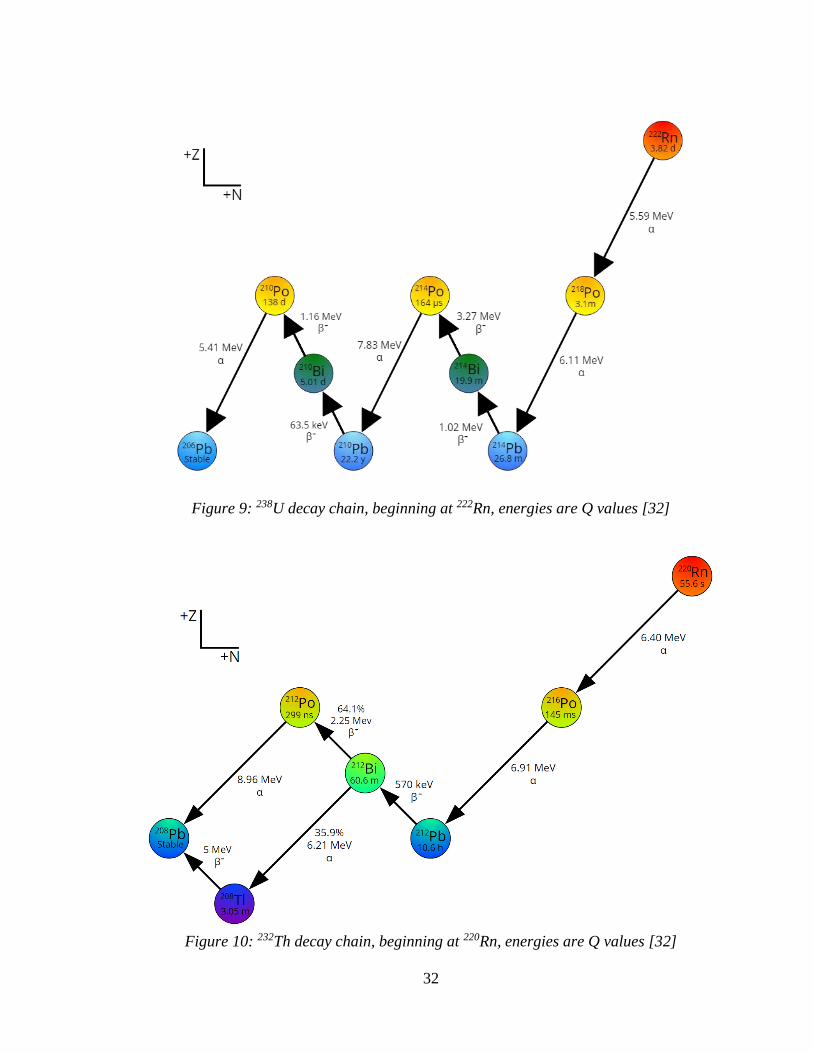
Figure 9: 238U decay chain, beginning at 222Rn, energies are Q values [32] ..................... 32
Figure 10: 232Th decay chain, beginning at 220Rn, energies are Q values [32] ................. 32
Figure 11: MAJORANA Radon Detector Vessel ............................................................. 40
Figure 12: Inlet pipe, the shape is designed to minimize disruption of the electrostatic
field ................................................................................................................................... 41
Figure 13: Vessel with vacuum valve and inlet pipe installed; C-clamps provide
additional sealing between the lid and the vessel ............................................................. 41
Figure 14: Detection of Rn via electrostatic collection on the photodiode ....................... 44
Figure 15: Total Mass Stopping Power for electrons in Si [44] ....................................... 47
xi
Figure 16: Total Mass Stopping Power for alphas in Si [45] ........................................... 47
Figure 17: Typical MCA Spectrum calibrated for energy, vertical lines represent decays
products of 238U (solid red) and 232Th (dashed green) ...................................................... 49
Figure 18: MCA measured events vs Time (x-axis) and Energy (y-axis); each mark
indicates one count ............................................................................................................ 51
Figure 19: Fraction of Po ions deposited on the photodiode surface, neglecting losses due
to collisions, as a function of vessel voltage ..................................................................... 54
Figure 20: Average Room Temperature vs Time of Day, averaged over 6 months ......... 60
Figure 21: Collection efficiency from 214Po, using room air as a source ......................... 63
Figure 22: Collection efficiency from 218Po, using room air as a source ......................... 63
Figure 23: Room Air vs Rock Sample Spectra- Both runs taken at 5KV Vessel bias over a
time period of 12 hours; energy bins are approximately 12 keV ...................................... 65
Figure 24: Collection efficiency from 214Po, using a rock sample as a source ................. 69
Figure 25: Collection efficiency from 218Po, using a rock sample as a source ................. 69
Figure 26: Photodiode Mount Geometry a) with initial 18x18mm2 Hamamatsu S3204-09
Si Pin Photodiode; b) with 28x28mm2 Hamamatsu S3584-09 Si Pin Photodiode ........... 70
Figure 27: Diagram of modifications to diode housing unit: a) addition of HV putty to
ground wire to reduce electrical breakdown; b) placement of Kapton tape between leads
of the photodiode and the mount ...................................................................................... 71
Figure 28:MCA Spectrum of two similar runs with photodiode #1(green) and photodiode
#2 (blue) ............................................................................................................................ 72
Figure 29: Photodiode in Cu mount; note the HV putty around the mount ground wire
connection as indicated in Figure 27, also note the nylon screws .................................... 73
xii
Figure 30: Photodiode sitting flush Cu mount; note the Kapton tape across the photodiode
leads .................................................................................................................................. 73
Figure 31: Collection efficiency from 214Po, after replacing the photodiode ................... 75
Figure 32: Collection efficiency from 218Po, using a rock sample as a source ................. 75
Figure 33: 214Po efficiencies using a larger photodiode vs the first photodiode ............... 76
Figure 34: 218Po efficiencies using a larger photodiode vs the first photodiode ............... 76
Figure 35: Plot of 214Po activity for a background run of approximately 333 hours, the
activity falls with a half-life of 3.82 days, consistent with radioactive equilibrium with
222Rn .................................................................................................................................. 82
Figure 36: Boil-off LN dewar, on the left is a liquid port, on the right is a gas port
connected to our Cu tubing, center is a pressure gauge atop two pressure relief valves .. 84
Figure 37: 214Po activity during the initial boil-off LN flush ............................................ 86
Figure 38: 218Po activity during the initial boil-off LN flush ............................................ 87
Figure 39: MCA events vs time and energy during the initial boil-off LN flush ............. 88
Figure 40: 210Po activity during the 2nd LN flush ............................................................. 90
Figure 41: 212Po activity during the 2nd LN flush ............................................................. 91
Figure 42: 214Po activity during the 2nd LN flush ............................................................. 92
Figure 43: 218Po activity during the 2nd LN flush ............................................................. 93
Figure 44: Beverage heater for LN boiling. Note tape around heater base. Length from
the bottom of the stopper to the end of the heater is 56 cm. ............................................. 96
Figure 45: Stopper placed on LN dewar and connected to PFA tubing ........................... 96
Figure 46: Reduction in 214Po activity during LN flush using immersion heater, flush
begins at 37.7 hours of run time and ends at 55.7 hours ................................................... 98
xiii
Figure 47: Reduction in 218Po activity during LN flush using immersion heater, flush
begins at 37.7 hours of run time and ends at 55.7 hours ................................................... 98
Figure 48: Omega KH-404/10P Kapton heating film [62] ............................................... 99
Figure 49: Dewar cap feedthrough configuration ........................................................... 100
Figure 50: Measured MCA events during the first LN flush with the new heater system.
a. Flush stopped and vessel sealed at t=70 hours. b. Faraday cage grounding modified at
t=157.8 hours. Blinded regions correspond to time bins removed for excessive noise. . 102
Figure 51: 214Po activity during the first LN flush with the new heater system. a. Flush
stopped and vessel sealed at t=70 hours. b. Faraday cage grounding modified at t=157.8
hours. Blinded regions correspond to time bins removed for excessive noise. .............. 103
Figure 52: 214Po activity during first run with pumping to approximately 400 Torr after an
LN flush. The first flush was unsuccessful due to LN evaporation faster than expected 106
Figure 53: Falling 212Po activity rate during the first nitrogen+vacuum run .................. 107
Figure 54: MCA Scatterplot during the vessel leak trial run .......................................... 110
Figure 55: 212Po activity during the vessel leak trial run. The error bars denote standard
counting error of the square root of the number of counts ............................................. 111
Figure 56: 214Po activity during the vessel leak trial run. At 217 hours of run time one
side of the vessel was opened to simulate a leak ............................................................ 112
Figure 57: 218Po activity during the vessel leak trial run. At 217 hours of run time one
side of the vessel was opened to simulate a leak ............................................................ 113
Figure 58: Assembled vessel with C-clamps installed ................................................... 114
Figure 59: Vacuum pumping components. Bellows hose leads to the vacuum pump ... 115
xiv
Figure 60: Pressure rise test of possible vessel leak, no significant leak indicated, inlay
boxes focus on trials at ~414 Torr and 500 Torr ............................................................ 116
Figure 61: MCA events before and after installation of a Faraday cage at t=69 hours,
periods of high noise are noted by a high density of event markers ............................... 120
Figure 62: Histogram of events above 10 MeV, showing the effect of electrical noise
across the entire MCA spectrum, most notably before the Faraday cage was installed at
t=69 hours ....................................................................................................................... 121
Figure 63: 210Po activity as affected by high electrical noise, particularly before
installation of the Faraday cage at t=69 hours ................................................................ 122
Figure 64: 214Po activity as affected by high electrical noise, particularly before
installation of the Faraday cage at t=69 hours ................................................................ 123
Figure 65: MCA spectrum during the final 40 hours of the runs before (blue) and after
(red) cleaning the vessel. Note that the activities of 214Po and 218Po are increased yet the
activity of 210Po remains constant, verifying detector performance ............................... 125
Figure 66: 212Po activity after cleaning the vessel. There is an elevated activity relative to
before cleaning ................................................................................................................ 126
Figure 67: 214Po activity after cleaning the vessel. There is an elevated activity relative to
before cleaning ................................................................................................................ 127
Figure 68: MCA Spectrum during the first run after cleaning (blue) and after installing
new O-rings (red). There is little difference between the two except for a slightly higher
activity after installing the new O-rings.......................................................................... 129
Figure 69: 210Po activity during checks at various voltages (red) ................................... 131
Figure 70: 214Po activity during checks at various voltages (red) ................................... 131
xv
Figure 71: 212Po activity during checks at various voltages (red) ................................... 132
Figure 72: Vessel activity prior to (solid blue) and after (dashed red) electropolishing the
vessel and cleaning the lid. 214Po and 218Po are reduced while 212Po and 210Po are
unaffected ........................................................................................................................ 133
Figure 73: Comparison of similar runs before (blue) and after (red) replacing the
photodiode, cleaning the photodiode mount and replacing brass screws ....................... 135
Figure 74: 212Po Activity after replacing the photodiode, cleaning the photodiode mount,
and replacing brass screws .............................................................................................. 136
Figure 75: 214Po Activity after replacing the photodiode, cleaning the photodiode mount,
and replacing brass screws .............................................................................................. 137
Figure 76: 214Po activity during a background run with no inlet pipe. The inlet pipe is
critical to an effective LN flush ...................................................................................... 138
Figure 77: Comparison of activities before (blue) and after (red) replacing the tophat and
the remaining brass screws ............................................................................................. 140
Figure 78: Emanation Chamber with Quarter-turn Valve .............................................. 143
Figure 79: Gas Flow Diagram of the Radon Detector System ....................................... 144
Figure 80: Granite Sample #1 ......................................................................................... 145
Figure 81: Granite Sample #1 Activity. Note the peak around 6.78 MeV, corresponding
to 216Po ............................................................................................................................ 146
Figure 82: 212Po Activity vs Time for Granite Sample #1 .............................................. 147
Figure 83:214Po Activity vs Time for Granite Sample #1 ............................................... 148
Figure 84: 216Po Activity vs Time for Granite Sample #1 .............................................. 148
Figure 85: 218Po Activity vs Time for Granite Sample #1 .............................................. 149
xvi
Figure 86: Activities of 214Po and 218Po during the room air characterization run. Room
air flushing from 0-26.75 and 174-263 hours, sealed from 26.75-174 hours, and
circulation pump off from 75-78 and 156-174 hours...................................................... 152
Figure 87: 212Po Activity vs Time. Decay constant (p1) corresponds to 10.78±0.11
hours, near the 10.64 half-life of 212Pb ........................................................................... 152
Figure 88: Granite Sample #2 ......................................................................................... 153
Figure 89: 218Po Activity during Emanation Measurement of Granite Sample #2 ......... 154
Figure 90: 214Po Activity during Emanation Measurement of Granite Sample #2 ......... 154
Figure 91: 212Po Activity during Emanation Measurement of Granite Sample #2 ......... 155
xvii
List of Tables
Table 1: Rn Collection Efficiency- Room Air .................................................................. 62
Table 2: Rn Collection Efficiency- Rock Sample, Photodiode #1 ................................... 68
Table 3: Rn Collection Efficiency-Rock Sample, Photodiode #2 .................................... 74
Table 4: Summary of Vessel Background Activity Runs; *N/A indicates that the 210Po
activity was below the noise level .................................................................................. 142
1
1 Theoretical Background
Observation of the theoretical nuclear rare decay process neutrinoless double beta
decay (0νββ) would provide us with a few important pieces of information on the nature
and interaction of the weak nuclear force, the properties and nature of neutrinos, and
physics beyond the standard model. Observation of 0νββ would provide compelling
evidence that the neutrino is its own anti-particle, called a Majorana particle [1]. Proof of
the Majorana nature of the neutrino could influence theories of the early universe by
testing theories of baryogenesis [2], the origin of matter-antimatter asymmetry in the
observed universe. Further, Majorana particles open new possibilities for theories of dark
matter candidates [3], as well as provide information on the properties of the neutrino,
including the masses and oscillation dynamics of the mass eigenstates [1]. Further, this
process would show that lepton number is not always conserved, which may also shed
new light on theories of baryogenesis [2].
1.1 Dirac and Majorana Fermions
The notion of a particle which is its own antiparticle is related to the very discovery
of antiparticles themselves. In 1928, while extending the Schrodinger and Klein-Gordon
equations to the electron, Paul Dirac developed a relativistic wave equation that is
applicable to all spin-1/2, massive particles [4]:
( ) 0 1,2,3,4k
ki m k − = = (1)
where m and ψ are the mass and wavefunction of the particle, respectively, ∂k is the
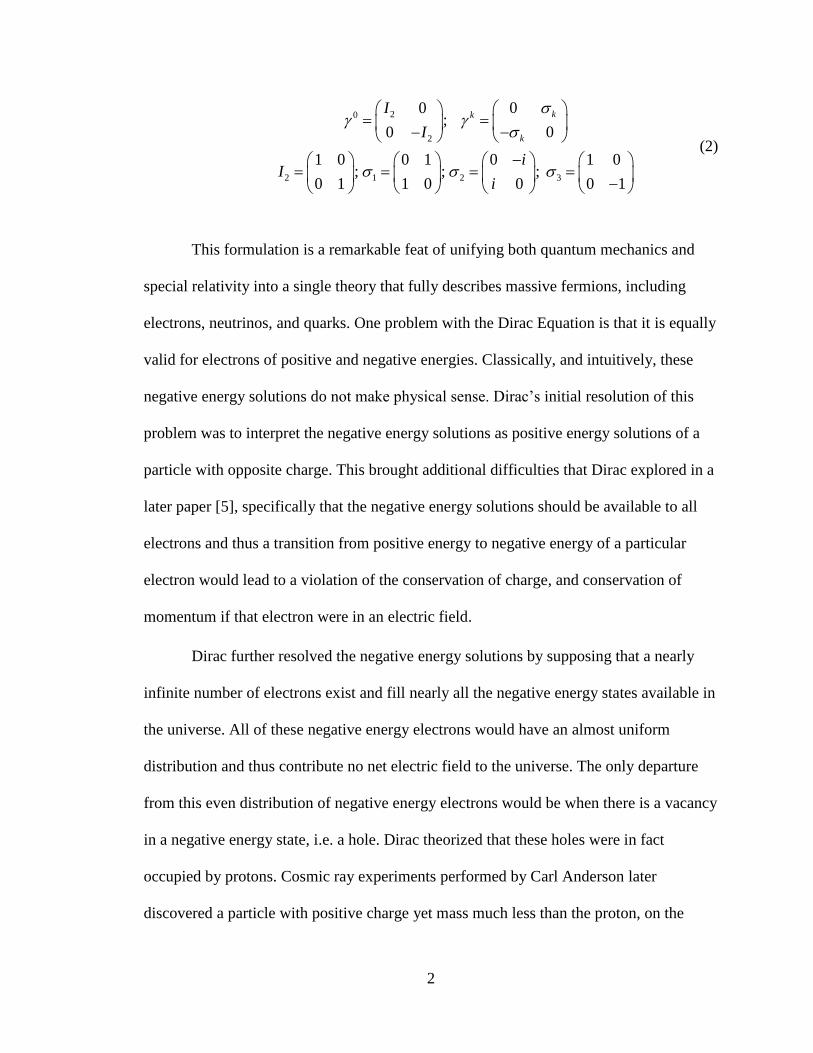
derivative with respect to the kth component, and γk are matrices given by the following:
2
20
2
2 1 2 3
00;
00
1 0 0 1 0 1 0; ; ;
0 1 1 0 0 0 1
kk
k
I
I
iI
i
= =
−−
− = = = =
−
(2)
This formulation is a remarkable feat of unifying both quantum mechanics and
special relativity into a single theory that fully describes massive fermions, including
electrons, neutrinos, and quarks. One problem with the Dirac Equation is that it is equally
valid for electrons of positive and negative energies. Classically, and intuitively, these
negative energy solutions do not make physical sense. Dirac’s initial resolution of this
problem was to interpret the negative energy solutions as positive energy solutions of a
particle with opposite charge. This brought additional difficulties that Dirac explored in a
later paper [5], specifically that the negative energy solutions should be available to all
electrons and thus a transition from positive energy to negative energy of a particular
electron would lead to a violation of the conservation of charge, and conservation of
momentum if that electron were in an electric field.
Dirac further resolved the negative energy solutions by supposing that a nearly
infinite number of electrons exist and fill nearly all the negative energy states available in
the universe. All of these negative energy electrons would have an almost uniform
distribution and thus contribute no net electric field to the universe. The only departure
from this even distribution of negative energy electrons would be when there is a vacancy
in a negative energy state, i.e. a hole. Dirac theorized that these holes were in fact
occupied by protons. Cosmic ray experiments performed by Carl Anderson later
discovered a particle with positive charge yet mass much less than the proton, on the
3
order of the electron mass [6]. Anderson identified this particle to be the positron, or
positive electron. Dirac incidentally predicted antimatter through his “hole” theory, and
Anderson observed that antimatter.
In response to Dirac’s hole theory, and the discovery of the positron, Ettore
Majorana proposed a new representation which would change the Dirac equation.
Majorana suggested that we can consider a case where the Dirac Equation is purely real
by considering the electron wavefunction to have a real part and an imaginary part and
taking only the real part [7]. This is functionally done by redefining the gamma matrices
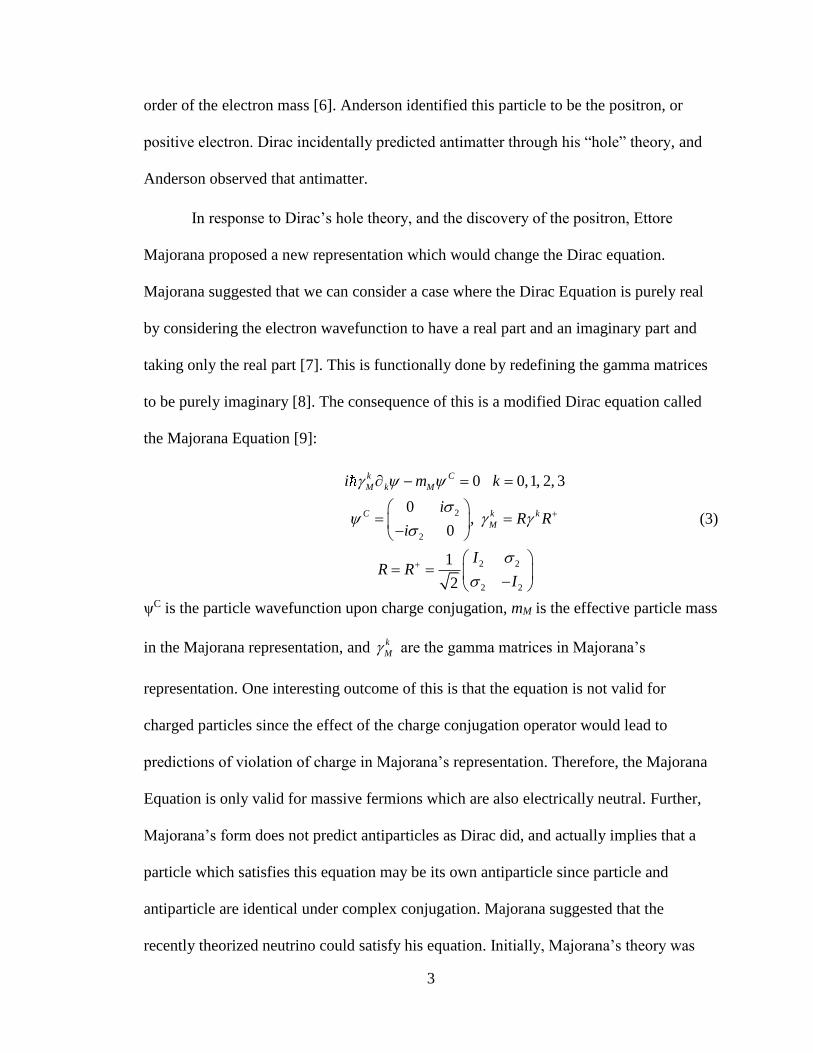
to be purely imaginary [8]. The consequence of this is a modified Dirac equation called
the Majorana Equation [9]:
2
2
2 2
2 2
0 0,1, 2, 3
0,
0
1
2
k C
M k M
C k k
M
i m k
iR R
i
IR R
I
+
+
− = =
= =
−
= =
−
(3)
ψC is the particle wavefunction upon charge conjugation, mM is the effective particle mass
in the Majorana representation, and k
M are the gamma matrices in Majorana’s
representation. One interesting outcome of this is that the equation is not valid for
charged particles since the effect of the charge conjugation operator would lead to
predictions of violation of charge in Majorana’s representation. Therefore, the Majorana
Equation is only valid for massive fermions which are also electrically neutral. Further,
Majorana’s form does not predict antiparticles as Dirac did, and actually implies that a
particle which satisfies this equation may be its own antiparticle since particle and
antiparticle are identical under complex conjugation. Majorana suggested that the
recently theorized neutrino could satisfy his equation. Initially, Majorana’s theory was
4
not seriously considered since it was, at the time, widely believed that neutrinos were
massless. After it was proven that all flavors of neutrinos must have mass, the notion of a
Majorana neutrino was re-introduced [10]. One prospective test for the possible Majorana
nature of the neutrino is 0νββ.
1.2 Single Beta Decay
Before exploring the theory and implications of 0νββ, we first briefly discuss two
similar processes that have indeed been observed: beta decay and ordinary, or two
neutrino double beta decay (2νββ). Beta decay involves the nuclear transmutation of a
nucleus that results in the emission of a beta particle, which is an electron or positron
depending on the details of the transmutation, and an electron-type antineutrino (or
neutrino) [10]. Beta decay has a special role in nuclear physics as it was the first decay
process to be observed, via the work of Becquerel and Rutherford [11]. Inconsistencies in
its experimentally observed energy spectra were the basis for the theoretical prediction of
the neutrino [12]. Its relatively simple transition made it among the first decay processes
to have an energy spectrum derived from theory [13], and today we search for a special
kind of beta decay.
Specifically, beta decay is a flavor-changing charged-current weak interaction that
involves the transition of a down quark into an up quark (or vice versa) via a virtual
charged W boson, which decays into an electron and an antineutrino (or positron and
neutrino) [10]. This quark flavor change transforms a neutron into a proton (or vice
versa), which in turn results in the transmutation. The process where a neutron becomes a
proton is called −-decay due to the charge of the virtual W boson (W-). Similarly, the
5
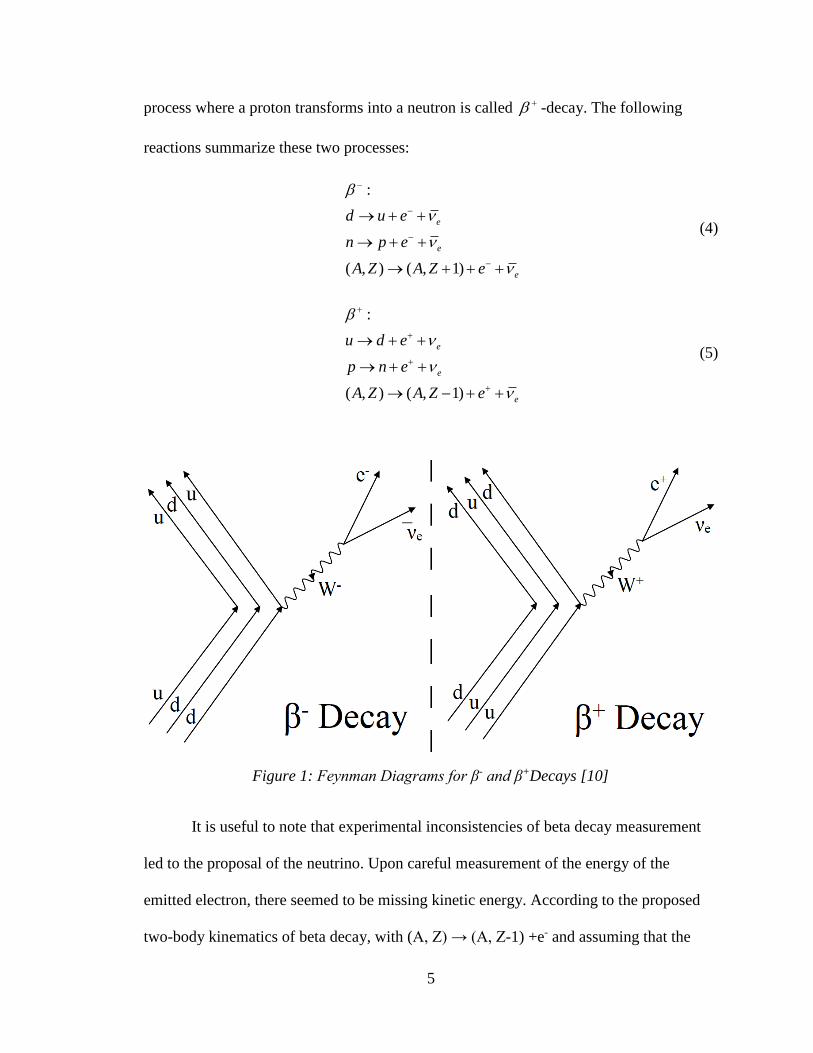
process where a proton transforms into a neutron is called + -decay. The following
reactions summarize these two processes:
:
( , 1( ), )
e
e
e
d u e
p e
A A eZ Z
n
−
−
−
−
→ +
→ + +
++
+
→
+ (4)
:
( , 1( ), )
e
e
e
u d e
p n e
A eZ A Z
+
+
+
+
→ +
→ − +
++
+
→
+ (5)
It is useful to note that experimental inconsistencies of beta decay measurement
led to the proposal of the neutrino. Upon careful measurement of the energy of the
emitted electron, there seemed to be missing kinetic energy. According to the proposed
two-body kinematics of beta decay, with (A, Z) → (A, Z-1) +e- and assuming that the
Figure 1: Feynman Diagrams for β- and β+Decays [10]
6
recoil kinetic energy of the daughter nucleus is negligible, the total energy of the emitted
electron would be equal to the difference in rest mass energy between the parent and the
daughter nuclei, known as the Q-value:
( )
( )
22 2 2 2
22 2 2
2 2 2
( ) ( )
( ) ( )
( ) .
P D D e D e D e
e P D e e e
e e
m c m c p c E m c E m m
E m m c Q E m c p c
p c Q m c const
= + + +
− = = = +
− =
(6)
where mic2 are the rest mass energies, pic are the kinetic energies, Ee is the total energy of
the emitted electron, Qβ is the Q-value of the reaction. The assumption that recoil energy
of the daughter nucleus is negligible is valid due to conservation of momentum. The mass
of the daughter nucleus is much larger than the mass of the electron, so the nucleus would
have very little velocity compared to the electron. Since the rest mass energies are fixed
values, the kinetic energy of the emitted electron would be a singular value. Rather, the
kinetic energy of the electron was observed to be a continuous spectrum, with an
endpoint at Qβ, but a peak at approximately 1/3 of the Qβ.
In 1930, Wolfgang Pauli surmised that the missing energy may be attributed to a
yet-to-be-detected particle which he called the neutron (slightly before James Chadwick
first detected the nucleonic neutron), which he predicted to be a neutral, massive, spin-1/2
fermion that interacts with matter about as often as, or less often than, a gamma ray [12].
By predicting another particle to be part of the beta decay reaction, the kinematics then
involves 3 bodies, rather than two. Instead of the total energy of the electron being equal
to the Q-value, the combined energies of the electron and Pauli’s “neutron” would sum to
Qβ. This theory was refined, and the decay kinematics and lifetimes were developed in
detail, in 1934 by Enrico Fermi [13]. In this paper, Fermi also used the term “neutrino”
7
for the third particle in the reaction, which clearly stuck. It is remarkable that Fermi
developed a theory that so closely matches observation, and that beta decay continues to
be among the most useful tools for probing nuclear and particle physics.
In order to understand the conditions that allow double beta decay (and in which
isotopes it might occur), it is useful to briefly discuss the conditions under which regular
beta decay occurs. Radioactive decay, in general, occurs when a nucleus is not in the
lowest possible energy configuration. The nucleus could be energetically excited, or the
arrangement of protons and neutrons in the nucleus not most favorable. The former case
usually leads to the emission of a gamma ray with energy equal to the difference between
the excited state and the final state (which may or may not be the ground state), and
otherwise leaves the nuclei intact. The latter case typically leads to one of three decay
processes, the first being the emission of an alpha particle, which is a 4He nucleus, the
second being fission of a very heavy nuclei, and the third being beta decay. Alpha decay
and fission mostly occur in heavier nuclei, where losing an entire helium nucleus or
splitting into two separate nuclei is still energetically favorable to remaining intact. Beta
decay, on the other hand, causes no change in mass number and could occur at atomic
mass.
1.2.1 Nuclear Stability and Decay Conditions
Multiple factors affect the stability of a nucleus to radioactive decay. The strong
nuclear force provides strong attraction between nucleons to bind the nucleus, but it only
acts on very small length scales. At larger distances within the nucleus, the strong nuclear
force is overcome by other forces, particularly the electromagnetic force between
protons. These opposing forces result in a tug-of-war between nucleons, with some forces
8
holding the nucleus together and others conspiring to break it apart. The net effect of
these forces can be summarized by the binding energy of the nucleus, the net energy that
holds the nucleus together. The effective rest mass energy of a nucleus is the mass of all
the constituent nucleons minus the binding energy. Thus, for nuclear isobars, the most
stable isobar will have the lowest rest mass energy (and be the most energetically
favorable configuration). An effective characterization of the binding energy is given by
the Weizsacker Equation [14]:
6
6
22/3
2 3 41
5
1/3
5
( 1) ( 2
0
,
)
,
B
a
a
Z Z A ZE a A a
a N Z
A
a
A a aA A
A odd
odd
A eN Z ven
−
−
−
− −= − − −
= +
(7)
where ia are empirically derived values, A is the atomic mass number, Z is the atomic
number, and N=A-Z is the neutron number. This formula is also called the semi-
empirical mass formula because it is partially based on theoretical predictions of how the
strong and electromagnetic forces act on nucleons, but the relative strengths of each term,
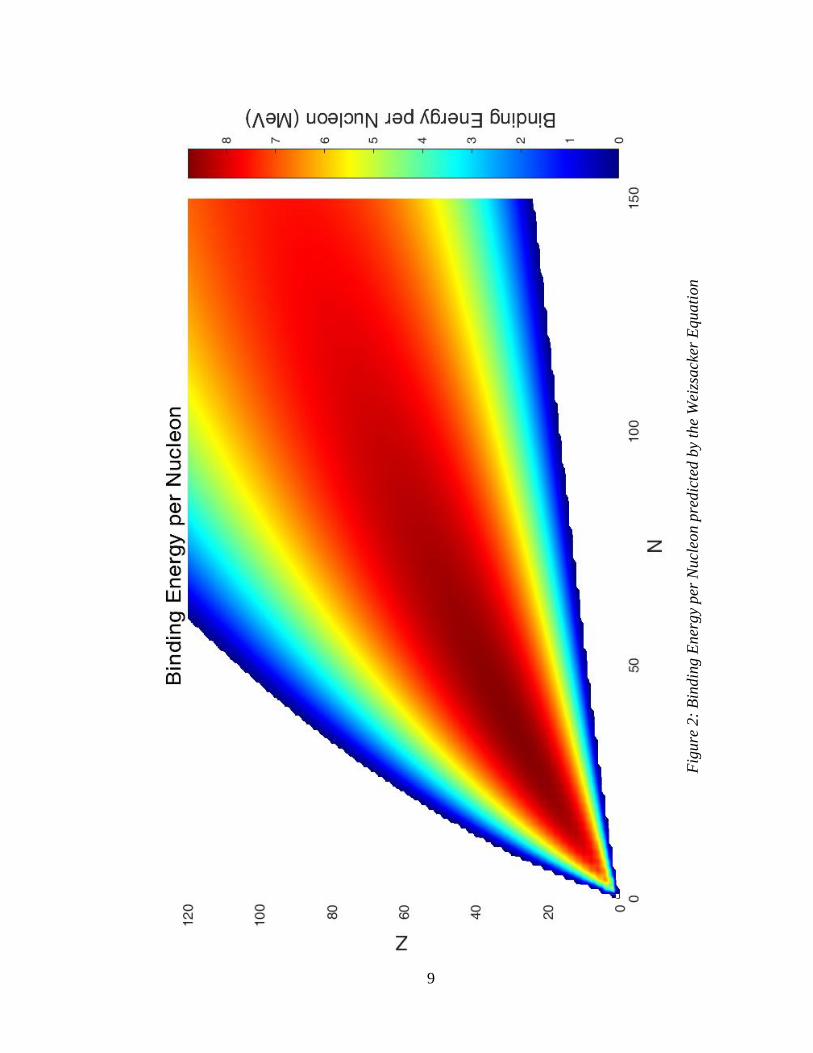
the coefficients, are determined by fitting to a curve of measured nuclear masses. Figure
2 shows a plot of the binding energy per nucleon predicted by the Weizsacker Equation
for all nuclei with 120, 1500 0 (0 270)Z N A . It is evident from this plot
that the most stable nuclei (those with highest binding energy) occur near a line N=Z at
low A but N>Z at higher A (Figure 3). The cause of this is that as Z increases, the
electrostatic repulsion between protons increases and more neutrons are required to
provide additional strong force. Since the electrostatic force acts at a greater range than
9
Fig
ure
2:
Bin
din
g E
ner
gy
per
Nucl
eon p
redic
ted b
y th
e W
eizs
ack
er E
quati
on
10
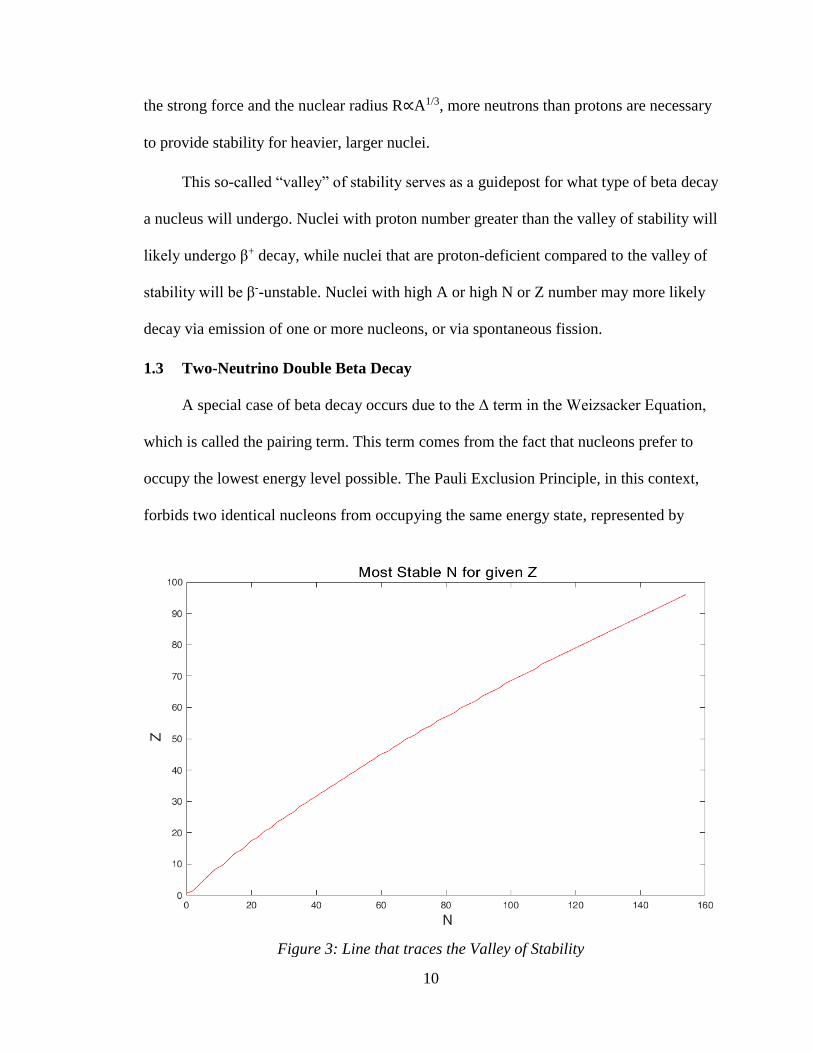
the strong force and the nuclear radius R∝A1/3, more neutrons than protons are necessary
to provide stability for heavier, larger nuclei.
This so-called “valley” of stability serves as a guidepost for what type of beta decay
a nucleus will undergo. Nuclei with proton number greater than the valley of stability will
likely undergo β+ decay, while nuclei that are proton-deficient compared to the valley of
stability will be β--unstable. Nuclei with high A or high N or Z number may more likely
decay via emission of one or more nucleons, or via spontaneous fission.
1.3 Two-Neutrino Double Beta Decay
A special case of beta decay occurs due to the Δ term in the Weizsacker Equation,
which is called the pairing term. This term comes from the fact that nucleons prefer to
occupy the lowest energy level possible. The Pauli Exclusion Principle, in this context,
forbids two identical nucleons from occupying the same energy state, represented by
Figure 3: Line that traces the Valley of Stability
11
nuclear orbitals, within the nucleus. Thus, each energy level will consist of two paired
nucleons with opposing spins. The spin-pairing effect results in an increase in binding
energy. Nuclei with even numbers of both neutrons and protons will have all nucleons
paired, while nuclei with odd numbers of both neutrons and protons will have 2 unpaired
nucleons. In the latter case, it may be energetically advantageous for one of the unpaired
nucleons to beta decay to pair with the other unpaired nucleon, despite a possible increase
in the fourth term ∝(A-2Z)2/A. This also means that if a nucleus is even-even in N and
Z, but not in the lowest energy state (in the valley of stability), any beta decay would
transmute the nucleus into one that is odd-odd and potentially lower the binding energy
due to spin-pairing. In this situation, the only decay that may be energetically favorable
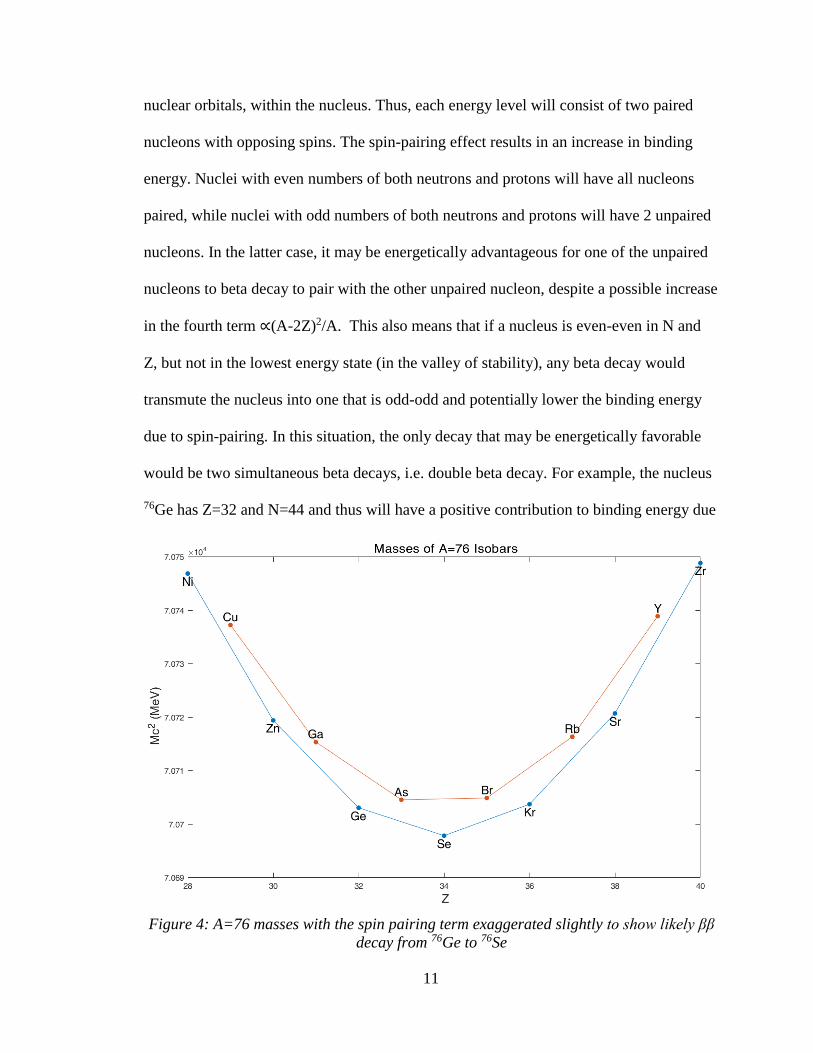
would be two simultaneous beta decays, i.e. double beta decay. For example, the nucleus
76Ge has Z=32 and N=44 and thus will have a positive contribution to binding energy due
Figure 4: A=76 masses with the spin pairing term exaggerated slightly to show likely ββ
decay from 76Ge to 76Se
12
to spin pairing. A single β- decay will transmute the nucleus to 76As, with a negative
contribution to binding energy due to no spin pairing and an overall lower binding
energy. This means that it would take some external input of energy to convert 76Ge to
76As. However, double beta decay to 76Se, also even-even, would be energetically
favorable and seemingly the only energetically favorable beta decay of 76Ge.
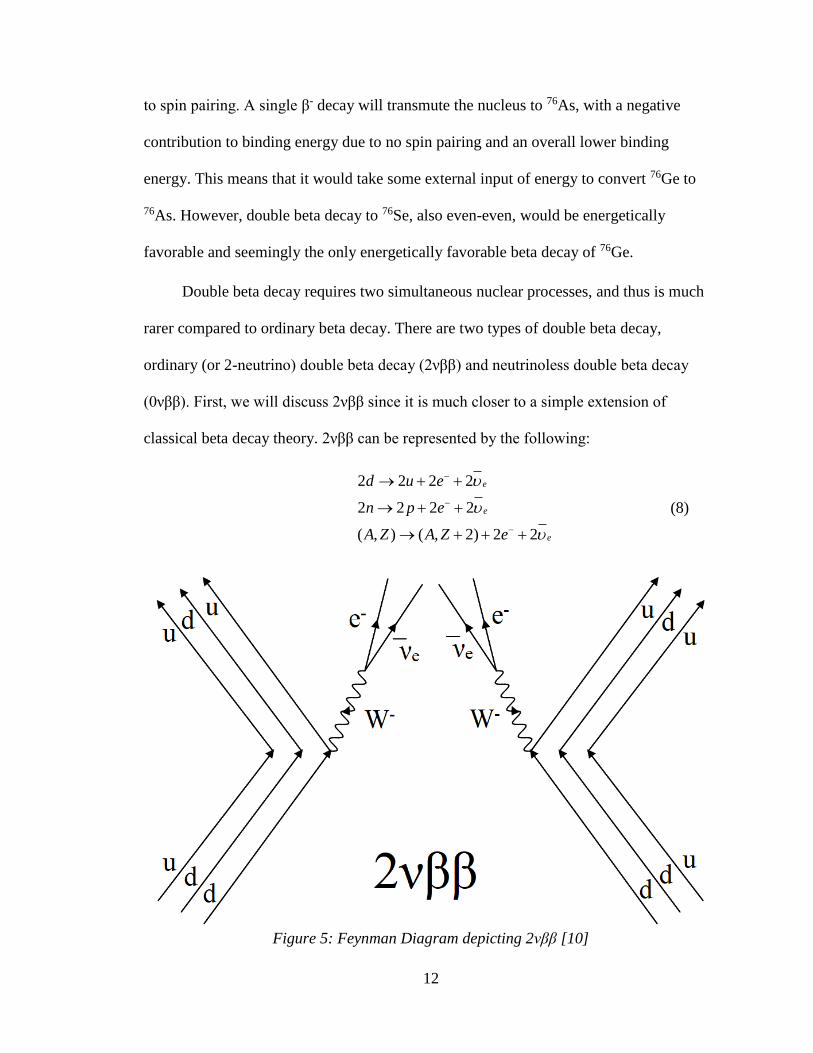
Double beta decay requires two simultaneous nuclear processes, and thus is much
rarer compared to ordinary beta decay. There are two types of double beta decay,
ordinary (or 2-neutrino) double beta decay (2νββ) and neutrinoless double beta decay
(0νββ). First, we will discuss 2νββ since it is much closer to a simple extension of
classical beta decay theory. 2νββ can be represented by the following:
2 2 2 2
2 2 2 2
( , ) ( , 2) 2 2
e
e
e
d u e
n p e
A Z A Z e
−
−
−
→ + +
→ + +
→ + + +
(8)
Figure 5: Feynman Diagram depicting 2νββ [10]
13
In fact, 2νββ is observationally identical to two β- decays which had occurred
simultaneously. Since detecting the electron antineutrinos from 2νββ is very difficult,
detection of the two electrons created simultaneously is evidence of 2νββ. Similarly to
single β decay, the antineutrinos take some momentum and energy with them and thus
the summed energy of both electrons is observed to be a continuous spectrum with an
endpoint at Qββ.
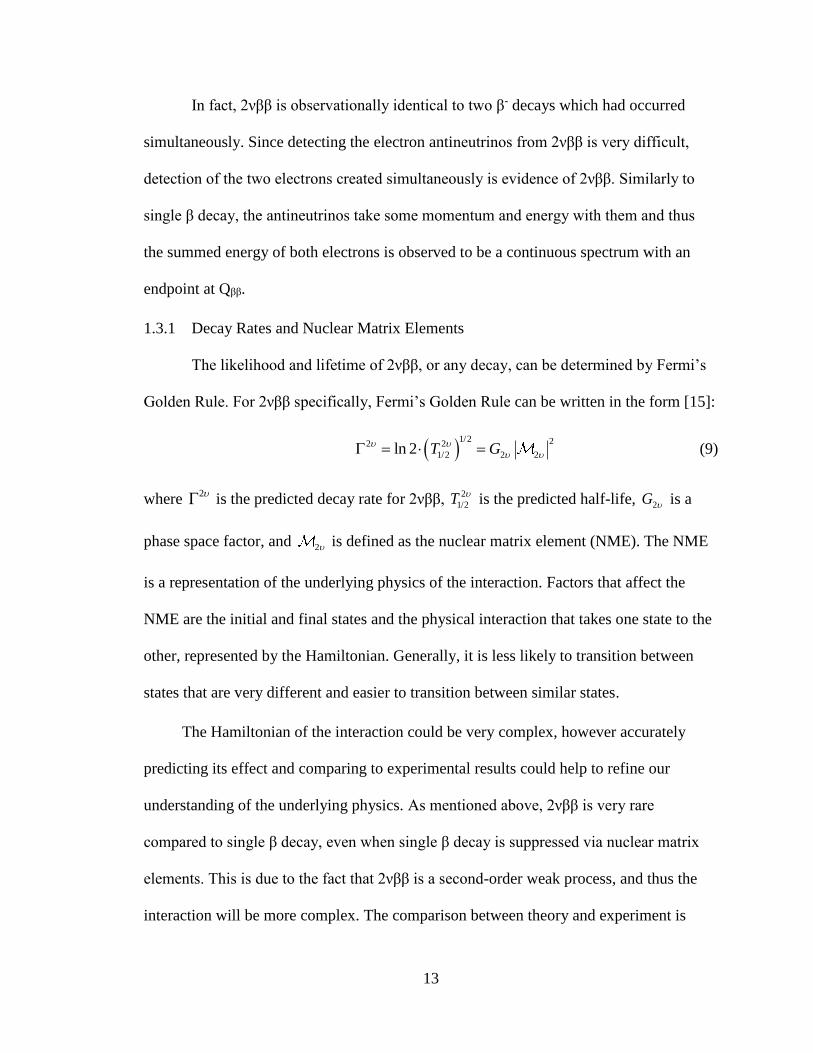
1.3.1 Decay Rates and Nuclear Matrix Elements
The likelihood and lifetime of 2νββ, or any decay, can be determined by Fermi’s
Golden Rule. For 2νββ specifically, Fermi’s Golden Rule can be written in the form [15]:
( )1/2 22 2
2 21/ 2ln 2 T G
= = (9)
where 2 is the predicted decay rate for 2νββ,
2
1/2T is the predicted half-life, 2G is a
phase space factor, and 2 is defined as the nuclear matrix element (NME). The NME
is a representation of the underlying physics of the interaction. Factors that affect the
NME are the initial and final states and the physical interaction that takes one state to the
other, represented by the Hamiltonian. Generally, it is less likely to transition between
states that are very different and easier to transition between similar states.
The Hamiltonian of the interaction could be very complex, however accurately
predicting its effect and comparing to experimental results could help to refine our
understanding of the underlying physics. As mentioned above, 2νββ is very rare
compared to single β decay, even when single β decay is suppressed via nuclear matrix
elements. This is due to the fact that 2νββ is a second-order weak process, and thus the
interaction will be more complex. The comparison between theory and experiment is
14
especially useful for rare processes such as 2νββ and 0νββ. Additionally, as we will
discuss later, understanding the NME for 0νββ can potentially help us to understand
physics beyond the standard model. Determining the NMEs for 2νββ can help us
understand the physics of ββ decay in general, the conditions under which we might
observe 0νββ, and the implications of the observation of 0νββ.
1.4 Neutrinoless Double Beta Decay
While rare, 2νββ is entirely consistent with the Standard Model and has indeed
been observed. 0νββ has not been conclusively observed, and its potential detection
would change our understanding of the Standard Model and would inform physics
beyond the Standard Model. To see why, we must discuss how 0νββ might occur. Unlike
2νββ, 0νββ is not identical to two simultaneous β- decays. The most popular model of the
reaction proceeds via the exchange of a massive virtual Majorana neutrino (meaning a
neutrino which is its own antineutrino) [16]. In this model, observation of 0νββ implies
that the neutrino is Majorana in nature. This exchange results in no neutrinos emitted
from the reaction, only the two electrons. An implication of this lack of emitted neutrinos
is that lepton number, the total number of leptons, is not conserved since zero leptons
existed before yet two leptons came out. β decay and 2νββ do not violate lepton number
since each electron (L=+1) is accompanied by an electron antineutrino (L=-1), and each
positron by an electron neutrino, conserving both lepton number and leptonic flavor
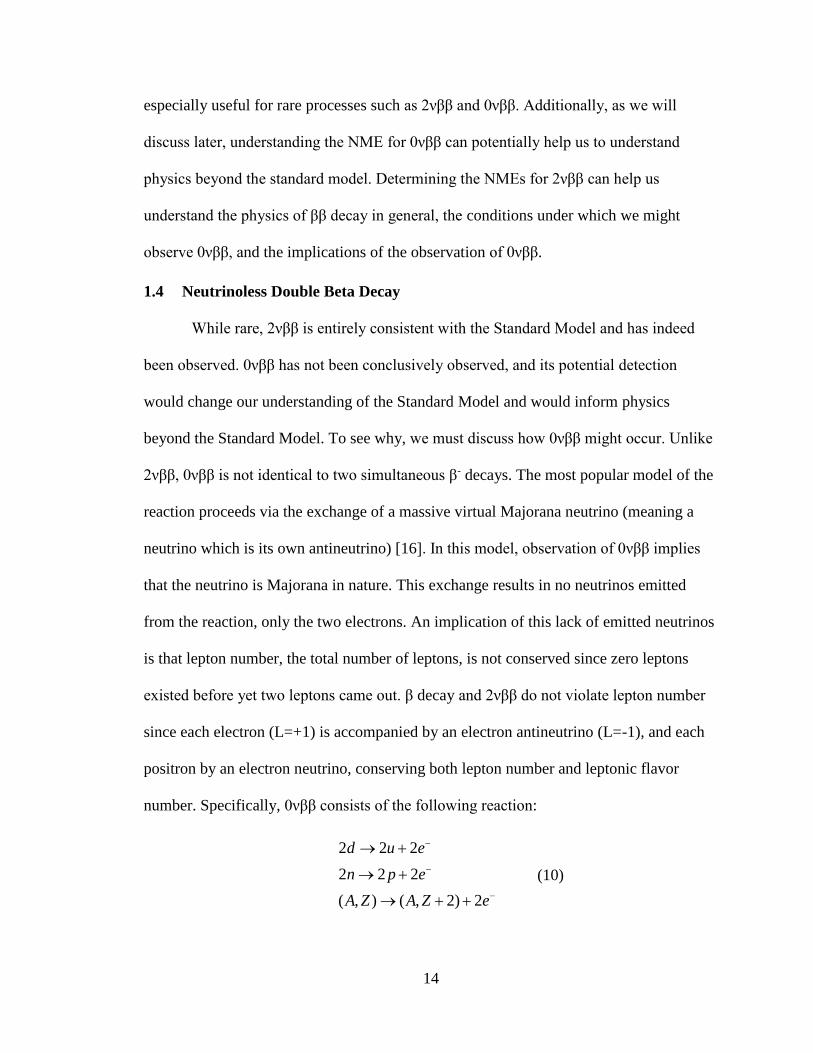
number. Specifically, 0νββ consists of the following reaction:
2 2 2
2 2 2
( , ) ( , 2) 2
d u e
n p e
A Z A Z e
−
−
−
→ +
→ +
→ + +
(10)
15
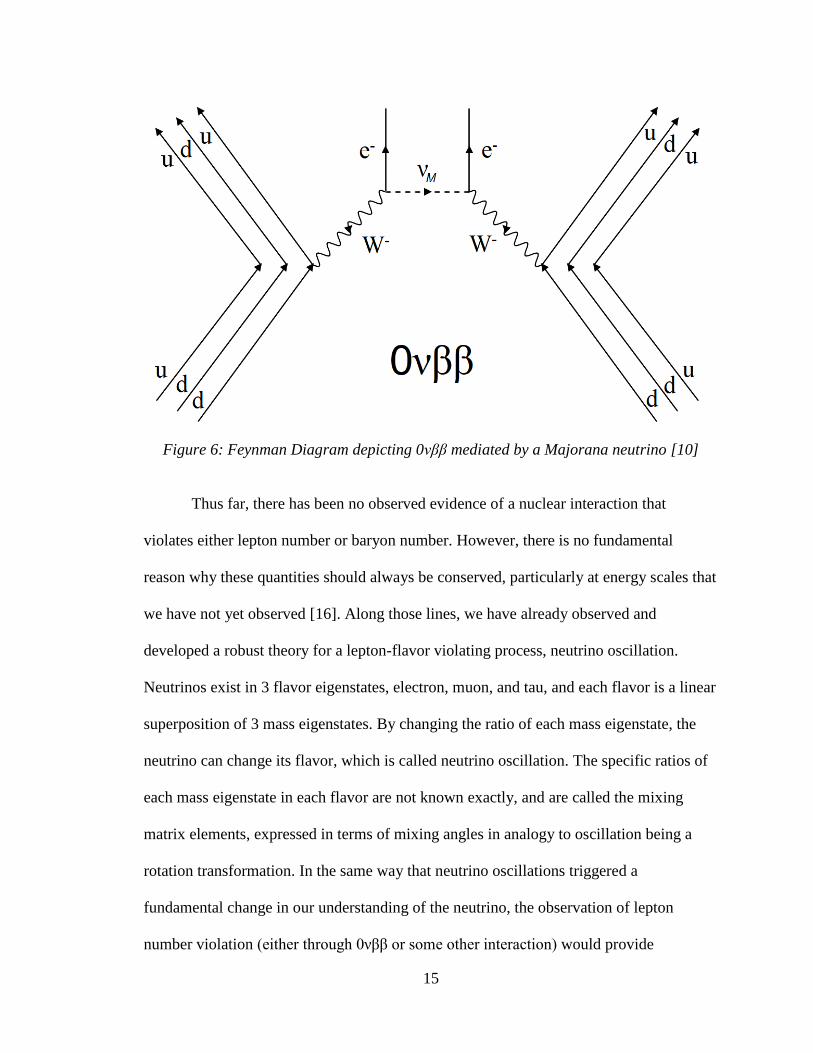
Thus far, there has been no observed evidence of a nuclear interaction that
violates either lepton number or baryon number. However, there is no fundamental
reason why these quantities should always be conserved, particularly at energy scales that
we have not yet observed [16]. Along those lines, we have already observed and
developed a robust theory for a lepton-flavor violating process, neutrino oscillation.
Neutrinos exist in 3 flavor eigenstates, electron, muon, and tau, and each flavor is a linear
superposition of 3 mass eigenstates. By changing the ratio of each mass eigenstate, the
neutrino can change its flavor, which is called neutrino oscillation. The specific ratios of
each mass eigenstate in each flavor are not known exactly, and are called the mixing
matrix elements, expressed in terms of mixing angles in analogy to oscillation being a
rotation transformation. In the same way that neutrino oscillations triggered a
fundamental change in our understanding of the neutrino, the observation of lepton
number violation (either through 0νββ or some other interaction) would provide
Figure 6: Feynman Diagram depicting 0νββ mediated by a Majorana neutrino [10]
16
additional information about physics beyond the Standard Model. Specifically, details of
lepton number violation could provide information on baryogenesis and details on the
physical origin of neutrino mass, perhaps through the seesaw mechanism [2].
Baryogenesis is the process which explains why there is more matter than
antimatter in the observable universe. The seesaw mechanism theorizes that there are yet-
unobserved heavy neutrinos that correspond to each flavor of observed light neutrinos.
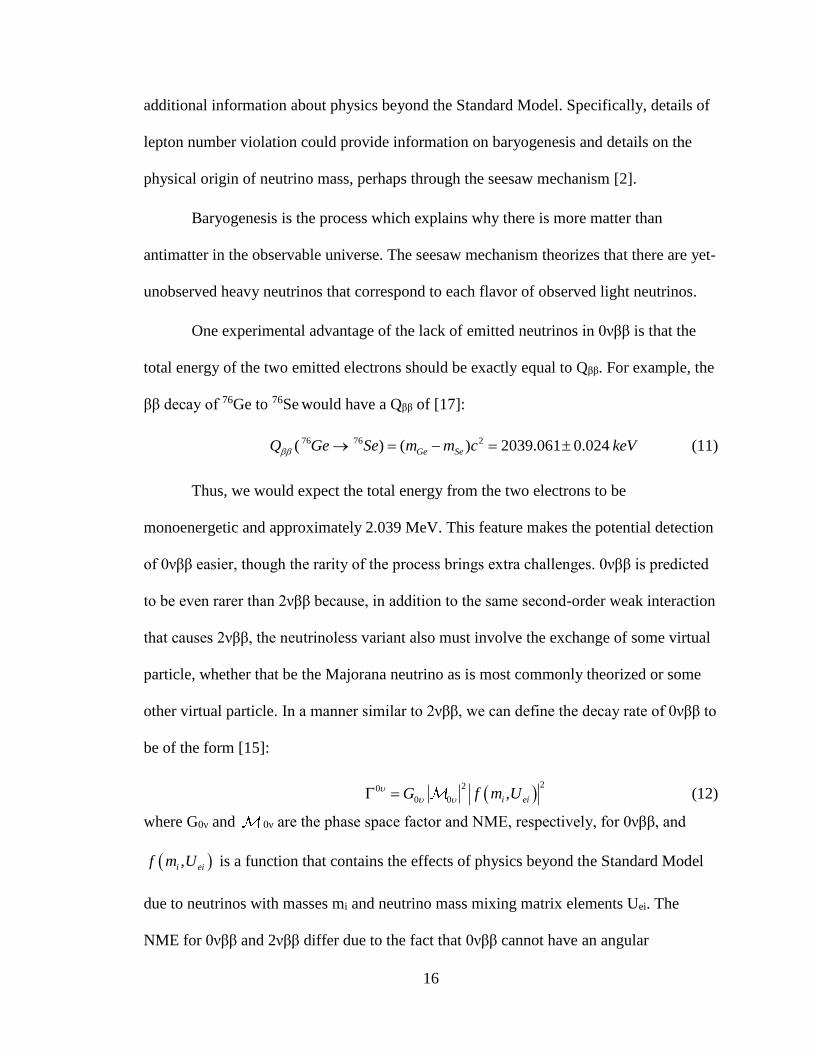
One experimental advantage of the lack of emitted neutrinos in 0νββ is that the
total energy of the two emitted electrons should be exactly equal to Qββ. For example, the
ββ decay of 76Ge to 76Se would have a Qββ of [17]:
76 76 2( ) ( ) 2039.061 0.024Ge SeQ Ge Se m m c keV → = − = (11)
Thus, we would expect the total energy from the two electrons to be
monoenergetic and approximately 2.039 MeV. This feature makes the potential detection
of 0νββ easier, though the rarity of the process brings extra challenges. 0νββ is predicted
to be even rarer than 2νββ because, in addition to the same second-order weak interaction
that causes 2νββ, the neutrinoless variant also must involve the exchange of some virtual
particle, whether that be the Majorana neutrino as is most commonly theorized or some
other virtual particle. In a manner similar to 2νββ, we can define the decay rate of 0νββ to
be of the form [15]:
( )220
0 0 ,i eiG f m U
= (12)
where G0ν and 0ν are the phase space factor and NME, respectively, for 0νββ, and
( ),i eif m U is a function that contains the effects of physics beyond the Standard Model
due to neutrinos with masses mi and neutrino mass mixing matrix elements Uei. The
NME for 0νββ and 2νββ differ due to the fact that 0νββ cannot have an angular
17
momentum state great than 1, due to only two spin-1/2 electrons in the final state, as well
as a difference in the neutrino potential in the two processes [15, 16]. While both the
NME and the f factor are generally quite complex, there has been substantial work to
predict these values [15]. Understanding these values can help us understand the
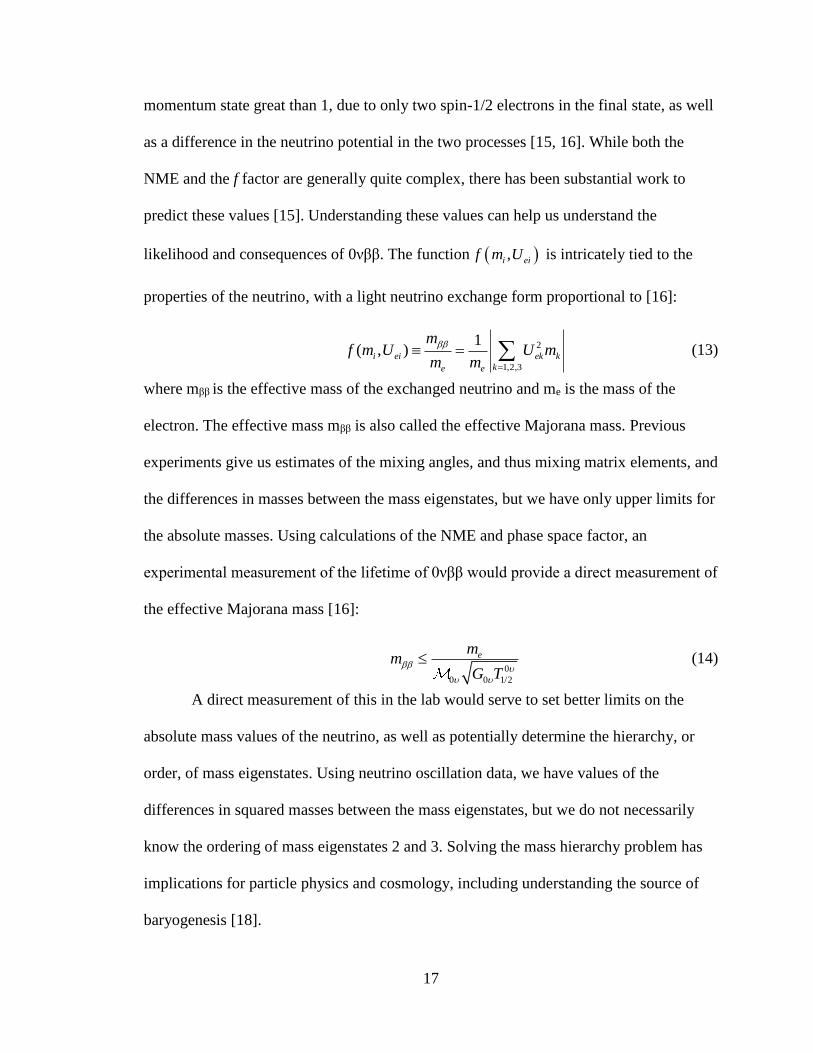
likelihood and consequences of 0νββ. The function ( ),i eif m U is intricately tied to the
properties of the neutrino, with a light neutrino exchange form proportional to [16]:
2
1,2,3
1( , )i ei ek k
ke e
mf m U U m
m m
=
= (13)
where mββ is the effective mass of the exchanged neutrino and me is the mass of the
electron. The effective mass mββ is also called the effective Majorana mass. Previous
experiments give us estimates of the mixing angles, and thus mixing matrix elements, and
the differences in masses between the mass eigenstates, but we have only upper limits for
the absolute masses. Using calculations of the NME and phase space factor, an
experimental measurement of the lifetime of 0νββ would provide a direct measurement of
the effective Majorana mass [16]:
0
0 0 1/2
emm
G T
(14)
A direct measurement of this in the lab would serve to set better limits on the
absolute mass values of the neutrino, as well as potentially determine the hierarchy, or
order, of mass eigenstates. Using neutrino oscillation data, we have values of the
differences in squared masses between the mass eigenstates, but we do not necessarily
know the ordering of mass eigenstates 2 and 3. Solving the mass hierarchy problem has
implications for particle physics and cosmology, including understanding the source of
baryogenesis [18].
18
Fig
ure
7:
Model
ed a
ctiv
ity
vs e
ner
gy
(sca
led t
o u
nit
s of
Qββ)
for
2νβ
β (
blu
e dott
ed l
ine)
and 0
νββ
(re
d s
oli
d l
ine)
wit
h a
n e
ner
gy
reso
luti
on o
f 2%
. 2νβ
β i
s norm
ali
zed t
o 1
, 0νβ
β i
s norm
ali
zed t
o 1
0-2
in t
he
pri
mary
plo
t and 1
0-7
in t
he
inse
t. [
1]
19
Most significantly, observation of 0νββ would imply that the neutrino is its own
antiparticle [1]. Thus far, all observed fermions have distinct antiparticles, i.e. same mass
but opposite charge, lepton number, baryon number, and all other quantum numbers.
However, since neutrinos have no charge, the key difference between a neutrino and an
antineutrino is that the latter will have opposite lepton number and handedness. Since
lepton number may not be conserved, it is possible that a Majorana neutrino may not
conserve that quantity. Handedness is a description of the spin of a particle in relation to
its momentum. Right-handed particles have a spin vector that is in the same direction as
the momentum vector, while left-handed particles have a spin vector antiparallel to the
momentum. Further, handedness is frame-dependent for particles which have mass, and
therefore travel slower than the speed of light. Changing reference frames could result in
an opposite sign of the momentum vector in the new frame. Further, an interesting
property of neutrinos is that in all observations thus far, all neutrinos are left-handed and
all antineutrinos are right-handed [19]. One possibility is that the weak interaction only
couples to left-handed neutrinos while the right-handed variant has no interaction, or the
right-handed neutrino simply does not exist. A massive neutrino that that is left-handed in
one reference frame would be right-handed in a different frame, and thus could be
observed as an antineutrino. Evidence of the Majorana nature of the neutrino, or
conversely evidence that the neutrino is purely a Dirac particle, would shed light on why
the weak interaction only couples to left-handed particles.
20
2 Experimental Efforts for 0νββ
Several experiments, spread globally, are designed to search for 0νββ. Each use
varying candidate nuclides and detection techniques. There are a few factors that
determine the feasibility and potential efficiency of a very rare event search in general,
and a 0νββ search in particular. These factors include a large mass of the isotope of
interest per unit mass of total detector material, detector technology with good energy
resolution in the expected energy range of the signal, and very low background activity
from natural and anthropogenic radiation [16]. All of these factors are intended to
increase the likelihood of detecting events, while reducing the background noise.
Some rare events, such as 2νββ, 0νββ, and even the ordinary α or β decay of some
nearly stable nuclides, occur with lifetimes on the order of the age of the universe (~1010
years), or orders of magnitude higher. An experiment that must run for anything more
than several years is not feasible. To get around the very long decay lifetimes of each
individual nuclide, a large number of nuclides is required. This need for a large mass
often conflicts with other operating parameters. Chiefly, larger mass typically translates
to larger volume. As the detector volume increases, so does the amount of support
material that could possibly introduce background, as well as the logistical difficulty of
building such a large detector and associated electronics. Additionally, despite being
extraordinarily long-living, many candidate isotopes are not as abundant as other isotopes
of that element. This means that naturally-occurring material must be enriched in the
isotope of interest in order to avoid a large mass of detector material that is mostly inert
to the signal of interest. The most notable example of this process is the enrichment of
21
uranium in 235U for use in nuclear weapons, where the most abundant isotope, 238U, is not
suitable for weaponization. While the need for enrichment for 0νββ experiments may not
be as intensive as enriching 0.72% 235U to close to 90%, the need is just as critical to
operation. Thus, the natural abundance and feasibility of enrichment (including chemical
properties), is as important to the choice of an ideal ββ radioisotope as other parameters
such as Qββ and expected lifetime.
For 0νββ specifically, favorable energy resolution is particularly important. The
energy signature of 0νββ, with the total energy of the two electrons precisely at Qββ, is
very important in identification of events of interest. However, this is only true as long as
the detector has sufficient energy resolution. As the resolution decreases, the energies of
observed events are distributed normally with increasing width and decreasing peak
height. This diffuse peak could then be obscured by noise from both background
radiation, and from 2νββ events. The requirement for good energy resolution could be
mitigated by choice of a candidate nuclide with high Qββ, above many background
radiation β events, though a background would still persist from 2νββ events (as seen in
Figure 7).
Currently, the detector technology with the highest energy resolution, as well as
efficiency of detection, are calorimetric detectors where the source material is collocated
with detector material [16]. This technique can be accomplished via either embedding the
source material within the detector material, or by using a source that also behaves as a
detector (such as one that scintillates). One attractive option is using high-purity
germanium (HPGe) semiconductor detectors enriched in 76Ge since HPGe detector
technology is well developed and has a good energy resolution and 76Ge undergoes ββ.
22
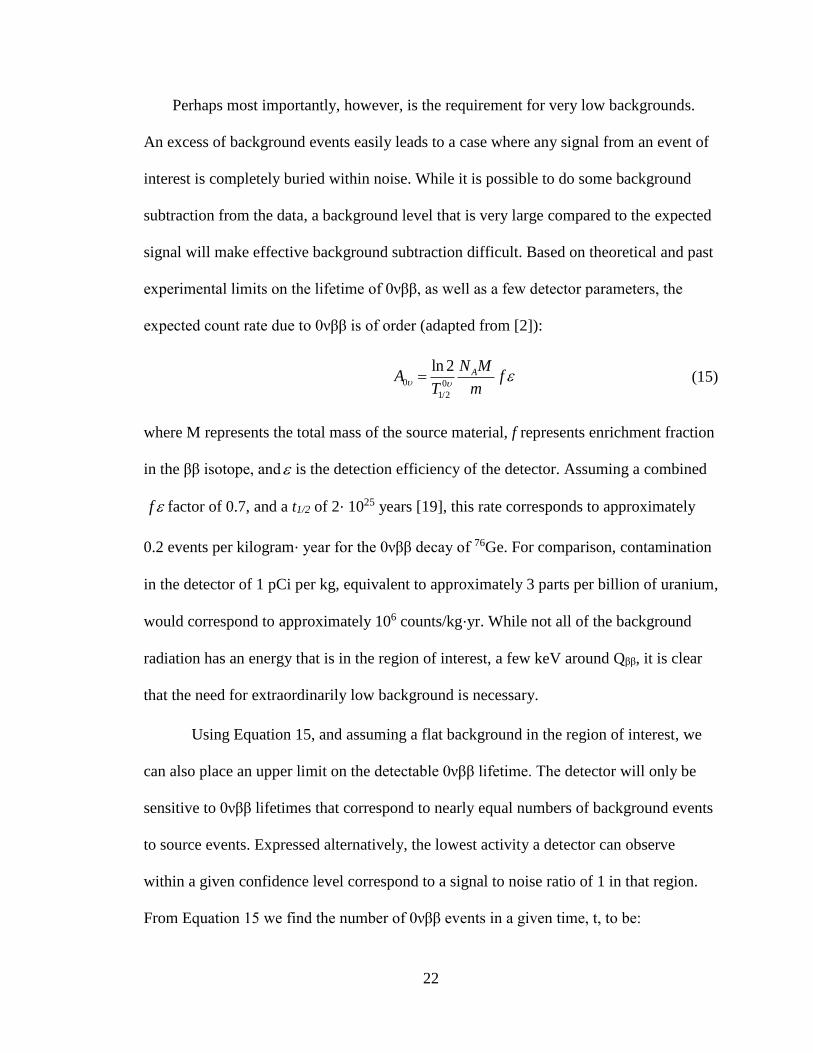
Perhaps most importantly, however, is the requirement for very low backgrounds.
An excess of background events easily leads to a case where any signal from an event of
interest is completely buried within noise. While it is possible to do some background
subtraction from the data, a background level that is very large compared to the expected
signal will make effective background subtraction difficult. Based on theoretical and past
experimental limits on the lifetime of 0νββ, as well as a few detector parameters, the
expected count rate due to 0νββ is of order (adapted from [2]):
0 0
1/2
ln 2 AN MA f
T m
= (15)
where M represents the total mass of the source material, f represents enrichment fraction
in the ββ isotope, and is the detection efficiency of the detector. Assuming a combined
f factor of 0.7, and a t1/2 of 2⋅ 1025 years [19], this rate corresponds to approximately
0.2 events per kilogram⋅ year for the 0νββ decay of 76Ge. For comparison, contamination
in the detector of 1 pCi per kg, equivalent to approximately 3 parts per billion of uranium,
would correspond to approximately 106 counts/kg⋅yr. While not all of the background
radiation has an energy that is in the region of interest, a few keV around Qββ, it is clear
that the need for extraordinarily low background is necessary.
Using Equation 15, and assuming a flat background in the region of interest, we
can also place an upper limit on the detectable 0νββ lifetime. The detector will only be
sensitive to 0νββ lifetimes that correspond to nearly equal numbers of background events
to source events. Expressed alternatively, the lowest activity a detector can observe
within a given confidence level correspond to a signal to noise ratio of 1 in that region.
From Equation 15 we find the number of 0νββ events in a given time, t, to be:
23
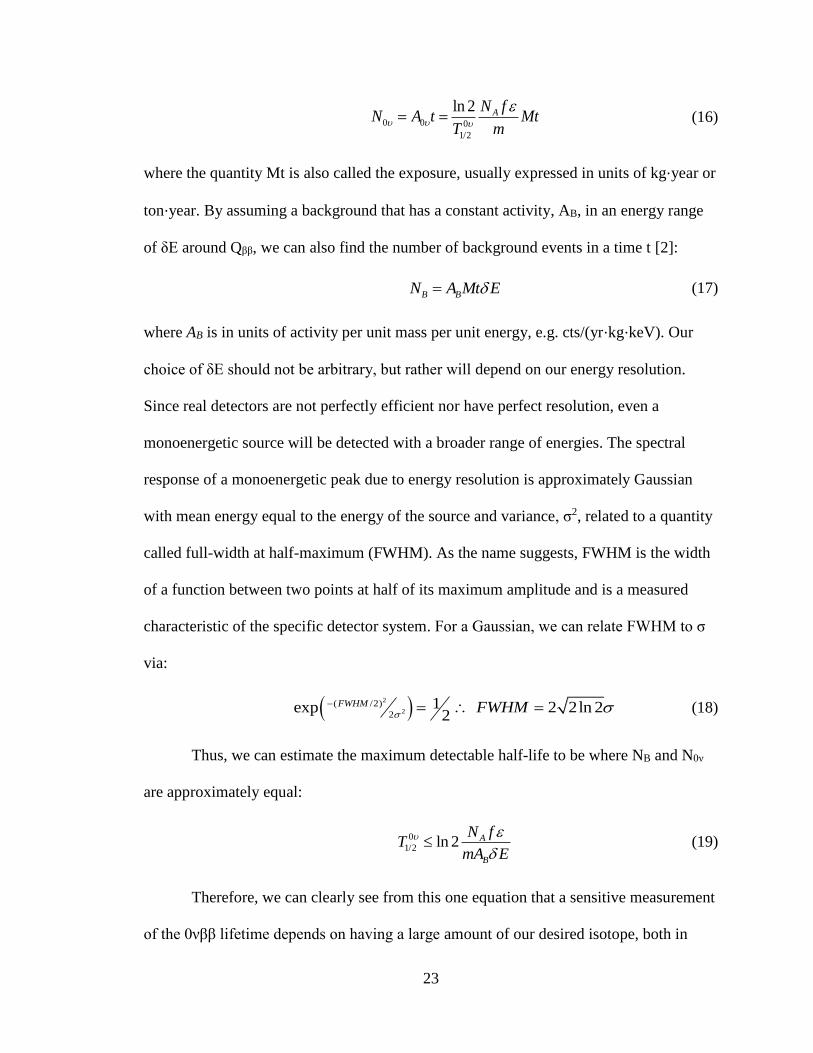
0 0 0
1/2
ln 2 AN fN A t Mt
T m
= = (16)
where the quantity Mt is also called the exposure, usually expressed in units of kg⋅year or
ton⋅year. By assuming a background that has a constant activity, AB, in an energy range
of δE around Qββ, we can also find the number of background events in a time t [2]:
B BN A Mt E= (17)
where AB is in units of activity per unit mass per unit energy, e.g. cts/(yr⋅kg⋅keV). Our
choice of δE should not be arbitrary, but rather will depend on our energy resolution.
Since real detectors are not perfectly efficient nor have perfect resolution, even a
monoenergetic source will be detected with a broader range of energies. The spectral
response of a monoenergetic peak due to energy resolution is approximately Gaussian
with mean energy equal to the energy of the source and variance, σ2, related to a quantity
called full-width at half-maximum (FWHM). As the name suggests, FWHM is the width
of a function between two points at half of its maximum amplitude and is a measured
characteristic of the specific detector system. For a Gaussian, we can relate FWHM to σ
via:
( )2
2( /2)
21exp 2 2ln 2
2FWHM FWHM
− = = (18)
Thus, we can estimate the maximum detectable half-life to be where NB and N0ν
are approximately equal:
0
1/2 ln 2 A
B
N fT
mA E
(19)
Therefore, we can clearly see from this one equation that a sensitive measurement
of the 0νββ lifetime depends on having a large amount of our desired isotope, both in
24
total number and relative fraction, a detector with excellent efficiency and resolution, and
very low background.
There have been numerous experiments to date that have detected 2νββ and
placed limits on the half-life of 0νββ in various isotopes. These experiments have used
130Te, 76Ge, 100Mo, and 136Xe as the ββ isotope. Three experiments of interest to the Large
Enriched Germanium Experiment for Neutrinoless Double Beta Decay Collaboration
(LEGEND) are the Heidelberg-Moscow Experiment, the Germanium Detector Array
(GERDA), and the MAJORANA DEMONSTRATOR. All three of these experiments use
HPGe detectors enriched in 76Ge. The Heidelberg-Moscow Experiment was a
collaboration between the Max-Planck Institute for Nuclear Physics (MPI Kernphysik)
and the Radiophysical Research Institute (НИРФИ) that used 5 Ge detectors located in
the Gran Sasso underground laboratory in Italy. In 2001, some members of this
collaboration (referred to as Klapdor-Kleingrothaus) announced a detection of 0νββ with
0
1/2t = 25(0.8 18.3) 10− y (1.96σ) from a 54.98 kg⋅yr exposure [20] This result was later
refined to 0
1/2t =(2.23−0.31
+0.44) ⋅ 1025 y from analysis of a 71.7 kg⋅yr exposure, which the
authors claimed to be a signal of 0νββ with a confidence level of over 6σ [21].
However, subsequent peer review found inconsistencies in the analysis that the
claim used as evidence, including the lack of a null hypothesis analysis, failure to explain
other apparent peaks in the data, and a 0
1/2t that conflicted with earlier published results of
Heidelberg-Moscow [22].
GERDA also operates at Gran Sasso with HPGe detectors, some of which came
from Heidelberg-Moscow. A unique trait of GERDA is that it uses liquid argon (LAr) to
cool the detectors, which must be operated in cryogenic conditions. Background
25
radiation, particularly gamma rays, coming into the detector volume may interact with
both the detectors and the LAr. This background causes the Ar to scintillate, and that
scintillation light can be detected separately and used to veto an event as background.
Utilization of LAr provides another tool to reduce the impact of background events.
Using a 34.4 kg⋅y exposure of 76Ge in two phases, GERDA announced a limit
0 25
1/2 5.3 10t y . This result further reduces the validity of the Heidelberg-Moscow 0νββ
detection claim. [23]
MAJORANA DEMONSTRATOR (MJD) has a primary goal of discovering what
technology and experimental techniques are required to operate a large-scale enriched Ge
experiment. This goal involves proving the scalability of the experiment from the tens of
kg scale to the ton or greater scale, as well as demonstrating background mitigation to a
level of 1 background event per ton⋅year in the 4 keV FWHM region around Qββ [24].
Further, MJD seeks to search for 0νββ, test the claim from KK, and search for additional
physics beyond the standard model such as dark matter. The experiment operates via
vertical arrays of HPGe detectors, called strings, within liquid nitrogen-cooled cryostats,
and is located in the Sanford Underground Research Facility (SURF). MJD mitigates
background by using a layered shielding scheme consisting of an ultra-clean
electroformed copper cryostat and inner layer, a layer of oxygen-free high thermal
conductivity copper, a layer of high-purity lead, a radon-exclusion box which encloses
the lead, an active muon veto system consisting of scintillating plastic, and two layers of
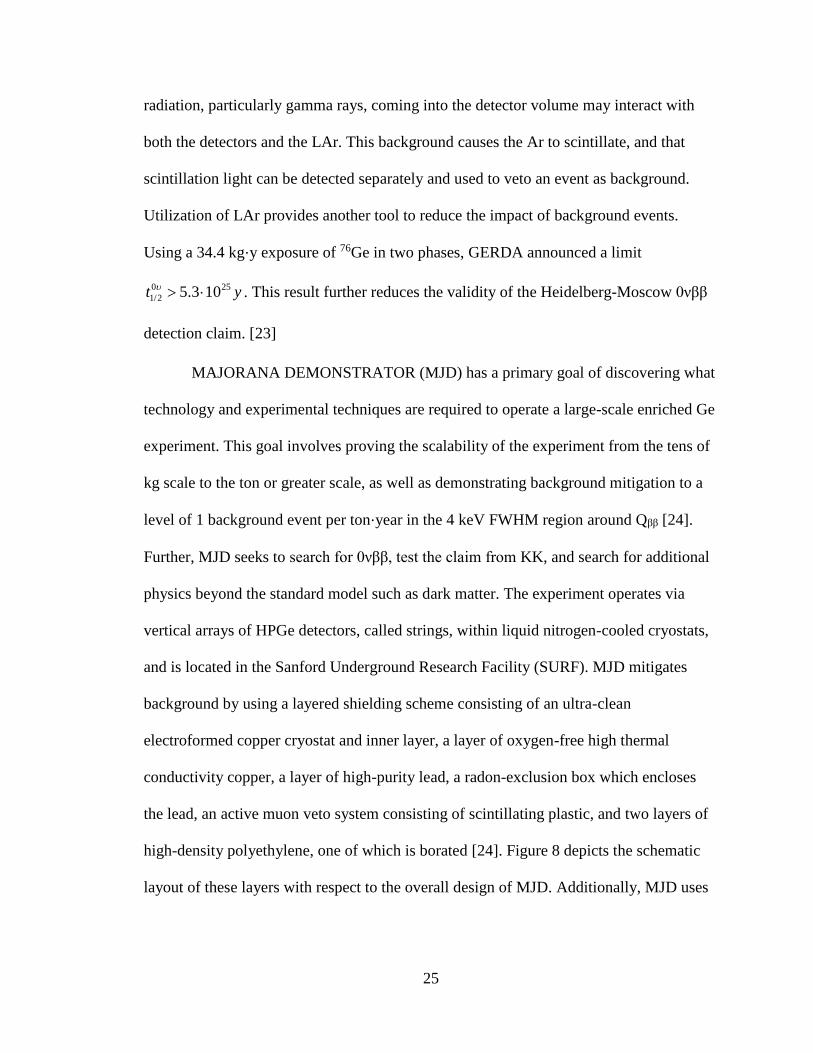
high-density polyethylene, one of which is borated [24]. Figure 8 depicts the schematic
layout of these layers with respect to the overall design of MJD. Additionally, MJD uses
26
p-type point contact HPGe detectors, which have very good energy resolution with a
FWHM of 2.4 keV. [24]
The Large Enriched Germanium Experiment for Neutrinoless Double Beta Decay
(LEGEND) is a collaboration between GERDA and MJD intended to use the
experimental and engineering experience of both experiments to build a ton-scale
detector experiment. The purpose of building such a large detector is to increase the total
exposure, and thus increase the likelihood of observing a 0νββ event or at least set a
better limit on the lifetime of this process. In addition to a larger exposure, work must be
done in improving the data analysis, improving the veto system, and maximizing the
radiopurity of the system in order to reduce the amount of background events and
discriminate against non-ββ events. [25]
Figure 8: Schematic diagram of the MAJORANA DEMONSTRATOR, including the
shielding layers and the inner detector vessel containing the 76Ge detector arrays [24]
27
2.1 Background Sources
Background radiation, in general, comes from various natural and man-made
sources. Natural sources include primordial radionuclides, cosmogenic radionuclides, and
cosmic rays [1]. Anthropogenic radionuclides include those which have been produced as
a part of human activity, chiefly through nuclear energy production and nuclear weapons
programs. Natural and anthropogenic sources of background radiation are pervasive
throughout Earth. In fact, due to primordial and cosmogenic radionuclides alone, most
objects on the surface of the earth are radioactive to some degree. Underground there are
much fewer anthropogenic radionuclides and cosmic rays are attenuated, however,
primordial nuclides and cosmic ray-produced muons present a strong source of
background.
Primordial radionuclides are those which were created long ago by nucleosynthesis
during the Big Bang, supernovae, fusion within stars, and other high energy nuclear
processes in space [26]. These nuclides were present during the formation of Earth, and
thus are very long-lived. Accordingly, these nuclides have half-lives on the order of the
age of the Earth. Such long half-lives mean that on the time scales we consider, even
decades, the number and decay rate of primordial radionuclides in the world is
approximately constant. This makes primordial nuclides particularly pervasive, but also
makes it such that their decay can be very well characterized. Primordial radionuclides of
interest to this work are 238U, 235U, 232Th, and 76Ge [27]. The first three are parents of
radon and decay via alpha particles which can cause a background themselves, and the
last is a strong candidate isotope for 0νββ.
28
Cosmic rays are high energy nuclei which originate from space. When these high
energy nuclei enter the atmosphere, they collide with nuclei in the atmosphere (likely
oxygen or nitrogen in air). These collisions are very energetic and produce secondary
energetic particles such as pions and baryons. The secondary particles could decay or
could collide with other nuclei to form additional secondary particles. The result is a
shower or cascade of fairly high-energy particles that are incident upon the surface of the
Earth, primarily leptons and gamma rays from pion decays. Since most of these cosmic
ray shower particles are strongly absorbed by matter on the surface, the best way to shield
from cosmic rays is to place an experiment underground. However, even underground
there is a background from cosmic rays in the form of muons formed from charged pion
decays [28]. Since muons have approximately 200 times the mass of the electron, muons
will experience less deflection while passing through matter and will have less energy
loss due to bremsstrahlung. Thus, at intermediate energies, GeV to TeV, muons will
generally have a low weak interaction cross section and low radiative energy loss [29].
The result is that cosmic ray secondary muons are able to penetrate deep into the earth,
and into deeply buried experiments.
Cosmogenic nuclides are those which were created via spallation or activation
during collisions between nuclei on Earth and cosmic rays. Nuclear spallation is the
process where nucleons are ejected from the target nuclei due to the energy of the
incoming particle. One analogy is a billiard cue ball striking a larger group of balls,
knocking one or more out of the group. Activation is the process where a nucleus absorbs
a nucleon to transmute into another, usually unstable isotope. Cosmogenics can be
created by incident cosmic rays, as well as by secondary particles in the cosmic ray
29
shower. Deep underground, the production rate of cosmogenics is nearly zero, however
there is still a chance for activation from delayed neutrons. The main source of
cosmogenic background in an underground experiment is via materials that were
activated on the surface and then later decay in-situ in the experiment. For a Ge
experiment, two significant cosmogenics are 68Ge and 60Co [27], both of which are
produced by activation of detector material while on the surface of the Earth.
Anthropogenic nuclei are those that are created via human interaction, predominately
through activities that use nuclear fission. Two types of anthropogenic nuclei are fission
products and activation products. Fission products are isotopes that are formed when
heavy nuclei fission. Since spontaneous fission is relatively rare, most of the fission
products in the world are human-induced as a result of nuclear weapons and reactors. The
number and species of fission products produced depends on the nucleus that fissions and
the energy of the neutron that induces that fission. Anthropogenic activation products are
produced in an identical fashion to those that are cosmogenically activated, except that
the source of activation nucleons is instead some man-made reaction such as thermal
neutrons from fission. In an underground experiment, contamination from fission and
activation products will decay and present a background. Efforts to mitigate the effects of
anthropogenic background include obtaining materials that have had as little exposure to
activation as possible. For some experiments, that has historically included salvaging iron
and lead from sunken ancient ships, that were constructed (and sunk) before the first
nuclear weapons test [30, 31].
30
3 Natural Production of Radon
Backgrounds from primordial isotopes are especially pervasive in an underground
environment. The soil and rock surrounding a tunnel passage contain varying levels of
naturally-occurring elements, some of which are primordial radionuclides. Uranium,
thorium, and potassium content present the largest contributions to underground natural
radioactivity due to a combination of high relative abundance and relatively short lifetime
compared to other primordial nuclides. The contribution from 40K is not significant for
0νββ since it decays via beta decay with energy less than Qββ so that it will not have a
background in the region of interest [32]. However, the major constituent isotopes of
uranium, 235U and 238U, and thorium, 232Th, all alpha decay with energy greater than Qββ.
It may seem that these alpha decays would be of too great energy to contribute to a
background in the region of interest, but the alphas could be detected in the region of
interest if they are incident at a large angle or if they lose sufficient energy while passing
through some dead layer on the detector surface. Contamination of U and Th on the
detector surface, or perhaps very close on the detector mounting hardware, could produce
signals from degraded alpha particles. Otherwise, these decays will have short range and
are easily shielded from the detectors.
The decay products of U and Th decays are certainly harder to shield, particularly
radon. As the first gaseous product in the U and Th decay chains, radon will be the first
daughter to escape any materials containing U or Th contamination. Further, radon’s
chemical properties, as a noble gas, mean that any radon that is released is generally free
to transport without being chemically captured or adsorbed. Even radon that originates
31
relatively far from the detector could diffuse into the detector enclosure and present a
background. This is particularly true for 222Rn, a daughter of 238U decay, which is fairly
long-lived with a 3.82-day half-life, though less true for other Rn isotopes which have
half-lives closer to seconds or minutes. Radon presents such a significant background
because, in addition to the direct effect of its alpha decay, many of the subsequent
daughter decays could have an energy in the region of interest. Figures 9 and 10 depict a
portion of the decay chains of the most significant primordial radionuclides in an
underground environment, 238U and 232Th, both starting at the first Rn daughter in the
chain. Some of the isotopes have branching ratios towards other decays or may have a
different decay in excited states, however most of these branching ratios are typically less
than one percent. One notable exception is 212Bi in the 232Th chain, which beta decays
about 64% of the time but may also alpha decay about 36% of the time [32].
Other isotopes of uranium and thorium likewise have decay chains that include
radon, but these other isotopes collectively constitute less than one percent of all U and
less than one tenth of one percent of all Th, respectively. Further, all material
underground has the same relative isotopic composition of U and Th, i.e. there is no
significant mechanism for enrichment underground beyond the differences in decay rates
between isotopes (which occurs over long time scales).
32
Figure 9: 238U decay chain, beginning at 222Rn, energies are Q values [32]
Figure 10: 232Th decay chain, beginning at 220Rn, energies are Q values [32]
33
It is useful to note that the half-lives on Figures 9 and 10 are for the ground state and
the energies listed are Q-values. As noted in section 2.2, some of the energy of the decay
goes into the emitted particle(s), and some goes into recoil energy of the daughter
nucleus. Since the momentum of the parent nucleus must be conserved between the
daughters, the recoil energy is not arbitrary. The emitted particles are very light compared
to a nucleus for beta decay, so the recoil energy is small. However, an α particle is not
negligible in mass compared to even transuranic nuclei so that a nucleus which alpha
decays will have appreciable recoil energy and the kinetic energy of the outgoing α will
be somewhat diminished. The recoil and decay particle energies may be calculated by
conservation of energy and momentum, however precise measured values are available
via the Evaluated Nuclear Structure Date File (ENSDF) [32].
Accordingly, by measuring the levels of 232Th and 238U alone in a material, we can
determine the total amount of U and Th contamination in that material. An effective and
nondestructive method of measuring the amounts of these radioisotopes is to directly
measure the activity levels of their daughter decay products. Because the lifetime of 232Th
and 238U are so long compared to their daughters, and the amount of 238U and 232Th in the
environment is constant over very long timescales, the level of both parents and
daughters will maintain an equilibrium. If all daughters in a decay chain of a very long-
lived nuclide have lifetimes much shorter (orders of magnitude) than the parent, all decay
products in the chain will reach an approximately steady state. This steady state, called
secular equilibrium, is represented by a constant ratio of the number of parent nuclides to
the population of the decay product, or daughter population, where A is activity:
1/2
1/2
D
D P P DP
tN N A A
t= = (20)
34
Of course, this equilibrium is broken if any of the daughters are removed via
some other process (such as flushing out the radon gas). It would take only a few half-
lives of the daughter to return to equilibrium.
The primary concern of radon to most people is that of human health due to radon
in basements and homes. Radon and its decay products are inhaled and ingested and pose
an internal health risk. If radon decays within the body, in the lungs or elsewhere, much
of the energy will be absorbed by internal organs, damaging cells which could then form
cancers. As a gas, the major concern of radon is an elevated risk of lung cancer [33].
Buildings that have a high natural concentration of radon, usually from surrounding rock
and soil, must install systems that filter radon out of the building air in order to mitigate
this health risk.
Radon levels can be very high in an underground or mine environment, with
much more exposure to uranium-bearing rock and confined spaces for radon to collect.
Air filtering and other mitigation systems exist for the health of mine personnel; however,
these mitigation systems do not remove all radon. The exposure to radon in an
underground environment persists as a large source of background for sensitive
experiments. A successful experiment must integrate a system to either remove or
exclude radon from the detector volume. MAJORANA accomplishes most radon
mitigation via aluminum panels enclosing additional shields [24, 34], while GERDA does
so through a combination of using water as a passive shield and the liquid argon active
veto system [23].
35
However, even if all efforts to mitigate radon that originates external to the
detector volume are successful, there will still be a background due to radon originating
from the detector components themselves. Radon can emanate not only from rock and
soil, but also from other materials. In fact, many materials contain uranium and thorium
in some minute quantity. On average, the crust of the earth contains 2.5 parts per million
(ppm) by mass of uranium and 13 ppm of thorium [35], although some minerals such as
ores may have much more, and some may have less. Ordinarily, the amount of uranium
and thorium present in most materials is far below a level of concern for health risk, or
even for background radiation in experiments that do not require ultra-low background.
In an application where there is a requirement for close to zero background radiation,
even tiny amounts of uranium, thorium, or any of the radioactive decay products of the
two, are significant. Assuming U and Th concentrations equal to the average of the
Earth’s crust and using the ratio 1/2 1/2/D Pt t in Equation 20, we can see that, in equilibrium,
the amount of 222Rn coming from the 238U decay chain is about 3 orders of magnitude
greater than the amount of 220Rn coming from the 232Th decay chain. This means that
most radon that contributes to the background will come from 238U, unless there is an
unusually high thorium content.
A successful experiment must make every effort to reduce and characterize the
radon background. In order to do so, radon assay is required. The concentration of radon
in an experiment depends heavily on the levels of U and Th. However, other factors
affect Rn emanation and the U and Th content of materials are often not precisely known.
Therefore, it is not easy to determine the Rn activity in an experiment without direct
measurement.
36
3.1 Radon Mitigation through Material Assay
The ideal goal of radon mitigation is to have zero radon in the detector volume.
While this is not practically feasible, it is certainly possible to use materials that would
reduce the amount of radon as much as possible. The amount of radon coming from a
sample is based on the amount of uranium and thorium in the material and the material
properties that allow radon to escape, such as thermal and chemical stability, density, and
surface properties of the material. [36] Radon can also escape a material via diffusion or
nuclear recoil of radium α decay. Radon has a fairly small diffusion coefficient [37], so
that the contribution from nuclear recoil will usually be dominant. The alpha decay
results in a nuclear recoil. If this α decay of radium occurs on or near the surface of the
material, or on or near an internal cavity of the material, the radon can escape [36]. Once
the radon has escaped the material, it can flow out through pores and fissures of the
material or diffuse out.
As mentioned earlier, the level of uranium or thorium alone does not determine the
amount of radon that will emanate from the material. The intrinsic physical and chemical
properties of the material are one important factor [37]. For example, material with high
porosity will allow radon to diffuse much easier. Also, materials that have poor stability
to changes in temperature or humidity are not ideal since they may have an inconsistent
radon emanation rate. It is certainly beneficial to choose a material that has both low U
and Th content, as well as excellent thermal and chemical properties.
Besides the inherent properties of the material, the sourcing, construction, and
finish of the material are also important. Radon emanation of a particular material could
37
vary with manufacture location due to variations in manufacturing procedures and
variations in environmental conditions. Material with a coarse, uneven surface profile
could allow more radon to escape compared to a polished surface due to a much higher
exposed surface area. Small imperfections such as pits or bumps in the surface finish will
result in an exposed effective surface area which is greater than its macroscopic surface
area. The degree of this difference from the macroscopic surface area is proportional to
the surface roughness. For this reason, surface finishing procedures such as
electropolishing, electroplating, or coating could result in a lower radon emanation rate.
Determining the radon emanation rate from a specific material or object is
important in selecting materials that will most effectively mitigate the overall radon level
of an experiment. To do so requires a sensitive material assay capability. With a sensitive
radon detector, it is possible to determine what materials, surface finishes, and
construction techniques have the lowest radon emanation rate. Ideally, the detector
should have zero background contribution from radon, and material selection through
radon assay is an important factor in pursuing that goal.
3.2 Radon Background Characterization through Material Assay
Total uranium and thorium content is proportional to the mass of detector and
construction materials, and radon emanation is proportional to the exposed surface area.
Increasing the mass of detector material will increase the sensitivity to rare events such as
0νββ since the likelihood of observing an event is proportional to the number of
candidate nuclei. However, increasing the detector mass will also require additional inert
construction material which does not increase the sensitivity to ββ events but does
increase the radon background.
38
The goal of material assay for radon mitigation is to compare various materials and
parts to determine which have the lowest radon emanation. All that is needed to achieve
this is to compare the relative radon rates in each material, but not necessarily the
absolute rates of each. However, an accurate characterization of the radon background is
crucial to understanding the overall sensitivity of the experiment. The sensitivity of the
experiment is proportional to its net background activity, as is evident in Equation 19 via
a longer maximum detectable ββ half-life. A precise measurement of AB requires a
precise measurement of the total radon emanation rate of all material exposed to the
detector volume, either emanated directly or diffused. In fact, successful radon mitigation
drives a need for even more precise characterization of the radon background since lower
backgrounds require increasingly more sensitive radioassay techniques.
39
4 MAJORANA Demonstrator Radon Detection Chamber
4.1 Motivation
This project entails building a radon detection chamber for use in characterization
and mitigation of radon background for the MAJORANA Demonstrator (MJD)
experiment. The goal of this detector is to develop a Rn monitoring capability for both
real-time monitoring and very sensitive emanation measurements. To date, radioassay
efforts for MJD have focused on γ-ray counting, mass spectroscopy, and neutron
activation analysis. A radon assay capability, sensitive to α backgrounds, will certainly be
beneficial to the MJD assay program. A radon detection chamber could primarily be
utilized to assess radon levels of MJD components, including both construction materials
and support materials such as tools. While MJD uses a series of shielding material,
including a radon exclusion layer, it is important to know the effectiveness of this
shielding. The MJD radon detection chamber may also be used to monitor the radon
activity of the gas within the HPGe detector volume.
4.2 Detector System Design
The MJD radon detector consists of a large, upright cylindrical stainless-steel
vessel, similar to a bell jar, with a silicon PIN-type semiconductor photodiode mounted
on the lid. A large positive voltage is applied to the vessel via a high-voltage power
supply connected to the lid. The photodiode, electrically insulated from the vessel, is
given a negative operating bias voltage. The large potential difference
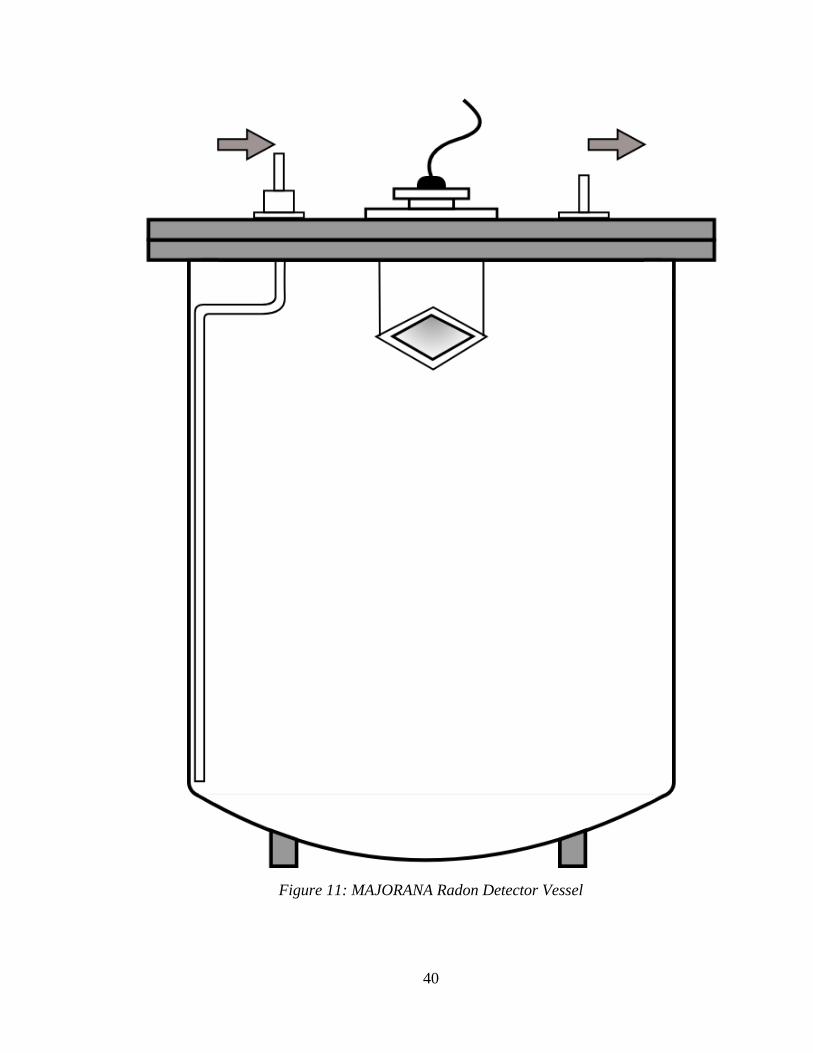
40
Figure 11: MAJORANA Radon Detector Vessel
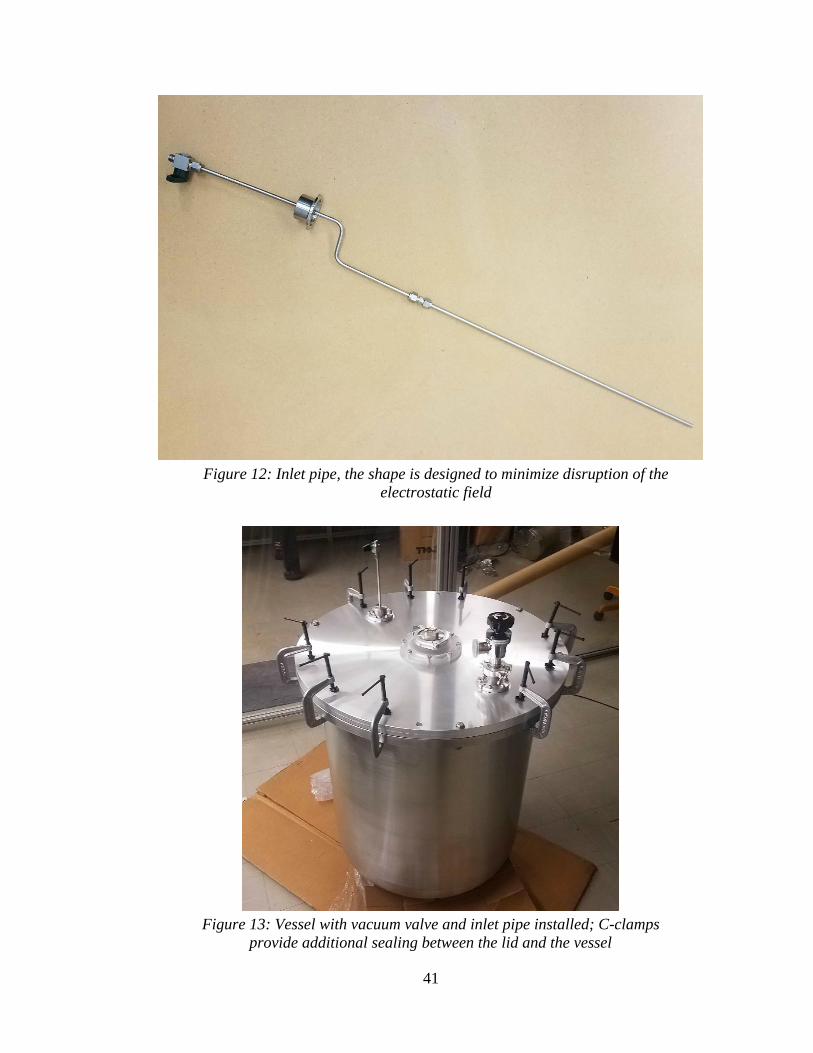
41
Figure 13: Vessel with vacuum valve and inlet pipe installed; C-clamps
provide additional sealing between the lid and the vessel
Figure 12: Inlet pipe, the shape is designed to minimize disruption of the
electrostatic field
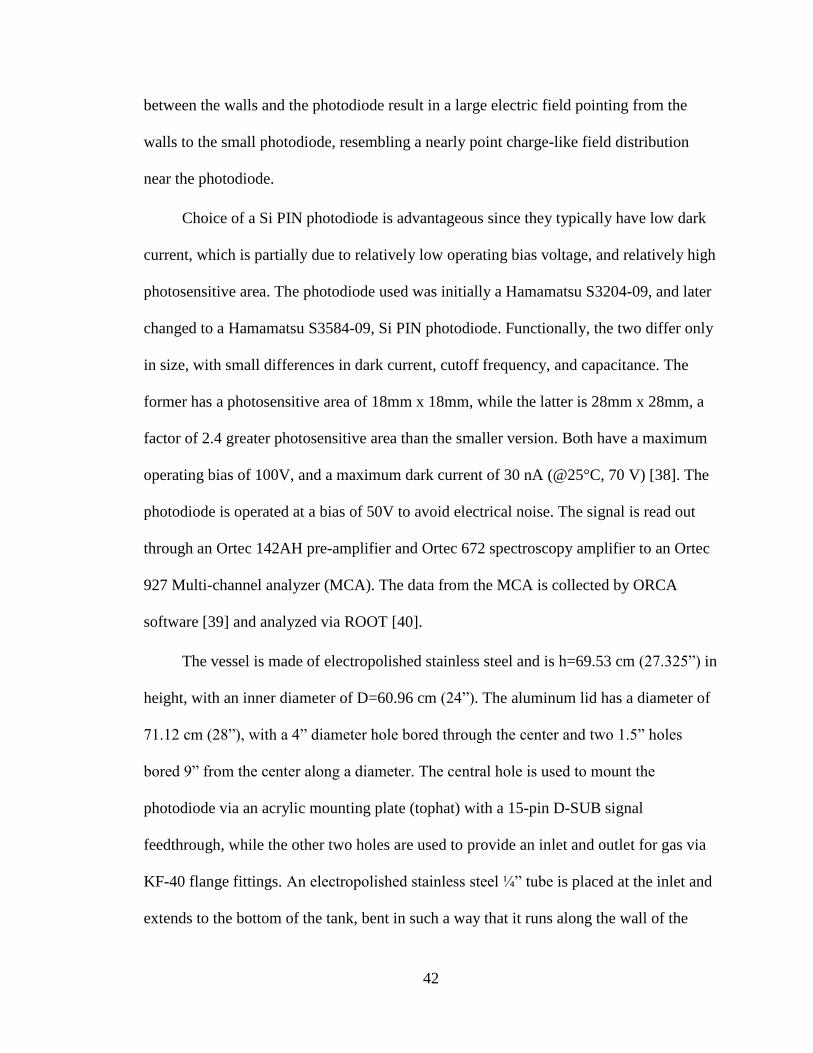
42
between the walls and the photodiode result in a large electric field pointing from the
walls to the small photodiode, resembling a nearly point charge-like field distribution
near the photodiode.
Choice of a Si PIN photodiode is advantageous since they typically have low dark
current, which is partially due to relatively low operating bias voltage, and relatively high
photosensitive area. The photodiode used was initially a Hamamatsu S3204-09, and later
changed to a Hamamatsu S3584-09, Si PIN photodiode. Functionally, the two differ only
in size, with small differences in dark current, cutoff frequency, and capacitance. The
former has a photosensitive area of 18mm x 18mm, while the latter is 28mm x 28mm, a
factor of 2.4 greater photosensitive area than the smaller version. Both have a maximum
operating bias of 100V, and a maximum dark current of 30 nA (@25°C, 70 V) [38]. The
photodiode is operated at a bias of 50V to avoid electrical noise. The signal is read out
through an Ortec 142AH pre-amplifier and Ortec 672 spectroscopy amplifier to an Ortec
927 Multi-channel analyzer (MCA). The data from the MCA is collected by ORCA
software [39] and analyzed via ROOT [40].
The vessel is made of electropolished stainless steel and is h=69.53 cm (27.325”) in
height, with an inner diameter of D=60.96 cm (24”). The aluminum lid has a diameter of
71.12 cm (28”), with a 4” diameter hole bored through the center and two 1.5” holes
bored 9” from the center along a diameter. The central hole is used to mount the
photodiode via an acrylic mounting plate (tophat) with a 15-pin D-SUB signal
feedthrough, while the other two holes are used to provide an inlet and outlet for gas via
KF-40 flange fittings. An electropolished stainless steel ¼” tube is placed at the inlet and
extends to the bottom of the tank, bent in such a way that it runs along the wall of the
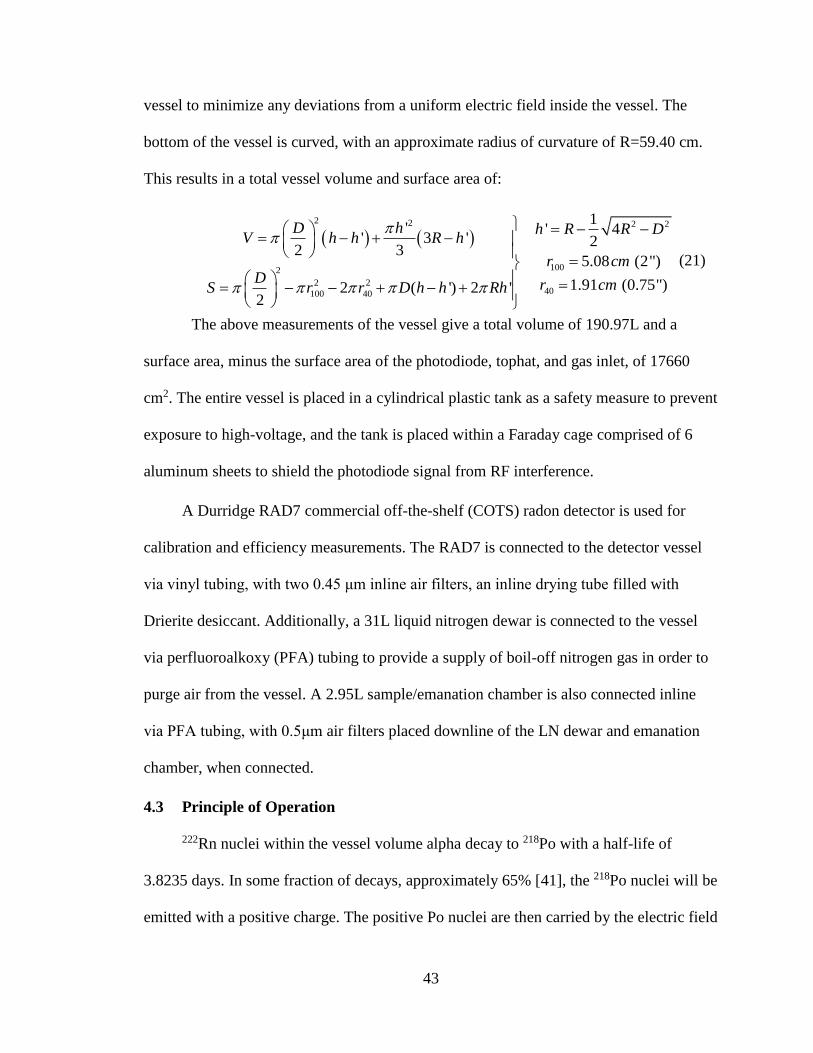
43
vessel to minimize any deviations from a uniform electric field inside the vessel. The
bottom of the vessel is curved, with an approximate radius of curvature of R=59.40 cm.
This results in a total vessel volume and surface area of:
( ) ( )2 2 2 2
1002
2 240100 40
1' ' 4
' 3 ' 22 3
5.08 (2")
1.91 (0.75")2 ( ') 2 '2
D h h R R DV h h R h
r cmD r cmS r r D h h Rh
= − − = − + −
=
== − − + − +
(21)
The above measurements of the vessel give a total volume of 190.97L and a
surface area, minus the surface area of the photodiode, tophat, and gas inlet, of 17660
cm2. The entire vessel is placed in a cylindrical plastic tank as a safety measure to prevent
exposure to high-voltage, and the tank is placed within a Faraday cage comprised of 6
aluminum sheets to shield the photodiode signal from RF interference.
A Durridge RAD7 commercial off-the-shelf (COTS) radon detector is used for
calibration and efficiency measurements. The RAD7 is connected to the detector vessel
via vinyl tubing, with two 0.45 μm inline air filters, an inline drying tube filled with
Drierite desiccant. Additionally, a 31L liquid nitrogen dewar is connected to the vessel
via perfluoroalkoxy (PFA) tubing to provide a supply of boil-off nitrogen gas in order to
purge air from the vessel. A 2.95L sample/emanation chamber is also connected inline
via PFA tubing, with 0.5μm air filters placed downline of the LN dewar and emanation
chamber, when connected.
4.3 Principle of Operation
222Rn nuclei within the vessel volume alpha decay to 218Po with a half-life of
3.8235 days. In some fraction of decays, approximately 65% [41], the 218Po nuclei will be
emitted with a positive charge. The positive Po nuclei are then carried by the electric field
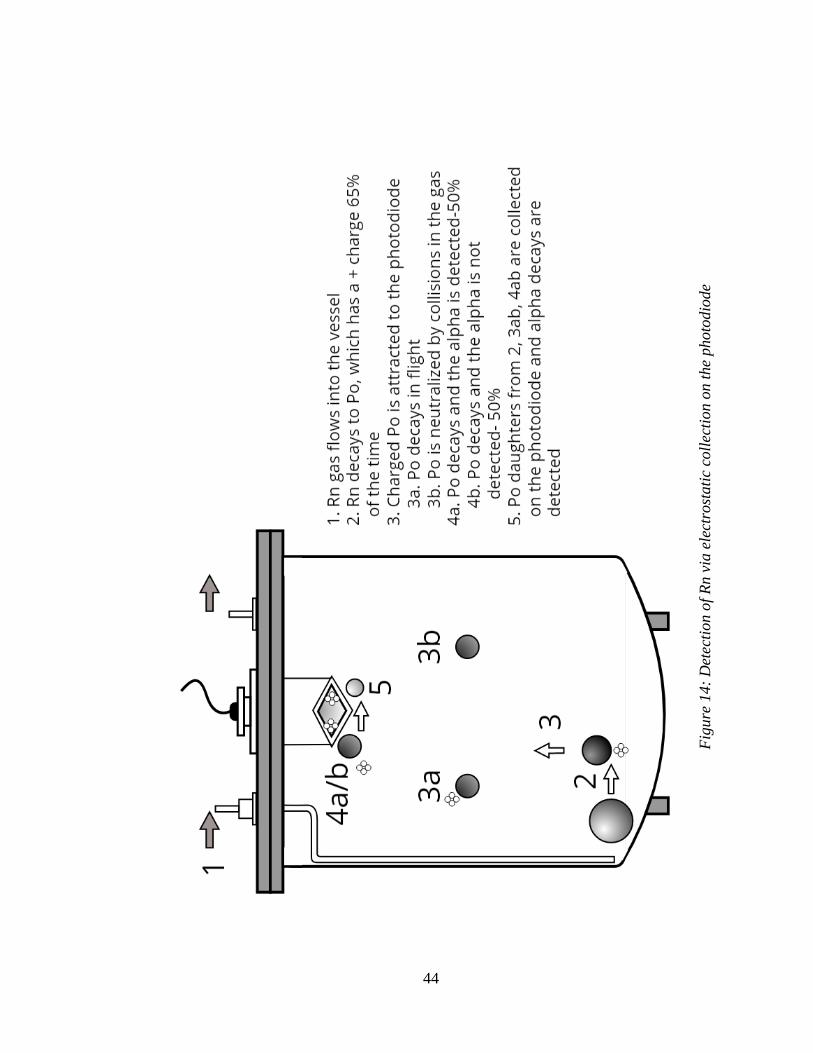
44
Fig
ure
14:
Det
ecti
on o
f R
n v
ia e
lect
rost
ati
c co
llec
tion o
n t
he
photo
dio
de
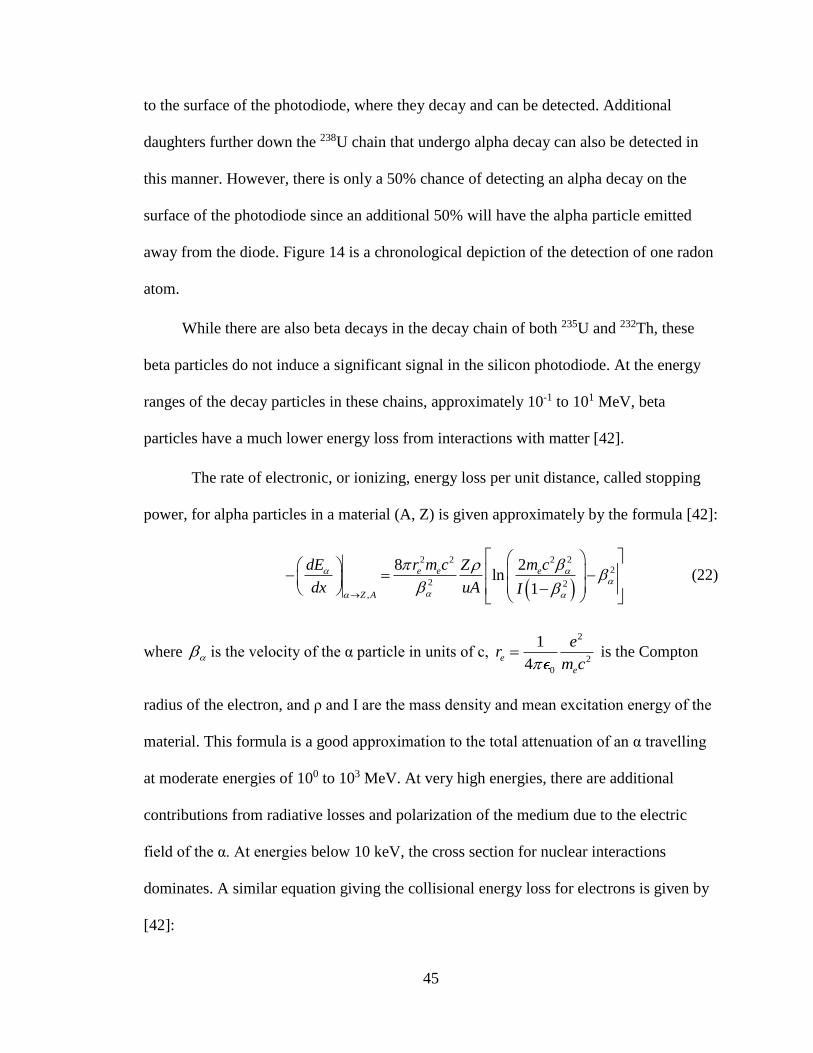
45
to the surface of the photodiode, where they decay and can be detected. Additional
daughters further down the 238U chain that undergo alpha decay can also be detected in
this manner. However, there is only a 50% chance of detecting an alpha decay on the
surface of the photodiode since an additional 50% will have the alpha particle emitted
away from the diode. Figure 14 is a chronological depiction of the detection of one radon
atom.
While there are also beta decays in the decay chain of both 235U and 232Th, these
beta particles do not induce a significant signal in the silicon photodiode. At the energy
ranges of the decay particles in these chains, approximately 10-1 to 101 MeV, beta
particles have a much lower energy loss from interactions with matter [42].
The rate of electronic, or ionizing, energy loss per unit distance, called stopping
power, for alpha particles in a material (A, Z) is given approximately by the formula [42]:
( )
2 2 2 22
2 2
,
8 2ln
1
e e e
Z A
dE r m c m cZ
dx uA I
→
− = − −
(22)
where is the velocity of the α particle in units of c, 0
2
2
1
4e
e
er
m c= is the Compton
radius of the electron, and ρ and I are the mass density and mean excitation energy of the
material. This formula is a good approximation to the total attenuation of an α travelling
at moderate energies of 100 to 103 MeV. At very high energies, there are additional
contributions from radiative losses and polarization of the medium due to the electric
field of the α. At energies below 10 keV, the cross section for nuclear interactions
dominates. A similar equation giving the collisional energy loss for electrons is given by
[42]:
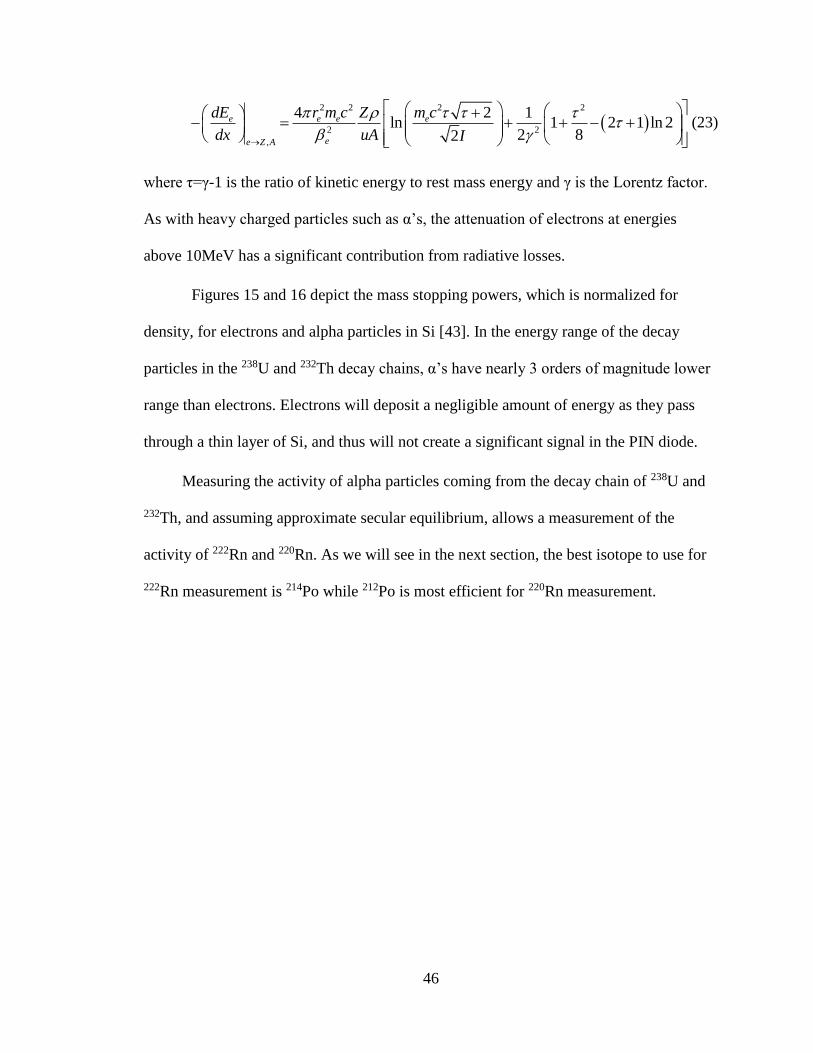
46
( )2 2 2 2
2 2
,
4 2 1ln 1 2 1 ln 2
2 82
e e e e
ee Z A
dE r m c Z m c
dx uA I
→
+ − = + + − +
(23)
where τ=γ-1 is the ratio of kinetic energy to rest mass energy and γ is the Lorentz factor.
As with heavy charged particles such as α’s, the attenuation of electrons at energies
above 10MeV has a significant contribution from radiative losses.
Figures 15 and 16 depict the mass stopping powers, which is normalized for
density, for electrons and alpha particles in Si [43]. In the energy range of the decay
particles in the 238U and 232Th decay chains, α’s have nearly 3 orders of magnitude lower
range than electrons. Electrons will deposit a negligible amount of energy as they pass
through a thin layer of Si, and thus will not create a significant signal in the PIN diode.
Measuring the activity of alpha particles coming from the decay chain of 238U and
232Th, and assuming approximate secular equilibrium, allows a measurement of the
activity of 222Rn and 220Rn. As we will see in the next section, the best isotope to use for
222Rn measurement is 214Po while 212Po is most efficient for 220Rn measurement.
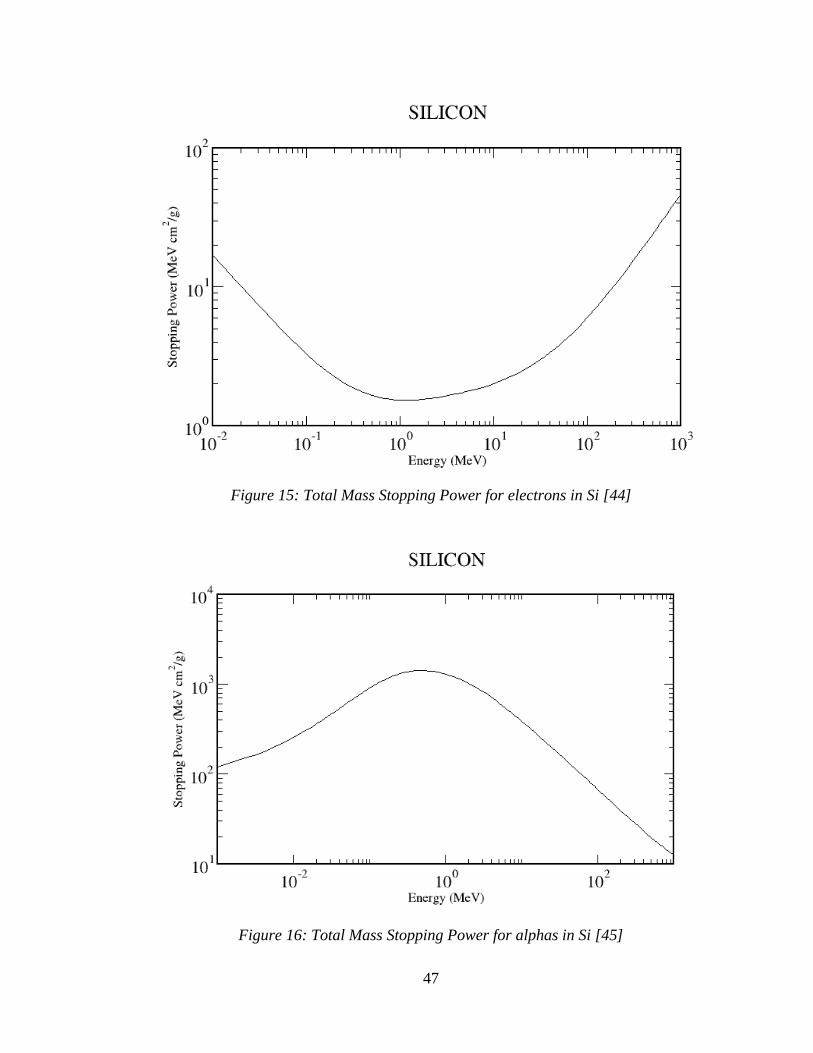
47
Figure 15: Total Mass Stopping Power for electrons in Si [44]
Figure 16: Total Mass Stopping Power for alphas in Si [45]
48
An example of a typical output of the MCA, as analyzed by ROOT is shown in
Figures 17 and 18. Figure 17 is a plot of measured events in each of the MCA’s 16,383
channels, with the channel number scaled to be calibrated for energy. The calibration
factor is photodiode-specific. It is determined by measuring the channel number
corresponding to the maximum value of a polonium alpha peak and scaling that channel
number by the expected energy of the specific alpha. For example, if the 214Po alpha
energy spectrum had a peak on channel number 6095 on the MCA, the calibration factor
would be the expected energy of the 214Po α, 7.687 MeV [32], divided by the peak
channel. The calibration factor would also correspond to the energy width of each
channel detected by the MCA. For Figures 17 and 18 this calibration factor is
approximately 1.3 keV/channel.
Semiconductor detectors operate by measuring electron-hole pairs induced by
collisions with the incoming particle, with one pair produced every 3.62 eV of energy
loss of the particle, on average [38]. Since 3.6 eV is much less than the typical α energy
of a few MeV, the photodiode is able to observe nearly the entire energy loss of the
particle, and the number of hole-electron pairs will scale linearly with the energy
loss. For this reason, we should expect that the photodiode will have an output that
is linearly proportional to the energy deposited in the photodiode by the
penetrating particle. For alphas this should correspond to the total energy of the
alpha, whereas for betas this will be a small fraction of the total energy due to their
very low stopping power. Therefore, for the alpha decays of interest in this work,
our scaling from MCA channel to energy would be close to constant across all
channels.
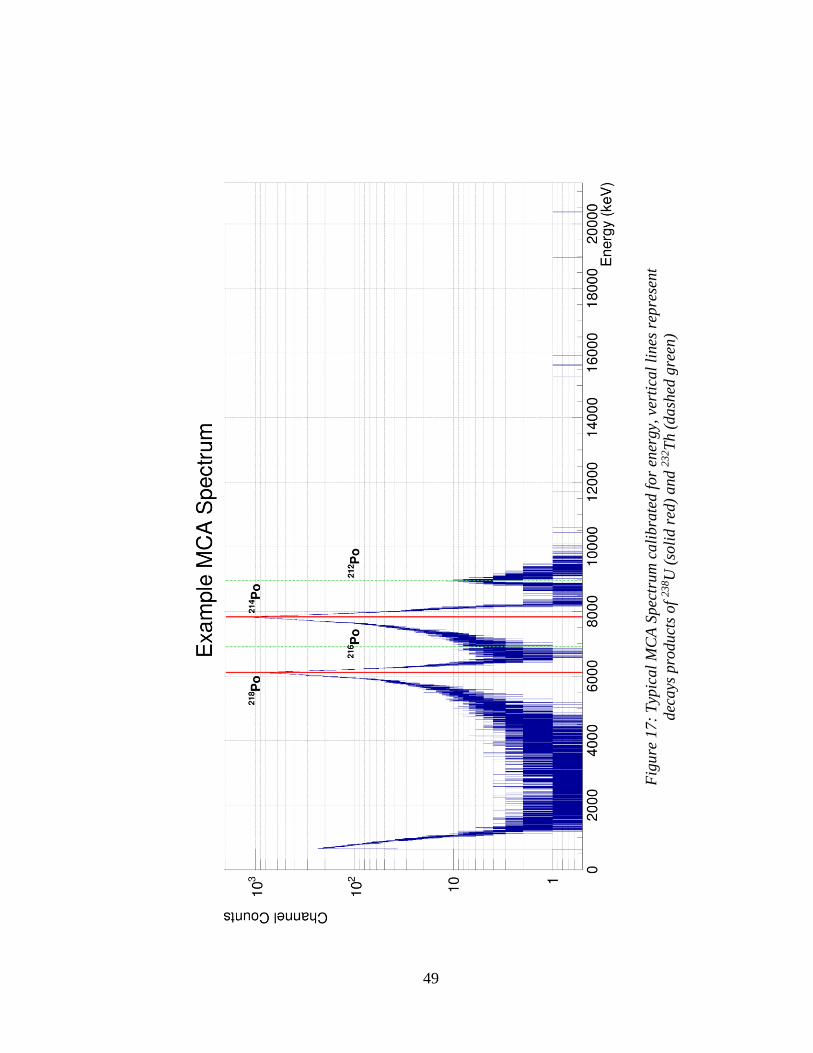
49
Fig
ure
17:
Typ
ical
MC
A S
pec
trum
cali
bra
ted f
or
ener
gy,
ver
tica
l li
nes
rep
rese
nt
dec
ays
pro
duct
s of
23
8U
(so
lid r
ed)
and 2
32T
h (
dash
ed g
reen
)
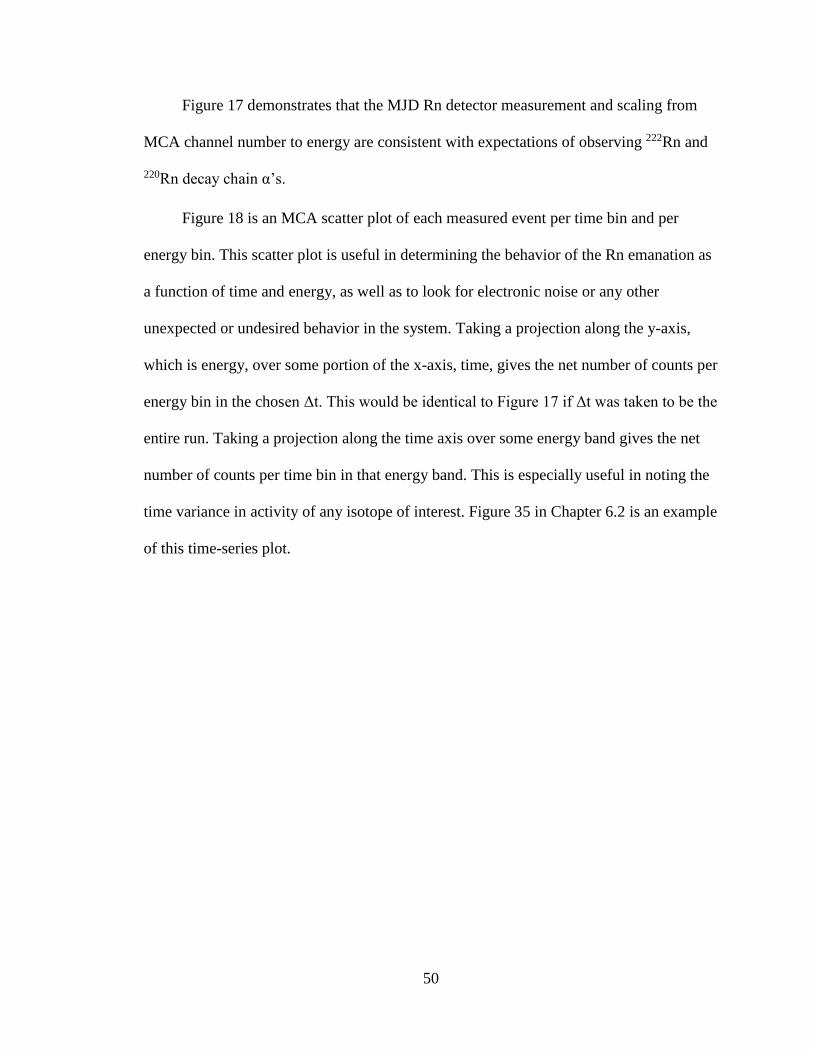
50
Figure 17 demonstrates that the MJD Rn detector measurement and scaling from
MCA channel number to energy are consistent with expectations of observing 222Rn and
220Rn decay chain α’s.
Figure 18 is an MCA scatter plot of each measured event per time bin and per
energy bin. This scatter plot is useful in determining the behavior of the Rn emanation as
a function of time and energy, as well as to look for electronic noise or any other
unexpected or undesired behavior in the system. Taking a projection along the y-axis,
which is energy, over some portion of the x-axis, time, gives the net number of counts per
energy bin in the chosen Δt. This would be identical to Figure 17 if Δt was taken to be the
entire run. Taking a projection along the time axis over some energy band gives the net
number of counts per time bin in that energy band. This is especially useful in noting the
time variance in activity of any isotope of interest. Figure 35 in Chapter 6.2 is an example
of this time-series plot.
51
Fig
ure
18:
MC
A m
easu
red e
vents
vs
Tim
e (x
-axi
s) a
nd E
ner
gy
(y-a
xis)
;
each
mark
indic
ate
s on
e co
unt
52
4.4 Efficiency of ion collection
The drift range of heavy ions in air also affects the efficiency of the detector to
measuring Rn. As Rn atoms in the vessel decay, and 218Po ions are swept to the detector,
some 218Po ions decay in transit or collide with molecules in the vessel gas. The number
of decays in transit is proportional to the drift time, td, of ions in the gas, and thus
inversely proportional to the drift velocity [46]. We can approximate the mean drift
velocity by:
max; 0d
d
lv KE l l
t= = (24)
where l is the distance from an arbitrary point inside the vessel and the photodiode, lmax is
the largest possible value of l allowed geometrically, K is the ionic mobility of radon in
air, and E is the electric field strength. The drift velocity is determined by ionic mobility,
the drift speed attained per unit electric field, E, in a given gas. For an ion of a certain
mass and charge in a gas, the ionic mobility, K, is inversely proportional to the mass and
density of the gas as well as the interaction cross section between the ion and the gas
[46]. The likelihood of a Po2+ ion reaching the detector are thus increased for a higher
electric field and a vessel gas which is free of contaminants, such as water or trace heavy
compounds, which could neutralize the drifting ion due to collisions.
The reduction in efficiency due to neutralization of ions in the gas depends
primarily on the density and composition of the gas, and to a lesser extent on the drift
velocity of the ion. However, the effect of decay prior to deposition on the photodiode
surface is greater for lower drift velocities, and lower electric fields. Since the half-life of
218Po is 3.1 minutes, the effect due to decay in transit will be small. However, 216Po in the
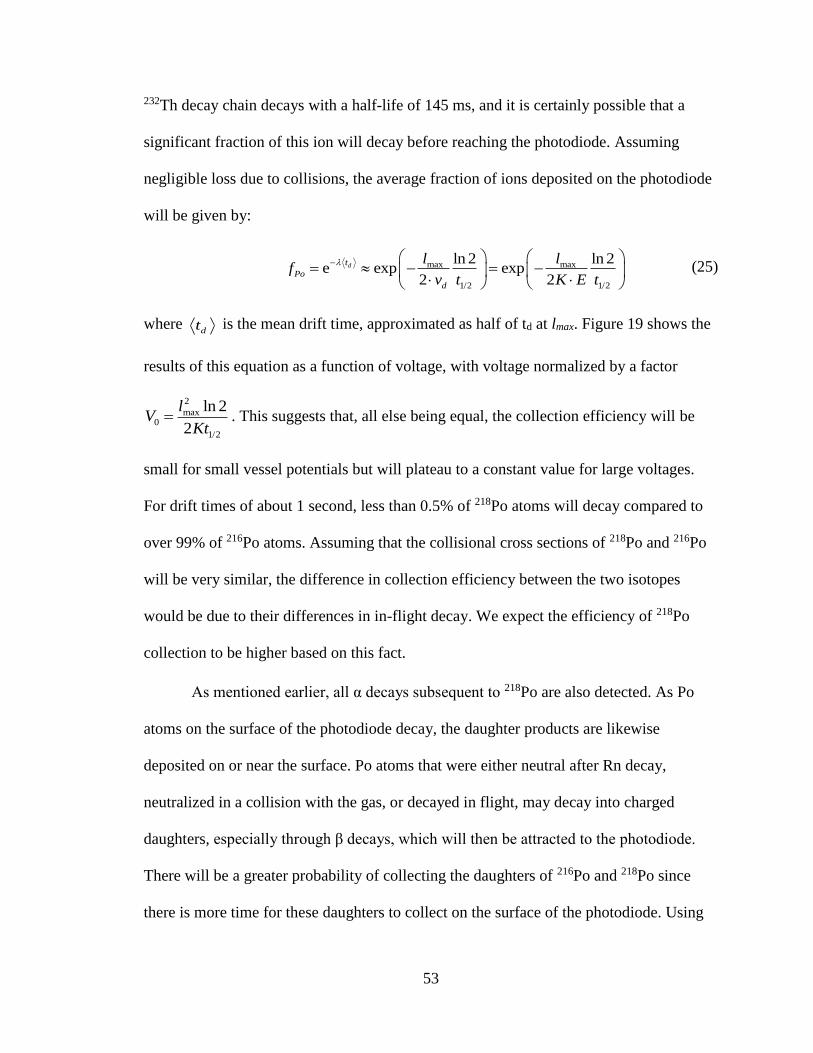
53
232Th decay chain decays with a half-life of 145 ms, and it is certainly possible that a
significant fraction of this ion will decay before reaching the photodiode. Assuming
negligible loss due to collisions, the average fraction of ions deposited on the photodiode
will be given by:
max max
1/2 1/2
ln 2 ln 2e exp exp
2 2dt
Po
d
l lf
v t K E t
− = − = −
(25)
where dt is the mean drift time, approximated as half of td at lmax. Figure 19 shows the
results of this equation as a function of voltage, with voltage normalized by a factor
2
max0
1/2
ln 2
2
lV
Kt= . This suggests that, all else being equal, the collection efficiency will be
small for small vessel potentials but will plateau to a constant value for large voltages.
For drift times of about 1 second, less than 0.5% of 218Po atoms will decay compared to
over 99% of 216Po atoms. Assuming that the collisional cross sections of 218Po and 216Po
will be very similar, the difference in collection efficiency between the two isotopes
would be due to their differences in in-flight decay. We expect the efficiency of 218Po
collection to be higher based on this fact.
As mentioned earlier, all α decays subsequent to 218Po are also detected. As Po
atoms on the surface of the photodiode decay, the daughter products are likewise
deposited on or near the surface. Po atoms that were either neutral after Rn decay,
neutralized in a collision with the gas, or decayed in flight, may decay into charged
daughters, especially through β decays, which will then be attracted to the photodiode.
There will be a greater probability of collecting the daughters of 216Po and 218Po since
there is more time for these daughters to collect on the surface of the photodiode. Using
54
Fig
ure
19:
Fra
ctio
n o
f P
o i
ons
dep
osi
ted o
n t
he
photo
dio
de
surf
ace
, neg
lect
ing l
oss
es d
ue
to c
oll
isio
ns,
as
a
funct
ion o
f ve
ssel
volt
age
55
214Po α counts instead of 218Po α counts results in a higher efficiency of Rn detection for
this reason, while the same is true for using 212Po α counts instead of 216Po α counts. Also
for this reason, one significant concern for the long-term viability of a radon detector is
the fact that 210Pb, with a half-life of 22.2 years, will build up on the surface of the
detector and contribute to a growing activity of 210Po. Over time, a high 210Po activity
may diminish the efficiency of the photodiode by increasing the dead time of the
detector. Fortunately, the 5.41 MeV energy of 210Po is small enough to be outside the
region of interest of 214Po decay, 7.83 MeV, so that lead build-up will not directly
interfere with Rn detection. Further, this effect can be mitigated by avoiding exposing the
photodiode to high Rn concentrations or samples with high U or Th content.
56
5 Detector Efficiency Measurements
5.1 Calibration and Collection Efficiency
The Rn collection efficiency of the MAJORANA detector was measured using the
RAD7 COTS Rn detector. The efficiency is calculated by measuring the Rn activity of a
sample of unknown activity and comparing that to the activity measured by the RAD7,
which has been calibrated for its own efficiency [47]. The MJD detector efficiency is thus
defined as the ratio of the detected activity to that of the RAD7. Besides environmental
conditions such as temperature and humidity, the differences in measured activity
between the two detectors can be attributed to the efficiency of the photodiode to
detecting radon and the vessel voltage, which will affect the electric field strength.
Additionally, there will be a small to moderate difference in actual Rn activity as the gas
flows from one detector to the other. As mentioned earlier and shown in Figure 19, the
efficiency is predicted to depend strongly on the vessel voltage for low voltages but will
asymptote to a constant value at high voltages. The difference in actual activity rate is
due to the fact that radioisotopes decay between measurement at one detector and the
other. Specifically, the activity rate is a function of time:
0 0( ) ( ) t tA t N t N e A e − −= = = (26)
where N0 and A0 are the number of radioisotopes and activity at t=0. For t ≪ t1/2 A(t) is
approximately constant. As long as the gas flows from one detector to the other on a
small timescale, there will be a negligible difference in actual activity between the two.
This is certainly feasible for 222Rn since the half-life is more than 3.8 days. There may
certainly be a significant difference for 220Rn since it has a half-life of just 56 seconds.
57
Given this fact, an efficiency measurement for 222Rn can be generally accurate, though
the same measurement for 220Rn may not be.
The RAD7 operates under a similar principle to the MAJORANA detector, albeit
at a smaller scale. The RAD7 uses electrostatic collection of radioisotopes in a 0.7L
hemispherical cell, charged to a 2KV-2.5KV, onto a passivated ion-implanted planar
silicon (PIPS) detector [47]. PIPS detectors have advantages over other detector
technologies due to low dark current and leakage current, increased ruggedness, and good
energy resolution [48]. The RAD7 has demonstrated utility in various applications,
including Rn monitoring for mitigation in homes and scientific research [47].
Contributing to this utility are a broad operating range (4 to 750,000 Bq/m3), versatile
modes of operation, rugged and easily portable case, and integrated data analysis.
The RAD7 can be operated using a variety of preset and custom protocols with
different cycle time, recycle number, analysis mode, and internal pump duty load. The
cycle time determines the length of time that the RAD7 takes data for a single reading. A
longer cycle time results in lower uncertainty in the reading but also results in lower
temporal resolution. The recycle number determines the number of data points that the
RAD7 will take in a given test and is set to zero for continuous monitoring. The data
analysis mode determines which Po peaks are used in the calculation of Rn activity. The
NORMAL mode uses both 214Po and 218Po and has lower uncertainty due to better
counting statistics but may not be accurate for short-duration tests since 214Po may not
have reached equilibrium with 222Rn. The SNIFF mode uses solely 218Po, giving better
accuracy for short-runs but higher uncertainty for long runs due to a lower efficiency of
218Po collection. Another mode, AUTO, uses SNIFF mode for the first three hours of the
58
test and NORMAL after that time. Finally, the internal pump may be set to provide flow
through the RAD7 either continuously, at some interval, or not at all (if an external pump
is used). The AUTO pump setting provides flow during the first four minutes of a test to
ensure a good initial sample and then for one minute every five minutes thereafter.
The operating protocols for the MAJORANA PIN photodiode and RAD7 are set
using an ORCA script. The script sets a binning time, m_time, and total test duration,
totaltime, for the MAJORANA detector, which then continuously takes data over
totaltime and prints the results to a unique text file every m_time. The text file
contains the number of counts collected over m_time in each channel of the MCA, with
each channel corresponding to a small energy bin. Since data is taken continuously,
m_time is chosen to be short enough to allow for sufficient temporal resolution while
reducing the total number of data files and the total file size of each test. For most tests,
the binning time was set at 15 minutes.
The script also sets the cycle time, m_rad, and other operating conditions for the
RAD7. The RAD7 cycle time is chosen to balance higher counting statistics with better
temporal resolution. An m_rad of 1 hour achieves this optimization and was used for
most tests. We wish to obtain high-accuracy, continuous measurement during efficiency
testing so the recycle number was set to 0 (continuous measurement until the end of the
script at totaltime), the analysis mode was set to NORMAL, and the internal pump
duty load was set to AUTO. The Orca script logs the last reported output of the RAD7 to
a single text file every m_time during the run, with the RAD7 again reporting every
m_rad. The output of the RAD7 is in the following format:
YYYY-MM-DD HH:MM:SS +0000 GMT index RH Rn RnUnc
59
where the date and time correspond to the beginning of the time bin, the index number
corresponds to the sequential time bin number (starting from 1 and ending on
totaltime /m_time), RH is the relative humidity measured in RAD7, and Rn and
RnUnc are the radon level (A) and uncertainty (δA) measured by the RAD7 in units of
picocurie per liter (37 Bq/m3).
As mentioned above, the efficiency of our detector is measured by taking the ratio
of the average activity of 214Po and 218Po, separately, measured by the radon chamber to
the average Rn activity measured by the RAD7. The activity measured by the radon
chamber is simply the total count in the 214Po or 218Po peak divided by the total time of
the run, in seconds. The average activity of the RAD7 is taken as the maximum
likelihood mean of each RAD7 measurement A±δA in the same time period as that used
in the radon chamber activity measurement [49]:
2
1
2 2
1 1
( ) 1
( ) ( )
n
i iin n
i ii i
A AA A
A A
−
=
− −
= =
=
(27)
The significance of using this form of the mean is that it accounts for the fact that
the RAD7 measurements are themselves an average measurement taken over a time
period, m_rad. The result of this mean is converted from units of pCi/L to Bq (counts
per second) by multiplying by a factor of 0.037 Bq/pCi⋅195 L. 195 L is the approximate
total internal volume of the system while doing emanation measurements, including the
vessel, RAD7, all tubing, and in later runs the sample/emanation chamber. Once the
RAD7 activity is determined, the efficiency is given by:
22
7
7 7 7
PD PD PD RAD
RAD RAD PD RAD
A A A A
A A A A
= +
(28)
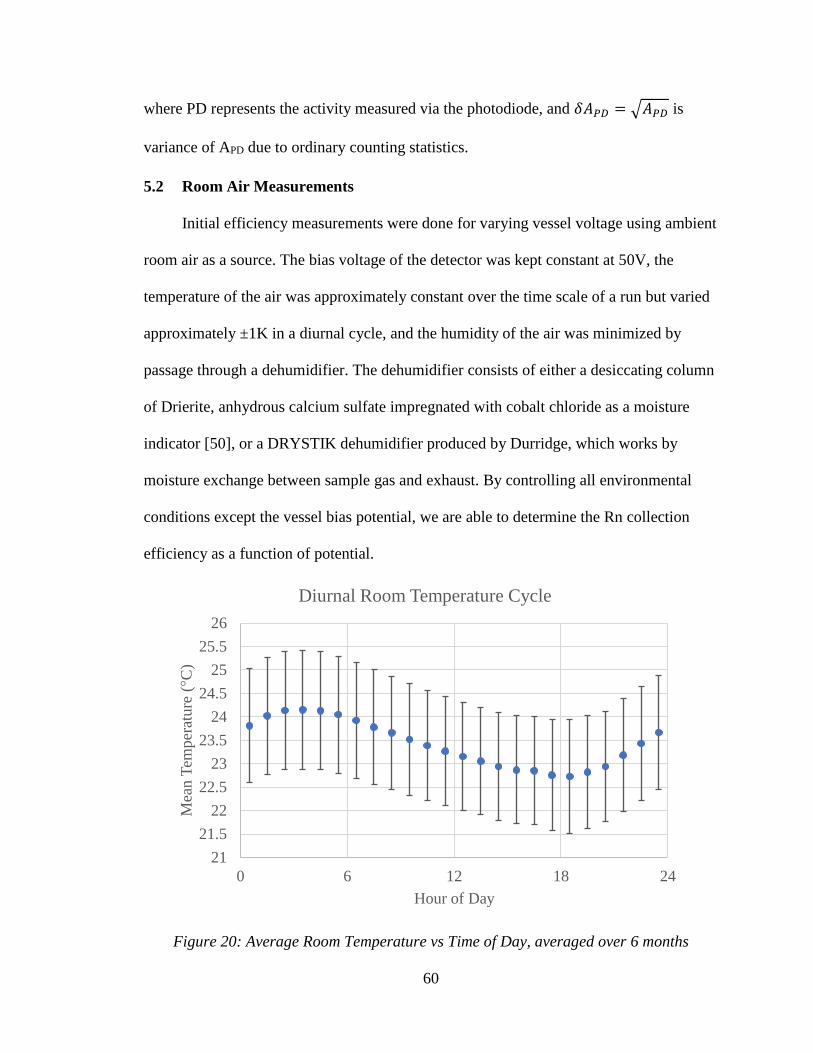
60
where PD represents the activity measured via the photodiode, and 𝛿𝐴𝑃𝐷 = √𝐴𝑃𝐷 is
variance of APD due to ordinary counting statistics.
5.2 Room Air Measurements
Initial efficiency measurements were done for varying vessel voltage using ambient
room air as a source. The bias voltage of the detector was kept constant at 50V, the
temperature of the air was approximately constant over the time scale of a run but varied
approximately ±1K in a diurnal cycle, and the humidity of the air was minimized by
passage through a dehumidifier. The dehumidifier consists of either a desiccating column
of Drierite, anhydrous calcium sulfate impregnated with cobalt chloride as a moisture
indicator [50], or a DRYSTIK dehumidifier produced by Durridge, which works by
moisture exchange between sample gas and exhaust. By controlling all environmental
conditions except the vessel bias potential, we are able to determine the Rn collection
efficiency as a function of potential.
21
21.5
22
22.5
23
23.5
24
24.5
25
25.5
26
0 6 12 18 24
Mea
n T
emper
atu
re (
°C)
Hour of Day
Diurnal Room Temperature Cycle
Figure 20: Average Room Temperature vs Time of Day, averaged over 6 months
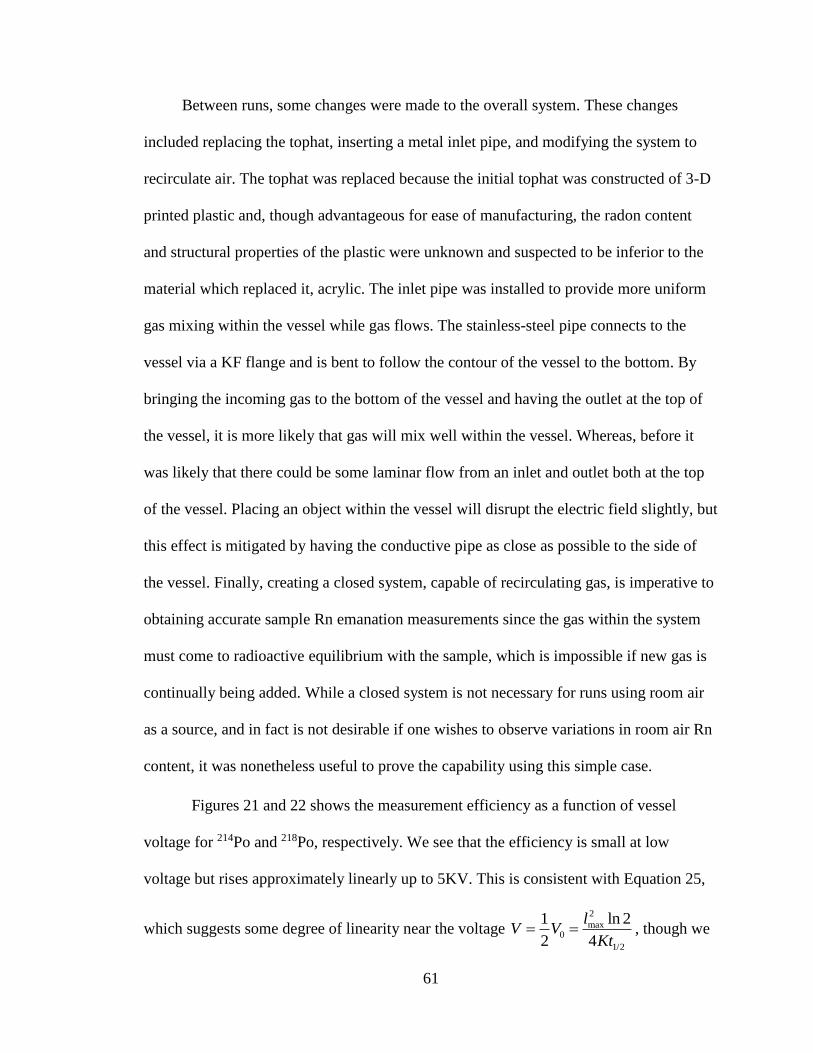
61
Between runs, some changes were made to the overall system. These changes
included replacing the tophat, inserting a metal inlet pipe, and modifying the system to
recirculate air. The tophat was replaced because the initial tophat was constructed of 3-D
printed plastic and, though advantageous for ease of manufacturing, the radon content
and structural properties of the plastic were unknown and suspected to be inferior to the
material which replaced it, acrylic. The inlet pipe was installed to provide more uniform
gas mixing within the vessel while gas flows. The stainless-steel pipe connects to the
vessel via a KF flange and is bent to follow the contour of the vessel to the bottom. By
bringing the incoming gas to the bottom of the vessel and having the outlet at the top of
the vessel, it is more likely that gas will mix well within the vessel. Whereas, before it
was likely that there could be some laminar flow from an inlet and outlet both at the top
of the vessel. Placing an object within the vessel will disrupt the electric field slightly, but
this effect is mitigated by having the conductive pipe as close as possible to the side of
the vessel. Finally, creating a closed system, capable of recirculating gas, is imperative to
obtaining accurate sample Rn emanation measurements since the gas within the system
must come to radioactive equilibrium with the sample, which is impossible if new gas is
continually being added. While a closed system is not necessary for runs using room air
as a source, and in fact is not desirable if one wishes to observe variations in room air Rn
content, it was nonetheless useful to prove the capability using this simple case.
Figures 21 and 22 shows the measurement efficiency as a function of vessel
voltage for 214Po and 218Po, respectively. We see that the efficiency is small at low
voltage but rises approximately linearly up to 5KV. This is consistent with Equation 25,
which suggests some degree of linearity near the voltage 2
max0
1/2
1 ln 2
2 4
lV V
Kt= = , though we
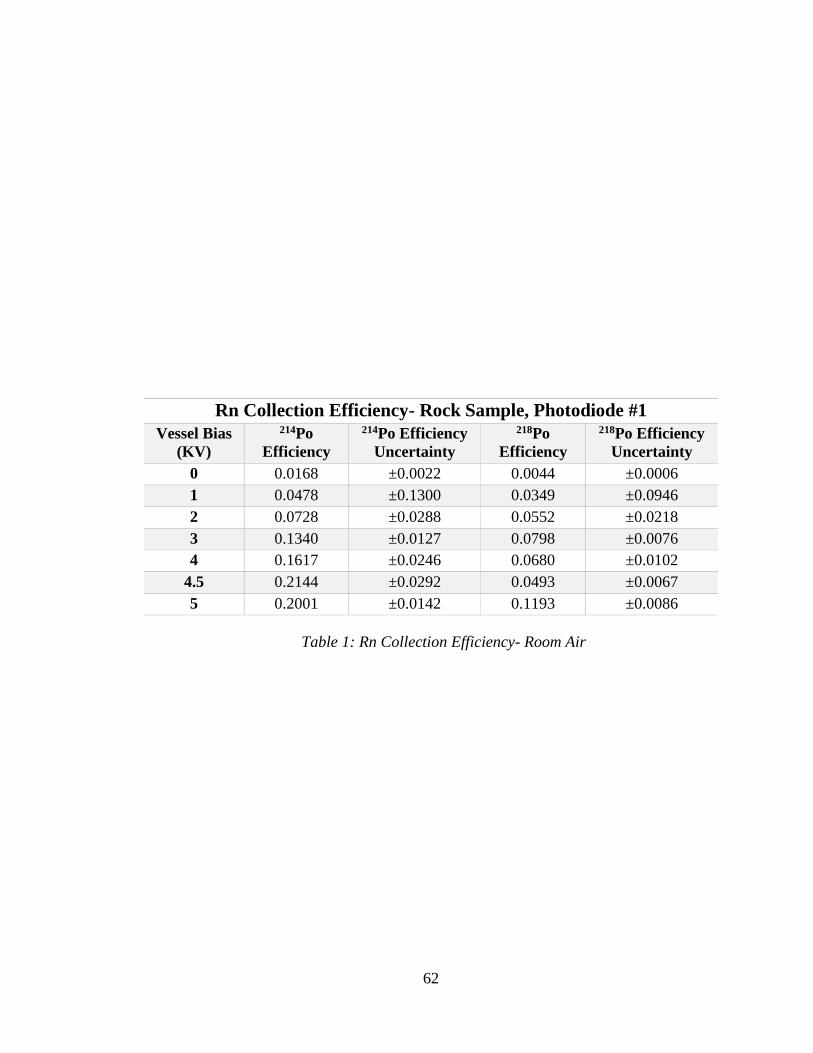
62
Rn Collection Efficiency- Rock Sample, Photodiode #1
Vessel Bias
(KV)
214Po
Efficiency
214Po Efficiency
Uncertainty
218Po
Efficiency
218Po Efficiency
Uncertainty
0 0.0168 ±0.0022 0.0044 ±0.0006
1 0.0478 ±0.1300 0.0349 ±0.0946
2 0.0728 ±0.0288 0.0552 ±0.0218
3 0.1340 ±0.0127 0.0798 ±0.0076
4 0.1617 ±0.0246 0.0680 ±0.0102
4.5 0.2144 ±0.0292 0.0493 ±0.0067
5 0.2001 ±0.0142 0.1193 ±0.0086
Table 1: Rn Collection Efficiency- Room Air
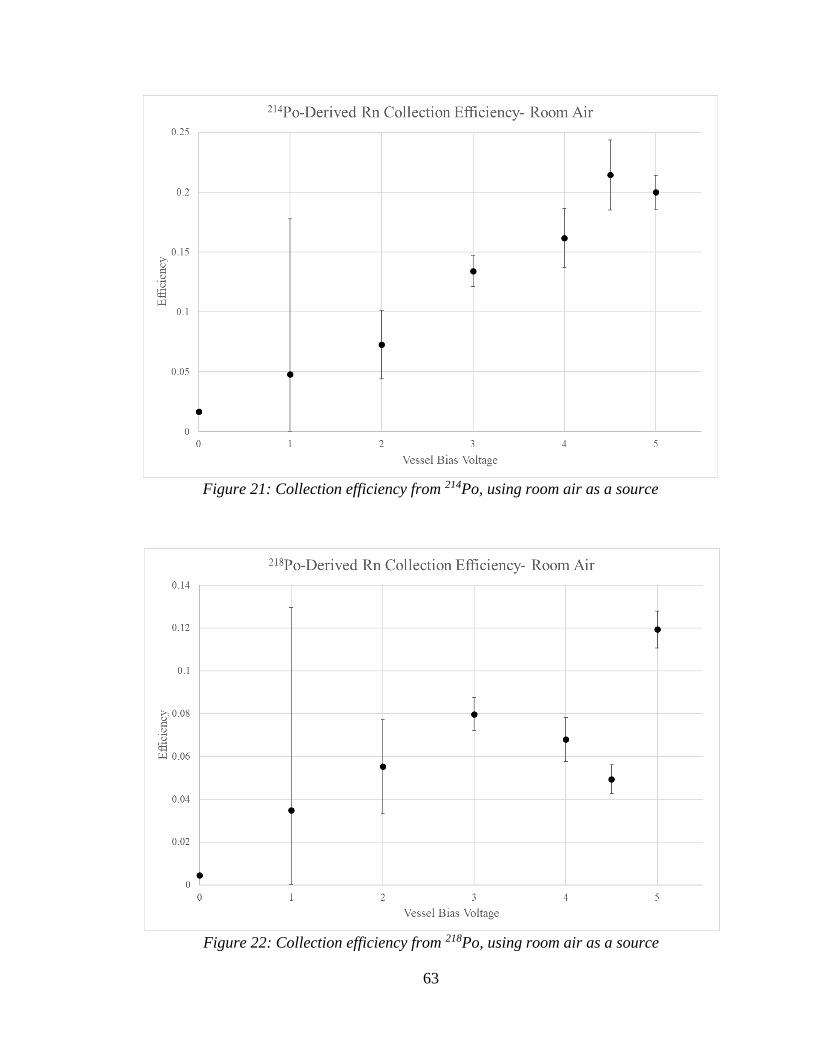
63
Figure 21: Collection efficiency from 214Po, using room air as a source
Figure 22: Collection efficiency from 218Po, using room air as a source
64
do not observe a significant plateau in efficiency as Equation 25 also predicts. As
expected, we observe a larger efficiency for 214Po collection due to the larger probability
of 214Po being swept to and decaying near the surface of the photodiode. Table 1 shows
the efficiency measurements for room air as a source.
5.3 U/Th Ore Rock Measurements
In addition to room air, a sample of a rock with high uranium and thorium content,
similar to an ore, was also used as a source. The rock was a sample of the mineral thorite
with inclusions of uranium pyrochlorate from the MacDonald Mine in Hybla, Ontario,
Canada [51]. The rock naturally had much higher activity, resulting in better counting
statistics and easier identification of specific decay peaks. Figure 23 demonstrates the
difference in activity rate of 218Po (6.002 MeV), 214Po (7.833 MeV), and 212Po (8.954
MeV) between two similar runs of equal length, with the primary difference being that
one used room air as a source and the other used the rock sample. We see in this figure
that the rock sample run, in green, indeed has a higher activity in all observed Rn decay
chain Po isotopes. The difference between the two sources is particularly notable in the
212Po alpha peak, consistent with the fact that the rock sample is similar in atomic
composition to a thorium ore. The higher activity of the rock results in better
measurement of the efficiency, especially at low to moderate voltages, as well as lower
uncertainty at a given voltage due to higher count rates and a smaller relative fraction of
Rn daughters that were removed or neutralized.
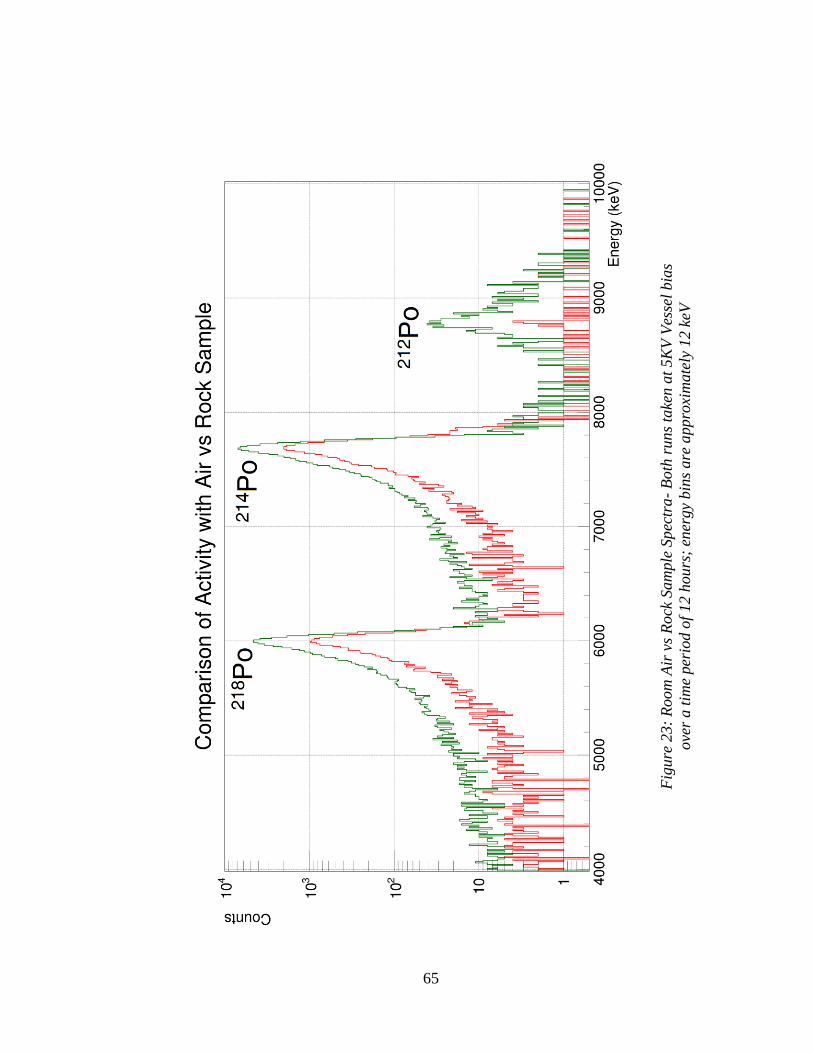
65
Fig
ure
23:
Room
Air
vs
Rock
Sam
ple
Sp
ectr
a-
Bo
th r
un
s ta
ken a
t 5K
V V
esse
l bia
s
ove
r a t
ime
per
iod o
f 12 h
ours
; en
ergy
bin
s are
appro
xim
ate
ly 1
2 k
eV
66
As with the room air runs, the runs using rock as a source kept all environmental
parameters constant except for the vessel bias potential. Three major changes were made
to the system while performing efficiency measurements using the rock sample. The first
was that a new high voltage power supply was installed to provide higher bias voltages to
the vessel. The power supply which was used previously was the same power supply that
provided the 50V reverse bias to the photodiode, through a different channel, and
supplied a maximum bias of 5KV. The new power supply, Spellman Model SL20P150,
instead provides a maximum bias of 20KV. This change allowed higher electric fields
within the vessel, and thus better Rn collection efficiencies to the extent predicted by
Figure 19. One issue related to the new power supply was that the higher voltage began
to cause breakdown sparking in the air between the lid of the vessel and the photodiode
mount ground wire. This issue was mitigated by placing a small amount of high voltage
putty on the exposed portion of the mount ground wire.
The second change was that the gas flow was modified slightly to remove the
Drystik dehumidifier, ensure a proper gas seal in the system, and change the order in
which gas flowed between the various elements. Silicon putty was placed on the inlet and
outlet holes in the lid of the 1-gallon paint can that was used as a sample chamber for the
rock sample. This change helped to ensure that the gas flow system was indeed a closed
loop, and that any radon measurement in the gas was due to the rock sample and not the
room air. The Drierite desiccant alone is sufficient to maintain low humidity in a closed
system. The gas flow was modified to send the gas from the sample chamber first to the
desiccant then to the RAD7, and then to the vessel, rather than going to the vessel first
and RAD7 last. Our goal was to minimize the transit time between the RAD7 and the
67
vessel to ensure that the air has the same activity in both chambers, so this new gas flow
provided better accuracy in the efficiency measurement.
Figures 24 and 25 show the collection efficiency as a function of vessel voltage,
again for 214Po and 218Po, during and following the changes mentioned above. We
observe a relation between efficiency and vessel bias that much more closely resembles
Equation 25 and Figure 19, with a steep rise in efficiency at low voltages and an
approach toward a constant value at high voltages.
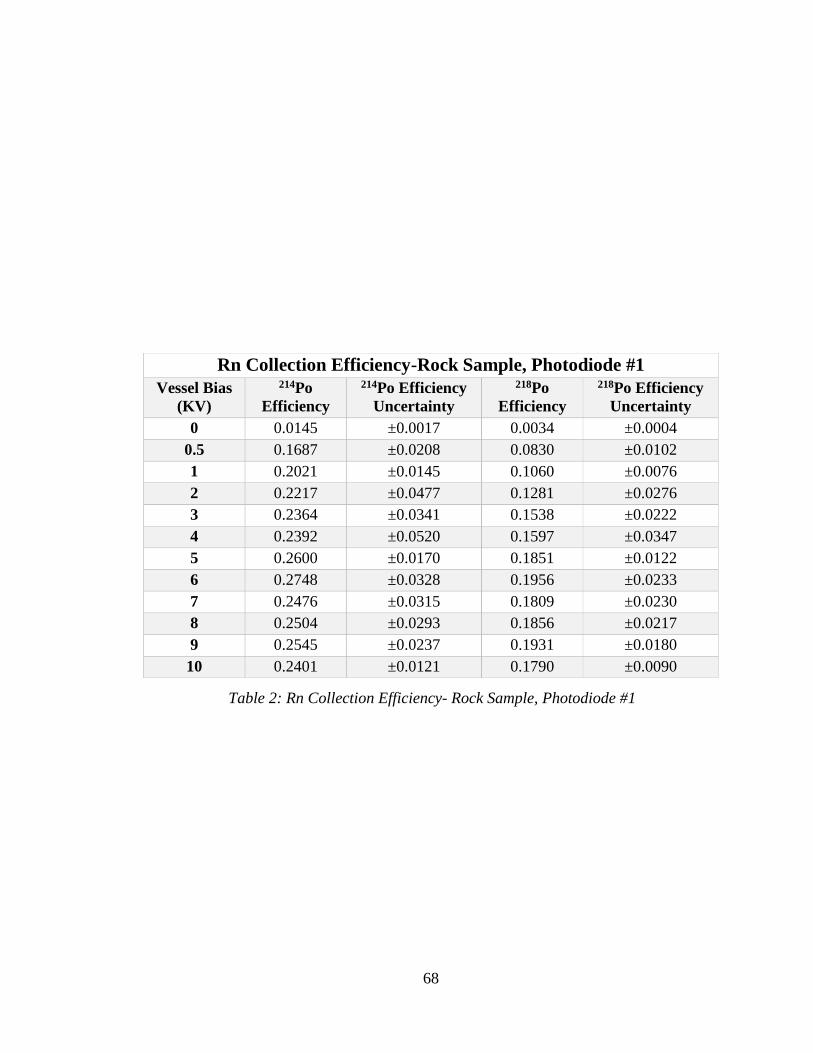
68
Rn Collection Efficiency-Rock Sample, Photodiode #1
Vessel Bias
(KV)
214Po
Efficiency
214Po Efficiency
Uncertainty
218Po
Efficiency
218Po Efficiency
Uncertainty
0 0.0145 ±0.0017 0.0034 ±0.0004
0.5 0.1687 ±0.0208 0.0830 ±0.0102
1 0.2021 ±0.0145 0.1060 ±0.0076
2 0.2217 ±0.0477 0.1281 ±0.0276
3 0.2364 ±0.0341 0.1538 ±0.0222
4 0.2392 ±0.0520 0.1597 ±0.0347
5 0.2600 ±0.0170 0.1851 ±0.0122
6 0.2748 ±0.0328 0.1956 ±0.0233
7 0.2476 ±0.0315 0.1809 ±0.0230
8 0.2504 ±0.0293 0.1856 ±0.0217
9 0.2545 ±0.0237 0.1931 ±0.0180
10 0.2401 ±0.0121 0.1790 ±0.0090
Table 2: Rn Collection Efficiency- Rock Sample, Photodiode #1
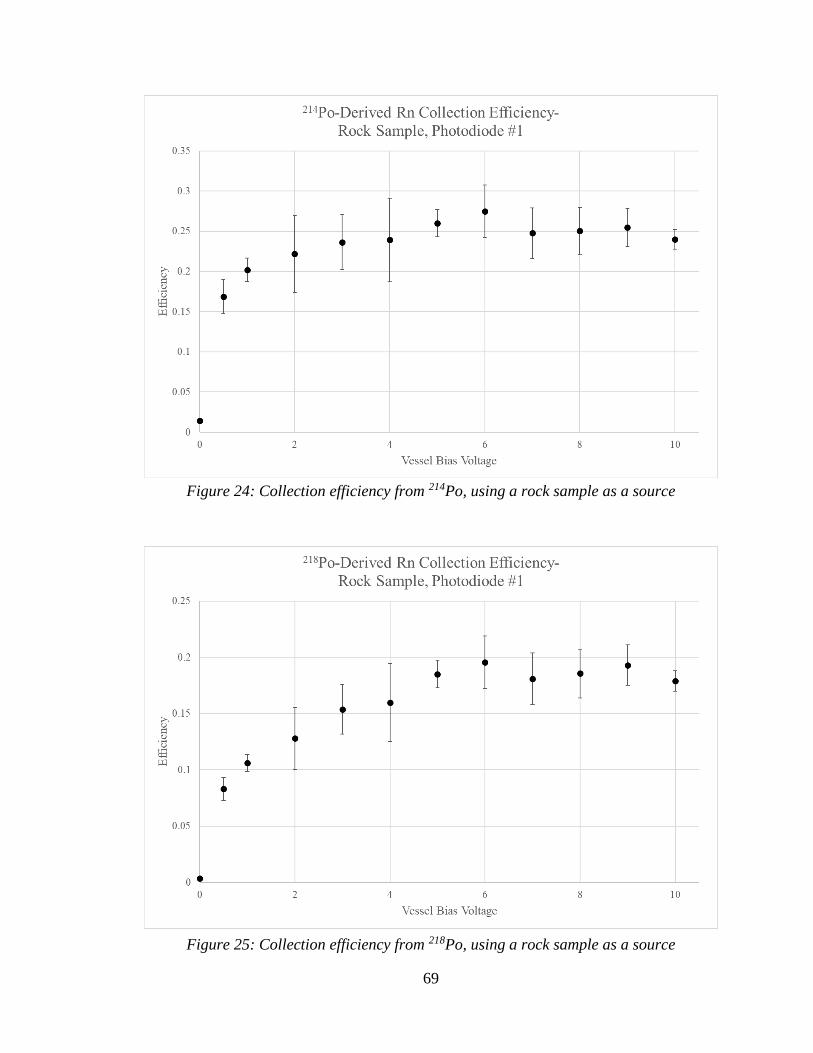
69
Figure 24: Collection efficiency from 214Po, using a rock sample as a source
Figure 25: Collection efficiency from 218Po, using a rock sample as a source
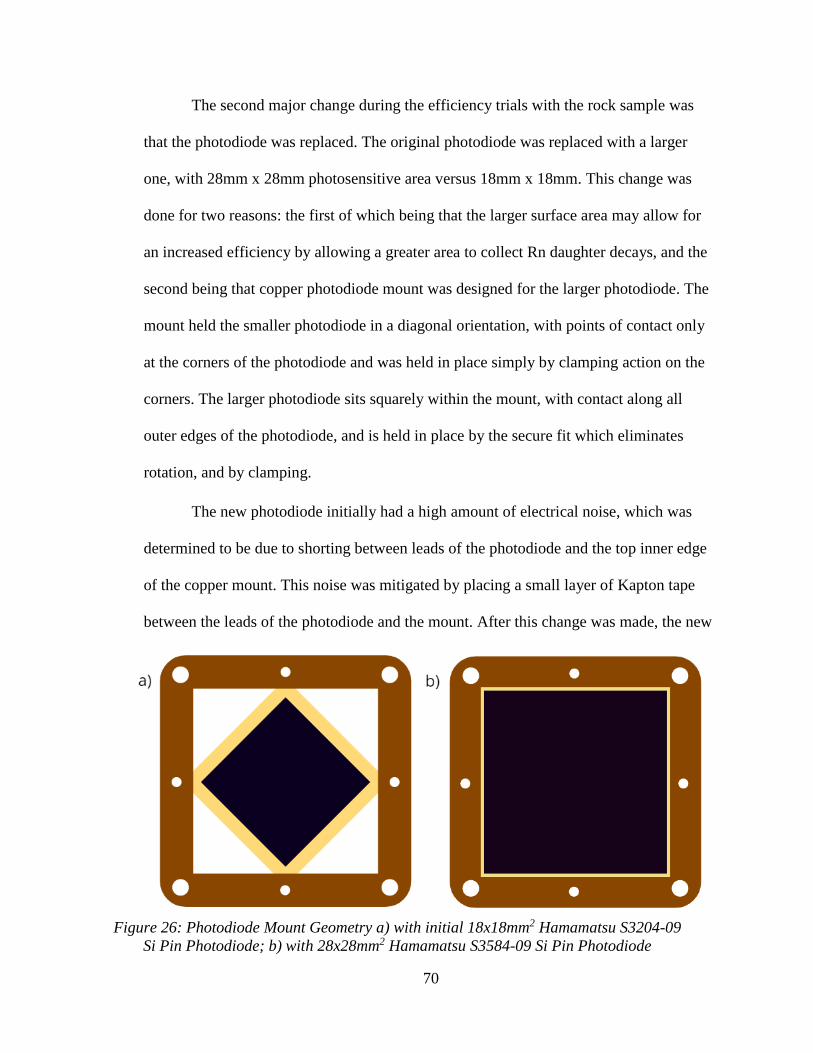
70
The second major change during the efficiency trials with the rock sample was
that the photodiode was replaced. The original photodiode was replaced with a larger
one, with 28mm x 28mm photosensitive area versus 18mm x 18mm. This change was
done for two reasons: the first of which being that the larger surface area may allow for
an increased efficiency by allowing a greater area to collect Rn daughter decays, and the
second being that copper photodiode mount was designed for the larger photodiode. The
mount held the smaller photodiode in a diagonal orientation, with points of contact only
at the corners of the photodiode and was held in place simply by clamping action on the
corners. The larger photodiode sits squarely within the mount, with contact along all
outer edges of the photodiode, and is held in place by the secure fit which eliminates
rotation, and by clamping.
The new photodiode initially had a high amount of electrical noise, which was
determined to be due to shorting between leads of the photodiode and the top inner edge
of the copper mount. This noise was mitigated by placing a small layer of Kapton tape
between the leads of the photodiode and the mount. After this change was made, the new
Figure 26: Photodiode Mount Geometry a) with initial 18x18mm2 Hamamatsu S3204-09
Si Pin Photodiode; b) with 28x28mm2 Hamamatsu S3584-09 Si Pin Photodiode
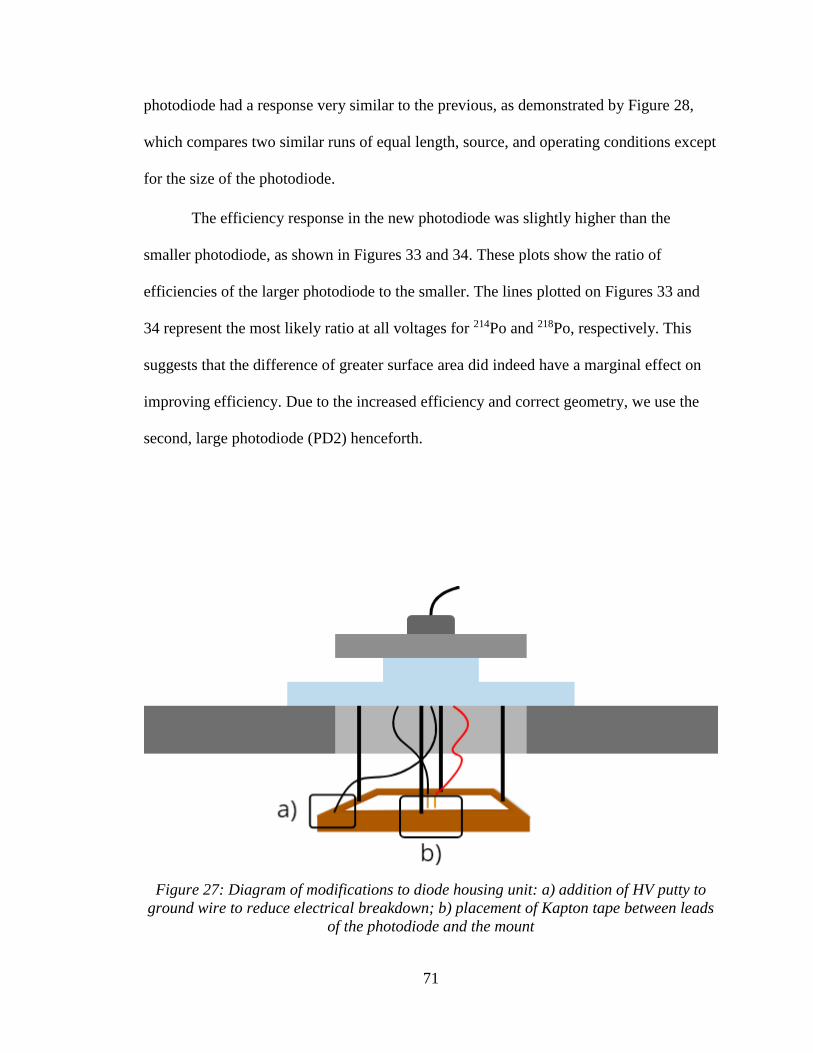
71
photodiode had a response very similar to the previous, as demonstrated by Figure 28,
which compares two similar runs of equal length, source, and operating conditions except
for the size of the photodiode.
The efficiency response in the new photodiode was slightly higher than the
smaller photodiode, as shown in Figures 33 and 34. These plots show the ratio of
efficiencies of the larger photodiode to the smaller. The lines plotted on Figures 33 and
34 represent the most likely ratio at all voltages for 214Po and 218Po, respectively. This
suggests that the difference of greater surface area did indeed have a marginal effect on
improving efficiency. Due to the increased efficiency and correct geometry, we use the
second, large photodiode (PD2) henceforth.
Figure 27: Diagram of modifications to diode housing unit: a) addition of HV putty to
ground wire to reduce electrical breakdown; b) placement of Kapton tape between leads
of the photodiode and the mount
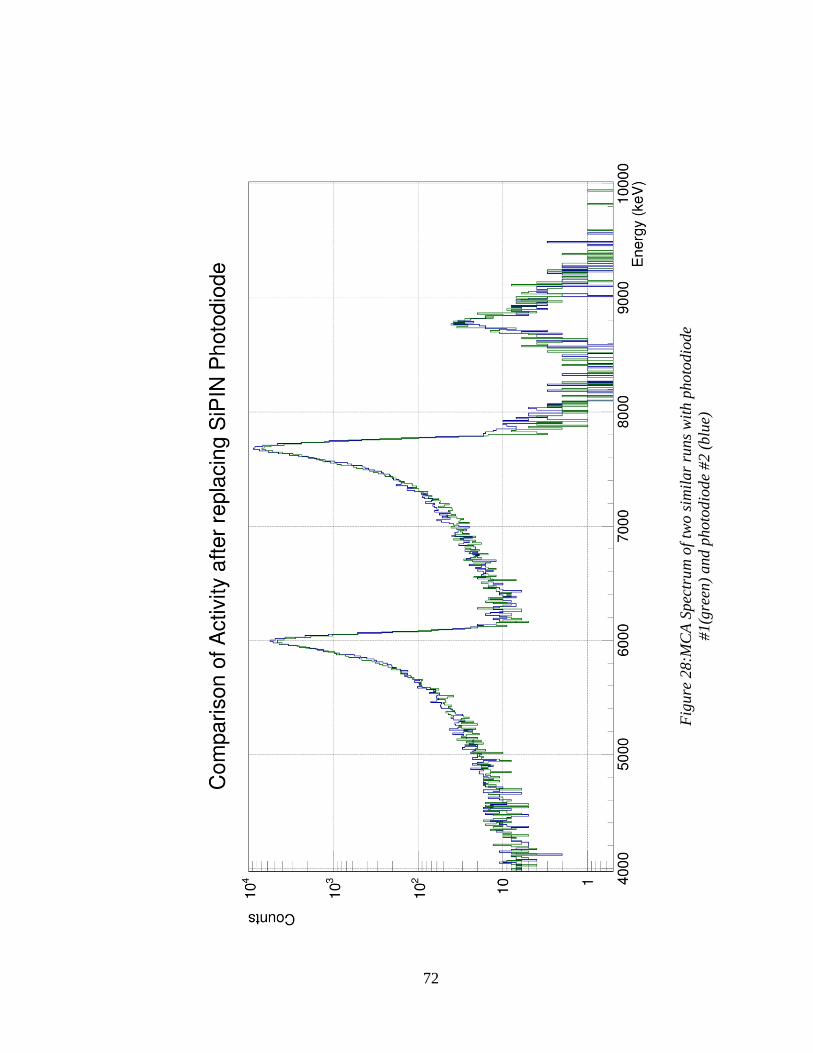
72
Fig
ure
28:M
CA
Spec
tru
m o
f tw
o s
imil
ar
runs
wit
h p
hoto
dio
de
#1(g
reen
) and p
hoto
dio
de
#2 (
blu
e)
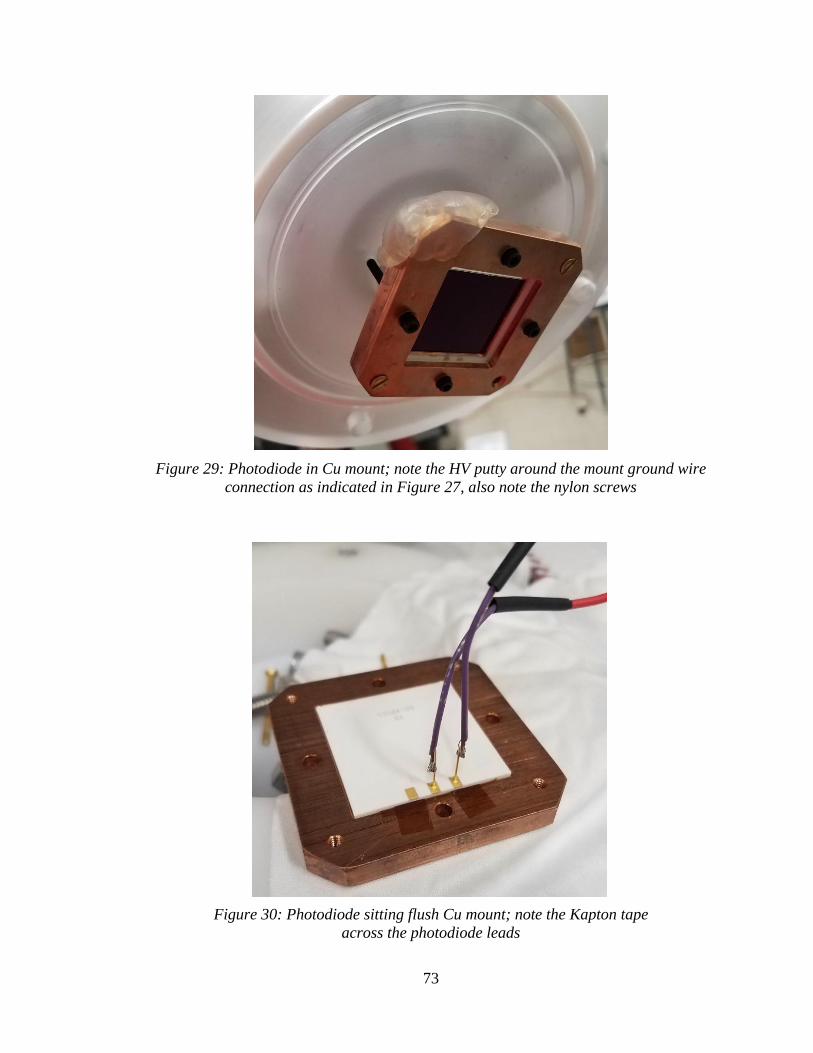
73
Figure 29: Photodiode in Cu mount; note the HV putty around the mount ground wire
connection as indicated in Figure 27, also note the nylon screws
Figure 30: Photodiode sitting flush Cu mount; note the Kapton tape
across the photodiode leads
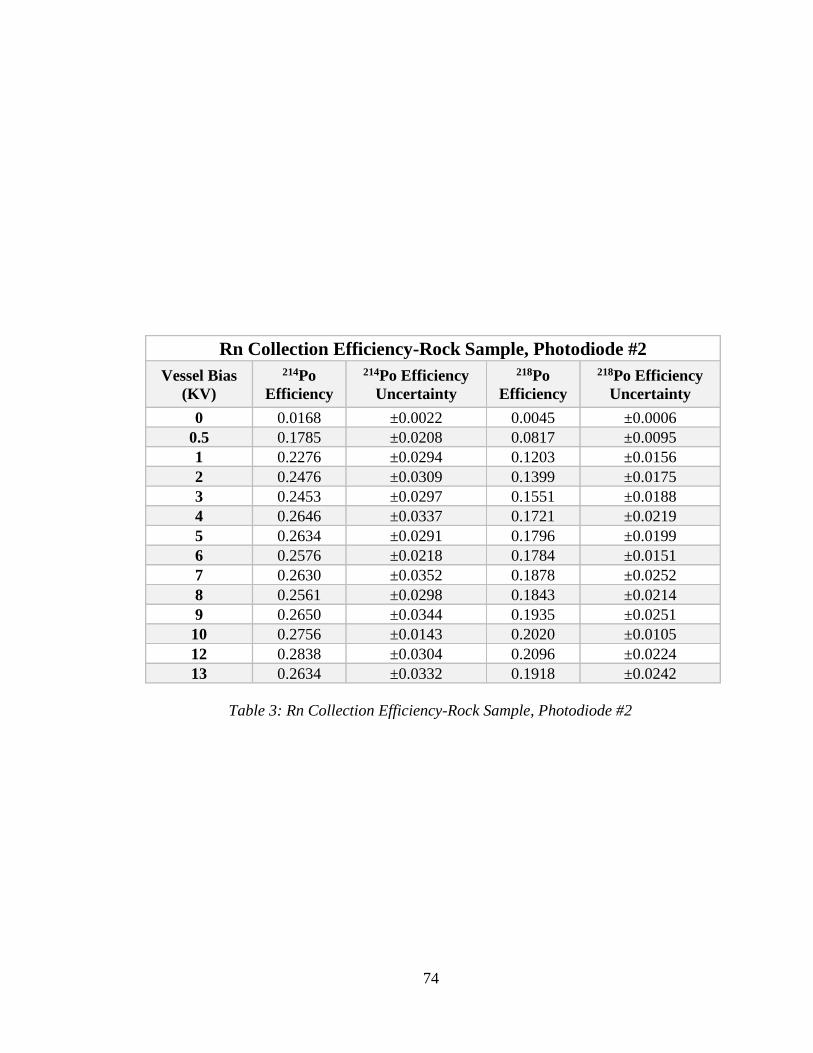
74
Rn Collection Efficiency-Rock Sample, Photodiode #2
Vessel Bias
(KV)
214Po
Efficiency
214Po Efficiency
Uncertainty
218Po
Efficiency
218Po Efficiency
Uncertainty
0 0.0168 ±0.0022 0.0045 ±0.0006
0.5 0.1785 ±0.0208 0.0817 ±0.0095
1 0.2276 ±0.0294 0.1203 ±0.0156
2 0.2476 ±0.0309 0.1399 ±0.0175
3 0.2453 ±0.0297 0.1551 ±0.0188
4 0.2646 ±0.0337 0.1721 ±0.0219
5 0.2634 ±0.0291 0.1796 ±0.0199
6 0.2576 ±0.0218 0.1784 ±0.0151
7 0.2630 ±0.0352 0.1878 ±0.0252
8 0.2561 ±0.0298 0.1843 ±0.0214
9 0.2650 ±0.0344 0.1935 ±0.0251
10 0.2756 ±0.0143 0.2020 ±0.0105
12 0.2838 ±0.0304 0.2096 ±0.0224
13 0.2634 ±0.0332 0.1918 ±0.0242
Table 3: Rn Collection Efficiency-Rock Sample, Photodiode #2
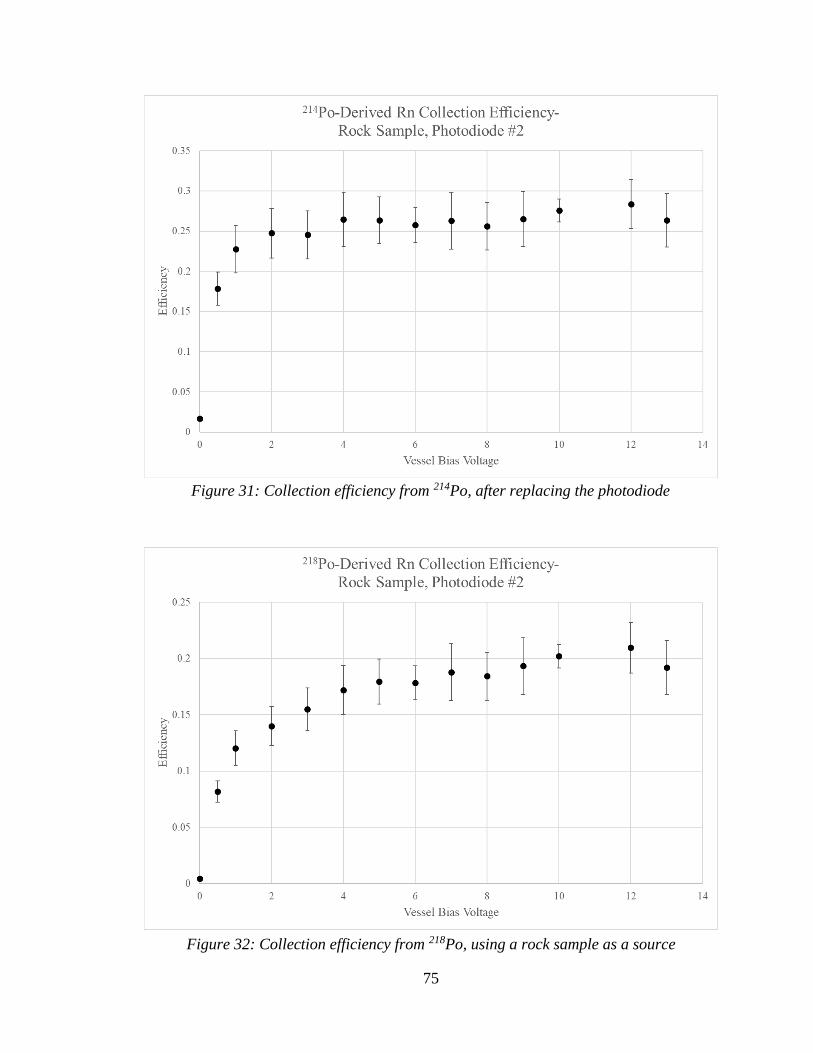
75
Figure 31: Collection efficiency from 214Po, after replacing the photodiode
Figure 32: Collection efficiency from 218Po, using a rock sample as a source
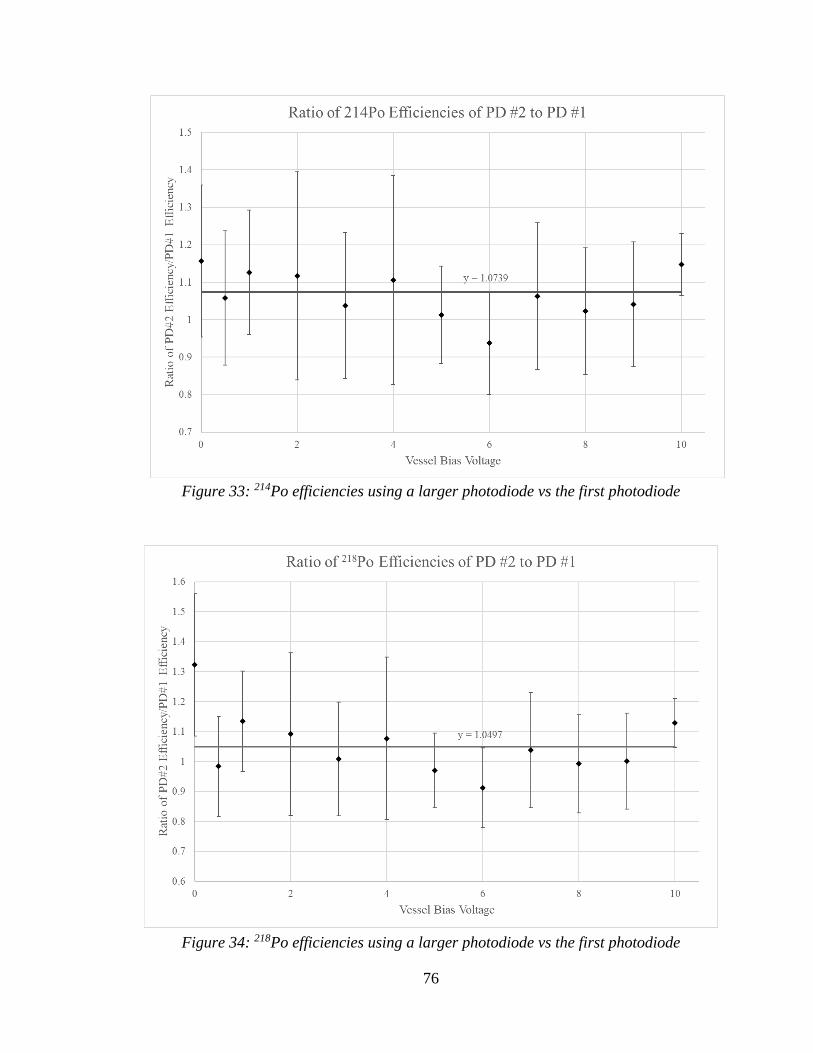
76
Figure 33: 214Po efficiencies using a larger photodiode vs the first photodiode
Figure 34: 218Po efficiencies using a larger photodiode vs the first photodiode
77
Having determined our detector's efficiency, we can convert the average 214Po or
218Po activity of a gas sample into a Rn activity. For example, an observed 214Po activity
of 1 Bq while operating the vessel at 10 kV using PD2 would correspond to a 222Rn
activity of 3.63±0.20 Bq since the efficiency at this voltage is 27.53±1.43%. A more
meaningful quantity for emanation studies is the activity per unit surface area (Bq/m2) or
per volume (Bq/m3). The former is used for determining Rn emanating from solid
objects, whereas the latter is used for measuring Rn concentration in gases.
Whereas gas volume is relatively easy to calculate or measure, surface area is
often not straightforward to calculate for real objects. The macroscopic surface area of
objects in the emanation chamber may be estimated by approximating the object as a
combination of standard geometric shapes such as spheres, cylinders, and cuboids.
Alternatively, the macroscopic surface area of an object may be more precisely
determined by creating a detailed model of the object in some computer-aided design
software that has a function for numerical surface area calculation, such as AutoCAD
[52]. As mentioned in Chapter 3, the microscopic surface area, considering small ridges,
pits, and other imperfections, is much larger but may be mitigated by surface finishing
techniques such as electropolishing.
For the MJD Rn Detector itself, the vessel activity per unit surface area is the
measured activity of either 214Po or 218Po divided by the respective efficiency, ε, and
divided by the interior surface area, 1.766 m2. Similarly, the volumetric activity rate is the
measured activity divided by ε and the internal volume of the system, approximately
0.191 m3 for the vessel alone or 0.195 m3 with the RAD7, emanation chamber, and
tubing included.
78
It is important to note that inferring the 222Rn activity from the 214Po or 218Po
activity in this manner assumes radioactive equilibrium between Rn and its daughters.
While this is true even over time scales on the order of a few half-lives of the daughter, it
will not be true for shorter time scales.
On a related note, an accurate measurement of the emanation of a particular
sample must be taken after the entire system has been closed for enough time for 222Rn to
build-up within the sample gas such the radioactive equilibrium approximation is valid.
Given the 3.8-day half-life of 222Rn, this build-up time corresponds to roughly 3 half-
lives or 11.5 days. After 3 half-lives the 222Rn activity is greater than 87.5%, depending
on the initial gas Rn activity, of the activity of its precursor, 226Ra.
79
6 Intrinsic Background Characterization
6.1 Motivation for Detector Background Characterization
With the relation between efficiency and vessel bias voltage known, it is then
possible to measure the Rn activity of an arbitrary gas. However, in order to correctly
infer the amount of radon emanating from a particular sample, it is necessary to fully
characterize the intrinsic radon background of the vessel and all other components that
come in contact with the gas. In a similar fashion to the very same motivation of this
project, the need for a low-background radon detector is directly tied to the sensitivity of
measurements. A Rn background with a low intrinsic Rn emanation rate from all interior
surfaces coupled with a low initial Rn activity in the system will be capable of measuring
much lower activities in samples of interest. Meanwhile, a detector system with a high
initial Rn activity, or high Rn emanation from detector subsystem components, will not
be sensitive to samples of low activity.
6.2 First Vessel Background Estimate
The first background run we made was done during room air efficiency
measurements, just before installing the rock sample. We expected the background
activity of the vessel would be less than the activity of room air. Based on this, we
expected that the measured activity in a sealed vessel would decay from some initial
value, close to the activity of room air, to some final value, approaching the steady-state
activity of the vessel itself. The run was performed by completely sealing the vessel filled
with room air and operating for 332.8 hours at a vessel bias of 5KV. The detector thus
80
had a 222Rn collection efficiency of 20.012±1.421% using 214Po activity and
11.929±0.862% using 218Po activity.
In the steady state, the amount of radon that decays in the vessel would be equal to
the amount emanated by the vessel’s inner surface. The activity in the vessel will
eventually reach a steady state after multiple half-lives of 222Rn, when it comes into
radioactive equilibrium with 226Ra. 226Ra is very long lived, and thus will have an activity
that is functionally constant over the time scale of our runs. Once sealed, radon from the
room air will decay away while the vessel walls will generate new radon, eventually
reaching some constant activity. We would then expect an expression for net Rn activity
as a function of time to be of the following form:
( )226
1/2( ) 1 ,t t Ra
air BG RaA t A e A e t t − −= + − (29)
where Aair and ABG are the activities of room air and the vessel Rn background,
respectfully, and λ is the decay constant for 222Rn, with a half-life of 3.8235 days. Figure
35 shows the measured 214Po activity as a function of time, with a fit to Equation 29. The
activity starts at some large initial value of 1648±41 counts per hour or 457.8±11.3 mBq
and falls to 41.11±3.38 mBq after 3.62 half-lives. Assuming the background emanation
rate is constant, and using λ=ln2/3.8235 days, we can use the fit on Figure 35 to infer a
background 222Rn rate, adjusted to efficiency, of approximately 8.55±1.09 mBq/m2.
This measurement of the background demonstrates the agreement between the
measured activity and that predicted by radioactive decay over a reasonably long time
period. However, this method has a high level of uncertainty due to the fit being sensitive
to assumptions of the initial air activity, background activity, and decay constant. Taking
this measurement over a longer time period, perhaps 10 half-lives in total, may yield a

81
better estimate of the background activity by minimizing the difference between the
inferred background and the likely actual background. Yet, obtaining an accurate value of
the background activity using this measurement may take a prohibitively long time.
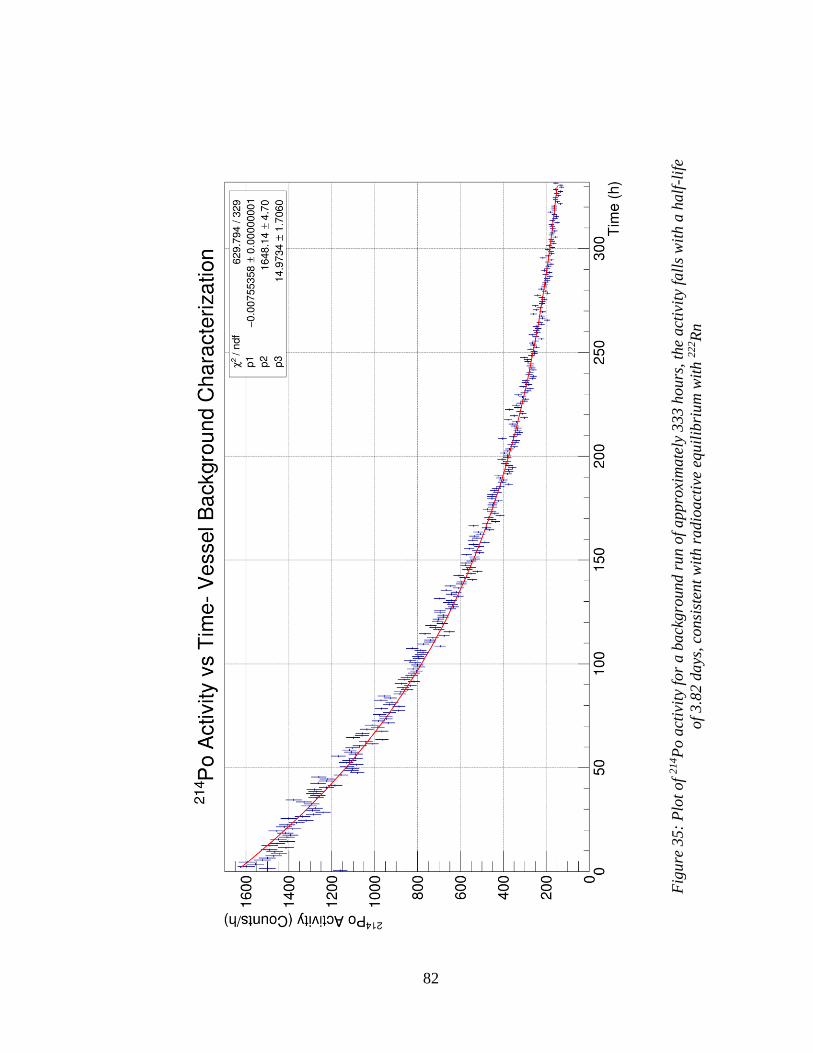
82
Fig
ure
35:
Plo
t o
f 2
14P
o a
ctiv
ity
for
a b
ack
gro
und
run o
f appro
xim
ate
ly 3
33 h
ours
, th
e act
ivit
y fa
lls
wit
h a
half
-lif
e
of
3.8
2 d
ays
, co
nsi
sten
t w
ith r
adio
act
ive
equil
ibri
um
wit
h 2
22R
n
83
6.3 Improved Background Measurement- Nitrogen Gas Flush
To better estimate the intrinsic background of the vessel, it would be more
expedient to start from a much lower initial Rn activity. In fact, the fastest possible
measurement of the background would be to start from an initial activity that is very
close to the background. In practice, since the background is not known a priori, it would
be better to start from as low of an initial Rn activity as possible and build-up to the
background level. Additionally, building up to the background level helps to ensure that
the measured activity can be more fully attributed to the background, and not to
remaining radon from room air or some other source.
In order to achieve this low background by evacuating the detector system of
existing radon, we sought to purge air from the system with a clean, dry gas with low
intrinsic radon content. Boil-off liquid nitrogen (LN) gas was chosen due to its intrinsic
purity, ease of employment, and demonstrated success in past studies [27, 53, 55]. The
boiling point of LN is 77.355 K, higher only than hydrogen, helium, and neon [54]. This
means that most gas contaminants, including water (boiling point 373.15 K) and radon
(boiling point 211.45 K), will remain in the solid or liquid phase at the boiling point of
LN. One experiment found that the radon concentration in boil-off LN was roughly 0.5
mBq/m3, though additional reduction in concentration was achieved by passing the boil-
off gas through charcoal filters [53]. The low boiling point of LN makes it very easy to
use as a boil-off source since it boils at room temperature and can be controlled by
submerging a variable-power heating source in the LN. Additionally, LN is relatively
ubiquitous and economical, with use in research and development in many fields of
physics, chemistry, and biology as well as several commercial uses. For these reasons,
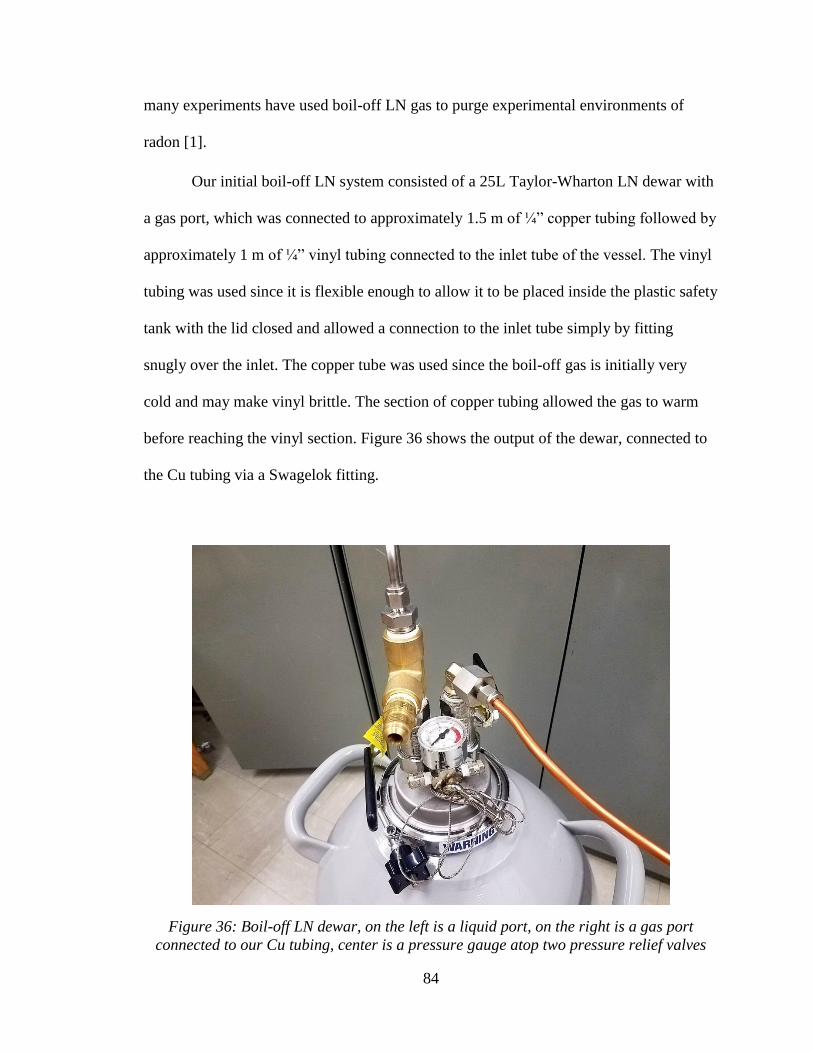
84
many experiments have used boil-off LN gas to purge experimental environments of
radon [1].
Our initial boil-off LN system consisted of a 25L Taylor-Wharton LN dewar with
a gas port, which was connected to approximately 1.5 m of ¼” copper tubing followed by
approximately 1 m of ¼” vinyl tubing connected to the inlet tube of the vessel. The vinyl
tubing was used since it is flexible enough to allow it to be placed inside the plastic safety
tank with the lid closed and allowed a connection to the inlet tube simply by fitting
snugly over the inlet. The copper tube was used since the boil-off gas is initially very
cold and may make vinyl brittle. The section of copper tubing allowed the gas to warm
before reaching the vinyl section. Figure 36 shows the output of the dewar, connected to
the Cu tubing via a Swagelok fitting.
Figure 36: Boil-off LN dewar, on the left is a liquid port, on the right is a gas port
connected to our Cu tubing, center is a pressure gauge atop two pressure relief valves
85
The LN boiling was not supported by an external heat source in this configuration,
and gas flow of boil-off nitrogen gas was achieved by allowing pressure to build-up in
the closed dewar, and then opening the gas port valve to allow gas to flow into the vessel.
The pressure in the dewar was limited to approximately 10 psi via a safety relief valve.
Once pressure built up to the maximum value, the gas port was opened, and boil-off gas
flowed until the pressure in the dewar reached atmospheric pressure. Since the rate of
flow in this configuration depends on the pressure difference between the dewar and the
detector vessel, the rate of flow gradually decreases from a maximum value at 10 psi to
nearly nothing when the dewar is at the same pressure as the vessel. Figures 37 and 38
shows the activities of 214Po and 218Po, respectively, as a function of time during the first
run of boil-off LN purging. Further, Figure 39 shows the qualitative utility of the MCA
scatterplot of counts versus time versus energy. In Figure 39 we observe that the
frequency of 214Po and 218Po counts decreases with time while the frequency of 212Po
appears to be more constant. As mentioned earlier, this type of plot is also very helpful in
identifying periods of high electrical noise, which can be observed as a dense line of
counts at low- to mid-range energies in a particular time bin.
We can see that the activities of these two isotopes begin to decrease sharply at
approximately one hour, when boil-off LN gas began to flow. The activity of 214Po drops
by a factor of ~28 while 218Po drops by a factor of ~33 in the span of 4 hours. At the end
of the run, the vessel had a 214Po-derived 222Rn activity, again adjusted for efficiency, of
7.99±2.18 mBq/m2 and a 218Po-derived activity of 7.01±2.37 mBq/m2, both taken over
the last hour of the run. It is imperative to note that the efficiencies measured in Chapter 6
were performed using air dehumidified to approximately 1-2% relative humidity at the
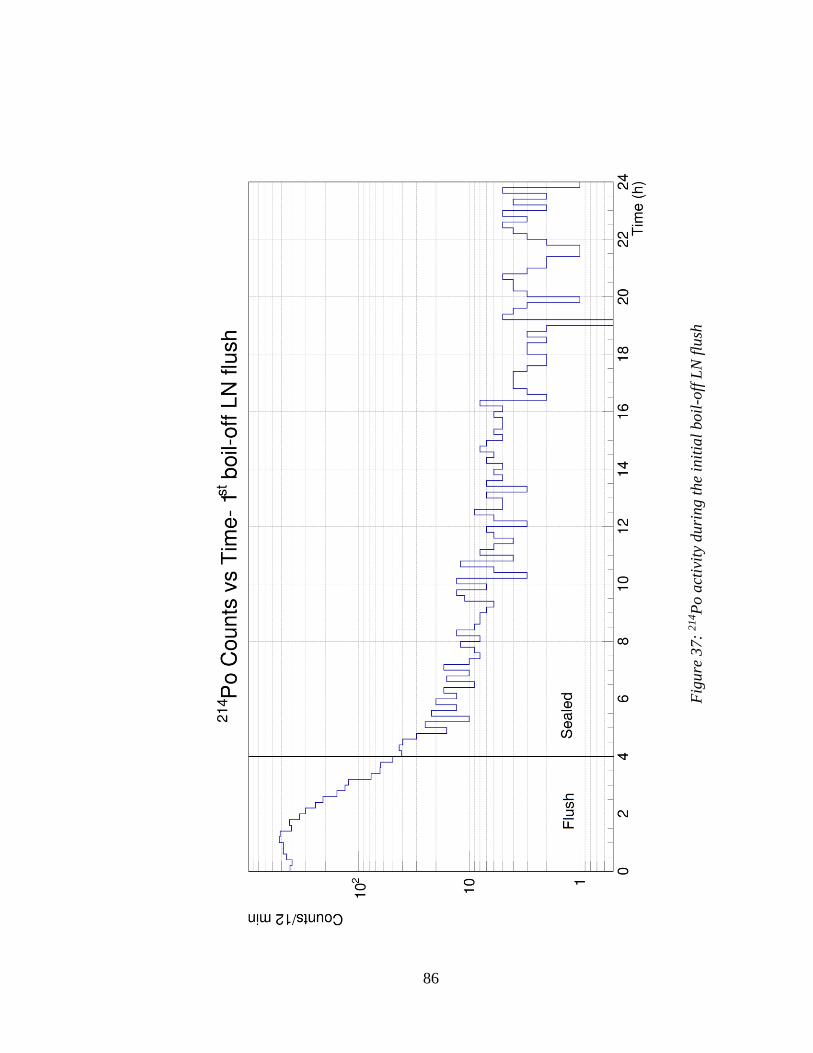
86
Fig
ure
37:
21
4P
o a
ctiv
ity
duri
ng t
he
init
ial
boil
-off
LN
flu
sh
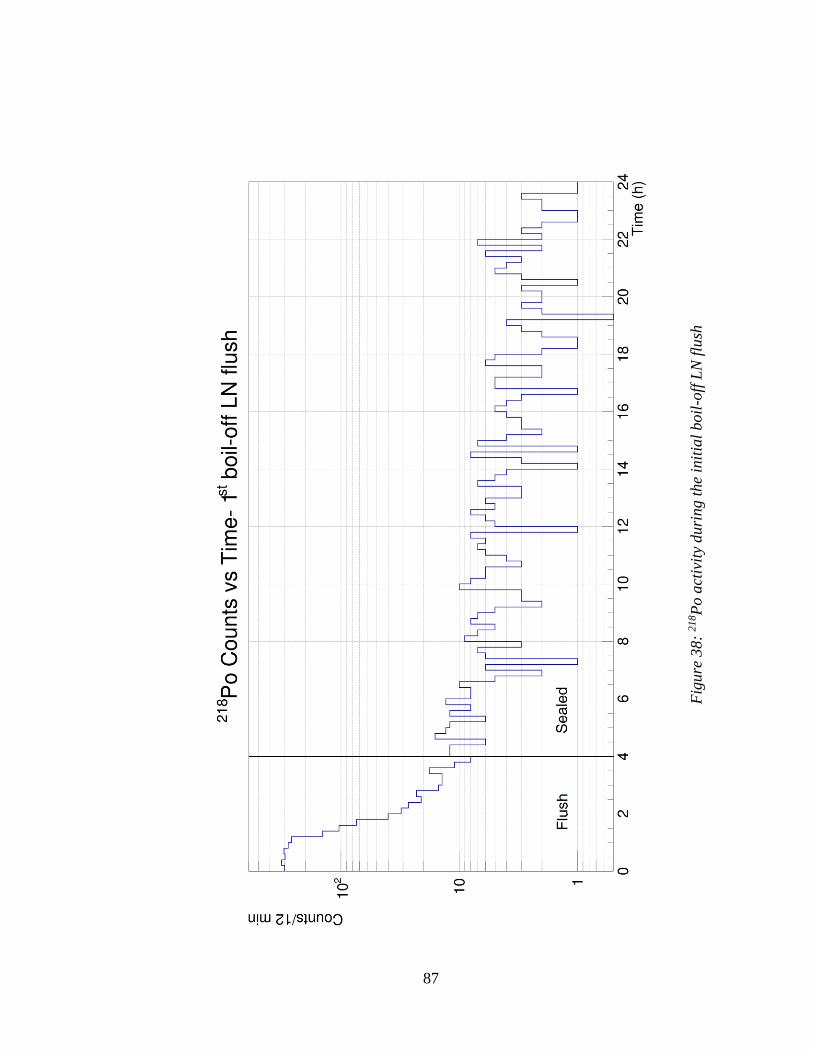
87
Fig
ure
38:
21
8P
o a
ctiv
ity
duri
ng t
he
init
ial
boil
-off
LN
flu
sh
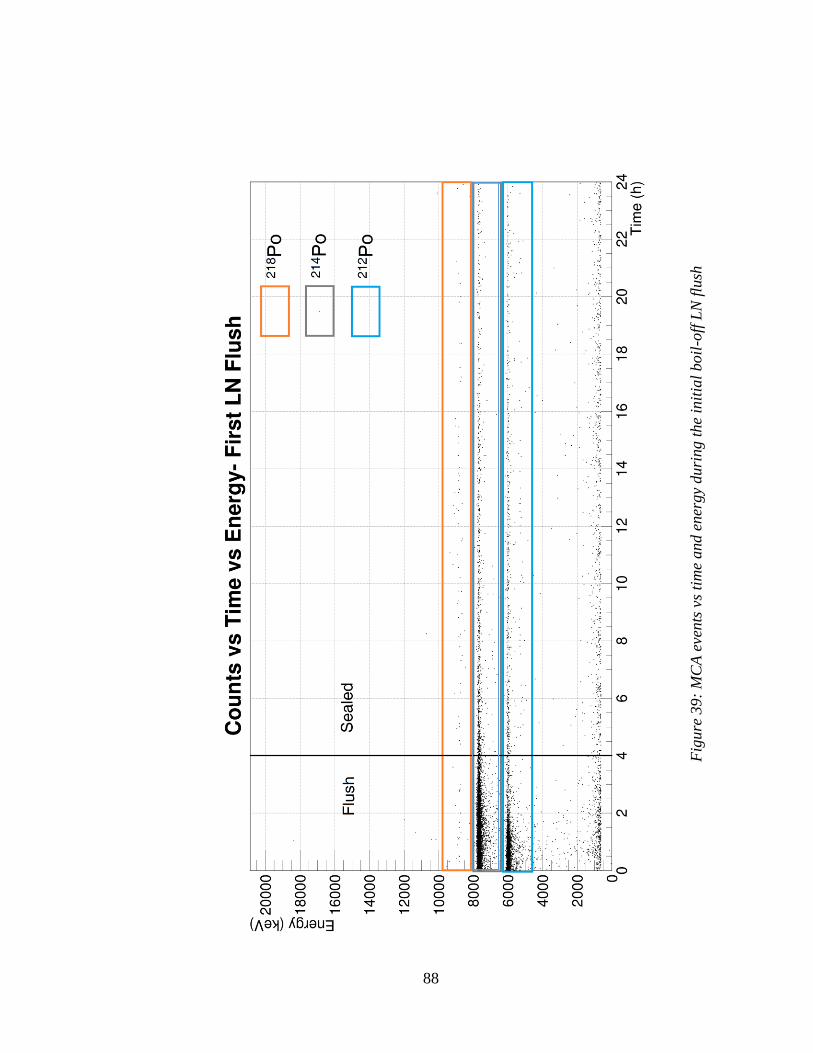
88
Fig
ure
39
: M
CA
eve
nts
vs
tim
e and e
ner
gy
duri
ng
the
init
ial
boil
-off
LN
flu
sh
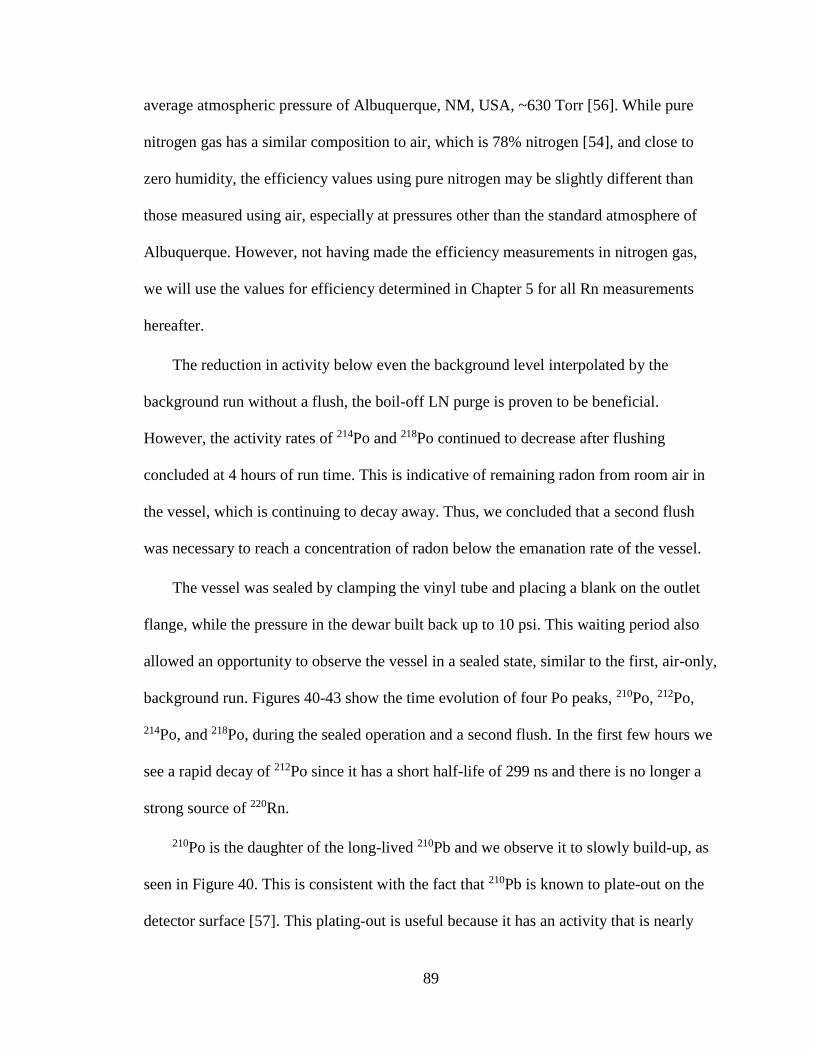
89
average atmospheric pressure of Albuquerque, NM, USA, ~630 Torr [56]. While pure
nitrogen gas has a similar composition to air, which is 78% nitrogen [54], and close to
zero humidity, the efficiency values using pure nitrogen may be slightly different than
those measured using air, especially at pressures other than the standard atmosphere of
Albuquerque. However, not having made the efficiency measurements in nitrogen gas,
we will use the values for efficiency determined in Chapter 5 for all Rn measurements
hereafter.
The reduction in activity below even the background level interpolated by the
background run without a flush, the boil-off LN purge is proven to be beneficial.
However, the activity rates of 214Po and 218Po continued to decrease after flushing
concluded at 4 hours of run time. This is indicative of remaining radon from room air in
the vessel, which is continuing to decay away. Thus, we concluded that a second flush
was necessary to reach a concentration of radon below the emanation rate of the vessel.
The vessel was sealed by clamping the vinyl tube and placing a blank on the outlet
flange, while the pressure in the dewar built back up to 10 psi. This waiting period also
allowed an opportunity to observe the vessel in a sealed state, similar to the first, air-only,
background run. Figures 40-43 show the time evolution of four Po peaks, 210Po, 212Po,
214Po, and 218Po, during the sealed operation and a second flush. In the first few hours we
see a rapid decay of 212Po since it has a short half-life of 299 ns and there is no longer a
strong source of 220Rn.
210Po is the daughter of the long-lived 210Pb and we observe it to slowly build-up, as
seen in Figure 40. This is consistent with the fact that 210Pb is known to plate-out on the
detector surface [57]. This plating-out is useful because it has an activity that is nearly
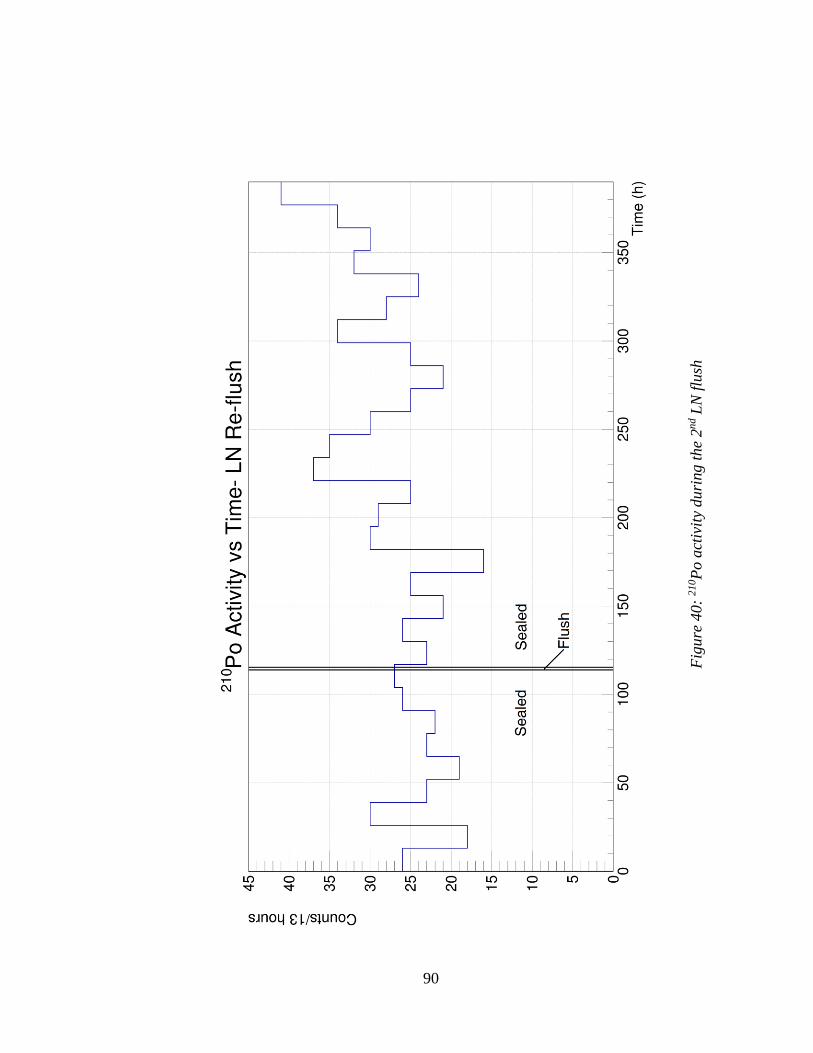
90
Fig
ure
40:
21
0P
o a
ctiv
ity
duri
ng t
he
2n
d L
N f
lush
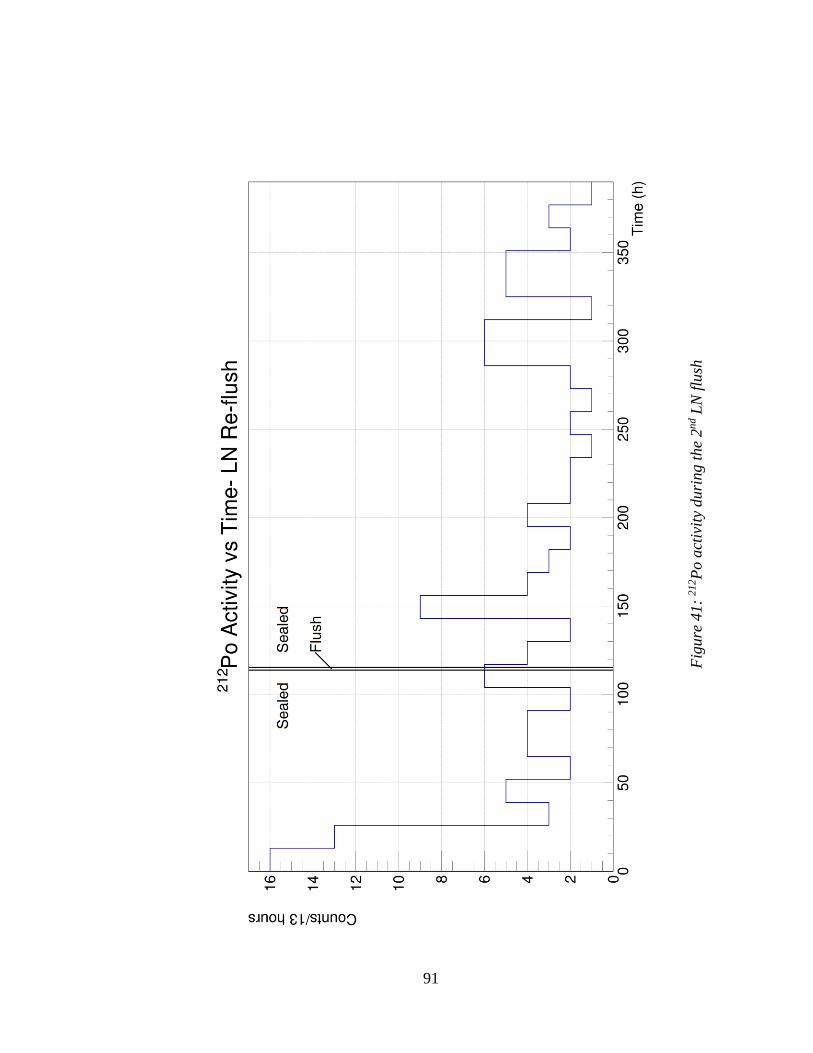
91
Fig
ure
41:
21
2P
o a
ctiv
ity
duri
ng t
he
2n
d L
N f
lush
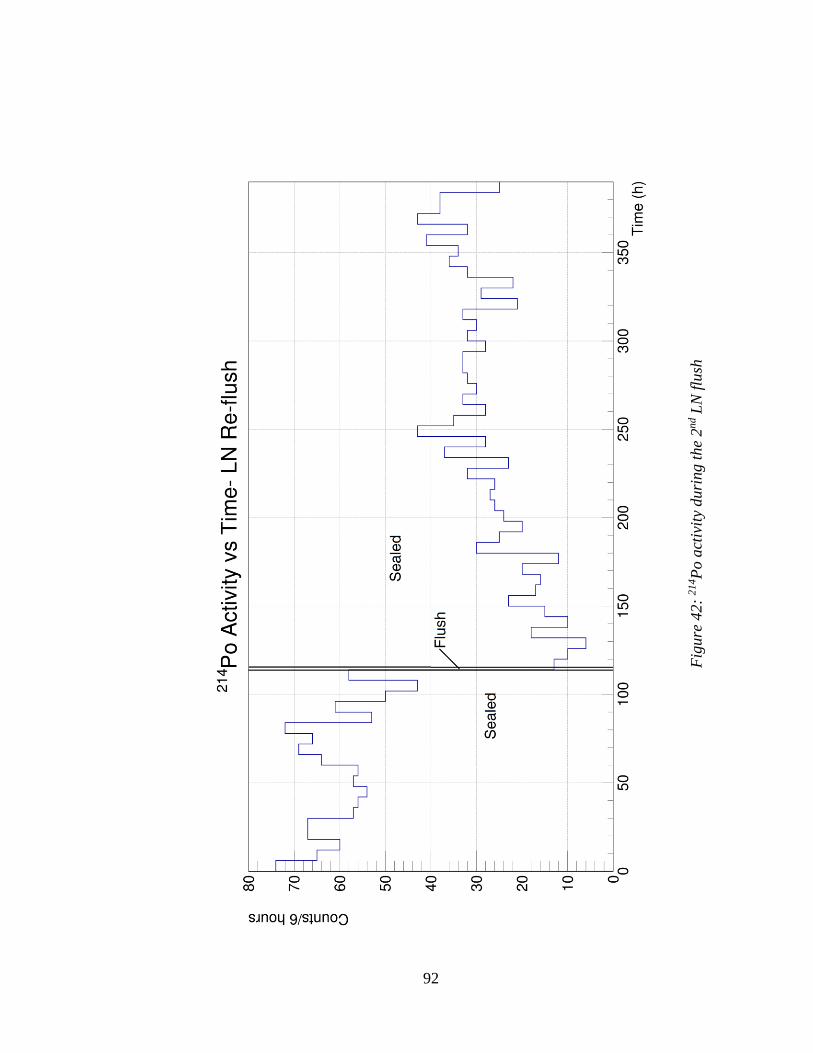
92
Fig
ure
42:
21
4P
o a
ctiv
ity
duri
ng t
he
2n
d L
N f
lush
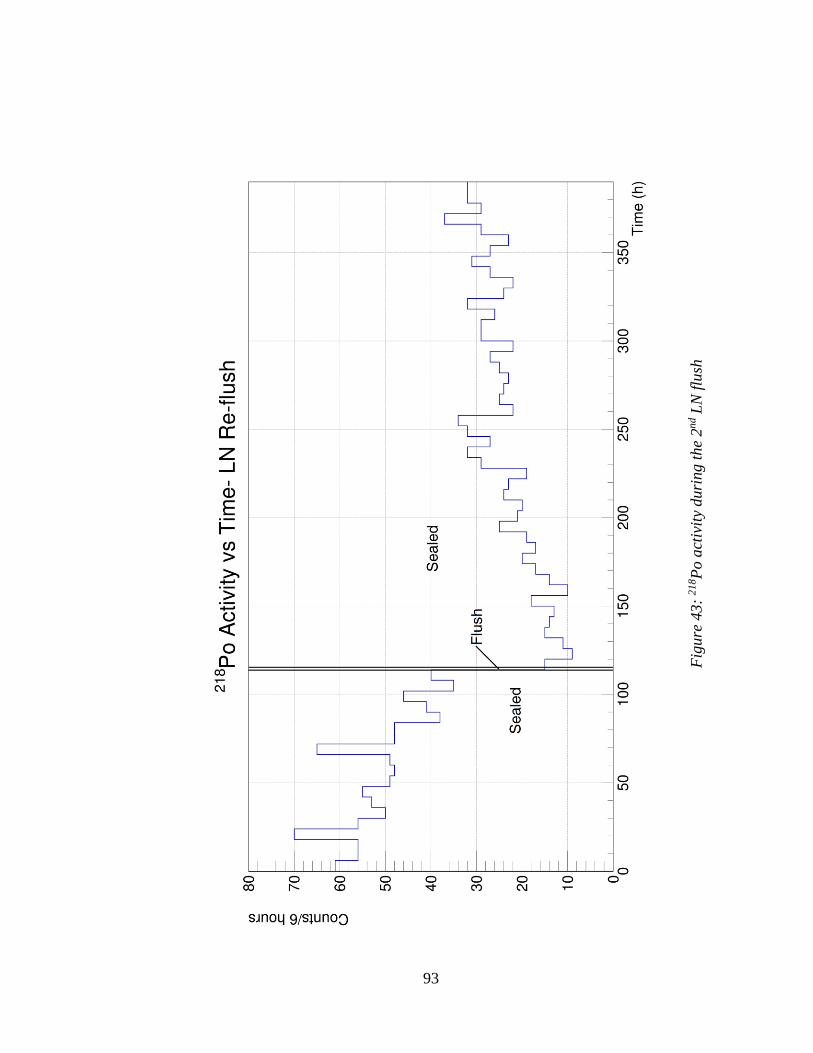
93
Fig
ure
43:
21
8P
o a
ctiv
ity
duri
ng t
he
2n
d L
N f
lush
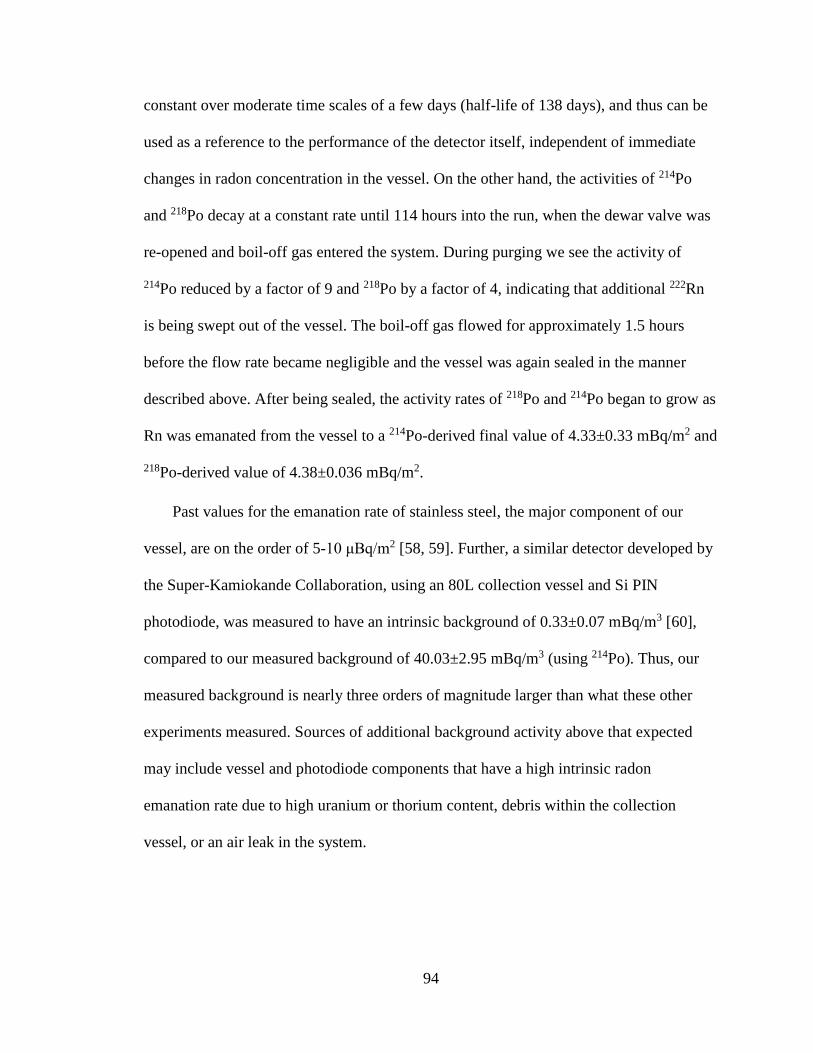
94
constant over moderate time scales of a few days (half-life of 138 days), and thus can be
used as a reference to the performance of the detector itself, independent of immediate
changes in radon concentration in the vessel. On the other hand, the activities of 214Po
and 218Po decay at a constant rate until 114 hours into the run, when the dewar valve was
re-opened and boil-off gas entered the system. During purging we see the activity of
214Po reduced by a factor of 9 and 218Po by a factor of 4, indicating that additional 222Rn
is being swept out of the vessel. The boil-off gas flowed for approximately 1.5 hours
before the flow rate became negligible and the vessel was again sealed in the manner
described above. After being sealed, the activity rates of 218Po and 214Po began to grow as
Rn was emanated from the vessel to a 214Po-derived final value of 4.33±0.33 mBq/m2 and
218Po-derived value of 4.38±0.036 mBq/m2.
Past values for the emanation rate of stainless steel, the major component of our
vessel, are on the order of 5-10 μBq/m2 [58, 59]. Further, a similar detector developed by
the Super-Kamiokande Collaboration, using an 80L collection vessel and Si PIN
photodiode, was measured to have an intrinsic background of 0.33±0.07 mBq/m3 [60],
compared to our measured background of 40.03±2.95 mBq/m3 (using 214Po). Thus, our
measured background is nearly three orders of magnitude larger than what these other
experiments measured. Sources of additional background activity above that expected
may include vessel and photodiode components that have a high intrinsic radon
emanation rate due to high uranium or thorium content, debris within the collection
vessel, or an air leak in the system.
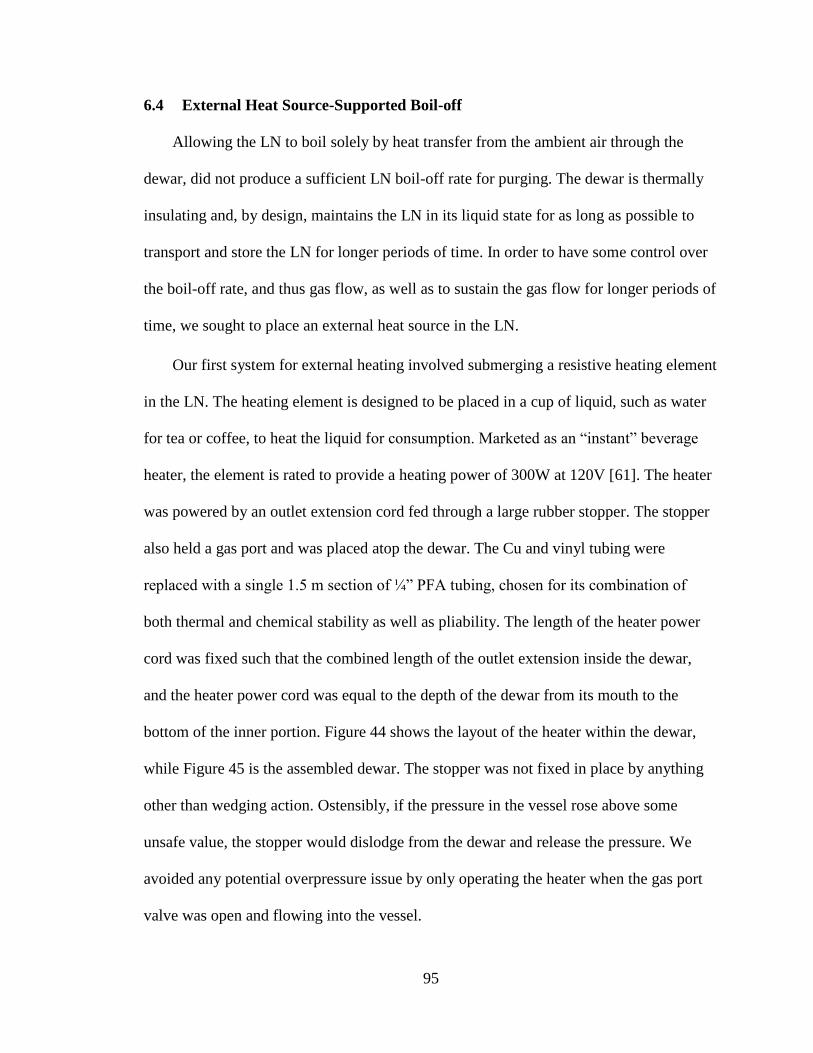
95
6.4 External Heat Source-Supported Boil-off
Allowing the LN to boil solely by heat transfer from the ambient air through the
dewar, did not produce a sufficient LN boil-off rate for purging. The dewar is thermally
insulating and, by design, maintains the LN in its liquid state for as long as possible to
transport and store the LN for longer periods of time. In order to have some control over
the boil-off rate, and thus gas flow, as well as to sustain the gas flow for longer periods of
time, we sought to place an external heat source in the LN.
Our first system for external heating involved submerging a resistive heating element
in the LN. The heating element is designed to be placed in a cup of liquid, such as water
for tea or coffee, to heat the liquid for consumption. Marketed as an “instant” beverage
heater, the element is rated to provide a heating power of 300W at 120V [61]. The heater
was powered by an outlet extension cord fed through a large rubber stopper. The stopper
also held a gas port and was placed atop the dewar. The Cu and vinyl tubing were
replaced with a single 1.5 m section of ¼” PFA tubing, chosen for its combination of
both thermal and chemical stability as well as pliability. The length of the heater power
cord was fixed such that the combined length of the outlet extension inside the dewar,
and the heater power cord was equal to the depth of the dewar from its mouth to the
bottom of the inner portion. Figure 44 shows the layout of the heater within the dewar,
while Figure 45 is the assembled dewar. The stopper was not fixed in place by anything
other than wedging action. Ostensibly, if the pressure in the vessel rose above some
unsafe value, the stopper would dislodge from the dewar and release the pressure. We
avoided any potential overpressure issue by only operating the heater when the gas port
valve was open and flowing into the vessel.
96
Figure 44: Beverage heater for LN boiling. Note tape around heater base. Length from
the bottom of the stopper to the end of the heater is 56 cm.
Figure 45: Stopper placed on LN dewar and connected to PFA tubing
97
In order to control the power delivered by the heater, we used a Variac variable
transformer to control the voltage. Since the heater works by resistive heat dissipation,
the heating power scales quadratically with voltage for a given resistance of the heater.
The actual power output, however, was not known. The manufacturer specified value of
300W was given for a voltage of 120V, likely at or near room temperature. The
resistance of the metal in the heater has a temperature dependence and may vary in time
as the metal heats by the power delivered and cools from the cryogenic nature of LN.
The result of an LN flush with this configuration of external heater was an order of
magnitude more effective than a single flush in the previous configuration using ambient
heating only. The higher boil rate due to the power dissipated by the immersion heater
leads to a greater volume of boil-off gas produced per unit time. Further, the additional
quantity of gas results in a sustained pressure sufficient for purging over a longer period,
limited only by the quantity of LN.
Figures 46 and 47 demonstrate the effectiveness of this flush. As with the
previous runs, the vessel was left sealed for a period to determine a baseline for the initial
Rn activity before the flush. 37.7 hours into the run the heater was emplaced and
activated. Both figures show that the activity promptly began to fall and continued to
decrease for approximately 18 hours. Again using 214Po counts and efficiency, the
calculated Rn concentration fell from 787±42 mBq, equivalent to 446±26 mBq/m2,
during the first 12 hours to 2.18±0.44 mBq, or 1.24±0.25 mBq/m2, during the final 12
hours.
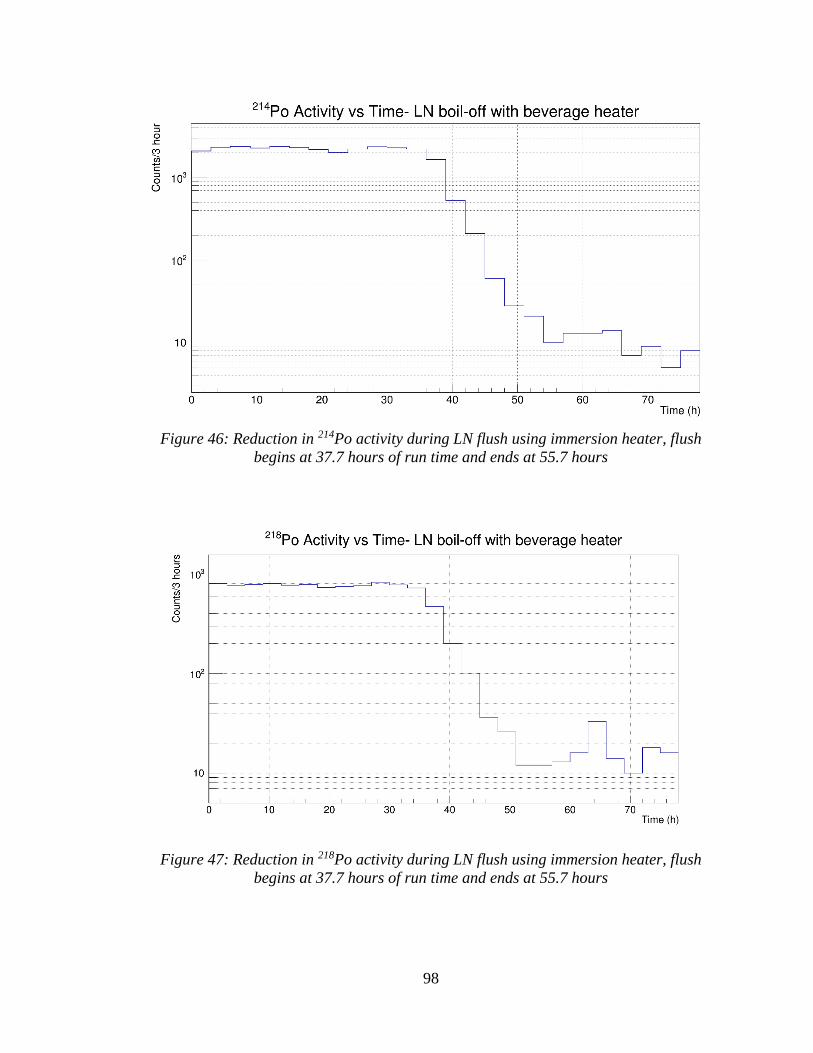
98
Figure 46: Reduction in 214Po activity during LN flush using immersion heater, flush
begins at 37.7 hours of run time and ends at 55.7 hours
Figure 47: Reduction in 218Po activity during LN flush using immersion heater, flush
begins at 37.7 hours of run time and ends at 55.7 hours
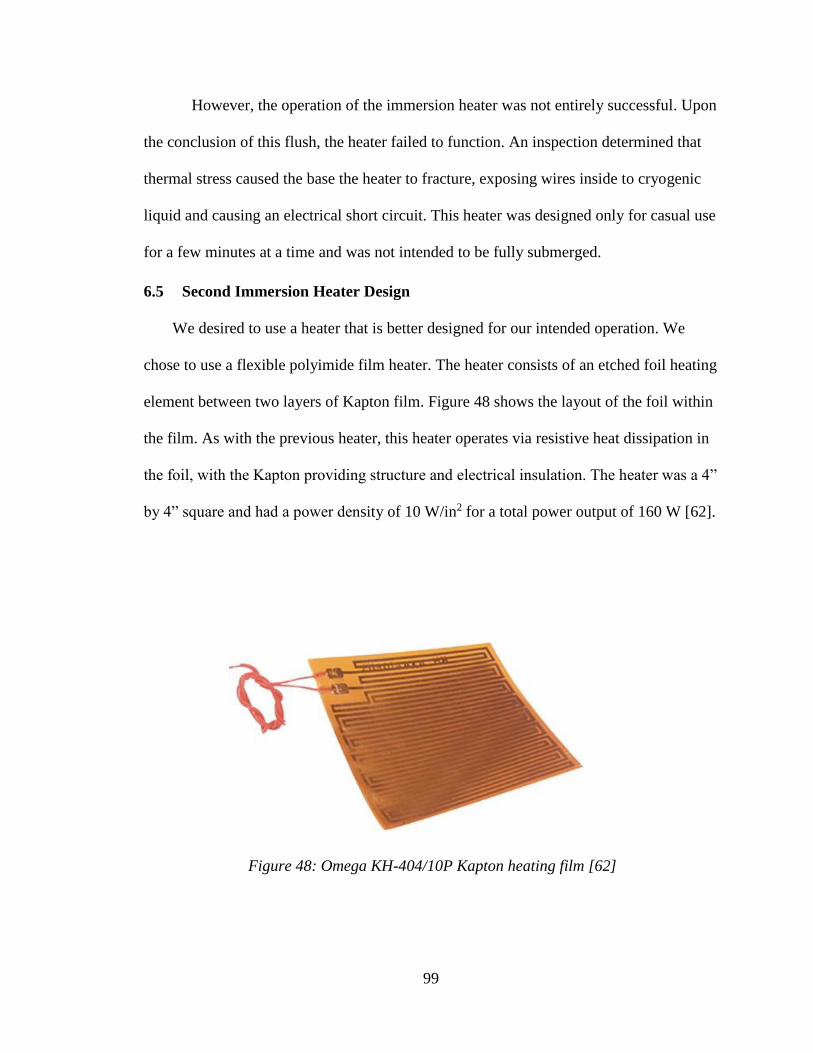
99
However, the operation of the immersion heater was not entirely successful. Upon
the conclusion of this flush, the heater failed to function. An inspection determined that
thermal stress caused the base the heater to fracture, exposing wires inside to cryogenic
liquid and causing an electrical short circuit. This heater was designed only for casual use
for a few minutes at a time and was not intended to be fully submerged.
6.5 Second Immersion Heater Design
We desired to use a heater that is better designed for our intended operation. We
chose to use a flexible polyimide film heater. The heater consists of an etched foil heating
element between two layers of Kapton film. Figure 48 shows the layout of the foil within
the film. As with the previous heater, this heater operates via resistive heat dissipation in
the foil, with the Kapton providing structure and electrical insulation. The heater was a 4”
by 4” square and had a power density of 10 W/in2 for a total power output of 160 W [62].
Figure 48: Omega KH-404/10P Kapton heating film [62]
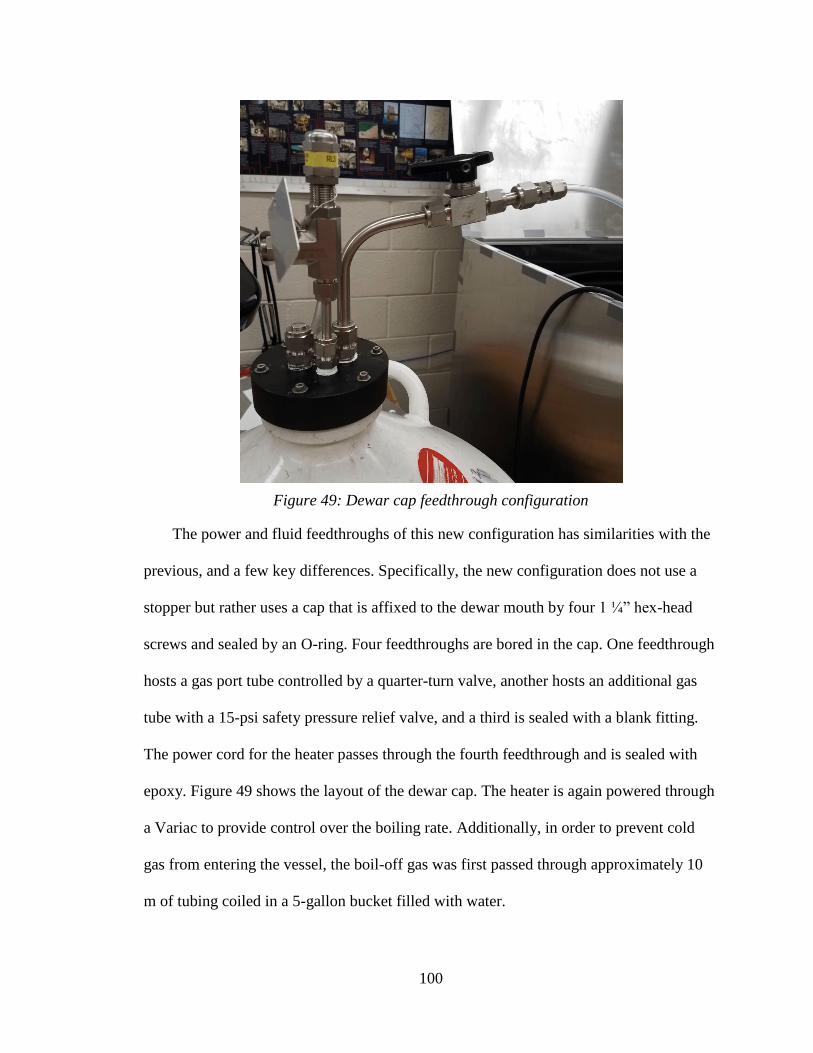
100
The power and fluid feedthroughs of this new configuration has similarities with the
previous, and a few key differences. Specifically, the new configuration does not use a
stopper but rather uses a cap that is affixed to the dewar mouth by four 1 ¼” hex-head
screws and sealed by an O-ring. Four feedthroughs are bored in the cap. One feedthrough
hosts a gas port tube controlled by a quarter-turn valve, another hosts an additional gas
tube with a 15-psi safety pressure relief valve, and a third is sealed with a blank fitting.
The power cord for the heater passes through the fourth feedthrough and is sealed with
epoxy. Figure 49 shows the layout of the dewar cap. The heater is again powered through
a Variac to provide control over the boiling rate. Additionally, in order to prevent cold
gas from entering the vessel, the boil-off gas was first passed through approximately 10
m of tubing coiled in a 5-gallon bucket filled with water.
Figure 49: Dewar cap feedthrough configuration
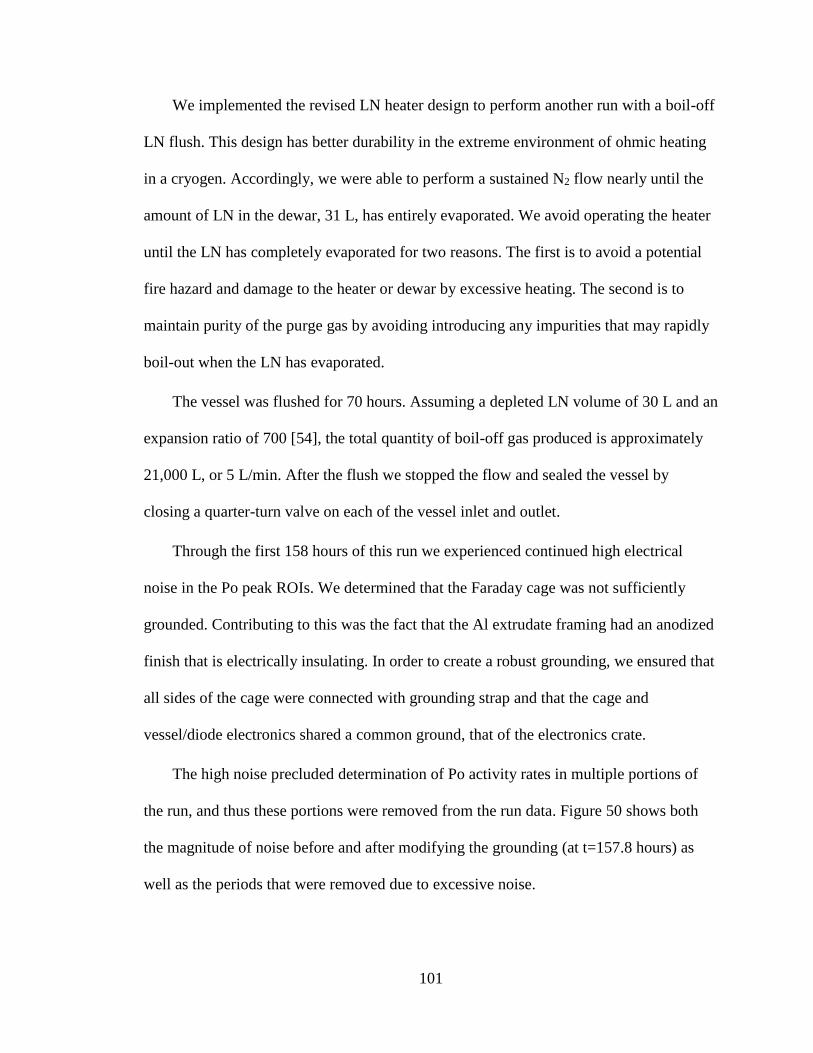
101
We implemented the revised LN heater design to perform another run with a boil-off
LN flush. This design has better durability in the extreme environment of ohmic heating
in a cryogen. Accordingly, we were able to perform a sustained N2 flow nearly until the
amount of LN in the dewar, 31 L, has entirely evaporated. We avoid operating the heater
until the LN has completely evaporated for two reasons. The first is to avoid a potential
fire hazard and damage to the heater or dewar by excessive heating. The second is to
maintain purity of the purge gas by avoiding introducing any impurities that may rapidly
boil-out when the LN has evaporated.
The vessel was flushed for 70 hours. Assuming a depleted LN volume of 30 L and an
expansion ratio of 700 [54], the total quantity of boil-off gas produced is approximately
21,000 L, or 5 L/min. After the flush we stopped the flow and sealed the vessel by
closing a quarter-turn valve on each of the vessel inlet and outlet.
Through the first 158 hours of this run we experienced continued high electrical
noise in the Po peak ROIs. We determined that the Faraday cage was not sufficiently
grounded. Contributing to this was the fact that the Al extrudate framing had an anodized
finish that is electrically insulating. In order to create a robust grounding, we ensured that
all sides of the cage were connected with grounding strap and that the cage and
vessel/diode electronics shared a common ground, that of the electronics crate.
The high noise precluded determination of Po activity rates in multiple portions of
the run, and thus these portions were removed from the run data. Figure 50 shows both
the magnitude of noise before and after modifying the grounding (at t=157.8 hours) as
well as the periods that were removed due to excessive noise.
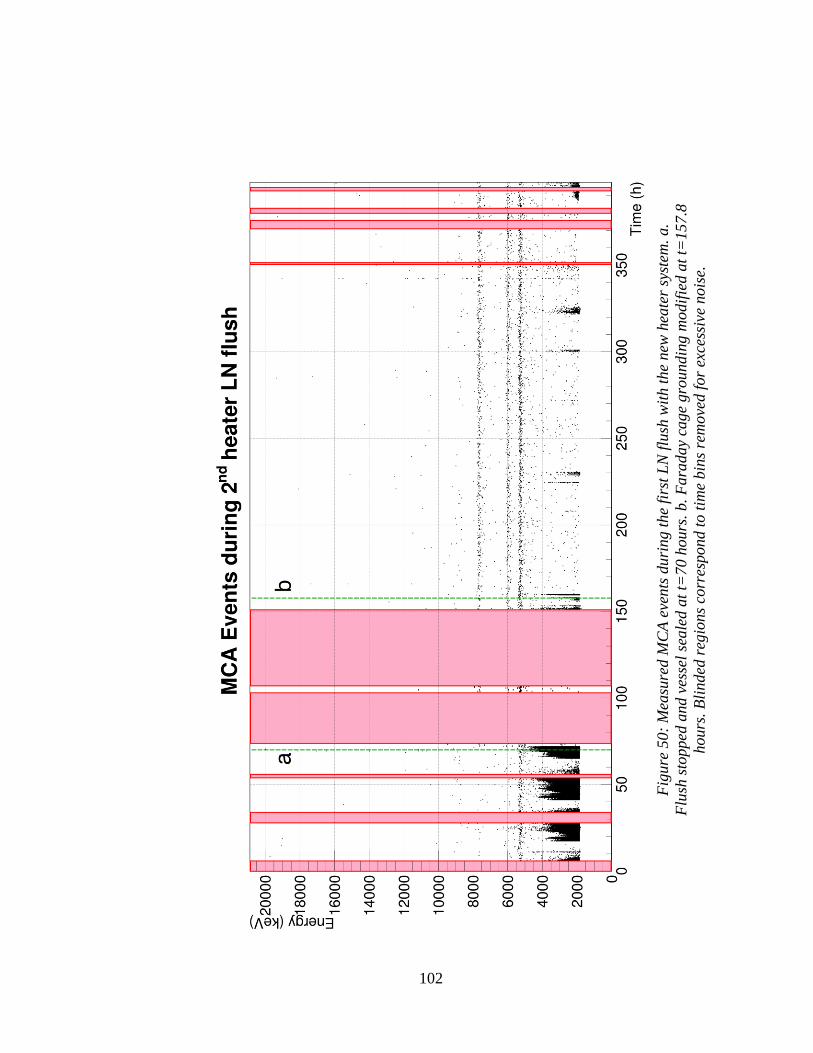
102
Fig
ure
50
: M
easu
red M
CA
eve
nts
du
ring t
he
firs
t L
N f
lush
wit
h t
he
new
hea
ter
syst
em. a.
Flu
sh s
topped
an
d v
esse
l se
ale
d a
t t=
70 h
ours
. b. F
ara
day
cage
gro
undin
g m
odif
ied a
t t=
157.8
hours
. B
linded
reg
ions
corr
espond t
o t
ime
bin
s re
move
d f
or
exce
ssiv
e nois
e.
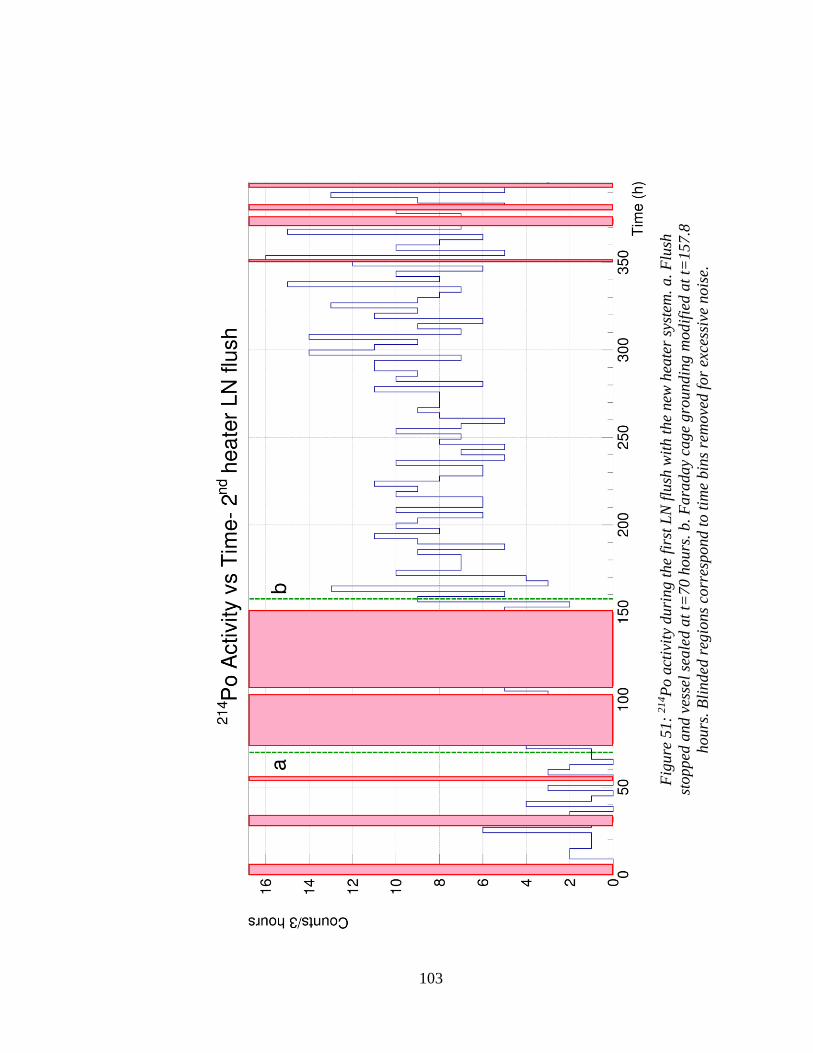
103
Fig
ure
51:
21
4P
o a
ctiv
ity
duri
ng t
he
firs
t L
N f
lush
wit
h t
he
new
hea
ter
syst
em. a. F
lush
stopp
ed a
nd v
esse
l se
ale
d a
t t=
70 h
ours
. b
. F
ara
day
cage
gro
undin
g m
od
ifie
d a
t t=
157.8
hours
. B
linded
reg
ions
corr
espond t
o t
ime
bin
s re
move
d f
or
exce
ssiv
e nois
e.
104
Despite the large amount of noise and blinded time bins, we were still able to
observe the effects of the purge and estimate a vessel background activity. The activity of
214Po is plotted as function of time in Figure 51. The sharp reduction in activity due to the
flush was contained within a period of noisy data, but it is evident that the activity prior
to sealing is much lower than room air. The average 222Rn activity during the 24 hours of
quality data prior to sealing the vessel was 1.85±0.29 mBq.
Again, due to noisy data, the growth of 222Rn activity due to emanation from the
vessel is not shown, however we can see the final emanation level clearly especially after
the Faraday cage was modified. The final activity rate of this run was 3.40±0.42 mBq,
corresponding to an emanation rate of 1.92±0.24 mBq/m2, still higher than the goal
background of 10s of μBq/m2.
6.6 Background Activity Measurement with LN Flush & Moderate Vacuum
Having a moderate vacuum in the vessel has the dual benefits of allowing us to
monitor the pressure in the vessel to test for any leaks as well as ensuring an additional
amount of leak-tightness in the system. Further, as mentioned in Chapter 4, the detection
efficiency is reduced by collisions of Rn daughters with gas or contaminant molecules in
the vessel. Reducing the pressure inside the vessel inherently means that there will be
fewer gas molecules to collide with.
Accordingly, we performed a run with an LN flush immediately followed by
pumping on the vessel before sealing. The vessel was sealed at approximately 400 Torr,
130 Torr below local atmospheric pressure. The first flush of this run was intended to last
24 hours but was ended prematurely because the LN became depleted. As the LN
evaporated, the flow rate dropped, and some air was able to creep back into the vessel
105
through the outlet valve. We sealed the vessel for approximately 72 hours to obtain
additional LN and then re-flushed for 20 hours. At the conclusion of the second flush, we
pumped the vessel down to P=413.5 Torr and sealed by closing the inlet and outlet
valves.
Figures 52 and 53 note the results of this run. In the first plot, 214Po activity vs time,
the effects of the two flushes and the build-up of 214Po due to 222Rn emanation are clear.
The activity falls from the room air level of ~3.9 Bq/m3 to 0.498 mBq/m3 during the first
flush, from 2.75 to 24 hours, before rising sharply due to evaporation of the LN and
possible air backflow. The purging activity of 0.498 mBq/m3 is consistent with
previously measured values of 0.5 mBq/m3 for the Rn concentration of boil-off LN gas
[53]. This indeed suggests that our LN flush has displaced room air from the system.
After the second flush, from 97 to 117 hours, the 222Rn activity steadily rises to a
final value of 1.94±0.24 mBq/m2. Consistent with the previous run without vacuum
pumping, it suggests that the measured vessel background activity is indeed on the order
of mBq\m2, much larger than the goal of 10s of μBq/m2.
A clue to the high background may lie in the activity of 212Po, indicative of the
presence of 232Th in the vessel. The 212Po activity falls from 96.45±19.29 μBq to
50.15±13.61 μBq over the 735.25-hour duration of the run. The falling activity, not a
steady state, suggests that there was some higher initial quantity of 232Th that was
decaying. Further, the average 212Po activity of similar runs using room air as a source
was 46.77 μBq. This fact, and the fact that the longest-lived daughter of 224Ra is 212Bi
with a half-life of 10.64 hours and we did not observe significant activity of 212Po in
room air runs, makes it unlikely that air is the source of the 212Po.
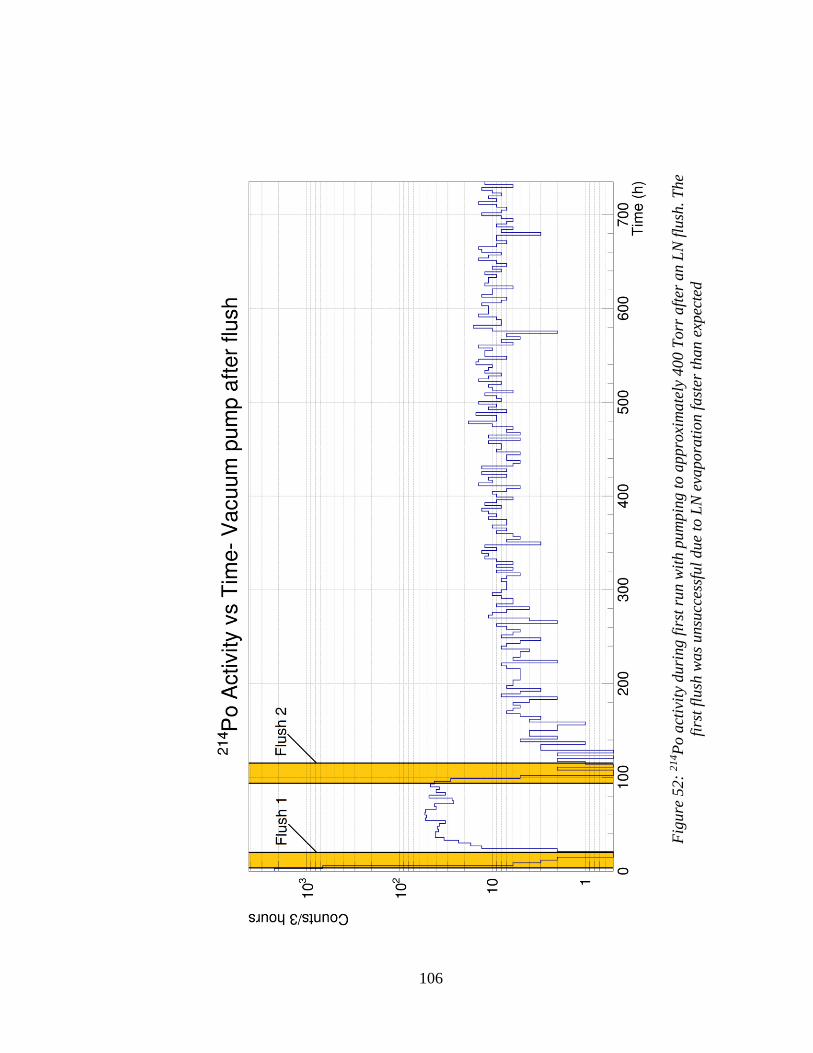
106
Fig
ure
52:
21
4P
o a
ctiv
ity
duri
ng f
irst
run w
ith p
um
pin
g t
o a
ppro
xim
ate
ly 4
00 T
orr
aft
er a
n L
N f
lush
. T
he
firs
t fl
ush
was
unsu
cces
sful
due
to L
N e
vapora
tion f
ast
er t
han
exp
ecte
d
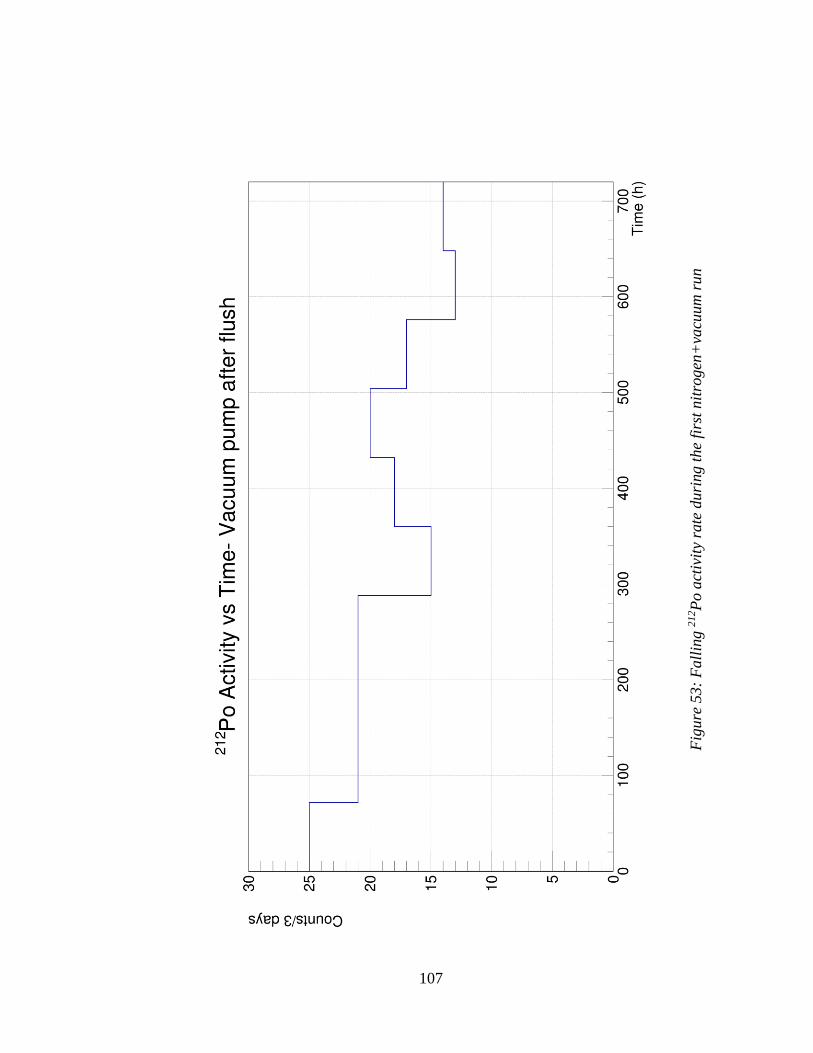
107
Fig
ure
53:
Fall
ing 2
12P
o a
ctiv
ity
rate
duri
ng t
he
firs
t nit
rogen
+va
cuum
run
108
We assessed that it was more likely that the source was either debris in the vessel or
thorium content in some component of the vessel’s construction. Since the thorite rock
sample that was used for efficiency measurements had a high thorium content and a
granular consistency, an immediate concern was that dust or a grain of the rock flowed
into the vessel and was causing an elevated 212Po activity. Alternatively, it is possible that
one or multiple components of the vessel had a large Rn emanation rate.
109
7 Investigation of Background Sources
7.1 Vessel Leak Investigation
In order to determine if a leak existed in the vessel, we left it sealed after an LN
flush and observed the activity. The room air was measured to have a much higher Rn
content than that of boil-off LN gas or of the measured intrinsic background of the vessel.
If a major leak existed, the Rn activity would increase as air entered the vessel. Figures
54-57 depict the results of this leak test run. 214Po and 218Po activities are statistically
constant (within standard counting error), during the sealed run. At 217 hours of runtime,
the inlet side of the vessel was opened by unclamping the vinyl tube to simulate a leak in
the vessel. Both 214Po and 218Po responded strongly to the simulated leak, both growing
by over an order of magnitude. During both the sealed run and the simulated leak 212Po
remained nearly constant, rising from 63.66±19.19 μBq during the first 48 hours of the
run to 75.23±20.87 μBq, indicating that the simulated leak rate was still slow enough to
prevent 220Rn daughters from reaching the detector due to their short half-lives compared
to 222Rn daughters. This suggests that there was not a large leak in the vessel during
sealed runs, however it was still not possible to tell if there was a smaller leak.
In order to mitigate against the possibility of a leak, all flanges were checked to
ensure a tight seal, including ensuring a proper fit of all O-rings. Additionally, 9 C-
clamps were placed around the vessel lid to supplement the three bolts which secure the
lid. Since the vessel was originally designed as a bell jar vacuum chamber, it was
expected to have an additional amount of force due to the pressure differential between
the interior and exterior to secure the lid. The clamps and bolts were spaced equidistant
around the perimeter of the lid, precisely 30° apart, in order to achieve a uniform force
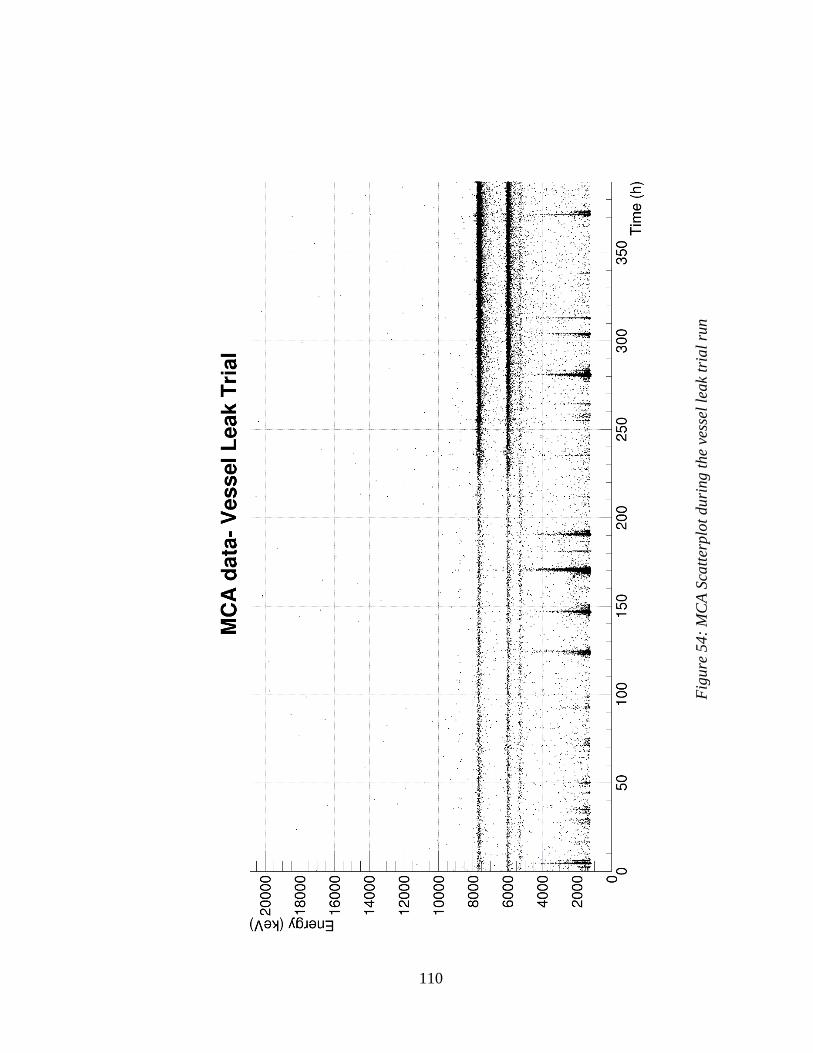
110
Fig
ure
54:
MC
A S
catt
erplo
t duri
ng t
he
vess
el l
eak
tria
l ru
n
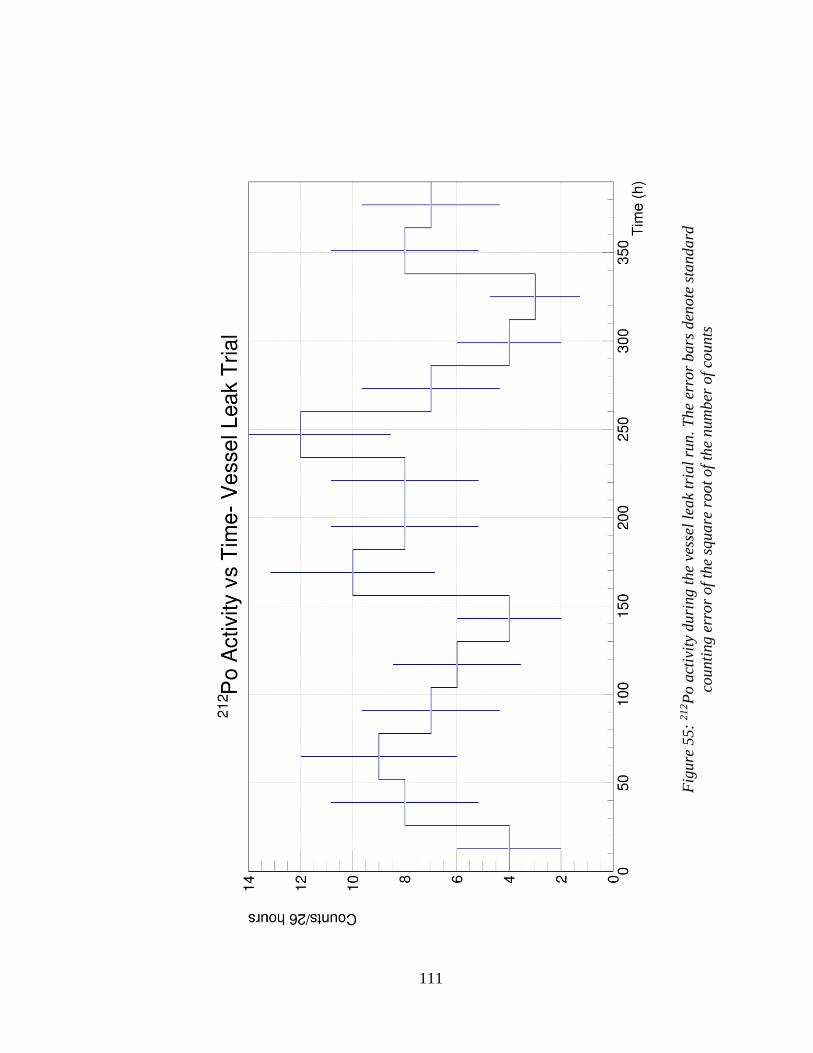
111
Fig
ure
55:
21
2P
o a
ctiv
ity
duri
ng t
he
vess
el l
eak
tria
l ru
n. T
he
erro
r b
ars
den
ote
sta
nd
ard
counti
ng e
rror
of
the
square
root
of
the
num
ber
of
counts
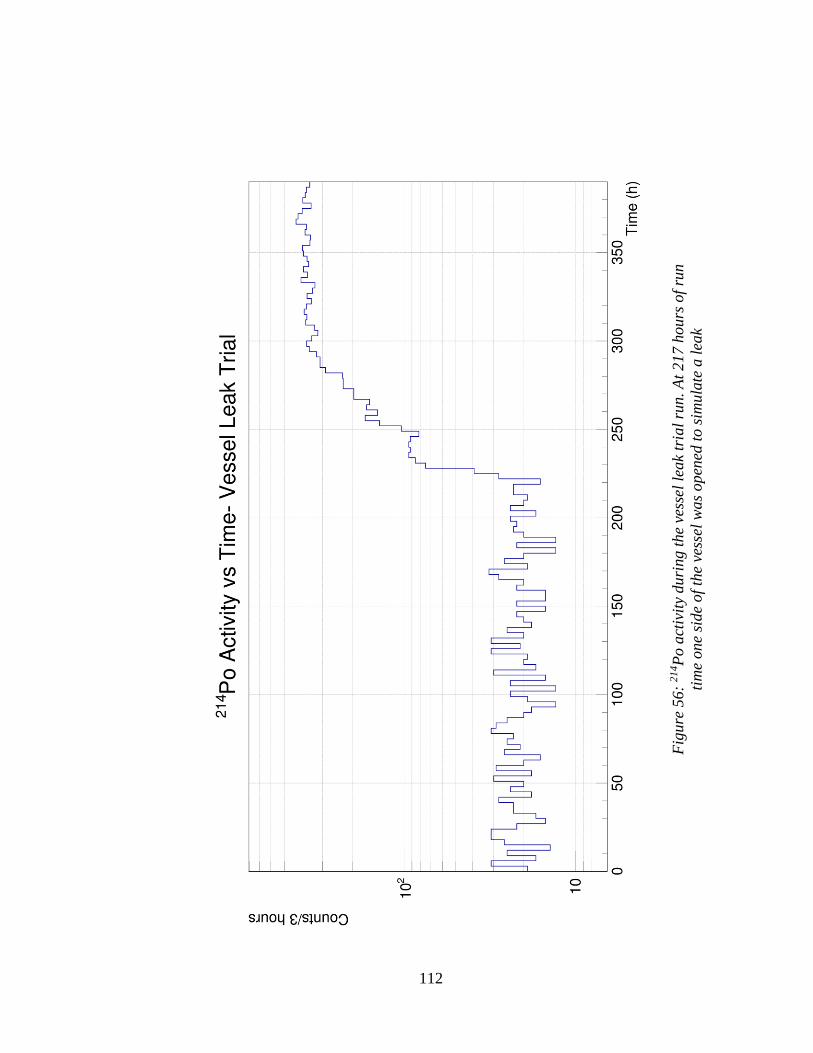
112
Fig
ure
56:
21
4P
o a
ctiv
ity
duri
ng t
he
vess
el l
eak
tria
l ru
n. A
t 217 h
ours
of
run
tim
e one
side
of
the
vess
el w
as
open
ed t
o s
imula
te a
lea
k
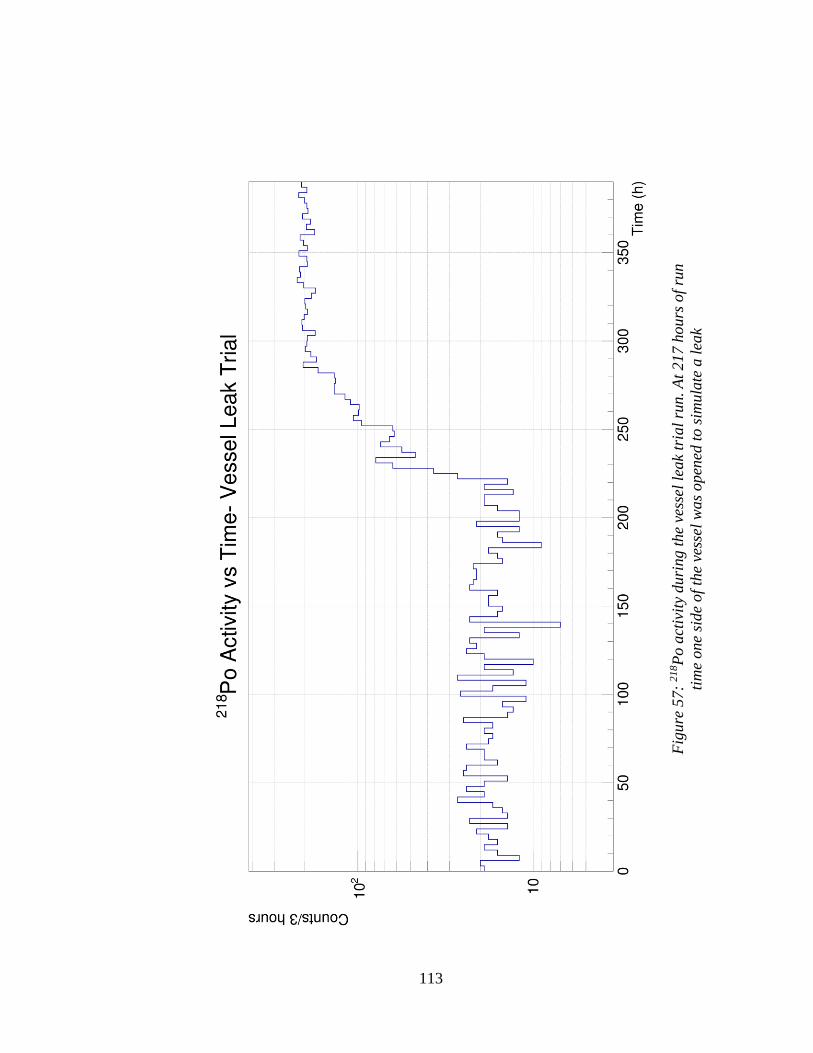
113
Fig
ure
57:
21
8P
o a
ctiv
ity
duri
ng t
he
vess
el l
eak
tria
l ru
n. A
t 217 h
ours
of
run
tim
e one
side
of
the
vess
el w
as
open
ed t
o s
imula
te a
lea
k
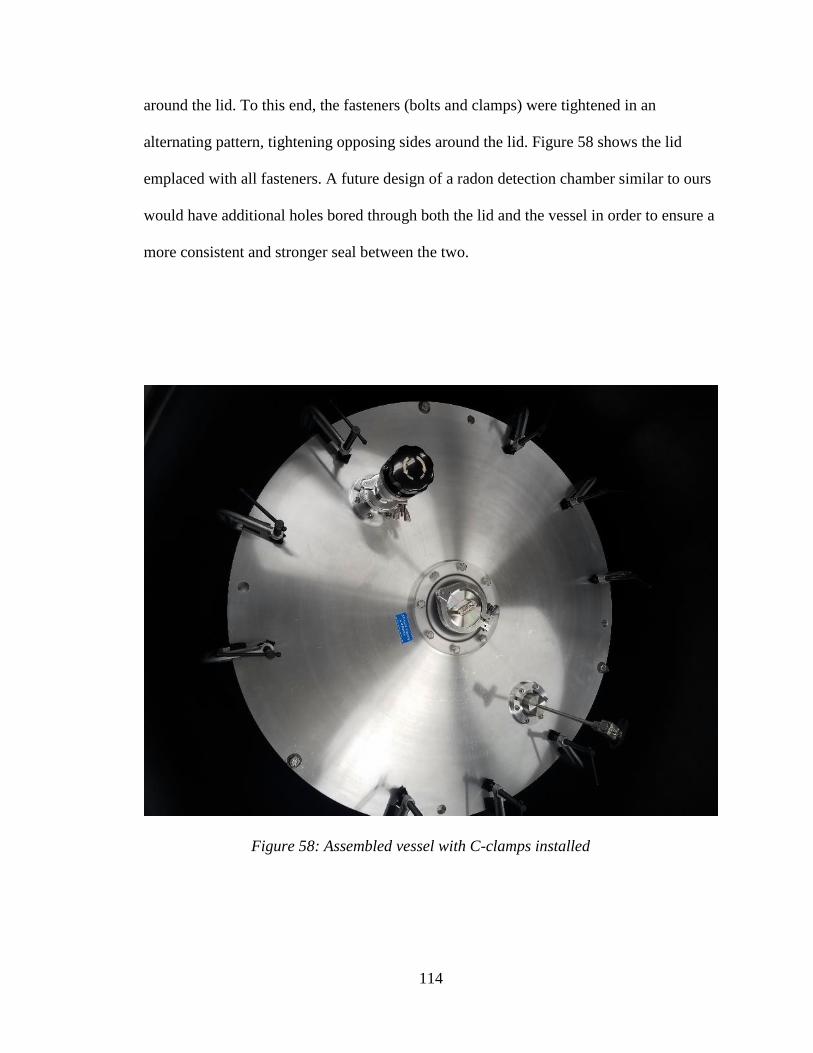
114
around the lid. To this end, the fasteners (bolts and clamps) were tightened in an
alternating pattern, tightening opposing sides around the lid. Figure 58 shows the lid
emplaced with all fasteners. A future design of a radon detection chamber similar to ours
would have additional holes bored through both the lid and the vessel in order to ensure a
more consistent and stronger seal between the two.
Figure 58: Assembled vessel with C-clamps installed
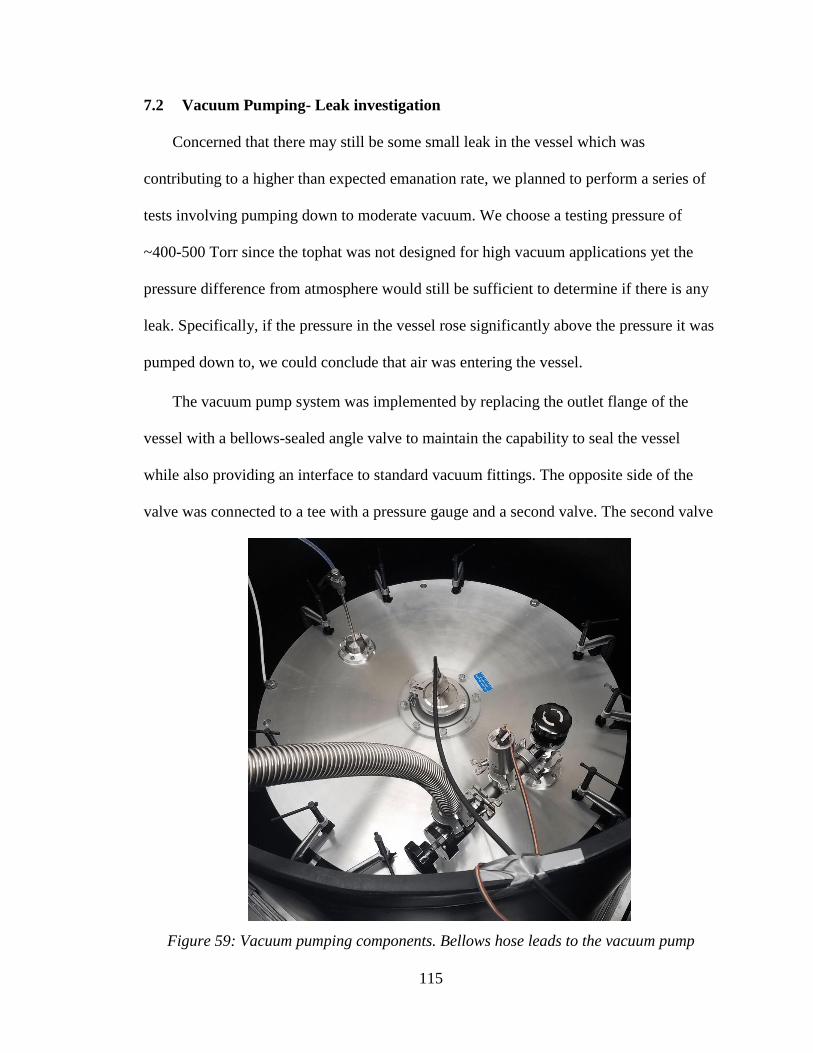
115
7.2 Vacuum Pumping- Leak investigation
Concerned that there may still be some small leak in the vessel which was
contributing to a higher than expected emanation rate, we planned to perform a series of
tests involving pumping down to moderate vacuum. We choose a testing pressure of
~400-500 Torr since the tophat was not designed for high vacuum applications yet the
pressure difference from atmosphere would still be sufficient to determine if there is any
leak. Specifically, if the pressure in the vessel rose significantly above the pressure it was
pumped down to, we could conclude that air was entering the vessel.
The vacuum pump system was implemented by replacing the outlet flange of the
vessel with a bellows-sealed angle valve to maintain the capability to seal the vessel
while also providing an interface to standard vacuum fittings. The opposite side of the
valve was connected to a tee with a pressure gauge and a second valve. The second valve
Figure 59: Vacuum pumping components. Bellows hose leads to the vacuum pump
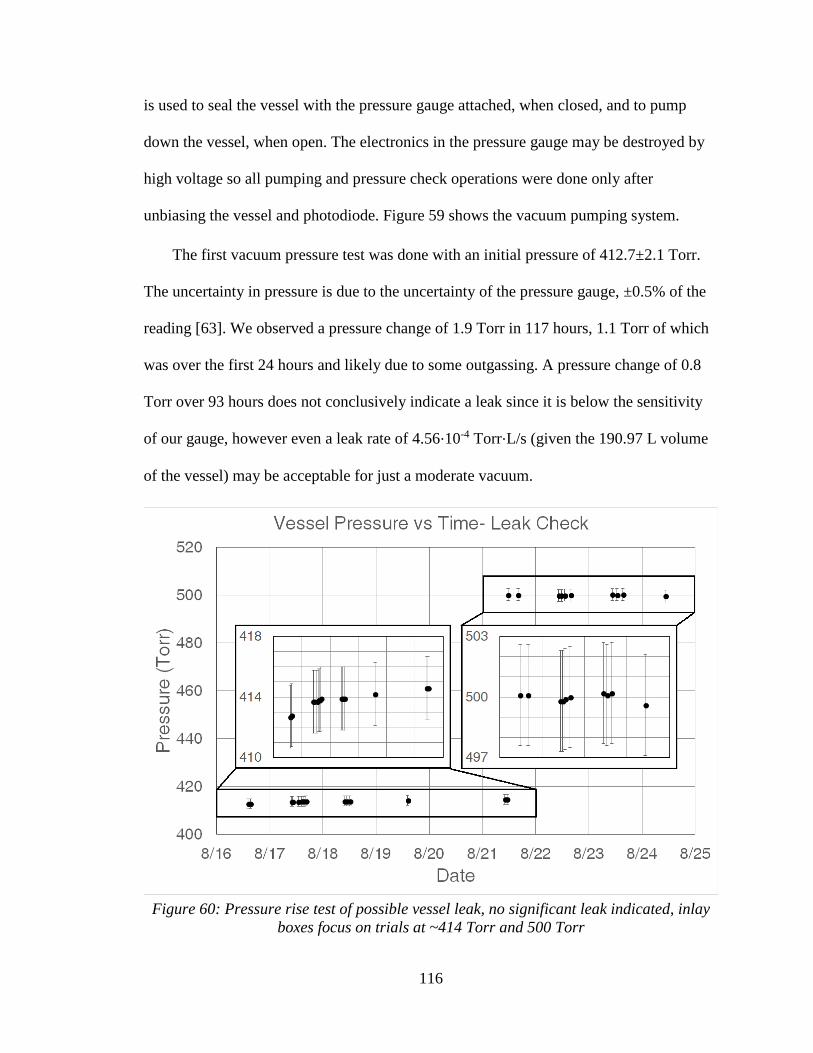
116
is used to seal the vessel with the pressure gauge attached, when closed, and to pump
down the vessel, when open. The electronics in the pressure gauge may be destroyed by
high voltage so all pumping and pressure check operations were done only after
unbiasing the vessel and photodiode. Figure 59 shows the vacuum pumping system.
The first vacuum pressure test was done with an initial pressure of 412.7±2.1 Torr.
The uncertainty in pressure is due to the uncertainty of the pressure gauge, ±0.5% of the
reading [63]. We observed a pressure change of 1.9 Torr in 117 hours, 1.1 Torr of which
was over the first 24 hours and likely due to some outgassing. A pressure change of 0.8
Torr over 93 hours does not conclusively indicate a leak since it is below the sensitivity
of our gauge, however even a leak rate of 4.56⋅10-4 Torr⋅L/s (given the 190.97 L volume
of the vessel) may be acceptable for just a moderate vacuum.
Figure 60: Pressure rise test of possible vessel leak, no significant leak indicated, inlay
boxes focus on trials at ~414 Torr and 500 Torr
117
Since it is possible that the very act of pumping to ~414 Torr sealed a leak that
would otherwise exist at 630 Torr, we also tested the vessel at 500 Torr. The result of this
test remained inconclusive of evidence of a leak, with the pressure remaining constant
(±0.5 Torr) over nearly 3 days. Figure 60 is a plot of the vessel pressure as a function of
time, for both the 414 Torr and 500 Torr tests. While these tests cannot rule out that there
was a leak at zero or positive pressure relative to atmosphere, they can conclude that
there is no appreciable leak at a moderate vacuum.
7.3 Electrical Noise Investigation- Faraday Cage
Prior to performing a boil-off LN flush with the second heater configuration, we
observed a high amount of electrical noise in the photodiode signal. Previously, the
electrical noise was primarily at low channel numbers, and hence low energies.
Occasionally the noise would extend to higher channels for short durations. In either
case, except in the rectified cases mentioned in Chapter 5, the noise previously did not
interfere with Po α counting. The noise began to become detrimental for Rn detection
operation as the noise, though diminishing in magnitude in high channel numbers, was
present in a larger range of channels and extending into the region of interest (ROI) for
222Rn and 220Rn decay chain α’s. For runs with a high Rn activity a small amount of noise
in the ROI may not be significant, however any amount of noise in the ROI will reduce
the sensitivity of the detector.
A particularly interesting feature of the noise was that it seemed to increase when the
fluorescent lights in the laboratory room were switched on as well as when other
appliances were running. We suspected that the photodiode and the signal feed cable
were picking up electromagnetic interference (EMI), resulting in high noise.
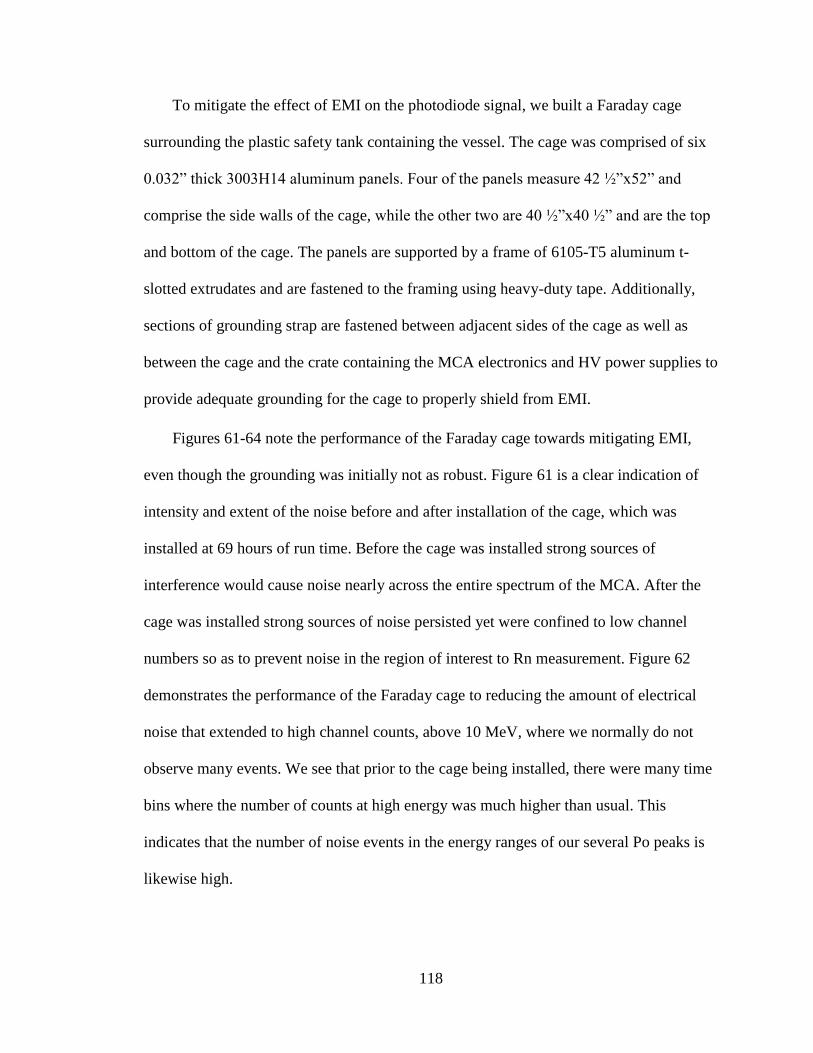
118
To mitigate the effect of EMI on the photodiode signal, we built a Faraday cage
surrounding the plastic safety tank containing the vessel. The cage was comprised of six
0.032” thick 3003H14 aluminum panels. Four of the panels measure 42 ½”x52” and
comprise the side walls of the cage, while the other two are 40 ½”x40 ½” and are the top
and bottom of the cage. The panels are supported by a frame of 6105-T5 aluminum t-
slotted extrudates and are fastened to the framing using heavy-duty tape. Additionally,
sections of grounding strap are fastened between adjacent sides of the cage as well as
between the cage and the crate containing the MCA electronics and HV power supplies to
provide adequate grounding for the cage to properly shield from EMI.
Figures 61-64 note the performance of the Faraday cage towards mitigating EMI,
even though the grounding was initially not as robust. Figure 61 is a clear indication of
intensity and extent of the noise before and after installation of the cage, which was
installed at 69 hours of run time. Before the cage was installed strong sources of
interference would cause noise nearly across the entire spectrum of the MCA. After the
cage was installed strong sources of noise persisted yet were confined to low channel
numbers so as to prevent noise in the region of interest to Rn measurement. Figure 62
demonstrates the performance of the Faraday cage to reducing the amount of electrical
noise that extended to high channel counts, above 10 MeV, where we normally do not
observe many events. We see that prior to the cage being installed, there were many time
bins where the number of counts at high energy was much higher than usual. This
indicates that the number of noise events in the energy ranges of our several Po peaks is
likewise high.
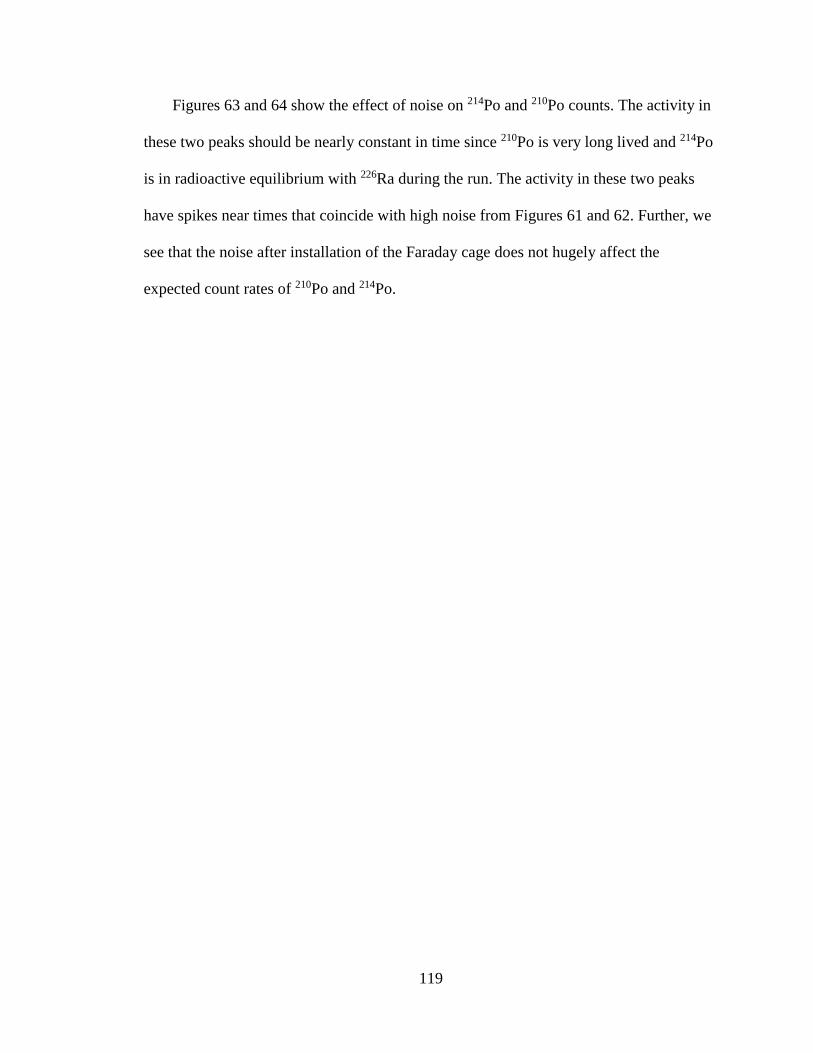
119
Figures 63 and 64 show the effect of noise on 214Po and 210Po counts. The activity in
these two peaks should be nearly constant in time since 210Po is very long lived and 214Po
is in radioactive equilibrium with 226Ra during the run. The activity in these two peaks
have spikes near times that coincide with high noise from Figures 61 and 62. Further, we
see that the noise after installation of the Faraday cage does not hugely affect the
expected count rates of 210Po and 214Po.
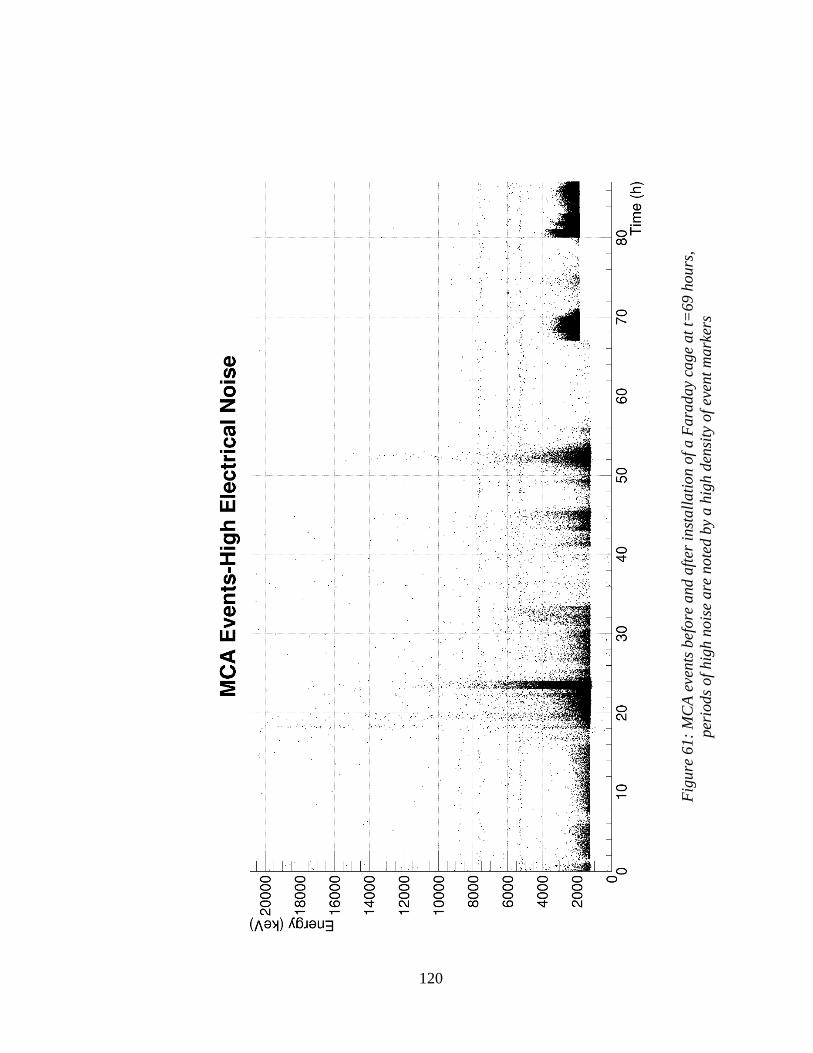
120
Fig
ure
61:
MC
A e
vents
bef
ore
and a
fter
inst
all
ati
on o
f a F
ara
day
cage
at
t=69 h
ours
,
per
iods
of
hig
h n
ois
e are
note
d b
y a h
igh d
ensi
ty o
f ev
ent
mark
ers
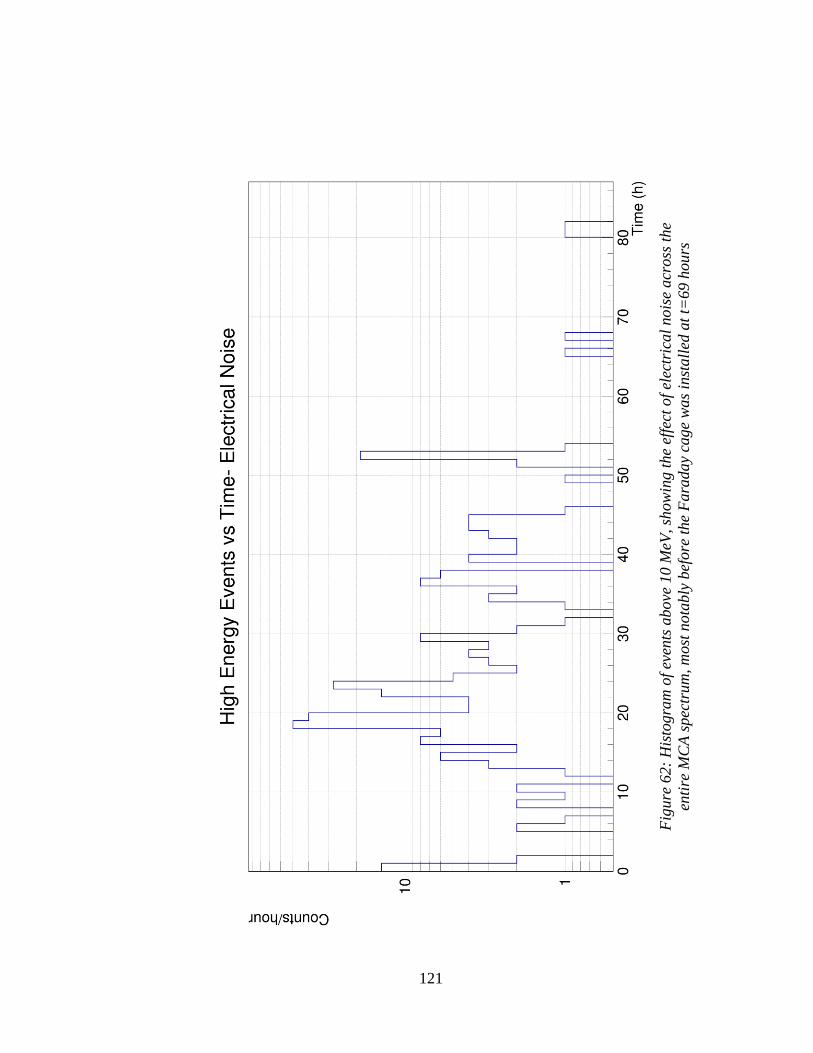
121
Fig
ure
62:
His
togra
m o
f ev
ents
ab
ove
10 M
eV, sh
ow
ing t
he
effe
ct o
f el
ectr
ical
nois
e acr
oss
the
enti
re M
CA
spec
trum
, m
ost
no
tably
bef
ore
the
Fara
day
cage
was
inst
all
ed a
t t=
69 h
ours
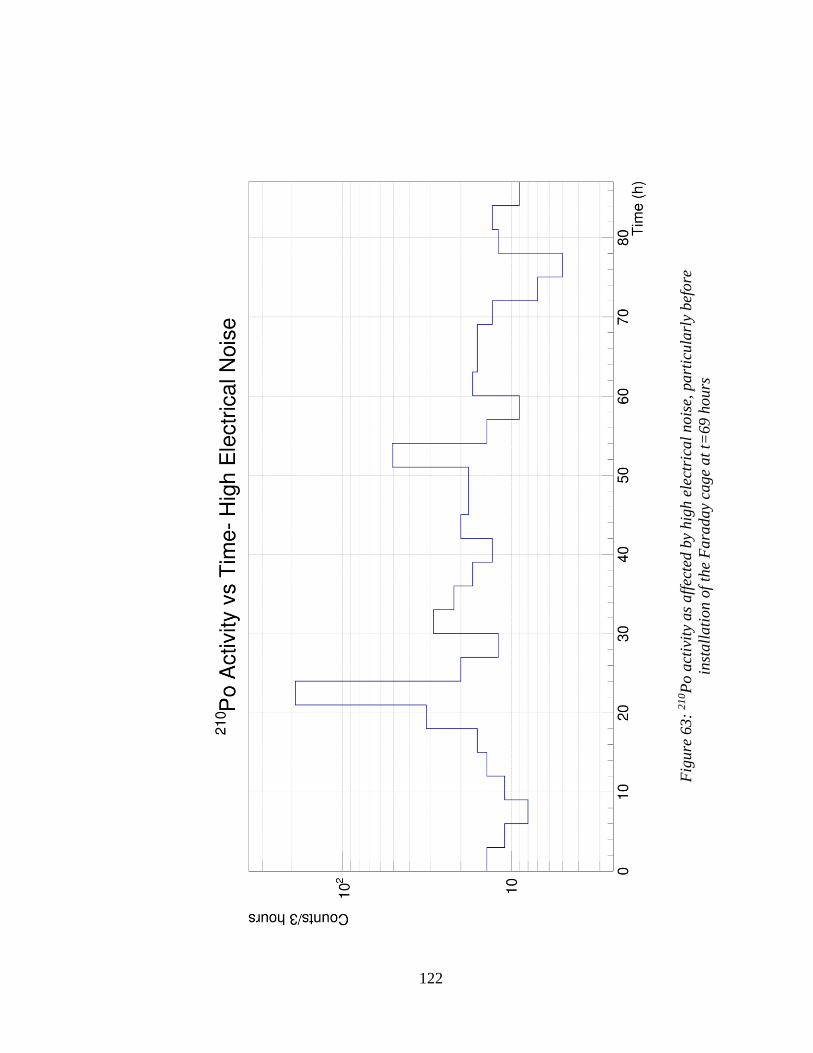
122
Fig
ure
63:
21
0P
o a
ctiv
ity
as
aff
ecte
d b
y hig
h e
lect
rica
l nois
e, p
art
icula
rly
bef
ore
inst
all
ati
on o
f th
e F
ara
day
cage
at
t=69 h
ours
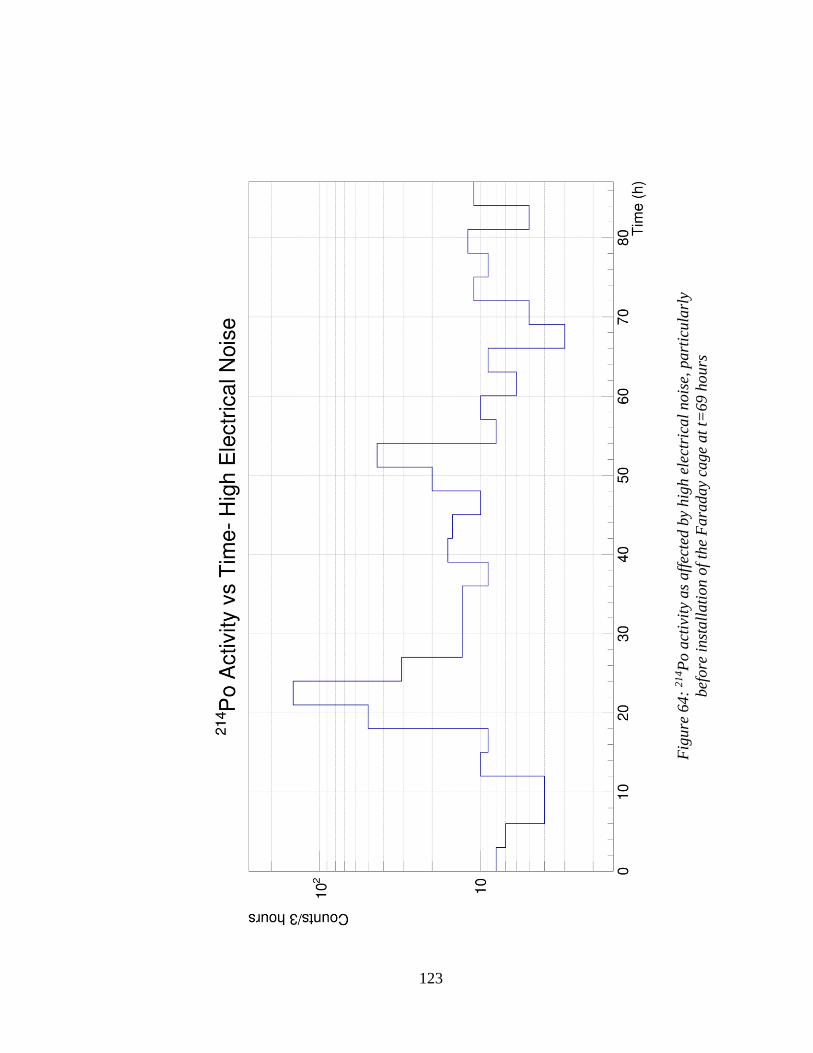
123
Fig
ure
64:
21
4P
o a
ctiv
ity
as
aff
ecte
d b
y hig
h e
lect
rica
l nois
e, p
art
icula
rly
bef
ore
inst
all
ati
on o
f th
e F
ara
day
cage
at
t=69 h
ours
124
8 Reducing Background Activity
8.1 Cleaning Vessel Interior
Concerned that ore dust may have flowed into the vessel during efficiency
measurements, we removed the lid and cleaned the interior with Kimwipe laboratory
wipes and isopropanol (IPA). The IPA was used as a solvent for any oils inside the
vessel, while the wipes were used to collect any debris. The cleaning was done by placing
the plastic safety tank, containing the lidless vessel, horizontally and wiping inside the
vessel with IPA-moistened Kimwipes. Due to the noxious fumes of IPA, a small fan was
used to ventilate the working area. Also, the steel inlet pipe was removed and the exterior
was wiped with IPA while the interior was flushed with IPA
The Kimwipes were stored after cleaning and were subsequently analyzed in a
gamma spectrometer. A 5cm x 5cm portion of the used wipe contained a level of 212Bi
slightly above that of a clean, bare wipe, however the increased quantity was not high
enough to conclusively state whether there was any debris collected on the wipe. It is
possible that the sample tested in the gamma spectrometer did not have a large
concentration of particulates since it was just a small portion of just one of several large
Kimwipes used.
A flush with vacuum pumping was again performed after cleaning. The results of the
post-clean run are shown in Figures 65-67. The MCA spectrum indicates qualitatively
that the activities of 214Po and 218Po are actually increased after cleaning, while the
activity of 212Po is constant within error. Since the cleaning did not involve the
photodiode, or what is plated-out on it, we did not expect the activity of 210Po to change
and indeed we observed nearly the same activity after cleaning.
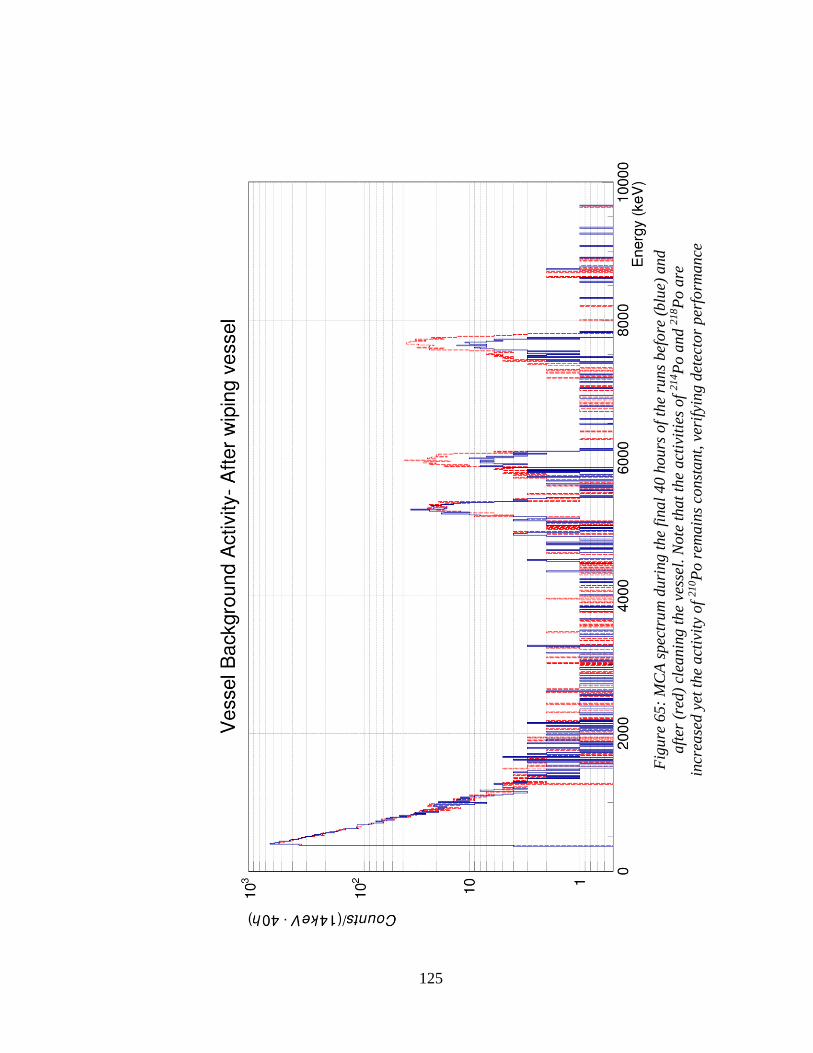
125
Fig
ure
65:
MC
A s
pec
tru
m d
uri
ng t
he
final
40 h
ours
of
the
run
s bef
ore
(blu
e) a
nd
aft
er (
red
) cl
eanin
g t
he
vess
el. N
ote
that
the
act
ivit
ies
of
21
4P
o a
nd 2
18P
o a
re
incr
ease
d y
et t
he
act
ivit
y of
21
0P
o r
emain
s co
nst
ant,
ver
ifyi
ng d
etec
tor
per
form
ance
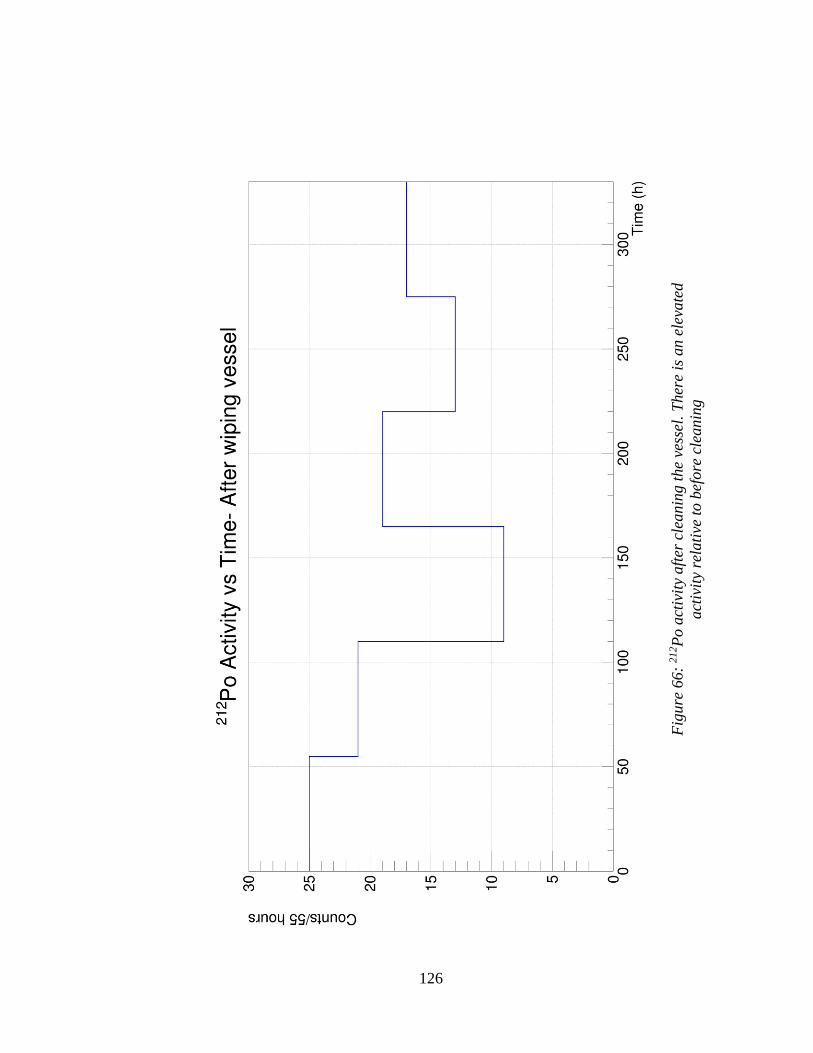
126
Fig
ure
66:
21
2P
o a
ctiv
ity
aft
er c
leanin
g t
he
vess
el.
Ther
e is
an
ele
vate
d
act
ivit
y re
lati
ve t
o b
efore
cle
anin
g
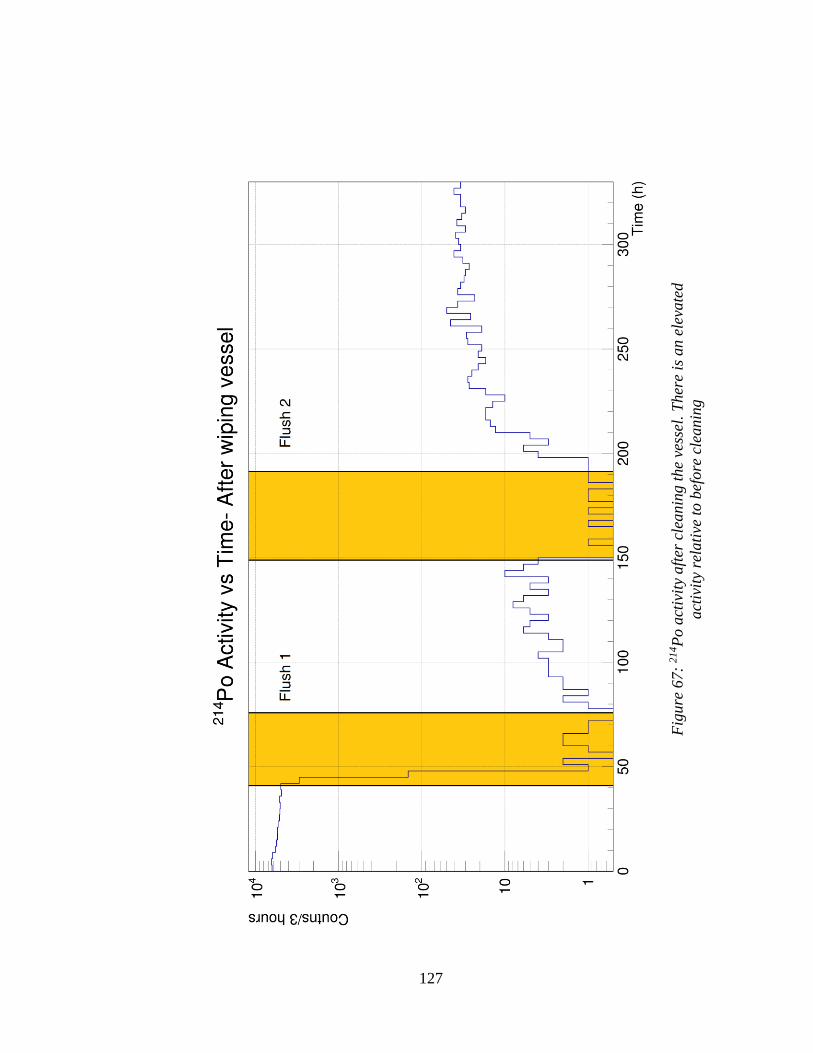
127
Fig
ure
67:
21
4P
o a
ctiv
ity
aft
er c
leanin
g t
he
vess
el.
Ther
e is
an
ele
vate
d
act
ivit
y re
lati
ve t
o b
efore
cle
anin
g
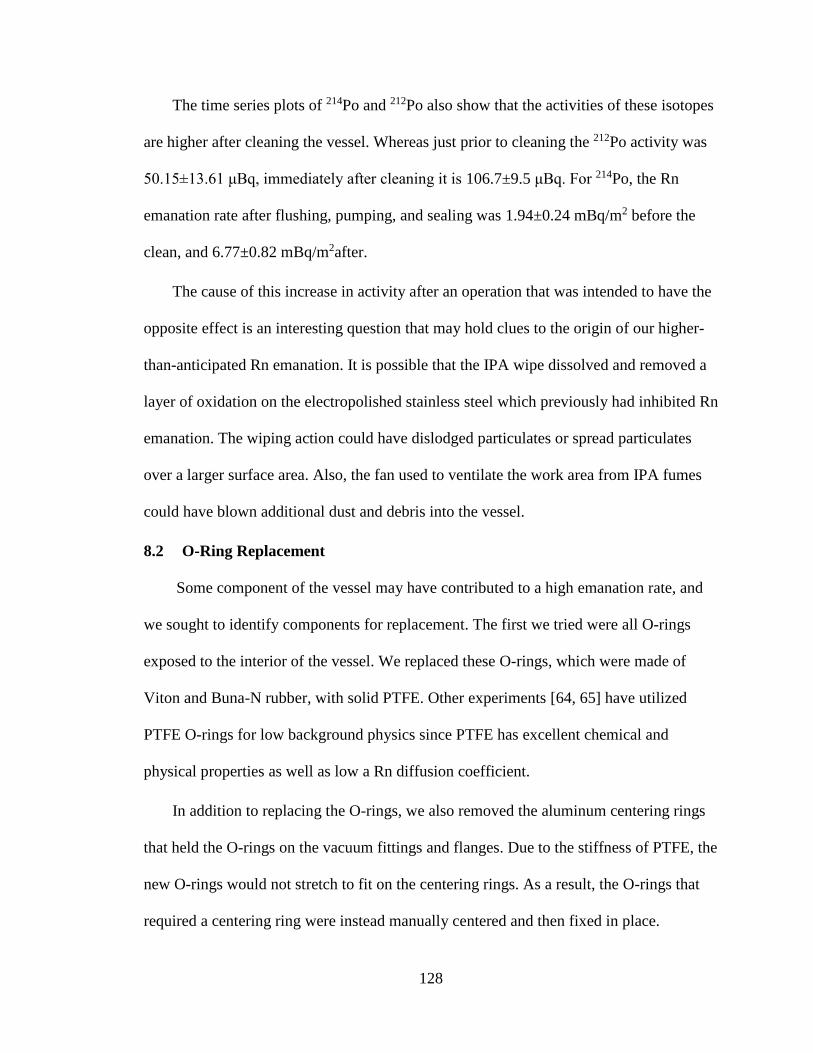
128
The time series plots of 214Po and 212Po also show that the activities of these isotopes
are higher after cleaning the vessel. Whereas just prior to cleaning the 212Po activity was
50.15±13.61 μBq, immediately after cleaning it is 106.7±9.5 μBq. For 214Po, the Rn
emanation rate after flushing, pumping, and sealing was 1.94±0.24 mBq/m2 before the
clean, and 6.77±0.82 mBq/m2after.
The cause of this increase in activity after an operation that was intended to have the
opposite effect is an interesting question that may hold clues to the origin of our higher-
than-anticipated Rn emanation. It is possible that the IPA wipe dissolved and removed a
layer of oxidation on the electropolished stainless steel which previously had inhibited Rn
emanation. The wiping action could have dislodged particulates or spread particulates
over a larger surface area. Also, the fan used to ventilate the work area from IPA fumes
could have blown additional dust and debris into the vessel.
8.2 O-Ring Replacement
Some component of the vessel may have contributed to a high emanation rate, and
we sought to identify components for replacement. The first we tried were all O-rings
exposed to the interior of the vessel. We replaced these O-rings, which were made of
Viton and Buna-N rubber, with solid PTFE. Other experiments [64, 65] have utilized
PTFE O-rings for low background physics since PTFE has excellent chemical and
physical properties as well as low a Rn diffusion coefficient.
In addition to replacing the O-rings, we also removed the aluminum centering rings
that held the O-rings on the vacuum fittings and flanges. Due to the stiffness of PTFE, the
new O-rings would not stretch to fit on the centering rings. As a result, the O-rings that
required a centering ring were instead manually centered and then fixed in place.
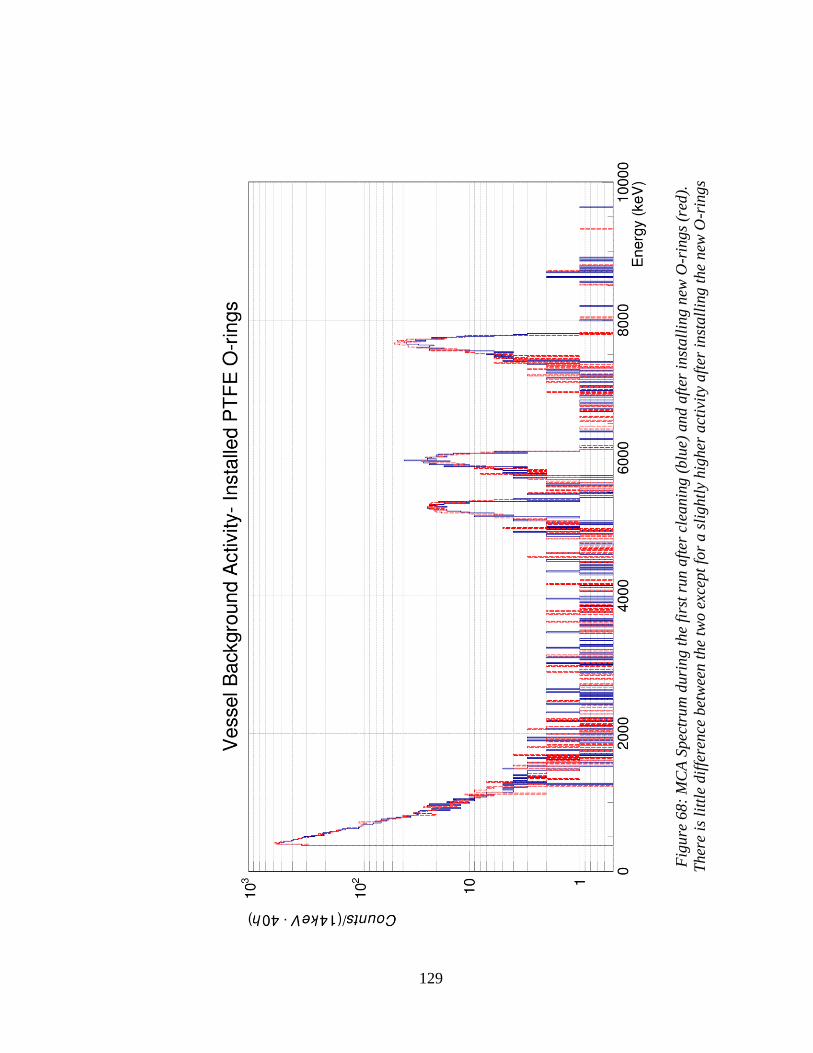
129
Fig
ure
68:
MC
A S
pec
tru
m d
uri
ng t
he
firs
t ru
n a
fter
cle
anin
g (
blu
e) a
nd a
fter
inst
all
ing n
ew O
-rin
gs
(red
).
Ther
e is
lit
tle
dif
fere
nce
bet
wee
n t
he
two e
xcep
t fo
r a s
lightl
y hig
her
act
ivit
y aft
er i
nst
all
ing t
he
new
O-r
ings
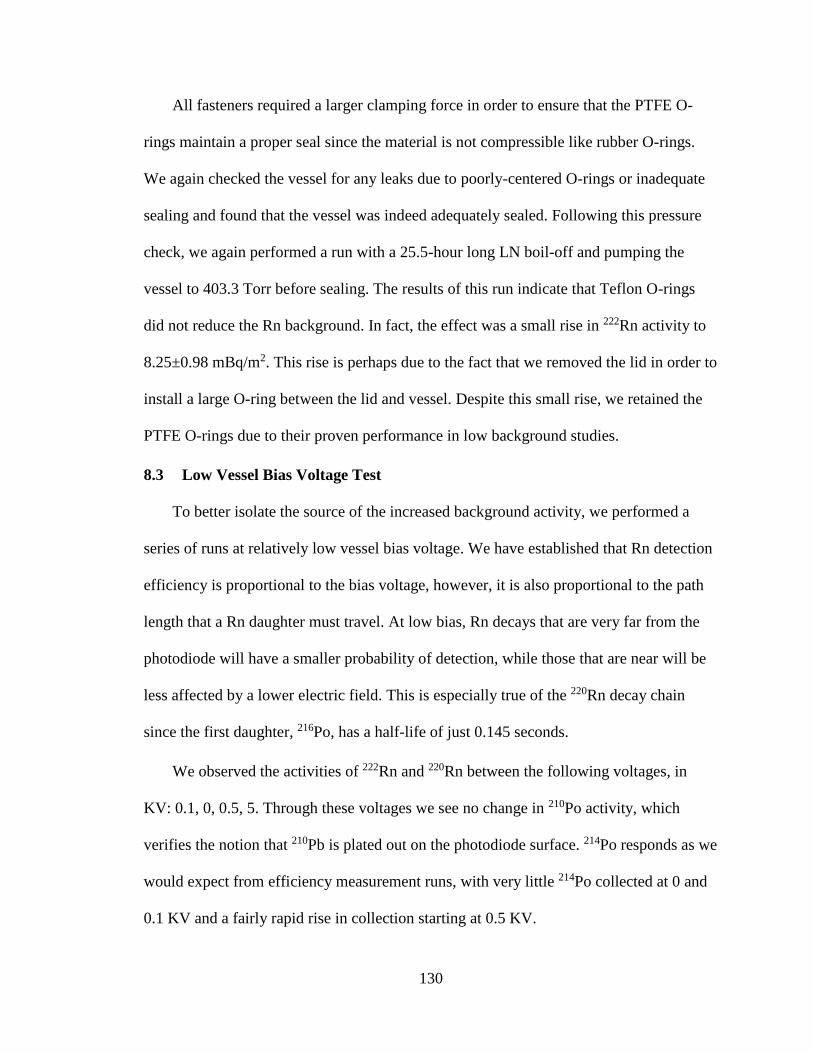
130
All fasteners required a larger clamping force in order to ensure that the PTFE O-
rings maintain a proper seal since the material is not compressible like rubber O-rings.
We again checked the vessel for any leaks due to poorly-centered O-rings or inadequate
sealing and found that the vessel was indeed adequately sealed. Following this pressure
check, we again performed a run with a 25.5-hour long LN boil-off and pumping the
vessel to 403.3 Torr before sealing. The results of this run indicate that Teflon O-rings
did not reduce the Rn background. In fact, the effect was a small rise in 222Rn activity to
8.25±0.98 mBq/m2. This rise is perhaps due to the fact that we removed the lid in order to
install a large O-ring between the lid and vessel. Despite this small rise, we retained the
PTFE O-rings due to their proven performance in low background studies.
8.3 Low Vessel Bias Voltage Test
To better isolate the source of the increased background activity, we performed a
series of runs at relatively low vessel bias voltage. We have established that Rn detection
efficiency is proportional to the bias voltage, however, it is also proportional to the path
length that a Rn daughter must travel. At low bias, Rn decays that are very far from the
photodiode will have a smaller probability of detection, while those that are near will be
less affected by a lower electric field. This is especially true of the 220Rn decay chain
since the first daughter, 216Po, has a half-life of just 0.145 seconds.
We observed the activities of 222Rn and 220Rn between the following voltages, in
KV: 0.1, 0, 0.5, 5. Through these voltages we see no change in 210Po activity, which
verifies the notion that 210Pb is plated out on the photodiode surface. 214Po responds as we
would expect from efficiency measurement runs, with very little 214Po collected at 0 and
0.1 KV and a fairly rapid rise in collection starting at 0.5 KV.
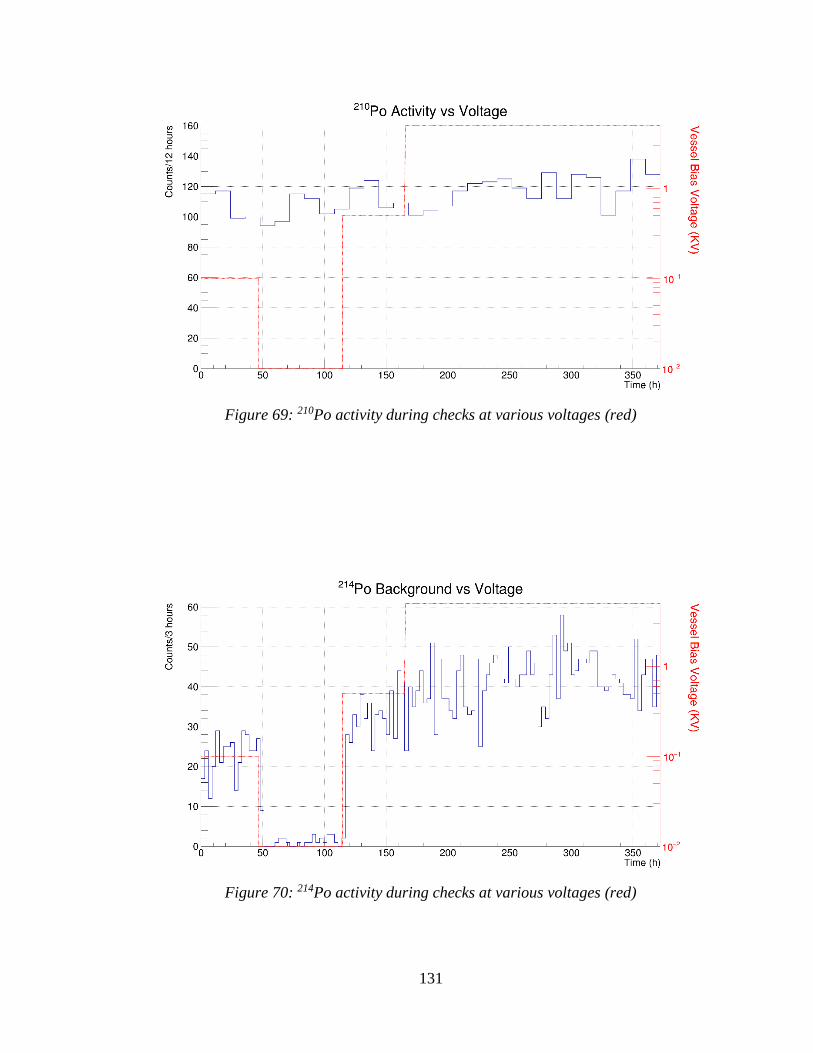
131
Figure 69: 210Po activity during checks at various voltages (red)
Figure 70: 214Po activity during checks at various voltages (red)
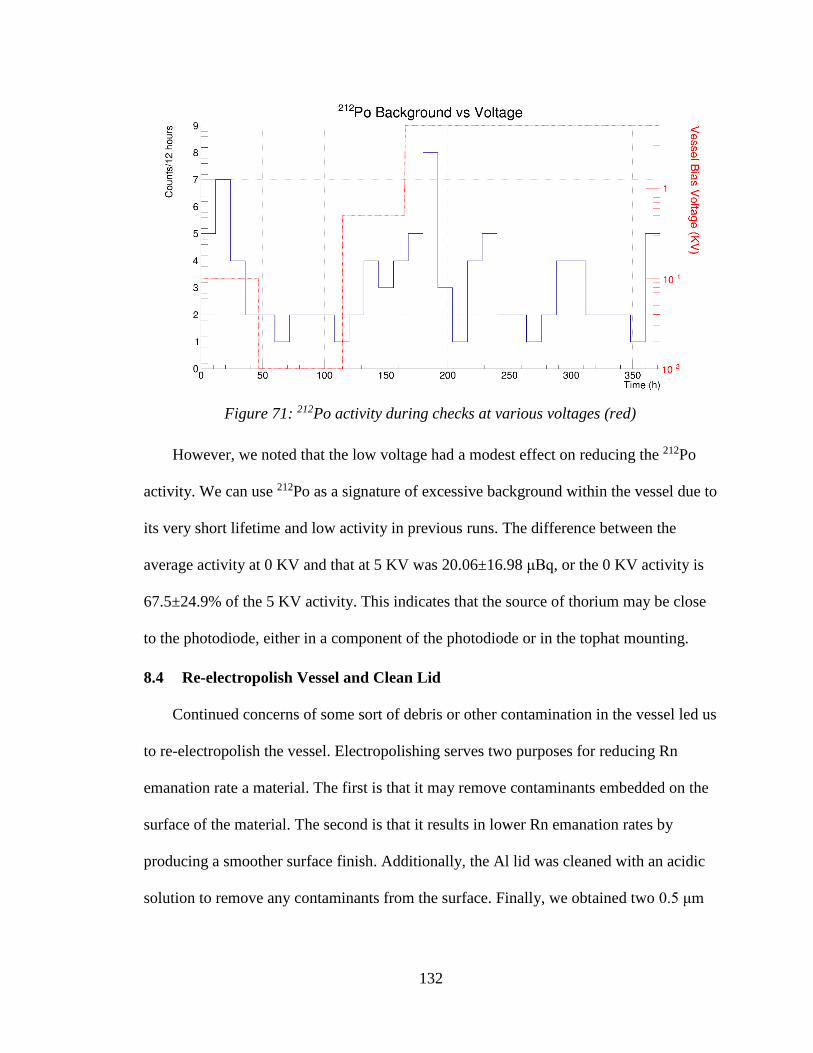
132
However, we noted that the low voltage had a modest effect on reducing the 212Po
activity. We can use 212Po as a signature of excessive background within the vessel due to
its very short lifetime and low activity in previous runs. The difference between the
average activity at 0 KV and that at 5 KV was 20.06±16.98 μBq, or the 0 KV activity is
67.5±24.9% of the 5 KV activity. This indicates that the source of thorium may be close
to the photodiode, either in a component of the photodiode or in the tophat mounting.
8.4 Re-electropolish Vessel and Clean Lid
Continued concerns of some sort of debris or other contamination in the vessel led us
to re-electropolish the vessel. Electropolishing serves two purposes for reducing Rn
emanation rate a material. The first is that it may remove contaminants embedded on the
surface of the material. The second is that it results in lower Rn emanation rates by
producing a smoother surface finish. Additionally, the Al lid was cleaned with an acidic
solution to remove any contaminants from the surface. Finally, we obtained two 0.5 μm
Figure 71: 212Po activity during checks at various voltages (red)
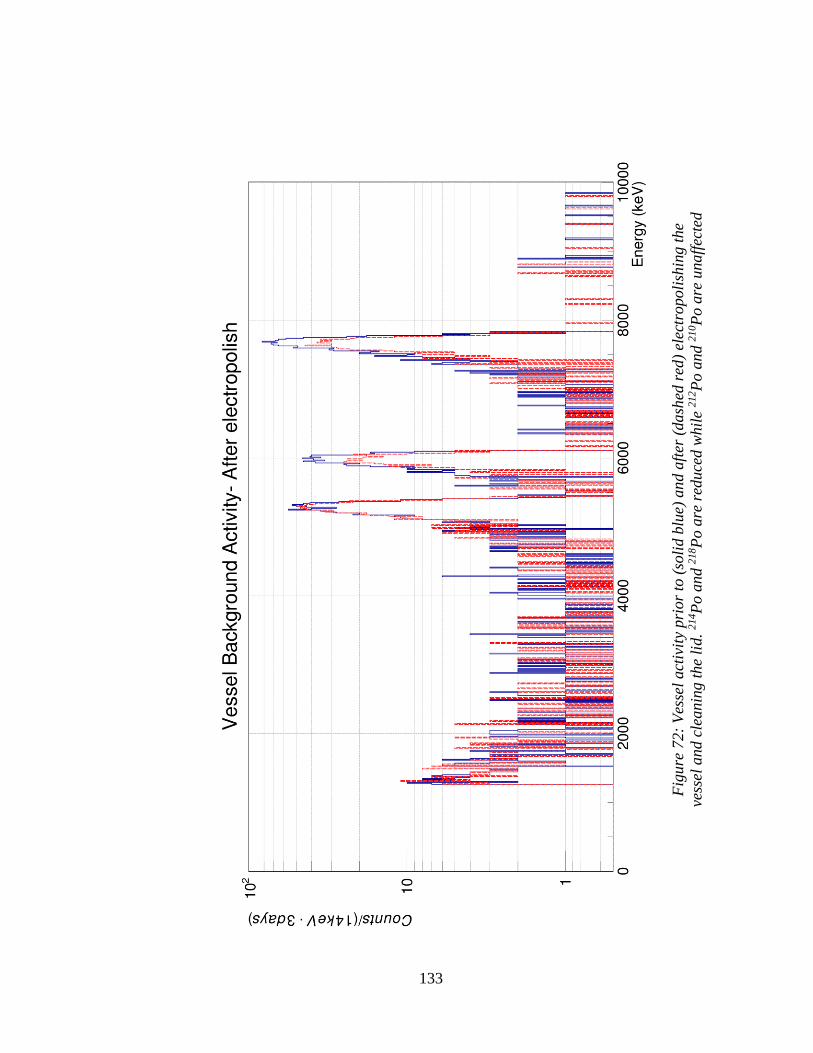
133
Fig
ure
72:
Ves
sel
act
ivit
y pri
or
to (
soli
d b
lue)
an
d a
fter
(dash
ed r
ed)
elec
tropoli
shin
g t
he
vess
el a
nd c
leanin
g t
he
lid.
214P
o a
nd 2
18P
o a
re r
educe
d w
hil
e 2
12P
o a
nd 2
10P
o a
re u
naff
ecte
d
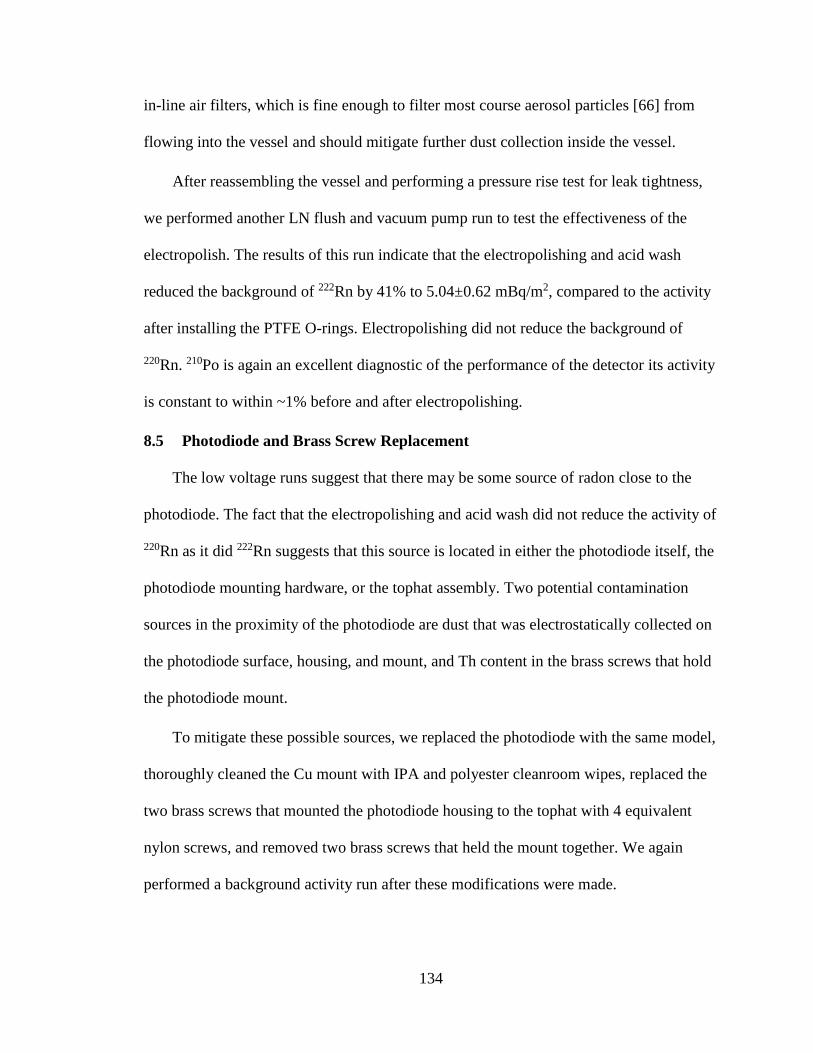
134
in-line air filters, which is fine enough to filter most course aerosol particles [66] from
flowing into the vessel and should mitigate further dust collection inside the vessel.
After reassembling the vessel and performing a pressure rise test for leak tightness,
we performed another LN flush and vacuum pump run to test the effectiveness of the
electropolish. The results of this run indicate that the electropolishing and acid wash
reduced the background of 222Rn by 41% to 5.04±0.62 mBq/m2, compared to the activity
after installing the PTFE O-rings. Electropolishing did not reduce the background of
220Rn. 210Po is again an excellent diagnostic of the performance of the detector its activity
is constant to within ~1% before and after electropolishing.
8.5 Photodiode and Brass Screw Replacement
The low voltage runs suggest that there may be some source of radon close to the
photodiode. The fact that the electropolishing and acid wash did not reduce the activity of
220Rn as it did 222Rn suggests that this source is located in either the photodiode itself, the
photodiode mounting hardware, or the tophat assembly. Two potential contamination
sources in the proximity of the photodiode are dust that was electrostatically collected on
the photodiode surface, housing, and mount, and Th content in the brass screws that hold
the photodiode mount.
To mitigate these possible sources, we replaced the photodiode with the same model,
thoroughly cleaned the Cu mount with IPA and polyester cleanroom wipes, replaced the
two brass screws that mounted the photodiode housing to the tophat with 4 equivalent
nylon screws, and removed two brass screws that held the mount together. We again
performed a background activity run after these modifications were made.
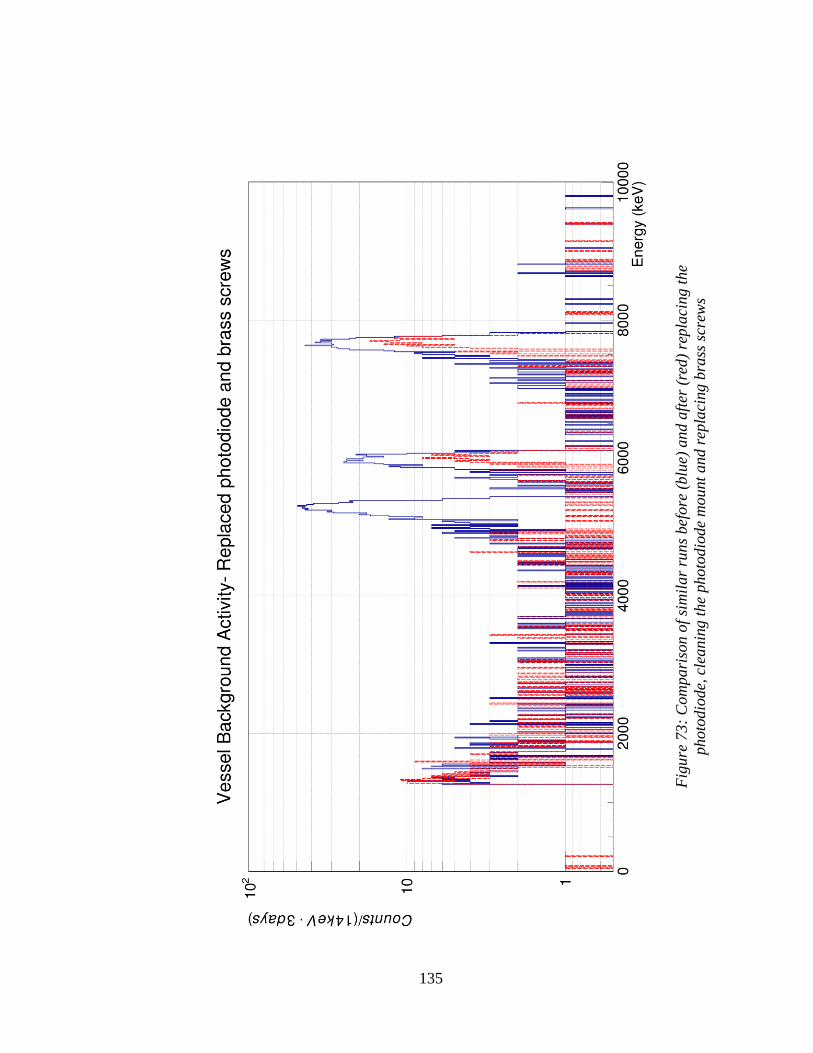
135
Fig
ure
73:
Com
pari
son o
f si
mil
ar
runs
bef
ore
(blu
e) a
nd a
fter
(re
d)
repla
cing t
he
photo
dio
de,
cle
anin
g t
he
photo
dio
de
mount
and r
epla
cing b
rass
scr
ews
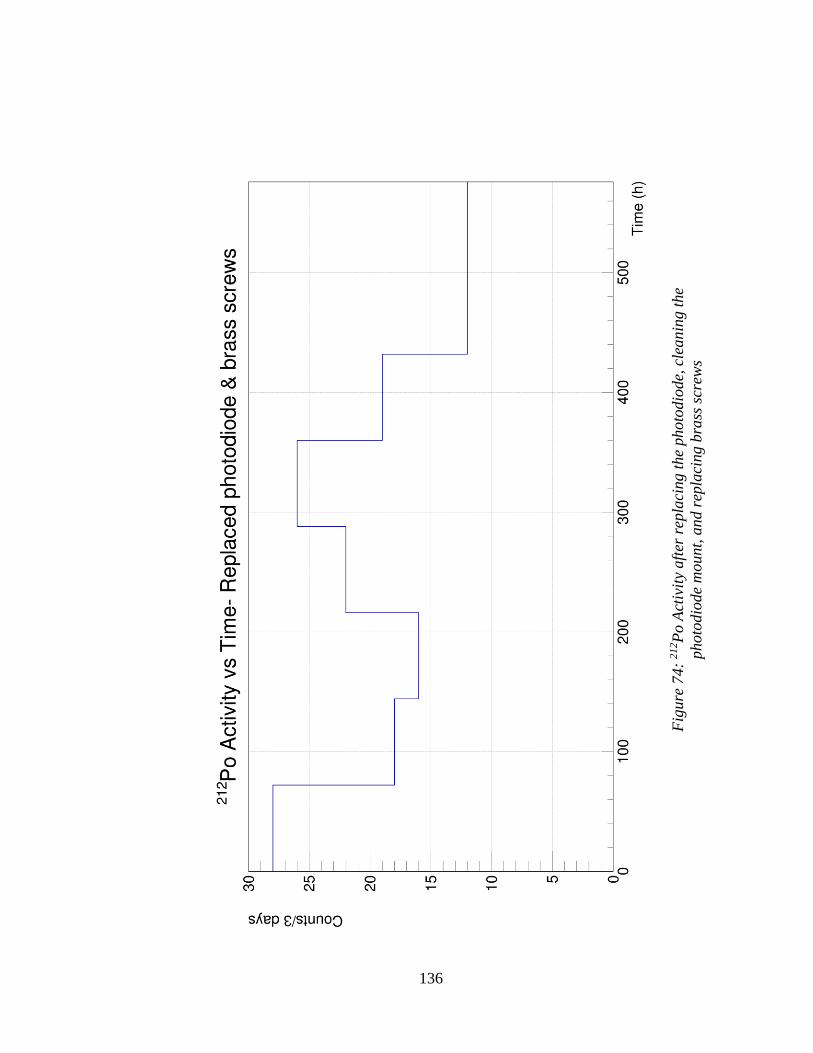
136
Fig
ure
74:
21
2P
o A
ctiv
ity
aft
er r
epla
cing t
he
photo
dio
de,
cle
anin
g t
he
photo
dio
de
mount,
and r
epla
cing b
rass
scr
ews
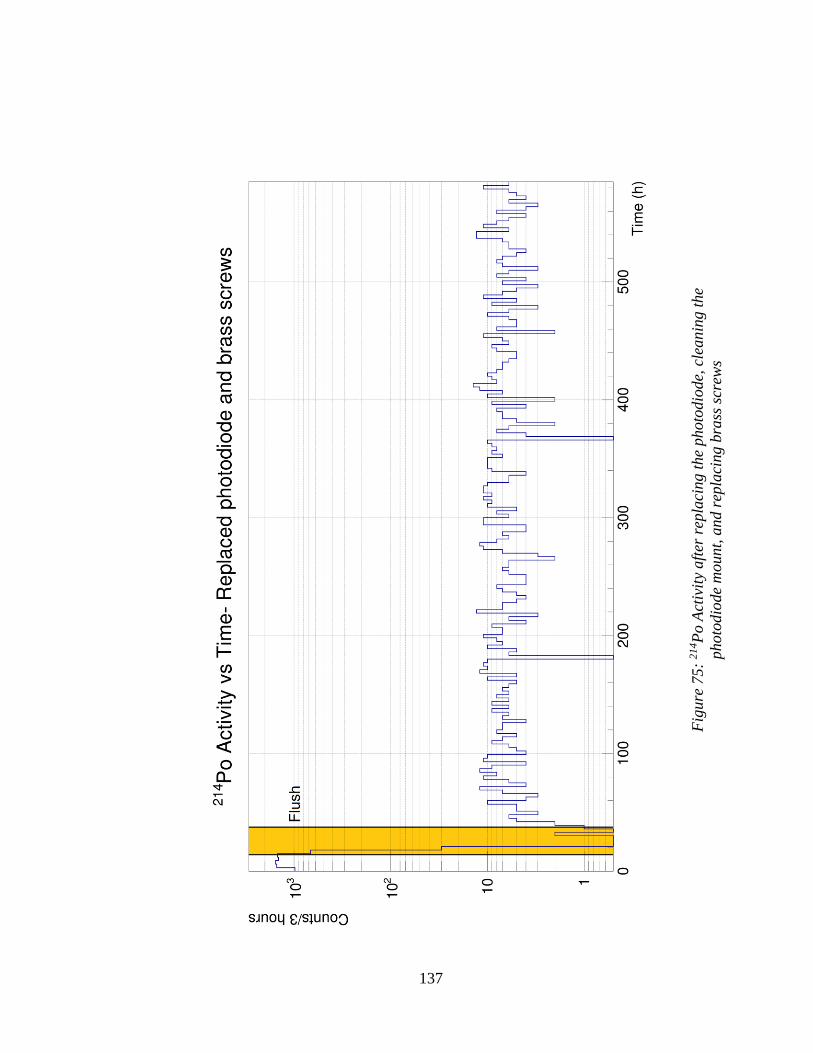
137
Fig
ure
75:
21
4P
o A
ctiv
ity
aft
er r
epla
cing t
he
photo
dio
de,
cle
anin
g t
he
photo
dio
de
mount,
and r
epla
cing b
rass
scr
ews
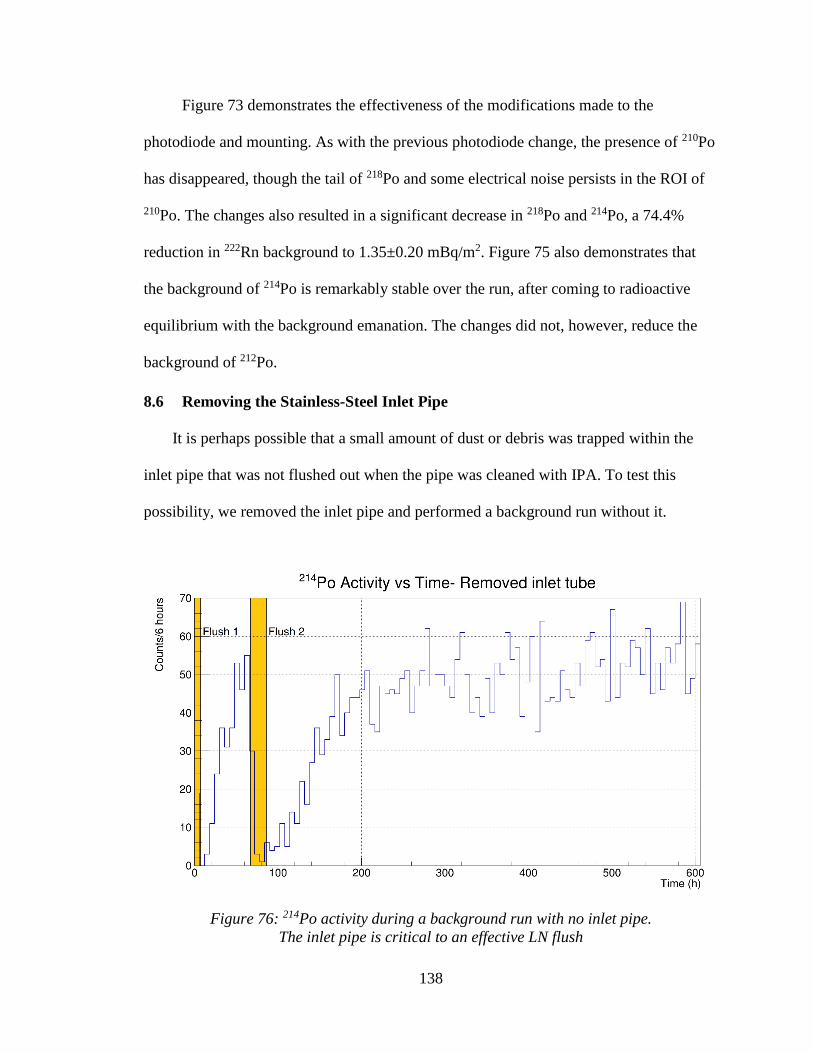
138
Figure 73 demonstrates the effectiveness of the modifications made to the
photodiode and mounting. As with the previous photodiode change, the presence of 210Po
has disappeared, though the tail of 218Po and some electrical noise persists in the ROI of
210Po. The changes also resulted in a significant decrease in 218Po and 214Po, a 74.4%
reduction in 222Rn background to 1.35±0.20 mBq/m2. Figure 75 also demonstrates that
the background of 214Po is remarkably stable over the run, after coming to radioactive
equilibrium with the background emanation. The changes did not, however, reduce the
background of 212Po.
8.6 Removing the Stainless-Steel Inlet Pipe
It is perhaps possible that a small amount of dust or debris was trapped within the
inlet pipe that was not flushed out when the pipe was cleaned with IPA. To test this
possibility, we removed the inlet pipe and performed a background run without it.
Figure 76: 214Po activity during a background run with no inlet pipe.
The inlet pipe is critical to an effective LN flush
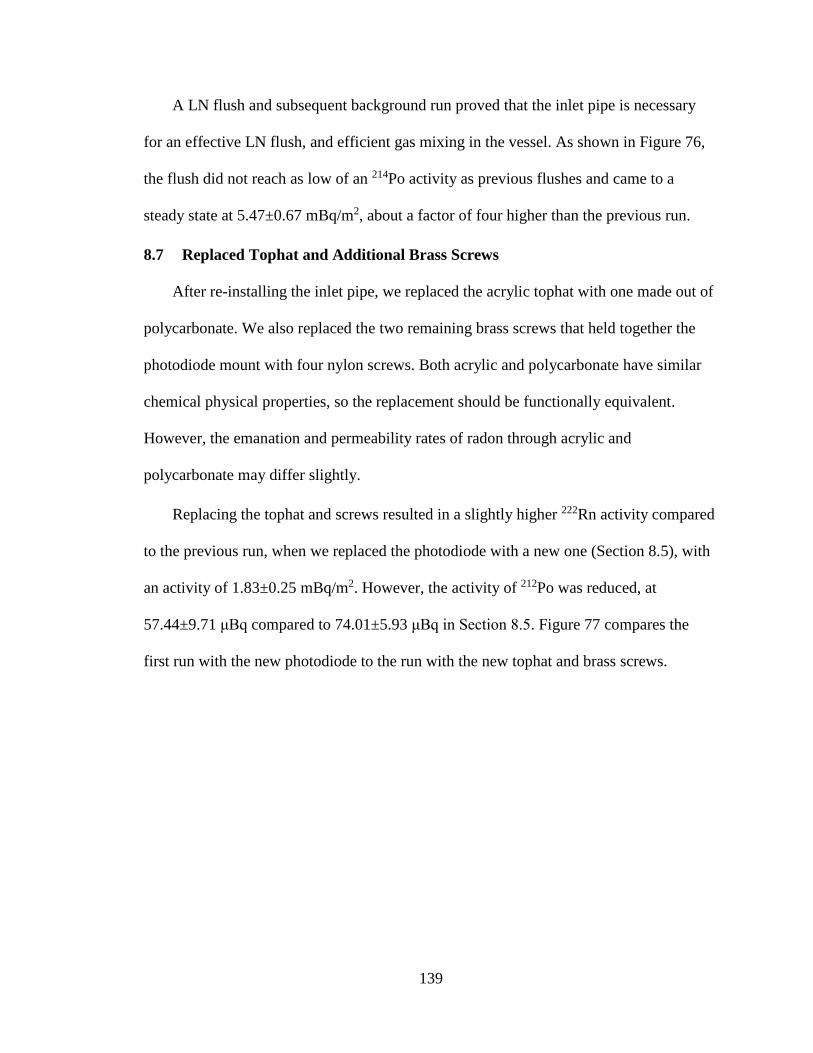
139
A LN flush and subsequent background run proved that the inlet pipe is necessary
for an effective LN flush, and efficient gas mixing in the vessel. As shown in Figure 76,
the flush did not reach as low of an 214Po activity as previous flushes and came to a
steady state at 5.47±0.67 mBq/m2, about a factor of four higher than the previous run.
8.7 Replaced Tophat and Additional Brass Screws
After re-installing the inlet pipe, we replaced the acrylic tophat with one made out of
polycarbonate. We also replaced the two remaining brass screws that held together the
photodiode mount with four nylon screws. Both acrylic and polycarbonate have similar
chemical physical properties, so the replacement should be functionally equivalent.
However, the emanation and permeability rates of radon through acrylic and
polycarbonate may differ slightly.
Replacing the tophat and screws resulted in a slightly higher 222Rn activity compared
to the previous run, when we replaced the photodiode with a new one (Section 8.5), with
an activity of 1.83±0.25 mBq/m2. However, the activity of 212Po was reduced, at
57.44±9.71 μBq compared to 74.01±5.93 μBq in Section 8.5. Figure 77 compares the
first run with the new photodiode to the run with the new tophat and brass screws.
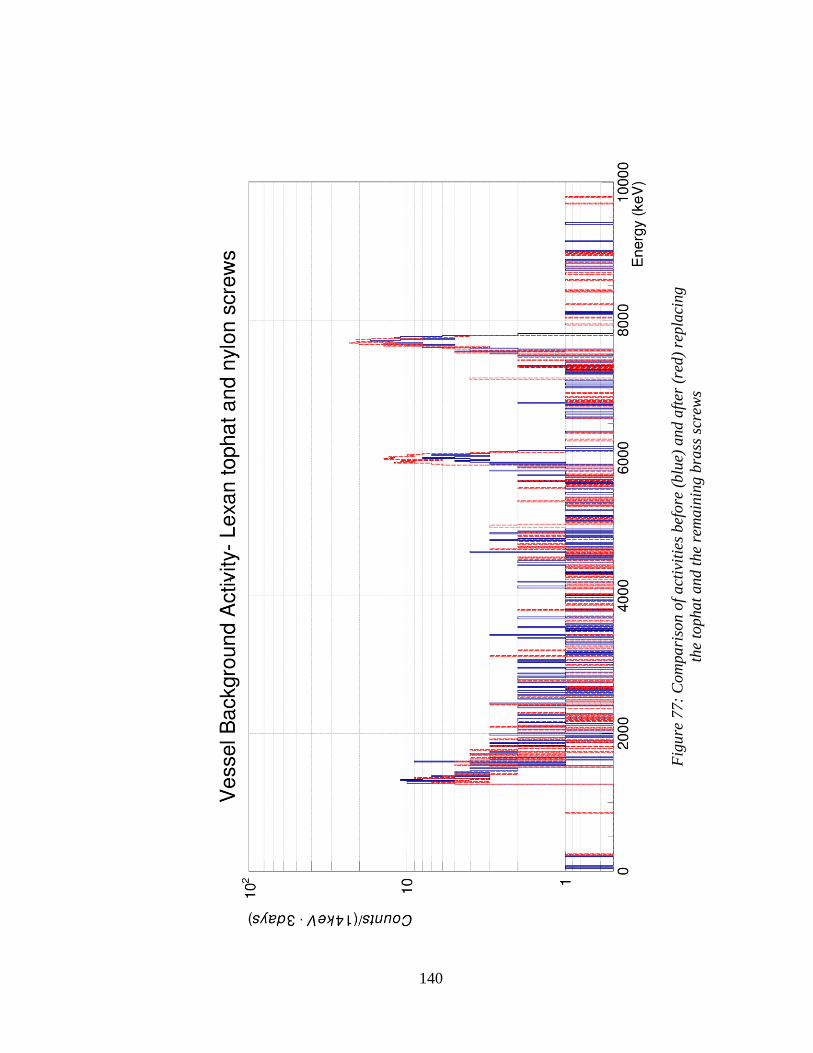
140
Fig
ure
77:
Com
pari
son o
f act
ivit
ies
bef
ore
(blu
e) a
nd a
fter
(re
d)
rep
laci
ng
the
tophat
and t
he
rem
ain
ing b
rass
scr
ews
141
8.8 Replaced Electropolished Stainless Steel Inlet Pipe
Following the success in reducing the background rate of the vessel by
electropolishing and establishing that the inlet pipe is critical to a low-background
measurement, we obtained a new electropolished stainless steel inlet pipe in the same
shape and design as the previous inlet (Figure 12). This did indeed reduce the 222Rn
background to 1.17±0.18 mBq/m2, the lowest measurement yet for the intrinsic 222Rn
background of the vessel. The 212Po activity was slightly higher than previously, at
81.52±11.09 μBq.
After replacing the inlet tube the only components unchanged from the original
design of the detector and exposed to the interior of the vessel are the Cu photodiode
mount housing, the photodiode wires, and the tophat D-SUB feedthrough flange.
Persistent background activity could originate in those components or elsewhere such as
in electrical solder above the photodiode or the vessel wall welds.
8.9 Background Activity Measurement with Emanation Chamber
In the final background measurement run, we connected the empty 2.95L emanation
chamber and an 8 L/min [67] diaphragm pump to the vessel to measure the background
of the emanation chamber and pump in addition to the vessel. The chamber is intended to
hold samples for measurement. The pump is to circulate gas in the system, or more
specifically to flow Rn-bearing gas emanated from a sample inside the emanation
chamber, to the detection vessel. The results of that run, and a summary of all previous
background runs are shown in Table 4.
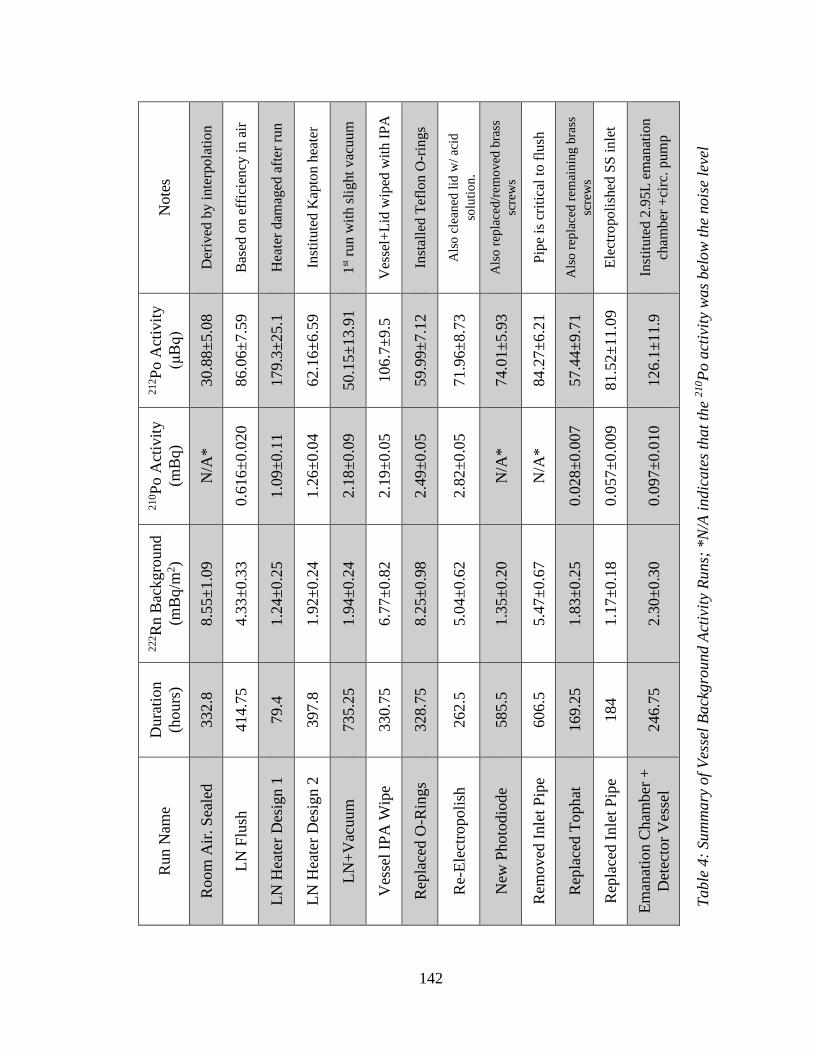
142
Note
s
Der
ived
by
in
terp
ola
tio
n
Bas
ed o
n e
ffic
ien
cy i
n a
ir
Hea
ter
dam
aged
aft
er r
un
Inst
itu
ted
Kap
ton
hea
ter
1st r
un
wit
h s
lig
ht
vac
uu
m
Ves
sel+
Lid
wip
ed w
ith
IP
A
Inst
alle
d T
eflo
n O
-rin
gs
Als
o c
lean
ed l
id w
/ ac
id
solu
tio
n.
Als
o r
epla
ced
/rem
ov
ed b
rass
scre
ws
Pip
e is
cri
tica
l to
flu
sh
Als
o r
epla
ced
rem
ain
ing
bra
ss
scre
ws
Ele
ctro
po
lish
ed S
S i
nle
t
Inst
itu
ted
2.9
5L
em
anat
ion
cham
ber
+ci
rc.
pum
p
212P
o A
ctiv
ity
(μB
q)
30.8
8±
5.0
8
86.0
6±
7.5
9
179.3
±25.1
62.1
6±
6.5
9
50.1
5±
13.9
1
106.7
±9.5
59.9
9±
7.1
2
71.9
6±
8.7
3
74.0
1±
5.9
3
84.2
7±
6.2
1
57.4
4±
9.7
1
81.5
2±
11.0
9
126.1
±11.9
210P
o A
ctiv
ity
(mB
q)
N/A
*
0.6
16±
0.0
20
1.0
9±
0.1
1
1.2
6±
0.0
4
2.1
8±
0.0
9
2.1
9±
0.0
5
2.4
9±
0.0
5
2.8
2±
0.0
5
N/A
*
N/A
*
0.0
28±
0.0
07
0.0
57±
0.0
09
0.0
97±
0.0
10
222R
n B
ackgro
und
(mB
q/m
2)
8.5
5±
1.0
9
4.3
3±
0.3
3
1.2
4±
0.2
5
1.9
2±
0.2
4
1.9
4±
0.2
4
6.7
7±
0.8
2
8.2
5±
0.9
8
5.0
4±
0.6
2
1.3
5±
0.2
0
5.4
7±
0.6
7
1.8
3±
0.2
5
1.1
7±
0.1
8
2.3
0±
0.3
0
Dura
tion
(hours
)
332.8
414.7
5
79.4
397.8
735.2
5
330.7
5
328.7
5
262.5
585.5
606.5
169.2
5
184
246.7
5
Run N
ame
Ro
om
Air
. S
eale
d
LN
Flu
sh
LN
Hea
ter
Des
ign 1
LN
Hea
ter
Des
ign 2
LN
+V
acuum
Ves
sel
IPA
Wip
e
Rep
lace
d O
-Rin
gs
Re-
Ele
ctro
poli
sh
New
Photo
dio
de
Rem
oved
Inle
t P
ipe
Rep
lace
d T
oph
at
Rep
lace
d I
nle
t P
ipe
Em
anat
ion C
ham
ber
+
Det
ecto
r V
esse
l
Table
4:
Sum
mary
of
Ves
sel
Ba
ckgro
und A
ctiv
ity
Runs;
*N
/A i
ndic
ate
s th
at
the
210P
o a
ctiv
ity
was
bel
ow
the
nois
e le
vel
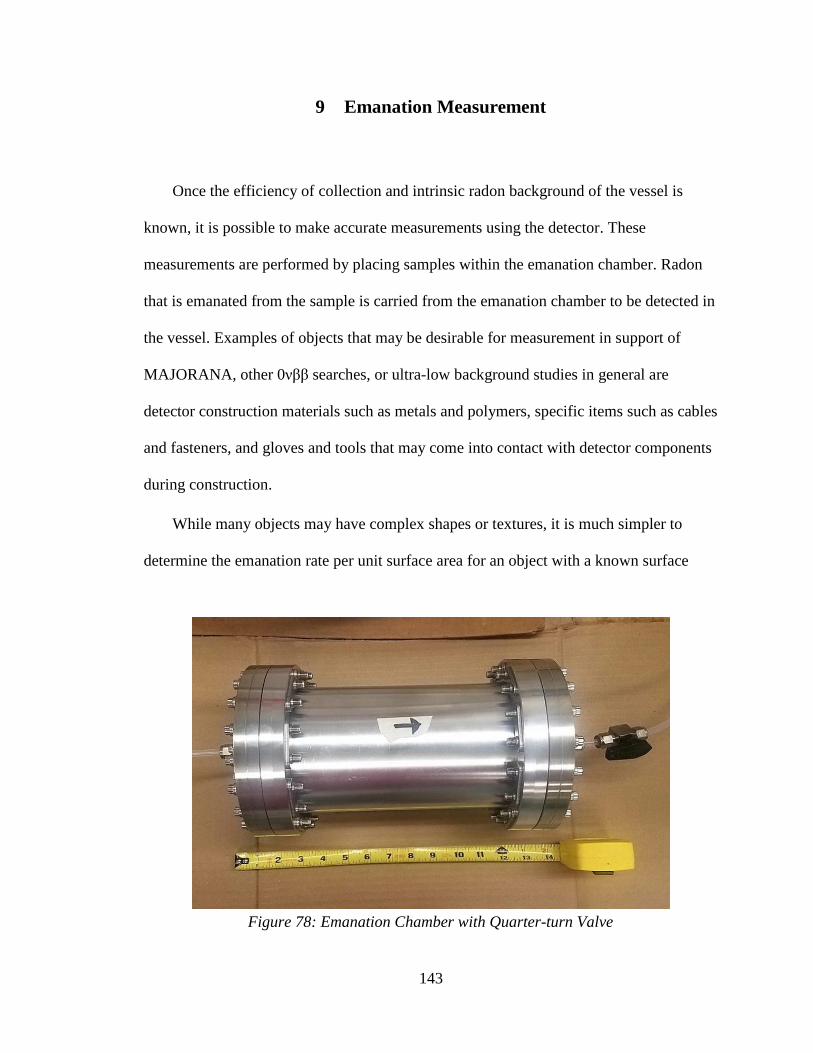
143
9 Emanation Measurement
Once the efficiency of collection and intrinsic radon background of the vessel is
known, it is possible to make accurate measurements using the detector. These
measurements are performed by placing samples within the emanation chamber. Radon
that is emanated from the sample is carried from the emanation chamber to be detected in
the vessel. Examples of objects that may be desirable for measurement in support of
MAJORANA, other 0νββ searches, or ultra-low background studies in general are
detector construction materials such as metals and polymers, specific items such as cables
and fasteners, and gloves and tools that may come into contact with detector components
during construction.
While many objects may have complex shapes or textures, it is much simpler to
determine the emanation rate per unit surface area for an object with a known surface
Figure 78: Emanation Chamber with Quarter-turn Valve
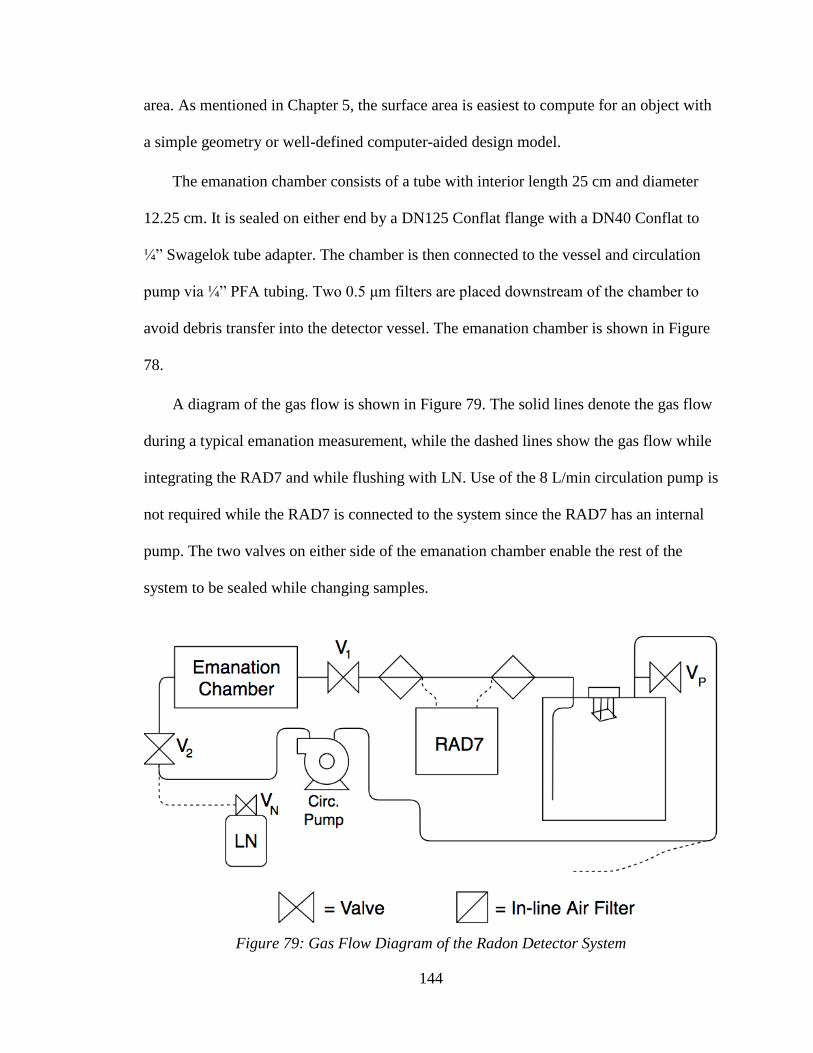
144
area. As mentioned in Chapter 5, the surface area is easiest to compute for an object with
a simple geometry or well-defined computer-aided design model.
The emanation chamber consists of a tube with interior length 25 cm and diameter
12.25 cm. It is sealed on either end by a DN125 Conflat flange with a DN40 Conflat to
¼” Swagelok tube adapter. The chamber is then connected to the vessel and circulation
pump via ¼” PFA tubing. Two 0.5 μm filters are placed downstream of the chamber to
avoid debris transfer into the detector vessel. The emanation chamber is shown in Figure
78.
A diagram of the gas flow is shown in Figure 79. The solid lines denote the gas flow
during a typical emanation measurement, while the dashed lines show the gas flow while
integrating the RAD7 and while flushing with LN. Use of the 8 L/min circulation pump is
not required while the RAD7 is connected to the system since the RAD7 has an internal
pump. The two valves on either side of the emanation chamber enable the rest of the
system to be sealed while changing samples.
Figure 79: Gas Flow Diagram of the Radon Detector System
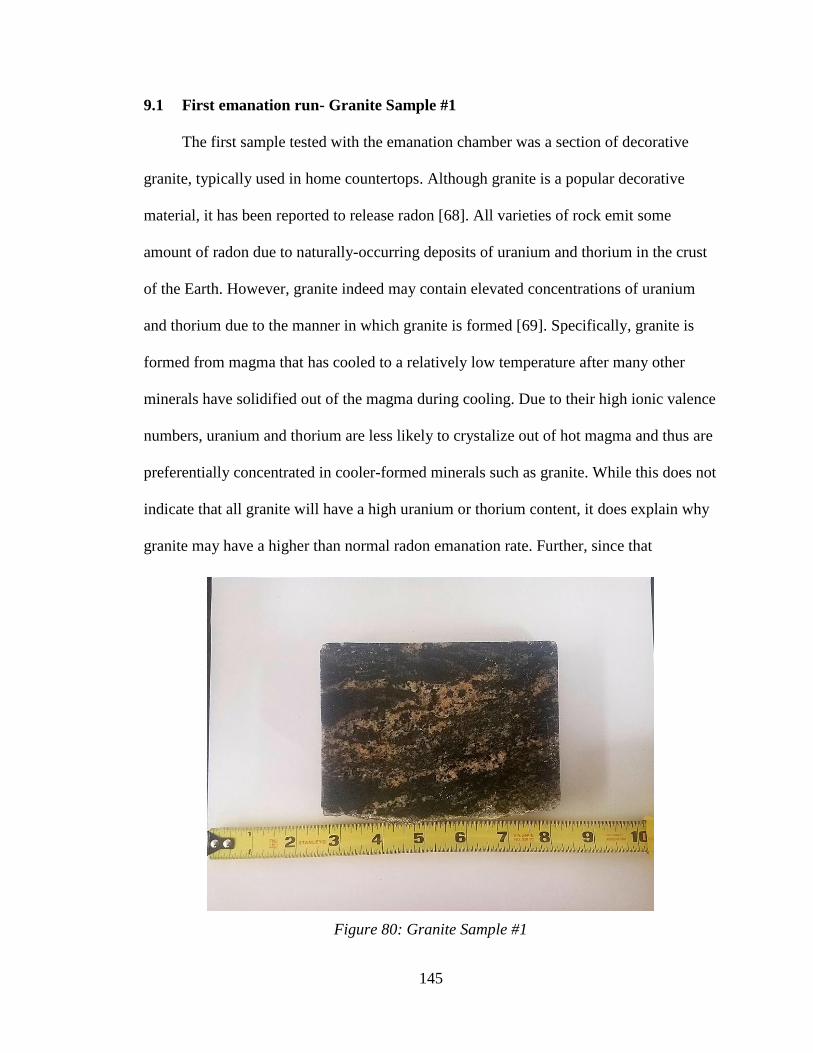
145
9.1 First emanation run- Granite Sample #1
The first sample tested with the emanation chamber was a section of decorative
granite, typically used in home countertops. Although granite is a popular decorative
material, it has been reported to release radon [68]. All varieties of rock emit some
amount of radon due to naturally-occurring deposits of uranium and thorium in the crust
of the Earth. However, granite indeed may contain elevated concentrations of uranium
and thorium due to the manner in which granite is formed [69]. Specifically, granite is
formed from magma that has cooled to a relatively low temperature after many other
minerals have solidified out of the magma during cooling. Due to their high ionic valence
numbers, uranium and thorium are less likely to crystalize out of hot magma and thus are
preferentially concentrated in cooler-formed minerals such as granite. While this does not
indicate that all granite will have a high uranium or thorium content, it does explain why
granite may have a higher than normal radon emanation rate. Further, since that
Figure 80: Granite Sample #1
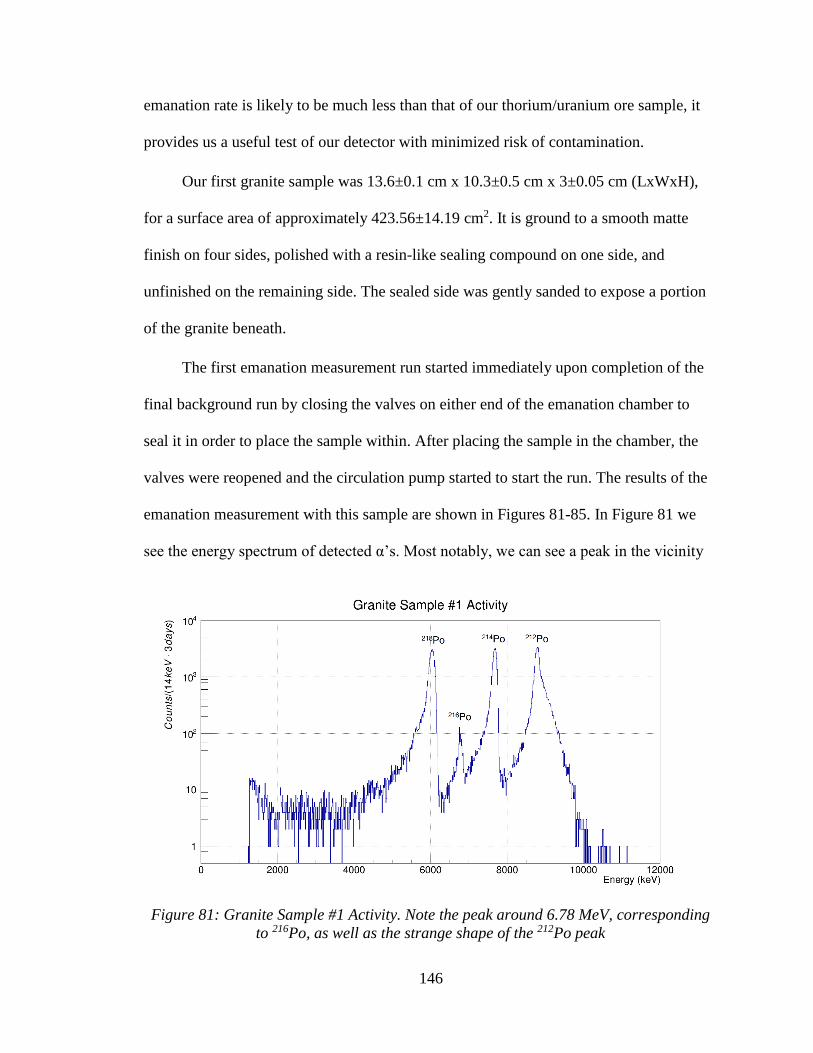
146
emanation rate is likely to be much less than that of our thorium/uranium ore sample, it
provides us a useful test of our detector with minimized risk of contamination.
Our first granite sample was 13.6±0.1 cm x 10.3±0.5 cm x 3±0.05 cm (LxWxH),
for a surface area of approximately 423.56±14.19 cm2. It is ground to a smooth matte
finish on four sides, polished with a resin-like sealing compound on one side, and
unfinished on the remaining side. The sealed side was gently sanded to expose a portion
of the granite beneath.
The first emanation measurement run started immediately upon completion of the
final background run by closing the valves on either end of the emanation chamber to
seal it in order to place the sample within. After placing the sample in the chamber, the
valves were reopened and the circulation pump started to start the run. The results of the
emanation measurement with this sample are shown in Figures 81-85. In Figure 81 we
see the energy spectrum of detected α’s. Most notably, we can see a peak in the vicinity
Figure 81: Granite Sample #1 Activity. Note the peak around 6.78 MeV, corresponding
to 216Po, as well as the strange shape of the 212Po peak
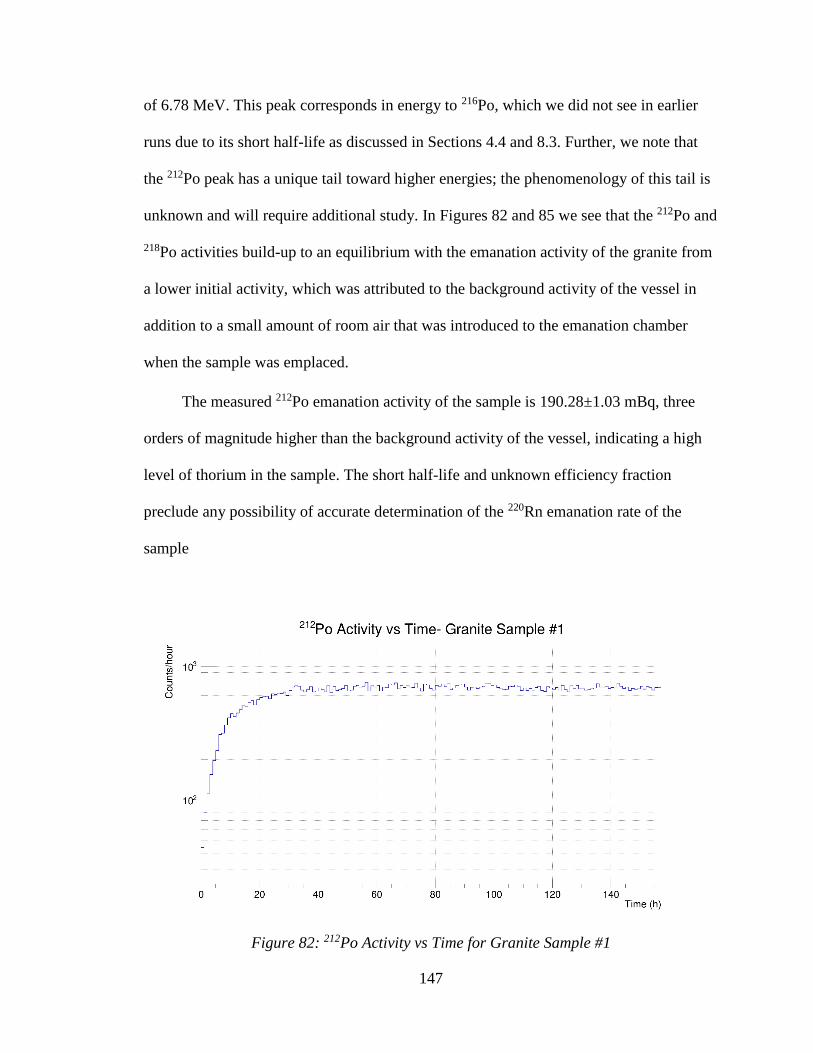
147
of 6.78 MeV. This peak corresponds in energy to 216Po, which we did not see in earlier
runs due to its short half-life as discussed in Sections 4.4 and 8.3. Further, we note that
the 212Po peak has a unique tail toward higher energies; the phenomenology of this tail is
unknown and will require additional study. In Figures 82 and 85 we see that the 212Po and
218Po activities build-up to an equilibrium with the emanation activity of the granite from
a lower initial activity, which was attributed to the background activity of the vessel in
addition to a small amount of room air that was introduced to the emanation chamber
when the sample was emplaced.
The measured 212Po emanation activity of the sample is 190.28±1.03 mBq, three
orders of magnitude higher than the background activity of the vessel, indicating a high
level of thorium in the sample. The short half-life and unknown efficiency fraction
preclude any possibility of accurate determination of the 220Rn emanation rate of the
sample
Figure 82: 212Po Activity vs Time for Granite Sample #1
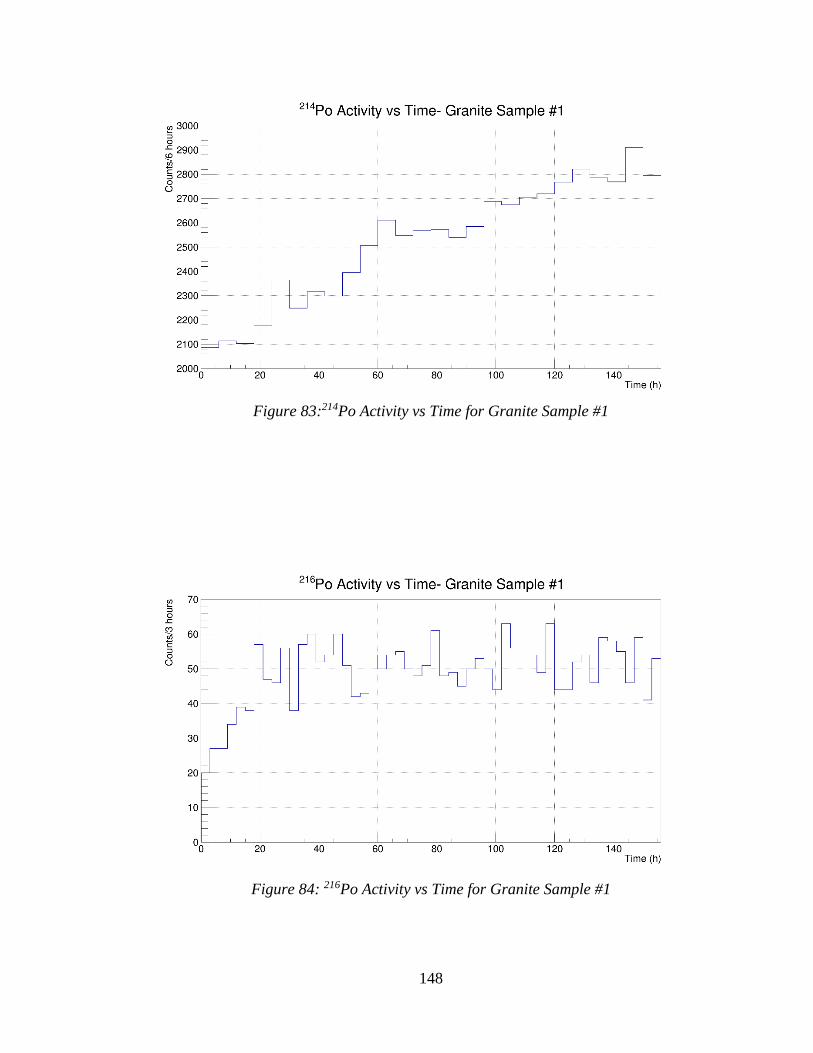
148
Figure 83:214Po Activity vs Time for Granite Sample #1
Figure 84: 216Po Activity vs Time for Granite Sample #1
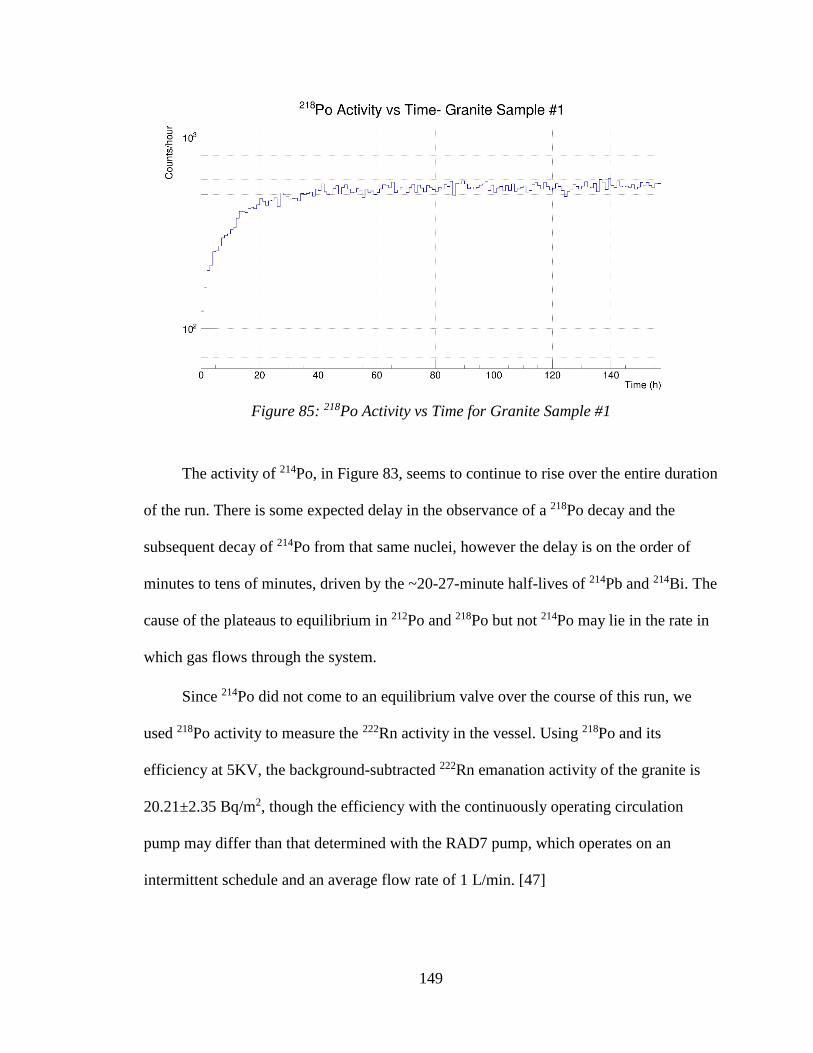
149
The activity of 214Po, in Figure 83, seems to continue to rise over the entire duration
of the run. There is some expected delay in the observance of a 218Po decay and the
subsequent decay of 214Po from that same nuclei, however the delay is on the order of
minutes to tens of minutes, driven by the ~20-27-minute half-lives of 214Pb and 214Bi. The
cause of the plateaus to equilibrium in 212Po and 218Po but not 214Po may lie in the rate in
which gas flows through the system.
Since 214Po did not come to an equilibrium valve over the course of this run, we
used 218Po activity to measure the 222Rn activity in the vessel. Using 218Po and its
efficiency at 5KV, the background-subtracted 222Rn emanation activity of the granite is
20.21±2.35 Bq/m2, though the efficiency with the continuously operating circulation
pump may differ than that determined with the RAD7 pump, which operates on an
intermittent schedule and an average flow rate of 1 L/min. [47]
Figure 85: 218Po Activity vs Time for Granite Sample #1
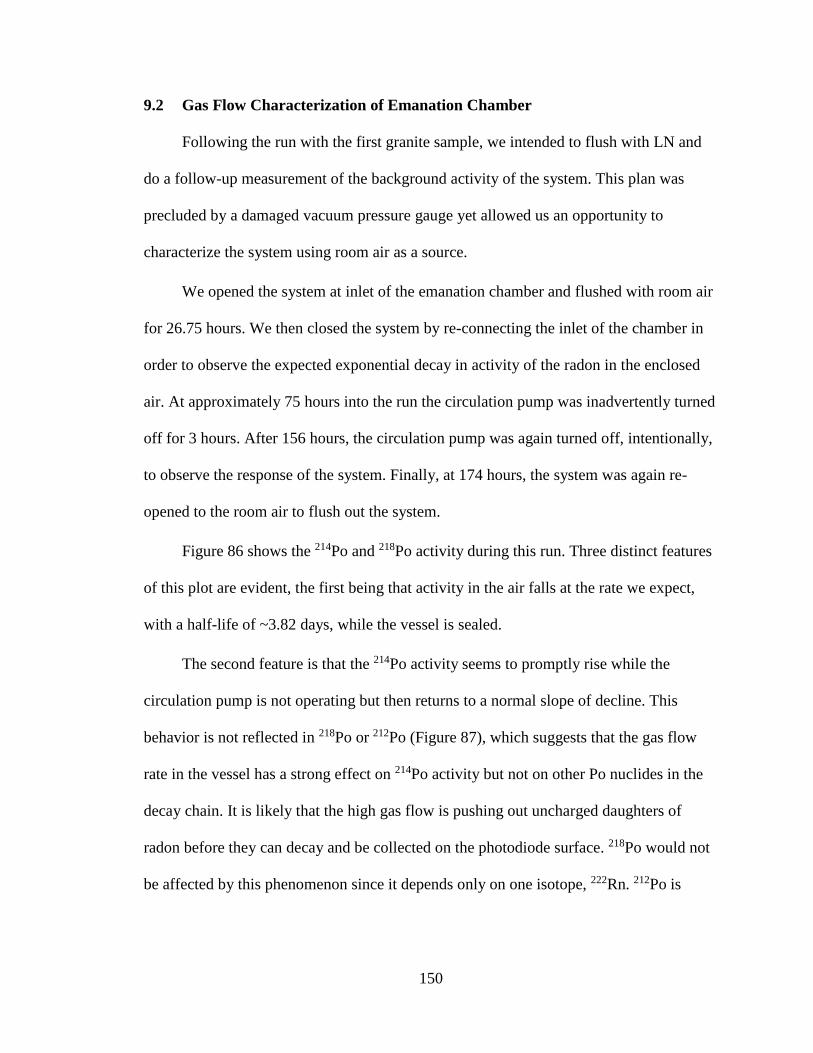
150
9.2 Gas Flow Characterization of Emanation Chamber
Following the run with the first granite sample, we intended to flush with LN and
do a follow-up measurement of the background activity of the system. This plan was
precluded by a damaged vacuum pressure gauge yet allowed us an opportunity to
characterize the system using room air as a source.
We opened the system at inlet of the emanation chamber and flushed with room air
for 26.75 hours. We then closed the system by re-connecting the inlet of the chamber in
order to observe the expected exponential decay in activity of the radon in the enclosed
air. At approximately 75 hours into the run the circulation pump was inadvertently turned
off for 3 hours. After 156 hours, the circulation pump was again turned off, intentionally,
to observe the response of the system. Finally, at 174 hours, the system was again re-
opened to the room air to flush out the system.
Figure 86 shows the 214Po and 218Po activity during this run. Three distinct features
of this plot are evident, the first being that activity in the air falls at the rate we expect,
with a half-life of ~3.82 days, while the vessel is sealed.
The second feature is that the 214Po activity seems to promptly rise while the
circulation pump is not operating but then returns to a normal slope of decline. This
behavior is not reflected in 218Po or 212Po (Figure 87), which suggests that the gas flow
rate in the vessel has a strong effect on 214Po activity but not on other Po nuclides in the
decay chain. It is likely that the high gas flow is pushing out uncharged daughters of
radon before they can decay and be collected on the photodiode surface. 218Po would not
be affected by this phenomenon since it depends only on one isotope, 222Rn. 212Po is
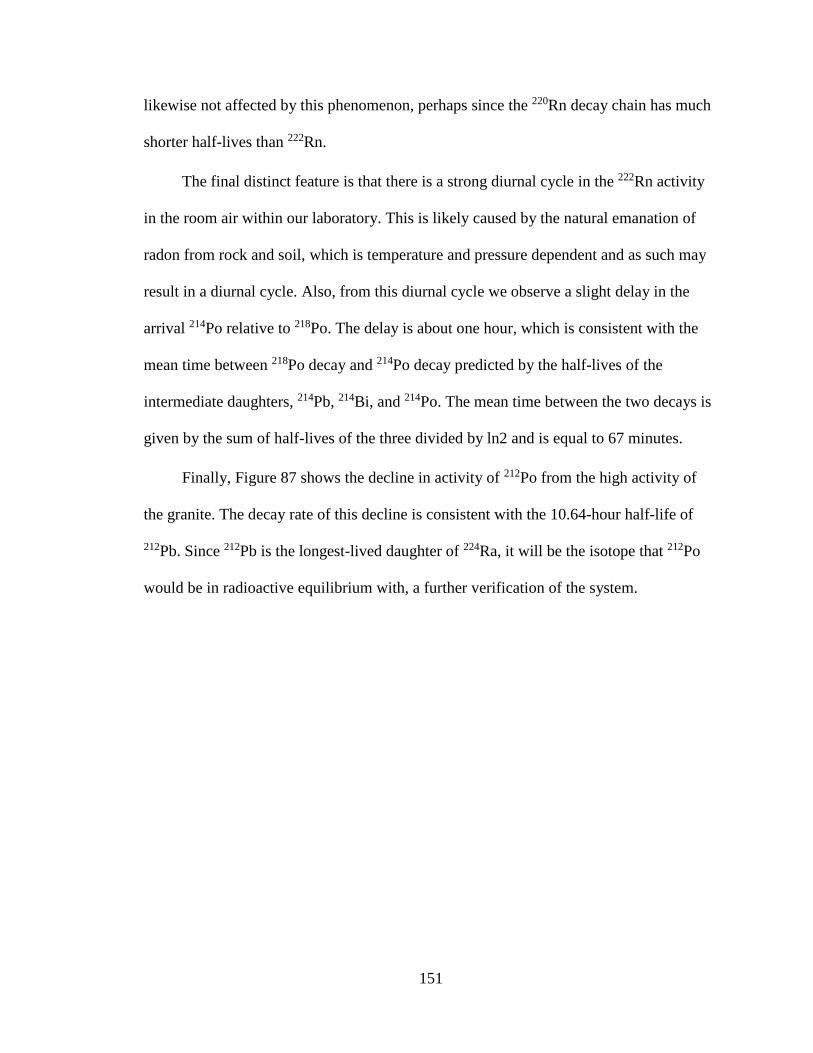
151
likewise not affected by this phenomenon, perhaps since the 220Rn decay chain has much
shorter half-lives than 222Rn.
The final distinct feature is that there is a strong diurnal cycle in the 222Rn activity
in the room air within our laboratory. This is likely caused by the natural emanation of
radon from rock and soil, which is temperature and pressure dependent and as such may
result in a diurnal cycle. Also, from this diurnal cycle we observe a slight delay in the
arrival 214Po relative to 218Po. The delay is about one hour, which is consistent with the
mean time between 218Po decay and 214Po decay predicted by the half-lives of the
intermediate daughters, 214Pb, 214Bi, and 214Po. The mean time between the two decays is
given by the sum of half-lives of the three divided by ln2 and is equal to 67 minutes.
Finally, Figure 87 shows the decline in activity of 212Po from the high activity of
the granite. The decay rate of this decline is consistent with the 10.64-hour half-life of
212Pb. Since 212Pb is the longest-lived daughter of 224Ra, it will be the isotope that 212Po
would be in radioactive equilibrium with, a further verification of the system.
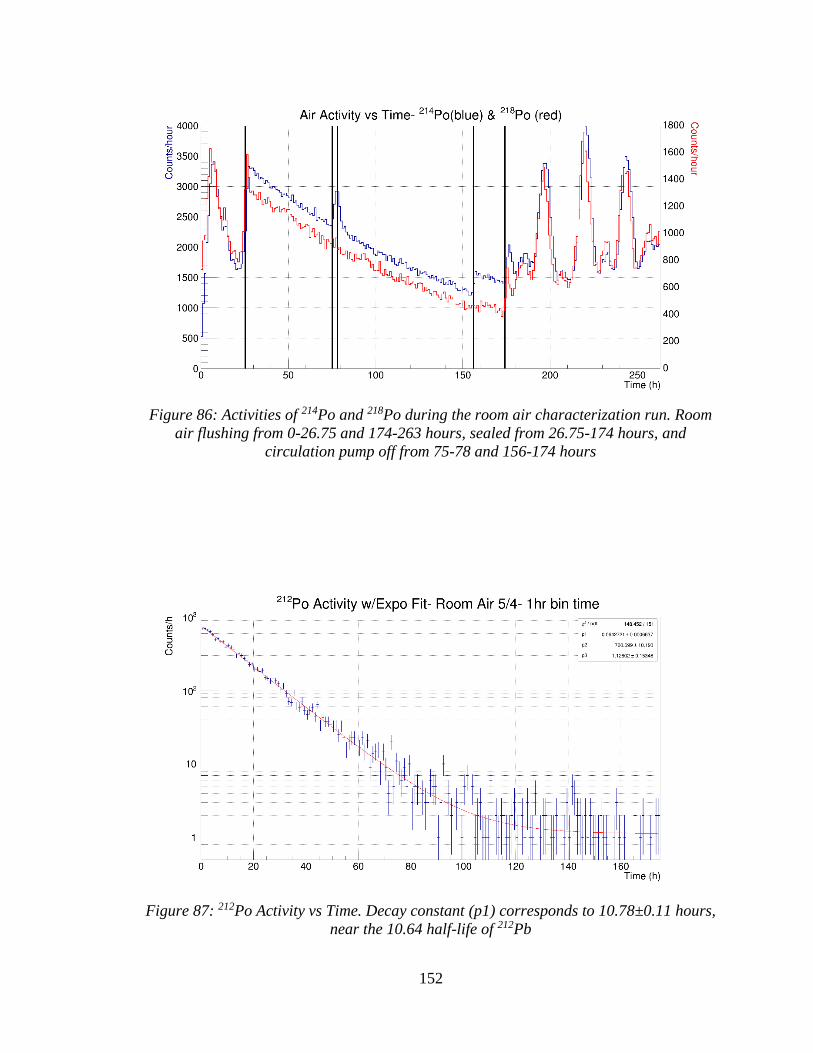
152
Figure 86: Activities of 214Po and 218Po during the room air characterization run. Room
air flushing from 0-26.75 and 174-263 hours, sealed from 26.75-174 hours, and
circulation pump off from 75-78 and 156-174 hours
Figure 87: 212Po Activity vs Time. Decay constant (p1) corresponds to 10.78±0.11 hours,
near the 10.64 half-life of 212Pb
153
9.3 Granite Sample #2
Following the room air flush run, we placed a new sample of granite into the
chamber. Like the first sample, the second was a showroom sample of a decorative
granite. The second sample originates from a different source than the first due to
differentiation in color and arrangement of crystals (Figure 88), suggesting a different
mineral composition. The source locations of both granite samples are unknown.
The second sample test began with the system sealed with room air. The count rate
of 218Po and 214Po, in Figures 89 and 90, initially followed an exponential decline due to
the decay of the high Rn content of room air. After an abbreviated LN flush of 6 hours,
the activity of 214Po and 218Po rose to an equilibrium due to the emanation rate of the
granite sample. Accordingly, the 222Rn emanation rate of the granite was determined to
be 6.62±0.78 Bq/m2 using the activity rate of 214Po with background subtracted. The
214Po activity was once again used since it indeed reached an equilibrium. Additionally,
the activity of 212Po was 31.25±0.42 mBq, which is about a third of the first granite
sample but still much higher than the background rate of the system.
Figure 88: Granite Sample #2
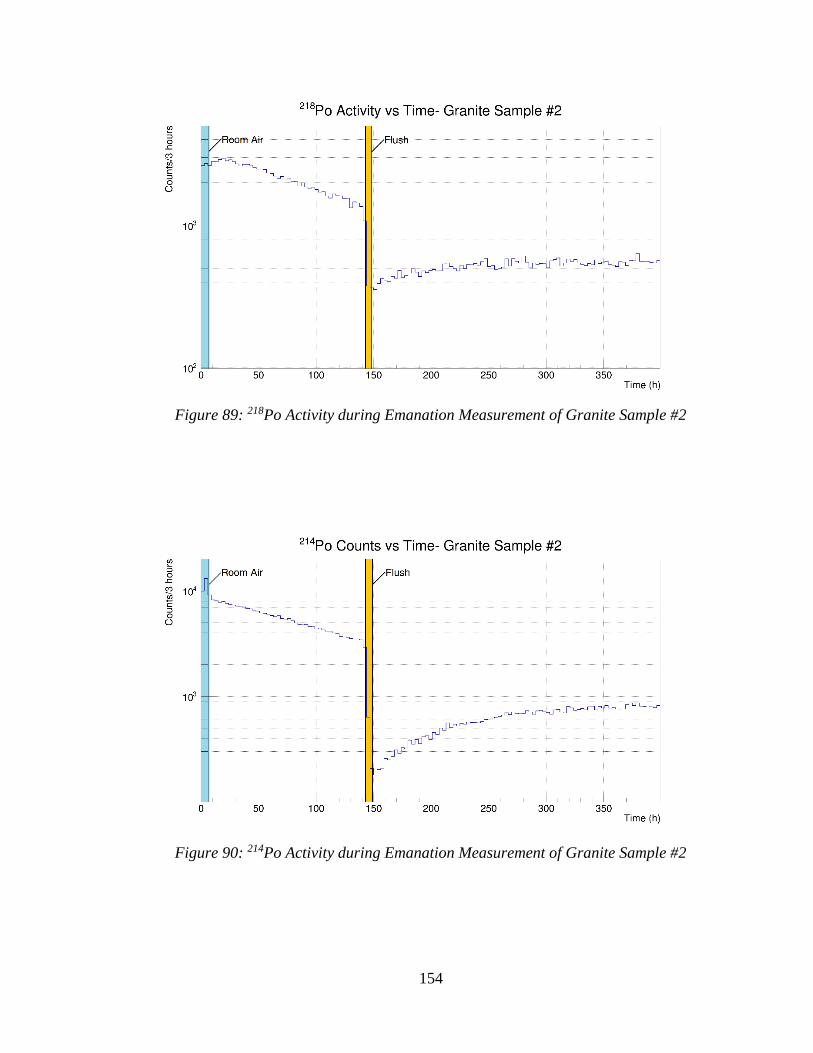
154
Figure 89: 218Po Activity during Emanation Measurement of Granite Sample #2
Figure 90: 214Po Activity during Emanation Measurement of Granite Sample #2
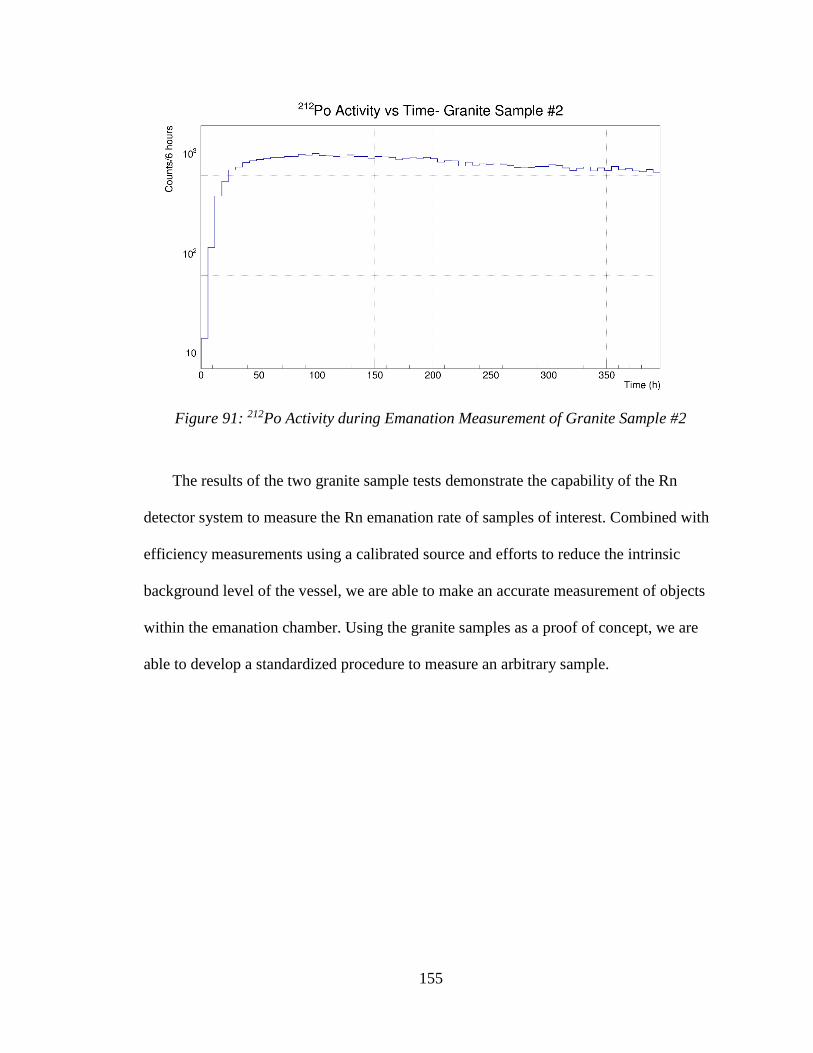
155
The results of the two granite sample tests demonstrate the capability of the Rn
detector system to measure the Rn emanation rate of samples of interest. Combined with
efficiency measurements using a calibrated source and efforts to reduce the intrinsic
background level of the vessel, we are able to make an accurate measurement of objects
within the emanation chamber. Using the granite samples as a proof of concept, we are
able to develop a standardized procedure to measure an arbitrary sample.
Figure 91: 212Po Activity during Emanation Measurement of Granite Sample #2
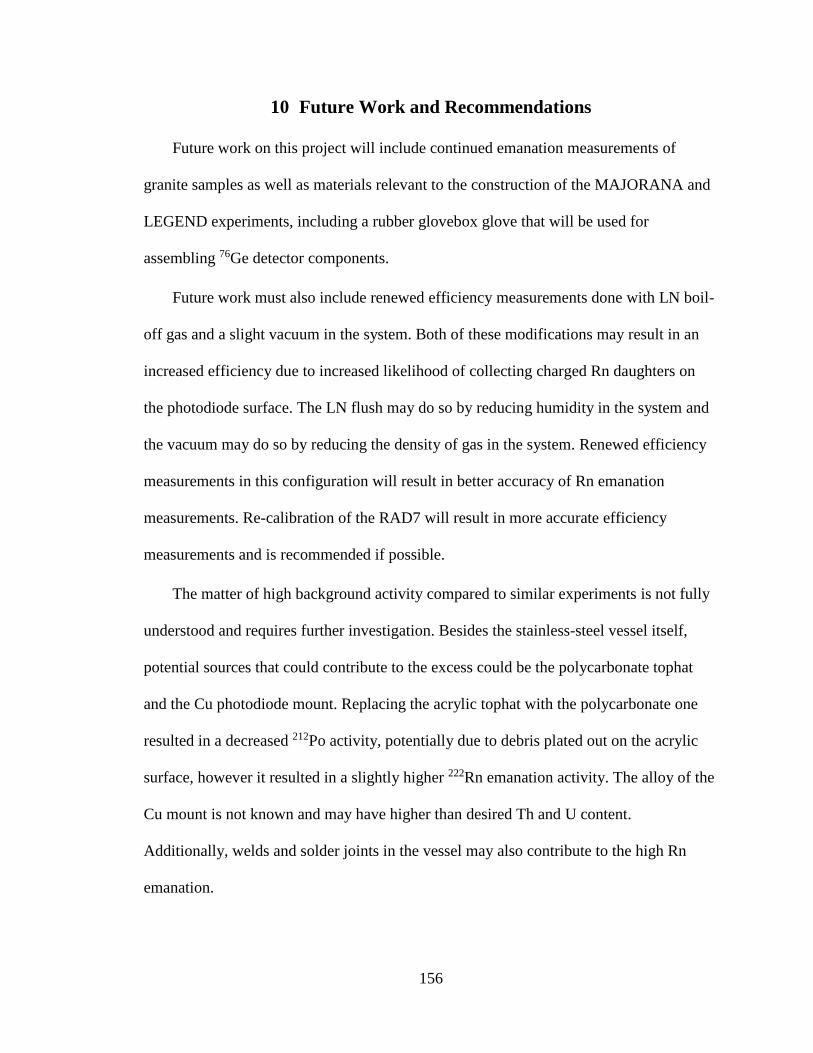
156
10 Future Work and Recommendations
Future work on this project will include continued emanation measurements of
granite samples as well as materials relevant to the construction of the MAJORANA and
LEGEND experiments, including a rubber glovebox glove that will be used for
assembling 76Ge detector components.
Future work must also include renewed efficiency measurements done with LN boil-
off gas and a slight vacuum in the system. Both of these modifications may result in an
increased efficiency due to increased likelihood of collecting charged Rn daughters on
the photodiode surface. The LN flush may do so by reducing humidity in the system and
the vacuum may do so by reducing the density of gas in the system. Renewed efficiency
measurements in this configuration will result in better accuracy of Rn emanation
measurements. Re-calibration of the RAD7 will result in more accurate efficiency
measurements and is recommended if possible.
The matter of high background activity compared to similar experiments is not fully
understood and requires further investigation. Besides the stainless-steel vessel itself,
potential sources that could contribute to the excess could be the polycarbonate tophat
and the Cu photodiode mount. Replacing the acrylic tophat with the polycarbonate one
resulted in a decreased 212Po activity, potentially due to debris plated out on the acrylic
surface, however it resulted in a slightly higher 222Rn emanation activity. The alloy of the
Cu mount is not known and may have higher than desired Th and U content.
Additionally, welds and solder joints in the vessel may also contribute to the high Rn
emanation.
157
11 Summary
The goal of this research project was to develop a high-sensitivity radon detector to
measure the radon emanation of materials for use in the Majorana Neutrinoless Double
Beta Decay Experiment and Large Enriched Germanium Experiment for Neutrinoless
Double Beta Decay. These experiments seek to find evidence of a very rare nuclear decay
process called neutrinoless double beta decay (0νββ). Evidence of this process
necessarily implies that the neutrino is its own anti-particle, a type of particle called a
Majorana particle. Evidence that the neutrino has a Majorana nature implies violation of
lepton number. Observation of 0νββ and determination of its lifetime would shed light on
the fundamental properties of the neutrino such as mass and mixing angles, the weak
nuclear process, and dynamics of the early universe. While one group has claimed to
observe this process, the claim has yet to be conclusively verified.
Any experiment that seeks to measure such a rare process requires great care to be
taken in understanding and mitigating the amount of background nuclear radiation in the
experiment. Very sensitive detectors are required to observe 0νββ and any amount of
background radiation may result in a diminished sensitivity of the detector to the
expected energy signature of 0νββ. One advantage of the search for 0νββ is the energy
signature. Single beta decay and two-neutrino double beta decay have a range in the
spectra of energies for the outgoing electrons, since neutrinos will have a variable share
of the net energy and momentum of the decay. The two electrons of 0νββ, however, will
have a combined energy that is constrained to a single value, the Q-value of the decay.
Efforts to reduce background radiation involve avoiding naturally-occurring and
man-made sources of radiation. The surface of the Earth has a relatively high amount of

158
radiation coming from extraterrestrial sources, as well as from anthropogenic and
primordial radioisotopes. Most sensitive nuclear detector experiments are placed deep
underground to shield from much of the radiation at the surface. Primordial radioisotopes
are persistent underground, however. Radon coming from 238U and 232Th specifically
provide a persistent source of background radiation, both on the surface of Earth and
underground.
Radon is the only daughter in the uranium and thorium decay chains that is gaseous.
It is able to escape rock, soil, and other material by flowing, or diffusing, through pores
and fissures in the material. Radon is most known as a health hazard in homes and
businesses since respiration of radon leads to a source of alpha and beta particles in the
lungs, which may cause cancer. Those same alpha and beta particles may also decay near
sensitive detectors, producing signatures similar to those being searched for.
This project used a radon detector that consists of a 191L electropolished stainless
steel vessel to collect radon-bearing gas and a high electrostatic field to collect charged
radon decay products on a Si PIN photodiode. Radon daughters that collect on the
photodiode will subsequently decay and, in the case of alpha-decays, produce an alpha
particle that may be detected. 214Po is the primary 222Rn daughter collected due to an
increased likelihood of collection, while 212Po is the primary daughter of 220Rn for the
same reason. Radon concentration in the gas is determined from the measured 214Po
activity by scaling it by an empirically measured collection efficiency value. The
collection efficiency was determined using room air and uranium- and thorium-bearing
rock as sources and a Durridge RAD7 commercial radon detector as a calibration
159
standard. Using the RAD7, the efficiency was determined as a function of the vessel bias
voltage, ranging between 0 kV and 10 kV.
In addition to the efficiency, it is also important to understand the background Rn
activity of the detector vessel itself. A lower background enables sensitive measurements
of Rn emanation. Background activity tests were performed by observing the fall in
activity of room air sealed in the vessel, by using boil-off liquid nitrogen (LN) to purge
all room air from the vessel and observing a rise in activity to the background level, and
by combining a boil-off LN flush with a moderate vacuum in the vessel. The boil-off LN
system used ambient heat transfer from the room to boil the LN as well as two external
heating designs, one using an immersion heater designed to boil water, and another using
an etched-foil heating element covered with Kapton film.
Higher than expected background activity measurements led us to replace or modify
several components of the vessel. Replacements included: solid PTFE O-rings for the
original rubber ones; a new, clean SiPIN photodiode replacing an identical model; nylon
photodiode mounting screws for brass ones; a tophat made of polycarbonate replacing an
acrylic one; and a clean, electropolished stainless-steel inlet pipe for one that was not
electropolished. Modified components included re-electropolishing the vessel, cleaning
the aluminum vessel lid with an acid solution, and installing two 0.5 μm in-line air filters.
Samples were measured for emanation by placing them in a 2.95L cylindrical
emanation chamber connected to the detector vessel by plastic polymer tubing and an 8
L/min circulation pump. Utilization of this detector in the construction and operation of
MAJORANA, LEGEND, or any other ultra-low background search, provides valuable
quantization of ambient radon backgrounds.
160
References
[1] S. Elliott and P. Vogel, “Double Beta Decay”, Ann. Rev. Nucl. Part. Sci. 52
(2002), 115-151
[2] H. Borgohain and M.K. Das, “Lepton Number Violation, Lepton Flavour
Violation and Baryogenesis in Left-Right Symmetric Model”, Phys. Rev. D 96 7
(2017), 075021
[3] J. L. Feng, “Dark Matter Candidates from Particle Physics and Methods of
Detection”, Ann. Rev. Astron. Astrophys. 48 (2010), 495
[4] P. A. M. Dirac, “The Quantum Theory of Electron," Proc. Roy. Soc. Lond. A 117
(1928) 610-624
[5] P. A. M. Dirac, “The Quantum Theory of Electron. Part II," Proc. Roy. Soc.
Lond. A 118 (1928), 351
[6] C. D. Anderson, “The Positive Electron,” Phys. Rev. 43 (1933), 491-494
[7] E. Majorana, “Theory of the Symmetry of Electrons and Positrons," Il Nuovo
Cimento 14 (1937), 171-184
[8] P. B. Pal, “Dirac, Majorana and Weyl fermions,” Am. J. Phys. 79 (2011), 485-498
[9] A. Aste. “A Direct Road to Majorana Fields”, Symmetry 2 (2010), 1776-1809
[10] M. Moe and P. Vogel, “Double Beta Decay”, Ann. Rev. Nucl. Part. Sci. 44
(1994), 247-283
[11] M. F. L’Annunziata, “Handbook of Radioactivity Analysis”, Academic Press
(2012)
161
[12] W. Pauli, Correspondence to meeting in Tübingen (1930), Trans. K. Riesselmann,
http://microboone-
docdb.fnal.gov/cgibin/RetrieveFile?docid=953;filename=pauli%20letter1930.pdf,
Accessed Nov 2017
[13] F.L. Wilson, “Fermi’s Theory of Beta Decay”, American J. of Phys. 36 12 (1968),
1150-1160
[14] J.M. Blatt and V.F. Weisskopf, “Theoretical Nuclear Physics”, Wiley, New York,
(1952)
[15] J. Barea, J. Kotila, F. Iachello, “Nuclear matrix elements for double-β decay”,
Phys. Rev. C 87 (2013), 014315
[16] S. Dell’Oro, S. Marcocci, M. Viel, and F. Vissani, “Neutrinoless double beta
decay: 2015 review”, Adv. in High Energy Phys. 2016 (2016), 2162659
[17] Atomic Mass Data Center, International Atomic Energy Agency- Nuclear Data
Services, https://www-nds.iaea.org/
[18] Hyper-Kamiokande, “What is the neutrino mass hierarchy?”, http://www.hyper-
k.org/en/physics/phys-hierarchy.html, Accessed November 2017
[19] M. Tanabashi et al. (Particle Data Group), Phys. Rev. D 98 (2018), 030001
[20] H.V. Klapdor-Kleingrothaus, A. Dietz, H.L. Harney, and I.V. Krivosheina,
“Evidence for Neutrinoless Double Beta Decay”, Mod. Phys. Lett. A 16 (2001).
2409-2420
[21] H.V. Klapdor-Kleingrothaus and I.V. Krivosheina, “The Evidence for the
Observation of 0νββ Decay: The identification of 0νββ events from the full
spectra”, Mod. Phys. Lett. A 20 (2006), 1547-1566
162
[22] C.E. Aalseth et al, “Comment on ‘Evidence for Neutrinoless Double Beta
Decay;”, Mod. Phys. Lett. A 17 (2002), 1475-1478
[23] M. Agostini et al (GERDA Collab.), “Background free search for neutrinoless
double beta decay with Gerda Phase II”, Nature 544 (2017), 47-52
[24] N. Abgrall et al (MAJORANA Collab.), “The MAJORANA DEMONSTRATOR
Neutrinoless Double-Beta Decay Experiment,” Adv. in High Energy Phys. 2014
(2014), 365432
[25] N. Abgrall et al (LEGEND Collab.), “The Large Enriched Germanium
Experiment for Neutrinoless Double Beta Decay (LEGEND)”, AIP Conf. Proc.
1894 (2017), 020027
[26] NASA’s Cosmicopia- Nucleosynthesis, National Aeronautics and Space
Administration (NASA), US NASA, https://helios.gsfc.nasa.gov/nucleo.html
[27] A. G. Schubert, “Searching for neutrinoless double-beta decay of germanium-76
in the presence of backgrounds”, PhD Dissertation (2012), University of
Washington
[28] E. Aguayo et al, “Cosmic Ray Interactions in Shielding Materials”, Pacific
Northwest National Laboratory, PNNL-20693 (2011)
[29] D.E. Groom, N.V. Mokhov, S.I. Striganov, “Muon Stopping Power and Range
Tables 10 Mev-100 TeV”, Atomic Data and Nucl. Data Tables 76 (2001), LBNL-
44742
[30] C. Moskowitz, “Ancient Roman Lead Melted Down to Explore the Frontiers of
Physics”, Scientific America, 1 March 2014
163
[31] O. Holmes, M. Ulmanu, and S. Roberts, “The world's biggest grave robbery:
Asia’s disappearing WWII shipwrecks”, The Guardian, 2 November 2017
[32] Evaluated Nuclear Structure Data File (ENSDF), National Nuclear Data Center,
US DOE, http://www.nndc.bnl.gov/ensdf/
[33] National Institutes of Health, “Radon and Cancer”, National Cancer Institute, 6
December 2011, https://www.cancer.gov/about-cancer/causes-
prevention/risk/substances/radon/radon-fact-sheet, Accessed July 2018
[34] N. Abgrall et al (MAJORANA Collab.), “The MAJORANA DEMONSTRATOR
radioassay program”, Nucl. Inst. and Meth. in Phys. Research A 828 (2016), 22-36
[35] A.A. Yaroshevsky, “Abundances of Chemical Elements in Earth’s Crust”,
Geochem. Intl. 44 (2006), 48-55
[36] A. Sakoda, Y. Ishimori, and K. Yamaoka, “A comprehensive review of radon
emanation measurements for mineral, rock, soil, mill tailing and fly ash”, Appl.
Radiation and Isotopes 69 (2011), 1422-1435
[37] Y. Ishimori et al, “Measurement and Calculation of Radon Releases from NORM
Residues”, International Atomic Energy Agency Technical Report 474 (2013)
[38] Hamamatsu, “Si Detectors for high energy particles”, Hamamatsu Photonics,
www.hamamatsu.com
[39] ORCA, University of North Carolina, Software, Mac, Version 11 (2017)
[40] ROOT, CERN, Software, UNIX, Version unknown (2017)
[41] E. Beauchamp, “Radon Removal from Gaseous Xenon for the Enriched Xenon
Observatory”, M.Sc. Thesis, Laurentian University, Sudbury, ON, CAN
164
[42] International Commission on Radiation Units and Measurements (ICRU), “Report
90: Key data for ionizing-radiation dosimetry” J. ICRU 14 (2014)
[43] M.J. Berger, J.S. Coursey, M.A. Zucker, J. Chang, “Stopping-Power and Range
Tables for Electrons, Protons, and Helium Ions” NISTIR 4999 (1993)
[44] Stopping-Power and Range Tables for Electrons (ESTAR),
https://physics.nist.gov/PhysRefData/Star/Text/ESTAR.html
[45] Stopping-Power and Range Tables for Helium Ions (ASTAR),
https://physics.nist.gov/PhysRefData/Star/Text/ASTAR.html
[46] H.E. Revercomb and E.A. Mason, “Theory of Plasma Chromatography/ Gaseous
Electrophoresis- A Review”, Analytical Chem. 47 7 (1975), 970-983
[47] Durridge Company, “RAD7 User Manual”, (2018)
[48] Canberra Company, “Passivated Implanted Planar Silicon Detectors Datasheet”.
(2012)
[49] N.F. Zhang, “The uncertainty associated with the weighted mean of measurement
data”, Metrologia 43 (2006), 195-204
[50] W.A. Hammond Drierite Company, www.drierite.com
[51] University of New Mexico Department of Earth and Planetary Sciences, Thorite
Ore, University of New Mexico, Obtained February 2017
[52] A. Mazzilli and T. Lenau, “Empirical calculation of the surface area of an object”,
Ingeniorskolernes Procesdatabase, http://polynet.dk/ingpro/surface/empirica.htm
[53] M. Wojcik and G. Zuzel, “Low-222Rn nitrogen gas generator for ultra-low
background counting systems”, Nucl. Instr. Meth. Phys. Res. A 539 (2005), 427-
432
165
[54] D.R. Lide, “CRC Handbook of Chemistry and Physics 86th Edition” CRC Press,
Taylor & Francis, Boca Raton, FL (2005-2006), 4-30
[55] C.E. Aalseth et al (MAJORANA Collaboration), “Search for Neutrinoless
Double-β Decay in 76Ge with the MAJORANA DEMONSTRATOR”, Phys. Rev.
Lett. 120 (2018), 132502
[56] NASA, NOAA, USAF, “U.S. Standard Atmosphere, 1976”, NASA-TM-X-74335
(1976)
[57] V.E. Guiseppe, C.D. Christofferson, K.R. Hair, and F.M. Adams, “A Review and
Outlook for the Removal of Radon-Generated Po-210 Surface Contamination”,
Low Radioactivity Techniques: LRT 2017, AIP Conf. Proc. 1921 (2018), 070003
[58] G. Zuzel, “Highly sensitive measurements of 222Rn emanation and diffusion”,
Low Radioactivity Techniques: LRT 2004, AIP Conf. Proc. 785 (2005), 142–149
[59] E.H. Miller et al, “Constraining Radon Backgrounds in LZ”, Low Radioactivity
Techniques: LRT 2004, AIP Conf. Proc. 1921 (2018), 050003
[60] Y. Nakano et al, “Measurement of radon concentration in Super-Kamiokande’s
buffer gas”, Nucl. Inst. And Meth. In Phys. Research A 867 (2017), 108-114
[61] Norpro, Inc., Norpro Item#599 Instant Heater (2017),
http://wholesale.norpro.com/index.php/instant-heater.html
[62] Omega Engineering, KH-404/10P Kapton® Insulated Flexible Heater (2017),
https://www.omega.com/pptst/KHR_KHLV_KH.html
[63] MKS Instruments, Baratron 722B-13TGA2FJ Manometer (2017),
https://www.mksinst.com/product/Product.aspx?ProductID=124
[64] V.E. Guiseppe, Personal Communication, 2017
166
[65] J.B.R. Battat et al (DRIFT Collab), “Radon in the DRIFT-II directional dark
matter TPC emanation, detection and mitigation”, JINST 9 (2014), P11004
[66] N. Mahowald et al, “The size distribution of desert dust aerosols and its impact on
the Earth system”, Aeolian Research 15 (2014), 53-71
[67] Gardner Denver Thomas GmbH, Thomas 1610VD Diagram Pump (2015)
[68] K. Murphy, “What’s Lurking in Your Countertop?”, New York Times, 24 July
2008
[69] C. K. Shearer, Personal Communication, 2017