radioresistance in oral squamous cell carcinoma
TRANSCRIPT

i
THE UNIVERSITY OF HULL
RADIORESISTANCE IN ORAL SQUAMOUS CELL
CARCINOMA.
Being a thesis submitted for the
degree of MD in the University of
Hull
By
Justin Thomas Murphy
MB ChB, MRCS

ii
Contents.
page
Abstract …………………………………………………………………… 1
CHAPTER 1 – Introduction
1.1 Introduction …………………………………………………………… 2
1.2 Anatomy …………………………………………………………… 4
1.2.1 Lymph drainage
1.2.2 Function
1.3 Incidence of Oral Cancer …………………………………………… 13
1.4 Aetiology …………………………………………………………… 15
1.5 Pathology of Oral Cancer …………………………………………… 18
1.5.1 Pre-malignant Conditions
1.5.2 Malignant Conditions
1.5.2.1 Squamous Cell Carcinoma
1.5.2.2 Salivary Gland Tumours
1.6 Symptoms …………………………………………………………… 24
1.7 Staging …………………………………………………………… 25
1.8 Treatment …………………………………………………………… 27
1.9 Prognosis …………………………………………………………… 30
1.10 Potential Markers Of Radioresistance …………………………… 32
1.10.1 Cytological Predictors
1.10.2 Microvessel Density
1.10.3 Molecular Determinants of response to Radiotherapy

iii
1.10.3.1 The Role of p53
1.10.3.2 DNA Protein Kinases
1.10.3.3 Vascular Endothelial Growth Factor
1.10.3.4 Cyclo-oxygenase 2
1.10.3.5 Bcl-2 Family
1.10.3.6 Epidermal Growth Factor Receptor
1.10.4 Future techniques
1.10.4.1 Microarray Technology
1.10.5 Summary of Markers of Radioresistance
1.11 Microarray Technology …………………………………………... 48
1.11.1 Types of Microarrays
1.11.2 Manufacturing a Gene Chip
1.11.2.1 Mechanical Microspotting
1.11.2.2 Photolithography
1.11.2.3 Ink Jet Technology
1.11.3 Methodology
1.11.4 Applications
1.11.5 Advantages of Microarrays
1.11.6 Disadvantages of Microarrays
1.12 Immunohistochemistry …………………………………………. 57
1.12.1 Introduction to Immunohistochemistry
1.12.2 Antigens
1.12.3 Antibodies

iv
1.12.3.1 Polyclonal Antibodies
1.12.3.2 Monoclonal Antibodies
1.12.3.3 Affinity
1.12.3.4 Reaction Rates
1.12.4 Fixation
1.12.4.1 Formaldehyde Based Fixatives
1.12.4.2 Other Fixatives
1.12.5 Antigen Retrieval
1.12.5.1 Heating
1.12.5.2 EDTA
1.12.5.3 Ultrasound
1.12.6 Staining
1.12.6.1 The Direct Method of Staining
1.12.6.2 The Indirect Method of Staining
1.12.6.3 Soluable Enzyme Immune Complex Method
1.12.6.4 Avidin Biotin Method
1.13 Study Aims ………..…………………………………….. 71

v
CHAPTER 2 - Materials and Methods.
2.1 Cell Culture …………………………………………………………… 73
2.1.1 Cell Lines
2.1.2 Thawing Cells
2.1.3 Culturing Cells
2.1.4 Passaging Cells
2.1.5 Freezing Cells
2.1.6 Counting Cells
2.1.7 Dose Response Curve
2.1.8 Incremental Irradiation Dose
2.2 Expression Microarray Analysis …………………………………… 79
2.2.1 Extraction of RNA
2.2.2 RNA Quantification and Purity Assessment
2.2.3 Generation of Amino Allyl Labelled cDNA
2.2.4 Purification of cDNA
2.2.5 NHS-Ester Containing Dye Coupling Reaction
2.2.6 Purification of Dye Coupled cDNA
2.2.7 Microarray Slide Preparation
2.2.8 Hybridisation
2.2.9 Post Hybridisation Washing

vi
2.3 Immunohistochemistry …………………………………………... 88
2.3.1 Case Selection
2.3.2 Definition of Radioresistant Cases
2.3.3 Slide Preparation
2.3.4 Antigen Retrieval
2.3.5 Blocking of Endogenous Avidin and Biotin
2.3.6 Antibody Binding and Detection
2.3.7 Chromogen Reaction
2.3.8 Counterstaining Nucleus
2.3.9 Mounting Slides

vii
CHAPTER 3 – RESULTS. Development of Novel Radioresistant Oral Squamous
Cell Carcinoma Cell Lines.
3.1 Introduction …………………………………………………………… 94
3.2 Materials and Methods …………………………………………… 95
3.2.1 Cell Lines
3.2.2 Determination of Inherent Response to Radiotherapy
3.2.3 Development of Radioresistant Cell Lines
3.2.4 Confirmation of Radioresistance
3.2.5 Physiological Parameters of Cell Lines
3.3 Results …………………………………………………………… 98
3.3.1 Dose Response Curves of PE-CAPJ41
3.3.2. Dose Response Curve of PE-CAPJ49
3.3.3 Incremental Dose of Radiotherapy
3.3.4. Confirmation of Radioresistance
3.3.5 Physiological Parameters of Cell Lines
3.4 Discussion …………………………………………………………… 104
viii
CHAPTER 4 – RESULTS. Identification of Novel Molecular Markers of
Radioresistance in Oral Squamous Cell Carcinoma Cell Line PE-CAPJ41 Using
Microarray Technology.
4.1 Introduction …………………………………………………………… 109
4.2 Materials and Methods …………………………………………… 110
4.3 Results …………………………………………………………… 114
4.3.1 Markers Identified in the PE-CAPJ41 Cell Line.
4.3.1.1 HRMT1L2
4.3.1.2. PITX1
4.3.1.3. PTK7
4.3.1.4. TEAD4
4.3.1.5 CD74
4.3.1.6 CLCN6
4.3.1.7 CLU
4.4. Discussion …………………………………………………………… 119
4.4.1 HRMT1L2
4.4.2 PITX1
4.4.3 PTK7
4.4.4 TEAD4
4.4.5 CD74
4.4.6 CLCN6
4.4.7 CLU

ix
CHAPTER 5 – RESULTS. Identification of Novel Molecular Markers of
Radioresistance In The Oral Squamous Cell Carcinoma Cell Line PE-CAPJ49
Using Microarray Technology.
5.1 Introduction …………………………………………………………… 127
5.2 Materials and Methods …………………………………………… 127
5.3. Results …………………………………………………………… 129
5.4 Discussion …………………………………………………………… 132
5.4.1 Pro-survival genes
5.4.2 Genes Associated With Cell Death
5.4.3. Genes Whose Role in Radioresistance Has Yet to be Determined
5.4.4. Comparison of Markers Identified in Cell Lines
5.5 Conclusion ………………………………………………………….. 148

x
CHAPTER 6 – RESULTS. Molecular Markers of Radioresistance in Oral
Squamous Cell Carcinoma as Detected by Immunohistochemistry.
6.1 Introduction …………………………………………………………… 150
6.2 Materials and Methods …………………………………………… 155
6.2.1 Patient Details
6.2.2 Immunohistochemistry
6.2.3 Interpretation and Assessment of Staining
6.2.4 Statistical Analysis
6.3. Results …………………………………………………………… 158
6.4. Discussion …………………………………………………………… 162
CHAPTER 7 – Concluding remarks …………………………………… 165
REFERENCES …………………………………………………………… 169

xi
LIST OF FIGURES.
1.1 Anatomy of Oral Cavity …………………………………………… 5
1.2 Anatomy of the Tongue …………………………………………… 6
1.3 Muscles of the Tongue …………………………………………… 7
1.4 Lymph Drainage of The Neck …………………………………………… 8
1.5 Levels of Lymph Nodes …………………………………………… 9
1.6 Swallowing Mechanism …………………………………………… 11
1.7 World Map of Incidence of Oral Cancer …………………………… 15
1.8 Microarray Methodology …………………………………………… 54
1.9 Basic Structure of Antibodies …………………………………………… 60
1.10 Indirect Staining Method …………………………………………… 69
1.11 Avidin Biotin Method …………………………………………… 71
2.1 Microscope Image of Cells Growing in a Monolayer …………………… 74
2.2 Microscope Image of Trypsinised Cells …………………………… 75
2.3 Grid Marked on Haemocytometer …………………………………… 77
2.4 RNA Extraction …………………………………………………… 81
2.5 Application of Hybriwell™ …………………………………………… 87
3.1 Initial Dose Response Curve for PE-CAPJ41 …………………………… 98
3.2 Final Dose Response Curve for PE-CAPJ41 …………………………… 99
3.3 Initial Dose Response Curve for PE-CAPJ49 …………………………… 100
3.4 Final Dose Response Curve for PE-CAPJ49 …………………………… 100
3.5 Dose Response Curve for PE-CAPJ41 Vs PE-CAPJ41RR …………… 102

xii
3.6 Dose Response Curve for PE-CAPJ49 Vs PE-CAPJ49RR …………… 102
3.7 Survival Curve Comparing PE-CAPJ41 Vs PE-CAPJ41RR …………… 103
3.8 Survival Curve Comparing PE-CAPJ41 Vs PE-CAPJ41RR …………… 103
4.1 Microarray Image of PE-CAPJ41 Vs PE-CAPJ41RR …………… 113
4.2 Microarray Image of Feature HRMT1L2 …………………………… 115
4.3 Microarray Image of Feature PITX1 …………………………………… 116
4.4 Microarray Image of Feature PTK7 …………………………………… 116
4.5 Microarray Image of Feature TEAD4 …………………………………… 117
4.6 Microarray Image of Feature CD74 …………………………………… 117
4.7 Microarray Image of Feature CLCN6 …………………………………… 118
4.8 Microarray Image of Feature CLU …………………………………… 118
5.1 Microarray Images of all Three Arrays for PE-CAPJ49 Vs PE-CAPJ49RR 130
6.1 Effects of EGFR …………………………………………………… 151
6.2 Interaction of COX2, EGFR and Bcl-2 …………………………… 153
6.3 Microscope View of Immunohistochemistry Slides …………………… 160

xiii
LIST OF TABLES.
1.1 Studies Showing Relationship of p53 to Radioresistance ………....... 41
3.1 Physiological Parameters of Cell lines …………………………… 104
4.1 Raw Data From PE-CAPJ41 Microarrays …………………………… 114
5.1 Raw Data From PE-CAPJ49 Microarrays …………………………… 131
5.2 Pro-survival Genes …………………………………………………… 133
5.3 Genes Associated with Cell Death …………………………………… 139
5.4 Genes Whose Role is Not Determined …………………………………… 143
5.5 Comparison of Genes from Chapter 4 …………………………………… 146
6.1 Patient Characteristics …………………………………………………… 159
6.2 Results of Statistical Analysis …………………………………………… 161
6.3 Results of Staining …………………………………………………… 161

xiv
LIST OF ABBREVIATIONS:
AJCC American Joint Committee on Cancer
BECN1 Beclin 1
BMP5 Bone Morphogenic Protein 5
BSA Bovine Serum Albumin
CEA Carcinoembryonic Antigen
CCNE1 Cyclin E
CLCN6 Chloride Channel 6
CLU Clusterin
COX Cyclo-oxygenase
cDNA Complementary
DAB Diaminobenzidine Tetrahydrochloride
DMSO Dimethylsulfoxide
DMEM Dulbecco’s Modified Eagle’s Medium
DNA Deoxyribose Nucleic Acid
DNA-PK Deoxyribose Nucleic Acid – Protein Kinase
EDTA Ethylenediaminetetraacetic Acid
EGFR Epidermal Growth Factor Receptor
EGR1 Early Growth Response 1
FAP Familial Adenomatous Polyposis
GMEB1 Glucocorticoid Modulatory Element Binding protein 1
HCl Hydrochloric acid
HEPA High Efficiency Particulate Air filter

xv
HER2 Human Epidermal Growth Factor Receptor 2
HNSCC Head and Neck Squamous Cell Carcinoma
HRMT1L2 Heterogeneous Nuclear Ribonucleotein Methyltransferase 1-Like 2
ICAM3 Intracellular Adhesion Molecule 3
IGHMBP2 Immunoglobulin Mu Binding Protein 2
KLK8 Kallikrein 8
LRR Loco-regional Recurrence Rate
LRRFIP1 Leucine Rich Repeat Interacting Protein 1
MeSH Medical Subject Heading
MNC Multi Nucleated Cell
mRNA messenger Ribose Nucleic Acid
MHC-II Major Histocompatability Complex - II
MVD Micro Vessel Density
PBS Phosphate Buffered Saline
PITX1 Pituitary Homeobox 1
PTK7 Protein Tyrosine Kinase 7
RNA Ribose Nucleic Acid
RREB1 Ras Responsive Element Binding protein 1
SCC Squamous Cell Carcinoma
SDS Sodium Dodecyl Sulphate
SSC Sodium Salt Citrate
TEAD4 Transcriptional Enhancer Factor 3
TGF-α Transforming Growth Factor Alpha

xvi
TGFB Transforming Growth Factor Beta
TBS Tris Buffered Saline
TNM Tumour Node Metastasis
VEGF Vascular Endothelial Growth Factor
UICC Union Internationale Contre le Cancer
WT Wild Type

xvii
Acknowledgements
I would like to thank Dr. Lynn Calkwell for her supervision and guidance through this
work. I would also like to thank Professor Nick Stafford for opening my eyes to the
world of research in clinical medicine and his support throughout this thesis. Without Dr.
Mark Watsons’ patience the sections on microarrays would have taken many mores hours
to master and I am therefore grateful for all his help. I would like to thank Professor
Andy Beavis at Princess Royal Hospital for his expertise and help in delivering the
correct dose of radiotherapy to the cancer cells and for giving up his free time to do it.
Lastly I would also like to thank all the staff in the laboratory at Castle Hill Hospital for
all their help and support.

1
Abstract.
Head and Neck Squamous Cell Carcinoma (HNSCC) is the sixth most common
cancer accounting for approximately 6% of all cancers worldwide. However the
distribution across the globe varies considerably. The majority of small tumours of
the oral cavity and upper aerodigestive tract, in the absence of metastatic disease, can
be successfully treated with surgery or radiotherapy. Despite this most small tumours
of the oral cavity are now treated with surgery as the primary treatment modality with
radiotherapy being reserved for adjuvant therapy, palliation or in patients unfit for
surgery. Radiotherapy is also used in cases where there is doubt about the
completeness of resection and where adverse histological characteristics are present.
Unfortunately, on average about 10% of tumours treated in this way are resistant to
radiotherapy, developing tumour recurrence within the original radiotherapy field
during the ensuing 12 months. Patients with radioresistant tumours are not only
receiving a therapy that is unnecessary but are also being put at risk of potentially
serious complications, e.g. osteoradionecrosis of the cervical spine. The primary aim
of this thesis was to investigate the mechanism of radioresistance and create an in
vitro model of a radioresistant oral squamous cell carcinoma. The methods of cell
culture, microarray analysis and immunohistochemistry were employed to this end.
Two novel radioresistant cell lines, PE-CAPJ41RR and PE-CAPJ49RR, were created
and a number of targets identified using microarray analysis. Immunohistochemistry
was used to investigate the relationship EGFR, Bcl-2, BAX and COX-2 had with
radiotherapy response.

2
1.1. Introduction
Head and Neck Squamous Cell Carcinoma is the sixth most prevalent cancer
worldwide (Parkin et al., 2005). Oral cancer is the most common form of head and
neck cancer with an estimated 275,000 new cases in 2002 far exceeding laryngeal
caner which has an estimated 159,000 new cases per year (Parkin et al., 2005). Oral
cancer makes up between 2-6% of all cancers diagnosed in Europe and the United
States (Moore et al., 2000b). In the UK, Europe and the USA, the incidence of oral
cancer increased in the last three decades (Hindle et al., 1996). Truncated age
standardised rates for mortality have risen from 1.67 per 100 000 in 1970 to a rate of
2.91 per 100 000 in 1990, with the incidence rates rising from 3.61 per 100 000 to
5.52 per 100 000 in a similar time period (Moore et al., 2000a). A number of factors
have been postulated for this increase including the large rise in the consumption of
alcohol in these countries in the latter part of this century (Hindle et al., 1996). The
cohort of adults in whom this increase is occurring is now entering the older age
group were there is traditionally a higher disease frequency. Thus in the next decade
the incidence of oral cancer may rise steeply with the subsequent extra burden on the
NHS. Therefore research needs to be targeted on optimising current treatment
regimens and developing new strategies.
Currently the majority of oral cancers are treated with surgery, radiotherapy
chemotherapy or a combination of these (Davidson et al., 2001). Small tumours are
usually treated surgically with radiotherapy being most commonly employed for those
cases with adverse histological findings such as involved resection margins. A group
of patients exists in whom radiotherapy may be of benefit. Where resection margins
are close, but still considered clear, radiotherapy may improve the long term survival

3
(Brown et al., 2007). Predicting the response this group of tumours has to
radiotherapy will enhance the decision making process. Each treatment modality is
associated with co morbidities and failure rates ranging from 20-40% depending on
stage of disease and the treatment chosen (Carvalho et al., 2003). Different tumour
types are already known to have a varied response to radiotherapy, with tumours such
as mesotheliomas having an “intrinsic” resistance to radiotherapy (Zucali and
Giaccone, 2006) and tumours such as seminomas having an “intrinsic” sensitivity
(Christoph et al., 2005). A tumours’ intrinsic response to radiotherapy along with
other factors such as the primary site of a tumour and its’ size (Corvo et al., 2001;
Fukuda et al., 2004; Raybaud-Diogene et al., 1997), already exist which enable the
clinician to make an informed decision about the efficacy of radiotherapy. However,
they are of limited value (Corvo et al., 2001). The ability to predict likely treatment
failures before the commencement of radiotherapy would increase the efficacy of the
treatment and spare the patient the potentially unpleasant side effects such as
xerostomia, dysgeusia, fibrosis (Lapeyre et al., 2004) and more wide reaching effects
such as immunosuppression (Fukuda et al., 2004).
During this thesis when the term “oral cancer” is used it will mean any malignant
neoplasm affecting the oral cavity (consisting of the vestibule and the oral cavity
proper). Thus cancers of the lateral border of tongue, floor of mouth, buccal mucosa
or a combination of these will be considered, and those of the lip and posterior third,
or fixed portion, of the tongue will not be discussed.

4
1.2. Anatomy
The oral cavity can be divided up into two main parts; an outer, smaller, slit like
portion, the vestibule; and a larger, oval-shaped portion referred to as the mouth
cavity proper. The vestibule is a slit like space which communicates with the mouth
cavity behind the third molar tooth on each side. With the mouth closed the roof and
floor of the vestibule are bounded by the reflection of the mucosa from the lips and
cheek onto the lateral gingival margin. The lateral wall of the vestibule is made up
primarily of the buccinator muscle and its overlying mucous membranes and medially
it is bound by the teeth and lateral wall of the alveolar process. See figure 1.1.
The boundaries of the oral cavity are made up anteriorly of the lips, posteriorly by the
anterior tonsillar pillar and laterally of the buccal mucosa. The roof consists of the
hard palate and the floor is formed primarily by the anterior two thirds of the tongue
and by the reflection of the mucous membranes from the sides of the tongue to the
gums on the mandible (Snell, 1992). That portion of the tongue lying posterior to the
foramen caecum and the soft palate are considered to be part of the oropharynx. The
oral cavity contains the alveolar processes and attached teeth, the hard palate, that
portion of the tongue which lies anterior to the circumvallate papilla, the orifice of the
parotid duct opposite the upper second molar and the orifices of the submandibular
and sublingual ducts.

5
Figure 1.1 From www.mededucation.bhmu.edu.cu showing anatomy of oral cavity from an anterior
view in (a) and a cross section in (b).
The anterior two thirds of the tongue is referred to as the oral or mobile tongue and is
bounded posteriorly by the “V” shaped line of circumvallate papillae (figure 1.2). The
mobile tongue has a dorsal and ventral surface which is covered by a mucosa of
simple stratified squamous epithelium with interspersed papillae or taste buds. The
tongue is comprised of both intrinsic and extrinsic muscles. The intrinsic muscles of
the tongue are responsible for changing its shape and consistency whilst the extrinsic
muscles provide the tongues mobility. There are three pairs of extrinsic muscles:
genioglossus, hyoglossus and styloglossus (figure 1.3). These muscles receive their
motor supply directly from the hypoglossal nerve (Boyle and Strong, 2001). The
sensory innervation of the anterior two thirds of the tongue is supplied by fibres from
the lingual nerve, a branch of the mandibular division of the trigeminal nerve, which
also supplies the mucous membranes lining the floor. Taste sensation is supplied via
the chorda tympani which is a branch of the facial nerve. The blood supply to the

6
tongue is derived from the lingual artery, the tonsillar branch of the facial artery and
the ascending pharyngeal artery, with the corresponding veins draining into the
ipsilateral internal jugular vein (Snell, 1992).
Figure 1.2. From www.doctorspiller.com showing the tongue and the circumvallate papillae dividing
it into its anterior and posterior portions.
The hard palate lies within the horseshoe shape of the maxillary alveolar process and
can be divided into the primary and secondary bony palate. The palatal processes of
the maxillary bones make up the primary bony palate whilst the secondary bony
palate is made up of the horizontal processes of the “L” shaped palatine bones. The
greater and lesser palatine foramina are situated adjacent to the second and third
molar on the hard palate and transmit the terminal branches of the sphenopalatine

7
artery (posterior superior alveolar artery) and greater palatine nerve, which are
braches of the maxillary artery and maxillary division of the trigeminal nerve
respectively. The vessels supplying the primary palate region are terminal branches of
the nasocilliary nerve and vessels and reach the palate through the incisive foramen
(Boyle and Strong, 2001).
Figure 1.3 from Greys Anatomy showing the muscles of the tongue.
A soft, thin “U” shaped layer of mucosa makes up the floor of the mouth. This
overlies the insertion of the mylohyoid muscle laterally, the hyoglossus medially and
the genioglossus anteriorly. It overlies the submandibular gland and duct and the
lingual nerve. The blood supply is derived from the lingual artery (Boyle and Strong,
2001).

8
The mouth is lined by stratified squamous epithelium which overlies richly vascular
connective tissue. The epithelium varies in thickness throughout the oral cavity being
thickest over the tongue where there are also papillary projections. Most of the
epithelium is non-keratinising except over the lips, gums and hard palate where a
degree of keratinisation occurs. When keratinisation occurs elsewhere in the oral
cavity this can lead to the formation of white plaques on the mucosa termed
leucoplakia (Dixon, 1996).
1.2.1. Lymph drainage
The oral cavity contains a rich supply of lymph channels which ultimately drain into
the lymph nodes of the neck as can be seen in figure 1.4. Upto seven different lymph
node levels have been described in the literature (see figure 1.5), with each head and
neck region preferentially draining to one of these levels.
Fig 1.4. From Greys
Anatomy showing
lymph drainage of oral
cavity, lymph drainage
channels can be seen
highlighted in blue. As
can be seen in the
diagram the lymph
drainage of the oral
cavity ultimately leads
to the lymph nodes
lying along the internal
jugular vein.

9
The lymph vessels of the oral cavity drain into level one lymph nodes via a number of
routes. The vessels draining the alveolae initially pass to the submaxillary glands,
those of the palate pass backwards to either drain into the subparotid or directly into
level 2 nodes and those of the floor of the mouth either pass through the
submental/level 1 nodes to level 2 or drain directly into level 2 nodes. The tonsil
usually has three to five lymph vessels which drain into a single level 2 node lying
immediately inferior to the posterior belly of the digastric muscle where it crosses the
internal jugular vein. This lymph node is often referred to as the jugulodigastric node.
Figure 1.5. From (Cummings et al., 2005) showing the different levels of the neck in which lymph
nodes are contained.

10
The lymph drainage of the tongue is a little more complex than the rest of the oral
cavity. The lymph vessels which drain the tongue can be divided up into four main
groups, the apical, lateral, basal and median. The apical vessels drain the tip of the
tongue to the submental/suprahyoid nodes. The lateral vessels, as the name suggests,
drain the margin of the tongue either to the submaxillary nodes or directly to level 2
nodes. The basal vessels drain from the region of the circumvallate papillae and pass
directly to level 2 and the median vessels also pass directly to level 2 lymph nodes
(Grey’s anatomy). Despite this, lesions which approach the midline can drain
bilaterally and thus present with metastasis in the contra-lateral neck. Cases have also
been reported where lesions of the anterior tongue metastasis directly to nodes low
down in the neck bypassing the “front line” lymph drainage (Boyle and Strong, 2001).
1.2.2. Function
The oral cavity and oropharynx are that part of the aero-digestive tract concerned with
mastication of food, initiation of swallowing, articulation and the provision of an
alternative airway should the nasal cavity become compromised. It is also where
digestion of food begins and, via the tongue, where food is tasted and deemed safe to
swallow.
Once solid food enters the mouth it is usually broken down by the grinding action of
the teeth which also facilitates the mixing of food with saliva. The functions of saliva
are mainly mechanical, lubricating the mouth during chewing and aiding swallowing.
It has a higher concentration of potassium than plasma, making it relatively alkaline,
and contains an amylase like enzyme, ptyalin, which initiates the digestion of starch
(Keele et al., 1992).

11
The action of the tongue and the cheek muscles (especially buccinator) cause the food
to pass repeatedly between the teeth to allow thorough mixing. Swallowing begins
when the mouth is closed and there is voluntary contraction of mylohyoid. There are
three phases of swallowing: the oral, pharyngeal and oesophageal phase. The first is
under voluntary control and the rest are under reflex control. Once the oral phase has
been initiated the food is formed into a bolus which eventually comes to lie on the
dorsum of the tongue. This food bolus is then pushed upward and backwards against
the under surface of the hard palate by the tongue and propelled into the oropharynx
which triggers the rest of the swallowing process (see figure 1.6). The oropharynx has
a rich sensory innervation from the glossopharyngeal nerve. Afferent impulses are
sent up to the so called “deglutination centre” in the medulla to produce the complex
co-ordinated movements which occur in the involuntary phase of swallowing (Keele
et al., 1992).
Figure 1.6 From (Cummings et al., 2005). Showing food bolus lying on the dorsum of the tongue as it
is passed back through the oral cavity towards the oropharynx.

12
The pharyngeal phase of swallowing is the most complex yet only lasts half a second
and occurs during a period of apnoea. Once the bolus has entered the oropharynx the
soft palate is elevated to close of the nasopharynx, the larynx also elevates, causing
the epiglottis to flap backwards, the cricoid tilts forward, the vocal cords are
approximated and the airway is thus protected from aspiration. The oesophageal phase
of swallowing consists of a wave of peristalsis that propagates downwards leading to
the entry of the food bolus into the stomach (Narcy et al., 2005).
The production of speech is a complex process involving the lungs, larynx,
oropharnyx and oral cavity, the later two are often referred to as the so called
articulators or voice tract. Once sound is initiated by air passing through the larynx
(so called phonation) the vocal tract modifies this to turn the rudimentary sound into
intelligible speech. Various parts of the oral cavity and oropharynx are concerned
with producing different sounds and work together to produce words and sentences.
The size and acoustics of the oral cavity can be changed by the movements of the
palate, tongue, lips, cheeks and jaw.
The soft palate (also known as the velum) is the mobile part of the roof of the
oropharynx and is normally in a position which allows air to pass through the nose
and mouth. During speech it is often raised so air cannot escape into the nose. Whilst
speaking the soft palate articulates with the tongue to produce the so called velar
consonants “k” and “g”. When the tongue articulates with the upper alveolar ridge,
just above the top front teeth, the sounds such as “t” and “d” are produced and are
sometimes referred to as alveolar sounds.

13
The tongue is probably the most important articulator as it interacts with so many of
the other articulators and can deform into many shapes. It therefore does not have any
particular sounds attributable to it. Lips also play a major role and have two main
methods of producing sound, pressing against each other or pressing against the teeth.
When the lips are pressed together bilabial sounds such as p and b are produced and
when they articulate with the teeth labiodental sounds such as f and v are formed.
(www.personal.rdg.ac.uk)
1.3 Incidence of Oral Cancer.
During the early part of the 20th century the incidence rate of oral cancer was
declining. This decline has been replaced by the subsequent increase in its incidence
over the past thirty years. The age-adjusted incidence rate for oral cancers was 8.3 per
100 000 in 1994 – 1998 but varied greatly between the sexes and across the globe
(Canto and Devesa, 2002) as illustrated in figure 1.7. Current figures show that the
area with the highest incidence is Melanesia, with an incidence rate of 31.5 per 100
000 (Parkin et al., 2005). There are also a high incidences reported in certain parts of
the developed world such as eastern, western and southern Europe and Australia
(Wunsch-Filho, 2002), with oral cancer being 45 times more common in parts of
France than in the Gambia (Davidson, 2001). Australia’s’ high rate of oral cancer,
10.2 per 100 000, is attributed to the high rate of lip cancer secondary to sun exposure
in the Caucasian population (Parkin et al., 2005). In India oral cancer is the most
common cancer affecting males, the third most common affecting females (Wunsch-
Filho, 2002) and accounts for over 50% of all newly diagnosed cancers (Ford and
Grandis, 2002). The notably high rate, 12.7 per 100 000, is most often attributed to the

14
high incidence of betel nut chewing, which is known to be linked to the pathogenesis
of oral cancer (Chen et al., 2003), and will be discussed further in section 1.4.
Latin America and the Caribbean have intermediate rates with some countries actually
reporting a decline. Uruguay has one of the highest incidence rates among the South
American countries with an incidence rate of 15.8 per 100 000 in the male population,
possibly due to the high consumption of spirits as compared to wine and beer (De
Stefani et al., 1998). The incidence rates across eastern Asia vary considerably. The
overall incidence rate for males in 2000 was 2.31 per 100 000 but in Taiwan in 1999
this was at 25.31 per 100 000 (Chen et al., 2004).
In the UK there has been a change in the incidence rate over the last century. The
elderly have seen a fall in the incidence rate over the last twenty years but successive
cohorts of younger age groups have seen a dramatic rise in incidence. Those aged 45-
49 have seen doubling of the incidence rate from 2.10 to 4.3 per 100 000 and in the
age group 50-54 there has been a rise from 3.9 to 6.9 (Hindle et al., 1996). It is
estimated that 6% of all oral cancers in the UK are diagnosed in patients under the age
of 45 years (Llewellyn et al., 2004) and 3% under the age of 40 years (Pitman et al.,
1999). The male:female ratio has also changed substantially over this time. In 1916
the male:female ratio was 10.3:1 but has subsequently fallen to 2.5:1 (Hindle et al.,
1996) possibly due to the increased rates of smoking and drinking among the female
population.

15
Figure 1.7 from (Parkin et al., 2005) showing incidence rates for oral cancer across the globe. The
highest incidence is shown in red.
1.4 Aetiology.
The link between alcohol, smoking and head and neck cancers has now been long
established (Elwood et al., 1984b). When alcohol and smoking habits were examined
with specific regard to oral cavity malignancy a number of studies have suggested that
alcohol may play a more important role than smoking (Choi and Kahyo, 1991;
Elwood et al., 1984a) and can act as an independent risk factor for the development of
oral cancer (Schlecht et al., 1999; Rothman, 1978). The risk of developing head and
neck SCC is between 5-25x higher for those who smoke (Licitra et al., 2002).
However these two factors alone cannot explain every case as cancers occur in those
who have neither smoked tobacco nor drunk alcohol.

16
Epidemiological data strongly link cigarette smoking to the development of cancer
(Brennan et al., 1999). Repeated exposure to specific carcinogens in cigarette smoke
are thought to cause multiple dysplastic lesions in the mucosa of the aerodigestive
tract, the so called phenomenon of field carcinogenesis (El-Gazzar et al., 2005). A
study by Brennan et al., (1999) found a link between cigarette smoking and mutations
in the p53 gene suggesting a possible mechanism of action. There are two main types
of tobacco on the market, black or dark tobacco which is air cured and mainly used in
cigars and pipes, and blond or light tobacco, which is flu cured and used mainly in the
manufacture of cigarettes. The two types of tobacco have been studied in the past to
see if they carry the same cancer risk (Castellsague et al., 2004). Castellsague et al.,
(2004) studied data on 375 patients newly diagnosed with oral cancer and matched
these with 375 controls. They found that black tobacco was associated with a 2 to 4
fold increase in the risk of developing cancer when compared to blond tobacco.
“Areca cattechu Linn” is more commonly known as the betel or arcacia nut and is a
widely cultivated plant in places such as India, Bangladesh, China and Malaysia
(Arjungi, 1976). In its most basic form betel quid is a combination of betel leaf, areca
nut and slaked lime. In many countries tobacco is added to this mixture along with
various other ingredients such as lime juice and spices. Areca nut has psychoactive
properties due to the presence of the alkaloid arecoline (Nair et al., 2004). The
practice of betel quid chewing has been found to have a causal relationship with oral
cancer, either through mutations caused from the alkaloid contained in the areca nut,
the tobacco chewed or as a combination of both (Gupta and Ray, 2004).
17
Viruses have been found to play a role in other cancers with the most notable example
being Human Papilloma Virus (HPV) and its’ link with cervical cancer (Mckaig et al.,
1998). HPV is also found in around 15% of all squamous cell cancers of the head and
neck region (Canto and Devesa, 2002), with tumours of the tonsil being the most
commonly infected (Canto and Devesa, 2002). A study in Sao Paulo found that 25%
of tonsil tumours were infected with HPV-16 (Wunsch-Filho, 2002). HPV is thought
to induce cancer by interfering with the genes or gene products of the cell cycle
(Mckaig et al., 1998). A systematic review of HPV and its links with head and neck
squamous cell carcinoma found that its link was strongest for those cancers affecting
the oropharynx and weakest for oral cavity tumours (Hobbs et al., 2006).
There is a higher incidence of oral cancer in those individuals from a lower social
status (Wunsch-Filho, 2002). A link between poor diet, poor dentition and
malnourishment may help to explain this (Wunsch-Filho, 2002). Other factors
reported to increase the risk of oral cancer include infrequent tooth brushing, low
intake of fresh fruit and vegetables, poorly fitting dental prosthesis, riboflavin
deficiency and charcoal grilled red meat (Wunsch-Filho, 2002).
Tea and coffee have not been found to be linked to oral cancer and it has been
hypothesised that green tea may have a protective effect (Wunsch-Filho, 2002). There
is a long list of occupations which have an association with oral cancer including
plumbers, carpet fitters, painters and decorators, blacksmiths and electricians. Whilst
no study has proved a direct link with occupation, it has been postulated that long
term exposure to burning fossil fuels may have a role to play (Huebner et al., 1992;
Merletti et al., 1991; Oreggia et al., 1989). Environmental exposures to radiation and

18
nitrosamines have also been linked with oral cancer (Canto and Devesa, 2002). The
risk marijuana smoking poses to the development of oral cancer is yet to be properly
understood (La Vecchia et al., 1997).
1.5 Pathology of Oral Cancer.
1.5.1 Pre-malignant conditions.
There are a number of pre-malignant conditions which are known to affect the oral
mucosa each with a different pre-disposition to develop into cancer. Lichen planus is
a keratin producing disease that usually affects the buccal mucosa. It is characterised
by the presence of “Wickham’s striae” which are multiple, grey, raised lines
converging towards each other to form a mesh with normal mucosa in between. It is a
relatively benign lesion with a low propensity to transform into SCC. Conversion
rates in the published literature range from 0.4% to 6.5% (Murti et al., 1986;
Holmstrup et al., 1988; Lanfranchi-Tizeira et al., 2003; Bornstein et al., 2006;
Markopoulos et al., 1997; Hsue et al., 2007).
Leucoplakia is commonly referred to as a pre-malignant lesion, but in actual fact it
literally means “a white plaque”. Oral leucoplakia is a predominantly white area of
the oral mucosa that cannot be characterised as any other definable lesion (Axell et
al., 1996). Histologically it is represented by hyperkeratosis with varying degrees of
dysplasia (Lodi et al., 2006). A proportion of these lesions undergo malignant
transformation with reported rates in the literature ranging from almost 0% to 20%
(Lind, 1987; Schepman et al., 1998; Silverman S Jr et al., 1984). Erythroplakia is a
variant of leucoplakia which appears as a red, velvety, mucosal patch. It represents

19
epithelial atrophy, inflammation and subepithelial telangectasia. This type of lesion
confers a much greater risk of being associated with cancer with upto 91%
representing either carcinoma in situ or invasive SCC (Boyle and Strong, 2001).
Histopathological analysis of lesions biopsied from the oral mucosa are often referred
to as dysplastic. The term “dysplasia” was originally used to describe an abnormality
of development, such as renal dysplasia and bronchopulmonary dysplasia, which have
no pre-cancerous association. In pathology, dysplasia refers to a combination of
abnormal cytological appearances and abnormal tissue architecture which occurs
principally in the epithelia. Its importance lies in its pre-cancerous association
(Lakhani et al., 1993). A dysplastic cell is one which displays considerable
pleomorphism (variation in size and shape) and has deeply stained (hyperchromic)
nuclei which are abnormally large for the cell. There is also an increase in mitotic
activity which is not confined to the basal layer of the epithelium where this usually
occurs. The cells lose their usual ordered architecture and exhibit a haphazard
arrangement (Kumar et al., 1997).
Dysplasia is often categorised as mild, moderate or severe in nature. The distinction
between the three is made on the extent of the tissues involved. Mild dysplasia usually
refers to changes affecting the lower third of the epithelium and can be difficult to
distinguish from an inflammatory response. Moderate dysplasia refers to changes
reaching the middle third of the epithelium and severe dysplasia occurs when the full
thickness of the epithelium is involved and is often referred to as carcinoma in situ
(Lakhani et al., 1993). Attempts to replace this traditional subdivision by other
grading systems, such as the squamous intraepithelial neoplasia grading system or the

20
Ljubljana classification, have not been successful and are not in widespread use
(Brennan et al., 2007).
1.5.2 Malignant Conditions.
The vast majority of malignant tumours found in the oral cavity are of the squamous
cell carcinoma type, so much so that oral cancer and oral squamous cell carcinoma are
often used synonymously. Oral squamous cell carcinoma makes up almost 90% of all
tumours found in the oral cavity (Brown et al., 2001). Salivary gland tumours are the
second largest group of tumours affecting the oral cavity making up around 7% of the
total. Melanomas, sarcomas, lymphomas and metastases from other sites make up the
remaining (Watkinson et al., 2004). The majority of oral cancers (35%) occur in the
tongue making this the most common site followed by carcinomas of the floor of
mouth (30%), lower alveolus (15%), buccal mucosa (10%), upper alveolus/hard
palate (8%) and the retromolar region (2%) (Shiboski et al., 2000; Barasch et al.,
1995). Oral squamous cell carcinoma primarily spreads to the regional nodes in the
head and neck region. Tumours of advanced T stage are most often associated with
distant spread. The lung is the most common site for distant spread (66% of lesions),
with bone (22%), liver (10%), skin and mediastinum being other sites for distant
metastasis (Ferlito et al., 2001).
1.5.2.1 Squamous cell carcinoma(SCC).
As previously stated this type of cancer makes up the vast majority of oral cancers.
The average age at diagnosis is 60 years with 95% of all SCCs of the oral cavity being
diagnosed in patients aged >40 years. The male:female ratio was around 6:1 in the
1950s, but more recently there has been an increase in the female incidence and the
male:female ratio was estimated at 2:1 in 1997 (Broom et al., 1998).

21
SCCs of the oral cavity can be further divided up into three distinct macroscopic sub-
groups those being exophytic, ulcerative or infiltrative. These types often coexist but
the most commonly occurring types are the ulcerative and infiltrative cancers with
exophytic ones being much rarer. SCC consists of malignant cells of squamous
differentiation as evidenced by keratin formation and the presence of intracellular
bridges. It is graded on a three point scale from well differentiated through moderately
differentiated to poorly differentiated depending on the presence of intra or extra
cellular keratin. Despite the widespread use of this grading system it has little bearing
on the prognosis of the patient (Prasad and Huvos, 2001). Various subtypes of SCC
exist including keratinizing, non-keratinising, verrucous, basaloid, spindle cell and
adenosquamous carcinoma.
Keratinising SCC tends to be both ulcerating and fungating with infiltrating margins.
They produce variable amounts of intra and extra-cellular keratin. Microscopically the
cells are large with prominent intracellular bridges. Non-keratinising SCCs are though
to be derived from respiratory tract mucosa and are the less common type. They grow
in a plexiform (weblike) pattern of connecting broad bands (Gassner et al., 2005).
Verrucous carcinomas are a variant of squamous cell carcinomas and represent a very
well differentiated type. They present in the oral cavity as a warty tumour which
grows slowly. Although undoubtedly malignant, they rarely if ever metastasise. They
are difficult to diagnose histologically unless the specimen includes the deep margin
of the tumour which demonstrates keratinising epithelium in long papillomatous folds
growing into the subepithelial tissue.

22
Basaloid SCCs are usually found in the posterior part of the oral cavity and are much
more aggressive than other forms of SCC. At presentation around two thirds of
patients with basaloid SCC will have nodal disease thus the prognosis for this type of
SCC is relatively poor with median survival being around 18 months. This tumour
grows submucosally around a central ulceration. It is composed of closely packed,
pleomorphic cells that form nests and cords.
Spindle cell SCC, also known as sarcomatoid SCC, is again exophytic in nature with a
histological profile resembling malignant fibrous histiocytoma. It has a squamous cell
component and a spindle cell component. The spindle cell component usually makes
up the bulk of the tumour. Most of these lesions are polypoid, firm and pink with a
mucosal attachment that varies from a thin stalk to a broad base. Adenosquamous
carcinoma and adenocarcinoma are thought to arise from the minor salivary glands
found throughout the oral mucosa (Prasad and Huvos, 2001; Gassner et al., 2005).
1.5.2.2 Salivary gland tumours.
Salivary gland tumours can occur within the minor salivary glands of the oral cavity
with the most common malignant tumours being mucoepidermoid carcinoma, adenoid
cystic carcinoma and adenocarcinomas (Spiro, 1986; Spiro et al., 1973; Waldron et
al., 1988). The incidence of malignancy in minor salivary gland tumours has been
reported to be as high as 88%, but more commonly reported to be in the region of
50% (Yih et al., 2005; Satko et al., 2000). These tumours tend to present as slow
growing, non-ulcerative masses in patients between the ages of 30 and 60 years, with
the peak age of incidence around 50 years (Ito et al., 2005; Watkinson et al., 2004;

23
Yih et al., 2005). Other rarer malignant tumours affecting the minor salivary glands
include acinic cell carcinoma, primary squamous cell carcinoma and carcinoma ex-
pleomorphic adenoma.
Adenoid cystic carcinoma is one of the most common tumours affecting the minor
salivary glands and represents between 27% and 55% of this type of tumour (Satko et
al., 2000; Gassner et al., 2005). It usually affects patients in their fifth decade with a
male:female ratio of 1:1.2 (Yih et al., 2005). It has a characteristic cribriform
appearance on microscopy with the interruption of sheets of tumour cells by
cylindrical pseudospaces. Adenoid cystics exhibit perineural invasion which is one of
the hallmarks of this type of tumour. Distant metastasis occur in about one third of
patients and they tend to exhibit haematogenous spread to lungs and bone in
preference to lymphatics (Gassner et al., 2005).
Mucoepidermoid carcinoma is also a commonly found tumour affecting the minor
salivary glands. Reports in the literature state that this type of tumour accounts for
between 22% and 51% of all minor salivary gland malignancy (Pinkston and Cole,
1999; Satko et al., 2000). It can affect patients from 25 years to 90 years with the
average age at diagnosis being 55 years. It affects women more commonly than men
with the male:female ratio being 1:2.5 (Yih et al., 2005). Microscopically this tumour
is composed of mucous secreting and epidermoid type cells. It primarily spreads to
regional lymph nodes with cervical node metastasis reported in upto 24% of patients
at diagnosis (Gassner et al., 2005).

24
Adenocarcinoma is the third most common malignant tumour affecting the minor
salivary glands making up between 12% and 26% of this type of tumour (Pinkston
and Cole, 1999; Waldron et al., 1988; Spiro, 1986). There are two main types of
adenocarcinoma, polymorphous low-grade adenocarcinoma and adenocarcinomas
which lack any characteristic features enabling them to be classified as any other
specific types, hence this is a diagnosis of exclusion (Prasad and Huvos, 2001).
Polymorphous low-grade adenocarcinoma almost exclusively affects the minor
salivary glands. The average age at diagnosis is approximately 60 years but it has
been reported in patients from as young as 20 years to as old as 94 years (Yih et al.,
2005). Microscopically cells are usually small to medium sized, regular in shape and
lack nuclear atypia.
1.6 Symptoms.
Cancers of the oral cavity are often picked up on routine dental examination or
brought to the attention of a family doctor as they are usually felt or seen quite easily
by the patient. They can present as roughness or ulceration on the mucosa of the oral
cavity. Oral cancer can also present in an early form as painless white or red patches
(Zakrzewska, 1999). Due to the complex sensory innervation of the ear provided by a
large number of nerves it is often a site of referred pain. The auriculotemporal branch
of the trigeminal nerve supplies sensation to the tragus, anterior pinna, anterolateral
surface of the tympanic membrane and part of the external auditory canal (Bauer and
Jenkins, 2005). The trigeminal nerve also supplies sensation to parts of the oral cavity
and when oral cancers start to involve these braches patients can present with referred
pain to the ear, which can be difficult to control.

25
1.7 Staging.
The natural history and response to treatment of oral cancer can be difficult to predict
in the clinical setting. The process by which cases of oral cancer are sub-divided into
groups in which the behaviour may be similar is called staging. The process of staging
not only allows an attempt to predict the behaviour of a cancer but also allows for a
meaningful comparison of clinical and biological data both nationally and
internationally. An idea of the patient prognosis for each stage of the disease can be
formed and, most importantly, a guide to suitable treatment is provided by the stage of
the disease.
In order to accurately stage a cancer a number of factors need consideration. Firstly
the primary site of the tumour e.g. whether this is oral cavity or lung, as the primary
site alone has a bearing on outcome. Once the primary site has been determined the
size of the tumour at this site must then be considered, with larger tumours and those
which involve surrounding tissues being associated with a less favourable outcome.
Once this has been established other factors to consider are the presence or absence of
lymphatic or blood borne metastasis. Together these make up the so-called tumour
(T), node (N), metastasis (M) or TNM system of staging cancer. There are
traditionally two staging classifications for head and neck cancer: those of the
American Joint Committee on Cancer (AJCC) and the Union Internationale Contre le
Cancer (UICC), which over the years have converged to an almost identical
classification system. The TNM classification for oral cavity cancer is shown below.

26
Tumour :
T1 tumour 2cm or less in greatest diameter
T2 tumour more than 2cm but less than 4cm in greatest diameter
T3 tumour more than 4cm in greatest diameter
T4 tumour invades adjacent structures
Node :
Nx regional nodes cannot be assessed
N0 no regional lymph node metastasis
N1 metastasis in a single ipsilateral lymph node 3cm or less in greatest diameter
N2a metastasis in a single ipsilateral lymph node greater than 3cm but less than
6cm in greatest diameter
N2b metastasis in multiple ipsilateral lymph nodes all less than 6cm in greatest
diameter
N2c metastasis in bilateral / contralateral lymph nodes all less than 6cm in greatest
diameter
N3 metastasis in any regional lymph node of greater than 6cm in maximum
diameter
Metastasis :
Mx distant metastasis not assessed
M0 no distant metastasis
M1 presence of distant metastasis
(reproduced from UICC handbook 1997)

27
1.8 Treatment.
There are a number of standard treatment options for oral cancer. These include
surgery, radiotherapy, chemotherapy or a combination of all three. The selection of
the treatment regime depends mainly on the extent of the primary tumour, the T-stage,
but other factors such as tumour infiltration, anatomical sub-site and lymph node
status also play a role (Stambuk et al., 2007). The histological grade of the tumour,
whilst needing consideration, is overridden by the T stage and anatomical subsite. No
large, well designed prospective randomised controlled trial yet exists comparing each
of the above three modalities (Licitra et al., 2002; Oliver et al., 2007b).
The management of the primary disease in oral squamous cell carcinoma has changed
considerably over the last twenty years. The treatment of choice in many countries is
now surgery with radiotherapy being used as an adjunct for those patients at risk of
recurrence (Day et al., 2003; Woolgar et al., 1999). The impact of surgical treatment
for oral cancer can have a profound effect on a patients quality of life, compromising
speech, mastication and appearance (Rogers et al., 1998). In some anatomical
subsites, such as the mobile tongue, surgery is preferred to radiotherapy due to its
proximity to adjacent radiosensitive structures of the teeth and mandible (Oliver et al.,
2007b). Although post operative radiotherapy is used to achieve improved local
control rates. The decision to follow surgery with radiotherapy is based on a
pathological assessment including pattern of invasion, resection margins and nodal
status (Langendijk et al., 2005). There is little doubt as to the usefulness of
radiotherapy in those cases were patients are at high risk of tumour recurrence with
involved resection margins and extra-capsular spread in the nodal disease (Brown et
al., 2007). Doubt still exists as to the role radiotherapy plays in those patients at

28
intermediate risk of recurrence were resection margins are clear but within 5mm and
were there is positive nodal disease in the neck without any extra-capsular spread
(Oliver et al., 2007b).
For more advanced tumours staged T3 or T4, where failure rates following
radiotherapy are relatively high (Licitra et al., 2002), or for those cases involving
cervical lymph node metastasis, surgery is the preferred option in combination with
radiotherapy ,to gain disease control. Inagi et al.,(2002) showed a five year survival
rate for stage three and four disease of 74% for those cases of oral cancer treated with
surgery alone and 47% for those treated with radiotherapy alone. When considering
the survival of patients with stage four disease the five year survival is much worse.
One study showed a five year survival of 43% when patients were treated with
surgery alone and 58% when surgery was combined with post operative radiotherapy
(Hicks, Jr. et al., 1997). Surgical excision often needs to be quite extensive but, with
the improvement in reconstructive surgical techniques, functions such as swallowing
are more often maintained now than was previously possible. In many cases
radiotherapy is needed after the surgical resection. For example if the original tumour
was considered bulky, resection margins were positive or if there was evidence of
extracapsular spread of an involved lymph node on histological examination
(Zelefsky et al., 1992). When radiotherapy is to be given post operatively it is best
commenced three weeks after the initial surgery and certainly not delayed longer than
six weeks (Lapeyre et al., 2004). This allows some healing to take place at the site of
surgery without allowing the tumour to repopulate. Improved outcome has been
shown with the addition of post operative radiotherapy for those tumours staged at T4

29
on initial diagnosis (Zelefsky et al., 1992; Gehanno et al., 1993; Spiro and Spiro,
1989; Pinsolle et al., 1992).
Treatment of the N0 neck has remained an area of some debate for those cancers
affecting the oral cavity. Whilst some papers have shown no increase in survival if
either elective neck dissection is carried out at the time of the initial surgery or when
neck metastasis are identified during follow-up, they still advocate a policy of elective
neck dissection (Hicks, Jr. et al., 1997; Inagi et al., 2002). A retrospective study with
nearly 1000 cases of oral cancer over a 40 year period again showed no significant
improvement in survival when treating the N0 neck. They recommend a policy of
observation with treatment reserved for positive neck nodes found during follow-up
(Sessions et al., 2000).
Where metastatic disease i.e. M1 disease, is encountered, palliation is usually the aim
of any treatment. Although the risk of distant metastasis is low at presentation it can
be as much as 40% during the follow-up period (Lee et al., 1993; Leemans et al.,
1994; Calhourn et al., 1994). The most common site for metastatic deposition is the
lung followed by the liver and then bone (Calhourn et al., 1994; Leemans et al., 1994;
Massard et al., 1993). Chemotherapy is the usual modality of treatment chosen but
there is only a 40-70% expected response rate (Licitra et al., 2002). Surgery can play a
role for some types of lung metastasis. When it is a solitary lesion presenting more
than one year from the initial head and neck primary, it is very difficult to
differentiate between this being a metastasis or a primary lung tumour. Therefore an
aggressive surgical approach should be taken. Five year survival rates for this type of
situation range from 20-30% (Mazer et al., 1988; Adelstein, 1994).

30
1.9 Prognosis.
Prognosis depends on a number of factors. Some are related to the tumour site, stage
and histological grade and some are related to the patient. Absolute survival of the
patient is usually lower than the disease specific survival due to deaths from other
related diseases or second primaries (Bataini et al., 1990).
Five year survival rates for T1 and T2 oral cancer are reported between the 70-90%
range, but as with other head and neck cancer subsites the prognosis decreases by
50% in the presence of metastatic neck nodes (Boyle and Strong, 2001). The five year
survival for patients with much more advanced stage, especially those with bulky or
bilateral lymph node involvement, is less than 20%. By the addition of post operative
radiotherapy the survival of later stage disease has been increased to between 50-60%
(Vikram et al., 1984). Factors which predict improved survival in oral cancer patients
are low T-stage, low N-stage and absence of significant co-morbidities (Boyle and
Strong, 2001). The histological grade of the tumour probably has some bearing on the
outcome, but this is by no means as significant as the T and N stage (Bataini et al.,
1990). Many patient factors have been shown to adversely affect the overall outcome.
Daily alcohol intake, smoking, gender, earache, pain, dysphagia, weight loss, oral
bleeding, odynophagia, the American Society of Anaesthesiologists surgical risk
score, haematocrit level and lymphocyte count all have a bearing on the prognosis
(Lee et al., 1993; Massano et al., 2006).
The recurrence rates quoted in the literature for all head and neck squamous cell
carcinoma (HNSCC) range from 18-76% (Carvalho et al., 2003). Fewer studies exist
which focus exclusively on oral cancer but in those which have been published

31
recurrence rates range from 19-53% (Shikama et al., 2003; Eckardt et al., 2004;
Carvalho et al., 2003). Obviously this is quite a large range, and a number of factors
may contribute. Each team seems to use a different definition of recurrence and many
of the papers in the literature do not concentrate on any particular head and neck sub
site.
Shikama et al., (2003) studied a population if 161 patients with HNSCC who were
treated with a combination of radiotherapy and surgery. Of this group 82 patients had
tumours of the oral cavity. In patients with oral cavity tumours the 5-year overall
survival rate was 56% and the 5-year loco-regional recurrence rate (LRR), was found
to be 47% compared to 23% for other sites (p=0.016). A recurrence was defined as a
local recurrence, regional nodal recurrence or both. Further analysis was performed
on the individual oral sites and the LRR for tongue, oral floor and other oral cavity
cancer was 42%, 47% and 52% respectively.
(Eckardt et al., 2004)Eckardt et al., (2004) looked at a sample of 1000 HNSCC of
whom 883 patients had oral cavity or oropharyngeal tumours. The patients in this
study were treated with a range of modalities including radiotherapy, surgery and a
combination of both. The recurrence rate was defined as any recurrence of the
primary tumour over the length of the study (20 years). An overall recurrence rate of
19.8% was found with 36.4% of these reported between 6 months and 1 year after the
initial treatment.
Carvalho et al., (2003), between 1954 and 1998, studied a total of 2067 patients
attending their department with oral or oropharyngeal tumours during 1954 and 1998.

32
The patients were treated with a variety of modalities reflecting the change in
regimens over the decades. When the data was analysed an overall recurrence rate of
52.2% was found. This was further classified according to treatment: of 729 (35.3%)
treated with radiotherapy alone a recurrence rate of 22.5% was noted.
The use of radiotherapy has been shown to improve the prognosis of certain groups of
oral cancer (Vikram et al., 1984). When it is used as the primary treatment modality it
not only treats the cancer in question but also treats the surrounding mucosal field in
the oral cavity. If however, the tumour does not respond to radiotherapy, then not only
is the prognosis worsened but the patient is left with unpleasant side effects from the
radiotherapy itself, with no benefit. Being able to predict this response to radiotherapy
before treatment would improve prognosis and avoid unwanted side effects for these
patients.
1.10 Potential Markers of Radioresistance.
With the advance in modern molecular research techniques the mechanisms by which
radiotherapy causes cell death have become clearer. Briefly, the ionising radiation
causes damage to a cells’ double stranded DNA. This damage is then detected via
various proteins and the cell cycle is paused whilst an attempt is made to repair the
DNA. In cancers which are radiosensitive the mechanisms of detection and repair are
inappropriate and less effective than in normal tissue or the damage is so great that the
apoptosis pathway is activated and the cell starts the process of programmed cell
death (Rosen et al., 2000). DNA is more susceptible to damage in rapidly dividing
cells which means that although cancer cells are primarily targeted, rapidly dividing
cells in normal tissue i.e. mucous membranes and salivary tissue, are also affected
(Oliver et al., 2007a). The mechanisms by which tumour cells become radioresistant
33
are complex and the exact molecular pathways remains to be elucidated. Many factors
exist which act at different points of the cell cycle changing the susceptibility to
radiotherapy. After exposure to ionising radiation the cell cycle is usually paused via
various check points, if these are defective through mutation or carcinogenesis then a
cell may avoid apoptosis (Bristow et al., 1996).
Early studies into radioresistant oral cancer employed techniques available at the time
such as cytological analysis (Silverman and Sheline, 1961; Gupta et al., 1987; Memon
and Jafarey, 1970). As things have moved on various genes and gene products have
been investigated using techniques such as polymerase chain reaction (PCR) and
immunohistochemistry which are good at studying single factors. Further
advancements in molecular techniques have opened up a new field of study, namely
microarrays, which enable thousands of genes/ gene products to be analysed
simultaneously. Data from each of these techniques will be discussed in turn.
1.10.1 Cytological Predictors.
Cytological analysis of the nuclei of cancer cells has been used as an attempt to
predict radiotherapy response in oral cavity SCC in the past by examining the
histomorphological changes of the nucleus such as micronucleus formation
(Silverman and Sheline, 1961; Gupta et al., 1987; Memon and Jafarey, 1970). During
mitosis any chromosomes or chromosome fragments which lag behind and are not
incorporated into the daughter nucleus are known as micronuclei. The presence of
micronuclei suggests that the cell suffered some form of chromosomal damage and
micronucleated cells are considered to be dying (Midander and Revesz, 1980). There
have also been a number of recent studies using serial cytological changes induced by
a course of radiotherapy to aid in the prediction of response to radiotherapy

34
(Narayanan et al., 1998; Bhattathiri et al., 1998; Bhattathiri et al., 1996; Bindu et al.,
2003).
Bhattathiri et al., (1996) analysed tumour cytology smears from 49 patients with oral
SCC whilst they underwent a course of fractionated radiotherapy to a total of 60Gy.
During the follow up (median time of follow-up being 14 months) 57% of the patients
developed a recurrence and were classified as radioresistant. Light microscopy was
used to identify micronucleated cells (MNC) in the smears. In this study no smears
were taken after 12Gy as it was deemed too difficult to distinguish tumour from
normal tissue. It was found that radioresistant and radiosensitive tumours
demonstrated the same proportion of MNC before and after treatment, and they both
showed an increase in MNC during treatment. Although the increase in MNC
occurred earlier in the radioresistant group, and reached a plateau which did not occur
in the radiosensitive group, these differences were not found to be statistically
significant.
Narayanan et al., (1998) performed a similar study on 44 patients with oral SCC.
During this study 59% of patients developed recurrence and the smears were taken up
to a dose of 28Gy i.e. half the total treatment dose. The tumours classed as
radioresistant were defined as those which developed a recurrence at any time during
follow up. Patients were followed up for a minimum of 30 months or until they
developed a recurrence. When the data were analysed a significant difference was
found in the MNC count at 28Gy (p-value=0.05). This group concluded that the
method could help detect treatment response during the course of radiotherapy but not
before commencement. This second study (Narayanan et al., 1998) found a significant

35
difference after extending the dose at which smears were obtained, as compared with
Bhattathiri et al., (1996). However, these results require further verification due to the
difficulty in identifying tumour during the course of radiotherapy and it must be
remembered that the technique does not appear to have any pre-treatment predictive
value in oral SCC despite having proved useful in other tumour types such as cervical
(Zolzer et al., 1995).
Bhattathiri et al., (1998) performed a study on 69 patients with OSCC undergoing
radiotherapy to a mean dose of 52.5Gy. They again took smears from the tumour both
before and during the course of radiotherapy to a dose of 38Gy. The patients were
followed up for 18 months or until they developed a recurrence at the primary site.
During this time 54% of the patients developed a recurrence and were termed
radioresistant. By light microscopy multiple changes in the morphology of the cell,
including multinucleation, micronucleation and nuclear budding were observed. It
was concluded that the radioresistant group of tumours exhibited a lesser degree of
change when compared to the radiosensitive group and although the change in the
characteristics was noted to be statistically significant (p<0.05) during the treatment
period no mention of the statistical significance between the two groups was
mentioned after the final analysis. The highly subjective nature of the assessment also
raises questions regarding widespread applicability.
Whilst a number of reports seem to offer a method by which response to radiotherapy
can be monitored and predicted during the treatment, none offer a reliable way of
predicting response to radiotherapy prior to treatment. As the two studies with
statistically significant results took smears upto 28Gy (Narayanan et al., 1998) and

36
38Gy (Bhattathiri et al., 1998) respectively there will be little benefit gained in terms
of avoiding the unpleasant side effects of radiotherapy.
1.10.2 Microvessel Density (MVD)
For a tumour to grow and survive past approximately 1mm3 it must induce a blood
supply to gain oxygen and nutrients, thus angiogenesis plays an important role in the
development of a tumour. Conversely hypoxia is thought to be one of the major
causes of radiotherapy failure as the formation of oxygen free radicals is how the
DNA is damaged (Littbrand and Revesz, 1969). So, increased angiogenesis can be
both a poor prognostic factor as well as potentially being responsible for improving
the chances for successful radiotherapy. One of the simplest and most widely
accepted ways of assessing angiogenesis is to look at microvessel density (MVD) i.e.
to examine how many new vessels have been formed. An alternative way is to
examine the expression of vascular endothelial growth factor (VEGF) which will be
considered later in this review.
Only three studies exist which have focussed exclusively on oral SCC, MVD and
response to radiotherapy (Brun et al., 2001; Shintani et al., 2000; Aebersold et al.,
2000). Brun et al., (2001) looked at 39 cases of oral SCC which all underwent pre-
operative radiotherapy (50Gy) and assessed the MVD both before and after
radiotherapy by staining with antibodies to von Willebrand factor. Although a high
degree of MVD correlated with a poor prognosis, it had no relation with response to
radiotherapy. Shintani et al., (2000) studied 41 cases of OSCC again with regards to
MVD before and after radiotherapy, and found that MVD decreased after
radiotherapy but once again established that there was no correlation between MVD

37
and radiotherapy response. In the largest study of its type Aerbersold et al., (2000)
studied a population of 100 patients with OSCC all of whom received radical
radiotherapy with a median dose of 74Gy. Intratumoral MVD was identified by
staining with antibodies to CD31. This study found that MVD did predict for response
to radiotherapy (p=0.01).
These three studies have given disparate results in terms of predicting the response of
a tumour to radiotherapy. A variety of reasons may be responsible for this including
the number of subjects in each study, amount of radiotherapy, stage of the tumours in
the study and the combined use of other treatment modalities (chemotherapy and
surgery) all are likely to confuse the picture. Aerersold et al., (2000) studied a
population of patients of whom 88% had T-stage 3 or 4, whilst the other two studies
had only approximately 50% of their study population falling into this group. Whilst
this will have an effect on the outcomes of the studies the most important factor is the
definition used for a radioresistant tumour. Whilst Brun et al., (2001) and Shintani et
al., (2000) used a definition which effectively excluded any late recurrences by only
looking at the initial response to radiotherapy Aerbersold et al., (2000) used a more
lenient definition which allowed for any recurrence be it early, late or at a distant site.
Thus the role MVD has in predicting radioresistance is not currently clear.
1.10.3 Molecular Determinants of Response to Radiotherapy.
1.10.3.1 The role of p53.
The p53 gene is one of the most commonly occurring mutated genes in cancer. The
p53 gene encodes a nuclear protein which is involved in many important cellular
processes such as apoptosis, DNA synthesis and gene transcription. When a cells’
DNA is damaged by ionising radiation this damage is detected and the level of p53

38
protein is stabilised. The cell cycle is paused and the resultant response determines
whether the cell enters into apoptosis or a DNA repair/survival pathway (Rosen et al.,
2000). A cell may however undergo p53 independent apoptosis if the dose of
radiotherapy is high enough and DNA is sufficiently damaged (Jayasurya et al.,
2004). Many studies utilise immunohistochemistry as a method to detect the presence
of mutated p53. This method assumes that very occasional positive staining of tumour
cells correlates with an accumulation of wild type (WT) p53 in response to DNA
damage while intense staining of most cells is due to mutation of the gene itself as
p53 has a much longer half life than the normal counterpart which is usually
undetectable (Aebersold et al., 2000).
The current literature was searched using the search terms radiation tolerance,
radioresistance, radiotherapy, radiosensitivity, mouth neoplasm and oral cancer and a
total of six studies which looked exclusively at the relationship between p53, oral
cancer and radiotherapy were identified (Grabenbauer et al., 2000; Jayasurya et al.,
2004; Girod et al., 1998; Yamazaki et al., 2003; Alsner et al., 2001; Koelbl et al.,
2001) (Table 1.1). The results obtained from these papers are both confusing and, in
some cases, contradictory. Whilst Grabenbauer et al., (2000) found that increased
staining for p53 protein correlated with tumour radiosensitivity (p=0.002) Jayasurya
et al., (2004) concluded the exact opposite (p=0.002) and Koelbl et al., (2001) found
no relationship between the two factors. Why the results should be so varied has a
number of likely explanations.

39
Author Year Countryof Study
Number Predictor forradioresistance
P-value
F/U Method
Girod et al.,(1998)
1998 Germany 90 Decreased p53staining
- Immediateresponse
Immuno
Grabenbauer etal., (2000)
2000 Germany 102 Decreased p53staining
0.002 43 months Immuno
Alsner et al.,(2001)
2001 Denmark 58 Mutated P53 0.003 74 months DGGE
Jayasurya et al.,(2004)
2004 India 125 Increased p53staining
0.002 48 months Immuno
Yamazaki et al.,(2003)
2003 Japan 49 Mutated p53 - Immediateresponse
PCR
Koelbl et al.,(2001)
2001 Germany 88 No relationship - 53 months Immuno
Table 1.1 Studies showing relationship between p53 and response to radiotherapy. Immuno –
immunohistochemistry, DGGE – denaturing gradient gel electrophoresis, PCR – polymerase chain
reaction.
Firstly, different parts of the world have different habits and cultures. Whilst chewing
tobacco and related products is popular in India it is relatively uncommon in Western
Europe. This may lead to different tumour characteristics in different populations and
effect study results. Jayasurya et al., (2004) concluded that an increased staining for
p53 predicted for radioresistance, studied a group of 125 patients with oral SCC all
from the Indian sub-continent out of which just over 80% chewed tobacco but the
group studied by Koelbe et al., (2001), whose study showed no relationship, came
from Germany where chewing tobacco is relatively uncommon.
The choice of treatment regime may also have an effect on the study results. Two of
the studies, Jayasurya et al., (2004) and Alsner et al., (2001) examined cases that were
treated with radiotherapy alone and concluded similar results, that increased

40
expression of p53 correlates with a radioresistant tumour. However, the group studied
by Grabenbauer et al., (2001) received post operative radiotherapy and concluded that
increased expression of p53 correlates with a radiosensitive tumour and the group
studied by Koelbl et al., (2001) received pre-operative radiochemotherapy and could
find no correlation between the expression of p53 and radiotherapy response. So it
seems that the timing of radiotherapy as well as the other choice of treatments has a
direct effect on the predictive value of p53.
When looking at the studies that utilised immunohistochemistry to detect over or
under expression of p53 (Girod et al., 1998; Jayasurya et al., 2004; Grabenbauer et al.,
2000; Koelbl et al., 2001) a number of different scoring methods have been used.
Grabenbauer et al., (2000) used a densitometer to score the slides, Jayasurya et al.,
(2004) used two people blinded to the pathological information who scored the slides
by examining the invading tumour fronts and, although Koelbl et al., (2001) again
utilised two independent scorers, they evaluated 400 tumour cells in four randomly
chosen high power fields of the tumour mass.
The definition used by each of the groups as to what constitutes a radioresistant
tumour varies widely and hence will also have an effect on the results. Whilst
Grabenbauer et al., (2000) and Alsner et al., (2001) included any recurrence at local or
distant sites during the follow up period (43 and 74 months respectively), Jayasurya et
al., (2004) and Koelbl et al., (2001) included only local recurrence during the follow
up period (48 and 52 months respectively) and (Girod et al., 1998)Girod et al., (1998)
simply looked at the initial effect radiotherapy had on the tumour thus excluding any
later local or distant recurrences.

41
From the published studies it is not possible to gain a consensus at the current time
over the role p53 has in predicting response to radiotherapy. The conflicting results
are almost certainly in part due to the different characteristics of the individual studies
but the complex role p53 has on the function of both normal and cancerous cells will
undoubtedly further confuse the issue.
1.10.3.2 DNA Protein Kinases.
The DNA protein kinase complex (DNA-PK) is involved in one of the major
pathways by which a cell responds to DNA double strand breaks induced by ionising
radiation (Jeggo et al., 1995). It consists of a heterodimer comprising 70- and 80 kDa
proteins termed Ku and a 465-kDa serine/threonine protein kinase catalytic subunit
termed DNA-PKca. The Ku component functions as an activator of the catalytic
subunit, and also represents the major double-stranded DNA-binding protein (Gottlieb
and Jackson, 1993). As such it would be expected that the over or under expression of
proteins which make up this complex could have some predictive value with regards
to the response to radiotherapy. When the PubMed database was searched using the
MeSH terms mouth neoplasms, radiation tolerance and DNA protein kinases only one
paper was found (Shintani et al., 2003).
Shintani et al., (2003) performed a study on 42 human oral SCC specimens, all of
whom had received pre-operative radiotherapy. An immunohistochemical analysis
was performed with antibodies against DNA-PK complex proteins. Although the
study found an increase in the expression of DNA-PK complex proteins after
radiotherapy there was no relationship between response to radiotherapy and DNA-
PK complex proteins.

42
1.10.3.3 Vascular Endothelial Growth Factor (VEGF).
Angiogenesis plays an important role in the development of radioresistance in many
types of cancer and a link has already been established in cervical and breast cancer
(Toi et al., 2001). VEGF encompasses a family of proteins which strongly promote
new vessel growth and formation. They act via receptors principally found on the
vascular endothelium (Ferrara et al., 1992). VEGF causes an up regulation of the
antiapoptotic protein Bcl-2 thus protecting cells from the effects of radiotherapy
(Ferrara, 2004). There have only been four studies on oral cancer exclusively, which
have attempted to correlate the levels of VEGF with the outcome of radiotherapy
(Harari and Huang, 2001; Tamatani et al., 2004; Shintani et al., 2000; Smith et al.,
2000). Shintani et al., (2000) analysed 41 oral SCCs using immunohistochemistry to
detect the presence of VEGF both before and after the tumour had been exposed to
fractionated radiotherapy. The polyclonal antibody used in this study detected the
precursor to VEGF and the VEGF-A isoform. In this study radioresistance was
defined as tumour regression of <50% of the initial tumour size on macroscopic
examination. Detection of VEGF could not be done on all of the specimens both
before and after radiotherapy as 12 of the cases showed a complete response and no
tumour tissue remained. This study concluded that VEGF was up-regulated in all of
the tumours surviving radiotherapy as the levels of VEGF in the post-radiotherapy
specimens were increased. The authors hypothesised that the radioresistant tumour
cells had the potential to up-regulate VEGF in response to DNA damage. (Smith et
al., 2000)Smith et al., (2000) studied a total of 56 patients treated with a combination
of surgery and post operative radiotherapy (to a median dose of 60Gy).
Immunohistochemistry was performed on tissue sections from the primary tumour
before therapy began. Any tumour at local, regional or distant sites was taken to be a

43
recurrence and thus indicate a resistance to radiotherapy, however they did analyse
each site of recurrence separately. They found that increased staining for VEGF
predicted any recurrence (p=0.007) and also predicted for local recurrence (p=0.04).
Harari and Huang, (2001) and Tamatani et al., (2004) both performed in vitro studies
on Oral SCC and whilst neither found any predictive value to VEGF they both found
VEGF to be of key importance to the mechanism by which tumours respond to
radiotherapy.
These studies suggest both a possible mechanism for the development of
radioresistance and a way of predicting a response to radiotherapy before treatment
begins. More clinical studies with a better standardised definition of radioresistance
are needed before any firm conclusions can be drawn.
1.10.3.4. Cyclooxygenase-2 (COX-2).
Prostaglandins are synthesised from arachidonic acid and the cyclooxygenase (COX)
enzymes are essential for this process. There are two isoforms of this enzyme
conveniently named COX-1 and COX-2. Of the two isoforms COX-2 is induced
during pathological processes such as inflammation and cancer (Lin et al., 2002)
including that of the head and neck region. One study exists that investigated COX-2
expression in histological biopsy specimens of oral SCC (Terakado et al., 2004). In
this study biopsy samples were taken from 41 patients with oral SCC both before
radiotherapy and after surgery, and immunohistochemistry was used to evaluate the
expression of COX-2. Radioresistance was determined from the surgical specimens
by analysing tumour mass remaining after the course of radiotherapy i.e. if two thirds
or less of the tumour mass did not show a response to radiotherapy the tumour was

44
deemed radioresistant. Of the biopsy specimens 26 were scored as having a poor
response to radiotherapy. When this was combined with the expression of COX-2, 17
of these specimens had a high level of COX-2 expression and statistical analysis
showed a significant relationship between the over expression of COX-2 and
radioresistance (P=0.047). Although this study is encouraging in its positive findings,
and correlates well with the findings from a study on laryngeal biopsy specimens (Nix
et al., 2004), the definition of radioresistance used in this instance does not take into
account any tumours which may recur after the immediate treatment, thus some
radioresistant and poor prognosis tumours will have been excluded from this group.
1.10.3.5 Bcl-2 Family.
These are a group of proteins which are intimately involved in programmed cell death
and are best described as being in two groups, those which promote and those which
inhibit cell death. Promoters include bax, bak, bcl-xS, bad and bid and inhibitors
include bcl-2, bcl-xL and bcl-w (Nikitakis et al., 2004). A number of radioresistance
factors discussed e.g. EGFR, p53, DNA-PK complex and COX-2 exert their effects
by modulating the apoptotic process. Whilst studies exist on the prevalence and
prognostic value of the Bcl-2 family in oral SCC (Loro et al., 1999; Xie et al., 2003;
Xie et al., 1999; Vora et al., 2003) studies relating the response to radiotherapy, Bcl-2
and oral SCC are awaited .
1.10.3.6 Epidermal Growth Factor Receptor (EGFR).
The family of epidermal growth factor receptors (EGFR) consists of four tyrosine
kinase transmembrane receptors which lie at the heart of a multitude of cell processes
including cell proliferation, angiogenesis, migration and apoptosis (Harari, 2004). The
45
EGFR signalling network is highly complex and consists of many layers. At present
there are ten different ligands known to activate this pathway in mammals, epidermal
growth factor (EGF) and transforming growth factor alpha (TGF-α) being two of the
more well known. When the pathway is activated in the majority of cases the result is
stimulation of cell growth (Yarden, 2001). However, this network has many other
effects on the cell and when the receptor is activated by its’ ligands e.g. TGF-, it
can cause activation of the signal transduction molecule stat3 which in turn promotes
a rise in the antiapoptotic gene products such as bcl-xL (Nikitakis et al., 2004; Song
and Grandis, 2000). The theory that blocking this receptor would enhance the effects
of radiotherapy, by decreasing the anti-apoptotic proteins, has been tested on a
number of occasions (Gee and Nicholson, 2003; Huang et al., 1999; Harari and
Huang, 2001; Huang et al., 2002). Huang et al., (1999) performed a study on cell lines
derived from human HNSCC. The cell lines used in the study were from the floor of
mouth, tonsil and facial epidermis. An antibody, C225, was used to inhibit the effects
of EGFR, and the growth of all cancer cell lines was inhibited. The cells were then
exposed to a standard regime of radiotherapy in combination with the C225 antibody.
It was found that C225 significantly enhanced the effect of radiotherapy (P=0.001).
Harari and Huang, (2001) took this theory one step further and using the same cell
lines they induced tumour growth in athymic mice, exposed them to C225 and then to
fractionated radiotherapy. They also found a significant increase in the response to
radiotherapy in those tumours exposed to C225. Huang et al., (2002) used a different
anti-EGFR agent, Iressa/ZD1839 a tyrosine kinase inhibitor, on tumours induced in
athymic mice and once again showed a markedly improved response to radiotherapy.
46
Harari and Huang, (2001) performed a study on cell lines developed from oral SCC
which induced tumours in mice. They used C225 combined with radiotherapy and
assessed levels of VEGF using immunohistochemistry both before and after
treatment. They found that the expression of VEGF was reduced after radiotherapy
alone and was reduced further when combined with the effect of C225. A further
study performed by a different research group (Tamatani et al., 2004) using tumour
bearing nude mice concluded that the production of angiogenic factors such as VEGF
in response to radiotherapy, was the major method of inducible radioresistance.
The C225 antibody has been used in a number of phase one, two and three trials,
under the trade name “Cetuximab”, treating a broad group of patients with all types of
head and neck cancer (Baselga, 2001). The trials also involved many other forms of
cancer including lung and colorectal cancer. The results of a large randomised
controlled trial involving 424 patients with advanced head and neck cancer were
published in June 2004. In the two arms of the study the patients were either given
high dose fractionated radiotherapy alone or this in combination with cetuximab. It
was found that the median survival of patients in the cetuximab arm had a near
doubling of their median survival time from 28 months to 54 months (Harari, 2004).
1.10.4 Future Techniques.
All of the studies quoted in this review so far have studied expression of a single gene
or protein with varying degrees of success. The process of studying gene expression
has been a time consuming process in the past with individual genes having to be
studied separately. In the last few years the advent of microarray technology has
revolutionised this field, allowing a large number of genes to be studied
47
simultaneously and comparisons to be made between two distinct groups of tumours
or between normal and tumour tissue (Varley, 2001).
1.10.4.1 Microarray Techniques.
Hanna et al., (2001) obtained biopsies from patients undergoing radical resections for
head and neck SCC but do not specify in their paper from which site these were taken.
They performed gene expression analysis using the Atlas human cancer 1.2 cDNA
microarray on two biopsies from radioresistant tumours and two from radiosensitive
tumours. The aim of the study was to try and identify a cluster of genes which would
more accurately predict the radiotherapy response than a single marker.
Out of the 1187 genes on the microarray, they selected 60 for further study. Using
bioinformatics they were able to predict the response to radiotherapy. Many of the
genes that were in the cluster have not been previously studied in the literature e.g.
JAG-2, STAT-3 (Hanna et al., 2001). However, this approach was undertaken
knowing the response to the radiotherapy, has very low numbers and, as stated by the
authors, does not take into consideration the expression of radio-inducible genes that
may also affect the response to radiotherapy. A larger, more controlled study is
required to validate this approach in the hunt for radioresistance genes, but this study
provides encouragement that the approach may prove useful as a profile for
radioresistance was obtained.
1.10.5 Summary of markers of radioresistance.
Out of the potential markers of radioresistance which have been identified so far in
this thesis only a few have demonstrated any real predictive value. Whilst cytological
48
analysis seems able to aid in prediction once a course of therapy has begun, they have
little value beforehand. Intratumoral microvessel density seems to be a more
promising area of study but only one of the three studies found a statistical
significance to their results. VEGF, VEGF-Receptor and COX-2 again look like
possible targets for further research with larger studies and a more standard definition
of radioresistance being essential. Of all the markers referred to in the literature EGFR
is undoubtedly the most promising as a therapeutic target, although as it is over
expressed by 80% of all HNSCC (Harari, 2004), its value as a predictive marker is
limited. With the advent of microarray technology the opportunity has arisen to
profile many genes from each patient with cancer. If a profile, such as the one
developed by Hanna et al., (2001) could be correlated with the outcome of different
treatment regimes this would be an invaluable tool in deciding the treatment regime of
cancer patients in the future. Ideally from the increasing body of microarray data will
come a small panel of key genes that can be tested in a routine screen, and on the
basis of this profile the most appropriate treatment strategy can be adopted.
1.11 Microarray Technology.
A microarray is a small analytical device that allows genomic exploration with greater
speed and precision than previously possible. Glass chips containing tens of thousands
of genes are used to analyse labelled nucleic acids extracted from cells, tissues and
other biological sources (Schena et al., 1998). Molecules in the fluorescent sample
react with the corresponding sequence on the chip which causes each spot to glow
with an intensity proportional to the activity of the expressed gene.
49
This technology is a relatively new entrant to the world of research. It was developed
and in use during the 1980s, but did not come into prominence until the mid 1990s
(Sasik et al., 2004). When it came onto the market in the late 1990s the high price
pushed the technology beyond many labs, and researchers were forced to build
arrayers themselves. With methods of manufacture changing and greater demand, the
price has come down over recent years and the technology has become available to a
growing number of research centres (Gershon, 2002).
Until the conception of microarrays studying gene expression was time consuming
and involved techniques such as Northern and dot blotting. Both of these techniques
involve hybridisation of a labelled gene probe to the RNA from the tissue of interest
in order to assess relative expression levels. They each have their own draw backs
primarily that only one gene at a time can be examined and in the case of Northern
blotting relatively large quantities of RNA are required (Varley, 2001). Microarrays
allow parallelism, miniaturisation, multiplexing (the process by which multiple genes
are analysed in a single assay) and automation which cannot be achieved with the
earlier technologies (Schena et al., 1998).
A simple idea was conceived to improve this process and overcome the
disadvantages, instead of immobilising the RNA from tissues of interest and probe
one at a time for each gene, the process was essentially reversed. The genes were
immobilised on a matrix and the RNA was labelled as a probe. As the Human
Genome Project identified more and more genes so the “array” of genes available to
attach to a matrix became larger and larger (Varley, 2001). Initial estimates on the
number of genes in the human genome were around 150 000 but have steadily

50
dropped to a figure of 30 000 (Varley, 2001). This led researchers to miniaturise the
matrix on which these can be immobilised and the resulting creation was termed a
gene chip. They are also referred to as DNA chips and microarrays.
1.11.1 Types of microarrays.
The first microarray experiments were performed using complementary DNA
(cDNA). A cDNA molecule is a nucleic acid derived from messenger RNA (mRNA).
It is a double stranded molecule that is an exact “complement” of the corresponding
mRNA molecule. As the mRNA only contains the nucleotides corresponding to the
original base pairs contained in the exon portion of the original gene, the sequence
representing the introns is not present in the cDNA. The length of cDNA used in
microarray analysis is typically between 500 – 2500 base pairs. Oligonucleotide
microarrays have now also become commonly used. Oligonucleotides are single
stranded 15 to 70 nucleotide molecules made by chemical synthesis. They are
constructed from genes where the exact sequence is known which means the
investigator can be quite specific about which target is printed onto the microarray.
1.11.2 Manufacturing a gene chip.
Many ways of manufacturing a gene chip have been tried in the past, and these
different methods can be categorised into the method of synthesis or delivery. When a
synthesis approach is used to manufacture chips, they are prepared in a step wise
fashion by the in situ synthesis of nucleic acids and other biopolymers.
Oligonucleotides are built up with each round of synthesis adding more and more
nucleotides until the desired length has been achieved. On the other side, delivery
techniques use exogenous preparations of molecules, such as complementary DNA,
and drop these onto known locations on the “chip” in an alternative approach to using

51
oligonucletides (Khan et al., 1999). There are three main methods of manufacturing
DNA chips photolithography, mechanical microspotting and ink jet technology
(Schena et al., 1998).
1.11.2.1 Mechanical Microspotting.
This was the first widely used method of producing microarrays (Sasik et al., 2004).
Essentially it involves the printing of a small quantity of premade biochemical
substance onto a solid surface i.e. a microscope slide. There is direct surface contact
between the printing substrate and a delivery mechanism containing an array of
tweezers, pins or capillaries. The largest manufacturer of this type of chip is Synteni
USA, and their chips measure approximately 3.6cm2 containing as many as 10 000
groups of cDNA. This method is cheaper than that of photolithography and by
combining chips, upto 40 000 genes can be analysed at any one time (Sasik et al.,
2004; Schena et al., 1998).
1.11.2.2 Photolithography.
The next type of array to emerge onto the market involved in situ synthesised
oligonucleotide arrays using photolithography (Sasik et al., 2004). This is a synthetic
technology which combines methods used in the semiconductor industry with DNA-
synthetic chemistry (Fodor et al., 1991). Unlike the microspotting method, this type of
chip allows hybridisation with cRNA from the test tissues (Sasik et al., 2004). These
chips are manufactured by Affymetrix in the USA. They are about 1.6cm2 in size and
contain 400 000 oligonucleotide groups. As photoprotected versions of the four DNA
building blocks are used in this method, chips can be manufactured from a sequence
database, and the use of synthetic agents minimises any chip to chip variation (Schena

52
et al., 1998). This method is cartridge based and requires the use of specific
equipment that comes as a package. It is much more expensive to use than the other
methods.
1.11.2.3 Ink Jet Technology.
This is the newest method of manufacturing DNA chips. It is similar to the
microspotting approach and there is no direct surface contact instead piezoelectric
forms of propulsion are utilised to transfer biochemical substances from miniature
nozzles to solid surfaces. This has the added benefit of having a theoretically much
higher throughput than the microspotting method (Schena et al., 1998).
1.11.3 Methodology.
Performing a microarray experiment involves a number of steps. Throughout the
experiment the DNA of the test is compared to that of a standard and any differences
in expression are analysed. The first part of the experiment involves extracting mRNA
from the pair of tissues under investigation e.g. RNA from an oral cancer cell line and
RNA from a normal oral cell line. This mRNA is then converted into cDNA using the
method of reverse transcription. The cDNA for the test and standard are then labelled
with different fluorescent dyes, typically one that fluoresces red and one green, see fig
1.8.
Once this has been done, the test samples are mixed and placed onto the microarray
slide where they are left to incubate. At this stage some of the cDNA labelled red or
green will bind to the corresponding oligonucleotide on the slide. Genes which have
been over expressed by one or the other of the test tissues will have relatively more
cDNA in the solution on the array slide. Thus, each spot on the array slide will bind

53
relatively more of that cDNA. Once the slide has been left to incubate the excess,
unbound cDNA is washed off along with the solution in which they were contained.
The slide is then scanned by a laser, first in the red spectrum and then in the green.
Two images are created which are then combined to form a final microarray image.
Each spot can fluoresce red, green, yellow or white. Red or green spots represent
those genes which have been over expressed by that tissue whose cDNA was labelled
with that florescent dye, shades of yellow arise when there has been an almost equal
number of cDNAs’ binding and white spots arise when the spot has been saturated
with cDNA of either type.
1.11.4 Applications.
The most widely used application of microarray technology is in the comparison of
gene expression in two or more populations of cells (Schena et al., 1998; Varley,
2001). All expression studies involve the hybridisation of labelled RNA to either the
cDNA spot or the oligonucleotide attached to the solid support (Varley, 2001). Gene
chips are well suited to this kind of analysis as they focus on the functional
(expressed) parts of the genome. This is an important consideration when working
with the human genome as the ratio of coding to non coding DNA is low (Schena et
al., 1998). Tumour profiling using gene chips has provided the most dramatic
example of the power of the microarray system. The profiling of a tumour can
produce huge amounts of information, but sometimes it is possible to identify groups
of genes whose expression pattern is closely related to specific clinical features such
as drug response, metastatic potential and response to radiotherapy.

54
Fig
ure
1.8
Sch
ematic
diag
ramto
sho
wth
em
ethod
olo
gy
behin
dp
erform
inga
micro
arrayex
perim
ent.
cDN
Ais
createdfro
mm
RN
A,
labelled
with
eachdy
e,th
enh
yb
ridised
toth
earray
slide.
Th
eslid
eis
then
readb
yth
escan
ner
andth
ed
atais
then
ready
tob
ein
terpreted
.

55
Knowing which genes are associated with these characteristics will give clues to the
biological mechanism behind them and may provide novel targets for therapies
(Varley, 2001).
Compounds and therapies can be applied to tumour cell lines and the resultant change
in gene expression determined. This can be used for screening new anti cancer agents,
investigating their mechanism of action and help in establishing how a tumour resists
a particular therapy. The mechanism of key cellular processes can also be investigated
using gene chips by comparing one group of genes to another e.g. comparing the
expression profiles of young, senescent and immortal cells to identify genes involved
in cellular ageing (Varley, 2001).
1.11.5 Advantages of Microarrays.
Microarray assays possess a set of performance specifications that older technologies
are unable to achieve. They allow for massive parallel data acquisition and analysis
thus increasing the speed of experimental progress and allowing meaningful
comparisons of the genes or gene products in the array. In the future it may be
possible to allow the analysis of the whole of the human genome in one experiment
(Schena et al., 1998).
Gene chip technology allows for the miniaturisation of conventional assays thus
reducing reagent consumption, minimising reaction volumes, increasing sample
concentration and accelerating the reaction kinetics. They allow sensitive and rapid
data detection with scanners or cameras equipped with charged-couple devices. The
ability to process multiple samples at the same time “multiplexing” is also possible
with microarrays. In this case, instead of two florescent dyes being used to label two

56
samples, multiple dyes are used for multiple samples which are then analysed on the
same chip. This increases the accuracy of comparative analysis by eliminating factors
such as chip to chip variation, different reaction conditions and other problems in
conducting two separate experiments (Schena et al., 1998).
1.11.6 Disadvantages of Microarrays.
Despite the falling cost of running microarray experiments over the past few years,
the expensive nature of the equipment is still one of the major limiting factors of this
technology (Hafian et al., 2004). This leads to the problem of few researchers being in
a position to repeat their experiments to confirm their results or to compare results
between different microarray technologies (Tilstone and Aldhous, 2003). Commercial
DNA chips were retailing for around $1000 each in 2003, this meant that some
researchers were forced to pool several different samples and apply them to one array.
However, in this type of experiment valuable information on sample to sample
variation maybe lost (Tilstone and Aldhous, 2003).
One of the benefits of microarrays can conversely also be one of its downfalls. The
amount of data that the analysis generates can sometimes be overwhelming and
meaningless. Statistical analysis of the results is often difficult, time consuming and
often requires powerful computer programmes. The relatively high cost of the gene
chips means that the experiments are often not repeated to allow for variations. It is
also difficult to determine whether an apparent two fold change in gene expression is
significant or not (Tilstone and Aldhous, 2003). There is no consensus on the number
of experimental replicates to perform and researchers often use computer software
incorrectly to perform the analysis, thus resulting in spurious results (Tilstone and
Aldhous, 2003).

57
When using microarray technology it is very difficult to know how to correct for false
positive results, for example when studying a single gene there maybe a 5% chance
that the recorded difference in its activity are the result of a chance fluctuation, but
when this is repeated over 10 000 genes it becomes 500 apparently significant
differences in gene expression when in fact there may be none! For simple data sets
statistical models exist to combat this but as yet none exist for gene chips (Tilstone
and Aldhous, 2003).
At every stage of the microarray process errors can creep in, from the preparation of
tissue samples to the data extraction. The source of mRNA should be isolated from a
homogenous population of cells and collected in a way that preserves it as RNA in
solution is an unstable substance which degrades easily, thus apparent differences in
expression may just be due to the RNA not being preserved properly when collected
(Tilstone and Aldhous, 2003). Whole samples of tissues can be difficult to study as
they have multiple cell types. Techniques and timing of collection of the samples vary
as does the quality and quantity of the RNA (Tilstone and Aldhous, 2003). The use of
different dyes can influence the results recorded by the lasers that measure the
fluorescent signals as can the location of the spots on the chip. Unevenness of the
glass slide or even dust on the slide can also affect the readings of fluorescence
(Tilstone and Aldhous, 2003).
1.12 Immunohistochemistry.
1.12.1 Introduction.
Over many years immunohistochemistry has played an important role in the fields of
cell and tissue biology, embryology and diagnostic pathology. It has revolutionalised
the field of tumour diagnosis and provided pathologists with a way of better

58
characterising difficult or unusual tumours. As a result it has led to the reclassification
of many neoplasms and the creation of new categories previously unknown.
Immunohistochemistry works by localising and identifying a specific antigen in a cell
or tissue specimen. The specimens are usually first fixed in formalin, embedded in
paraffin and then cut into sections of approximately 4 – 5 m thick. These are then
deparaffinised with a xylene solution and rehydrated with a series of ethanol solutions
of decreasing concentrations. The sections are then dried and treated with 3%
hydrogen peroxide solution to block any endogenous peroxidase. The final staining
chromogen reaction utilises an enzyme isolated from the root of the horseradish plant,
horseradish peroxidase. Its active site is iron containing and is able to form complexes
with hydrogen peroxide. This reaction breaks down the hydrogen peroxide into water
and atomic oxygen, which is then able to go on and oxidise any available substrate. In
this thesis the substrate used for the staining reaction is 3-diaminobenzidine
tetrahydrochloride (DAB) which forms a brown precipitate when oxidised. If the
endogenous peroxidase contained in cells types such as erythrocytes, monocytes and
myocytes is not blocked then increased background staining will occur.
Once the endogenous peroxidase has been blocked the sections may need to be
subjected to an antigen retrieval method, described in section 1.12.5. The sections are
then treated with caesin to block any non-specific staining and the primary antibody,
either monoclonal or polyclonal, is then applied. A second antibody linked with a
visible marker, is then applied to enable detection of the primary (Hayat, 2002b).

59
1.12.2 Antigens.
An antigen is a substance which reacts specifically with receptors on the surface of
lymphocytes and with their soluble products such as antibodies. They are usually
large complex proteins or polysaccharides. Most antigens have a variety of antigenic
determinants on their surface, so called “epitopes”. When an antibody detects an
antigen it does not recognise the whole of the antigen, instead it just homes in on a
particular epitope on the antigens’ surface. Epitopes can be defined as
immunologically active regions of an antigen which bind to specific membrane
receptors on secreted antibodies (Hayat, 2002b).
1.12.3 Antibodies.
This term refers to a group of proteins that belong to the immunoglobulin family.
There are five types of human antibodies with IgG being the most abundant and IgA,
IgM, IgD and IgE being the rest in order of decreasing abundance. IgG and IgM are
by far the most utilised antibodies in the field of immunohistochemistry.
Each antibody is essentially the same in structure consisting of two heavy and two
light chains which are linked together by a varying number of disulfide bonds. Each
light chain can consist of either a kappa or lambda portion. An antibody can be split
up into various “domains” using either papain or pepsin. When this is done two
different domains are formed those being the constant region and variable region, see
figure 1.9. The variable region contains the amino terminus of the antibody where the
antigen binds. The structure of each different type of antibody varies only slightly
from this model but the structure of the IgM antibody is worth commenting upon.
IgM is a pentamer of five subunits (each of these being similar to a single IgG

60
molecule) connected by disulfide bonds. The half life of the IgM antibody is
anywhere from four to six days whereas that of IgG is around three weeks.
Figure 1.9 showing the basic structure of a typical antibody with the heavy and light chains illustrated
on the left, and the variable and constant regions illustrated on the right. The variable region of the
antibody is the site which recognises and binds to the antigen. (adapted from
www.immuno.path.cam.ac.uk)
1.12.3.1 Polyclonal Antibodies.
This type of antibody is produced by different cells in the body and although they are
basically the same in structure, slight differences in the variable portions of the heavy
and light chains mean that they recognise different epitopes. Rabbit is the most
common animal used for the production of this type of antibody followed by goat,
pig, sheep, hoarse and guinea pig. The rabbit has become the most popular animal as
it is both relatively easy to maintain and human antibodies to rabbit serum proteins are
rare.

61
Antibodies of this type are manufactured by the process of generating an immune
response from the animal, by injecting a sample of the antigen into the animal either
intradermally or intraperitoneally. Once a response has happened blood is harvested
from a major vein and the serum is isolated. The antibody can then be prepared, via
various methods, into whole stabilised serum or fractions purified to certain degrees.
1.12.3.2 Monoclonal Antibodies.
These are produced by clones of plasma cells and are therefore identical and react
with a specific epitope on the antigen surface. Mice are almost exclusively used for
the production of this type of antibody. The antibodies are produced by stimulating
the mouse spleen into producing B-cells specific to the antigen in question. These B-
cells then produce a clone of antibodies against the antigen in question.
There is less batch to batch variation compared to polyclonal antibodies, they also
have a lower probability of non-specific antibody binding. Each batch of monoclonal
antibodies will only react to one specific epitope on the antigen, thus reducing any
background signal. However, if this single target epitope does not survive the fixation
process no staining will be apparent. With polyclonal antibodies having multiple
target epitopes, the chance of this happening is much less.
1.12.3.3. Affinity.
In immunohistochemistry the term affinity of an antibody can be loosely defined by
the time taken to reach equilibrium with the tissue antigen. The affinity of an antigen
is related to its ability to form insoluble immune complexes. Polyclonal antisera
contain a continuous spectrum of low to high affinity antibodies against several

62
epitopes on a particular antigen. This means that after incubation excessive washing
is unlikely to result in loss of staining. Monoclonal antibodies, on the other hand, have
a uniform affinity for a particular epitope, if this is low a loss of staining during the
washing process is more likely.
1.12.3.4. Reaction Rates.
In ideal conditions antibodies and antigens react very rapidly. Unfortunately the
conditions encountered in the immunohistochemical process are far from the ideal
situation and the reaction rates can therefore take anything up to 48 hours. The
reaction time can depend upon the type and method of tissue fixation, the
concentration of the antibody and the ambient temperature. Shorter times occur when
using high concentrations of high affinity antibodies (Boenisch et al., 1989a).
1.12.4 Fixation.
All histological techniques need to preserve tissues and cells in as reproducible and
lifelike manner as possible. In order to achieve this specimens are usually fixed in a
fluid. The aim of the fixative solution is to prevent autolysis, inhibit the growth of
moulds and bacteria and to limit the damage to the structure of the sample during the
subsequent staining process.
Unfortunately all these properties cannot be achieved without a cost and the dilemma
in fixative techniques has always been that in order to preserve the tissues it is
necessary to introduce some artefact. In performing their role the fixatives denature
proteins thus some of the antigenic profile is lost. Under normal circumstances viable
cells are normally encased in an impermeable membrane. The process of fixation
breaks this down allowing relatively large molecules to enter and escape. Different

63
types of fixative result in different degrees of porosity with coagulant fixatives e.g. B5
resulting in larger pore sizes than non-coagulant fixatives e.g. formalin.
1.12.4.1. Formaldehyde based fixatives.
Almost all samples used for immunostaining are embedded in paraffin. Most of the
popular fixatives contain formalin (40% w/v formaldehyde in water), a neutral salt to
maintain tonicity and a buffering system to maintain pH. During the process of
fixation or the subsequent paraffin embedding there may be shrinkage or distortion of
the tissues.
Formalin fixes by the process of addition and not via coagulation. It reacts with basic
amino acids to form cross linking methylene bridges. As a result of this there is
relatively low permeability to macromolecules thus protecting the structures of the
intracytoplasmic proteins. The process of protein cross linking leads to the masking of
antigenic epitopes. This process is dependent upon factors such as the concentration
of the fixative, the fixative contact time and the thickness of the tissues. If the tissue
pieces to be fixed are small and fixed promptly in neutral buffered formalin for 6 –
24hrs there will be relatively little antigen masking. The thicker the tissue the longer
the contact time is needed to fix the tissue at the centre of the specimen, and the more
likely antigens are to be masked. This can be a problem with large tissue specimens
obtained from resections from oral cancer, but should not cause too much difficulty
with the relatively small biopsy specimens used in the thesis.
Careful consideration is needed when choosing a monoclonal antibody against an
antigen when the specimen has been fixed in formalin. The formalin itself may

64
destroy the epitope in question but leave the rest of the antigen intact thus giving a
false negative result. Formalin may also react with adjacent amino acids causing
conformational changes in the antigen and thus inhibiting the binding of the antibody.
This type of problem can be overcome by using proteolytic digestion. The very
process of embedding the tissue in paraffin may also destroy the epitope as the tissue
is heated to the melting point of wax (60C) which can destroy the epitope on its own.
Thus overheating of the tissue during embedding or during the drying process can
adversely affect the staining process.
1.12.4.2 Other fixatives.
There are a number of other fixatives on the market, each with their own advantages
and disadvantages. Mercuric-chloride based fixatives were designed with the aim in
mind to better preserve the cytological appearance and better prevent tissue distortion
than the formaldehyde based preparations. Whilst achieving this unfortunately they
are very poor at penetrating tissues and as in the case of all coagulative fixants they
cause considerable hardening of the tissues but are better at demonstrating
intracytoplasmic antigens. Examples of this type include B5 and Zenker’s solution.
Acetic acid-zinc chloride has become more popular with time as it is good at
preserving membrane proteins. Periodate-lysine-paraformaldehyde is quite useful as it
stabilises both proteins and carbohydrates. More recently potassium dichromate was
added to preserve the lipid component of the tissue. Ethanol is not widely used as a
fixative as it has very poor penetration into tissues and can cause conformational
changes. However it fixes small pieces of tissue rapidly with good cytological

65
preservation. Acetone can also be used but again has very poor penetration into
tissues (Boenisch et al., 1989b).
1.12.5 Antigen retrieval
Many methods of antigen retrieval exist including heating, enzyme digestion, use of
ethylenediaminetetraacetic acid (EDTA), treatment with detergents and ultrasound.
By far the most commonly used method is that of heating. This can be done using
various pieces of equipment such as microwave ovens, pressure cookers, hot plates
and water baths. Each method has its own advantages and limitations, but all are
likely to be equally effective if used under optimal conditions.
There are a number of theories on the mechanism of how epitopes are unmasked.
Some believe that the protein crosslinks formed during the formaldehyde treatment
are broken down and others that the methods cause denaturing of the proteins to
reveal previously masked epitopes. Antigen retrieval methods may work by either
restoring the original protein structure previously altered during fixation or by
breaking down the protein crosslinks formed thus unmasking the epitope.
1.12.5.1 Heating.
Most, if not all, crosslinks formed during formaldehyde fixation should be destroyed
upon heating even at 37C for 48 hours or for shorter times at higher temperatures e.g.
a few minutes at 80 - 100C. In theory any method of heating should unmask
epitopes, but some of them are destroyed with heating and some still remain
undetectable. Factors affecting the successful retrieval include the actual temperature
used, the duration of heating and any variation in temperature during the process.

66
As previously mentioned many methods of heating exist but the three main ones
employ either a microwave or a pressure cooker. Though they all have different
advantages and disadvantages they obtain similar degrees of antigen retrieval. The
choice of method depends upon the individual study and the equipment available.
One of the speediest methods involves the use of a standard, readily available
microwave oven (900 watts 2450MHz) set on full power for two separate five minute
cycles. The slides are placed in a non metallic rack in the buffer solution for the
procedure. Care must be taken that they do not dry out as the buffer can boil over and
be lost. While this method is quick, it is difficult to standardise. The second method
involves heating in a microwave for a total of 20 minutes. Extending the time can
improve the staining of many antigens but there is more chance of the fluid boiling
over and of hot and cold spots developing.
The third method employs a pressure cooker as the source of heat. Microwaves do not
raise the temperature of the buffer above 100C, but in a pressure cooker temperatures
of 115C and higher can be achieved. The advantages of a pressure cooker include
better reproducibility with large batches and relatively low cost of the equipment.
Some comparative studies have indicated that pressure cooking or pressure cooking in
combination with microwave heating produces more uniform, efficient, consistent and
rapid immunostaining (Hayat, 2002a).
1.12.5.2 Ethylenediaminetetraacetic Acid (EDTA).
Exposing sections to high temperatures in combination with a calcium chelating or
precipitating agent such as EDTA can increase the efficiency of antigen retrieval. The

67
combined treatment leads to the release of calcium ions previously tightly complexed
to formalin fixed tissue sections. The use of EDTA both augments the intensity and
number of cells stained. Variations in the pH of the EDTA has an influence on the
intensity of staining with strong staining at pH 3 and neutral to high pHs but relatively
weak staining at pH 4 and pH 5. Care must be taken when using EDTA as it is a
strong oxidising agent and can thus alter the cell morphology.
1.12.5.3 Ultrasound.
There is only limited data on the mechanism by which ultrasound exerts a direct or
indirect effect on the process of antigen retrieval. Treating the tissues with ultrasound
causes enormous molecular agitation which both initiates and accelerates biochemical
and physical reactions. This agitation also generates a considerable amount of heat
which is rapidly lost from the tissues. The combination of the heat and the agitation is
thought to release calcium ions thus enhancing the effect of the antigen retrieval
solution. Ultrasound is also thought to break down the formalin induced cross links
and expose the epitopes. This method is however difficult to reproduce as the exact
parameters regarding the intensity at the acoustic frequency are difficult to set
precisely (Hayat, 2002a).
1.12.6 Staining.
There are many staining methods available to localise antigens in
immunohistochemistry. The choice depends on the type of specimen, the degree of
sensitivity required, the processing time and the cost of the procedure. There are four
main methods commonly described today the direct method, the indirect method, the
soluble enzyme immune complex and the avidin-biotin method. Due to its increased

68
sensitivity of antigen detection the avidin-biotin, as detailed in section 1.12.6.4,
method was utilised in this thesis
1.12.6.1 The Direct Method.
This is a relatively old technique which is rarely used today but on which many of the
further techniques are based. It utilises a primary antibody which has been labelled
with enzyme. This labelled antibody then reacts with the antigen in the tissue enabling
it to be visualised. As this method only uses one antibody it is quick but because of
this little signal amplification is achieved.
1.12.6.2 The Indirect Method.
In this method an unconjugated primary antibody is first attached to the antigen in
question. Following this a second antibody (which has been labelled with an enzyme)
against the primary antibody is added. The primary antibody is from a different
species to the tissue that is being stained and antibodies raised in rabbits and mice are
commonly used. This method is more sensitive than the direct method as a number of
secondary antibodies can bind to various different epitopes on the primary antibody,
as illustrated in figure 1.10. The staining intensity can be increased by modifying this
method slightly into a three stage procedure. In this method a third labelled antibody
against the second antibody is used therefore placing additional enzyme at the site of
the tissue antigen and increasing the intensity of the stain.

69
1.12.6.3 Soluble Enzyme Immune Complex Method.
This is also referred to as the unlabelled antibody method and uses a preformed
soluble enzyme-antienzyme immune complex where the enzyme is the antigen. To
make this complex soluble the enzyme is added in excess and the precipitate removed.
The sequence in this staining process begins with the addition of the primary
unconjugated antibody, the secondary antibody is the added followed by the soluble
immune complex and finally the substrate solution. The secondary antibody must be
added in excess so that one of its antibody binding sites binds to the primary antibody
Figure 1.10 illustrating the indirect staining method. Primary antibody is represented in blue,secondary antibody represented in orange. The epitope is represented by the yellow triangle andthe marker bound to the secondary antiboy is represented by the brown star. As illustrated,multiple secondary antibodies are able to bind to the primary antibody thus increasing thestaining and hence the detection.

70
leaving the other free to bind the immune complex. This method is amongst the most
sensitive immunochemical technique as many enzyme molecules are localised per
antigen site.
1.12.6.4 Avidin-Biotin Method.
This method has a higher sensitivity of antigen detection. Avidin has four binding
sites for biotin, and a high binding affinity. This method requires a so called “link”
antibody which has been previously biotinylated, i.e. molecules of biotin have
previously been covalently attached. One of the open sites on the avidin molecule
then binds to the biotin on the link antibody. This leaves three binding sites available
on the avidin molecule to further biotin binding. Once the avidin has bound, a further
solution containing biotin with horseradish peroxidase is added. This biotin then binds
to the three remaining “open” sites on the avidin molecule. Thus every biotin
molecule attached to the secondary antibody has the potential to be amplified three-
fold, as illustrated in figure 1.11. This method is said to be more sensitive than either
the direct or indirect method. A solution of DAB is then added which reacts with the
horseradish hydrogen peroxide, oxidises and turns brown enabling the detection of the
epitope with a high degree of amplification.

71
secondary antibody
horseradish peroxidase
biotin
avidin
Figure 1.11 Illustrating the avidin biotin method of staining. As can be seen the secondary antibody hasa number of molecules of biotin attached, avidin can then bind to this biotin molecule aswell as bindinga further three biotin molecules with horseradish peroxidase attached. Thus the staining for each singleepitope is greatly amplified.
1.13 Study Aims
Head and neck cancer comprises a large and diverse group of tumours. Different
subsites are affected by different aetiological agents and respond differently to various
curative therapies. This thesis aims to investigate the mechanism of radioresistance
with regards to a single subset of head and neck cancer, namely the oral cavity. Thus
leading to more accurate data not clouded by information relevant to other head and
neck cancer subsites. Cell culture techniques along with a fractionated course of
radiotherapy will be used with the aim of creating a novel radioresistant oral SCC cell

72
line. This will enable microarray analysis to be preformed on both the parent and
daughter cell line to investigate radioresistant features of oral cancer. This will
hopefully enable novel markers of radioresistance to be identified thus aiding in the
decision making process for those tumours with adverse histological findings which
may benefit from post operative radiotherapy. In the future microarray technology
should enable the development of a genetic “fingerprint” by which the response
radiotherapy can be predicted and, if necessary, identify appropriate genes which can
be blocked sensitising the tumour to radiotherapy. The work done here on oral cancer
should also help in identifying targets in other HNSCC subsites.

73
Chapter 2: Materials and Methods.
2.1 Cell Culture.
2.1.1 Cell lines.
Two commercially purchased cells lines were used in this experiment, both from the
oral cavity and both squamous cell carcinomas. They were named “PE-CAPJ41” and
“PE-CAPJ49” respectively and were obtained from the European Collection of Cell
cultures, Salisbury, U.K. All cell culture reagents were from Invitrogen UK unless
otherwise stated and all the plasticware used was from Sarstedt unless otherwise
stated. The culture medium used was Dulbecco’s Modified Eagle’s Medium (DMEM)
with the addition of 10% v/v foetal calf serum, 1% v/v penicillin and 1% v/v
glutamine.
At all times during the handling of cells strict sterility was maintained and all surfaces
and containers were wiped or sprayed with 70% v/v alcohol before processing took
place. All work which involved manipulating the cells was undertaken in a class 2
microbiological safety cabinet equipped with high efficiency particulate air (HEPA)
filters and UV sterilising lamp (Walker Safety Cabinets Ltd).
2.1.2 Thawing cells.
Before cells were thawed, the cell culture medium was warmed to 37˚C in a water
bath for 30 minutes. The cells were then removed from the liquid nitrogen store,
where they had been kept at -135ºC in sealed cryovials, and placed in a water bath at
37°C for ten minutes to ensure the medium was in liquid form before continuing. The
vial was then sprayed with 70% v/v alcohol and transferred to the class 2
microbiological safety cabinet.

74
The cell suspension was removed and placed in a sterile 30ml polypropylene
container. Cell culture medium was then added to make the suspension up to 10ml.
This was centrifuged at 2500xg for three minutes. The supernatant was discarded and
the remaining cell pellet was re-suspended in 12ml of cell culture medium. This was
then split equally between three 75cm2 flasks and placed in a humidified incubator
kept at a constant temperature of 37°C with an atmosphere of 5% CO2.
2.1.3 Culturing Cells.
Cells were grown in 75cm2 tissue culture flasks incubated at a constant temperature of
37°C in an atmosphere of 5% CO2. Four to five millilitres of DMEM was kept in the
flask and changed as needed. The cells were grown in a monolayer, as shown is figure
2.1, and checked under a light microscope on a regular basis. When a confluence level
of above 70% was reached the cells were split into three further flasks.
2.1.4 Passaging cells.
Once a 70% confluence level was reached the cells were split to facilitate further
growth. The flask was removed from the incubator and transferred to the safety
cabinet. The culture media was aspirated and discarded into a container of Virkon
disinfectant. Four millilitres of trypsin (0.25% w/v) was added to the flask which was
Figure 2.1 PE-CAPJ41cells growing in amonolayer on the base ofa tissue culture flask.

75
then returned to the incubator. This was left for five minutes, removed and checked
under the light microscope. Gentle tapping of the base of the flask was performed at
this stage, and the flask was once again returned to the incubator. This procedure was
repeated at five minute intervals until the majority of the cells had become detached
from the base of the flask. The cells appeared more spherical in appearance under the
light microscope after they had detached from the base of the flask, as illustrated in
figure 2.2, and could be seen floating in the media. In total this process took between
15 to 20 minutes. Using trypsin alone to detach the cells avoids mechanical damage to
cell structure from other methods such as the use of cell scrapers.
The cell suspension was removed from the flask and placed in a 30ml polypropylene
container. Cell culture media was added to make the suspension up to 10ml in total,
and the resultant mixture was centrifuged at 2500xg for three minutes. Once
completed, this was returned to the safety cabinet, the supernatant removed and the
remaining cell pellet re-suspended in 12ml of cell culture media. This was divided up
into 4ml portions and each placed in a fresh 75cm2 tissue culture flask and returned to
the incubator.
Figure 2.2. Microscopicview of trypsinised cells,as compared to fig 2.1these cells are morecircular in shape as theyhave lost theirattachment to the base ofthe tissue culture flask.

76
2.1.5 Freezing cells.
Cells were removed from the flask in the same way as for passaging and the
suspension was again spun in the centrifuge as described in section 2.1.4. Once the
supernatant was removed however, the remaining cell pellet was suspended in 3ml of
a freezing solution. This freezing solution was taken from a 50 ml stock made up of
DMEM (46% v/v), Foetal calf serum (40% v/v), Dimethylsulfoxide (DMSO 10%
v/v), penicillin (2% v/v) and glutamine (2% v/v). This was then divided up into three
cryovials each containing one millilitre of solution. The vials were then placed upright
into a freezer at -80°C overnight after which they were transferred into liquid nitrogen
at -135°C for long term storage.
2.1.6 Counting Cells.
A cell pellet was prepared, as described in section 2.1.2, and re-suspended in cell
culture media. Once done, 0.25µl was pippetted out into a sterile 1.5ml
microcentrifuge tube and mixed with 0.25µl of trypan blue (0.4% v/v). As trypan blue
has the ability to enter the cytoplasm of dead cells it was used to determine which of
the cells were alive. After mixing, a small amount of the solution was placed under a
glass cover slip on a haemocytometer and the number of cells in the grids labelled 1 –
5 in figure 2.3 were counted. Any cells which stained with the trypan blue were not
deemed to be alive and so were not entered into the calculation. The average number
of cells in each grid was calculated and multiplied by two. This figure was then
multiplied by 104 to give the number of cells in 1ml of the solution.

77
Fig 2.3. Grid on haemocytometer for counting cells.
2.1.7 Dose response curve.
The cells were counted using the method described in section 2.1.6 and 1x10⁶ cells
were placed in 7ml polypropylene containers. A total of 6 containers were used and
each container was filled with 5ml of the cell suspension. The containers were then
labelled with the dose of radiation each was going to receive i.e. 0Gy, 2Gy, 4Gy, 6Gy,
8Gy and 10Gy. The samples were then irradiated using ionising radiation from a 6Mv
radiotherapy machine (200cGy/min) at the Radiotherapy Department in Princess
Royal Hospital, Hull.
A proportion of the suspension from each container, which corresponded to
approximately 10 000 cells, was then removed and placed into six well tissue culture
plates. This was done in triplicate. The plates were incubated at 37°C for 14 days,
ensuring that the cell culture media did not dry out during this time. After 14 days the
media was removed and the cells were fixed using a solution of methanol and glacial
acetic acid (ratio 3:1 v/v). They were then air dried overnight before staining with
eosin. This was achieved by covering the fixed layer of cells in each well with a

78
shallow layer of eosin. The cells were then left for five minutes before each well was
rinsed with tap water.
In order to calculate the number of surviving cells after each dose of radiotherapy the
stained colonies were scanned into a computer using a Biorad GS-800 calibrated
densitometer. Colonies of cells of greater than 50 in number were deemed to represent
surviving cells from the original cell line. The plates were examined under a light
microscope and a colony of 50 cells was identified. This was then correlated with the
image on the computer and a measurement taken. Any group of cells of this size or
greater was then counted on the computer, and a graph of number of colonies against
dose of radiotherapy was generated.
2.1.8 Incremental irradiation dose.
The parent cell line in this experiment refers to the cell line which had received no
doses of radiotherapy from which a radioresistant cell line was hoped to be created. A
sample of one million cells from the parent cell line was placed into a 7ml
polypropylene container and made up to a volume of 5ml with culture medium. This
was then taken to the Radiotherapy Department and given a dose of 4Gy. The cells
were then split equally between two 75cm2 tissue culture flasks, further media was
added to a total of 5ml per flask, and returned to the incubator. The cells were
checked under a light microscope, and when greater than 70% confluence was
reached the cells were counted and a further one million cells were taken for another
dose of 4Gy of radiation. This process was repeated until a final dose of 28Gy was
reached for PE-CAPJ41 and 24Gy for PE-CAPJ49.

79
2.2. Expression microarray analysis
As mentioned in section 1.11.3 the basic methodology for all expression microarrays
consists of generating cDNA from a sample of RNA, coupling this to a fluorescent
dye and then hybridising this to a DNA probe. There are a number of methods in use
today but in this instance we used the FairPlay® ΙΙ Microarray Labelling Kit
(Stratagene USA). One of the main problems when performing a microarray
experiment is the interpretation of the results with regards to the intensity of the
fluorescent dyes. An element which can be avoided with the use of this kit is the need
to “dye swap” to allow for the uneven incorporation of labelled nucleotides during the
reverse transcription reaction to produce labelled cDNA. This kit overcomes this by
converting the labelling process into two parts. Firstly the amino allyl groups on the
cDNA are modified and then the dye is chemically coupled to the cDNA. This
removes the need for bulky CY-labelled dUTP to be incorporated during the reverse
transcriptase reaction (Stratagene, 2004).
2.2.1. Extraction of RNA.
The Qiagen RNeasy® Mini animal cell RNA extraction kit (Qiagen UK) was used to
provide all the necessary RNA extraction tubes and reagents except for the ß-
mercaptoethanol (ß-ME) which was supplied by Sigma-Aldrich (UK). A stock
solution of “Buffer RLT” was prepared with 990µl RLT and 10µl of ß-ME.
As described in section 2.1.4 the cells were pelleted and then re-suspended in 1.5ml
PBS. They were transferred to 2ml centrifuge tubes and centrifuged at 3000g for 2
minutes. The resulting supernatant was removed and the pellet vortexed on high speed
until the pellet returned to liquid form, thus allowing for adequate further mixing to

80
take place. The pellet was re-suspended in 660µl of the “RLT buffer” solution and
gently mixed by pipetting. “RLT buffer” solution is used in order to disrupt the cell
walls and plasma membranes of the cells, allowing the release of all the RNA
contained in the sample. This mixture was then transferred to a QiaShredder® column
(Qiagen) and centrifuged at 13000g for 2 minutes. The QiaShredder® column is used
to homogenise the cells, this process shears the high molecular weight DNA and
cellular components to create a homogenous lysate. Incomplete homogenisation leads
to poor binding of the RNA to the RNeasy® column, used in later steps, and
decreases the yield of RNA from the sample. To precipitate the RNA, the
QiaShredder® was discarded and 600µl of RNase-free 70% ethanol was added to the
flow through. The solution was once again mixed by pipetting and 700µl of the
solution was added to an RNeasy® column. The 70% ethanol was added to create
conditions appropriate for the binding of RNA to the column. This was then
centrifuged at 8000g for 15 seconds and the flow-through discarded. We were then
left with RNA and contaminants from the cell bound to the membrane in the column.
Next we needed to remove all the contaminants from the column by applying a series
of washes. Firstly, 700µl of “Buffer RW1” was added to the column and this was then
centrifuged at 800g for 15 seconds. The column was then removed from the 2ml
collection tube and transferred to a fresh identical container. To this column 500µl of
“Buffer RTE” was added and the tube was then centrifuged at 8000g for 15 seconds.
The flow through was discarded 500µl of “Buffer RPE” added and the column once
again centrifuged at 8000g for 2 minutes. Once washing was completed, the column
was placed into a fresh RNase-free 1.5ml microcentrifuge tube and 50µl of RNase-
free water added. This was then incubated at room temperature for ten minutes and
then centrifuged at 8000g for 1 minute to collect the RNA eludate. In order to increase

81
the concentration of the RNA the eluate was passed back through the column and
centrifuged at 8000g for 1 minute for a final time. An overview of this process is
represented in figure 2.4.
Figure 2.4. Representing an overview of the steps involved in isolating RNA from three different tissue
types. Cells are initially lysed and homogenised, then RNA is bound to a membrane, the RNA is then
washed three times to remove impurities then eluted in RNase free water. Reproduced from Qiagen
RNeasy mini kit handbook. (Qiagen, 2006)

82
2.2.2. RNA Quantification and Purity assessment.
The quantification of RNA is more accurate when the sample to be measured is
suspended in Tris rather than water. Water is not buffered and its’ pH can therefore
vary. This variation in pH affects the absorbance of the solution and thus alters the
calculation of both purity and quantity of RNA from day to day. A solution of Tris
buffer solution, with the addition of EDTA to remove any RNase activity, was
prepared and RNA from the sample of RNA prepared in section 2.2.1 was added. This
was achieved by adding 2µl of the RNA solution to 98µl of the Tris EDTA giving a
concentration of 1 part in 50. The resulting 100µl was then added to a micro cuvette
and a Biotech photometer® used to measure the absorbance at 260nm. This value was
then used to calculate the concentration of RNA in one ml of solution using the
equation shown below:
Concentration =
0.125.0
260
x
AxD
A260= absorption at 260nm0.25= extinction coefficient of RNA1.0= distance light travels in cmD= dilution factor
The purity of the RNA to be used in the microarray experiment also needed to be
checked. Again this was done using the Biotech photometer® with the same solution
as before. The absorbance was tested at both 260nm and 280nm and the ratio of the
two values indicated the purity of the sample of RNA. A value as close to 2 as
possible was desirable as this indicates pure RNA sample.

83
2.2.3. Generation of amino allyl labelled cDNA.
All products used in the generation of amino allyl labelled cDNA were supplied by
Stratagene unless otherwise stated. The first step in this process was to anneal the
total RNA to an oligonucleotide d(T) primer. All RNA strands in the body have a
poly-A tail at the 3’ end of the molecule, the oligo d(T) binds to the poly-A tail
allowing the reverse transcriptase to bind. The method described below was
performed separately for both the parent and radioresistant cell line.
Firstly 10µg of the total RNA was suspended in 12µl of DEPC water. DEPC water
was used to ensure no RNase is present and prevents RNA degradation during
processing. Then 1µl of 500ng/µl oligonucleotide d(T) was added and the resulting
solution incubated at 70ºC for 10 minutes in a heatblock. The tube was cooled on ice
and a solution consisting of 2µl 10x StrataSciptTM reaction buffer, 1µl 20x dNTP mix,
1.5µl 0.1 M DTT and 0.5µl RNase block was prepared in a fresh sterile RNase/DNase
free microcentrifuge tube. The RNA sample which was annealed to the oligo d(T)
primer was added to this mixture. Finally, 3µl of StrataScriptTM HC reverse
transcriptase was added and the solution placed in an incubator at 42ºC for 60 minutes
to allow reverse transcription to take place and generate the cDNA. The resultant
mixture containing cDNA and RNA strands was then treated with 10µl of 1M NaOH
at 70ºC for 10 minutes to hydrolyse any remaining RNA strands. The solution was
cooled at room temperature and centrifuged briefly to collect the contents. Then 10µl
HCl was added to neutralise the solution.

84
2.2.4. Purification of cDNA.
The solution from 2.2.3 contained not only cDNA but unincorporated excess
nucleotides, buffer components and hydrolysed RNA which needed to be removed
before the coupling reaction took place. The purification was achieved by first adding
4µl of 3M sodium acetate (pH 4.5), 1µl of 20mg/ml glycogen and 100µl of ice cold
95% ethanol and incubating this at -20ºC for 35 minutes to precipitate cDNA out of
solution. The mixture was then centrifuged at 13,000g for 15 minutes at 4ºC to pellet
the cDNA, and the resultant supernatant carefully removed. Then 0.5ml of ice cold
70% ethanol was added and the mixture centrifuged at 13,000xg for 15 minutes at 4ºC
to wash the pellet. The resulting cDNA pellet was then carefully air dried at 37ºC to
make sure all of the ethanol was removed before proceeding to the dye coupling
reaction.
2.2.5. NHS-Ester containing dye coupling reaction.
The cDNA pellet was then re-suspended in 5µl of the 2x “Coupling Buffer”, supplied
with Fairplay® II microarray labelling kit, and placed in a heat block at 37ºC for 15
minutes to aid the process. Then 5µl of the dye (CyDyeTM 3 or CyDyeTM 5,
Amersham Bucks UK) was added to the cDNA solution. The mixture was then gently
mixed and the solution incubated at room temperature for 30 minutes in the dark,
since fluorescent dyes can degrade when exposed to daylight.
2.2.6. Purification of the dye coupled cDNA.
At this stage the resultant mixture now contained uncoupled fluorescent dye and
buffer salts which affect the hybridisation process if not removed at this stage. This
was achieved by first adding 90µl of TE buffer (10mM Tris 1mM EDTA) to the dye

85
labelled cDNA from 2.2.5. A mixture of 100µl of DNA Binding Solution, supplied
with Fairplay® II microarray labelling kit, and 100µl of 70%(v/v) ethanol was then
prepared, added to the labelled cDNA and mixed by gentle vortexing. The mixture
was then transferred to a Microspin Cup, supplied with Fairplay® II microarray
labelling kit, seated in a 2ml receptacle tube and centrifuged in a microcentrifuge at
13000g for 30 seconds. The Microspin Cup is made up of a silica-based fibre matrix
which, in the presence of the DNA-binding solution, binds to the cDNA, thus
removing it from the solution. After centrifuging, the Microspin Cup was removed
and retained and the contents of the tube were discarded. This process was then
repeated. Once completed a solution of 750µl of 75% ethanol was added to the
Microspin Cup and centrifuged in a microcentrifuge at 13000g for a further 30
seconds. The flow through was then discarded and the washing step repeated. The
Microspin Cup was centrifuged once more at 13000g for 30 seconds, without the
addition of further solutions, to remove any remaining wash buffer and then
transferred to a fresh 1.5ml microcentrifuge tube. Next 50µl of 10mM Tris (pH 8.5)
was placed on top of the fibre matrix and this was left to incubate at room temperature
for five minutes. The addition of Tris to the matrix of the Microspin Cup creates
conditions in which the cDNA is liberated from the matrix and becomes suspended in
the Tris solution. The tube containing the Microspin Cup was then centrifuged at
13000g for 30 seconds in the microcentrifuge. The resulting fluid was recovered,
reapplied to the fibre matrix and respun in the microcentrifuge for 30 seconds as
before. This was done to maximise recovery of the labelled cDNA from the fibre
matrix. The flow through now contained the purified labelled cDNA.

86
2.2.7. Microarray slide preparation.
Before the slides could be used for hybridisation they needed to be made as particle
free as possible and any unbound target molecules or buffer substances needed to be
removed to avoid any interference with the later hybridisation process. This was
achieved by placing the microarray slide firstly into a 50ml centrifuge tube containing
40ml of 0.1% Triton X-100 and rinsing for five minutes. The slide was then removed
from its container and placed in a fresh 50ml centrifuge tube containing 40ml of 1M
HCl and rinsed for a total of two minutes. This rinse was repeated in a fresh tube
before another was filled with 40ml of 100mM KCl solution, the slide placed inside
and rinsed for ten minutes. The final rinse was performed using 40ml of distilled
water for a duration of one minute. Once washed it was necessary to “block” the
slides. This process ensures any reactive groups on the slide which may bind non-
specifically to the added cDNA are unable to do so. The blocking was achieved by
immersing the washed slides in Nexterion® Blocking Solution (Schott Germany) for
15 minutes at 50ºC. Once completed, they were rinsed in distilled water at room
temperature for one minute. Excess solution was removed from the slides by
centrifuging at 200g for a total of 5 minutes thus avoiding water stains. Once dried, a
Hybriwell™ (Grace Bio-Labs USA) adhesive coverslip was applied over the printed
area of the slide.
2.2.8. Hybridisation.
The purified labelled cDNA from section 2.2.6 was then re-suspended in Nexterion®
Hybridisation solution (Schott Germany). This was done by first adding 50µl of the
each cDNA in Tris buffer along with 400µl of Tris to a MicroCon spin cap. This was
then spun in a centrifuge at 1000g for 15 minutes. The flow through was then

87
discarded and the cDNA remained in the MicroCon. The MicroCon was then inverted
and 20µl of Nexterion® Hybridisation solution added. This was again centrifuged at
1000g for 2 minutes. The flow through now contained the cDNA in the correct
hybridisation solution. To this 2µl of 1µg/µl human Cot-1 DNA (10ng/µl final
concentration; Invitrogen, UK), 2µl of 1µg/µl Oligo d(A) (10ng/µl final
concentration; Invitrogen, UK), 5µl of 7.5% w/v BSA (bovine serum albumin 0.2%
final concentration; Invitrogen, UK) and 150µl of NexterionTM Hybridisation buffer
were added to minimise the cross-hybridisation between labelled targets and arrayed
elements that share small regions of homology. This was heated at 95ºC for 3 minutes
on a heat block to denature the target. At the same time a Hybriwell™ was placed
over each slide to be used, as shown in fig 2.5, and once the solution had been
denatured, 200µl was gently pippeted under the well, taking care to avoid any air
bubbles, and the holes at each end sealed. The slide was then placed in an incubator
for 16 hours at 65ºC to allow hybridisation to take place.
Fig 2.5. Showing method for application of and specimen placement under the Hybriwell™. Adapted
from www.gracebio.com

88
2.2.9. Post hybridisation washing.
Once the labelled cDNA had been hybridised to the microarray all the excess buffer
solution and unbound labelled cDNA needed to be removed so an accurate analysis of
the staining could take place. This was done using differing concentrations of a
solution containing SDS (Sodium Dodecyl Sulphate) and SSC (Sodium Salt Citrate).
The slide was suspended in a conical flask which contained 2x SSC and 0.1% SDS.
The flask was then placed in an incubator at a temperature of 42ºC whilst being gently
stirred for five minutes. Next the slide was suspended in a fresh conical flask
containing 2x SSC and 0.1%SDS and again stirred for five minutes at room
temperature. The slide was then placed in another conical flask containing 0.2x SSC
and stirred for one minute before a final wash in a flask containing 0.1xSSC again
stirred for one minute. The slide was then spun in a centrifuge at 200g for five
minutes to remove any excess solution. The slides were then ready for analysis.
2.3 Immunohistochemistry.
2.3.1 Case selection
Following ethical approval, archival tissue blocks were identified retrospectively from
the Histopathology and Head and Neck departments at Hull Royal Infirmary. Cases
were identified from 1995 to 2005 and a database of the findings was constructed. All
cases with squamous cell carcinoma of the lateral border of tongue, floor of mouth,
mandibular alveolus, buccal mucosa and retromolar trigone were included in the
study. Details including patient age, gender, smoking and alcohol history, stage and
site of tumour, date of diagnosis, dates of radiotherapy, dose of radiotherapy, date of
recurrence, site of recurrence and survival were recorded.

89
2.3.2 Definition of radioresistant cases.
Cases had to satisfy a set of criteria before they were considered to be radioresistant.
Only cases that had a recurrence within 12 months of completing radiotherapy, which
was at the original anatomical site, were deemed to be radioresistant. Thus any
recurrence that consisted of neck disease was excluded as this may have represented
original tumour that had not been included in the radiotherapy fields. Any
“recurrence” at a site other than the original was also not included to remove the
possibility of this simply being a second primary tumour.
2.3.3 Slide Preparation.
Paraffin embedded archival tissue blocks were retrieved from the Histopathology
department at Hull Royal Infirmary. A total of 12 sections were prepared from each
block using a Reichert-Jung microtome. Sections of 4 microns thickness were floated
onto a water bath at 40ºC and placed onto SuperfrostR Plus glass microscope slides
(Merck UK). The slides had been pre-labelled in pencil with the corresponding
histology number and the antibody to be used. Once prepared in this way the slides
were placed in an incubator at 37ºC overnight to dry.
The wax was removed, after the slides had been placed into a metal slide rack, by
treating in a solution of Histo-clear™ (National Diagnostics, UK) warmed to a
temperature of 37ºC. They were left in this solution for ten minutes then transferred to
two further solutions of cold Histo-clear™ for ten seconds in each case.
The slides were then re-hydrated in three solutions of 100% ethanol, being left for ten
seconds in each and then rinsed for one minute under running tap water. This was

90
done to return the cells on the slide to a state as near as possible to their in vivo
condition. The endogenous peroxidase of red blood cells was blocked by placing the
slides in 400ml of methanol to which 8ml of 30% hydrogen peroxide had been added,
and leaving the slides for 20 minutes in the solution. Once removed, the slides were
rinsed in running tap water.
2.3.4 Antigen retrieval.
A solution consisting of 1500 ml of distilled water with 15ml of Antigen Unmasking
Solution (Vector UK) was heated to boiling point in a pressure cooker. When boiling
vigorously, the slides were added and the solution brought to pressure of 103KPa.
After three minutes the pressure cooker was cooled and the slides quickly transferred
to Tris-Buffered Saline (TBS - 0.05 mol/l Tris HCL, 0.15mol/l NaCl, pH 7.6) to
prevent any drying.
2.3.5 Blocking of endogenous avidin and biotin.
The cooled slides were assembled with coverplates and TBS solution and placed in a
Sequenza slide holder ensuring no air bubbles were formed. Each reservoir was then
filled with TBS solution and left for five minutes to prevent dehydration. A solution
containing 1ml of casein and 9ml of TBS was prepared and 100l of this was added
to the middle of each slide reservoir to block any non-specific protein reactions. The
slides were rinsed in TBS for five minutes to remove any excess casein.
Three drops of 0.1% avidin (Vector) was then added to each slide to block any
endogenous biotin. After fifteen minutes the slides were rinsed with TBS for a further

91
five minutes. This process was then repeated using three drops of 0.01% biotin
(Vector) to block any endogenous avidin.
2.3.6 Antibody Binding and Detection.
The primary antibodies, listed in section 6.2.2, were diluted with 0.2x casein in TBS
and added to each slide. The slides were then covered and left for a total of two hours
at room temperature. The ABC method of staining was used in this instance and the
reagents were taken from the Duet kit (Dako UK). A solution consisting of 1 in 100
biotinylated goat antibody was prepared using TBS, and 100µl of this was added to
each slide. The slides were then covered and left for half an hour. A preformed
solution of avidin and biotinylated peroxidase was diluted to a concentration of 1 in
100 with TBS. To each slide 100µl of this was added, and the slides were then left
covered at room temperature for half an hour.
2.3.7 Chromogen reaction.
The slides were removed from the sequenza and placed into a pot of fresh TBS
solution. A solution of 400ml of TBS, 3ml DAB (3,3’-diaminobenzidine
tetrahydrochloride, Sigma) and 15 drops of hydrogen peroxide (30% v/v) was then
made up and the slides immersed in the solution until they stained brown for a
maximum of 30 minutes. The slides were then rinsed in running tap water to
terminate the reaction. To enhance the staining the slides were then immersed in a
solution of 0.5% w/v copper sulphate solution for a total of five minutes and then
rinsed in running tap water.

92
2.3.8 Counterstaining nucleus.
The cell nuclei were counterstained blue with Harris Haematoxylin (BDH Laboratory
Supplies UK). After the slides had been rinsed in section 2.3.7, they were
immediately immersed in a solution of Harris Haematoxylin for a total of 20 seconds
and then washed in running tap water for a total of 30 seconds. The haematoxylin was
then differentiated by dipping the slides in acid alcohol ten times and rinsing again in
running tap water. The slides were then immersed in Scotts tap water substitute for
one minute and finally rinsed in running tap water.
2.3.9 Mounting Slides.
The tissue sections were dehydrated by immersing them in three different containers
of 100% ethanol for ten seconds in each. The slides were then dipped in three changes
of Histoclear II (National Diagnostics) solution and then mounted by applying a cover
slip with Histomount (National Diagnostics). The slides were then left overnight to
dry at room temperature.

93
Chapter 3: Results – Development of Novel Radioresistant Oral Squamous Cell
Carcinoma Cell Lines.
Aims:
To establish the response of oral squamous cell carcinoma cell lines PE-
CAPJ41 and PE-CAPJ49 to radiotherapy.
To establish a novel sub-colony of radioresistant oral cancer cells using a
course of fractionated radiotherapy.
To confirm and quantify this radioresistance by comparing dose response
curves.
To enable further analysis to take place on the radioresistant cells lines in
order to identify novel markers of radioresistance.

94
3.1 Introduction.
In order to obtain information about potential predictive markers of radioresistance it
is necessary to study radioresistant tumours. As the inherent response to radiotherapy
is only known after a tumour has already undergone a course of radiotherapy, samples
which are then collected are often from the tumour which is now radioresistant, thus it
is difficult to link any predictive value to markers elucidated from them. Pre-treatment
tumour samples of this nature are difficult to come by and even if a pre-treatment
biopsy specimen is found it is impossible to know whether this sample came from part
of the tumour which was inherently radioresistant or not. Processing, transport and
storage of tumour tissue also leads to variations in the quality and usefulness of such
samples.
There is no standard definition for a radioresistant tumour and quantification of just
how sensitive a tumour is in real life is almost impossible. Other studies have already
shown that it is possible to create a cell line which shows a greater resistance to drug
therapy than its’ parent cell line (Losada et al., 2004) and that certain head and neck
cell lines are more radioresistant than others (Schwartz, 1994). There are also a
number of experiments that have created radioresistant cell lines of cervical (Chung et
al., 2005a), oesophageal (Fukuda et al., 2004), lung (Guo et al., 2005), breast (Li et
al., 2001) and pancreatic cancer (Ogawa et al., 2006). In vivo it is very difficult to
distinguish whether the radioresistance was inherent in the patient or the tissue itself
or if it was acquired after the cancer therapy. In any given tumour there may be a
certain degree of heterogeneity (Fukuda et al., 2004) with regards to radiotherapy
response therefore it is impossible to tell whether any pre-treatment specimens are
from a radioresistant subpopulation or not. Using cell lines which have previously

95
been proven to be radioresistant overcomes these problems and allows the
investigator to be confident that conclusions drawn from further studies are applicable
to radioresistance.
This experiment aims to create a cell line which is significantly more resistant to the
effects of radiotherapy than its parent, thus enabling quantification of the
radioresistance and direct comparison of the resistant cell line to the parent in order to
gain valuable information on how the genetic expression of the cell line has changed
to enable it to become more resistant.
3.2 Materials and methods.
3.2.1 Cell Lines
An aliquot of PE-CAPJ41 and PE-CAPJ49, human oral squamous carcinoma cell
lines obtained from the European Collection of Cell Cultures, were defrosted and
cultured as per section 2.1.2 and 2.1.3. These cell lines were chosen due to their ease
of culture, ready availability and as they came from the most common site for oral
cancer i.e. floor of mouth/ lateral border of tongue. Each cell line was split into a test
and control sample and exposed to the same conditions throughout the experiment.
3.2.2 Determination of Inherent Response to Radiotherapy.
Before a radioresistant cell line could be established, the inherent sensitivity of each
was determined. A clonogenic assay was performed and dose response curves for
each cell line were then constructed. For each dose response curve the cells were
harvested and counted as per section 2.1.6 and 100 000 cells were placed in 7ml
polypropylene containers. Six separate containers were used for each dose response

96
curve. These were then transported to the Radiotherapy Department at Princess Royal
Hospital and given a dose of 0Gy, 2Gy, 4Gy, 6Gy, 8Gy and 10Gy to the respective
container. The cells were then returned to the lab and 10 000 cells were removed from
each container and placed into six well tissue culture plates. They were cultured for
14 days and then stained with eosin to enable a survival assay to be carried out as per
section 2.1.7. Each curve was repeated on three separate occasions for confirmatory
purposes. A final curve was constructed using the mean number of surviving cells at
each dose of radiotherapy across the three curves.
3.2.3 Development of radioresistant cell lines.
The cells were cultured and passaged as per sections 2.1.3 and 2.1.4, and a total of
one million cells were taken to the Radiotherapy Department at Princess Royal
Hospital for treatment with fractionated doses of radiotherapy. This was done at two
weekly intervals as described in section 2.1.8. Initially the cell line was exposed to
2Gy of radiotherapy at each visit as from the initial dose response curves this dose
seemed to strike a balance between cell death and giving the cells enough time to
carry out repair processes. However, it soon became apparent that the surviving cells
were outgrowing the tissue culture flasks sooner than the planned two weekly dose of
radiotherapy, thus further passages would be needed leading to potential differences
in the expression of genes which at the final analysis may be due to the different
passage number not the effects of radiotherapy. An incremental dose of 4Gy was then
chosen which enabled us to use a single passage to return to the radiotherapy
department for a further dose of radiation. The novel cell line derived from PE-
CAPJ41 was called PE-CAPJ41“RR” and that cell line derived from PE-CAPJ49 was
called PE-CAPJ49“RR”.

97
3.2.4 Confirmation of radioresistance.
In order to determine whether the novel cell lines were more resistant to radiotherapy
a dose response curve was constructed, as per section 2.1.7, and compared to the dose
response curve for PE-CAPJ41 and PE-CAPJ49. The dose response curve for the
novel cell lines, PE-CAPJ41RR and PE-CAPJ49RR were repeated for confirmatory
purposes. To compare the response to radiotherapy between the parent and novel cell
lines graphs were constructed showing the surviving fraction of cells in percentage
terms for each cell line at each dose of radiotherapy. This was done by taking the
number of cells surviving from the sample which had received 0Gy to represent a
survival fraction of 100%. Each further number of colonies was then calculated as a
fraction of this and a curve constructed.
3.2.5 Physiological parameters of cell lines.
The plating efficiencies for each cell line were calculated to determine what effect the
transport, passage and subsequent culture had on the cells. The number of cells
originally transported to Princess Royal Hospital was known and after the dose
response curve was constructed the number of cells which had survived the process
that had received 0Gy was also known. The plating efficiency was calculated by
determining what fraction of the cell had survived the whole process. From the dose
response curves it was also possible to determine what dose of radiation was needed
to kill 50% of the cells and the fraction that survived after doses of 2Gy and 4Gy.
These figures allowed a comparison to be made about the relative response to
radiotherapy of each cell line.

98
3.3 Results.
3.3.1 Dose response curves of PE-CAPJ41.
As expected the greatest number of cells survived when exposed to no radiation,
however, as we plated out 10 000 cells in each of the wells for the survival assay it
was surprising to see only a fraction of these had survived after receiving no
radiotherapy. Figure 3.1 shows the three dose response curves for parental PE-
CAPJ41 cells the majority of which were killed with 2Gy with only a small fraction
surviving 4Gy. Figure 3.2 shows the resulting curve constructed by plotting the mean
number of surviving cells at each dose of radiotherapy.
0
200
400
600
800
1000
1200
1400
1600
0Gy 2Gy 4Gy 6Gy 8Gy 10Gy
dose of radiation
Nu
mb
er
of
co
lon
ies
CAPJ41 1
CAPJ41 2
CAPJ41 3
Fig 3.1 Initial dose response curves for parent PE-CAPJ41 cells performed on three separate occasions
with the surviving number of cells plotted on the y-axis against the dose of radiotherapy given on the x-
axis. Each line on the graph represents a separate experiment.

99
0
200
400
600
800
1000
1200
1400
0Gy 2Gy 4Gy 6Gy 8Gy 10Gy
dose of radiation
nu
mb
er
of
co
lon
ies
Fig 3.2 Final dose response curve of parent PE-CAPJ41 cells calculated by plotting the mean number
of surviving cells at each dose of radiation on the y-axis against the dose of radiation on the x-axis.
3.3.2. Dose response curve of PE-CAPJ49.
Figure 3.3 shows the response curves generated for parental PE-CAPJ49 cells through
the three separate experiments. As with PE-CAPJ41 the greatest number of cells
survived when exposed to no radiation, and only a fraction of the cells that were
exposed to 0Gy survived. When comparing figure 3.2 with 3.4 more cells of PE-
CAPJ49 survived at 0Gy, 2Gy and 4Gy than those of PE-CAPJ41.

100
0
200
400
600
800
1000
1200
1400
1600
0Gy 2Gy 4Gy 6Gy 8Gy 10Gy
Dose of radiation
Nu
mb
er
of
Co
lon
ies
CAPJ49 1
CAPJ49 2
CAPJ49 3
Fig.3.3 Initial dose response curves for parent PE-CAPJ49 cells performed on three separate occasions
with the surviving number of cells plotted on the y-axis against the dose of radiotherapy given on the x-
axis. Each line on the graph represents a separate experiment.
0
200
400
600
800
1000
1200
1400
1600
0Gy 2Gy 4Gy 6Gy 8Gy 10Gy
Dose of radiation
Num
ber
of
colo
nie
s
Fig. 3.4 Final dose response curve of parent PE-CAPJ49 cells calculated by plotting the mean number
of surviving cells at each dose of radiation on the y-axis against the dose of radiation on the x-axis.

101
3.3.3 Incremental dose of radiotherapy.
Over a period of three months PE-CAPJ41 received a total dose of 28Gy radiation at
incremental doses of 4Gy. The novel cell line was named PE-CAPJ41RR. During the
initial doses of radiation CAPJ41RR proliferated at a slower rate than PE-CAPJ41.
This continued until a dose of 24Gy was reached when the proliferation rate
increased. This was taken to indicate a change in the inherent resistance to
radiotherapy and the incremental dosage regimen was stopped one dose later. PE-
CAPJ49 received a total of 24Gy over the same period and the new cell line was
named CAPJ49RR. Again a change in the rate of proliferation was noted, as in PE-
CAPJ41, but this time it was noticed at 20Gy. The irradiation was then stopped after
one further dose and the cell line analysed.
3.3.4. Confirmation of radioresistance.
Figure 3.5 shows the resulting dose response curves for PE-CAPJ41RR as compared
to PE-CAPJ41. As can be seen from the graph cells from PE-CAPJ41RR were not
killed by radiotherapy until a dose of 6Gy was reached and some cells survived at a
dose of 8Gy. This is in contrast to PE-CAPJ41 were no cells survived from a dose of
6Gy onwards. The graph therefore confirms the increased resistance to the effects of
radiotherapy of PECAPJ41RR. Figure 3.6 shows the resulting dose response curves
for PE-CAPJ49 as compared to PE-CAPJ49RR and once again a greater number of
cells survived at all doses of radiotherapy other than 10Gy. Figures 3.7 and 3.8 show a
direct comparison between each parent and each resistant cell lines in terms of
surviving fraction of cells at each dose of radiotherapy.
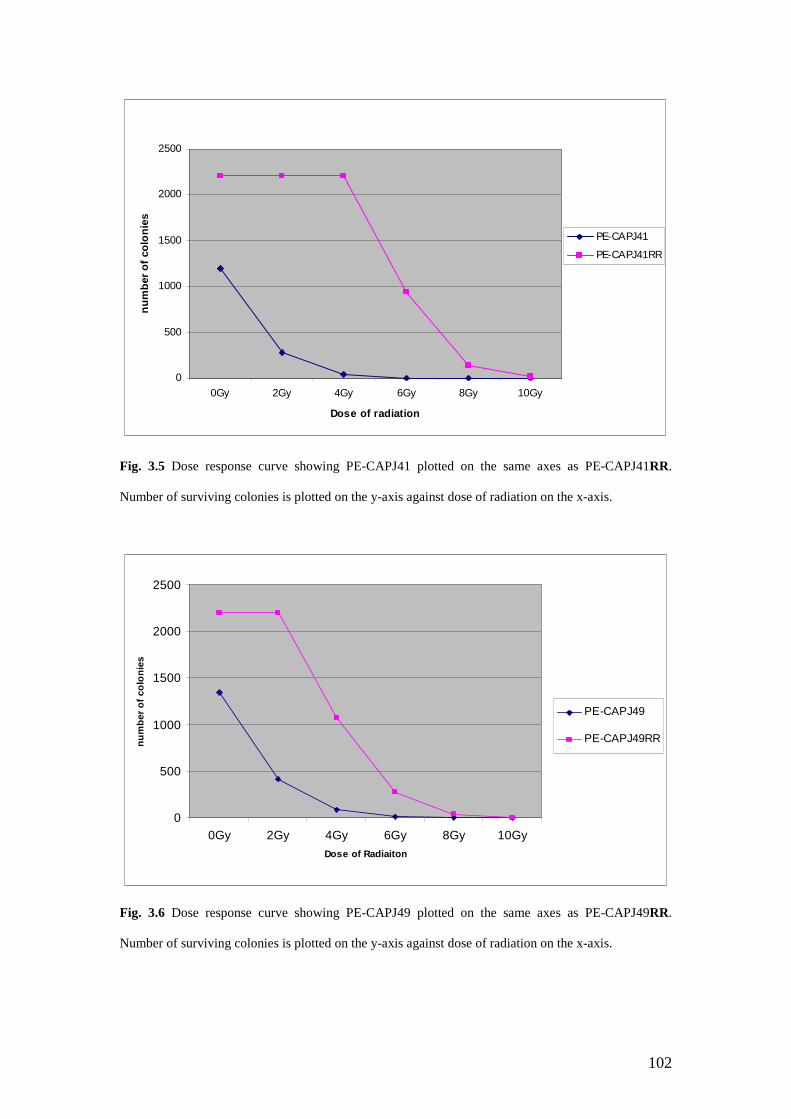
102
0
500
1000
1500
2000
2500
0Gy 2Gy 4Gy 6Gy 8Gy 10Gy
Dose of radiation
nu
mb
er
of
co
lon
ies
PE-CAPJ41
PE-CAPJ41RR
Fig. 3.5 Dose response curve showing PE-CAPJ41 plotted on the same axes as PE-CAPJ41RR.
Number of surviving colonies is plotted on the y-axis against dose of radiation on the x-axis.
0
500
1000
1500
2000
2500
0Gy 2Gy 4Gy 6Gy 8Gy 10Gy
Dose of Radiaiton
nu
mb
er
of
co
lon
ies
PE-CAPJ49
PE-CAPJ49RR
Fig. 3.6 Dose response curve showing PE-CAPJ49 plotted on the same axes as PE-CAPJ49RR.
Number of surviving colonies is plotted on the y-axis against dose of radiation on the x-axis.

103
0
20
40
60
80
100
120
0 2 4 6 8 10
Gy
Su
rviv
al
(%o
fC
on
tro
ls)
CAPJ41
CAPJ41RR
Fig 3.7 Survival curve comparing PE-CAPJ41 and PE-CAPJ41RR. Dose of radiotherapy is shown on
the x-axis and % of surviving cells is shown on the y-axis.
0
20
40
60
80
100
120
0 2 4 6 8 10
Gy
Su
rviv
al(%
of
Co
ntr
ols
)
CAPJ49
CAPJ49RR
Fig 3.8 Survival curve comparing PE-CAPJ49 and PR-CAPJ49RR. Dose of radiotherapy is shown on
the x-axis and % of surviving cells is shown on the y-axis.

104
3.3.5 Physiological parameters of cell lines.
Cell Line Plating Efficiency (%) LD50
(Gy)
SF2
(%)
SF4
(%)
CAPJ41 12.60±0.92 0.91±0.05 21.80±2.25 3.10±0.48
CAPJ49 13.93±0.77 1.26±0.05 33.78±1.93 7.01+0.70
CAPJ41RR 22.00±0.00 5.85±0.07 100.00±0.00 100.00±0.00
CAPJ49RR 22.00±0.00 3.96±0.12 100.00±0.00 48.74+4.96
Table 3.1 Physiological parameters of the cell lines. LD50 refers to the dose of radiotherapy needed to
kill fifty percent of the cells. SF2 and SF4 refer to the Surviving Fraction of cells after a dose of 2Gy
and 4Gy of radiotherapy.
3.4 Discussion.
Radiotherapy has been used for successfully treating oral squamous cell carcinoma
for many years but with varying degrees of success with control rates varying from
18-76% (Carvalho et al., 2003). Radioresistance is therefore a major obstacle which
affects the ability of the clinician to offer a potential cure. To enable the mechanism
of radioresistance to be elucidated it is necessary to study radioresistant tumours. In
these experiments we have created two radioresistant oral squamous cell carcinoma
cell lines to allow further analysis to be performed on readily available
physiologically proven radioresistant oral cancer cell lines.
PE-CAPJ41 and PE-CAPJ49 were chosen due to their availability and as they
represented the most common site for oral cancer. Each cell line was irradiated with a
dosing regimen of 4Gy increments. During the initial dosing increments it was noted
that the irradiated cells for both PE-CAPJ41RR and PE-CAPJ49RR proliferated at a

105
slower rate than their parental counterparts. As they had been receiving doses of
radiotherapy this was not unexpected as time would be needed to undergo DNA
repair, cells would be paused in the cell cycle as this took place and a proportion of
cells would die as a result of the radiotherapy. However, after PE-CAPJ41RR had
received a dose of 24Gy the rate of proliferation was significantly increased as the
tissue culture flask in which the cell line was being cultured became visibly more
confluent after the two week incubation. A similar phenomenon was noticed with PE-
CAPJ49RR but after a dose of 20Gy. This may have been noticed earlier than with
PE-CAPJ41RR as PE-CAPJ49RR was irradiated on a schedule behind PE-
CAPJ41RR and we were therefore more aware of potential changes in proliferation
around this time.
Each cell line showed similar characteristics throughout the experiments and
produced the corresponding radioresistant cell lines. PE-CAPJ41 and PE-CAPJ49 had
an LD50 of 0.91Gy and 1.26Gy respectively so a similar dose of radiotherapy was
needed to kill half of the surviving cells, whilst in contrast PE-CAPJ41RR and PE-
CAPJ49RR had an LD50 of 5.85Gy and 3.96Gy respectively. PE-CAPJ41RR may
have developed a higher LD50 as a result of the larger dose of fractionated
radiotherapy it received (28Gy as opposed to 24Gy) which could have resulted in
further changes in its’ phenotype. We may have expected PE-CAPJ49RR to have
shown a greater resistance to radiotherapy in the final analysis as PE-CAPJ49 was
initially more resistant to radiotherapy. The fractionated dose of radiotherapy given
during the experiment seems to have had more effect on the final outcome than the
inherent radiosensitivity of the cell line. This could lead us to conclude that it is not

106
the inherent radiosensitivity of the tumour that is the greatest determinant of response
but the actual fractionated regimen undertaken.
As can be seen from figures 3.5 (PE-CAPJ41 Vs PE-CAPJ41RR) and 3.6 (PE-
CAPJ49 Vs PE-CAPJ49RR) there is an obvious difference in the response to
radiation at all the tested doses from 0Gy to 10Gy. These figures not only show a
difference in colony formation at 2Gy, 4Gy, 6Gy, 8Gy and 10Gy, but somewhat
unexpectedly show a significant change in response at the 0Gy exposure which was
acting as a control. This maybe due to the difference in proliferation rates between the
parent and resistant cell lines with the resistant cell lines having developed a much
faster rate of growth and proliferation. Genes which regulate proliferation may have
been over expressed to give these cells a survival advantage. It is well known that the
cell cycle has a role in the response to radiotherapy and if there are an increased
number of cells in a tumour then it is more likely that there will be an increased
number of cells in that part of the cell cycle that is relatively resistant to radiotherapy.
This may well be one of the major ways in which a tumour avoids the effects of
radiotherapy, or a reason why tumours which have failed radiotherapy have a
worsened prognosis as those cells which are “left behind” are now proliferating at a
much faster rate than previously, thus any delay in treatment leads to a much greater
tumour bulk than would previously have been evident.
The two novel cell lines created in this experiment, PE-CAPJ41RR and PE-
CAPJ49RR, need further analysis on a genetic level in an effort to identify those
genes responsible for their increased radioresistant properties. In Chapter 4 and 5 we
will aim to use cDNA microarray technology to compare the difference in expression

107
of genes between these novel cell lines and their parent counterparts. In the future it
would be of interest to continue the dosing regimen we have employed here using an
incremental dose of 6Gy or even 8Gy. The current dose of 4Gy may now not be
enough to induce further changes in the novel cell lines as they have become
relatively resistant to this degree of radiotherapy with 100% of PE-CAPJ41RR
surviving and 50% of PE-CAPJ49RR at a dose of 4Gy.

108
Chapter 4 Results – Identification of novel molecular markers of radioresistance
in oral squamous cell carcinoma cell line PE-CAPJ41 using microarray
technology.
Aims:
To extract RNA from the radioresistant oral cancer cell line PE-CAPJ41RR,
established in chapter 3, and its parent counterpart PE-CAPJ41.
To compare the gene expression of PE-CAPJ41RR and its’ parental cell line
PE-CAPJ41 using microarray technology.
To identify altered gene products between the parent cell line and the
radioresistant equivalent.
To discuss the possible role these altered genes may have in radioresistance.

109
4.1 Introduction.
Microarray technology was first conceived in the late 1980s (Sasik et al., 2004) and
since that time has grown in its use and popularity. The concurrent advances in
bioinformatics together with the Human Genome Project have now enabled us to
analyse the expression of thousands of genes simultaneously and also provide us with
a method of identifying differentially expressed proteins in two distinct types of tissue
(Gershon, 2002). The potential for microarray technology to identify new molecular
markers is huge. Microarrays have already been used to identify clusters of genes
which may help to predict the likely prognosis of HNSCC (Belbin et al., 2002), the
risk of nodal metastasis (Warner et al., 2004) and the response to radiotherapy (Hanna
et al., 2001). Belbin et al., (2002) used microarray technology to identify a cluster of
375 genes, such as CEA (carcinoembryonic antigen) and caspase-4, which they used
to group head and neck cancer patients into on the basis of prognosis. Warner et al.,
(2004) identified CLDN1 as predicting for nodal metastasis in oral cancer again by
using a cDNA microarray. Hanna et al., (2001) used biopsy samples from two
radioresistant tumours and compared them with samples from clinically radiosensitive
tumours to identify differentially expressed genes. They were able to use a group of
60 genes to predict the response to radiotherapy. However, the definition used for
radioresistance in this paper was tumour regression of less than 40% after a six week
course of radiotherapy thus later recurrences were excluded. Utilising biopsy samples
from patients also has the inherent problem that there is no way of ensuring these are
taken from a clone of cells resistant to radiotherapy within the tumour.
The study described here utilised cell lines in an effort to overcome these problems.
As it can be very difficult to distinguish whether radioresistance was inherent in a

110
patient/tissue itself or if it was acquired after radiotherapy, using established cell lines
has the advantage that the response to radiotherapy is known, and is quantifiable,
before the microarray analysis starts, and as the whole clone of cells has been shown
previously to be radioresistant no error in sampling can occur. However, as with any
in-vitro model the environment in which the cells are kept will not be the same as
those experienced in vivo, with the influence of such things as the immune system
removed, which may lead to results which do not translate directly to real life.
Given the complexity of radiation-induced responses, microarray analysis offers new
opportunities to identify a wider range of genes and signalling pathways involved in
the response to radiation (Guo et al., 2005). The technique of using radioresistant cell
lines and microarray technology has previously been used to predict novel markers of
radioresistance in cervical (Chung et al., 2005a), oesophageal (Fukuda et al., 2004;
Matsuyama et al., 2001), lung (Guo et al., 2005), breast (Li et al., 2001) and
pancreatic cancer (Ogawa et al., 2006).
In this thesis we have attempted to identify differentially expressed genes between
previously established radiosensitive and radioresistant oral cancer cell lines. The
radioresistant cell lines used were established in chapter 3 and cDNA microarrays
were then employed to investigate differential gene expression.
4.2 Materials and Methods.
The head and neck squamous cell carcinoma cell line PE-CAPJ41 was used in this
experiment along with the radioresistant counterparts PE-CAPJ41RR which had been
derived from the parent cell line using the method described in section 2.1.8. In order

111
to decrease the chances of altered gene expression between different flasks of cells,
RNA was only extracted from flasks which had reached a confluence of 80% or more.
Total RNA was extracted using the Qiagen RNeasy® Mini animal cell extraction kit,
from both the radioresistant cell line and the parent cell line as described in section
2.2.1.
The Human V3 Cancer Subset (http://omad.operon.com/download/index.php),
consisting of approximately 3000 genes, was purchased from Operon (Germany) and
microarrays were printed on pre prepared glass slides in house. The FairPlay® II
microarray labelling kit, purchased from Strategene®, was used to generate cDNA
from total RNA extracted from the parent and radioresistant cell line, as described in
sections 2.2.3 and 2.2.4. The parent cell line was then labelled using CyDye™ 5 and
the radioresistant cell line was labelled with CyDye™ 3 as described in section 2.2.5
and 2.2.6. The labelled cDNA was then hybridised to the microarray slide for 18
hours then washed to remove any unbound labelled cDNA as described in section
2.2.8 and 2.2.9. Once this was completed it was scanned using an Axon GenePix™
4100A scanner purchased from Axon instruments and the data analysed using the
Acuity 4.0 software (Axon Molecular Devices USA). The full microarray experiment
was performed on three separate occasions to validate the results.
Each microarray slide had a total of 2908 different genes represented on its surface
and each oligonucleotide (feature) representing the gene was repeated three times on
each slide. Thus there were almost 9000 features on each array to be analysed using
the Acuity™ software. Each feature on each microarray was scanned as above with a
resolution of 5µm/pixel. These images were then analysed by applying an array

112
specific feature (gene) location file (.gal file). This gal file was used to generate a
results file (.gpr) which contained the feature name, individual dye intensities at each
feature and the dye ratio at each feature. These results files were then imported into
the Acuity™ v4.0 software. The collective data from each microarray was then
normalised using the Lowess method thus allowing for any variation between the
same features throughout the slide. From this a data set was created which only
included those features with the parameter “flags ≥0” thus ensuring only those
features found were included in the analysis. Once the data had been filtered it was
analysed to identify those genes which had altered in a significant way across all
features on all of the microarrays. Only those with a small intra- or inter-array
variance were included. As three features were printed on each slide the combined
intra- and inter-array variance was calculated based upon the mean of the three
features per slide (technical replicate) across the three slides (biological replicate), so
9 features in total. Intra- and inter-array variance was analysed using the one sample t-
test and only those features with p≤0.03 were considered for further analysis.
Calculating the variance in this way meant that only those features which did not vary
from day to day or from slide to slide were considered for further analysis. From these
features, only those which had a mean expression change of at least 2-fold were
selected. This was achieved by selecting the features whose log ratio value was ≥1.0
or ≤-1 as a log value of 1.0 corresponds to a real life fold change of 2.

113
Fig 4.1 Microarray of PE-CAPJ41 parent cell line versus PE-CAPJ41RR. Green features represent
genes over expressed in radioresistant cell line, red features represent genes over-expressed in
radiosensitive cell line and white features represent those which have been saturated with markers.

114
4.3 Results.
All genes that were over expressed by the radioresistant cell line when scanned
fluoresced in the green channel and all those that had been under expressed by the
radioresistant cell line fluoresced in the red channel. Thus each feature on the
microarray either appeared green, red or a combination of both colours on the final
image. This can be seen in Figure 4.1 which illustrates the final scanned image of the
microarray slide. Any of the features which appear white on the image are those
which have been saturated with labelled cDNA.
Using the methods described above seven genes were identified which had changed
significantly in all three repeats of features and on all the arrays that had been
performed, and these are represented in table 4.1.
Table 4.1 Showing the raw data from all three microarrays and calculated fold change for all of the
genes identified by the microarray analysis as being associated with radioresistance. The expression
change is expressed as the ratio of the medians value at each pixel of the feature. A negative fold
change corresponds to decreased expression of the gene in PE-CAPJ41RR.
Expression changeGene
Array 1 Array 2 Array 3
Mean
change
Fold
change
t-test
CD74 4.607 9.84 9.519 7.989 -7.989 0.015
CLCN6 3.147 2.005 3.679 2.943 -2.943 0.029
CLU 2.596 4.978 2.748 3.441 -3.441 0.029
HRMT1L2 2.998 3.871 2.674 3.181 -3.181 0.009
PIT1 3.23 4.655 2.754 3.546 -3.546 0.015
PTK7 5.615 3.391 2.802 3.936 -3.936 0.024
TEAD4 2.822 2.988 3.186 2.998 -2.998 0.001

115
4.3.1 Markers identified in the PE-CAPJ41 Cell line.
4.3.1.1 HRMT1L2.
As can be seen from Figure 4.2 HRMT1L2 was under expressed by the radioresistant
cell line PECAPJ41RR, as the feature fluoresces in red, by a factor of just over three.
This correlated well across all of the arrays with the one sample t-test proving the
correlation to be significant (p=0.009).
Fig 4.2 Magnified image of microarray slide showing the HRMT1L2 feature which was under
expressed by the radioresistant cell line and the feature therefore is red. Feature marked by red arrow.
4.3.1.2. PITX1.
As can be seen in table 4.1, PITX1 was also under expressed by the radioresistant cell
line by a factor of 3.5. This was found to be significant when compared across all
three arrays (p=0.015). Figure 4.3 shows the scanned image of the feature.

116
4.3.1.3. PTK7
PTK7 was under-expressed by the radioresistant cell line by a factor of almost 4
across all three microarrays. This was found to be a significant change in expression
when comparing the data across all three arrays using the one sample t-test (p=0.024).
4.3.1.4. TEAD4
TEAD4 was underexpressed by the radioresistant cell line by a factor of 2.9 across all
three microarray experiments. This change was found to be significant when
comparing data from all three arrays (p=0.001).
Fig 4.3 Magnified view of
microarray slide highlighting the
feature PITX1 as indicated by the
arrow. As can be seen the feature
is predominantly red, unlike those
surrounding it, indicating its
decreased expression.
Fig 4.4 Magnified image of
microarray showing PTK7
feature as illustrated by the
arrow. Other features can be
seen in the image, some in
green showing they have been
overexpressed by the
radioresistant cell line.

117
4.3.1.5 CD74
CD74 was underexpressed by a factor of almost eight across all the repeats and the
change was found to be significant as the p-value was 0.015 when comparing the data
across all three arrays.
4.3.1.6 CLCN6
CLCN6 was under-expressed by a factor of almost three across all three arrays with
the change found to be statistically significant when comparing data across all three
arrays (p=0.029).
Fig 4.5 Magnified image of a
section of microarray showing the
feature TEAD4 in red as pointed
out by the arrow.
Fig 4.6 Magnified image of
a section of microarray
slide illustrating the feature
corresponding to CD74.

118
4.3.1.7 CLU
CLU was under-expressed by a factor of nearly 3.5 across all three arrays. When
comparing the data across all of the arrays this change was found to be statistically
significant (p=0.029).
Fig 4.7 Magnified image of a
section of microarray slide
showing the feature which
represents CLCN6.
Fig 4.8 Magnified image of a
section of a microarray
illustrating the feature
corresponding to CLU.

119
4.4. Discussion.
All of the genes identified in this experiment, illustrated in table 4.1, have been
significantly under expressed by the radioresistant cell line. This could be explained
by the fact that loss of the resultant proteins confers a survival advantage to these cells
after a course of radiotherapy. However, it could be hypothesised that this group of
genes are particularly more sensitive to the damaging effects of radiotherapy than the
other genes represented on this microarray, and are thus consistently damaged by the
effects of ionising radiation.
4.4.1 HRMT1L2
HRMT1L2, also known as heterogeneous nuclear ribonucleotein methyltransferase 1-
like 2, protein arginine N-methlytransferase 1, PRMT1, and interferon receptor 1
bound protein 4, is a protein encoding gene for arginine methyl transferases located
on the long arm of chromosome 19. Protein arginine methyltransferases (PRMTs)
regulate mRNA processing and maturation by altering the activity of RNA binding
proteins through methylation (Scorilas et al., 2000). There are three isoforms of
HRMT1L2 in existence, resulting from alterative mRNA splicing, two of these have
been shown to be down regulated in breast cancer (Scorilas et al., 2000). HRMT1L2
is also associated with the signal transducers and activators of transcription (STAT)
family of proteins. HRMT1L2 methylates STAT 1 which is needed for any
transcriptional activation. Inhibitors of HRMT1L2 are found in certain cancer cells
thus STAT1 is not methylated and this in turn impairs the interferon mediated gene
induction and antiproliferation (Mowen et al., 2001). STAT 1 has been implicated in
both modulating pro and anti-apoptotic genes and there are studies that have shown
that STAT1 deficient cells are more resistant to agents that induce apoptosis

120
(Stephanou and Latchman, 2003). As HRMT1L2 is under-expressed by the
radioresistant cell line, the methylation of STAT1 will be impaired and its function
reduced. The cell line will therefore be deficient in the active form of STAT1 and be
more resistant to apoptosis induced by ionising radiation.
4.4.2 PITX1
PITX1 is also known as pituitary homeobox 1, paired-like homeodomain transcription
factor 1, HGNC:9004, BFT, POTX and PTX1. It is a protein encoding gene found on
the long arm of chromosome 5 and belongs to a family of transcription factors with
the other members being PITX2 and PITX3 (Tremblay et al., 2000). PITX1 acts as a
pan pituitary regulator of transcription and is associated with a large number of
downstream regulators. The expression of PITX1 has been found to be decreased by
more than 50% in pituitary adenomas (Skelly et al., 2000).
PITX1 has been found under expressed in prostate, bladder and colon cancer and a
role has been identified in the regulation of the proto-oncogene RAS (Kolfschoten et
al., 2005). The p21 RAS proto-oncogene is at the heart of a signalling network that
mediates the control of cell growth, metabolism and differentiation. Transmembrane
receptors initiate signals that are transduced via RAS and propagated by a
phosphorylation cascade to the nucleus thereby altering the activation of specific
transcription factors (Bradford et al., 1996a). In a recent study by Kolfsschoten et al.,
(2005) it was found that PITX1 down regulates the RAS pathway and hence
suppresses tumorigenicity.
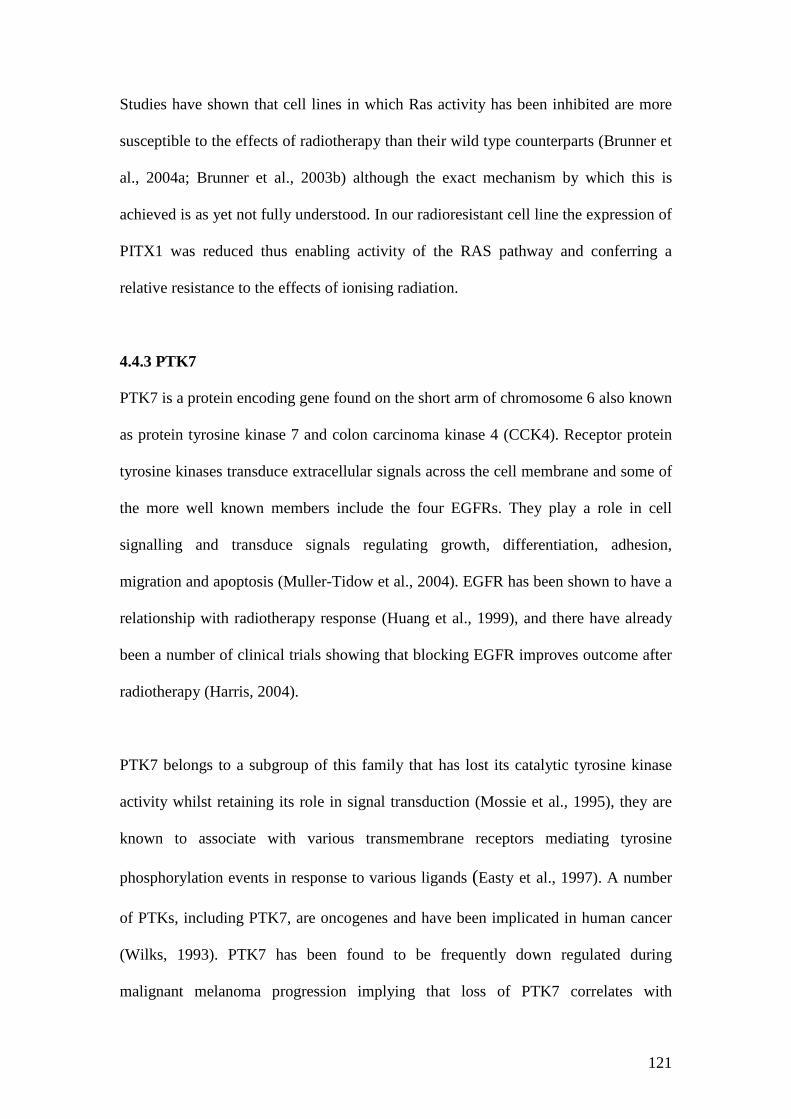
121
Studies have shown that cell lines in which Ras activity has been inhibited are more
susceptible to the effects of radiotherapy than their wild type counterparts (Brunner et
al., 2004a; Brunner et al., 2003b) although the exact mechanism by which this is
achieved is as yet not fully understood. In our radioresistant cell line the expression of
PITX1 was reduced thus enabling activity of the RAS pathway and conferring a
relative resistance to the effects of ionising radiation.
4.4.3 PTK7
PTK7 is a protein encoding gene found on the short arm of chromosome 6 also known
as protein tyrosine kinase 7 and colon carcinoma kinase 4 (CCK4). Receptor protein
tyrosine kinases transduce extracellular signals across the cell membrane and some of
the more well known members include the four EGFRs. They play a role in cell
signalling and transduce signals regulating growth, differentiation, adhesion,
migration and apoptosis (Muller-Tidow et al., 2004). EGFR has been shown to have a
relationship with radiotherapy response (Huang et al., 1999), and there have already
been a number of clinical trials showing that blocking EGFR improves outcome after
radiotherapy (Harris, 2004).
PTK7 belongs to a subgroup of this family that has lost its catalytic tyrosine kinase
activity whilst retaining its role in signal transduction (Mossie et al., 1995), they are
known to associate with various transmembrane receptors mediating tyrosine
phosphorylation events in response to various ligands (Easty et al., 1997). A number
of PTKs, including PTK7, are oncogenes and have been implicated in human cancer
(Wilks, 1993). PTK7 has been found to be frequently down regulated during
malignant melanoma progression implying that loss of PTK7 correlates with
122
tumorigenecity (Easty et al., 1997). It has been found to be over expressed in acute
myeloid leukaemia (Muller-Tidow et al., 2004) and used to aid in determining the
prognosis of pulmonary adenocarcinoma (Endoh et al., 2004).
The exact role PTK7 plays interacting with EGFR is as yet unknown. This study has
shown that under expression of PTK7 correlates with radioresistance, it may be that
loss of PTK7 allows the antiapoptotic cascade to be triggered by EGFR.
4.4.4 TEAD4
TEAD4 is a protein encoding gene found on the long arm of chromosome 12 and is
also known as transcriptional enhancer factor 3, RTEF1, TEF-3, EFTR-2, RTEF-1,
TEFR-1, MGC9014, TCF13L1 and hRTEF-B. It belongs to a family of transcription
factors which contains at least four distinct members, TEF-1, EFT, EFTR-1 and
TEAD 4 itself (Yasunami et al., 1996). A transcription factor is a regulatory protein
that binds to a specific region of DNA resulting in either an increased or decreased
rate of gene transcription. Each particular gene has its own specific binding site which
ensures that the gene is only transcribed in the proper cell type and at the correct time
during development. These family of transcription factors have been associated with
the S100B (Tsoporis et al., 2003) gene and with papillary renal cell carcinoma
(Weterman et al., 1996).
TEAD4 activates the S100B promoter causing an increase in its activity. S100B has a
wide variety of both intra and extracellular functions. These include regulation of the
cells morphology and cell cycle progression. Increased levels of S100B also inhibit
the calcium dependent phosphorylation of the p53 tumour suppressor mechanism
which results in uncontrolled tumour growth (Harpio and Einarsson, 2004). In this

123
experiment TEAD4 was under-expressed by the radioresistant cell line, which seems
to contradict what would be expected as this would lead to a more controlled tumour
growth rate, however, rapidly dividing cells are more susceptible to the effects of
radiotherapy than more quiescent cells, so a loss of this transcription factor may
actually confer a survival advantage with regards to response to radiotherapy.
4.4.5 CD74
The CD74 gene is located on the long arm of chromosome 5 and is also known as
DHLAG, HLADG, Ia-Gamma and protein 41. It encodes for a protein that is
associated with the major histocompatabilty complex class II molecules (MHC-II)
(Claesson et al., 1983). MHC-II molecules bind peptide antigens and internalise and
process them ready for presentation to T cells. They are expressed on the cell surface
as heterodimers composed of an α and β chain. For these chains to unfold, assemble
and be expressed correctly on the cell surface they need to be associated with the
invariant chain during their synthesis (Elliott et al., 1994). CD74 encodes for this
“invariant chain”. If this “invariant chain” is not present in the cell the MHC-II will
not unfold correctly and will therefore be trapped inside the cytoplasm of the cell. As
MHC-II molecules play a role in antigen presentation and identification of tissues it
may be that the loss of this gene enables the radioresistant cell line to avoid detection
by the host immune system, thus conferring a survival advantage. However, as these
cells were cultured in vitro, no immune system was present and the resultant ability to
avoid an immune response would not have enabled these cells to survive the effects of
radiotherapy.
124
4.4.6 CLCN6
CLCN6 is located on the short arm of chromosome 1 and is also known as chloride
channel 6, RP5-934G17.1, CLC-6 and KIAA0046 (Nomura et al., 1994). It is a
member of a family of nine voltage dependent chloride channel genes which have
diverse functional characteristics whilst sharing significant sequence similarity
(Brandt and Jentsch, 1995). Relatively little evidence exists as to the exact role
CLCN6 has in the pathogenesis of cancer but it was found to be under-expressed in
more aggressively behaving breast cancer (Han et al., 2006). As it was also
significantly under-expressed in the more rapidly proliferating and radioresistant cell
line in this experiment it may be of future interest to further investigate the
mechanism whereby this is achieved.
4.4.7 CLU
CLU is a protein encoding gene situated on the short arm of chromosome 8 (Purrello
et al., 1991). It is also known as clusterin, AAG4, APOJ, CLI, KUB1, MGC24903,
SGP-2, SGP2, SP-40, TRPM-2 and TRPM2. Clusterin is a glycoprotein that has been
implicated in various cell functions involved in carcinogenesis and tumour
progression (Shannan et al., 2006). It has been shown to be over-expressed in lung
(Cao et al., 2005), bladder (Yamanaka et al., 2005), prostate (Zellweger et al., 2002)
and squamous cell carcinomas (Zhang et al., 2005). It is usually induced during
apoptosis and is considered to be a stress inducible pro-survival factor (Caccamo et
al., 2006). Clusterin has been shown to inhibit apoptosis by interacting with the pro-
apoptotic activities of BAX (Zhang et al., 2005). Clusterin can be found in two sub
cellular locations either closely associated with the nucleus, nCLU, or in the
cytoplasm, sCLU. This difference in sub cellular location seems to have a profound
125
effect on the role clusterin plays on the survival of the cell population. nCLU is pro-
apoptotic whilst sCLU functions as a pro-survival protein. In the radioresistant cell
line PE-CAPJ41RR clusterin was significantly under-expressed when compared with
its parent cell line. This finding may be considered as somewhat unexpected as
clusterin seems to be a protein more often associated with the increased survival of a
cell population and an overall inhibition of apoptosis. However, one possible
explanation for this under-expression may be understood by remembering the fact that
it is usually induced during apoptosis (Caccamo et al., 2006). The radioresistant cell
line after been exposed to a total of 28Gy is relatively resistant to the effects of
radiotherapy and so apoptosis of the cells of this lineage will be a relatively rare event
when compared with the parent cell line PE-CAPJ41.
This experiment is, as yet, a preliminary study and all the markers discussed above
require validation to ensure they are under-expressed in reality and not just a result of
artefacts in the microarray process or selected out by this particular method of
statistical analysis. This could be achieved by utilising real time PCR on the cell lines
to confirm their under-expression in PE-CAPJ41RR. However, there are some
encouraging preliminary findings into the mechanism by which a squamous cell
carcinoma evades the effects of radiotherapy.

126
Chapter 5 Results – Identification of Novel Molecular Markers of
Radioresistance In The Oral Squamous Cell Carcinoma Cell Line PE-CAPJ49
Using Microarray Technology.
Aims:
To extract RNA from the radioresistant oral cancer cell line, PE-CAPJ49RR,
established in chapter 3, and its parent counterpart.
To compare the gene expression PE-CAPJ49RR with the parental cell line
PE-CAPJ49 using microarray technology.
To identify altered gene products between the parent cell line and PE-
CAPJ49RR.
To discuss the possible role these altered genes may have in radioresistance.
To compare differentially expressed genes identified in Chapter 4 from PE-
CAPJ41RR.

127
5.1 Introduction.
Microarray technology has become a more widespread and accessible tool for
examining the differential gene expression between two types of tissue over recent
years (Tilstone and Aldhous, 2003). Each array has large numbers of genes
represented on their matrix and hence analysis of these arrays produces large
quantities of data. Powerful statistical analysis software is then needed before sense
can be made of the raw data available (Sasik et al., 2004). Confirmatory processes are
always advisable in any experiment and microarray technology is no different in this
respect. This experiment utilizes a separate oral cancer cell line from chapter 4,
which was exposed to the same conditions and analyzed in the same fashion, in an
attempt to identify some markers of radioresistance which are common to
radioresistant tumours.
5.2 Materials and Methods.
The head and neck squamous cell carcinoma cell line PE-CAPJ49 was used in this
experiment along with the radioresistant counterparts PE-CAPJ49RR which had been
derived from the parent cell line using the method described in section 2.1.8. In order
to decrease the chances of altered gene expression between different flasks of cells,
RNA was only extracted from flasks which had reached a confluence of 80% or more.
Total RNA was extracted using the Qiagen RNeasy® Mini animal cell extraction kit,
from both the radioresistant cell line and the parent cell line as described in section
2.2.1.
The human V3 cancer subset (http://omad.operon.com/download/index.php),
consisting of approximately 3000 genes, was purchased from Operon and microarrays

128
were printed on pre prepared glass slides in house. The FairPlay® II microarray
labelling kit, purchased from Strategene®, was used to generate cDNA from total
RNA extracted from the parent and radioresistant cell line, as described in sections
2.2.3 and 2.2.4. The parent cell line was then labelled using CyDye™ 5 and the
radioresistant cell line was labelled with CyDye™ 3 as described in section 2.2.5 and
2.2.6. The labelled cDNA was then hybridised to the microarray slide for 18 hours
then washed to remove any unbound labelled cDNA as described in section 2.2.8 and
2.2.9. Once this was completed it was scanned using a GenePix™ 4100A scanner
(Axon instruments) and the data analyzed using the Acuity 4.0 software. The full
microarray experiment was performed on three separate occasions to validate the
results.
Each microarray slide had a total of 2908 different genes represented on its surface
and each oligonucleotide (feature) representing the gene was repeated three times on
each slide. Thus there were almost 9000 features on each array to be analyzed using
the Acuity™ software (Molecular Devices Corporation U.S.A). Each feature on each
microarray was scanned as above with a resolution of 5µm/pixel. These images were
then analyzed by applying an array specific feature (gene) location file (.gal file).
This gal file was used to generate a results file (.gpr) which contained the feature
name, individual dye intensities at each feature and the dye ratio at each feature.
These results files were then imported into the Acuity™ v4.0 software. The
collective data from each microarray was then normalized using the Lowess method
thus allowing for any variation between the same features throughout the slide. From
this a data set was created which only included those features with the parameter
“flags ≥0” thus ensuring only those features found were included in the analysis.

129
Once the data had been filtered it was analyzed to identify those genes which had
altered in a significant way across all features on all of the microarrays. Only those
with a small intra- or inter-array variance were included. As three features were
printed on each slide the combined intra- and inter-array variance was calculated
based upon the mean of the three features per slide (technical replicate) across the
three slides (biological replicate), so 9 features in total. Intra- and inter-array variance
was analyzed using the one sample t-test and only those features with p≤0.03 were
considered for further analysis. Calculating the variance in this way meant that only
those features which did not vary from day to day or from slide to slide were
considered for further analysis. From these features, only those which had a mean
expression change of at least 2-fold were selected. This was achieved by selecting the
features whose log ratio value was ≥1.0 or ≤-1 as a log value of 1.0 corresponds to a
real life fold change of 2.
5.3. Results.
The final microarray scanned images comparing PE-CAPJ49 and PE-CAPJ49RR can
be seen in Figure 5.1. All the features represented by green spots on the slides
represent those genes which have been over-expressed by PE-CAPJ49RR and all the
features represented by the red spots represent those genes that have been under-
expressed by PE-CAPJ49RR.
From the statistical analysis described above 40 genes were identified which had been
significantly over or under expressed by PE-CAPJ49RR. Of these 40 genes one had
been under expressed and the rest over-expressed by PE-CAPJ49RR. These genes can
be found in Table 5.1.

130
c.
Fig 5.1. Showing scanned imagesof all three microarrays performedin this experiment. The variationsin experimental conditions can beseen when comparing the threeslides. Slides “a” and “b” showdifferent patterns of streakingfrom the drying process, whilstslide “c” has a number of largebright green spots due toparticulate contamination eitherduring the hybridisation or dryingprocess. As each feature isrepresented three times on eachslide, enough good data exists toallow for such losses.
A
B C

131
Table 5.1 Showing the raw data from all three microarrays, with the expression change shown as
the ratio of the medians, and calculated fold change for all of the genes identified by the
microarray analysis as being associated with radioresistance along with the p-value as calculated
by the one sample t-test. The “↓” symbol represents a gene that has been under-expressed by PE-
CAPJ49RR.
Expression changeGene name
Array 1 Array 2 Array 3
Meanchange
Foldchange
t-test
EPHA4 0.104 0.089 0.06 0.084 11.86 0.004282
CD3E 0.069 0.163 0.069 0.100 9.967 0.014188
ABCC2 0.049 0.088 0.166 0.101 9.901 0.020594
BMP5 0.132 0.131 0.089 0.117 8.523 0.003583
CYP3A4 0.089 0.188 0.08 0.119 8.403 0.014705
MAD 0.193 0.134 0.159 0.162 6.173 0.003346
FCGR3B 0.135 0.138 0.221 0.165 6.073 0.007645
ZNF46 0.110 0.14 0.246 0.165 6.048 0.015935
NOL1 0.113 0.241 0.197 0.184 5.445 0.016504
CCL11 0.116 0.232 0.203 0.184 5.445 0.014809
GMEB1 0.141 0.225 0.207 0.191 5.236 0.007199
RBM6 0.099 0.27 0.207 0.192 5.208 0.02865
CASP8 0.176 0.255 0.146 0.192 5.199 0.009716
TGFB2 0.125 0.290 0.250 0.222 4.511 0.026495
H2AFG 0.148 0.276 0.244 0.223 4.491 0.015081
KLK8 0.212 0.203 0.263 0.226 4.425 0.00287
MAP3K12 0.170 0.218 0.334 0.241 4.155 0.017462
RREB1 0.183 0.338 0.257 0.259 3.856 0.016295
RUN1 0.293 0.283 0.284 0.287 3.488 0.000068
PMS2L5 0.262 0.422 0.227 0.304 3.293 0.022575
PAWR 0.283 0.347 0.287 0.306 3.272 0.003168
OT2 0.328 0.391 0.219 0.313 3.198 0.019979
VEGFC 0.279 0.372 0.319 0.323 3.093 0.005291
KRT9 0.215 0.426 0.336 0.326 3.071 0.028797
NFIC 0.327 0.251 0.409 0.329 3.040 0.015292
TGFA 0.391 0.279 0.318 0.329 3.036 0.007635
MAPKAPK3 0.226 0.456 0.307 0.330 3.033 0.029928
PPAT 0.379 0.257 0.362 0.333 3.006 0.011917
CCNE1 0.258 0.394 0.386 0.346 2.890 0.0161
TRIP11 0.302 0.489 0.283 0.358 2.793 0.025717
SART3 0.300 0.289 0.491 0.360 2.778 0.025349
DD3 0.265 0.403 0.423 0.364 2.750 0.020177
↓EGR1 ↓2.841 ↓2.782 ↓2.505 ↓2.709 ↓2.709 0.001528
PSMD9 0.389 0.401 0.354 0.381 2.622 0.00151
BECN1 0.301 0.423 0.466 0.397 2.521 0.019195
SAS 0.488 0.361 0.418 0.422 2.368 0.009956
ERBB2 0.460 0.464 0.348 0.424 2.358 0.011608
IGHMBP2 0.374 0.479 0.425 0.426 2.347 0.00703
ICAM3 0.371 0.436 0.489 0.432 2.315 0.008829
LRRFIP1 0.424 0.404 0.496 0.441 2.266 0.005654

132
5.4 Discussion.
A relatively large number of genes, with significant expression change in PE-
CAPJ49RR when compared to parental cells, have been identified using the methods
described. They have a wide range of functions throughout the cell being involved in
proliferation, cell cycle regulation, apoptosis and autophagy. PE-CAPJ49RR was
exposed to 24Gy of ionising radiation in 4Gy increments to produce a radioresistant
cell line. During this process DNA will have been damaged and cellular processes
will have been initiated to repair this damaged DNA or initiate cell death should this
repair not be possible. The genes identified above are a group of genes that are
involved with this process. Some of these genes are capable of increasing the survival
of the cells involved, thereby avoiding the effects of radiotherapy, whilst others are
involved in initiating cell death due to damaged DNA.
As we have shown PE-CAPJ49RR is relatively more resistant to radiotherapy and the
resulting cell death is much reduced compared to PE-CAPJ49. We would expect the
over-expression of pro-survival genes to outnumber those genes over-expressed that
have a role in cell death. From the genes identified, 16 are so called pro-survival
genes (section 5.4.1) and nine are involved in cell death (section 5.4.2). The exact role
of the remaining 15 genes (section 5.4.3) in the pathway conferring increased
radioresistance has yet to be determined.

133
5.4.1 Pro-survival genes.
Gene Name Function
RUN1 Transcription factor - promotes cell cycle progression - suppressive effect on
apoptosis.
KLK8 Serine protease which binds epidermal growth factor
PAWR Leads to an up regulation of Bcl-2 and decreased levels of the pro-apoptotic Bax
BMP5 Part of TGFβ superfamily responsible for accelerating cell cycle
EPHA4 Part of protein tyrosine kinase receptor family
VEGFC Member of vascular endothelial growth factor family – stimulates cell growth
IGHMBP2 Involved in repair of DNA
GMEB1 Inhibits caspase mediated apoptosis
TGFA Binds to EGFR initiating anti-apoptotic pathway
ICAM3 Increases activity of FAK which inhibits apoptosis
ERBB2/HER-2 Associated with radioresistance, inhibits apoptosis
RREB1 Transcription factor involved in activation of RAS
NOL1 Proliferation associated antigen – associated with increased proliferation
TGFB2 Accelerates cell cycle progression
RBM6 Regulates apoptosis ?through Bcl-2/Bax pathway
MAPKAPK3 Member of serine threonine protein kinase family
Table 5.2 showing the pro-survival genes over-expressed by PE-CAPJ49RR and a brief description of
their function.
Of the pro-survival genes ERBB2, also known as HER-2 and c-erb B2, is the most
well known. This gene is located on the long arm of chromosome 17 and encodes for
a member of the epidermal growth factor family of receptor tyrosine kinases. It has
been shown to be over-expressed in a wide variety of human tumours including
HNSCC (Do et al., 2004), oral SCC (Khan et al., 2002), breast (Siziopikou and Khan,

134
2005), prostate (Fossa et al., 2002) and oesophageal cancer (Akamatsu et al., 2003).
The role this receptor has on cell function is wide and varied and includes regulating
apoptosis, cell proliferation and the response to a number of stresses (Yarden, 2001).
More recently its role in response to radiotherapy has been extensively studied and it
has been found to play a part in the effect radiotherapy has on HNSCC (Uno et al.,
2001), breast (Juranic et al., 2004), oesophageal (Akamatsu et al., 2003) and prostate
cancer (Fossa et al., 2002). In each case the over-expression of HER2 has been
associated with an increased resistance to radiotherapy and in some cases monoclonal
antibodies or small molecule tyrosine-kinase inhibitors have been used to block the
effects of HER2 leading to a decrease in the relative radioresistance of the original
tumour (Mundy et al., 2006; Azria et al., 2003). The exact pathway by which HER2 is
able to overcome the effects of radiotherapy has not yet been fully discovered but a
number of important genes or gene products have been found to play some part.
Among them are VEGFC (Yang et al., 2002), which was found to be over-expressed
in breast cancer and correlated with the over-expression of HER2, and the MAPK
family of protein kinases which are up-regulated by the downstream effects of HER2
activation (Liang et al., 2003) and play a role in radioresistance.
PE-CAPJ49RR demonstrated over-expression of HER2 by a factor of over two in all
three microarrays further strengthening the evidence to support the role this gene has
on the effect of radiotherapy. Interestingly the analysis also revealed an over
expression of VEGFC, by a factor of over three, and a number of members of the
MAPK family, namely MAPKAPK3 and MAP3K12. From the studies already
performed on breast cancer (Liang et al., 2003; Yang et al., 2002) it would appear that
HER2 may work in a similar way in radioresistant oral cancer.

135
VEGFC is a protein encoding gene situated on the long arm of chromosome 4. The
protein it encodes is a member of the vascular endothelial growth factor family. Its
over-expression has been linked with an unfavourable prognosis in a wide variety of
human tumours including tongue (Lopez de et al., 2004), oesophageal (Byeon et al.,
2004), cervical (Gombos et al., 2005), gastric (Hachisuka et al., 2005), thyroid (Hung
et al., 2003) and prostate cancer (Jennbacken et al., 2005). It is thought to have its
effect by increasing the expression of Bcl-2 (Dias et al., 2002), thus decreasing the
apoptotic effect of radiation and increasing the survival of the cell population. A
number of other genes in our analysis, PAWR and RBM6, increase the survival of the
cell population via interactions with the Bcl-2/Bax ratio to up or down regulate the
respective gene to have an overall anti-apoptotic effect.
PAWR is a protein encoding gene found on the long arm of chromosome 12
(Johnstone et al., 1998). It is also known as apoptosis response protein and over-
expression of PAWR has been found to lead to an increase in the anti-apoptotic
protein Bcl-2 with a converse reduction in the pro-apoptotic protein Bax (Boehrer et
al., 2004). RBM6 is a protein encoding gene situated on the short arm of chromosome
3 (Timmer et al., 1999) also known as RNA binding protein 6. It has been shown to
have a role in regulating apoptosis through interaction with Bcl-2 (Sutherland et al.,
2005).
ICAM3 was over-expressed by a factor of over 2 across all three microarrays. It is a
protein encoding gene situated on the short arm of chromosome 19 (Bossy et al.,
1994). Whilst it is named intracellular adhesion molecule 3 and has a role in cell to
cell interaction and leukocyte migration it has also been shown to be a potent

136
signalling molecule relevant in cancer (Simmons, 1995). A recent study, utilising
microarray technology, on radioresistant cervical cancer showed that ICAM3 was
significantly over-expressed by radioresistant cervical cancer (Chung et al., 2005b)
which would correlate well with our findings here. Further more this study also found
that increased levels of ICAM3 lead to an increase in the phosphorylation of FAK
which results in a decrease in apoptosis (Chung et al., 2005b).
Two of the members of the transforming growth factor β family were found to be
over-expressed by PE-CAPJ49RR, TGFB2 and BMP5. BMP5, also known as bone
morphogenic protein 5, is a protein encoding gene situated on the short arm of
chromosome 12 (Hahn et al., 1992). TGFB2 is located on the long arm of
chromosome 1 (Barton et al., 1988) and is one member of a family of proteins
involved in various cell functions including cell differentiation and proliferation
(Motegi et al., 2003). The TGFB family act by accelerating cell cycle progression
from the G0/G1 phase to the S phase thus increasing the rate at which cells proliferate
(Motegi et al., 2003). As PE-CAPJ49RR over-expressed two of this family of genes
the subsequent increase in the cells proliferation rate would have helped to overcome
the effects of ionising radiation and increase the survival of the cells.
Two other genes over-expressed by PE-CAPJ49RR also have a role in increasing the
progress of a cell through the cell cycle namely NOL1 and RUN1. RUN1 is a gene
situated on the long arm of chromosome 22 (Avramopoulos et al., 1992), it encodes a
transcription factor which has been shown to promote progress through the cell cycle
(Peterson et al., 2005) and induces S-phase entry via cyclin D3 (Bernardin-Fried et
al., 2004). It has also been shown to be an effective suppressor of apoptosis (Abe et

137
al., 2005). Thus working in two ways to enhance the radioresistance of PE-
CAPJ49RR. NOL1, also known as proliferation associated nucleolar protein, is a
gene located on the short arm of chromosome 12 (Baens et al., 1994) it is expressed in
the G1 phase of the cell cycle and peaks in early S-phase (Valdez et al., 1992) and is
associated with an increase in cell proliferation (Fonagy et al., 1993).
As previously discussed a member of the EGFR family, HER-2, was significantly
over-expressed by PE-CAPJ49RR. A number of other genes were also over-
expressed by PE-CAPJ49RR and exert their effect via interactions with the EGFR
family of receptor protein kinases namely KLK8 and TGFA. KLK8, also known as
kallikrein 8, is a gene located on the long arm of chromosome 19 (Harvey et al., 2000)
and encodes for a member of the kallikrein family which are a subgroup of the serine
proteases. Its role in cancer is not yet fully understood and it has been found to be
over-expressed in colon (Yousef et al., 2004a), cervical (Cane et al., 2004) and
ovarian cancer (Yousef et al., 2003) whilst being under-expressed by breast cancer
tissue (Yousef et al., 2004b). Whilst it seems to have a number of different functions
the one which seems most pertinent to PE-CAPJ49RR is the ability it has to bind
epidermal growth factor (EGF) (Mason et al., 1983) thus enabling it to be transported
more efficiently and aid in its eventual binding to EGFR with the initiation of the
subsequent pro-survival cascade. TGFA is a gene situated on the short arm of
chromosome 2 (Tricoli et al., 1986) it encodes for the polypeptide transforming
growth factor alpha. It has been shown to bind to and activate EGFR to promote
cellular growth (Werneburg et al., 2003). This method of activation of EGFR has been
shown to produce a mitogenic response via the ERK/MAPK pathway (Sawhney et al.,

138
2003). The interaction of these two proteins seems to be another part of the pathway
by which PE-CAPJ49RR evaded the effects of radiotherapy.
A transcription factor is a protein that controls whether a particular gene is “switched”
on or off, thus increasing or decreasing the gene product. IGHMBP2 and RREB1 are
two such transcription factors that were over-expressed by PE-CAPJ49RR.
IGHMBP2, also known as immunoglobulin Mu binding protein, is a gene located on
the long arm of chromosome 11 (Fukita et al., 1993). It is a transcription factor
(Sebastiani et al., 1995) that is involved in DNA repair and replication (Shen et al.,
2006). RREB1, also known as Ras responsive element binding protein 1, is a gene
located on the short arm of chromosome 6 (Thiagalingam et al., 1997). The RAS
proto-oncogene is at the heart of a signalling network that mediates the control of cell
growth, metabolism and differentiation. Transmembrane receptors initiate signals that
are transduced via RAS and propagated by a phosphorylation cascade to the nucleus
(Bradford et al., 1996b). Increase in the activity of Ras has been associated with
radioresistance in a number of cell line studies (Brunner et al., 2004b; Brunner et al.,
2003a). The binding of RREB1 to its target, Ras responsive element, results in an up-
regulation of this protein (Thiagalingam et al., 1996) and may well be another way in
which PE-CAPJ49RR resists the effect of ionising radiation.
GMEB1, also known as glucocorticoid modulatory element binding protein 1, is a
protein encoding gene situated on the short arm of chromosome 1 (Theriault et al.,
1999). It is a potent inhibitor of caspase mediated apoptosis having its effect by
binding to pro-caspase 2 (Tsuruma et al., 2004) and the pro-caspases 8+9 thereby
disrupting their activation and the subsequent apoptotic effect (Tsuruma et al., 2006).

139
This gene was over-expressed by a factor of over 5 across all three microarrays.
Interestingly caspase 8 was also over expressed by PE-CAPJ49RR by a factor of just
over 5. The induction of caspase 8 to initiate apoptosis in the cells damaged by the
irradiation may have been antagonised by a corresponding increase in the levels of
GMEB1, thus enabling the cells to survive.
5.4.2 Genes associated with cell death.
Gene name Function
Caspase 8 Initiator caspase involved in the initiation of apoptosis
CCNE1 Induces caspases
LRRFIP1 Represses TNFα
DD3 Decreases cell proliferation and increases apoptosis
PMS2L5 DNA mismatch repair gene
MAPK3K12 Inhibits cell growth
MAD Transcriptional repressor, limits proliferation
EGR1 Increases clusterin – antiapoptotic and pro-survival
BECN1 Initiator of autophagy
Table 5.3. Showing genes associated with cell death with a brief description of their function.
Caspases are a large family of evolutionary preserved proteases that are synthesised as
inactive precursors. They are divided up into initiator and effector caspases with the
initiator caspases activating the effectors in response to cell death signals which bring
about apoptosis (Chang and Yang, 2000). Dysregulation of caspases has been found
to be a prominent feature of many human diseases including cancer (Thompson,
1995). Caspase 8 has been shown to be one of the initiator caspases (Tsuruma et al.,

140
2006) and to be activated by the Fas death receptor (Muzio et al., 1996). The gene for
caspase 8 is situated on the long arm of chromosome 2 (Grenet et al., 1999) and was
over-expressed by PE-CAPJ49RR by a factor of just over 5 times which may be
associated with increased apoptosis caused by the ionising radiation. However, its
function may have been blocked by the concomitant over expression of GMEB1,
again over expressed by PE-CAPJ49RR by a factor of just over 5, which inhibits
caspase 8. Such natural inhibitors have been found to be effective in blocking this
pathway to apoptosis (Chang and Yang, 2000). Genes associated with promoting
apoptosis would not normally be linked with a radioresistant cell line, and the over-
expression of caspase 8 may well be a false discovery.
The inhibition of caspase 8 has been shown to lead to a rise in the gene product of
BECN1 (Yu et al., 2004a) which was also over expressed by PE-CAPJ49RR by a
factor of just over 2. BECN1, also known as beclin 1, is a protein encoding gene
situated on the long arm of chromosome 17 (Aita et al., 1999). Beclin 1 has been
shown to promote autophagy and autophagic induced cell death. Autophagy is the
process by which components of the cytoplasm are degraded during nutrient
deprivation (Yu et al., 2004b). The increase in the levels of beclin 1 in PE-
CAPJ49RR could be an alternative mechanism to apoptosis to initiate cell death in
those cells whose DNA is badly damaged by ionising radiation. As the cell line was
stable when the microarray was performed it would not be expected to find a gene
promoting cell death to be over-expressed, thus BECN1 may, as with caspase 8, be
false finding.

141
CCNE1, also known as cyclin E, was over expressed by PE-CAPJ49RR by a factor of
almost three. It is a protein encoding gene situated on the long arm of chromosome 19
(Demetrick et al., 1995). It is required in the G1/S transition of the cell cycle
(Brzezinski et al., 2005) and has been associated with a number of human cancers
including pancreatic (Yue and Jiang, 2005), adrenocorticoid (Tissier et al., 2004) and
ovarian (Tsuda et al., 2004). A previous study showed an up regulation of cyclin E
after haematopoietic cells were exposed to radiotherapy and in a further study went on
to show that this increase in cyclin E lead to enhanced caspase activation (Mazumder
et al., 2004). The clone of PE-CAPJ49RR cells may have induced this gene in an
effort to rid itself of the damaged DNA via activation of the caspase cascade.
EGR1, also known as early growth response 1, was the only gene that was under-
expressed by PE-CAPJ49RR. It is a protein encoding gene situated on the long arm of
chromosome 5 (Chavrier et al., 1989). Increased expression of EGR1 is triggered by
cell cycle arrest and not by damage to DNA (Quinones et al., 2003) which may be one
of the reasons why it was not up regulated in PE-CAPJ49RR, as these cells were
proliferating at a much higher rate than their counterpart PE-CAPJ49 (see chapter 3).
EGR1 expression is required for the expression of the pro-survival/antiapoptotic
protein clusterin (found to be under expressed in PE-CAPJ41RR see section 4.4.7) via
a cascade of events initiated by ionising radiation (Criswell et al., 2005). Therefore
loss of expression of this gene would lead to a decrease in clusterin and the overall
balance of the system to be tipped towards cell destruction.
A number of genes over expressed by PE-CAPJ49RR have been shown to lead to an
overall decrease in the proliferation rate of tumour cells; these being MAD, DD3 and

142
MAP3K12. MAD was over expressed by a factor of just over six times across all
three microarrays, and is a gene situated on the short arm of chromosome 2 belonging
to a subfamily of MAX interacting proteins (Edelhoff et al., 1994). MAD antagonises
the effect of another member of the family, MYC, to hold the cells in the G0/G1
phase of the cell cycle thus slowing down cell proliferation (Zhao and Xu, 1999).
DD3 was over expressed by a factor of just under three by PE-CAPJ49RR and is a
protein encoding gene situated on the short arm of the X chromosome (Park et al.,
1998). It is a member of the DEAD box protein family and is involved in cellular
growth and division (Chang et al., 2006). Chang et al., (2006) showed that increased
expression of DD3 had the effect of holding the cells in the G0/G1 phase thus having
an inhibitory effect on cell proliferation. MAP3K12 was over expressed by a factor
of just over four times by PE-CAPJ49RR and is a protein encoding gene situated on
the long arm of chromosome 12 (Reddy et al., 1995). Expression of this gene leads to
a dramatic reduction in the proliferative capacity of cells grown in culture (Bergeron
et al., 1997). As cells are relatively radioresistant in early G1 of the cell cycle (Iliakis,
1997), genes which have the ability to pause the cell cycle at the G0/G1 stage would
confer a degree of radioresistance.
PMS2L5 was over expressed by a factor of over three by PE-CAPJ49RR and is a
gene situated on the short arm of chromosome 7. Activation of p53 in response to cell
damage leads to cell cycle arrest allowing the cell to repair DNA and recover or to
initiate cell death if the damage is too great. PMS2L5 plays a pivotal role in this
decision making process, stabilising p73 which is a member of the p53 family
required for p53-dependent apoptosis (Chen and Sadowski, 2005).
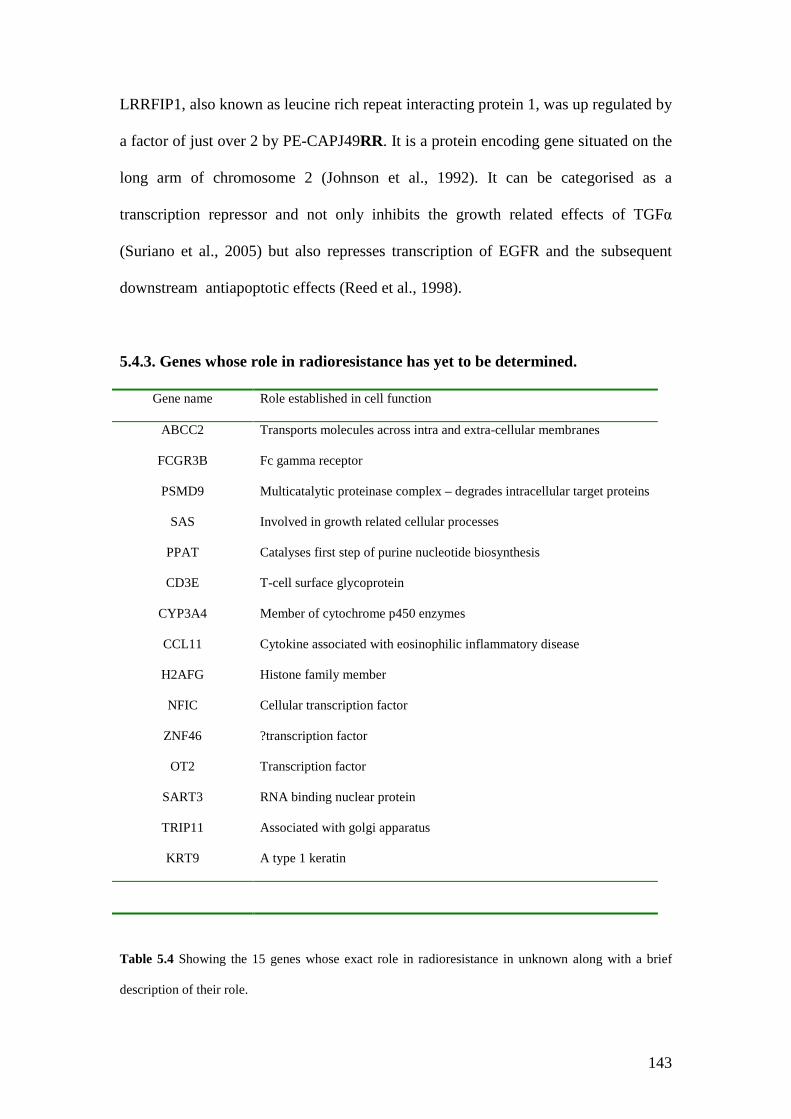
143
LRRFIP1, also known as leucine rich repeat interacting protein 1, was up regulated by
a factor of just over 2 by PE-CAPJ49RR. It is a protein encoding gene situated on the
long arm of chromosome 2 (Johnson et al., 1992). It can be categorised as a
transcription repressor and not only inhibits the growth related effects of TGFα
(Suriano et al., 2005) but also represses transcription of EGFR and the subsequent
downstream antiapoptotic effects (Reed et al., 1998).
5.4.3. Genes whose role in radioresistance has yet to be determined.
Gene name Role established in cell function
ABCC2 Transports molecules across intra and extra-cellular membranes
FCGR3B Fc gamma receptor
PSMD9 Multicatalytic proteinase complex – degrades intracellular target proteins
SAS Involved in growth related cellular processes
PPAT Catalyses first step of purine nucleotide biosynthesis
CD3E T-cell surface glycoprotein
CYP3A4 Member of cytochrome p450 enzymes
CCL11 Cytokine associated with eosinophilic inflammatory disease
H2AFG Histone family member
NFIC Cellular transcription factor
ZNF46 ?transcription factor
OT2 Transcription factor
SART3 RNA binding nuclear protein
TRIP11 Associated with golgi apparatus
KRT9 A type 1 keratin
Table 5.4 Showing the 15 genes whose exact role in radioresistance in unknown along with a brief
description of their role.
144
As can be seen from Table 5.4 there are a number of genes over expressed by PE-
CAPJ49RR whose precise role in the pathway of radioresistance could not be
determined. Three of these genes have been identified as transcription factors, OT2
(Gherzi et al., 1997), NFIC (Qian et al., 1995) and ZNF46 (Chardin et al., 1991), but
their exact function is not yet determined. ABCC2 and CYP3A4, when over
expressed, have been shown to be associated with the metabolism of various
chemotherapy agents. ABCC2 is a member of the ABC transporters which functions
in the transport of various molecules across intra- and extra-cellular membranes, and
has a particular role in drug export in the kidney (Evers et al., 1998). Evers et el.,
(1998) showed that the gene product of ABCC2 led to a relative drug resistance to the
anti-cancer drug vinblastine. CYP3A4 is a member of the cytochrome p450 family of
enzymes and plays a major role in the activation of pro-carcinogens and the
metabolism of several drugs including tamoxifen (Kapucuoglu et al., 2003).
Two of the other genes identified, PSMD9 and SAS, are involved in cellular growth
responses. PSMD9 is an ATP dependent protease for selectively degrading intra-
cellular target proteins which belongs to a family of proteases which play an essential
role in the proliferation of cells. This role, however, has not been identified with
PSMD9 and its exact function in cell growth and proliferation is as yet unclear
(Watanabe et al., 1998). SAS the protein encoded by this gene is a member of the
transmembrane 4 superfamily and is involved in growth related cellular processes
(Jankowski et al., 1994). It is thought that it plays some role in cell growth response to
external stimuli (Jankowski et al., 1995). CCL11, also known as eotaxin, is a gene
encoding for a cytokine that is most commonly associated with eosinophilic
inflammatory disease and has a role in fine tuning cellular responses at sites of

145
allergic inflammation (Ogilvie et al., 2001). The treatment of cells with ionising
radiation has been shown to up-regulate eotaxin and a role for it in patients with
eosinophilia after exposure to radiotherapy has been suggested (Huber et al., 2000).
5.4.4. Comparison of markers identified in PE-CAPJ41RR and PE-CAPJ49RR.
None of the genes identified using the statistical method described in section 5.2 and
4.2 respectively were the same when comparing the two cell lines and some genes
that we might have expected to be altered were also not identified. The criteria used to
identify the genes involved with radioresistance were quite strict and may have led in
part to this discrepancy, particularly regarding the intra- and inter-array variance. No
gene was considered for further analysis if the feature was not identified in all three
technical replicates on the slide and in all biological replicates across the three
different microarrays.
Bcl-2 has been shown to be related to the response a tumour has to radiotherapy in a
number of different papers (Hara et al., 2005; Rupnow and Knox, 1999; Chin et al.,
2005; Nix et al., 2005) and would have been expected to be involved in our
radioresistant cell lines response to radiotherapy, yet was not highlighted in our
analysis. When the data from the microarray was looked at more closely for PE-
CAPJ49RR it was found to be over expressed across all three microarrays performed
by a factor of 2.35 as seen in Table 5.5. However the change in expression varied
considerably between array 1 and the other two performed leading to a p-value which
did not support a statistically significant change through all the arrays. With regards to
PE-CAPJ41RR again Bcl-2 was over-expressed but this time with a fold change of
1.38. In array 1 the feature was unfortunately unavailable for analysis due to a

146
technical problem with that part of the microarray slide leading to the feature being
spoiled which again meant that the change was not considered to be consistent across
all three biological replicates.
Table 5.5. Showing a comparison between the genes expression of PE-CAPJ41RR and PE-
CAPJ49RR, with the expression change shown as the ratio of the median change across the numerical
value of each picsel analysed in each microarray. Thus all values of greater than one correspond to an
under expression in the “RR” cell lines and all values less than 1 correspond to an over expression in
the “RR” cell lines. The genes shown in blue represent the data from PE-CAPJ41RR.
Bad is one of the Bcl-2 family members which promotes cell death by its pro-
apoptotic nature (Schoelch et al., 1999) and was represented on the gene set used in
this microarray experiment. Due to its pro-apoptotic function we may have expected
this gene to exhibit decreased expression by both PE-CAPJ41RR and PE-
Expression changeGene
Array 1 Array 2 Array 3
Meanchange
Foldchange
t-test
Bcl-2 0.113 0.649 0.517 0.424 2.35 0.184
Bcl-2(41) - 0.686 0.759 0.723 1.38 0.098
Bad 1.944 0.526 2.375 - - 0.596
Bad(41) 5.301 3.963 1.086 3.450 -3.450 0.165
ERBB2/Her-2 0.460 0.464 0.348 0.424 2.36 0.012
ERBB2/Her-2(41) 1.611 2.276 0.355 - - 0.129
Caspase 8 0.176 0.255 0.146 0.192 5.12 0.009
Caspase 8 (41) 3.037 1.288 0.871 - - 0.383
GMEB1 0.141 0.225 0.207 0.191 5.23 0.007
GMEB1 (41) 1.774 1.495 0.577 - - 0.724

147
CAPJ49RR. Overall this was the case across the microarrays with 5 out of the six
arrays performed across the two cell lines showing a reduction in its expression, as
illustrated in Table 5.5. It was not identified in our analysis as the change was not a
consistent one through all of the repeats with a resultant p-value which was not
statistically significant.
ERBB2, also known as Her-2, was significantly over-expressed by a factor of 2.36 by
PE-CAPJ49RR but this did not correlate with PE-CAPJ41RR. Here ERBB2 showed
decreased expression in the first two arrays and was over-expressed in the third. This
variability in results across different arrays highlights the importance of performing a
number of technical repeats when dealing with microarray technology.
Caspase 8 was significantly over-expressed by PE-CAPJ49RR with a corresponding
increase in GMEB1. These two genes were not highlighted in the analysis of PE-
CAPJ41RR. When we look more closely at the data, shown in Table 5.5, we can see
that both caspase 8 and GMEB1 were under-expressed by PE-CAPJ41RR in the first
two arrays and both over-expressed in the final one. It is interesting to note that their
expression seems to always correlate well between the two genes, further
strengthening the argument that their function is linked. It could by hypothesised that
these genes were under-expressed by PE-CAPJ41RR as its DNA was less susceptible
to damage caused by ionising radiation due to the increased dose of radiotherapy it
had been exposed to.

148
5.5 Conclusion.
In conclusion, we have successfully analysed the tumour cell line PE-CAPJ49RR,
and from this we have identified 40 genes which have shown a significant change in
their levels of expression. All of these targets require further evaluation to confirm
these results. Interestingly no gene was found to show a significant change in
expression in PE-CAPJ41RR and PE-CAPJ49RR. As there are over 200 OSCC cell
lines available worldwide (Lin et al., 2007) an alternative way of investigating
radioresistance using cell lines would be to establish the inherent response to
radiotherapy of a number of these cell lines, using the clonogenic assay techniques
described in chapter 3. Once the different response to radiotherapy was known,
microarray analysis could then be performed comparing the expressed genes of each
cell line. Using this method would eliminate those genes which are simply damaged
by the radiotherapy, as may have happened in our study. As the tumour has an
intrinsic resistance to radiotherapy, as opposed to the model used in this thesis where
the resistance is radio-induced, the results may be more applicable to predictive
markers. However, as each cell line comes from a different tumour it would be
impossible to tell if the targets identified are simply due to the differing genotype of
each tumour or whether they truly are responsible for the different response to
radiotherapy.

149
Chapter 6 – Results Molecular markers of radioresistance in oral squamous cell
carcinoma as detected by Immunohistochemistry.
Aims:
To enable the prediction of response to radiotherapy utilising pre-treatment
biopsy specimens.
To confirm markers of radioresistance previously described in oral squamous
cell carcinoma.
To investigate previously described markers of radioresistance from other
head and neck sites.
To identify novel molecular markers of radioresistance in oral squamous cell
carcinoma.

150
6.1 Introduction.
Despite oral cancer being the twelfth most common cancer world-wide (Parkin et al.,
2005), there has been little improvement in the five year survival over the last three
decades (Bettendorf et al., 2004). This is in part due to the difficulty in choosing the
treatment modality that will be the most suitable for an individual patient, with the
knowledge that there are a large proportion of tumours which recur after radiotherapy
treatment.
The family of epidermal growth factor receptors (EGFR) consists of four tyrosine
kinase transmembrane receptors which lie at the heart of a multitude of cell processes
including cell proliferation, angiogenesis, migration and apoptosis (Harari, 2004) as
pictured in figure 6.1. So far ten ligands have been identified in humans which bind to
the receptor each causing slightly differing intracellular responses (Yarden, 2001).
Over expression of EGFR has been demonstrated in 80-100% of head and neck
malignancies, using methods such as immunohistochemistry or fluorescent in situ
hybridization (Harari, 2004), and has been associated with a poorer prognosis
(Nicholson et al., 2001). Over expression of EGFR has also been associated with an
overall decrease in the response a tumour has to the effects of radiotherapy, with an
increase in functional EGFR demonstrated in epidermal keratinocytes and increased
resistance to radiotherapy demonstrated in vivo and in vitro (Peter et al., 1993).

151
Figure 6.1 Effects of EGFR adapted from (Harari, 2004). After ligands bind to the receptor a number
of effects can take place including angiogenesis, proliferation and metastasis.
EGFR
ligand ligand
Cell membrane
Signalling cascade
nucleus
G1
SG2
M
Cell cycleprogression

152
The mechanism by which EGFR exerts its effect depends on which particular ligand
binds and the subsequent cascade initiated. It has been found that activation of EGFR
by binding of either epidermal growth factor (EGF) or transforming growth factor-α
(TGF-α) leads to an increase in COX-2 expression. Increased levels of EGFR have
also been found together with over expression of COX-2 in breast cancer cells
(Dannenberg et al., 2005). A mechanism where-by activation of EGFR leads to an
increase in prostaglandins which then stimulate COX-2 expression has also been
described in a number of papers (Lippman et al., 2005; Mohan and Epstein, 2003).
The cyclo-oxygenase enzyme catalyzes the conversion of arachidonic acid into
various prostaglandins. These prostaglandins exert their effect by binding to G-protein
coupled cell surface receptors leading to changes in the cellular level of cyclic
adenosine monophosphate and calcium ions. Prostaglandins play a role in cell
proliferation, angiogenesis, immune surveillance and apoptosis all of which are
important in the pathogenesis of cancer (Lin et al., 2002). Two isoforms of the
enzyme exist and are referred to as COX-1 and COX-2. Whilst COX-1 is present in
normal tissue COX-2 is an inducible enzyme which is expressed in relation to
inflammation and carcinogenesis (Lin et al., 2002). Over expression of COX-2 has
been demonstrated by immunohistochemical analysis in many human malignancies
including oral cancer (Lin et al., 2002; Mohan and Epstein, 2003; Altorki et al., 2004).
Inhibition of COX-2 with selective drugs such as celecoxib has been shown to be
effective in reducing the number of adenomatous polyps in patients with FAP
(familial adenomatous polyposis) (Brown and DuBois, 2005). Celecoxib was also
153
found to inhibit the growth of head and neck cancer cell lines and augment the
efficacy of chemotherapy agents (Hashintani et al., 2003). Hashintani et al., (2003)
showed that treatment of the head and neck squamous carcinoma cell line SCC25
with celecoxib enhanced the sensitivity of the cell line to vincristine, bleomicin and
doxyrubicin. To date only one study exists looking at the relationship between
radiotherapy and COX-2. In the study by Terakado et al (2004) 41 pre-treatment
biopsy samples, taken from patients with oral cancer, all of whom had pre-operative
radiotherapy, were analysed for expression of COX-2 utilising
immunohistochemistry. A tumour was considered to be radioresistant by examining
the resected tumour specimen for residual tumour. By comparing the response to
radiotherapy (26 cases were deemed non-responders and 15 were deemed as
responders) with the expression of COX-2 the conclusion was made that COX-2
predicts for radioresistance (p=0.047) (Terakado et al., 2004).
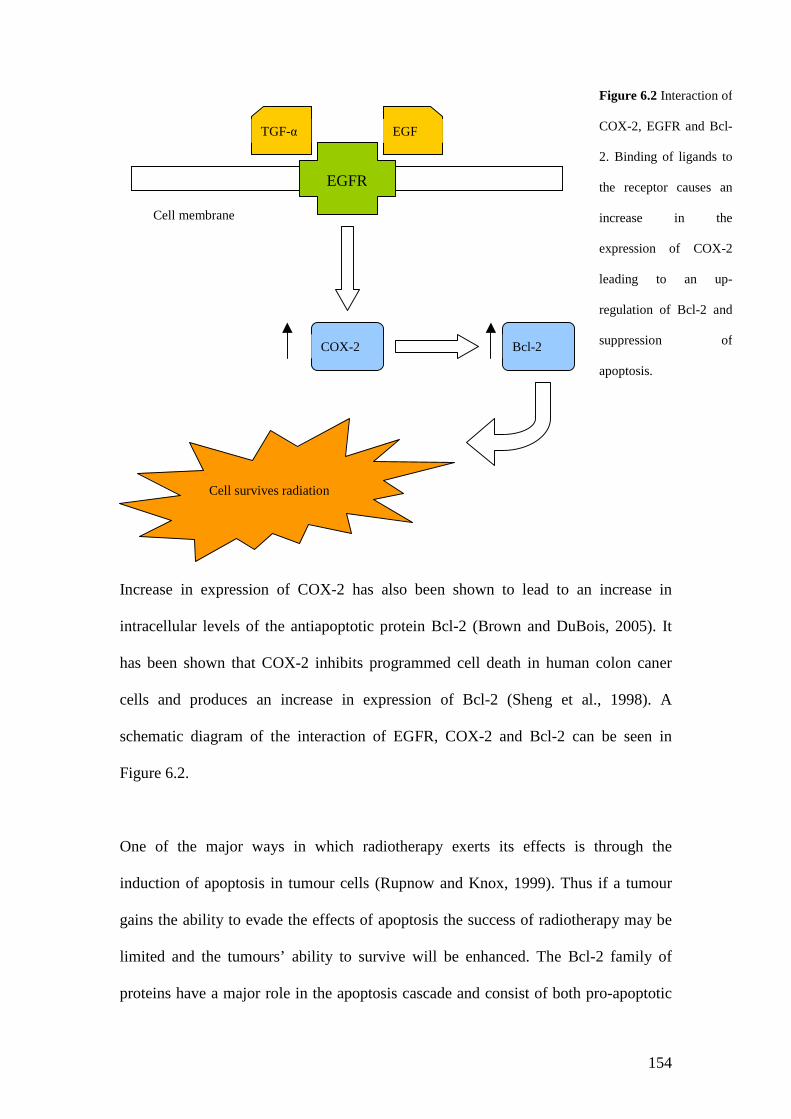
154
Increase in expression of COX-2 has also been shown to lead to an increase in
intracellular levels of the antiapoptotic protein Bcl-2 (Brown and DuBois, 2005). It
has been shown that COX-2 inhibits programmed cell death in human colon caner
cells and produces an increase in expression of Bcl-2 (Sheng et al., 1998). A
schematic diagram of the interaction of EGFR, COX-2 and Bcl-2 can be seen in
Figure 6.2.
One of the major ways in which radiotherapy exerts its effects is through the
induction of apoptosis in tumour cells (Rupnow and Knox, 1999). Thus if a tumour
gains the ability to evade the effects of apoptosis the success of radiotherapy may be
limited and the tumours’ ability to survive will be enhanced. The Bcl-2 family of
proteins have a major role in the apoptosis cascade and consist of both pro-apoptotic
EGFR
TGF-α EGF
Cell membrane
Cell survives radiation
COX-2 Bcl-2
Figure 6.2 Interaction of
COX-2, EGFR and Bcl-
2. Binding of ligands to
the receptor causes an
increase in the
expression of COX-2
leading to an up-
regulation of Bcl-2 and
suppression of
apoptosis.
155
members such as Bax and anti-apoptotic members such as Bcl-2 (Haupt et al., 2003).
Bcl-2 was first recognised as a gene that was deregulated by the t(14;18)
chromosomal translocation associated with B cell lymphoma in man (Bakhshi et al.,
1985). Its anti-apoptotic role was soon recognised and is now well established (Vaux
et al., 1988). It initiates apoptosis by stabilising the mitochondrial membrane,
preventing cytochrome c release and its subsequent binding to apoptosis activating
factor-1 (Thomadaki and Scorilas, 2006). In response to stress Bax forms a
homodimmer causing release of cytochrome c from the mitochondria. This results in
caspase 9 activation which eventually leads to apoptosis (Adams and Cory, 1998).
Overall the ratio of pro-apoptotic (e.g. Bax) to pro-survival (e.g.Bcl-2) proteins seems
to determine the cells sensitivity or resistance to apoptotic stimuli such as
radiotherapy (Thomadaki and Scorilas, 2006).
The reported prevalence of bcl-2 in oral cancer varies quite widely from study to
study with recent studies finding bcl-2 positive oral cancers in 55%, 26%, 17% and
7% of cases respectively on immunohistochemical analysis (Lo Muzio et al., 2005; Lo
Muzio et al., 2003; Schildt et al., 2003; Vora et al., 2003). Bax has not been as
extensively studied in the literature as its’ counterpart Bcl-2 but it has been reported to
be over-expressed in 46% of oral cancer specimens (Teni et al., 2002).
A review by Smith and Hafty, (1999) looked at molecular markers of radioresistance,
including EGFR, Bcl-2, p53 and VEGF, in head and neck cancer and concluded that
there where no markers at present which reliably predicted the response a tumour has
to radiotherapy. This review looked at head and neck cancer as a whole, grouping all
the individual subsites together (Smith and Haffty, 1999). As head and neck cancer

156
consists of a diverse group of tumours, from the tongue to the hypopharynx, it would
seem more sensible to study each subsite separately. This approach may yield more
rewarding results and is the approach adopted in this chapter. As EGFR is over
expressed in 80-100% of head and neck cancer it would seem unlikely that this
marker alone will aid in the prediction of a tumours response to radiotherapy. This
thesis attempts to use the knowledge that EGFR is linked with the expression of
COX-2 and Bcl-2 to see if these three markers can be used either alone or in
conjunction to predict the response to radiotherapy of oral squamous cell carcinoma.
6.2 Materials and Methods.
6.2.1 Patient details.
The Local Research Ethics Committees’ approval was obtained to allow the data and
archival tissue blocks to be collected on patients who had been treated with
radiotherapy for oral squamous cell carcinoma. Using the local head and neck cancer
database in tandem with the local histopathology database, 254 cases of oral
squamous cell carcinoma were identified in the time period 1996 to 2004. Of these,
185 case notes were retrieved and 88 of these had been treated with radiotherapy as
the primary modality. Tumours were classed as radioresistant if biopsy proven
squamous cell carcinoma recurred at the primary tumour site within twelve months of
the initial treatment. In the present literature no universally accepted definition of
radioresistance exists. A recurrence should have the same histology as the original
tumour and occur at the original site within a specified time frame. These
characteristics prevent second primaries or occult metastasis being classified as radio
recurrence. The definition used in this thesis has been used in other head and neck
case series (Nix et al., 2005).
157
Ten such cases were identified from the notes, but only nine tissue samples were
available for retrieval. To reduce confounding factors the nine cases were matched
with a control case that was deemed radiosensitive, as there had not been a recurrence
of the original tumour within the first year of follow-up. They were also matched for
age, gender, tumour subsite, T-stage and smoking and alcohol history. The dose of
radiotherapy given ranged from 50Gy – 60Gy in a fractionated regimen. Patients had
been followed up in the ENT head and neck clinic on a monthly basis for the first
year, on a bimonthly basis for the second year, every three months for the third year,
six monthly for the forth year and yearly thereafter. At each visit patients had
undergone a clinical examination of their oral cavity for evidence of tumour
recurrence.
6.2.2 Immunohistochemistry
The tissue sections were stained for EGFR, COX-2, Bcl-2 and Bax, as described in
section 2.3, using 100µl of the primary antibodies anti EGFR (Ab-5 clone H11,
Neomarkers USA), anti cox-2 (BD Transduction laboratories UK), anti Bcl-2 (Ab-3
clone Stratech Scientific Ltd K) and anti Bax (Ab-5 clone Stratech Scientific)
respectively. This was used at a dilution of 1:50, (diluted in 0.2x casein in TBS, with
the negative control being 100µl of 0.2x casein in TBS) for EGFR, COX-2 and Bcl-2
and 1:100 for Bax.
6.2.3 Interpretation and assessment of staining.
The slides were independently scored by two investigators who were blinded as to the
outcome of radiotherapy. If a difference of opinion was encountered the slide in

158
question was discussed, and if no consensus could be reached a third scorer, also
blinded to the outcome of radiotherapy, was asked to adjudicate. During the scoring
process for all the markers assessed a consensus of opinion was reached in each case.
As EGFR, COX-2 and Bcl-2 are not usually detected in normal oral mucosal (Hou et
al., 1992), sections were regarded as positive if greater than 10% of the tumour cells
stained positive for their presence. The pro-apoptotic marker was scored in the
context of loss of expression, so if ≥50% of the cytoplasm stained for Bax then the
section was deemed to be positive.
6.2.4 Statistical Analysis
Statistical analysis was performed using the statistics programme SPSS v11.5 for
windows (SPSS inc. Illinois, USA). Bivariate Pearson correlation analysis was
performed and p-values generated for correlations between the radioresistant group
and other variables. A p-value of less then 0.05 was taken to indicate a significant
relationship.
6.3. Results.
From our data, ten patients were identified who satisfied our criteria for a
radioresistant tumour. Of these, nine tissue blocks were available for analysis. All had
been treated with radiotherapy as the primary treatment modality. The characteristics
of this patient group are shown in table 6.1 along with the characteristics of the
controls. The age range of the radioresistant group was from 33 years to 79 years with
a mean age of 53 years. The radioresistant samples were matched with seven controls
for gender, age, smoking and alcohol history and tumour subsite. The controls were
considered radiosensitive if there was no reported recurrence at the site of the first

159
tumour after the first year of follow-up. Samples of the slides staining positive and
negative are shown in figure 6.2 with summary of data shown in table 6.3. As can be
seen in Table 6.1 a correlation was found between EGFR and response to
radiotherapy, with positive staining correlating with a radioresistant tumour
(p=0.0439), a significant correlation was also found between BAX and smoking
history, with positive staining correlating with smokers (p=0.0004).
Sample Age Gender Smoking Alcohol Subsite Response
1 33 ♀ Smoker Nil Tongue Radioresistant
2 42 ♀ Nil Nil Tongue Radioresistant
3 44 ♀ Nil Drinker Tongue Radioresistant
4 47 ♂ Nil Drinker Tongue Radioresistant
5 50 ♂ Smoker Drinker Oral cavity Radioresistant
6 55 ♂ Smoker Drinker Floor of
mouth
Radioresistant
7 57 ♂ Smoker ? Tongue Radioresistant
8 70 ♂ Smoker ? Oral cavity Radioresistant
9 79 ♀ Smoker Nil Floor of
mouth
Radioresistant
10 37 ♀ Nil Drinker Tongue Radiosensitive
11 45 ♂ Nil Drinker Tongue Radiosensitive

160
12 46 ♀ Smoker Nil Floor of
mouth
Radiosensitive
13 55 ♂ Smoker Drinker Floor of
mouth
Radiosensitive
14 59 ♂ Smoker Nil Tongue Radiosensitive
15 73 ♂ Smoker Drinker Tongue Radiosensitive
16 78 ♀ Nil ? Tongue Radiosensitive
Table 6.1. Showing the patient characteristics of the radioresistant and radiosensitive groups. Where
“?” appears the information was not available from the notes. ♂ = male patient and ♀ = female patient.
Oral cavity refers to a tumour which involves both the lateral border of tongue and the floor of mouth.
a. b.
c. d.
Figure 6.3. Showing positive staining
results for (a) Bax, (b) EGFR, (c) Bcl-2
and (d) COX-2. Cells stained brown
represent a positive result for the

161
e.
Positive staining Negative Staining
EGFR 4 (25%) 12 (75%)
COX-2 6 (38%) 10 (62%)
Bcl-2 15 (94%) 1 (6%)
BAX 8 (50%) 8 (50%)
Table 6.2. Showing the number of samples staining positive for the markers investigated in this chapter
with corresponding percentages in brackets.
COX-2 + EGFR + Bcl-2 + BAX+
Radioresistance 0.5473 0.0439 0.8609 0.6419
Age 0.5717 0.0716 0.4006 0.7389
Smoking history 0.4577 0.5816 0.2711 0.0004

162
Alcohol history 0.6059 0.5463 0.4533 0.4710
Gender 0.7192 0.7889 0.2070 0.1489
Table 6.3. Showing p-values for correlations between positive staining for marker, tumour and patient
characteristics. P-values of less than 0.05 were considered significant. Values highlighted in blue are
significant correlations.
6.4. Discussion.
All of the markers examined have previously been studied in relation to head and
neck cancer, either on a specific subsite or taking head and neck cancer as a whole.
EGFR has been shown to be over-expressed in 80 – 100% of head and neck cancer
(Harari, 2004) and studies have also shown an over-expression in 100% or oral
squamous cell carcinoma (Storkel et al., 1993). An over-expression of COX-2 has
been reported in 100% of head and neck cancer (Chan et al., 1999) and in a study on
oral cancer alone the over-expression of COX-2 was reported as 60% (Terakado et al.,
2004). Bcl-2 and its counterpart Bax have not been as extensively studied with the
reported over-expression varying from 7-55%, for Bcl-2, and 46%, for BAX, in cases
of oral cancer (Lo Muzio et al., 2005; Lo Muzio et al., 2003; Schildt et al., 2003; Vora
et al., 2003; Teni et al., 2002; Teni et al., 2002).
163
When comparing the current literature to our results there are some clear differences.
In our study only 25% of the specimens stained positive for EGFR (table 6.2) as
opposed to the near 100% of oral cancer specimens found in previous studies (Storkel
et al., 1993). Positive staining for COX-2 was found in 38% of cases which compares
with 60% of cases described in other reports (Terakado et al., 2004). Bcl-2 was
expressed by 94% of our sample, a much larger fraction than previously reported (Lo
Muzio et al., 2003; Schildt et al., 2003; Vora et al., 2003), and Bax stained positive in
50% of cases, a figure much more akin to the other study on the expression of Bax in
oral cancer (Teni et al., 2002). These discrepancies highlight the problems associated
with immunohistochemistry as there are many variables which can alter the potential
staining of a tumour for a particular antigen including the fixative used and the
fixation process (Farmilo et al., 2003). The different scoring systems used in the
literature also have an effect on the results. Terakado et al., (2004) allowed for a
positive result with as little as 5% of the tumour cells staining for COX-2 thus leading
to a potential increase in the positive samples as compared to our study. The number
of independent scorers along with their ability to interpret histological slides has a
bearing on the outcome of a positive result with a consultant histopathologist being
more skilled than some investigators at interpreting staining results.
Of the markers studied in this chapter only EGFR showed a correlation with a
radioresistant tumour (Table 6.3) with positive staining predicting for a radioresistant
tumour. This finding is supported by an in vitro study on head and neck cancer cell
lines, in which a monoclonal antibody, C225 also known as cetuximab, was used to
block the effects of EGFR. When this was combined with radiotherapy the effects

164
were greater than those of radiotherapy alone (Harari and Huang, 2001) suggesting a
role for EGFR in radioresistance.
As previously stated the EGFR family is at the centre of a cascade of events and can
activate a number of different responses depending on the ligand which binds to it
including increased expression of Bcl-2 and COX-2. Whilst 25% of cases stained
positive for EGFR in our study the percentage of cases staining positive for the other
markers (COX-2, Bcl-2 and BAX) was always higher than this ranging from 38-94%
(Table 6.2). These other markers may play a role in the overall genotype of oral
cancer and not just in the response to radiotherapy. Other stimuli may lead to their
over expression, such as smoking or alcohol intake, as well as EGFR status.
Positive staining for BAX was found to correlate with the smoking history in the
cases selected in our study (p=0.004). Teni et al., (2002) found a similar correlation
with Bax and chewing tobacco induced oral cancer again utilizing the method of
immunohistochemistry to detect the expression of Bax. Thus suggesting that the
carcinogen in the tobacco causes an up regulation of the protein Bax in an effort to
induce apoptosis in the cells with tobacco induced DNA damage.
Whilst only EGFR status was found to predict for response to radiotherapy in this
study other studies on COX-2 and Bcl-2 in head and neck cancer have found a
positive correlation (Nix et al., 2005; Terakado et al., 2004). The relatively small
sample size of oral SCC specific cases in this study means that any correlation has to
be particularly strong for a statistically significant relationship to be found. So whilst
there may indeed by a relation ship between COX-2, Bcl-2, Bax and response to

165
radiotherapy in oral SCC, it is not strong enough to overcome the small number in this
study. It would be interesting to study a larger group of homogeneous oral SCC
tumours to try and identify a link between Bcl-2, COX-2, Bax and radioresistance.
Chapter 7 – Concluding remarks.
Radiotherapy has been, and continues to be, a major treatment modality used in the
treatment of oral squamous cell carcinoma. The prognosis of oral cancer has failed to
show significant improvement over the past three decades. Resistance of oral cancer
cells to the effects of ionising radiation remains an obstacle to improvement in the
prognosis of this type of cancer. Radiotherapy in itself has a number of unpleasant
side effects and when a tumour fails to respond to radiotherapy the prognosis is
worsened further. The overall aim of this Thesis was to investigate the mechanism of
radioresistance and attempt to identify markers that could predict the response to
radiotherapy. To achieve this, the Thesis had a number of secondary aims:
To establish a novel subclone of radioresistant oral cancer cells using a course
of fractionated radiotherapy.

166
To use expression microarrays to investigate the mechanism by which oral
cancer avoids the effects of radiotherapy.
To identify potential markers of radioresistance in oral cancer using
microarrays.
To investigate previously described markers of radioresistance in head and
neck cancer with specific focus on oral cancer via immunohistochemistry.
Investigation of radioresistance in a tumour is hampered by a number of factors. The
definition of radioresistance itself in a clinical setting varies widely from study to
study affecting the final outcome of the study and any realistic comparison between
studies. Sampling error can occur when a biopsy is taken from a tumour as this biopsy
only represents a small fraction of the overall tumour population. This fraction may or
may not have responded to radiotherapy in the patient and so the predictive value of
studies utilizing such methods is called into question. This Thesis has overcome these
problems by creating a novel, physiologically proven, radioresistant cell line from a
previously established oral squamous carcinoma cell line. This enables the
characteristics of a radioresistant population of cells to be studied and extraction of
large quantities of pure nucleic acids for further genetic analysis. Thus far it is our
understanding that no other proven radioresistant oral cancer cell line has been created
for study. A whole host of techniques can now be used on this “stock” of
radioresistant oral cancer cells to both investigate mechanisms of radioresistance and
trial therapies for eventual clinical use.
There have been a number of research studies in the past which have looked at
individual markers of radioresistance (Terakado et al., 2004) or markers in tandem
167
such as p53 and Ki67 (Couture et al., 2002) in an effort to predict response of oral
cancer to radiotherapy. The literature on the whole can be quite contradictory and a
reliable marker is yet to be fully evaluated. This Thesis aimed to look beyond a single
indicator of radioresistance by utilizing the relatively new technology of cDNA
microarrays.
The utilization of cDNA microarray technology has been used to study a wide variety
of cancers and in many different aspects of cancer development. To date they have
not been used to search for markers of radioresistance in oral cancer. This Thesis
aimed to fill this gap by comparing our radioresistant cell line to its parent cell line,
shown to be considerably less resistant to the effects of radiotherapy. We were able to
identify a number of genes which when present confer a radioresistant phenotype to
the tumour. The most promising results came from the PE-CAPJ49 cell lines with a
total of 40 genes being identified as having a significantly altered level of expression.
Of these, one of the genes identified had shown decreased expression the
radioresistant cell line and the rest had been over-expressed. When the function of
these genes was looked at more closely, it soon became evident that the genes fell into
two broad groups, those whose function was cytotoxic to the cell, and thus
contradictory to expected findings, and those which exhibited a cytoprotective effect.
As would be expected, the majority of the genes whose function was well known had
an overall cytoprotective effect on the cell. Interestingly a number of the genes
identified actually counteracted each other with this being best illustrated by the
interaction of caspase 8 and GMEB1.
168
From the analysis performed on the two cell lines PE-CAPJ41RR and PE-CAPJ49RR
it is clear that no single gene holds the key to the cascade of events that leads to a
colony of cells becoming radioresistant. Instead, a complex interaction of many genes
is involved in regulating the response each cell has to the harmful effect of ionising
radiation and overcoming the inevitable damage to the DNA. These findings should
enable us to eventually determine a panel of genes which will identify how a tumour
is likely to respond to a course of fractionated radiotherapy using a routine assay such
as Immunohistochemistry.
Alternatively in the future it may be possible to use a sample of tumour DNA,
extracted from a patient, and by using cDNA microarrays create a “fingerprint” of the
cancer DNA which will enable us to confidently predict whether this tumour will
respond to radiotherapy and if not, which gene/gene product needs inhibiting to allow
radiotherapy to work. This thesis aims to be the start of this process but before this
can happen, further studies such as quantitative PCR need performing to confirm that
the genes identified in this thesis are actually implicated in radioresistance.

169
Reference List
Abe,N., Kohu,K., Ohmori,H., Hayashi,K., Watanabe,T., Hozumi,K., Sato,T., Habu,S.,and Satake,M. (2005). Reduction of Runx1 transcription factor activity up-regulatesFas and Bim expression and enhances the apoptotic sensitivity of double positivethymocytes. J Immunol. 175, 4475-4482.
Adams,J.M. and Cory,S. (1998). The Bcl-2 protein family: arbiters of cell survival.Science 281, 1322-1326.
Adelstein,D.J. (1994). The community approach to salvage therapy for advanced headand neck cancer. Seminars in Oncology 21, 52-57.
Aebersold,D.M., Beer,K.T., Laissue,J., Hug,S., Kollar,A., Greiner,R.H., andDjonov,V. (2000). Intratumoral microvessel density predicts local treatment failure ofradically irradiated squamous cell cancer of the oropharynx. International Journal ofRadiation Oncology*Biology*Physics 48, 17-25.
Aita,V.M., Liang,X.H., Murty,V.V., Pincus,D.L., Yu,W., Cayanis,E., Kalachikov,S.,Gilliam,T.C., and Levine,B. (1999). Cloning and genomic organization of beclin 1, acandidate tumor suppressor gene on chromosome 17q21. Genomics 59, 59-65.

170
Akamatsu,M., Matsumoto,T., Oka,K., Yamasaki,S., Sonoue,H., Kajiyama,Y.,Tsurumaru,M., and Sasai,K. (2003). c-erbB-2 oncoprotein expression related tochemoradioresistance in esophageal squamous cell carcinoma. Int. J Radiat. OncolBiol. Phys. 57, 1323-1327.
Alsner,J., Hoyer,M., Sorensen,S.B., and Overgaard,J. (2001). Interaction betweenpotential doubling time and TP53 mutation: predicting radiotherapy outcome insquamous cell carcinoma of the head and neck. International Journal of RadiationOncology,Biology, Physics 49, 519-525.
Altorki,N.K., Subbaramaiah,K., and Dannenberg,A.J. (2004). COX-2 inhibition inupper aerodigestive tract tumours. Seminars in Oncology 31, 30-35.
Arjungi,K.N. (1976). Areca nut: a review. Arzneimittelforschung. 26, 951-956.
Avramopoulos,D., Cox,T., Blaschak,J.E., Chakravarti,A., and Antonarakis,S.E.(1992). Linkage mapping of the AML1 gene on human chromosome 21 using a DNApolymorphism in the 3' untranslated region. Genomics 14, 506-507.
Axell,T., Pindborg,J.J., Smith,C.J., and van,d.W., I (1996). Oral white lesions withspecial reference to precancerous and tobacco- related lesions: conclusions of aninternational symposium held in Uppsala, Sweden, May 18-21 1994. InternationalCollaborative Group on Oral White Lesions. J Oral Pathol Med. 25, 49-54.
Azria,D., Larbouret,C., Robert,B., Culine,S., Ychou,M., Verrelle,P., Dubois,J.B., andPelegrin,A. (2003). [Radiotherapy and inhibitors of epidermal growth factor receptor:preclinical findings and preliminary clinical trials]. Bull. Cancer 90 Spec No, S202-S212.
Baens,M., Chaffanet,M., Aerssens,J., Cassiman,J.J., and Marynen,P. (1994).Assignment of the gene for the human proliferating cell nucleolar protein P120(NOL1) to chromosome 12p13 by fluorescence in situ hybridization and polymerasechain reaction with somatic cell hybrids. Genomics 21, 296-297.
Bakhshi,A., Jensen,J.P., Goldman,P., Wright,J.J., McBride,O.W., Epstein,A.L., andKorsmeyer,S.J. (1985). Cloning the chromosomal breakpoint of t(14;18) humanlymphomas: clustering around JH on chromosome 14 and near a transcriptional uniton 18. Cell 41, 899-906.
Barasch,A., Gofa,A., Krutchkoff,D.J., and Eisenberg,E. (1995). Squamous cellcarcinoma of the gingiva. A case series analysis. Oral Surg Oral Med. Oral PatholOral Radiol. Endod. 80, 183-187.
Barton,D.E., Foellmer,B.E., Du,J., Tamm,J., Derynck,R., and Francke,U. (1988).Chromosomal mapping of genes for transforming growth factors beta 2 and beta 3 inman and mouse: dispersion of TGF-beta gene family. Oncogene Res 3, 323-331.
Baselga,J. (2001). The EGFR as a target for anticancer therapy - focus on cetuximab.Eur. J. Cancer. 37, S16-S22.
Bataini,J.P., Asselain,B., Jaulerry,C., Brunin,F., Bernier,J., Pontvert,D., and Lave,C.(1990). A multivariate primary tumour control analysis in 465 patients treated by

171
radical radiotherapy for cancer of the tonsillar region: clinical and treatmentparameters as prognostic factors. Radiotherapy and oncology 19, 237-244.
Bauer,C.A. and Jenkins,H.A. (2005). Otologic Symptoms and Syndromes. InCummings Otolaryngology Head and Neck Surgery, C.W.Cummings, P.W.Flint,L.A.Harker, B.H.Haughey, M.A.Richardson, K.T.Robbins, D.E.Schuller, andJ.R.Thomas, eds. (philadelphia: Mosby inc), pp. 2867-2881.
Belbin,T.J., Singh,B., Barber,I., Socci,N., Wenig,B., Smith,R., Prystowsky,M.B., andChilds,G. (2002). Molecular classification of head and neck squamous cell carcinomausing cDNA microarrays. Cancer Res 62, 1184-1190.
Bergeron,P., Douziech,M., Daigle,N., and Blouin,R. (1997). Inhibition of cell growthby overexpression of the ZPK gene. Biochem. Biophys. Res Commun. 231, 153-155.
Bernardin-Fried,F., Kummalue,T., Leijen,S., Collector,M.I., Ravid,K., andFriedman,A.D. (2004). AML1/RUNX1 increases during G1 to S cell cycleprogression independent of cytokine-dependent phosphorylation and induces cyclinD3 gene expression. J Biol. Chem. 279, 15678-15687.
Bettendorf,O., Piffko,J., and Bankfalvi,A. (2004). Prognostic and predictive factors inoral squamous cell cancer: important tools for planning individual therapy? OralOncology 40, 110-119.
Bhattathiri,V.N., Bindu,L., Remani,P., Chandralekha,B., Davis,C.A., and Nair,K.M.(1996). Serial cytological assay of micronucleus induction: a new tool to predicthuman cancer radiosensitivity. Radiotherapy and oncology 41, 139-142.
Bhattathiri,V.N., Bindu,L., Remani,P., Chandralekha,B., and Nair,K.M. (1998).Radiation-induced acute immediate nuclear abnormalities in oral cancer cells: serialcytologic evaluation. Acta Cytol 42, 1084-1090.
Bindu,L., Balaram,P., Mathew,A., Remani,P., Bhattathiri,V.N., and Nair,M.K.(2003). Radiation induced changes in oral carcinoma cells - a multiparametricevaluation. Cytopathology 14, 287-293.
Boehrer,S., Brieger,A., Schaaf,S., Kukoc-Zivojnov,N., Nowak,D., Ruthardt,M.,Hoelzer,D., Mitrou,P.S., Weidmann,E., and Chow,K.U. (2004). In theerythroleukemic cell line HEL Prostate-apoptosis-response-gene-4 (par-4) fails todown-regulate Bcl-2 and to promote apoptosis. Leuk. Lymphoma 45, 1445-1451.
Boenisch,T., Farmilo,A.J., and Stead,R.H. (1989a). Antibodies. In ImmunochemicalStaining Methods, S.J.Naish, ed. (California: DAKO Corporation), pp. 1-6.
Boenisch,T., Farmilo,A.J., and Stead,R.H. (1989b). Fixation inimmunocytochemistry. In Immunochemical Staining Methods, S.J.Naish, ed.(California: DAKO Corporation), pp. 24-28.
Bornstein,M.M., Kalas,L., Lemp,S., Altermatt,H.J., Rees,T.D., and Buser,D. (2006).Oral lichen planus and malignant transformation: a retrospective follow-up study ofclinical and histopathologic data. Quintessence. Int. 37, 261-271.

172
Bossy,D., Mattei,M.G., and Simmons,D.L. (1994). The human intercellular adhesionmolecule 3 (ICAM3) gene is located in the 19p13.2-p13.3 region, close to the ICAM1gene. Genomics 23, 712-713.
Boyle,J.O. and Strong,E.W. (2001). Oral Cavity Cancer. In Cancer of the Head andNeck, J.P.Shah, ed. (New York: Harcourt Publishers Limited), pp. 100-126.
Bradford,A.P., Conrad,K.E., Tran,P.H., Ostrowski,M.C., and Gutierrez-Hartmann,A.(1996a). GHF-1/Pit-1 functions as a cell-specific integrator of Ras signaling bytargeting the Ras pathway to a composite Ets-1/GHF-1 response element. J BiolChem. 271, 24639-24648.
Bradford,A.P., Conrad,K.E., Tran,P.H., Ostrowski,M.C., and Gutierrez-Hartmann,A.(1996b). GHF-1/Pit-1 functions as a cell-specific integrator of Ras signaling bytargeting the Ras pathway to a composite Ets-1/GHF-1 response element. J BiolChem. 271, 24639-24648.
Brandt,S. and Jentsch,T.J. (1995). ClC-6 and ClC-7 are two novel broadly expressedmembers of the CLC chloride channel family. FEBS Lett. 377, 15-20.
Brennan,J.A., Boyle,J.O., Koch,W.M., Goodman,S.N., Hruban,R.H., Eby,Y.J.,Couch,M.J., Forastiere,A.A., and Sidransky,D. (1999). Association between cigarettesmoking and mutation of the p53 gene in squamous cell carcinoma of the head andneck. New England Journal Of Medicine 332, 712-717.
Brennan,M., Migliorati,C.A., Lockhart,P.B., Wray,D., Al-Hashimi,I., Axell,T.,Bruce,A.J., Carpenter,W., Eisenberg,E., Epstein,J.B., Holmstrup,P., Jontell,M.,Nair,R., Sasser,H., Schifter,M., Silverman,B., Thongprasom,K., Thornhill,M.,Warnakulasuriya,S., and van,d.W., I (2007). Management of oral epithelial dysplasia:a review. Oral Surg Oral Med. Oral Pathol Oral Radiol. Endod. 103 Suppl, S19-12.
Bristow,R.G., Benchimol,S., and Hill,R.P. (1996). The p53 gene as a modifier ofintrinsic radiosensitivity: implications for radiotherapy. Radiotherapy and oncology40, 197-223.
Broom, C. V., Marks, J. S., and Mass, W. R. Prevneting and controlling oral andpharyngeal cancer. 47, 2-11. 1998. centre for disease control and prevention.Morbidity and Mortatlity Weekly Report.Ref Type: Report
Brown,J.R. and DuBois,R.N. (2005). Cox-2: A molecular target for coloractal cancerprevention. J Clin Oncol 23, 2840-2855.
Brown,J.S., Blackburn,T.K., Woolgar,J.A., Lowe,D., Errington,R.D., Vaughan,E.D.,and Rogers,S.N. (2007). A comparison of outcomes for patients with oral squamouscell carcinoma at intermediate risk of recurrence treated by surgery alone or withpost-operative radiotherapy. Oral Oncol 43, 764-773.
Brown,L.M., Gridley,G., Diehl,S.R., Winn,D.M., Harty,L.C., Otero,E.B.,Fraumeni,J.F., Jr., and Hayes,R.B. (2001). Family cancer history and susceptibility tooral carcinoma in Puerto Rico. Cancer 92, 2102-2108.

173
Brun,E., Zatterstrom,U., Kjellen,E., Wahlberg,P., Willen,R., Brun,A., Perfekt,R., andTennvall,J. (2001). Prognostic value of histopathological response to radiotherapy andmicrovessel density in oral squamous cell carcinomas. Acta Oncol 40, 491-496.
Brunner,T.B., Gupta,A.K., Shi,Y., Hahn,S.M., Muschel,R.J., McKenna,W.G., andBernhard,E.J. (2003b). Farnesyltransferase inhibitors as radiation sensitizers. Int. JRadiat. Biol 79, 569-576.
Brunner,T.B., Gupta,A.K., Shi,Y., Hahn,S.M., Muschel,R.J., McKenna,W.G., andBernhard,E.J. (2003a). Farnesyltransferase inhibitors as radiation sensitizers. Int. JRadiat. Biol 79, 569-576.
Brunner,T.B., Hahn,S.M., McKenna,W.G., and Bernhard,E.J. (2004a). Radiationsensitization by inhibition of activated Ras. Strahlenther. Onkol. 180, 731-740.
Brunner,T.B., Hahn,S.M., McKenna,W.G., and Bernhard,E.J. (2004b). Radiationsensitization by inhibition of activated Ras. Strahlenther. Onkol. 180, 731-740.
Brzezinski,J., Migodzinski,A., Toczek,A., Tazbir,J., and Dedecjus,M. (2005). Patternsof cyclin E, retinoblastoma protein, and p21Cip1/WAF1 immunostaining in theoncogenesis of papillary thyroid carcinoma. Clin. Cancer Res 11, 1037-1043.
Byeon,J.S., Jung,H.Y., Lee,Y.J., Lee,D., Lee,G.H., Myung,S.J., Yang,S.K.,Hong,W.S., Kim,J.H., Min,Y.I., and Kim,J.S. (2004). Clinicopathologicalsignificance of vascular endothelial growth factor-C and cyclooxygenase-2 inesophageal squamous cell carcinoma. J Gastroenterol. Hepatol. 19, 648-654.
Caccamo,A.E., Desenzani,S., Belloni,L., Borghetti,A.F., and Bettuzzi,S. (2006).Nuclear clusterin accumulation during heat shock response: implications for cellsurvival and thermo-tolerance induction in immortalized and prostate cancer cells. JCell Physiol 207, 208-219.
Calhourn,K.H., Fulmer,P., Weiss,R., and Hokanson,J.A. (1994). Distant metastasesfrom head and neck squamous cell carcinomas. Laryngoscope 104, 1199-1205.
Cane,S., Bignotti,E., Bellone,S., Palmieri,M., De las,C.L., Roman,J.J., Pecorelli,S.,Cannon,M.J., O'Brien,T., and Santin,A.D. (2004). The novel serine protease tumor-associated differentially expressed gene-14 (KLK8/Neuropsin/Ovasin) is highlyoverexpressed in cervical cancer. Am. J Obstet. Gynecol. 190, 60-66.
Canto,M.T. and Devesa,S.S. (2002). Oral cavity and pharynx cancer incidence rates inthe United States, 1975-1998. Oral Oncology 38, 610-617.
Cao,C., Shinohara,E.T., Li,H., Niermann,K.J., Kim,K.W., Sekhar,K.R., Gleave,M.,Freeman,M., and Lu,B. (2005). Clusterin as a therapeutic target for radiationsensitization in a lung cancer model. Int. J Radiat. Oncol Biol. Phys. 63, 1228-1236.
Carvalho,A.L., Magrin,J., and Kowalski,L.P. (2003). Sites of recurrence in oral andoropharyngeal cancers according to the treatment approach. Oral Diseases 9, 112-118.
Castellsague,X., Quintana,M.J., Martinez,M.C., Nieto,A., Sanchez,M.J., Juan,A.,Monner,A., Carrera,M., Agudo,A., Quer,M., Munoz,N., Herrero,R., Franceschi,S.,

174
and Bosch,F.X. (2004). The role of type of tobacco and type of alcoholic beverage inoral carcinogenesis. Int. J. Cancer. 108, 741-749.
Chan,G., Boyle,J.O., Yang,E.K., Zhang,F., Sacks,P.G., Shah,J.P., Edelstein,D.,Soslow,R.A., Koki,A.T., Woerner,B.M., Masferrer,J.L., and Dannenberg,A.J. (1999).Cyclooxygenase-2 expression is up-regulated in squamous cell carcinoma of the headand neck. Cancer Res 59, 991-994.
Chang,H.Y. and Yang,X. (2000). Proteases for cell suicide: functions and regulationof caspases. Microbiol. Mol. Biol. Rev. 64, 821-846.
Chang,P.C., Chi,C.W., Chau,G.Y., Li,F.Y., Tsai,Y.H., Wu,J.C., and Wu Lee,Y.H.(2006). DDX3, a DEAD box RNA helicase, is deregulated in hepatitis virus-associated hepatocellular carcinoma and is involved in cell growth control. Oncogene25, 1991-2003.
Chardin,P., Courtois,G., Mattei,M.G., and Gisselbrecht,S. (1991). The KUP gene,located on human chromosome 14, encodes a protein with two distant zinc fingers.Nucleic Acids Res 19, 1431-1436.
Chavrier,P., Janssen-Timmen,U., Mattei,M.G., Zerial,M., Bravo,R., and Charnay,P.(1989). Structure, chromosome location, and expression of the mouse zinc finger geneKrox-20: multiple gene products and coregulation with the proto-oncogene c-fos.Mol. Cell Biol. 9, 787-797.
Chen,I.H., Chang,J.T., Liao,C.T., Wang,H.M., Hsieh,L.L., and Cheng,A.J. (2003).Prognostic significance of EGFR and HER-2 in oral cavity cancer in betel quidprevelant area. Br. J. Cancer. 89, 681-686.
Chen,J. and Sadowski,I. (2005). Identification of the mismatch repair genes PMS2and MLH1 as p53 target genes by using serial analysis of binding elements. Proc.Natl. Acad. Sci. U. S. A 102, 4813-4818.
Chen,P.H., Ko,Y.C., Yang,Y.H., Lin,Y.C., Shieh,T.Y., Chen,C.H., and Tsai,C.C.(2004). Important prognostic factors of long-term oropharyngeal carcinoma survivorsin Taiwan. Oral Oncology 40, 847-855.
Chin,C., Bae,J.H., Kim,M.J., Hwang,J.Y., Kim,S.J., Yoon,M.S., Lee,M.K.,Kim,D.W., Chung,B.S., Kang,C.D., and Kim,S.H. (2005). Radiosensitization bytargeting radioresistance-related genes with protein kinase A inhibitor inradioresistant cancer cells. Exp. Mol. Med. 37, 608-618.
Choi,S.Y. and Kahyo,H. (1991). Effect of cigarette smoking and alcohol consumptionin the aetiology of cancer of the oral cavity, pharynx and larynx. Int. J Epidemiol. 20,878-885.
Christoph,F., Weikert,S., Miller,K., and Schrader,M. (2005). New guidelines forclinical stage I testicular seminoma? Oncology 69, 455-462.
Chung,Y.M., Kim,B.G., Park,C.S., Huh,S.J., Kim,J., Park,J.K., Cho,S.M., Kim,B.S.,Kim,J.S., Yoo,Y.D., and Bae,D.S. (2005b). Increased expression of ICAM-3 isassociated with radiation resistance in cervical cancer. Int. J Cancer 117, 194-201.

175
Chung,Y.M., Kim,B.G., Park,C.S., Huh,S.J., Kim,J., Park,J.K., Cho,S.M., Kim,B.S.,Kim,J.S., Yoo,Y.D., and Bae,D.S. (2005a). Increased expression of ICAM-3 isassociated with radiation resistance in cervical cancer. Int. J Cancer 117, 194-201.
Claesson,L., Larhammar,D., Rask,L., and Peterson,P.A. (1983). cDNA clone for thehuman invariant gamma chain of class II histocompatibility antigens and itsimplications for the protein structure. Proc. Natl. Acad. Sci. U. S. A 80, 7395-7399.
Corvo,R., Antognoni,P., and Sanguineti,G. (2001). Biological predictors of responseto radiotherapy in head and neck cancer: recent advances and emerging perspectives.Tumori 87, 355-363.
Couture,C., Raybaud-Diogene,H., Tetu,B., Bairati,I., Murry,D., Allard,J., andFortin,A. (2002). p53 and Ki-67 as markers of radioresistance in head and neckcarcinoma. Cancer 94, 713-722.
Criswell,T., Beman,M., Araki,S., Leskov,K., Cataldo,E., Mayo,L.D., andBoothman,D.A. (2005). Delayed activation of insulin-like growth factor-1receptor/Src/MAPK/Egr-1 signaling regulates clusterin expression, a pro-survivalfactor. J Biol. Chem. 280, 14212-14221.
Cummings,C.W., Flint,P.W., Harker,L.A., Haughey,B.H., Richardson,M.A.,Robbins,K.T., Schuller,D.E., and Thomas,J.R. (2005). Cummings OtolaryngologyHead and Neck Surgery. (Philadelphia: Elsevier).
Dannenberg,A.J., Lippman,S.M., Mann,J.R., Subbaramaiah,K., and DuBois,R.N.(2005). Cyclooxygenase-2 and epidermal growth factor receptor: pharmacologictargets for chemoprevention. J Clin. Oncol 23, 254-266.
Davidson,B.J. (2001). Epidemology and Aetiology. In Cancer of The Head and Neck,J.P.Shah, ed. (New York: BC Decker inc), pp. 1-19.
Davidson,B.J., Root,W.A., and Trock,B.J. (2001). Age and survival from squamouscell carcinoma of the oral tongue. Head Neck 23, 273-279.
Day,T.A., Davis,B.K., Gillespie,M.B., Joe,J.K., Kibbey,M., Martin-Harris,B.,Neville,B., Richardson,M.S., Rosenzweig,S., Sharma,A.K., Smith,M.M., Stewart,S.,and Stuart,R.K. (2003). Oral cancer treatment. Curr. Treat. Options. Oncol 4, 27-41.
De Stefani,E., Boffetta,P., Oreggia,F., Fierro,L., and Mendilaharsu,M. (1998). Hardliquor drinking is associated with higher risk of cancer of the oral cavity and pharynxthan wine drinking. A case control study in Uraguay. Oral Oncology 34, 99-104.
Demetrick,D.J., Matsumoto,S., Hannon,G.J., Okamoto,K., Xiong,Y., Zhang,H., andBeach,D.H. (1995). Chromosomal mapping of the genes for the human cell cycleproteins cyclin C (CCNC), cyclin E (CCNE), p21 (CDKN1) and KAP (CDKN3).Cytogenet. Cell Genet. 69, 190-192.
Dias,S., Choy,M., Alitalo,K., and Rafii,S. (2002). Vascular endothelial growth factor(VEGF)-C signaling through FLT-4 (VEGFR-3) mediates leukemic cell proliferation,survival, and resistance to chemotherapy. Blood 99, 2179-2184.

176
Dixon,M.F. (1996). Alimentary System. In General and Systematic Pathology,J.C.E.Underwood, ed. (Sheffield: Churchill Livingston), pp. 401-449.
Do,N.Y., Lim,S.C., and Im,T.S. (2004). Expression of c-erbB receptors, MMPs andVEGF in squamous cell carcinoma of the head and neck. Oncol Rep 12, 229-237.
Easty,D.J., Mitchell,P.J., Patel,K., Florenes,V.A., Spritz,R.A., and Bennett,D.C.(1997). Loss of expression of receptor tyrosine kinase family genes PTK7 and SEK inmetastatic melanoma. Int. J Cancer 71, 1061-1065.
Eckardt,A., Barth,E.L., Kokemueller,H., and Wegener,G. (2004). Recurrentcarcinoma of the head and neck: treatment stratergies and survival analysis in a 20-year period. Oral Oncology 40, 427-432.
Edelhoff,S., Ayer,D.E., Zervos,A.S., Steingrimsson,E., Jenkins,N.A., Copeland,N.G.,Eisenman,R.N., Brent,R., and Disteche,C.M. (1994). Mapping of two genes encodingmembers of a distinct subfamily of MAX interacting proteins: MAD to humanchromosome 2 and mouse chromosome 6, and MXI1 to human chromosome 10 andmouse chromosome 19. Oncogene 9, 665-668.
El-Gazzar,R., Macluskey,M., and Ogden,G.R. (2005). Evidence for a field changeeffect based on angiogenesis in the oral mucosa? A brief report. Oral Oncol 41, 25-30.
Elliott,E.A., Drake,J.R., Amigorena,S., Elsemore,J., Webster,P., Mellman,I., andFlavell,R.A. (1994). The invariant chain is required for intracellular transport andfunction of major histocompatibility complex class II molecules. J. Exp. Med. 179,681-694.
Elwood,J.M., Pearson,J.C., Skippen,D.H., and Jackson,S.M. (1984a). Alcohol,smoking, social and occupational factors in the aetiology of cancer of the oral cavity,pharynx and larynx. Int. J Cancer 34, 603-612.
Elwood,J.M., Pearson,J.C.G., Skippen,D.H., and Jackson,S.M. (1984b). Alcohol,smoking, social and occupational factors in the aetiology of cancer of the oral cavity,pharynx and larynx. Int. J. Cancer. 34, 603-612.
Endoh,H., Tomida,S., Yatabe,Y., Konishi,H., Osada,H., Tajima,K., Kuwano,H.,Takahashi,T., and Mitsudomi,T. (2004). Prognostic model of pulmonaryadenocarcinoma by expression profiling of eight genes as determined by quantitativereal-time reverse transcriptase polymerase chain reaction. J Clin Oncol 22, 811-819.
Evers,R., Kool,M., van,D.L., Janssen,H., Calafat,J., Oomen,L.C., Paulusma,C.C.,Oude Elferink,R.P., Baas,F., Schinkel,A.H., and Borst,P. (1998). Drug export activityof the human canalicular multispecific organic anion transporter in polarized kidneyMDCK cells expressing cMOAT (MRP2) cDNA. J Clin. Invest 101, 1310-1319.
Farmilo,A.J., Stead,R.H., and Atwood,K. (2003). Fixation in immunohistochemistry.In Handbook of Immunochemical Staining Methods, T.Boenisch, ed. CarpinteriaUSA), pp. 18-22.

177
Ferlito,A., Shaha,A.R., Silver,C.E., Rinaldo,A., and Mondin,V. (2001). Incidence andsites of distant metastases from head and neck cancer. ORL J Otorhinolaryngol. RelatSpec. 63, 202-207.
Ferrara,N., Houck,K., Jakeman,L., and Leung,D.W. (1992). Molecular and biologicalproperties of the vascular endothelial growth factor family of proteins. EndocrineReview 13, 18-32.
Ferrara,N. (2004). Vascular Endothelial Growth Factor as a Target for AnticancerTherapy. Oncologist 9, 2-10.
Fodor,S.P.A., Read,J.L., Pirrung,M.C., Stryer,L., Tsai Lu,A., and Solas,D. (1991).Light-directed, spatially addressable parallel chemical synthesis. Science 251, 767-774.
Fonagy,A., Swiderski,C., Wilson,A., Bolton,W., Kenyon,N., and Freeman,J.W.(1993). Cell cycle regulated expression of nucleolar antigen P120 in normal andtransformed human fibroblasts. J Cell Physiol 154, 16-27.
Ford,A.C. and Grandis,J.R. (2002). Targeting epidermal growth factor receptor inhead and neck cancer. Head Neck 25, 67-73.
Fossa,A., Lilleby,W., Fossa,S.D., Gaudernack,G., Torlakovic,G., and Berner,A.(2002). Independent prognostic significance of HER-2 oncoprotein expression in pN0prostate cancer undergoing curative radiotherapy. Int. J Cancer 99, 100-105.
Fukita,Y., Mizuta,T.R., Shirozu,M., Ozawa,K., Shimizu,A., and Honjo,T. (1993). Thehuman S mu bp-2, a DNA-binding protein specific to the single-stranded guanine-richsequence related to the immunoglobulin mu chain switch region. J Biol. Chem. 268,17463-17470.
Fukuda,K., Sakakura,C., Miyagawa,K., Kuriu,Y., Kin,S., Nakase,Y., Hagiwara,A.,Mitsufuji,S., Okazaki,Y., Hayashizaki,Y., and Yamagishi,H. (2004). Differential geneexpression profiles of radioresistant oesophageal cancer cell lines established bycontinuous fractionated irradiation. Br. J Cancer 91, 1543-1550.
Gassner,H.G., Sabri,A.N., and Olsen,K.D. (2005). Oropharyngeal Malignancy. InCummings Otolaryngology Head and Neck Surgery, C.W.Cummings, P.W.Flint,L.A.Harker, B.H.Haughey, M.A.Richardson, K.T.Robbins, D.E.Schuller, andJ.R.Thomas, eds., pp. 1717-1757.
Gee,J.M. and Nicholson,R.I. (2003). Expanding the therapeutic repertoire ofepidermal growth factor receptor blockade: radiosensitization. Breast. Cancer. Res. 5,126-129.
Gehanno,P., Depondt,J., Guedon,C., Kebaili,C., and Koka,V. (1993). Primary andsalvage surgery for cancer of the tonsillar region: a retrospective study of 120patients. Head Neck 15, 185-189.
Gershon,D. (2002). Microarray technology. An array of opportunities. Nature 416,891.

178
Gherzi,R., Briata,P., Boncinelli,E., Ponassi,M., Querze,G., Viti,F., Corte,G., andZardi,L. (1997). The human homeodomain protein OTX2 binds to the humantenascin-C promoter and trans-represses its activity in transfected cells. DNA CellBiol. 16, 559-567.
Girod,S.C., Kaupe,M., Pfeiffer,P., and Pape,H.D. (1998). p53 as a biomarker inradiotherapy of carcinoma of the mouth cavity. Mund Kiefer Gesichtschir 2, 11-13.
Gombos,Z., Xu,X., Chu,C.S., Zhang,P.J., and Acs,G. (2005). Peritumoral lymphaticvessel density and vascular endothelial growth factor C expression in early-stagesquamous cell carcinoma of the uterine cervix. Clin. Cancer Res 11, 8364-8371.
Gottlieb,T.M. and Jackson,S. (1993). The DNA dependent protein kinase:requirement for DNA ends and association with Ku antigen. Cell 72, 131-142.
Grabenbauer,G.G., Muhlfriedel,C., Rodel,F., Niedobitek,G., Hornung,J., Rodel,C.,Martus,P., Iro,H., Kirchener,T., Steininger,H., Sauer,R., Weidenbecher,M., andDistel,L. (2000). Squamous cell carcinoma of the oropharynx: Ki-67 and p53 canidentify patients at risk for local recurrence after surgery and postoperativeradiotherapy. International Journal of Radiation Oncology,Biology, Physics 48, 1041-1050.
Grenet,J., Teitz,T., Wei,T., Valentine,V., and Kidd,V.J. (1999). Structure andchromosome localization of the human CASP8 gene. Gene 226, 225-232.
Guo,W.F., Lin,R.X., Huang,J., Zhou,Z., Yang,J., Guo,G.Z., and Wang,S.Q. (2005).Identification of differentially expressed genes contributing to radioresistance in lungcancer cells using microarray analysis. Radiat. Res 164, 27-35.
Gupta,P.C. and Ray,C.S. (2004). Epidemiology of betel quid usage. Ann. Acad. Med.Singapore 33, 31-36.
Gupta,S., Mukheerjee,K., Gupta,Y.N., and Kumar,M. (1987). Sequential radiationchanges in cytology of vaginal smears in carcinoma of cervix uteri duringradiotherapy. Int. J. Gynaecol. Obstet. 25, 303-308.
Hachisuka,T., Narikiyo,M., Yamada,Y., Ishikawa,H., Ueno,M., Uchida,H., Yoriki,R.,Ohigashi,Y., Miki,K., Tamaki,H., Mizuno,T., and Nakajima,Y. (2005). Highlymphatic vessel density correlates with overexpression of VEGF-C in gastric cancer.Oncol Rep 13, 733-737.
Hafian,H., Venteo,L., Sukhanova,A., Nabiev,I., Lefevre,B., and Pluot,M. (2004).Immunohistochemistry study of DNA topoisomerase 1, DNA topoisomerase 2 alpha,p53, and Ki-67 in oral preneoplastic lesions and oral squamous cell carcinomas. Hum.Pathol. 35, 745-751.
Hahn,G.V., Cohen,R.B., Wozney,J.M., Levitz,C.L., Shore,E.M., Zasloff,M.A., andKaplan,F.S. (1992). A bone morphogenetic protein subfamily: chromosomallocalization of human genes for BMP5, BMP6, and BMP7. Genomics 14, 759-762.
Han,W., Han,M.R., Kang,J.J., Bae,J.Y., Lee,J.H., Bae,Y.J., Lee,J.E., Shin,H.J.,Hwang,K.T., Hwang,S.E., Kim,S.W., and Noh,D.Y. (2006). Genomic alterations

179
identified by array comparative genomic hybridization as prognostic markers intamoxifen-treated estrogen receptor-positive breast cancer. BMC. Cancer 6, 92.
Hanna,E., Shrieve,D.C., Ratanatharathorn,V., Xia,X., Breau,R., Suen,J., and Li,S.(2001). A novel alternative approach for prediction of radiation response of squamouscell carcinoma of head and neck. Cancer Res 61, 2376-2380.
Hara,T., Omura-Minamisawa,M., Chao,C., Nakagami,Y., Ito,M., and Inoue,T. (2005).BCL-2 inhibitors potentiate the cytotoxic effects of radiation in bcl-2 overexpressingradioresistant tumor cells. International Journal of Radiation Biology and Physics 61,517-528.
Harari,P.M. (2004). Epidermal growth factor receptor inhibition strategies inoncology. Endocr Relat Cancer 11, 689-708.
Harari,P.M. and Huang,S.M. (2001). Head and neck cancer as a clinical model formolecular targeting of therapy: combining EGFR blockade with radiation.International Journal of Radiation Oncology,Biology, Physics 49, 427-433.
Harpio,R. and Einarsson,R. (2004). S100 proteins as cancer biomarkers with focus onS100B in malignant melanoma. Clin Biochem. 37, 512-518.
Harris,M. (2004). Monoclonal antibodies as therapeutic agents for cancer. The LancetOncology 5, 292-302.
Harvey,T.J., Hooper,J.D., Myers,S.A., Stephenson,S.A., Ashworth,L.K., andClements,J.A. (2000). Tissue-specific expression patterns and fine mapping of thehuman kallikrein (KLK) locus on proximal 19q13.4. J Biol. Chem. 275, 37397-37406.
Hashintani,S., Urade,M., Nishimura,N., Maeda,T., Takaoka,K., Noguchi,K., andSakurai,K. (2003). Apoptosis induction and enhancement of cytotoxicity of anticancerdrugs by celecoxib, a selective cyclooxygenase-2 inhibitor, in human head and neckcarcinoma cell lines. Int. J. Oncol. 23, 665-672.
Haupt,S., Berger,M., Goldberg,Z., and Haupt,Y. (2003). Apoptosis - the p53 network.J Cell Sci 116, 4077-4085.
Hayat,M.A. (2002a). Antigen Retrieval. In Microscopy, Immunohistochemistry andAntigen Retrieval Methods., (New York: Plenum), pp. 117-168.
Hayat,M.A. (2002b). Introduction. In Microscopy, Immunohistochemistry andAntigen Retrieval Methods., (New York: Plenum), pp. 1-29.
Hicks,W.L., Jr., Loree,T.R., Garcia,R.I., Maamoun,S., Marshall,D., Orner,J.B.,Bakamjian,V.Y., and Shedd,D.P. (1997). Squamous cell carcinoma of the floor ofmouth: a 20-year review. Head Neck 19, 400-405.
Hindle,I., Downer,M.C., and Speigth,P.M. (1996). The Epidemiology of Oral Cancer.Br. J. Oral Maxillofac. Surg. 34, 471-476.

180
Hobbs,C.G., Sterne,J.A., Bailey,M., Heyderman,R.S., Birchall,M.A., and Thomas,S.J.(2006). Human papillomavirus and head and neck cancer: a systematic review andmeta-analysis. Clin. Otolaryngol 31, 259-266.
Holmstrup,P., Thorn,J.J., Rindum,J., and Pindborg,J.J. (1988). Malignantdevelopment of lichen planus-affected oral mucosa. J Oral Pathol 17, 219-225.
Hou,L., Shi,D., Tu,S.M., Zhang,H.Z., Hung,M.C., and Ling,D. (1992). Oral cancerprogression and c-erbB-2/neu proto-oncogene expression. Cancer Letters 65, 215-220.
Hsue,S.S., Wang,W.C., Chen,C.H., Lin,C.C., Chen,Y.K., and Lin,L.M. (2007).Malignant transformation in 1458 patients with potentially malignant oral mucosaldisorders: a follow-up study based in a Taiwanese hospital. J Oral Pathol Med. 36, 25-29.
Huang,S.M., Bock,J.M., and Harari,P.M. (1999). Epidermal growth factor receptorblockade with C225 modulates proliferation, apoptosis, and radiosensitivity insquamous cell carcinoma of the head and neck. Cancer Res 59, 1935-1940.
Huang,S.M., Li,J., Armstrong,E.A., and Harari,P.M. (2002). Modulation of radiationresponse and tumour-induced angiogenesis after epidermal growth factor receptorinhibition by ZD1839 (Iressa). Cancer Res 62, 4300-4306.
Huber,M.A., Kraut,N., Addicks,T., and Peter,R.U. (2000). Cell-type-dependentinduction of eotaxin and CCR3 by ionizing radiation. Biochem. Biophys. ResCommun. 269, 546-552.
Huebner,W.W., Schoenberg,J.B., Kelsey,J.L., Wilkox,H.B., Mclaughlin,J.K., andGreenburg,R.S. (1992). Oral and pharyngeal cancer and occupation: a case controlstudy. Epidemiology 3, 300-309.
Hung,C.J., Ginzinger,D.G., Zarnegar,R., Kanauchi,H., Wong,M.G., Kebebew,E.,Clark,O.H., and Duh,Q.Y. (2003). Expression of vascular endothelial growth factor-Cin benign and malignant thyroid tumors. J Clin. Endocrinol. Metab 88, 3694-3699.
Iliakis,G. (1997). Cell cycle regulation in irradiated and non-irradiated cells. Semin.Oncol 24, 602-615.
Inagi,K., Takahashi,H., Okamoto,M., Nakayama,M., Makoshi,T., and Nagai,H.(2002). Treatment effects in patients with squamous cell carcinoma of the oral cavity.Acta Otolaryngol Suppl 25-29.
Ito,F.A., Ito,K., Vargas,P.A., de Almeida,O.P., and Lopes,M.A. (2005). Salivarygland tumors in a Brazilian population: a retrospective study of 496 cases. Int. J OralMaxillofac. Surg 34, 533-536.
Jankowski,S.A., De,J.P., and Meltzer,P.S. (1995). Genomic structure of SAS, amember of the transmembrane 4 superfamily amplified in human sarcomas.Genomics 25, 501-506.

181
Jankowski,S.A., Mitchell,D.S., Smith,S.H., Trent,J.M., and Meltzer,P.S. (1994). SAS,a gene amplified in human sarcomas, encodes a new member of the transmembrane 4superfamily of proteins. Oncogene 9, 1205-1211.
Jayasurya,R., Francis,G., Kannan,S., Lekshminarayanan,K., Nalinakumari,K.R.,Abraham,T., Abraham,E.K., and Nair,M.K. (2004). p53, p16 and CyclinD1:Molecular Determinants of Response to Radiotherapy Treatment Response in OralCarcinoma. Int. J. Cancer. 109, 710-716.
Jeggo,P.A., Taccioli,G.E., and Jackson,S.P. (1995). Mehage a trios: double strandbreak repair V(D)J recombination and DNA-PK. Bioassays 17, 949-957.
Jennbacken,K., Vallbo,C., Wang,W., and Damber,J.E. (2005). Expression of vascularendothelial growth factor C (VEGF-C) and VEGF receptor-3 in human prostatecancer is associated with regional lymph node metastasis. Prostate 65, 110-116.
Johnson,A.C., Kageyama,R., Popescu,N.C., and Pastan,I. (1992). Expression andchromosomal localization of the gene for the human transcriptional repressor GCF. JBiol. Chem. 267, 1689-1694.
Johnstone,R.W., Tommerup,N., Hansen,C., Vissing,H., and Shi,Y. (1998). Mappingof the human PAWR (par-4) gene to chromosome 12q21. Genomics 53, 241-243.
Juranic,Z.D., Borojevic,N., Jovanovic,D., Stanojevic-Bakic,N., Zizak,Z., Neskovic-Konstantinovic,Z., Saric,M., Stanojkovic,T., Raonic,T., and Milosevic,D. (2004).Effects of X-ray irradiation on the overexpression of HER-2/Erb-B2 on breast cancercell lines. J Exp. Clin. Cancer Res 23, 675-680.
Kapucuoglu,N., Coban,T., Raunio,H., Pelkonen,O., Edwards,R.J., Boobis,A.R., andIscan,M. (2003). Expression of CYP3A4 in human breast tumour and non-tumourtissues. Cancer Lett. 202, 17-23.
Keele,C.A., Neil,E., and Joels,N. (1992). Digestion. In Samson Wright's AppliedPhysiology, (Oxford: Oxford University Press), pp. 422-439.
Khan,A.J., King,B.L., Smith,B.D., Smith,G.L., DiGiovanna,M.P., Carter,D., andHaffty,B.G. (2002). Characterization of the HER-2/neu oncogene byimmunohistochemical and fluorescence in situ hybridization analysis in oral andoropharyngeal squamous cell carcinoma. Clin. Cancer Res 8, 540-548.
Khan,J., Bittner,M.L., Chen,Y., Meltzer,P.S., and Trent,J.M. (1999). DNA microarraytechnology: the anticipated impact on the study of human disease. BiochimistryBiophysics Acta 1423, M17-28.
Koelbl,O., Rosenwald,A., Haberl,M., Muller,J., Reuther,J., and Flentje,M. (2001).p53 and Ki-67 as predictive markers for radiosensitivity in squamous cell carcinomaof the oral cavity? an immunohistochemical and clinicopathologic study. InternationalJournal of Radiation Oncology,Biology, Physics 49, 147-154.
Kolfschoten,I.G.M., van Leeuwen,B., Berns,K., Mullenders,J., Beijersbergen,R.L.,Bernards,R., Voorhoeve,P.M., and Agami,R. (2005). A Genetic Screen IdentifiesPITX1 as a Suppressor of RAS Activity and Tumorigenicity. Cell 121, 849-858.

182
Kumar,V., Cotran,R.S., and Robbins,S.L. (1997). Neoplasia. In Basic Pathology,V.Kumar, R.S.Cotran, and S.L.Robbins, eds. (Philadelphia: W.B.Saunders Co.), pp.132-175.
La Vecchia,C., Tavani,A., Franceschi,S., Levi,F., Corrao,G., and Negri,E. (1997).Epidemiology and prevention of oral cancer. Oral Oncology 33, 302-312.
Lakhani,S.R., Dilly,S.A., and Finlayson,C.J. (1993). Cell Growth and its Disorders. InBasic Pathology: an introduction to the mechanisms of disease, (London: EdwardArnold), pp. 153-197.
Lanfranchi-Tizeira,H.E., Aguas,S.C., and Sano,S.M. (2003). Malignanttransformation of atypical oral lichen planus: a review of 32 cases. Med. Oral 8, 2-9.
Langendijk,J.A., Slotman,B.J., van,d.W., I, Doornaert,P., Berkof,J., andLeemans,C.R. (2005). Risk-group definition by recursive partitioning analysis ofpatients with squamous cell head and neck carcinoma treated with surgery andpostoperative radiotherapy. Cancer 104, 1408-1417.
Lapeyre,M., Bollet,M.A., Racadot,S., Geoffrois,L., Kaminsky,M.C., Hoffstetter,S.,Dolivet,G., Toussaint,B., Luporsi,E., and Peiffert,D. (2004). Postoperativebrachytherapy alone and combined postoperative radiotherapy and brachytherapyboost for squamous cell carcinoma of the oral cavity, with positive or close margins.Head Neck 26, 216-223.
Lee,W.R., Mendenhall,W.M., Parsons,J.T., Million,R.R., Cassisi,N.J., andStringer,S.P. (1993). Carcinoma of the tonsillar region: a multivariate analysis of 243patients treated with radical radiotherapy. Head Neck 15, 283-288.
Leemans,C.R., Tiwari,R., Nauta,J.J., van der Waal,I., and Snow,G.B. (1994).Recurrance at the primary site in head and neck cancer and the significance of necklymph node metastases as a prognostic factor. Cancer 73, 187-190.
Li,Z., Xia,L., Lee,L.M., Khaletskiy,A., Wang,J., Wong,J.Y., and Li,J.J. (2001).Effector genes altered in MCF-7 human breast cancer cells after exposure tofractionated ionizing radiation. Radiat. Res 155, 543-553.
Liang,K., Lu,Y., Jin,W., Ang,K.K., Milas,L., and Fan,Z. (2003). Sensitization ofbreast cancer cells to radiation by trastuzumab. Mol. Cancer Ther. 2, 1113-1120.
Licitra,L., Bernier,J., Grandi,C., Merlano,M., Bruzzi,P., and Lefebvre,J.L. (2002).Cancer of the Oropharynx. Crit. Rev. Oncol. Haematol. 41, 107-122.
Lin,C.J., Grandis,J.R., Carey,T.E., Gollin,S.M., Whiteside,T.L., Koch,W.M.,Ferris,R.L., and Lai,S.Y. (2007). Head and neck squamous cell carcinoma cell lines:established models and rationale for selection. Head Neck 29, 163-188.
Lin,D.T., Subbaramaiah,K., Shah,J.P., Dannenberg,A.J., and Boyle,J.O. (2002).Cyclooxygenase-2: a novel molecular target for the prevention and treatment of headand neck cancer. Head Neck 24, 792-799.

183
Lind,P.O. (1987). Malignant transformation in oral leukoplakia. Scand. J Dent. Res95, 449-455.
Lippman,S.M., Sudbo,J., and Hong,W.K. (2005). Oral cancer prevention and theevolution of molecular-targeted drug development. J Clin Oncol 23, 346-356.
Littbrand,B. and Revesz,L. (1969). The effect of oxygen on cellular survival andrecovery after radiation. Br. J. Radiol. 42, 914-924.
Llewellyn,C.D., Johnson,N.W., and Warnakulasuriya,K.A.A.S. (2004). Risk factorsfor oral cancer in newly diagnosed patients aged 45 years and younger: a case-control study in Southern England. J Oral Pathol Med 33, 525-532.
Lo Muzio,L., Falaschini,S., Farina,A., Rubini,C., Pezzetti,F., Campisi,G., De Rosa,G.,Capogreco,M., and Carinci,F. (2005). Bcl-2 as a prognostic factor in head and necksquamous cell carcinoma. Oncol Res 15, 249-255.
Lo Muzio,L., Mignogna,M.D., Pannone,G., Rubini,C., Grassi,R., Nocini,P.F.,Ferrari,F., Serpico,R., Favia,G., De Rosa,G., and Maiorano,E. (2003). Expression ofbcl-2 in oral squamous cell carcinoma: an immunohistochemical study of 90 caseswith clinico-pathological correlations. Oncol Rep 10, 285-291.
Lodi,G., Sardella,A., Bez,C., Demarosi,F., and Carrassi,A. (2006). Interventions fortreating oral leukoplakia. Cochrane. Database. Syst. Rev. CD001829.
Lopez de,C.R., Watson,J.C., Bassi,D.E., Litwin,S., and Klein-Szanto,A.J. (2004).Simultaneous expression of furin and vascular endothelial growth factor in humanoral tongue squamous cell carcinoma progression. Clin. Cancer Res 10, 4480-4488.
Loro,L.L., Vintermyr,O.K., Liavaag,P.G., and Johannessen,A.C. (1999). Oralsquamous cell carcinoma is associated with decreased bcl-2/bax expressed ratio andincreased apoptosis. Hum. Pathol. 30, 1097-1105.
Losada,A., Lopez-Oliva,J.M., Sanchez-Puelles,J.M., and Garcia-Fernandez,L.F.(2004). Establishment and characterisation of a human carcinoma cell line withacquired resistance to AlpidinTM. Br. J. Cancer. 1-9.
Markopoulos,A.K., Antoniades,D., Papanayotou,P., and Trigonidis,G. (1997).Malignant potential of oral lichen planus; a follow-up study of 326 patients. OralOncol 33, 263-269.
Mason,A.J., Evans,B.A., Cox,D.R., Shine,J., and Richards,R.I. (1983). Structure ofmouse kallikrein gene family suggests a role in specific processing of biologicallyactive peptides. Nature 303, 300-307.
Massano,J., Regateiro,F.S., Januario,G., and Ferreira,A. (2006). Oral squamous cellcarcinoma: review of prognostic and predictive factors. Oral Surg Oral Med. OralPathol Oral Radiol. Endod. 102, 67-76.
Massard,G., Roeslin,N., Jung,G.M., Dumont,P., Wihlm,J.M., and Morand,G. (1993).Bronchogenic cancer associated with head and neck tumours. Survival analysis of 194patients. Journal of Cardiovascular Surgery 106, 218-227.

184
Matsuyama,A., Inoue,H., Shibuta,K., Tanaka,Y., Barnard,G.F., Sugimachi,K., andMori,M. (2001). Hepatoma-derived growth factor is associated with reducedsensitivity to irradiation in esophageal cancer. Cancer Res 61, 5714-5717.
Mazer,T.M., Robbins,K.T., McMurtrey,M.J., and Byers,R.M. (1988). Resection ofpulmonary metastases from squamous carcinoma of the head and neck. Am. J. Surg56, 238-242.
Mazumder,S., DuPree,E.L., and Almasan,A. (2004). A dual role of cyclin E in cellproliferation and apoptosis may provide a target for cancer therapy. Curr. CancerDrug Targets. 4, 65-75.
Mckaig,R.G., Baric,R.S., and Olsan,A.F. (1998). Human papillomarvirus and headand neck cancer: epidemiology and mollecular biology. Head Neck 20, 250-265.
Memon,M.H. and Jafarey,N.A. (1970). Cytologic study of radiation changes incarcinoma of the oral cavity: prognostic value of various observations. Acta Cytol 14,22-24.
Merletti,F., Boffetta,P., Ferro,G., Pisani,P., and Terracini,B. (1991). Occupation andcancer of the oral cavity or oropharynx in Turin, Italy. Scandinavian Journal of Work,Environment and Health 17, 248-254.
Midander,J. and Revesz,L. (1980). The Micronucleus (MN) in irradiated cells as ameasure of survival. Br. J. Cancer. 41, 204-212.
Mohan,S. and Epstein,J.B. (2003). Carcinogenesis and cyclooxygenase: the potentialrole of COX-2 inhibition in upper aerodigestive tract cancer. Oral Oncology 39, 537-546.
Moore,S.R., Johnson,N.W., Pierce,A.M., and Wilson,D.F. (2000a). The epidemiologyof tongue cancer: a review of global incidence. Oral Diseases 6, 75-84.
Moore,S.R., Johnson,N.W., Pierce,A.M., and Wilson,D.F. (2000b). TheEpidemiology of Mouth Cancer: a review of global incidence. Oral Diseases 6, 65-74.
Mossie,K., Jallal,B., Alves,F., Sures,I., Plowman,G.D., and Ullrich,A. (1995). Coloncarcinoma kinase-4 defines a new subclass of the receptor tyrosine kinase family.Oncogene 11, 2179-2184.
Motegi,Y., Usui,T., Ishida,K., Kato,S., and Yamashita,H. (2003). Regulation ofbovine corneal endothelial cell cycle by transforming growth factor-beta. ActaOphthalmol. Scand. 81, 517-525.
Mowen,K.A., Tang,J., Zhu,W., Schurter,B.T., Shuai,K., Herschman,H.R., andDavid,M. (2001). Arginine methylation of STAT1 modulates IFNalpha/beta-inducedtranscription. Cell 104, 731-741.
Muller-Tidow,C., Schwable,J., Steffen,B., Tidow,N., Brandt,B., Becker,K., Schulze-Bahr,E., Halfter,H., Vogt,U., Metzger,R., Schneider,P.M., Buchner,T., Brandts,C.,Berdel,W.E., and Serve,H. (2004). High-Throughput Analysis of Genome-Wide

185
Receptor Tyrosine Kinase Expression in Human Cancers Identifies Potential NovelDrug Targets. Clin Cancer Res 10, 1241-1249.
Mundy,D.W., Harb,W., and Jevremovic,T. (2006). Radiation binary targeted therapyfor HER-2 positive breast cancers: assumptions, theoretical assessment and futuredirections. Phys. Med. Biol. 51, 1377-1391.
Murti,P.R., Daftary,D.K., Bhonsle,R.B., Gupta,P.C., Mehta,F.S., and Pindborg,J.J.(1986). Malignant potential of oral lichen planus: observations in 722 patients fromIndia. J Oral Pathol 15, 71-77.
Muzio,M., Chinnaiyan,A.M., Kischkel,F.C., O'Rourke,K., Shevchenko,A., Ni,J.,Scaffidi,C., Bretz,J.D., Zhang,M., Gentz,R., Mann,M., Krammer,P.H., Peter,M.E.,and Dixit,V.M. (1996). FLICE, a novel FADD-homologous ICE/CED-3-like protease,is recruited to the CD95 (Fas/APO-1) death--inducing signaling complex. Cell 85,817-827.
Nair,U., Bartsch,H., and Nair,J. (2004). Alert for an epidemic of oral cancer due touse of the betel quid substitutes gutkha and pan masala: a review of agents andcausative mechanisms. Mutagenesis 19, 251-262.
Narayanan,V., Bhattathiri,V.N., Chandralekha,B., Prathapan,R.,Chirayathmanjiyil,D.A., and Nair,K.M. (1998). Prediction of radiosensitivity of oralcancers by serial cytological assay of nuclear changes. Radiotherapy and oncology 49,61-65.
Narcy,P., Contencin,P., and Van Den Abbeele,T. (2005). Aspiration and SwallowingDisorders. In Cummings Otolaryngology Head and Neck Surgery, C.W.Cummings,P.W.Flint, L.A.Harker, B.H.Haughey, M.A.Richardson, D.E.Schuller, K.T.Robbins,and J.R.Thomas, eds. (Philadelphia: Mosby inc), pp. 4290-4295.
Nicholson,R.I., Gee,J.M., and Harper,M.E. (2001). EGFR and cancer prognosis. Eur.J. Cancer. 37, S9-S15.
Nikitakis,N.G., Sauk,J.J., and Papanicolaou,S.I. (2004). The role of apoptosis in oraldiseases: mechanisms; aberrations in neoplastic,autoimmune;infectious; hematologicand developmental diseases; and therapeutic options. Oral Surgery, Oral Medicine,Oral Pathology, Oral Radiology, and Endodontics. 97, 476-490.
Nix,P., Cawkwell,L., Patmore,H., Greenman,J., and Stafford,N. (2005). Bcl-2expression predicts radiotherapy failure in laryngeal cancer. Br. J Cancer 92, 2185-2189.
Nix,P.A., Lind,M., Greenman,J., Stafford,N.D., and Cawkwell,L. (2004). Expressionof Cox-2 protein in radioresistant laryngeal cancer. Ann. Oncol 15, 1444-1445.
Nomura,N., Nagase,T., Miyajima,N., Sazuka,T., Tanaka,A., Sato,S., Seki,N.,Kawarabayasi,Y., Ishikawa,K., and Tabata,S. (1994). Prediction of the codingsequences of unidentified human genes. II. The coding sequences of 40 new genes(KIAA0041-KIAA0080) deduced by analysis of cDNA clones from human cell lineKG-1. DNA Res 1, 223-229.

186
Ogawa,K., Utsunomiya,T., Mimori,K., Tanaka,F., Haraguchi,N., Inoue,H.,Murayama,S., and Mori,M. (2006). Differential gene expression profiles ofradioresistant pancreatic cancer cell lines established by fractionated irradiation. Int. JOncol 28, 705-713.
Ogilvie,P., Bardi,G., Clark-Lewis,I., Baggiolini,M., and Uguccioni,M. (2001).Eotaxin is a natural antagonist for CCR2 and an agonist for CCR5. Blood 97, 1920-1924.
Oliver,R.J., Clarkson,J.E., Conway,D.I., Glenny,A., Macluskey,M., Pavitt,S., andSloan,P. (2007a). Interventions for the treatment of oral cancer: radiotherapy.Cochrane. Database. Syst. Rev.
Oliver,R.J., Clarkson,J.E., Conway,D.I., Glenny,A., Macluskey,M., Pavitt,S., andSloan,P. (2007b). Interventions for the treatment of oral and oropharyngeal cancers:surgical treatment. Cochrane. Database. Syst. Rev.
Oreggia,F., De Stefani,E., Correa,P., Rivero,S., Fernandez,G., and Levia,J. (1989).Occupational exposure in cancer of the mouth, pharynx and larynx. AnalesOtorrinolaringologicos Ibero-Americanos 16, 365-376.
Park,S.H., Lee,S.G., Kim,Y., and Song,K. (1998). Assignment of a human putativeRNA helicase gene, DDX3, to human X chromosome bands p11.3-->p11.23.Cytogenet. Cell Genet. 81, 178-179.
Parkin,D.M., Bray,F., Ferlay,J., and Pisani,P. (2005). Global Cancer Statistics, 2002.CA Cancer J Clin 55, 74-108.
Peter,R.U., Beetz,A., Ried,C., Michel,G., van,B.D., and Ruzicka,T. (1993). Increasedexpression of the epidermal growth factor receptor in human epidermal keratinocytesafter exposure to ionizing radiation. Radiat. Res 136, 65-70.
Peterson,L.F., Boyapati,A., Ranganathan,V., Iwama,A., Tenen,D.G., Tsai,S., andZhang,D.E. (2005). The hematopoietic transcription factor AML1 (RUNX1) isnegatively regulated by the cell cycle protein cyclin D3. Mol. Cell Biol. 25, 10205-10219.
Pinkston,J.A. and Cole,P. (1999). Incidence rates of salivary gland tumors: resultsfrom a population-based study. Otolaryngol Head Neck Surg 120, 834-840.
Pinsolle,J., Demeaux,H., Coustal,B., Siberchicot,F., Caudry,M., Maire,J.P., andMichelet,F.X. (1992). Results of surgical treatment of T3 and T4 tumors of the oralcavity and oropharynx. Am. J Surg 164, 587-591.
Pitman,K.T., Johnson,J.T., Wagner,R.L., and Myers,E.N. (1999). Cancer of thetongue in patients less than forty. Head Neck 22, 297-302.
Prasad,M.L. and Huvos,A.G. (2001). Pathology of head and neck tumours. In Cancerof the head and neck, J.P.Shah, ed. (New York: Harcourt Publishers Limited), pp. 19-56.

187
Purrello,M., Bettuzzi,S., Di,P.C., Mirabile,E., Di,B.M., Rimini,R., Grzeschik,K.H.,Ingletti,C., Corti,A., and Sichel,G. (1991). The gene for SP-40,40, human homolog ofrat sulfated glycoprotein 2, rat clusterin, and rat testosterone-repressed prostatemessage 2, maps to chromosome 8. Genomics 10, 151-156.
Qiagen, g. RNeasy Mini Handbook. fourth. 2006.Ref Type: Pamphlet
Qian,F., Kruse,U., Lichter,P., and Sippel,A.E. (1995). Chromosomal localization ofthe four genes (NFIA, B, C, and X) for the human transcription factor nuclear factor Iby FISH. Genomics 28, 66-73.
Quinones,A., Dobberstein,K.U., and Rainov,N.G. (2003). The egr-1 gene is inducedby DNA-damaging agents and non-genotoxic drugs in both normal and neoplastichuman cells. Life Sci. 72, 2975-2992.
Raybaud-Diogene,H., Fortin,A., Morency,R., Roy,J., Monteil,R.A., and Tetu,B.(1997). Markers of radioresistance in squamous cell carcinomas of the head and neck:A clinicopathological and immunohistochemical study. J Clin Oncol 15, 1030-1038.
Reddy,U.R., Nycum,L., Slavc,I., and Biegel,J.A. (1995). Localization of the humanzipper protein kinase gene (ZPK) to chromosome 12q13 by fluorescence in situhybridization and somatic cell hybrid analysis. Genomics 25, 597-598.
Reed,A.L., Yamazaki,H., Kaufman,J.D., Rubinstein,Y., Murphy,B., and Johnson,A.C.(1998). Molecular cloning and characterization of a transcription regulator withhomology to GC-binding factor. J Biol. Chem. 273, 21594-21602.
Rogers,S.N., Humphris,G., Lowe,D., Brown,J.S., and Vaughan,E.D. (1998). Theimpact of surgery for oral cancer on quality of life as measured by the MedicalOutcomes Short Form 36. Oral Oncol 34, 171-179.
Rosen,E.M., Fan,S., Goldberg,I.D., and Rockwell,S. (2000). Biological basis ofradiation sensitivity. Part 2: Celullar and molecular determinants of radiosensitivity.Oncology (Huntington) 14, 741-757.
Rothman,K.J. (1978). The effect of alcohol consumption on risk of cancer of the headand neck. Laryngoscope 88, 51-55.
Rupnow,B.A. and Knox,S.J. (1999). The role of radiation-induced apoptosis as adeterminant of tumour responses to radiation therapy. Apoptosis 4, 115-143.
Sasik,R., Woelk,C.H., and Corbeil,J. (2004). Microarray truths and consequences.Journal of Molecular Endocrinology 33, 1-9.
Satko,I., Stanko,P., and Longauerova,I. (2000). Salivary gland tumours treated in thestomatological clinics in Bratislava. J Craniomaxillofac. Surg 28, 56-61.
Sawhney,R.S., Sharma,B., Humphrey,L.E., and Brattain,M.G. (2003). Integrin alpha2and extracellular signal-regulated kinase are functionally linked in highly malignantautocrine transforming growth factor-alpha-driven colon cancer cells. J Biol. Chem.278, 19861-19869.

188
Schena,M., Heller,R.A., Theriault,T.P., Konrad,K., Lachenmeier,E., and Davis,R.W.(1998). Microarrays: biotchnology's discovery platfotrm for functional genomics.Trends in Biotechnology 16, 301-306.
Schepman,K.P., van der Meij,E.H., Smeele,L.E., and van,d.W., I (1998). Malignanttransformation of oral leukoplakia: a follow-up study of a hospital-based populationof 166 patients with oral leukoplakia from The Netherlands. Oral Oncol 34, 270-275.
Schildt,E.B., Nylander,K., Eriksson,M., Hardell,L., Magnusson,A., and Roos,G.(2003). Expression of p53,PCNA,Ki-67 and bcl-2 in relation to risk factors in oralcancer - a molecular epidemiological study. Int. J. Oncol. 22, 861-868.
Schlecht,N.F., Franco,E.L., Pintos,J., Negassa,A., Kowalski,L.P., Oliveira,B.V., andCurado,M.P. (1999). Interaction between tobacco and alcohol consumption and therisk of cancers of the upper aero-digestive tract in Brazil. Am. J Epidemiol. 150,1129-1137.
Schoelch,M.L., Le,Q.T., Silverman Jr,S., Mcmillan,A., Dekker,N.P., Fu,K.K.,Ziober,B.L., and Regezi,J.A. (1999). Apoptosis associated proteins and thedevelopment of oral squamous cell carcinoma. Oral Oncology 35, 77-85.
Schwartz,J.L. (1994). The role of constitutive and inducible processes in the responseof human squamous cell carcinoma cell lines to ionizing radiation. RadiationResearch 138, 37-39.
Scorilas,A., Black,M.H., Talieri,M., and Diamandis,E.P. (2000). Genomicorganization, physical mapping, and expression analysis of the human proteinarginine methyltransferase 1 gene. Biochem. Biophys. Res Commun. 278, 349-359.
Sebastiani,G., Durocher,D., Gros,P., Nemer,M., and Malo,D. (1995). Localization ofthe Catf1 transcription factor gene to mouse chromosome 19. Mamm. Genome 6,147-148.
Sessions,D.G., Spector,G.J., Lenox,J., Parriott,S., Haughey,B., Chao,C., Marks,J., andPerez,C. (2000). Analysis of treatment results for floor-of-mouth cancer.Laryngoscope 110, 1764-1772.
Shannan,B., Seifert,M., Leskov,K., Willis,J., Boothman,D., Tilgen,W., andReichrath,J. (2006). Challenge and promise: roles for clusterin in pathogenesis,progression and therapy of cancer. Cell Death. Differ. 13, 12-19.
Shen,J., Beth,T.M., Gammon,M.D., Gaudet,M.M., Teitelbaum,S.L., Eng,S.M.,Sagiv,S.K., Neugut,A.I., and Santella,R.M. (2006). IGHMBP2 Thr671Alapolymorphism might be a modifier for the effects of cigarette smoking and PAH-DNA adducts to breast cancer risk. Breast Cancer Res Treat. 99, 1-7.
Sheng,H., Shao,J., Morrow,J.D., Beauchamp,R.D., and DuBois,R.N. (1998).Modulation of apoptosis and Bcl-2 expression by prostaglandin E2 in human coloncancer cells. Cancer Res 58, 362-366.
Shiboski,C.H., Shiboski,S.C., and Silverman S Jr (2000). Trends in oral cancer ratesin the United States, 1973-1996. Community Dent. Oral Epidemiol. 28, 249-256.

189
Shikama,N., Sasaki,S., Nishikawa,A., Koiwai,K., Yoshino,F., Hirase,Y.,Kawakami,R., Kadoya,M., and Oguchi,M. (2003). Risk factors for local-regionalrecurrence following preoperative radiation therapy and surgery for head and neckcancer (stage 2 - 4B). Radiology 228, 789-794.
Shintani,S., Kiyota,A., Mihara,M., Nakahara,Y., Terakado,N., Ueyama,Y., andMatsumura,T. (2000). Association of preoperative radiation effect with tumourangiogenesis and vascular endothelial growth factor in oral squamous cell carcinoma.Japanese Journal of Cancer Research 91, 1051-1057.
Shintani,S., Mihara,M., Li,C., Nakahara,Y., Hino,S., Nakashiro,K., and Hamakawa,H.(2003). Up-regulation of DNA-dependent protein kinase correlates with radiationresistance in oral squamous cell carcinoma. Cancer science 94, 894-900.
Silverman S Jr, Gorsky,M., and Lozada,F. (1984). Oral leukoplakia and malignanttransformation. A follow-up study of 257 patients. Cancer 53, 563-568.
Silverman,S. and Sheline,G.E. (1961). Effects of radiation on exfoliated normal andmalignant oral cells. A preliminary study. Cancer 14, 587-596.
Simmons,D.L. (1995). The role of ICAM expression in immunity and disease. CancerSurv. 24, 141-155.
Siziopikou,K.P. and Khan,S. (2005). Correlation of HER2 gene amplification withexpression of the apoptosis-suppressing genes bcl-2 and bcl-x-L in ductal carcinomain situ of the breast. Appl. Immunohistochem. Mol. Morphol. 13, 14-18.
Skelly,R.H., Korbonits,M., Grossman,A., Besser,G.M., Monson,J.P., Geddes,J.F., andBurrin,J.M. (2000). Expression of the Pituitary Transcription Factor Ptx-1, But NotThat of the Trans-Activating Factor Prop-1, Is Reduced in Human CorticotrophAdenomas and Is Associated with Decreased {alpha}-Subunit Secretion. J ClinEndocrinol Metab 85, 2537-2542.
Smith,B.D. and Haffty,B.G. (1999). Molecular markers as prognostic factors for localrecurrence and radioresistance in head and neck squamous cell carcinoma. RadiationOncology Investigations 7, 125-144.
Smith,B.D., Smith,G.L., Carter,D., Sasaki,C.T., and Haffty,B.G. (2000). PrognosticSignificance of Vascular Endothelial Growth Factor Protein Levels in Oral andOropharyngeal Squamous Cell Carcinoma. J Clin Oncol 18, 2046-2052.
Snell,R.S. (1992). The Head and Neck. In Clinical Anatomy for Medical Students,(Washington D.C.: Little, Brown and Company), pp. 717-941.
Song,J.I. and Grandis,J.R. (2000). STAT signaling in head and neck cancer.Oncogene 19, 2489-2495.
Spiro,J.D. and Spiro,R.H. (1989). Carcinoma of the tonsillar fossa. An update. Arch.Otolaryngol. Head Neck Surg. 115, 1186-1189.
Spiro,R.H. (1986). Salivary neoplasms: overview of a 35-year experience with 2,807patients. Head Neck Surg 8, 177-184.

190
Spiro,R.H., Koss,L.G., Hajdu,S.I., and Strong,E.W. (1973). Tumors of minor salivaryorigin. A clinicopathologic study of 492 cases. Cancer 31, 117-129.
Stambuk,H.E., Karimi,S., Lee,N., and Patel,S.G. (2007). Oral cavity and oropharynxtumors. Radiol. Clin. North Am. 45, 1-20.
Stephanou,A. and Latchman,D.S. (2003). STAT-1: a novel regulator of apoptosis. Int.J Exp Pathol 84, 239-244.
Storkel,S., Reichert,T., Reiffen,K.A., and Wagner,W. (1993). EGFR and PCNAexpression in oral squamous cell carcinomas- a valuable tool in estimating the patientsprognosis. European journal of cancer Biology Oral Oncology 29B, 273-277.
Stratagene. FairPlay ll Microarrat labeling kit. 2004. California.Ref Type: Pamphlet
Suriano,A.R., Sanford,A.N., Kim,N., Oh,M., Kennedy,S., Henderson,M.J.,Dietzmann,K., and Sullivan,K.E. (2005). GCF2/LRRFIP1 represses tumor necrosisfactor alpha expression. Mol. Cell Biol. 25, 9073-9081.
Sutherland,L.C., Rintala-Maki,N.D., White,R.D., and Morin,C.D. (2005). RNAbinding motif (RBM) proteins: a novel family of apoptosis modulators? J CellBiochem. 94, 5-24.
Tamatani,T., Azuma,M., Ashida,Y., Motegi,K., Takashima,R., Harada,K.,Kawaguchi,S., and Sato,M. (2004). Enhanced radiosensitization in NF-KappaBsuppressed human oral cancer cells via the inhibition of gamma irradiation and 5-FUinduced production of IL-6 and IL-8. Int. J. Cancer. 108, 912-921.
Teni,T., Pawar,S., Sanghvi,V., and Saranath,D. (2002). Expression of bcl-2 and bax inchewing tobacco-induced oral cancers and oral lesions from India. Pathol Oncol Res8, 109-114.
Terakado,N., Shintani,S., Yano,J., Chunnan,L., Mihara,M., Nakashiro,K., andHamakawa,H. (2004). Overexpression of cyclooxygenase-2 is associated withradioresistance in oral squamous cell carcinoma. Oral Oncology 40, 383-389.
Theriault,J.R., Charette,S.J., Lambert,H., and Landry,J. (1999). Cloning andcharacterization of hGMEB1, a novel glucocorticoid modulatory element bindingprotein. FEBS Lett. 452, 170-176.
Thiagalingam,A., De,B.A., Borges,M., Jasti,R., Compton,D., Diamond,L., Mabry,M.,Ball,D.W., Baylin,S.B., and Nelkin,B.D. (1996). RREB-1, a novel zinc finger protein,is involved in the differentiation response to Ras in human medullary thyroidcarcinomas. Mol. Cell Biol. 16, 5335-5345.
Thiagalingam,A., Lengauer,C., Baylin,S.B., and Nelkin,B.D. (1997). RREB1, a rasresponsive element binding protein, maps to human chromosome 6p25. Genomics 45,630-632.
Thomadaki,H. and Scorilas,A. (2006). BCL2 family of apoptosis-related genes:functions and clinical implications in cancer. Crit Rev. Clin. Lab Sci. 43, 1-67.

191
Thompson,C.B. (1995). Apoptosis in the pathogenesis and treatment of disease.Science 267, 1456-1462.
Tilstone,C. and Aldhous,P. (2003). Vital statistics. Nature 424, 610-612.
Timmer,T., Terpstra,P., van den,B.A., Veldhuis,P.M., Ter,E.A., Voutsinas,G.,Hulsbeek,M.M., Draaijers,T.G., Looman,M.W., Kok,K., Naylor,S.L., and Buys,C.H.(1999). A comparison of genomic structures and expression patterns of two closelyrelated flanking genes in a critical lung cancer region at 3p21.3. Eur. J Hum. Genet. 7,478-486.
Tissier,F., Louvel,A., Grabar,S., Hagnere,A.M., Bertherat,J., Vacher-Lavenu,M.C.,Dousset,B., Chapuis,Y., Bertagna,X., and Gicquel,C. (2004). Cyclin E correlates withmalignancy and adverse prognosis in adrenocortical tumors. Eur. J Endocrinol. 150,809-817.
Toi,M., Matsumoto,T., and Bando,H. (2001). Vascular endothelial growth factor: itsprognostic, predictive, and therapeutic implications. The Lancet Oncology 2, 667-673.
Tremblay,J.J., Goodyer,C.G., and Drouin,J. (2000). Transcriptional properties of Ptx1and Ptx2 isoforms. Neuroendocrinology 71, 277-286.
Tricoli,J.V., Nakai,H., Byers,M.G., Rall,L.B., Bell,G.I., and Shows,T.B. (1986). Thegene for human transforming growth factor alpha is on the short arm of chromosome2. Cytogenet. Cell Genet. 42, 94-98.
Tsoporis,J.N., Marks,A., Van Eldik,L.J., O'Hanlon,D., and Parker,T.G. (2003).Regulation of the S100B gene by alpha 1-adrenergic stimulation in cardiac myocytes.Am J Physiol Heart Circ. Physiol 284, H193-H203.
Tsuda,H., Bandera,C.A., Birrer,M.J., Hashiguchi,Y., Berkowitz,R.S., and Mok,S.C.(2004). Cyclin E amplification and overexpression in clear cell adenocarcinoma of theovary. Oncology 67, 291-299.
Tsuruma,K., Nakagawa,T., Morimoto,N., Minami,M., Hara,H., Uehara,T., andNomura,Y. (2006). Glucocorticoid modulatory element-binding protein 1 binds toinitiator procaspases and inhibits ischemia-induced apoptosis and neuronal injury. JBiol. Chem. 281, 11397-11404.
Tsuruma,K., Nakagawa,T., Shirakura,H., Hayashi,N., Uehara,T., and Nomura,Y.(2004). Regulation of procaspase-2 by glucocorticoid modulatory element-bindingprotein 1 through the interaction with caspase recruitment domain. Biochem. Biophys.Res Commun. 325, 1246-1251.
Uno,M., Otsuki,T., Kurebayashi,J., Sakaguchi,H., Isozaki,Y., Ueki,A., Yata,K.,Fujii,T., Hiratsuka,J., Akisada,T., Harada,T., and Imajo,Y. (2001). Anti-HER2-antibody enhances irradiation-induced growth inhibition in head and neck carcinoma.Int. J Cancer 94, 474-479.
Valdez,B.C., Perlaky,L., Saijo,Y., Henning,D., Zhu,C., Busch,R.K., Zhang,W.W., andBusch,H. (1992). A region of antisense RNA from human p120 cDNA with high

192
homology to mouse p120 cDNA inhibits NIH 3T3 proliferation. Cancer Res 52, 5681-5686.
Varley,J. (2001). A vast array of possibilities. Scientific Yearbook 14-16.
Vaux,D.L., Cory,S., and Adams,J.M. (1988). Bcl-2 gene promotes haemopoietic cellsurvival and cooperates with c-myc to immortalize pre-B cells. Nature 335, 440-442.
Vikram,B., Strong,E.W., Shah,J.P., and Spiro,R. (1984). Failure in the neck followingmultimodality treatment for advanced head and neck cancer. Head Neck Surg 6, 724-729.
Vora,H.H., Shah,N.G., Patel,D.D., Trivedi,T.I., and Chikhlikar,P.R. (2003).Prognostic significance of biomarkers in squamous cell carcinoma of the tongue:multivariate analysis. J Surg Oncol 82, 34-50.
Waldron,C.A., el-Mofty,S.K., and Gnepp,D.R. (1988). Tumors of the intraoral minorsalivary glands: a demographic and histologic study of 426 cases. Oral Surg OralMed. Oral Pathol 66, 323-333.
Warner,G.C., Reis,P.P., Jurisica,I., Sultan,M., Arora,S., Macmillan,C., Makitie,A.A.,Grenman,R., Reid,N., Sukhai,M., Freeman,J., Gullane,P., Irish,J., and Kamel-Reid,S.(2004). Molecular classification of oral cancer by cDNA microarrays identifiesoverexpressed genes correlated with nodal metastasis. Int. J Cancer 110, 857-868.
Watanabe,T.K., Saito,A., Suzuki,M., Fujiwara,T., Takahashi,E., Slaughter,C.A.,DeMartino,G.N., Hendil,K.B., Chung,C.H., Tanahashi,N., and Tanaka,K. (1998).cDNA cloning and characterization of a human proteasomal modulator subunit, p27(PSMD9). Genomics 50, 241-250.
Watkinson,J.C., Gaze,M.N., and Wilson,J.A. (2004). Tumours of the lip and oralcavity. In Stell and Maran's Head and Neck Surgery, (London: Reed Educational andProfessional Publishing), pp. 275-319.
Werneburg,N.W., Yoon,J.H., Higuchi,H., and Gores,G.J. (2003). Bile acids activateEGF receptor via a TGF-alpha-dependent mechanism in human cholangiocyte celllines. Am. J Physiol Gastrointest. Liver Physiol 285, G31-G36.
Weterman,M.A., Wilbrink,M., and Geurts van,K.A. (1996). Fusion of thetranscription factor TFE3 gene to a novel gene, PRCC, in t(X;1)(p11;q21)-positivepapillary renal cell carcinomas. Proc. Natl. Acad Sci U. S. A 93, 15294-15298.
Wilks,A.F. (1993). Protein tyrosine kinase growth factor receptors and their ligands indevelopment, differentiation, and cancer. Adv. Cancer Res 60, 43-73.
Woolgar,J.A., Rogers,S., West,C.R., Errington,R.D., Brown,J.S., and Vaughan,E.D.(1999). Survival and patterns of recurrence in 200 oral cancer patients treated byradical surgery and neck dissection. Oral Oncol 35, 257-265.
Wunsch-Filho,V. (2002). The epidemiology of oral and pharynx cancer in Brazil.Oral Oncology 38, 737-746.

193
Xie,X., Clausen,O.P., and Boysen,M. (2003). Prognostic value of Bak expression inoral tongue squamous cell carcinomas. Oncol Rep 10, 369-374.
Xie,X., Clausen,O.P., De,A.P., and Boysen,M. (1999). The prognostic value ofspontaneous apoptosis, Bax, Bcl-2, and p53 in oral squamous cell carcinoma of thetongue. Cancer 86, 913-920.
Yamanaka,K., Gleave,M., Muramaki,M., Hara,I., and Miyake,H. (2005). Enhancedradiosensitivity by inhibition of the anti-apoptotic gene clusterin using antisenseoligodeoxynucleotide in a human bladder cancer model. Oncol Rep 13, 885-890.
Yamazaki,Y., Chiba,I., Hirai,A., Notani,K., Kashiwazaki,H., Tei,K., Totsuka,Y.,Iizuka,T., Kohgo,T., and Fukuda,H. (2003). Radioresistance in oral squamous cellcarcinoma with p53 DNA contact mutation. American Journal of Clinical Oncology.26, 124-129.
Yang,W., Klos,K., Yang,Y., Smith,T.L., Shi,D., and Yu,D. (2002). ErbB2overexpression correlates with increased expression of vascular endothelial growthfactors A, C, and D in human breast carcinoma. Cancer 94, 2855-2861.
Yarden,Y. (2001). The EGFR family and its ligands in human cancer: signallingmechanisms and therapeutic opportunities. Eur. J. Cancer. 37, S3-S8.
Yasunami,M., Suzuki,K., and Ohkubo,H. (1996). A novel family of TEA domain-containing transcription factors with distinct spatiotemporal expression patterns.Biochem. Biophys. Res Commun. 228, 365-370.
Yih,W.Y., Kratochvil,F.J., and Stewart,J.C. (2005). Intraoral minor salivary glandneoplasms: review of 213 cases. J Oral Maxillofac. Surg 63, 805-810.
Yousef,G.M., Borgono,C.A., Popalis,C., Yacoub,G.M., Polymeris,M.E.,Soosaipillai,A., and Diamandis,E.P. (2004a). In-silico analysis of kallikrein geneexpression in pancreatic and colon cancers. Anticancer Res 24, 43-51.
Yousef,G.M., Polymeris,M.E., Yacoub,G.M., Scorilas,A., Soosaipillai,A., Popalis,C.,Fracchioli,S., Katsaros,D., and Diamandis,E.P. (2003). Parallel overexpression ofseven kallikrein genes in ovarian cancer. Cancer Res 63, 2223-2227.
Yousef,G.M., Yacoub,G.M., Polymeris,M.E., Popalis,C., Soosaipillai,A., andDiamandis,E.P. (2004b). Kallikrein gene downregulation in breast cancer. Br. JCancer 90, 167-172.
Yu,L., Alva,A., Su,H., Dutt,P., Freundt,E., Welsh,S., Baehrecke,E.H., andLenardo,M.J. (2004a). Regulation of an ATG7-beclin 1 program of autophagic celldeath by caspase-8. Science 304, 1500-1502.
Yu,L., Lenardo,M.J., and Baehrecke,E.H. (2004b). Autophagy and caspases: a newcell death program. Cell Cycle 3, 1124-1126.
Yue,H. and Jiang,H.Y. (2005). Expression of cell cycle regulator p57kip2, cyclinEprotein and proliferating cell nuclear antigen in human pancreatic cancer: animmunohistochemical study. World J Gastroenterol. 11, 5057-5060.

194
Zakrzewska,J.M. (1999). Fortnightly review: Oral cancer. BMJ 318, 1051-1054.
Zelefsky,M.J., Harrison,L.B., and Armstrong,J.G. (1992). Long-term treatment resultsof postoperative therapy for advanced stage oropharyngeal carcinoma. Cancer 70,2388-2395.
Zellweger,T., Chi,K., Miyake,H., Adomat,H., Kiyama,S., Skov,K., and Gleave,M.E.(2002). Enhanced radiation sensitivity in prostate cancer by inhibition of the cellsurvival protein clusterin. Clin. Cancer Res 8, 3276-3284.
Zhang,H., Kim,J.K., Edwards,C.A., Xu,Z., Taichman,R., and Wang,C.Y. (2005).Clusterin inhibits apoptosis by interacting with activated Bax. Nat. Cell Biol. 7, 909-915.
Zhao,H. and Xu,Y.H. (1999). Mad-overexpression down regulates the malignantgrowth and p53 mediated apoptosis in human hepatocellular carcinoma BEL-7404cells. Cell Res 9, 51-59.
Zolzer,F., Alberti,W., Pelzer,T., Lamberti,G., Hulskamp,F.H., and Streffer,C. (1995).Changes in S-phase fraction and micronucleus frequency as prognostic factors inradiotherapy of cervical carcinoma. Radiotherapy and oncology 36, 128-132.
Zucali,P.A. and Giaccone,G. (2006). Biology and management of malignant pleuralmesothelioma. Eur. J Cancer 42, 2706-2714.