radionuclide and radioactivity monitoring on - clark university
TRANSCRIPT

RADIONUCLIDE AND RADIOACTIVITY MONITORING ON YOMBA SHOSHONE TRIBAL LAND, AGRICULTURAL AND RANCHING SETTLEMENTS,
AND TRADITIONAL USE AREAS IN NEVADA
YOMBA SHOSHONE TRIBE HC 61 BOX 6275
AUSTIN, NV 89310
Prepared by: Dr. Bonnie Eberhardt Bobb PO Box 223 Austin, NV 89310 [email protected] Supported by a grant from the Citizens’ Monitoring and Technical Assessment Fund
2
RADIONUCLIDE AND RADIOACTIVITY MONITORING ON YOMBA SHOSHONE TRIBAL LAND, AGRICULTURAL AND RANCHING SETTLEMENTS,
AND TRADITIONAL USE AREAS IN NEVADA
INTRODUCTION The Citizen’s Monitoring and Technical Assistance Fund, or MTA Fund, was established as the result of a 1998 court settlement between DOE and 39 non-profit peace and environmental groups. The fund oversees $6.25 million which was set aside “to provide monies to eligible organizations to procure technical and scientific assistance to perform technical and scientific review and analyses of environmental management activities at DOE sites” and disseminate the results of these studies. Because this funding was available to non-profit, non-governmental organizations and tribes to conduct independent research, raise the consciousness of communities in the area, and to promote environmental justice, the Yomba Shoshone Tribe, a federally recognized tribe, applied for and was awarded funding (www.mtafund.org). The Yomba Shoshone Tribe The Yomba Shoshone Tribe (HC 61 Box 6275, Austin, NV 89310) is a federally recognized Western Shoshone tribe located in an extremely isolated area within the Toiyabe National Forest of central Nevada, approximately 150 miles north west of the Nevada Test Site. Tribal families have, thus, experienced the impacts of years of above- and below-ground nuclear weapons testing.
Because the Yomba Shoshone maintain many of the cultural lifeways of their hunter-gatherer heritage, they may be more exposed to both external and internal doses of radiation. The Yomba Shoshone hunt and eat wild game, gather plants for medicine, baskets, and implements. At least one family of a deceased person has received compensation for radiation exposure-related death.
The objectives of this study were: 1) to perform soils analyses of traditionally used lands to determine if radioactive contamination is present; 2) to conduct interviews with elders who may have relevant knowledge of contaminant pathways in the soil, air, plants, and wildlife during the nuclear era; 3) to gather, review and analyze available scientific reports, evaluations, special studies and projected contamination patterns and models of NTS contamination; 4) to collaborate with the Tupippuh Project (Timbisha Shoshone) of Death Valley California on the monitoring initiative by sharing information and equipment; 5) to develop a final report for the project, which will include the results of the archival research, elder interview summaries (with confidentiality restrictions), soil contamination survey results and analyses; and 6) to disseminate the results of this report

3
to tribal members, tribal governments and organizations, and public and private organizations with a vested interest in this region or this subject matter.
HISTORY OF THE WESTERN SHOSHONE
For thousands of years, the Western Shoshone lived a nomadic hunter-gatherer lifestyle in the Great Basin desert, traveling between present day Idaho, California, Nevada, and Utah, hunting wild game and harvesting the pine nut of the pinyon tree, a dietary staple, as well as other plant foods and medicines (Clemmer, 1972). After 1850 more and more Anglos appeared on Western Shoshone traditional lands, passing through on their way to California where gold had been discovered. With them came small pox, tuberculosis, and other diseases which ravaged the Western Shoshone. The settlers destroyed many of the traditional hunting areas, and frequent hostilities arose.
Because the US was in the midst of the Civil War and needed gold from the west,
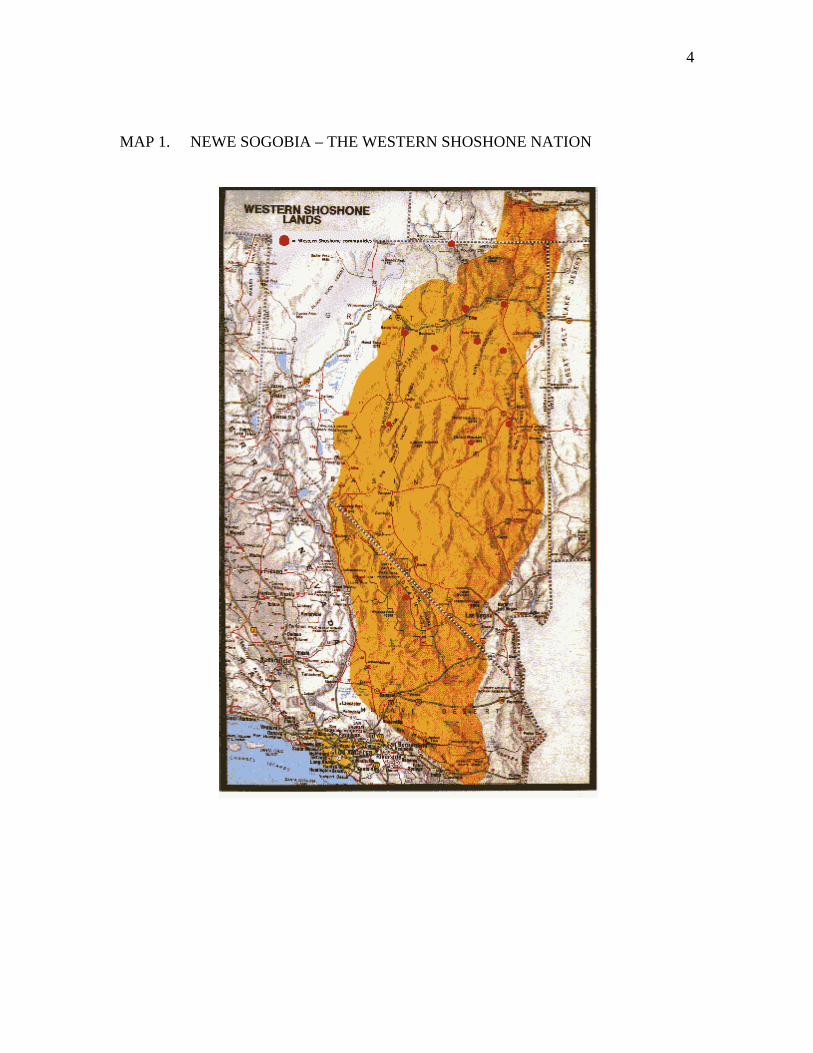
the cost in money and manpower to defend against the Shoshone attacks was expensive. Therefore in 1863 the United States negotiated a Peace and Friendship treaty with the Western Shoshone, guaranteeing safe passage of whites with their trains and wagons and the allowance of a fort and settlements to be developed around small gold and silver mines. The treaty was unique in that it ceded no land, but only permitted safe passage through the land. The treaty clearly delineated the boundaries of the Western Shoshone Nation. The boundaries of Newe Sogobia (the Western Shoshone Nation) extend throughout most of eastern Nevada, parts of Idaho, Utah, and into California to the Mojave Desert (See Map 1).
By the turn of the century much of the Western Shoshone land was devastated by the large number of settlers. Pinyon forests were cut down for use in mining and smelting operations. Wild life was destroyed by hunters and trappers. Round-ups and forced marches killed many of the young and elderly. The treaty, still in effect, was ignored by the US government and its citizens. To this day the U.S. government, despite frequent court challenges, has never been able to find specific documentation on how they gained control of the land, how they overturned a ratified treaty without the consent or knowledge of the people.
Starving, some Western Shoshone had moved near ranching and mining
settlements to work for Anglos. Taking advantage of this situation, the US began to assert more control over Western Shoshone families. In the late 1920’s and 1930’s, using the Indian Reorganization Act, the federal government urged the formation of tribal governments on what they deemed as land held in federal trust. Although no reservations were ever established in Nevada as provided by the Ruby Valley Treaty of 1863, small parcels claimed illegally by the US government as “trust lands,” came to be commonly referred to as reservations. This was done without the consent of the Western Shoshone Nation’s traditional government (Bobb, 1999).
4
MAP 1. NEWE SOGOBIA – THE WESTERN SHOSHONE NATION
5
Traditional and Tribal Governments A distinction needs to be made between tribal governments and traditional governments. Tribal governments were authorized by the federal government under the Indian Reorganization Act of 1934. The power of the tribal government extends only to lands claimed to be held in trust by the U.S. government for that particular group of Indians. Tribal Councils were assisted in writing Constitutions, and enacted their own laws, subject to approval by the U.S. Secretary of the Interior, their “trustee.” There are several so-called Western Shoshone “reservations” located within the 1863 treaty boundaries: Wells, Battle Mountain, Elko, Yomba, Duckwater, Ely, and the Timbisha Homelands. The land base of the trust lands takes up less than 1% of the total Western Shoshone Nation treaty land. The traditional government of the Western Shoshone Nation has existed for thousands of years. In its present form, the governing body is known as the Western Shoshone National Council, made up of representatives of traditional communities. The traditional government’s area of influence is approximately 60,000,000 to 70,000,000 acres of land, with the exception of trust lands having their own tribal jurisdiction (Clemmer, 1972). Maintaining a Subsistence Life Style In the past, Western Shoshone lived in a synchronistic relationship with nature, harvesting and hunting at appropriate times throughout the year. In their migratory patterns, they established temporary camps in summer and returned to winter homes. currently the Bureau of Land Management and the U.S. Forest Service claim most of Nevada as public land. A majority of this public land is then fenced off and used by gold and silver mines and by the U.S. Department of Energy and Department of Defense, making it inaccessible. Despite being restricted from parts of their own treaty land, many Western Shoshone have never abandoned their traditional lifeways. They gather pine nuts, wild foods and medicines, and hunt game. Willow is used to create baskets, cradleboards, and tools which are still used (Clemmer, 1972). Native spiritual and healing ceremonies are common, and a variety of medicinal plants are gathered for use (Bobb, 1999). According to a 1999 examination of Western Shoshone acculturative resistance (Bobb, 1999), Western Shoshone appear to have retained the heritage of a hunter-gatherer society. Approximately 64.7% of Western Shoshone fish for trout, 49% hunt jackrabbit, 47.1% hunt deer, and 47.1% hunt cottontail. Other native wild foods include sage hen, squirrel, antelope, groundhog, chuckawalla, chukar, crawdads, carp, whitefish, coot, and chub. For comparison, while 70.59% of Western Shoshone hunt or fish, of this number, 52.78% are men and 47.22% are women. Of the total United States population, age 16 and older, approximately14% of men and 1% of women hunt or fish. Of this number,
6
92% are men and 8% are women. In rural areas of the West, only 10% of residents hunt and fish (Department of Commerce, Bureau of Census, 1991). Similarly, there is a preference for native foods when it is available. Pine nuts are consumed by 86.3% of Western Shoshone. Deer are eaten by 76.5%, trout by 64.7%, cottontail by 56.9%, and sage hen by 49.0% (Bobb, 1999). Undomesticated native plants continue to be gathered for food, medicine, and art. Western Shoshone still gather pine nuts (84.3% ), Indian tea (64.7%), wild onions (49.0%), choke cherries (43.1%), willows (43.1%), and sage brush (39.2%). Other wild plants used include buckberry, doza, pine pitch, juniper, rabbit brush, yomba, tule, greasewood, willow, Indian tobacco, and bishop (Bobb, 1999). Approximately 25%-35% of Western Shoshone engage in traditional arts. In the study, 35.3% of Western Shoshone know how to make blankets, drums, and other items from hides, 25.5% know how to tan hides, 29.4 know how to do basketry, 29.4% weave willow baskets or cradle boards (Bobb, 1999).
The Yomba Shoshone are still known for their fine basketry which was used for carrying and boiling water, trapping birds, and carrying food. The baskets are still used for harvesting pine nuts and, for cradle boards, and for many other uses. tested for the presence of radionuclides.
Yomba Shoshone Tribe
The Yomba Shoshone Tribe is located in the Reese River Valley in an isolated area of the Toiyabe National Forest in an area originally known as Mahaquaduka bahunovi. On the west side of the valley are the Shoshone Mountains and on the east are the Toiyabe Mountains with one of the highest peaks over 9,000 feet. Recharge from snowfall in the mountains sends water to the river Reese River, the southern most basin of the Humboldt River which runs north.
Shoshone camped here because the high mountains provided a variety of native
food sources, including pine nuts, fish, rabbit, antelope, deer, plants, and a wild carrot the Shoshone called Yomba. The coming of non-Indians for ranching and mining decreased the number of Shoshone as well as the pinyon forests and wild game populations. However, even after the Yomba Shoshone Tribe was established in 1939, Shoshone continued to harvest pine nuts and hunt for game where ever the resources were available. Willow basketry, bead work, skin-sewing and tanning continued. Medicine men using native medicine were summoned in times of illness. These activities continue today (Rusco, 1991).
Following John Collier’s appointment as Commissioner of Indian Affairs in 1933,
the Indian Reorganization Act of 1934 was passed by Congress. Collier believed the establishment of reservations with Tribal Constitutions and governments would preserve

7
Indian cultures (Rusco, 1991). The first residents of Yomba were born in Big Smoky Valley, Austin, Monitor Valley, Potts, Belmont, Bull Spring, Ione, Warm Spring, and Tonopah , but many had lived at Walker River for several years (National Archives, Laguna Niguel, Social and Economic Information for the Yomba Reservation, 1939).
Four hay meadow ranches were purchased under Section 5 of the Indian
Reorganization Act to create the Yomba Shoshone Tribal lands. The 4,681 total acres included 1,216 irrigable acres (Tonopah Archives). Grazing rights were secured on US Forest Service and BLM land. Although the Bureau of Indian Affairs encouraged the Yomba Shoshone to become more self-sufficient by growing their own food and by keeping farm animals, the altitude, between 6,320 and 6,880 feet, and the resulting short growing season (62-90 days) made that difficult. Frost could be as late as the first week of July and as early as the first week of September. Therefore the Tribe concentrated on root vegetables, wild hay, barley, and wheat (National Archives, San Bruno, Box 163, Folder Miscellaneous, Yomba Shoshone Reservation, March 24, 1942). The tribe owned a total of 1,421 head of cattle, 21 dairy cows, and 140 horses (Tonopah Archives folders, Yomba Shoshone Tribe).
Sixteen families owned cows, 13 owned milk cows, 16 owned horses, 12 owned
pigs, 10 owned turkeys, 14 owned chickens, 7 owned water fowl. Residents lived in concrete block houses with outside toilets until the 1970’s when HUD housing was built. Only 4 families had wells and 1 had spring water. Only the Agency building had electricity and a well that supplied some other houses (National Archives, San Bruno, Box 163, Folder Miscellaneous, Yomba Shoshone Reservation, March 24, 1942).. Tonopah was about 90 miles southeast and Austin was about 50 miles north, both over dirt roads.
HISTORY OF THE NEVADA TEST SITE
Site Selection
Shortly after the end of World War II, a joint task force of Army and Navy personnel chose the Marshall Islands, which had been granted as a U.S. trust territory, as the site for several nuclear tests. Native residents of the Bikini Atoll were removed to Rongerik, an island about 130 miles away. Operation Crossroads was to consist of three explosions, Able, Baker, and Charlie. Able was exploded on June 30, 1946. But, the second test, Baker, exploded July 24, 1946, resulted in massive contamination. As a result, the third test, Charlie, was cancelled (Cheney, 1996).
The Atomic Energy Commission (AEC) was established on August 1, 1946 by President Harry Truman to supervise the development and civilian and military use of atomic energy, including nuclear reactors and nuclear weapons production and testing. The AEC mandate was to safeguard the health and safety of the public by regulation of nuclear products (Fradkin, 2004).
8
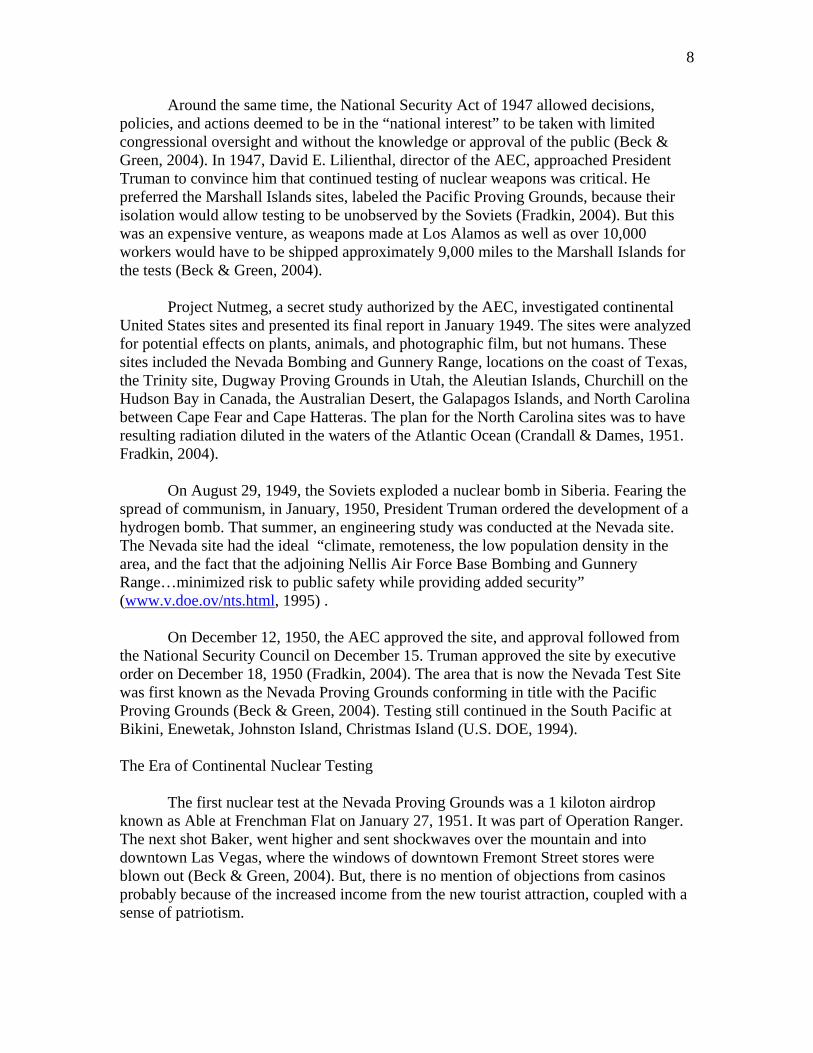
Around the same time, the National Security Act of 1947 allowed decisions, policies, and actions deemed to be in the “national interest” to be taken with limited congressional oversight and without the knowledge or approval of the public (Beck & Green, 2004). In 1947, David E. Lilienthal, director of the AEC, approached President Truman to convince him that continued testing of nuclear weapons was critical. He preferred the Marshall Islands sites, labeled the Pacific Proving Grounds, because their isolation would allow testing to be unobserved by the Soviets (Fradkin, 2004). But this was an expensive venture, as weapons made at Los Alamos as well as over 10,000 workers would have to be shipped approximately 9,000 miles to the Marshall Islands for the tests (Beck & Green, 2004).
Project Nutmeg, a secret study authorized by the AEC, investigated continental United States sites and presented its final report in January 1949. The sites were analyzed for potential effects on plants, animals, and photographic film, but not humans. These sites included the Nevada Bombing and Gunnery Range, locations on the coast of Texas, the Trinity site, Dugway Proving Grounds in Utah, the Aleutian Islands, Churchill on the Hudson Bay in Canada, the Australian Desert, the Galapagos Islands, and North Carolina between Cape Fear and Cape Hatteras. The plan for the North Carolina sites was to have resulting radiation diluted in the waters of the Atlantic Ocean (Crandall & Dames, 1951. Fradkin, 2004).
On August 29, 1949, the Soviets exploded a nuclear bomb in Siberia. Fearing the spread of communism, in January, 1950, President Truman ordered the development of a hydrogen bomb. That summer, an engineering study was conducted at the Nevada site. The Nevada site had the ideal “climate, remoteness, the low population density in the area, and the fact that the adjoining Nellis Air Force Base Bombing and Gunnery Range…minimized risk to public safety while providing added security” (www.v.doe.ov/nts.html, 1995) .
On December 12, 1950, the AEC approved the site, and approval followed from
the National Security Council on December 15. Truman approved the site by executive order on December 18, 1950 (Fradkin, 2004). The area that is now the Nevada Test Site was first known as the Nevada Proving Grounds conforming in title with the Pacific Proving Grounds (Beck & Green, 2004). Testing still continued in the South Pacific at Bikini, Enewetak, Johnston Island, Christmas Island (U.S. DOE, 1994). The Era of Continental Nuclear Testing
The first nuclear test at the Nevada Proving Grounds was a 1 kiloton airdrop known as Able at Frenchman Flat on January 27, 1951. It was part of Operation Ranger. The next shot Baker, went higher and sent shockwaves over the mountain and into downtown Las Vegas, where the windows of downtown Fremont Street stores were blown out (Beck & Green, 2004). But, there is no mention of objections from casinos probably because of the increased income from the new tourist attraction, coupled with a sense of patriotism.

9
Bleachers were set up north of Mercury, overlooking Frenchman Flat for technicians from Los Alamos, the Air Force and private contractors like EG&G, REECo, and General Electric to observe the tests. Because of the broken windows and dust and dirt, most tests were moved to Yucca Flat. Yucca Flat was used by Los Alamos Scientific Lab and the Lawrence Radiation Lab, and was divided into 11 areas for different types of testing. A dry lake bed at the south runs level to the foothills, and shock waves were absorbed by the surrounding mountains (Beck & Green, 2004).
As part of the testing at Yucca Flat and Frenchman Flat, a maximum of 6,000 army personnel at a time were brought to Camp Desert Rock, south of Mercury. The camp was mostly tents, but cement structures were later built. Only the slabs remain today. “The Atomic Energy Commission was reluctant to let the military engage in the tests in the first place. This has been documented. The military more or less said they wouldn’t participate unless they could put the troops in relatively close ranges, much closer than the AEC recognized to be safe” (Lerager, 1988). Some of these soldiers would later form a group know as the “Nuclear Atomic Veterans.” News media were invited to Yucca Flat in 1952 and one test was televised. The area became known as News Nob (Beck & Green, 2004).
Above-ground testing continued from January 27, 1951 through October 31, 1958, when a moratorium went into effect. When the Soviet Union resumed testing in September, 1961, the U.S. also returned to testing on September 15, 1961. The last atmospheric test at the NTS was Little Fellar I on July 17, 1962 (U.S. DOE, 2000).
On August 5, 1963, the U.S. and the Soviet Union signed the Limited Test Ban Treaty, prohibiting atmospheric, ocean, and space tests. On October 2, 1992, the U.S. began another moratorium which lasted until August 11, 1995 when President Clinton made a decision to negotiate a comprehensive nuclear test ban. On September 24, 1996, the Comprehensive Nuclear Test Ban Treaty was signed, “prohibiting any nuclear weapon test explosion” by any State party. The AEC was discontinued on October 11, 1974, and replaced by 2 agencies: ERDA (Energy Research and Development Administration) and NRC. When the DOE was created in 1977, it absorbed the functions of ERDA (U.S. DOE, 2000). . The U.S. has tested a total of 1,054 nuclear tests in several locations with 1,149 detonations. A total of 928 nuclear tests have taken place at the Nevada Test Site. Of these tests, 100 were atmospheric tests (U.S. DOE, 2000). These figures do not include ongoing sub-critical tests. Despite the number of nuclear tests with accompanying fallout and the statistics enumerated above showing that Western Shoshone have never given up a foraging subsistence existence, there have been few studies of off-site soil contamination and no studies of residual fallout on Western Shoshone land or on the vegetation used by them. No studies could be found that studied the effects of radionuclides on traditional foods like pine nuts or berries. There have been no studies of health effects, nor any base line studies of overall health in the area – either of Western Shoshone or any other population.

10
RADIATION MONITORING AT NTS HISTORY OF MONITORING AT NTS
From 1951 until January, 1975, the AEC managed the activities at the NTS. In 1975, the U.S. Energy Research and Development Administration took over for two years, until they merged with other agencies to become the Department of Energy (DOE). An off-site monitoring program managed by Los Alamos Scientific Laboratory and the U.S. Army, was replaced in 1954 by the U.S. Public Health Service’s Offsite Radiological Environmental Monitoring Program (OREMP). Following its creation in December, 1970, the U.S. Environmental Protection Agency (EPA) took over administration of the OREMP through its Environmental Monitoring Systems Laboratory in Las Vegas (Douglas, 1983). Since 1995, the EPA has operated the OREMP through its Office of Radiation and Indoor Air, Radiation and Indoor Environments National Laboratory in Las Vegas. The objectives of this scaled-down program were to assure public health and safety of residents living near the NTS, measure environmental levels of radiation in prior testing areas, maintain readiness to resume testing, obtain data to verify regulatory compliance (Davis et al., 1999).
Due to decreased funding and reported lack of findings beyond background, off-
site garden and other soil sampling, and on- and off-site wildlife sampling were cut in 1995. Routine assessments using pressurized ion chambers, thermoluminescent dosimeters for air, water, and milk sampling, and long-term monitoring wells remained. Results from 1997 monitoring reportedly showed no radiation directly attributable to current activities (Davis et al., 1999).
The offsite thermoluminescent dosimetry network of 39 fixed monitors and 18
offsite personnel was established to measure changes in ambient gamma radiation and alleviate the fears of the public. Annual exposures were calculated by dividing each quarterly rate by the number of days deployed to obtain a daily rate, then multiplying by 365.25. Annual exposure rate in 1997 ranged from 61 mR/ year at Pahrump, NV to 161 mR/year at Blue Jay, NV with a mean of 99 mR/year. Areas closest to Yomba Shoshone traditional areas were Tonopah, NV with 120 mR/yr, Tonopah Test Range with 125 mR/yr, Goldfield, NV with 95 mR/yr. The personnel readings ranged from 74 mR/yr at Indian Springs, NV to Beatty with 147 mR/yr with a mean of 96 mR/yr. The personnel closest to Yomba Shoshone traditional areas were both at Tonopah, at 116 mR/yr and 120 mR/yr (Davis et al., 1999).
The network of 15 pressurized ion chambers in Nevada and Utah measure low-
dose exposures of gamma radiation. Annual exposures ranged from 71 mR/yr to 155 mR/yr. The report concluded that these exposures are within background levels based on the BEIR report determination of background to vary between 49 mR/yr and 247 mR/yr. [Areas closest to the Tupippah Project parcels were Beatty, NV with 143 mR/yr, Amargosa Center, NV with 97 mR/yr, Furnace Creek, CA with 86 mR/yr, Goldfield with 135 mR/yr, Tonopah, NV with 154 mR/yr.] [Areas closest to Yomba Shoshone

11
traditional areas were Tonopah, NV with 154 mR/yr, and Goldfield, NV with 135 mR/yr.] (Davis et al., 1999).
The Air Surveillance Network consists of 20 continuously monitoring sampling stations, six of which are high volume air samplers within 220 miles of the NTS. The quantity of gamma was reported as mostly negligible, with average annual activity of 1.5 x 10⁻¹³ μC/mL, slightly less than on-site. Gross beta exceeded the minimum detectable concentration, averaging 1.5 +/- 2.2 x 10⁻⁴ Bq/m3 somewhat lower than on-site. Gross alpha average was 2.0 x 10⁻¹⁵ μC/mL, slightly higher than on-site. Plutonium was detected at about ¼ the on-site rate (Davis et al., 1999).
The Milk Surveillance Network included commercial dairies and family farm cows and goats within 186 miles of the NTS. Samples were analyzed for Strontium. Only one dairy in Moapa had a result above the minimum detectable concentration (Davis et al., 1999). ANIMAL STUDIES
In 1964 a 36-acre farm was built in Area 15 to test the effects of radiation on crops and animals by examining plants and soils. Crops were planted and a dairy built with open paddocks, shaded stalls and a milking barn. Thirty Holstein cows, 100 Hereford beef cattle, horses, pigs, goats, and chickens were raised. The farm closed in 1981. All radiation was reported to be within acceptable levels and there were no effects of exposure (NTS News and Views, 1993).
Studies (Smith & Andrews, 1981; Smith, Giles, & Bernhardt, 1981) measured
levels of strontium-90 and cesium-137 in cattle, deer, and bighorn sheep living around and near the NTS since 1956. and found tissue concentrations were from global fallout rather than from testing. One deer was found with 2,900 pCi/kg of cesium-137 in the liver, 5 weeks after a cratering experiment. The DOE-funded study claimed daily consumption of 500 grams of the tissue would result in an annual dose of only 6.4% of the guidelines for the general population. There was no reported impact found on cattle.
MONITORING TODAY As reported above, soil sampling of off-site gardens stopped in 1995 due to lack
of funding and no significant findings. This researcher attempted to find maximum contaminant levels for soil off-site, but could find none. While there are ground water and air MCL’s, there are no consistent soil MCL’s other than on-site or for specific contaminated locations for cleanup.
A closer inspection and more careful reading of DOE National Nuclear Security
Administration documents concerning radiological monitoring of plants and animals shows that game animals “are sampled annual from known contaminated sites on the
12
NTS to estimate hypothetical doses to hunters (i.e., the public) and determine if NTS plants and animals themselves are exposed to radiation levels harmful to their populations (www.nv.doe.gov/emprograms/biota/evaluating.htm).” Their goal is to “determine if the potential dose to humans consuming game animals from the NRS is less than 100 mrems per year, the limit set by DOE Order 5400.5.” (www.nv.doe.gov/emprograms/biota/monitoring.htm).
Off-site direct monitoring of surrounding communities within 240 miles of the
NTS is still conducted and overseen by the Desert Research Institute. There has been no evidence of offsite radiation from the NTS and are reported to be within normal background radiation levels (www.nv.doe.gov/emprograms/radiation/radoffsite.htm)
METHODOLOGY
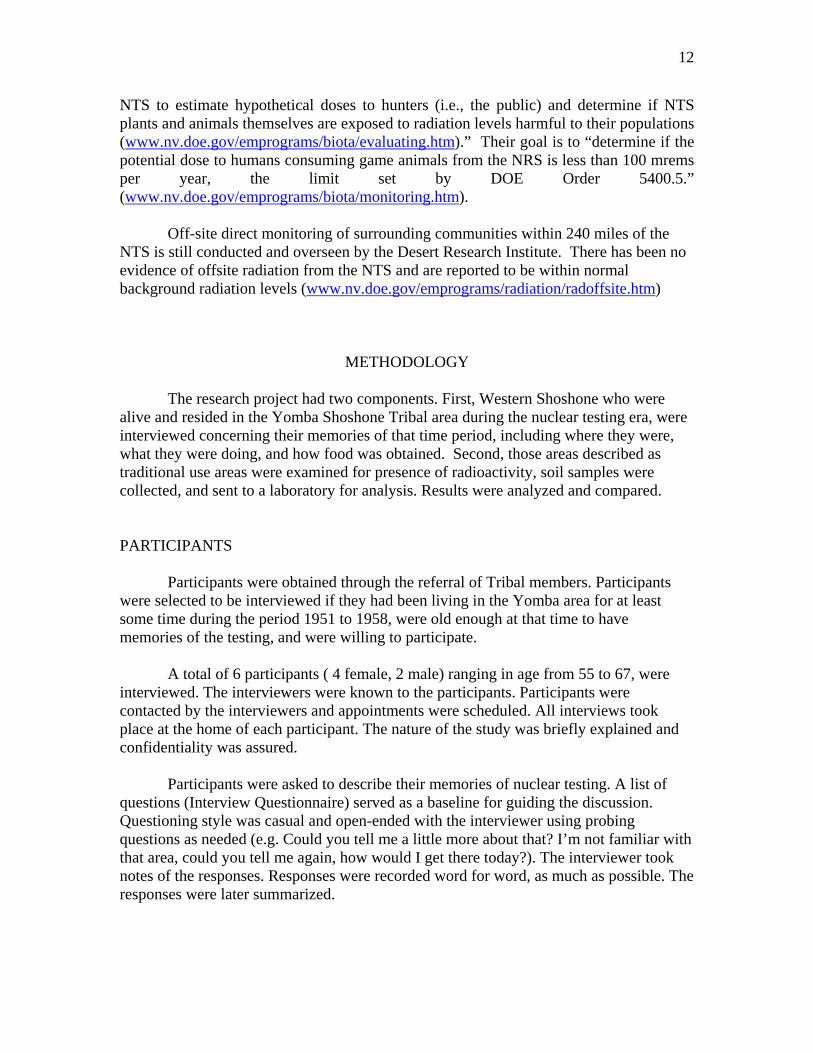
The research project had two components. First, Western Shoshone who were alive and resided in the Yomba Shoshone Tribal area during the nuclear testing era, were interviewed concerning their memories of that time period, including where they were, what they were doing, and how food was obtained. Second, those areas described as traditional use areas were examined for presence of radioactivity, soil samples were collected, and sent to a laboratory for analysis. Results were analyzed and compared. PARTICIPANTS
Participants were obtained through the referral of Tribal members. Participants were selected to be interviewed if they had been living in the Yomba area for at least some time during the period 1951 to 1958, were old enough at that time to have memories of the testing, and were willing to participate.
A total of 6 participants ( 4 female, 2 male) ranging in age from 55 to 67, were interviewed. The interviewers were known to the participants. Participants were contacted by the interviewers and appointments were scheduled. All interviews took place at the home of each participant. The nature of the study was briefly explained and confidentiality was assured.
Participants were asked to describe their memories of nuclear testing. A list of questions (Interview Questionnaire) served as a baseline for guiding the discussion. Questioning style was casual and open-ended with the interviewer using probing questions as needed (e.g. Could you tell me a little more about that? I’m not familiar with that area, could you tell me again, how would I get there today?). The interviewer took notes of the responses. Responses were recorded word for word, as much as possible. The responses were later summarized.

13
INTERVIEW QUESTIONNAIRE
During the time period 1951 to 1968, the US conducted many above ground tests at the Nevada Nuclear Weapons Test Site. We are going to ask you questions about your memories of that period. Nuclear testing began at the Nevada Test Site on January 27, 1951. Where were you living at that time? Did you often travel for work, visiting friends, because of the heat, or for other purposes? What about food gathering, hunting, that sort of thing? Did you travel during certain seasons or times of year to collect plants or hunt? Did you move away from here? If so, when and where did you go? Do you remember seeing a nuclear cloud? If so, where were you and what were you doing when you saw it? Please describe your memory of what it looked like, what you heard or felt. (If participant saw more than one cloud, ask about each one). Did you know what it was when you first saw it? Can you remember who else was living here in the valley and where their house was? Did you hear stories or people talking about the nuclear tests? How did you find out what the tests were? Did the government notify you? Were people warned about them or told to do or not do anything to protect themselves? How did you get your food at that time? What were you eating? Were you advised not to drink milk or water? Did they warn you about not eating wild game or native plants? Do you remember any areas where plants died, or grew differently, or did not grow back? Please describe the area enough so I could get there today. Where else were you traveling or moving about to at the time? For example, did you go somewhere a lot to pick willows or pine nuts or to get medicine? Describe the area so I could get there today.
14
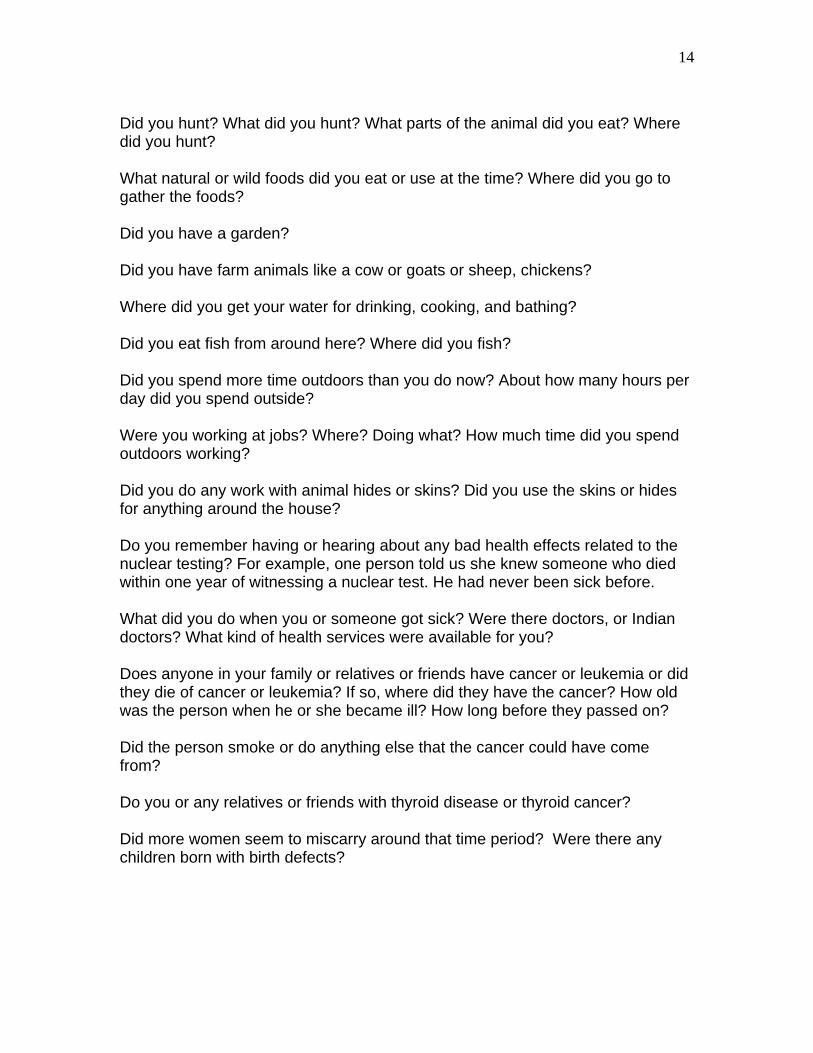
Did you hunt? What did you hunt? What parts of the animal did you eat? Where did you hunt? What natural or wild foods did you eat or use at the time? Where did you go to gather the foods? Did you have a garden? Did you have farm animals like a cow or goats or sheep, chickens? Where did you get your water for drinking, cooking, and bathing? Did you eat fish from around here? Where did you fish? Did you spend more time outdoors than you do now? About how many hours per day did you spend outside? Were you working at jobs? Where? Doing what? How much time did you spend outdoors working? Did you do any work with animal hides or skins? Did you use the skins or hides for anything around the house? Do you remember having or hearing about any bad health effects related to the nuclear testing? For example, one person told us she knew someone who died within one year of witnessing a nuclear test. He had never been sick before. What did you do when you or someone got sick? Were there doctors, or Indian doctors? What kind of health services were available for you? Does anyone in your family or relatives or friends have cancer or leukemia or did they die of cancer or leukemia? If so, where did they have the cancer? How old was the person when he or she became ill? How long before they passed on? Did the person smoke or do anything else that the cancer could have come from? Do you or any relatives or friends with thyroid disease or thyroid cancer? Did more women seem to miscarry around that time period? Were there any children born with birth defects?

15
EQUIPMENT
Community members who served as field technicians were trained in the use of a Garmin Etrex Legend hand-held GPS unit, and an Inspector Nuclear Radiation Monitor. Clear glass 125 ml standard sampling jars with lids, protective work gloves, and separate aluminum scoops were obtained. PROCEDURE
Community members who agreed to serve as field technicians were trained by the
consultant on procedures including purpose of the study, sample design, sample site selection, use of a hand-held GPS monitor, use of a hand-held radiation monitor, sampling technique, data recording, and the importance of chains of custody.
The consultant did not choose to conduct random soil sampling. Because of the
high cost of soil analyses, the vast area to be covered, and the limited amount of funding, the goal of sampling was to choose areas with the highest probability of having residual radiation.
At least one elder or one community member attended the soil sampling events
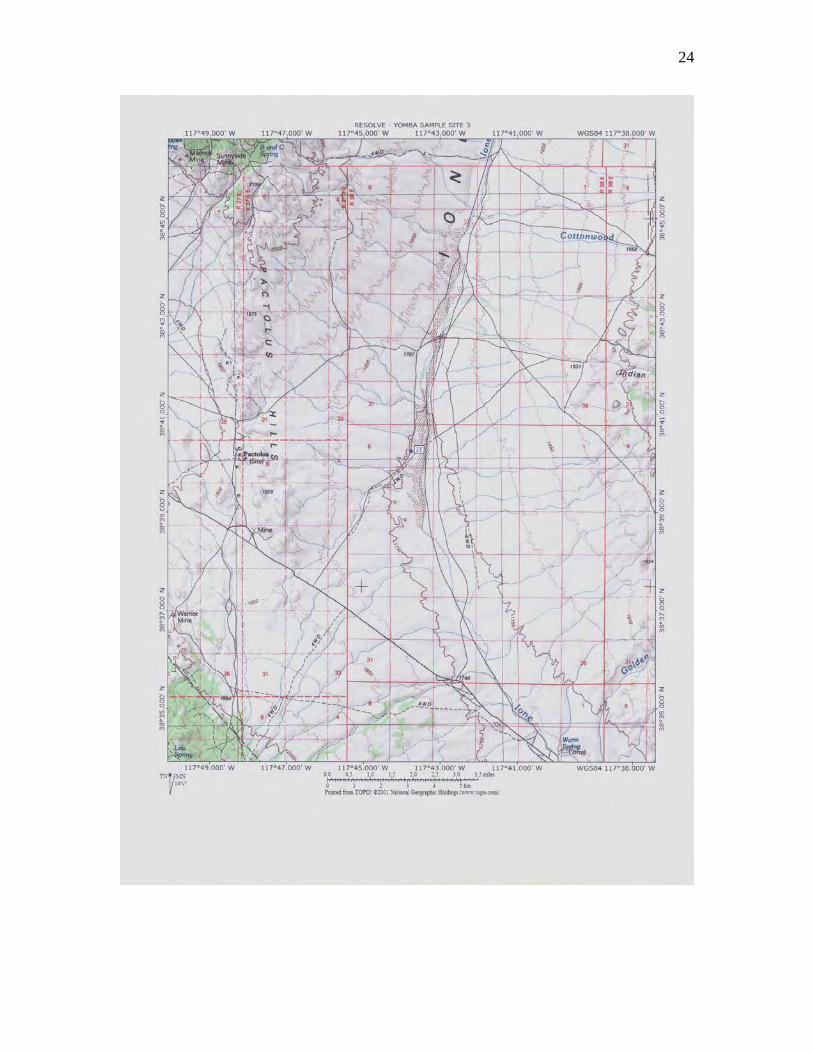
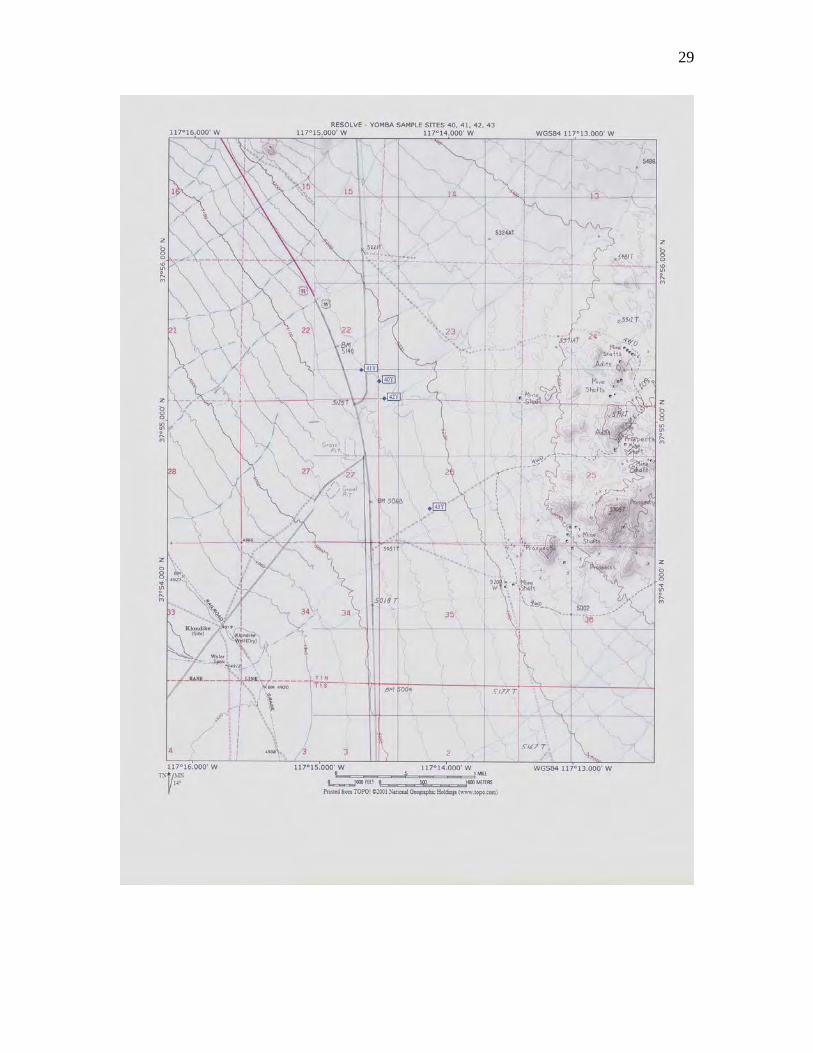
and pointed out specific use areas. Areas were initially examined using a hand-held nuclear radiation monitor capable of detecting low levels of radiation (alpha, beta, gamma) through a 2-inch round Geiger-Mueller tube, or “pancake tube.” As radiation passes through the tube causing ionization, an electric current is generated. The monitor was set to measure the most direct unit of measure, counts per minute (CPM), every 3 seconds. Milliroentgens per hour were not chosen as a measure because they are calculated using a conversion factor optimized for Cesium-137, and therefore result in less accurate measurement for other radionuclides. Field technicians held the monitor with the alpha window facing and within 1-12 inches above the soil surface. Areas that appeared to be undisturbed by cattle, traffic, or development were chosen. Locations with counts above 100 per minute were recorded, and the highest of the samples chosen. The site was measured with the GPS instrument, and the field technician filled the sample jar using an aluminum scoop. Samples were taken from the surface 1 inch of soil. The GPS location, including altitude, were marked in a data manual. Both the lid and the jar were marked with a sample number.
Thirty-six samples were collected. Chains of custody forms were filled out
including project name and contact information, lab-assigned project number, media type, date and time of collection, analyses requested, and custody signatures. The samples were packaged and sent by UPS to the laboratory for analysis. Maps were produced from the GPS locations using the National Geographic topographic mapping program.

16
SELECTION OF ANALYTES AND LABORATORY Many of the fission products from nuclear weapons tests were from short-lived radionuclides (Anspaugh, 2000). Thus many of the radionuclides from nuclear testing over 50 years ago would be undetectable. Gross measures of radioactivity were tested to determine the general activity levels of sites. Because gross radiation measures cannot distinguish between radionuclides, specific analyses were performed in addition to gross alpha, gross beta, and gamma detection. Radionuclide analytes were chosen that were products of nuclear weapons testing and had a relatively long half-life. The number of analytes chosen was limited by available funding.
Severn Trent Laboratory (STL), the same laboratory that performs the Hanford, WA testing was chosen for sample testing. Several laboratories were approached by the consultant, but STL offered the best price and was the most helpful and responsive. Quality assurance reports were satisfactory.
The analyses requested were: Alpha Spectroscopy
- Americium-241 by method RICH-RC-5087; - Isotopic Plutonium by method RICH-RC-5087 Gamma Spectroscopy
- Gamma by method RICH-RC-5017 Gas Proportional Counting - Gross Alpha by method RICH-RC-5020 - Gross Beta by method RICH-RC-5020 - Total Strontium by method RICH-RB-5006 Liquid Scintillation - Tritium Analysis by method RICH-RC-5037
The analytical result for each analysis performed included a minimum of one laboratory control sample, and one reagent blank sample analysis. Plutonium
Plutonium is formed when uranium absorbs an atomic particle. Extremely small amounts may occur naturally, but most, in the form of Pu-239 and Pu-240, enters the environment as a byproduct of nuclear weapons testing or accidents at nuclear facilities. Pu-238 and Pu-239 decay into Uranium-234 and U-235, releasing alpha and beta articles and gamma radiation. Plutonium isotopes have very long half-lives. Pu-238 has a half life of 87 years; Pu-239 has a half-life of 24,065 years, and Pu-240 has a half-life of 6,537 years.
Plutonium adheres to soil particles and may be inhaled or swallowed and, any amount not excreted continues to expose the body, predominately lungs, bones, and liver, and increases risk of cancer and leukemia. Plutonium has reproductive effects in that it

17
concentrates in the testicles, and easily crosses the placenta. It is the most carcinogenic substance on earth. Latency periods of 30 years occur between exposure and cancer or leukemia diagnosis. Plutonium concentrates in the top 5 cm of soil, but can migrate 25 cm deep (www.epa.gov/radiation/radionuclides/cesium.htm).
. Tritium
Tritium occurs in low concentrations naturally, produced when cosmic rays strike nitrogen molecules in the upper atmosphere. Most enters the environment through nuclear weapons explosions, where it is used in the triggering mechanism in thermonuclear explosions, or as a byproduct of nuclear reactors. It can be inhaled or ingested in water and causes increased risk of cancer, as it goes directly into the soft tissues and organs (http://www.epa.gov/radiation/radionuclides/tritium.htm). Strontium
With 16 known isotopes, four of which are stable, strontium is found naturally as a non-radioactive element. Twelve isotopes are radioactive, strontium-90 being the most significant. Strontium-90 is a byproduct of the fission of uranium and plutonium in nuclear weapons and reactors. Large amounts were produced in nuclear tests and dispersed throughout the world. Its half-life is 29.1 years.
Because it behaves like calcium, it is taken into the bones, bone marrow, and teeth. It forms compound easily and moves through the environment and while it can be inhaled on dust, it easily enters the food chain. Bone cancer, cancer of the soft tissue and leukemia result (http://www.epa.gov/radiation/radionuclides/strontium.htm).
. Cesium
Radioactive cesium 137 is produced when uranium and plutonium absorb neutrons and undergo fission in reactors and weapons. Its half-life is 30.17 years. It decays by emission of a beta particle and relatively strong gamma rays to barium 137. Cesium easily becomes airborn and walking in soil with cesium, exposes a person to inhalation of gamma. Cesium becomes distributed fairly uniformly in soft tissue and retains in muscle, increasing the risk of cancer. In high external exposure, it causes burns and death (http://www.epa.gov/radiation/radionuclides/cesium.htm).
Americium
Americium is a man-made isotope produced when plutonium absorbs neutrons in nuclear reactors and weapons detonations. Most environmental americium is a result of nuclear weapons testing. All americium isotopes are radioactive, but the most important

18
is Americium-241 which releases alpha and gamma upon decay into radioactive neptunium-237. The half-life of Americium-241 is 432.7 years.
A person may become exposed to Americium-241 by walking on contaminated soil, inhaling resuspended, contaminated dust, or drinking contaminated water. Americium-241 concentrates in lungs, bone, liver, and muscle and increases risk of cancer in all organs due to gamma radiation. (http://www.epa.gov/radiation/radionuclides/americium.htm.)
RESULTS
ORAL HISTORY INTERVIEWS
Six individuals (2 males, 4 females) aged 55 to 70 were interviewed. The Yomba Shoshone are surrounded by U.S. Forest Service land, so they still hunt and fish and prefer wild game which they get less often now because of hunting restrictions by the federal agencies. Because the Test Site and some federal areas are restricted areas, some Shoshone are afraid to discuss their traditional hunting locations. The elders frequently entered onto some restricted areas including those at the edge of the NTS to hunt and gather food during the times of nuclear testing (See Map 2.)
At the time of testing they were eating groundhogs, sage hen, antelope, dove,
insects, fish, deer, jackrabbit, cottontail, pine nuts, yomba, wild onions, choke cherries, currants, service berries, juniper berries, Indian spinach, and elderberries. Wood was harvested and burned for heat and cooking. Houses, sweat houses, animal corrals were made from juniper, willow, boards, rabbit brush, and sage brush. Willows were crafted into baskets for carrying, gathering, drying sifting, storage, babies, willow.
Quite a bit of time was spent outdoors in all seasons. Yomba Shoshone slept most of the time except in the winter. They spent a lot of time in the mountains in fall and winter where shelters were built covered with skins and brush. Quite a few families had gardens and grew strawberries, potatoes, beets, onions, and beans. Living Situation
“We lived in houses about 5’ by 6’ made of boards and mud. I lived with my grandparents there as a little boy (early 1950’s). We used cardboard for walls, they were real drafty and cold, so we put brush in the holes. The roof was the same, boards and mud. Later some people moved into brick houses. They cracked and then there were holes in the walls. They were real drafty too, so we plugged the holes with old rags. About 1979 they built HUD homes. We didn’t have electricity, we used oil lamps. We didn’t have telephones till in the 1980’s. There was no plumbing. Water was carried from the river.

19
For some reason we moved to Tonopah to go to school, then later to Fallon. After
the nuclear test outside Fallon (Project Shoal), my uncle wouldn’t go to Fallon anymore.

20
There was a Chevron station across from the Fallon test site, by Frenchman’s Station, and Indians worked there. My sister worked there. White people would come in and want to talk about the tests, about the clouds. My uncle’s friend lived in Fallon, he complained about the test. I remember my uncle went around and talked to people about it. There was a paper about it.
“After the tests started, there was always a taste in the air, kind of sour, it smelled like almost moldy, but fort of it tasted like acid, metal. It seemed like it would build up in your mouth while you sleep. You don’t want to swallow it, you want to spit it out. So grandma always kept a spit pan by the side of the bed. You can still taste it some places. When you go to Fallon over Elk Horn Summit, you can taste it, and Dixie Valley tastes the same. Sand Mountain really tastes that way. The taste was in the wild foods we ate. Then we started eating junk food, and it would go away. But then you’d kind of crave it, it got worse when I got older, craving wild foods with that taste. I never found it again in the food. It sounds funny but I grew up on it (Interview 1).” Food
“We had a garden and there were some milk cows. Cows were outside in the field all year. We never bought feed, they just ate grass. We had goats too. We used to drink goat milk and make goat cheese. We used to make ice cream out of snow and milk
“When I was young I’d just get on my horse and ride into the woods in the summer and stay gone for a few days or till my grandpa came to find me. I’d play with the animals in the woods. They were my pets. I’d take jerky with me. I’d pick pine nuts and berries in the fall or shoot a rabbit.
“We ate rabbit a couple of times a day. We’d make soup and jerky and biscuits. Soup with just potatoes and rabbit boiled up together.
“We ate ground hog in about March or April. Deer were hunted from about October till mid-November. We discarded the stomach, bladder, and throat and used the rest. We put deer in soup or beans (Interview 1).” Illnesses
“Some people went to see the tests. Lots of people have thyroid problems and thyroid cancer. Almost everyone has diabetes and high blood pressure and there are quite a few people, some are gone now, who have been on dialysis. There are at least three or four kids who were mentally challenged. Several families have more than one deaf children in a family. Almost all the kids are in special ed, but that could be just Gabbs School (Interview 2).
“I recently found that more lumps are growing in my colon. A couple of years ago they found I had colon cancer. I was born and raised in Yomba in the early 1950’s. There have been quite a few people who died of colon cancer (Interview 3).”

21
“I sometimes wonder if I’m responsible for giving my daughter colon cancer. I
was pregnant when the bombs were going off and I didn’t know. I feel real bad about that. But what could I have done? They didn’t tell us it was bad. Now I just don’t know (Interview 4).”
“I never thought much about it. I come from Elko. My first husband died when he was 21, not too long after we got married. He had cancer. We lived in Fallon then, but he was originally from Yomba and he always used to come back to Yomba to hunt with his friends in the 1950’s. (Interview 5)”
“There’s a story about these men from Yomba. They’d be buckarooing and they went to that pool, it’s dried up now. Under the trees there on the road from Gabbs off to the left if you’re headed to Gabbs. There’s a road. They’d go there to soak in the water. The one guy his hair started to fall out. He died shortly after from cancer (Interview 6).” Changes in Plants and Animals
“In 1976 three men hunting deer, went to the area around Marysville, behind the houses, shot a deer. When they gutted him, he didn’t look right. Inside he was black, there were big black bubbles. His muscles were ugly with it. He was so bad we didn’t know how he survived. About four were found like that around that time. The next year, my brother saw a deer, she was walking sideways, swaying left to right (Interview 1).”
“It seems like all the animals went away, all the birds except the magpies. The sage hen are almost gone. The eggs don’t make it. They have weak shells. The pine trees stopped making pine nuts the way they used to (Interview 2). “There was one man, he was always healthy, never sick, always buckarooing. He was invited to see some of the tests. Then he came back and in about a week he fell off his horse. He had cancer really bad and died after that (Interview 2). ” Memories of the Time
“There was a few times we were told about the tests. You know those places on the way to Tonopah on Poleline Road, that look like mining digs. They had all these people come check for radiation. They had real high readings. Nothing would grow on them and still it doesn’t. Then they had a big meeting in Tonopah and all that land became BLM land. I don’t know why.
“I remember one cloud. It came up Ione Valley. We were there by the gas station. It was pink and it came up and went over those mountains by the Boy Scout camp (Interview 6).”
22
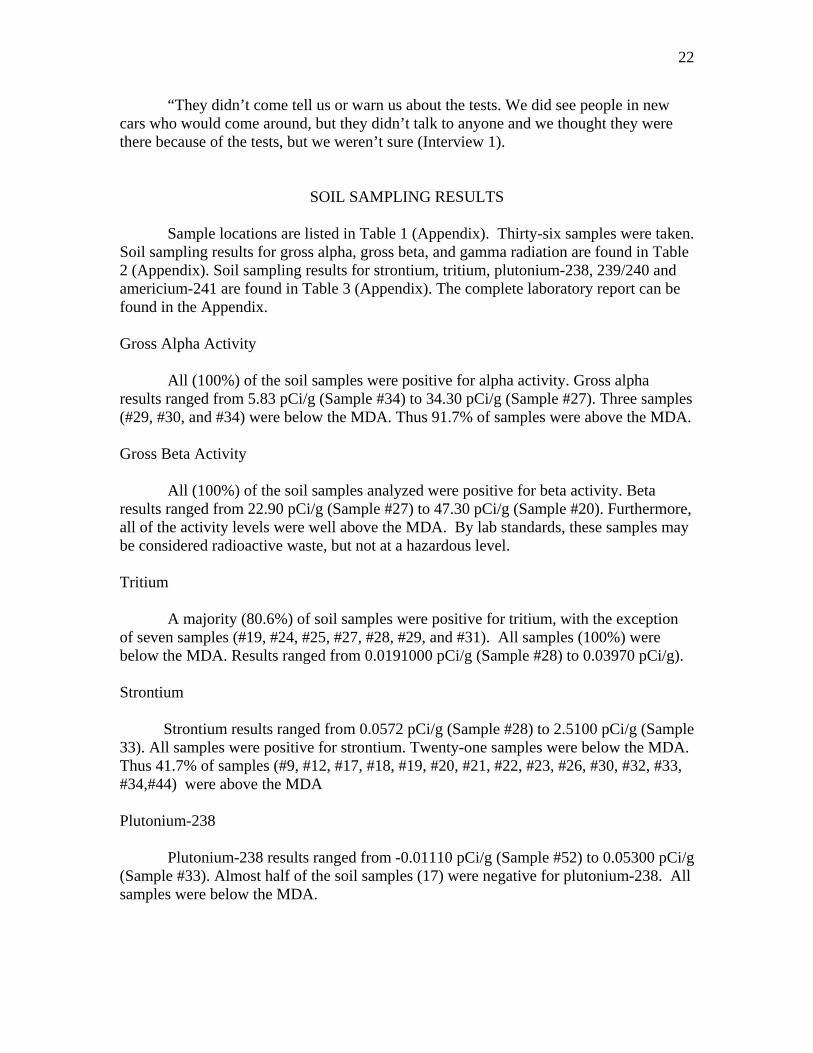
“They didn’t come tell us or warn us about the tests. We did see people in new cars who would come around, but they didn’t talk to anyone and we thought they were there because of the tests, but we weren’t sure (Interview 1).
SOIL SAMPLING RESULTS
Sample locations are listed in Table 1 (Appendix). Thirty-six samples were taken.
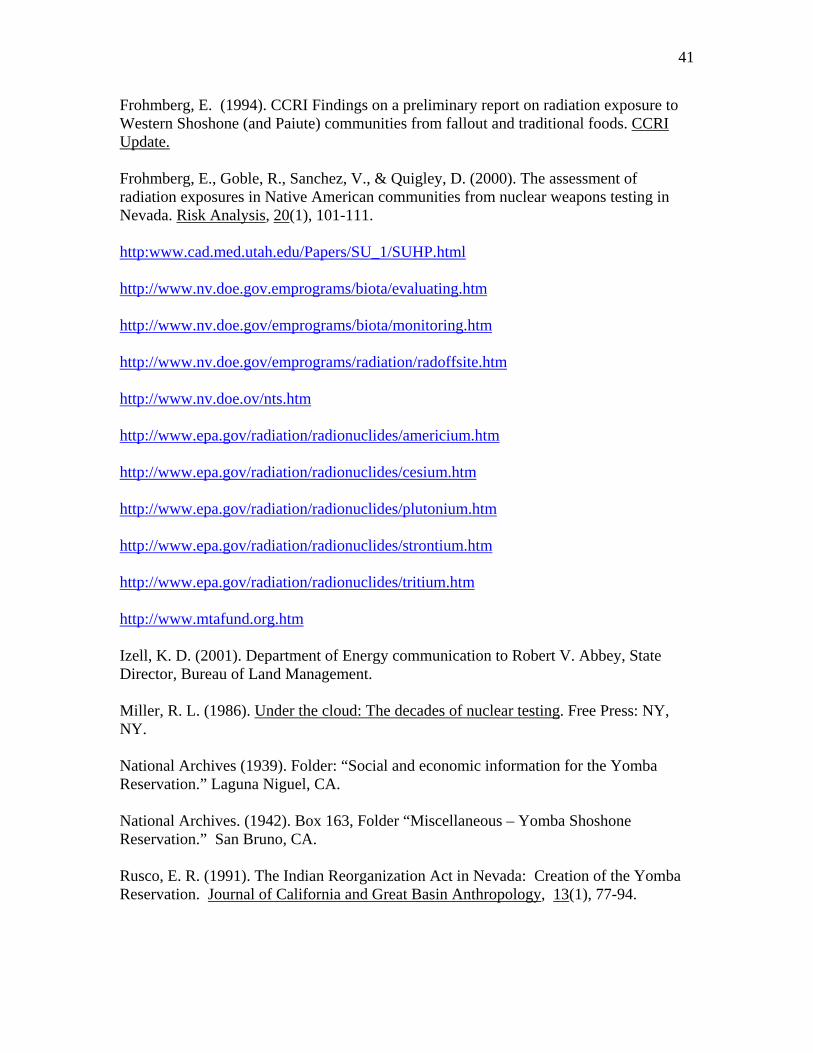
Soil sampling results for gross alpha, gross beta, and gamma radiation are found in Table 2 (Appendix). Soil sampling results for strontium, tritium, plutonium-238, 239/240 and americium-241 are found in Table 3 (Appendix). The complete laboratory report can be found in the Appendix. Gross Alpha Activity All (100%) of the soil samples were positive for alpha activity. Gross alpha results ranged from 5.83 pCi/g (Sample #34) to 34.30 pCi/g (Sample #27). Three samples (#29, #30, and #34) were below the MDA. Thus 91.7% of samples were above the MDA. Gross Beta Activity All (100%) of the soil samples analyzed were positive for beta activity. Beta results ranged from 22.90 pCi/g (Sample #27) to 47.30 pCi/g (Sample #20). Furthermore, all of the activity levels were well above the MDA. By lab standards, these samples may be considered radioactive waste, but not at a hazardous level. Tritium A majority (80.6%) of soil samples were positive for tritium, with the exception of seven samples (#19, #24, #25, #27, #28, #29, and #31). All samples (100%) were below the MDA. Results ranged from 0.0191000 pCi/g (Sample #28) to 0.03970 pCi/g). Strontium Strontium results ranged from 0.0572 pCi/g (Sample #28) to 2.5100 pCi/g (Sample 33). All samples were positive for strontium. Twenty-one samples were below the MDA. Thus 41.7% of samples (#9, #12, #17, #18, #19, #20, #21, #22, #23, #26, #30, #32, #33, #34,#44) were above the MDA Plutonium-238 Plutonium-238 results ranged from -0.01110 pCi/g (Sample #52) to 0.05300 pCi/g (Sample #33). Almost half of the soil samples (17) were negative for plutonium-238. All samples were below the MDA.

23
Plutonium-239/-240 Plutonium-239/-240 results ranged from -0.02510 pCi/g (Sample #29 to 1.27000 pCi/g (Sample #32). Six (6) soil samples (#19, #21, #24, #28, #29, #34) showed negative plutonium-239/-240 activity. Four samples were above the MDA (#12, #32, #33, #44). Thus 11.1% of samples were above the MDA. Americium-241 Americium-241 results ranged from -0.01730 pCi/g (Sample #25) to 0.21900 pCi/g (Sample #32). Sixteen soil samples showed negative americium-241 activity. Four samples (#21, #26, #32, #45) samples were above the MDA. Thus 11.1% of samples were above the MDA. Cesium-137
Cesium-137 ranged from -0.00686 pCi/g (Sample #28) to 4.28000 pCi/g (Sample #33). All but one soil sample (#28) were positive for cesium-137 activity. Thirty-one samples were above the MDA. Only five samples (#28, #42, #46, #48, #49) were below the MDA. Thus, 86.1% of samples were above the MDA. Three of the lowest results occurred in Sample #16 and 2 in Sample #10. Two of highest results occurred in Samples # 21 and #3.
24

25

26

27

28
29

30
31
CONCLUSIONS LIMITATIONS OF THIS STUDY
This study does not deal in depth with the cultural history of the Western Shoshone people or with the complex and spiritual relationship of the Western Shoshone people to their land. Identification of specific medicine plants and their uses will not be discussed. The study is not intended as a dose reconstruction, and will not make conclusions about the source of the radionuclides. Further the research will not directly deal with Native American opposition to nuclear testing, although several respondents asked that the opposition at least be mentioned. DOE’s Most Recent Soil Study (2001)
In 2001, the Ely BLM Office released a signed Decision of Record for a
prescribed burn of over 3 million acres of pinyon-juniper forest in White Pine, Lincoln, and northern Nye County. Because of concerns expressed by Western Shoshone, Goshute, and Paiute tribes, organizations, and individuals about resuspension of residual radiation, Robert Abbey, State Director, Bureau of Land Management, Nevada State Office, contacted DOE to obtain baseline information on residual radiation from nuclear testing at the Nevada Test Site for use in the NEPA analysis of prescribed burns (Izell, 2001).
Larry M. Franks, Supervising Radiation Physicist, Deputy Food and Drug
Commissioner, of the Radiological Health Section of the State Bureau of Health Protection Services, and Kenneth Hoar, Director, Environment, Safety, and Health Division, National Nuclear Security Administration, Nevada Operations Office conducted soil sampling in the areas of Caliente, Elko, and Ely, NV in July 2001. Franks and Jim Larson, PHE-III also collected soil from areas in southern Nevada as “non-fallout” comparisons (Franks, 2001).
The research question was “How do we determine if a BLM firefighter or anyone
else who breaths smoke from burning vegetation in areas known to have been contaminated by fallout is at an increased health risk from radiation exposure (Franks, 2001)?”
Thirty-four soil and 11 vegetation samples were collected from fall-out and “non-fallout” areas for comparison. Samples from potential fallout areas “east of Caliente, northeast of Ely, southwest of Cherry Creek and northeast of Battle Mountain”, potential prescribed burn areas, were collected. Samples were also taken from non-prescribed burn areas – Intersection of Hwy 95/168, Highway 229/93 intersection, Lages, Spring Creek, and Lund. Non-fallout areas were locations along Hwy 160, Pahrump, Death Valley Junction, Amargosa Valley, Beatty, and Scotty’s Junction. A commercial lab analyzed the samples for alpha, beta, and gamma radiation (Izell, 2001).
32
Franks averaged the laboratory findings from fallout and non-fallout samples
separately for each analyte (alpha, beta, gamma). No significant difference was found between fallout and non-fallout samples. The study concluded “Consequently, an individual exposed to smoke from burning vegetation in the Caliente, Ely, and Elko areas, would be at no increased radiological risk than from smoke in southern Nevada or other areas of the United States.” Natural and man-made radionuclides were at minimum detectable amounts “or well within averages for other areas of the United States (Franks, 2001.” Critique of the 2001 Study The methodology of the 2001 study was a four paragraph rationale which exemplifies the non-scientific approach and assumptions used in DOE and DOE-contracted studies. “Air Sampling: The immediate solution appears to be straight forward. Take air samples of the smoke in those areas and see if NTS fallout is present, and if so, how much. Upon further examination, numerous technical challenges become evident that make this approach difficult if not impossible to pursue (September 10, 2001, report to Kenneth Hoar from Larry M. Franks).” Although the research was performed by the Bureau of Health Protective Services of the State of Nevada, the challenges enumerated had nothing to do with the safety of the public or the uninformed use of the public in a simple before-after experimental design (i.e. Condition A - measure of ambient air contaminants -- Fire as experimental treatment -- Condition B measure air contaminants, then compare results for increase, decrease, or finding of no difference). Perceived challenges amounted to cost, not of human health, but of air sampling pumps, filters, vehicles to carry samplers, and personnel. Further, they asserted that there would definitely be radioactivity in the smoke because fallout is still detectable throughout the United States. They stated that air samples would have to be taken from NY and California for comparison. It is unclear whether this means that all such prescribed burns and wildfires are redistributing radiation from the NTS, and this theory should be investigated further (Franks, 2001). Further, the non-fallout samples were taken from areas where fallout was known to have occurred. To justify, the “non-fallout” areas, DOE used the iso-exposure contour map of the original monitor readings from a 1959 report by Gordon Dunning, Chief, Radiation Effects of Weapons Branch, Division of Biology and Medicine, AEC. The map of “Estimated Radiation Doses” is unclear and without detail. The map shows radiation in roentgens in only 6 locations (St. George is not measured; no measures south of the test site) and only includes radiation from detonations through 1959. Therefore, the map does not include nuclear releases from 1960-1962, including one of the most powerful, Sedan, or the recently 55 recently declassified off-site releases (Schoengold, DeMarre, & Kirkwood (1996). Dunning’s figures included a 25% reduction due to estimated time spent indoors (www.cad.med.utah.edu/Papers/SU_1/SUHP.html).

33
This is the same Gordon Dunning who at a meeting in 1957 before the Joint
Committee Hearings on Radiation, said that radioactive atmospheric release could be reduced, but our freedom would be threatened. “However, if we continue to reduce the fraction we are willing to release, we eventually reach a cost of control which makes the operation prohibitive. the dilemma is that we must weigh the degree of undesirability of radioactive fallout against the advantages which may be anticipated from activities which are inevitably accomplished by fallout.” At the same meeting, Dunning also denied that iodine-131 did damage to the thyroid, despite the fact that he had received Public Health Service press releases warning of the damage. According to the radiation compensation case reports, Dunning had been involved in much of the cover-up of health damage and animal deaths resulting from nuclear testing (Fradkin, 2004).
This outdated map may not apply given the more recent studies and mapping of the distribution of fallout (Miller, 1986). In addition, research studies had been pointed out to BLM concerning the finding of environmental and health damage from radiation redistributed and resuspended by fire following Chernobyl’s nuclear accident. These studies were ignored. The 2001 DOE/NV study is also not of sufficient scientific quality because it is not replicable. Only the “fallout” areas were located by GPS, the “non-fallout” areas are listed as vague locations (e.g. “State Route 160 M-M CL13” “Amargosa Rest Stop, St. Rt. 373 and US 95, 200 yards south of junction.”) If these locations are on the side of the road, they were not in undisturbed areas as the “fallout” areas of the forest might be. Road construction and run-off may have moved the residual radiation. The areas are directly in areas that were crossed many times by fallout (Miller, 1986). To call these areas “non-fallout” areas is similar to the errors of measure following the bombing of Hiroshima and Nagasaki where the center of the explosion (fallout area) was compared to an area approximately 10 miles away (non-fallout area), and the results used to set radiation standards for nuclear workers. There is no true baseline in the southern Nevada area. The DOE findings for gross alpha (which are averaged) were 7.79 +/-28.05 in fallout soil, and 6.30 +/- 26.06 in non-fallout soil. Gross beta was 26.18 +/- 23.98 in fallout soil and 26.63 +/-23.80 in non-fallout soil. Cesium-137 was 0.36 +/-0.45 in fallout soil and 0.10 +/-0.62 in non-fallout soil. Individual site results were averaged to get these numbers. This is a questionable technique because there were so few samples over such a huge land mass of differing terrain and weather conditions. Franks (2001) concluded “there is no significant difference between samples taken in the fallout vs non-fallout areas.” A more accurate conclusion would have been that whatever amount of fallout is in the southern locations, a slightly higher amount is

34
present in the burn areas. The conclusion hints that an analysis of variance was performed on the results from the two sampling areas, but any ANOVA calculations are not presented. If ANOVA was performed, no levels of statistical significance were given. although the results were claimed to be not significant. There is, in fact, no reason to believe, and no justification was provided, to show that the two sampling areas are different or a listing of factors considered. The correct initial statistical assumption would have been that the two areas were equal, and the study would investigate the alternative hypothesis that there was significant difference.
The conclusion is not that firefighters and the public are safe, but rather that risk
from exposure is slightly higher in the burn areas than in the non-burn areas.
Differences from Present Study The difference in results between DOE’s sampling and the Yomba Shoshone Tribe’s sampling is quite large. In the east of NV (known areas of fallout) alpha ranged from 2.39 pCi/g to 17.30. Yomba’s results (5.83 pCi/g to 34.30 pCi/g) were approximately double. Gross alpha in the “non-fallout” areas ranged from 0.00 pCi/g to 16.10 pCi/g. Also, Yomba had no instances in which error was higher than the result.
Beta in the fallout area of eastern NV ranged from 12.20 pCi/g to 38.40 pCi/g.
Beta in the “non-fallout” areas ranged from 5.15 pCi/g to 42.10 pCi/g. The results at Yomba traditional areas was 22.90 pCi/g to 47.30 pCi/g, higher than the DOE study.
Gamma radiation measured by cesium ranges from 0.12 pCi/g to 0.69 pCi/g in the
fallout areas of the DOE study. Cesium results ranged from 0.0 to .27 pCi/g in “non-fallout” areas. The Yomba study ranged from a low of -0.00686 pCi/g to 4.28 pCi/g. This is quite a large difference.
It is unclear what has caused the large difference in findings, particularly because
of the lack of descriptive methodology of the DOE study. Three possibilities could be explored:
1. The Yomba study sampled from the top 1 inch of soil in undisturbed areas.
The DOE study does not describe its technique. It is possible that the DOE study used samples taken below 1 inch of soil and that there is more radiation on the soil surface from wind, Brownian movement, or characteristics of the radionuclide.
2. It is possible that significant radiation from NTS traveled further to the west
than previously considered. This could be from unknown meteorological factors such as wind traveling in opposing directions at different trajectory levels. The possibility of unknown, unmapped hot spots should be investigated.

35
3. It is possible that significant radiation has become available from the Project Shoal test in Fallon, NV. Perhaps significant venting was unreported.
Critique of Other DOE Studies
DOE’s reliance on models and inferences from those models does not match observations. The observations are not merely anecdotal evidence, but biostatistical studies, for example the 80,000 cases of leukemia observed by the Center for Disease Control and the National Cancer Institute. These epidemiological studies do not appear to be taken into consideration in the mechanistic models of DOE.
The DOE Off-Site Radiation Exposure Review Project (ORERP) which
developed a model for risk, is one such model. From 1979 to 1994 the ORERP re-evaluated the off site dose from above ground testing during the period 1951-1963. The radionuclides of concern were Cesium-137, Strontium-90, Iodine-131, and Plutonium-239/240. Data were obtained by observations from tracking planes that followed the nuclear clouds till they disappeared and from data monitors like gummed paper, ion chambers, Geiger counters, and film badges.
Next an exposure pathway model was developed. The DOE conducted interviews
with 500 downwinders in the 1950’s and 1960’s to develop a lifestyle survey. People were asked about their milk consumption, where they worked and spent their time, how much time was spent outdoors. The results were used to classify people by lifestyle: Newborn, infant, preschool, elementary student, secondary students, homemaker, employed outdoors, employed indoors, and shepherd.
No Native American person was included in this survey. However, Native people
were classified according to the “shepherd” lifestyle. The shepherd representative figure was a Caucasian male, of approximately 134 pounds, between the ages of 20 and 30, who was outside except at night, and who had the same type of residential construction as a non-Indian person. This model, which is still used today, does not address the increased cancer risk to women, infants, small children, or native peoples. All monitoring systems used for collection of data in the model measured external, not internal, doses.
Frohmberg (1994) was the first to express scientific concern for the increased risk
of health effects from radiation on the Western Shoshone and Paiute peoples living near the NTS. In his thorough examination, he found that there were no studies of differential effects to native people. He hypothesized that internal radiation exposure was underestimated due to their lifestyle and cultural ways. In a participatory research study using local Western Shoshone and Paiute community members, Frohmberg, Goble, Sanchez, and Quigley (2000) affirmed significant differences in lifestyle. Western Shoshone and Paiute were found to have been significantly impacted by Iodine-131 from eating all parts, including the thyroids, of small game such as rabbits.
The “shepherd” lifestyle does not account for Native American lifeways and cultural uses of the land. Western Shoshone, and undoubtedly Paiute hunters, wandered

36
through the NTS area and in many other areas, searching in their traditional locations for game and plant foods and medicines, exposing themselves and their families to increased levels of radiation that are unaccounted for in any ICRP model. Native American food consumption patterns were not included in the “shepherd” lifestyle, as many Shoshone reported eating rabbit or other wild game in some form every day. They collected wild food and medicines from the same areas and used the plants and animal parts in their artwork, basketry, and buckskin work.
In addition to Western Shoshone wandering through NTS lands, migration
patterns of deer and other game were not considered in the model. From 1975 to 1981 DOE traced 2 deer that left the NTS and moved 75-125 away. This is probably typical, especially if the deer were in search of food in the winter. Perhaps obvious visible signs, like the black bubbles reported, or tumors had not developed at the time they were killed and eaten. This would have increased the internal dose to Western Shoshone. Also, if radiation fell on the fur of wild game, and Western Shoshone used the hide, they would have increased external exposure. It appears that deer, mountain sheep, and other wild game were allowed to roam freely on and off of the NTS area. And there are no dose standards for animals. Perhaps that is why many Shoshone report seeing fewer animals and birds than in the old days. Animals would have eaten other contaminated animals and would have drunk contaminated water.
Most of the monitors collecting data for the ICRP study were placed in towns and
near highways. Some ranchers in less accessible locations were given film badges. No Shoshone interviewed was provided with a film badge. Western Shoshone, like those from Yomba Shoshone Tribe or Timbisha people of the Tupippuh Project, lived in extremely isolated areas where there were no monitors. They spent much of their lives in mountainous areas, which are more likely to have fallout. They traveled, and still travel, extensively in search of wild food and to meet with relatives and friends at ceremonies and celebrations. Western Shoshone spent most of their time out of doors in poorly insulated homes, exposing them to even more radiation. None of these factors is taken into consideration in the DOE ICRP models. This is but one underlying assumption (that Native Americans fit the “shepherd” profile) that should be explored and investigated. In addition the following observations and suggestions are made:
a) Local knowledge has been ignored. For example, the elegant studies by Nuclear Risk Management for Native Communities, part of the Frohmberg et al. (1994, 2000) studies, rely on indigenous communities. The community knows itself and is quick to see changes in health or environment and should be on the frontline of making decisions concerning the missing gaps in data or prioritization of research. Far from being biased, some native communities will only open up to people they know. Researchers from the community know what cultural information is inappropriate to share publicly. But they can use their complex knowledge to ask the important questions.
37
b) The concept of “downwinder” implies an assumption of plume direction. Most DOE studies are based on the majority of plumes traveling north and east. But is this correct? Wind patterns cannot be predicted. While most wind moves west to east, currents at 10,000 feet may move differently than those at 20,000 or 30,000 feet. Oceans, polar and tropical air masses can move the funnel the wind in unpredictable ways (Miller, 1986). Both the Yomba and the Tupippuh Project study results indicate radiation has moved west and south. Doses from the west were higher than doses in the assumed fallout areas. If the AEC/DOE did not place monitors in these areas, because of the assumption of wind patterns, downwinders and radiation went unnoticed. Or is the fallout from another source, such as Project Shoal or Chernobyl or other testing arenas than the NTS? This should be investigated. Perhaps there are more “downwinders” who should be compensated.
c) Many federal studies have only tracked the increase in cancer and leukemia in areas and have not focused on immune system breakdown. There are few studies of non-cancerous outcomes, fetal death, infant mortality, etc. There are no studies of combined effects of other pollutants with radiation. For example, if radiation weakens the immune system, what happens when the person is then exposed to an endocrine disrupter, such as a pesticide. Pesticide spraying for noxious weeds is common in Nevada. What are the health effects from this multidimensional health risk model? There are no studies on differential effects for a fetus, infants, small children, women, Native people, who may be at higher risk. There has been no study of decreased birth rate, birth weight, or increased teratological issues.
d) Many studies do not differentiate between external and internal exposure. Badge and monitor data have little to do with internal dose. And what exactly is a rem? If it is a measure of absorbed dose to tissue, how much damage is that? To what tissue? This concept of measure should be reconsidered. Bioaccumulation in specific organs is not addressed. Many of the studies rely upon data from health effects of Hiroshima and Nagasaki. Results of external acute radiation exposure cannot be extended to the level of internal chronic exposure from point sources. Consideration of the temporal lag between exposure and cancer development or genetic damage and the bioaccumulation effects of low dose exposure are ignored.
e) The concept of background radiation needs clarification. Some studies define
background radiation as all non-man-made productions of radiation. Other studies define it as all radiation except that from the NTS, making Chernobyl normal background radiation.
f) There is lack of confidence in DOE operations and studies. Most radiation research is funded by U. S. governmental agencies, primarily DOE, that support, defend, and promote nuclear programs. These agencies have the option to classify documents in the “national interest” and declassify them at their whim. A recently declassified DOE document lists all the radiological effluents released from US testing. The document was prepared in 1996, but only became publicly available within the last year. This report lists

38
at least 52 off-site releases from 433 under-ground tests before 1992. Findings related to the subject area are listed in Table 4 (Schoengold, et. al.,1996).
How does this information change any of the previous health studies? For
example, the iodine-133/thyroid studies do not include exposures after 1971. And is this document accurate? According to the original Black, Smith, & Costa (1986) report, the maximum detected concentration of xenon-133 following the Mighty Oak incident was 550 pCi/m3. However the 1996 declassified document lowers that concentration to 450 pCi/m3. Is this a typographical error and are there other errors that could not be verified without access to original documents? According to Anspach (2000), DOE makes it a practice not to refer to classified documents, so that they remain out of the public view. The declassification of the effluent release document is critical to all health studies. An oversight or review committee needs to keep information regarding health open to independent researchers.
g) Most importantly, is it ethical to continue an operation which results in genetic damage or death without the informed consent, with insufficient accurate information and with no opportunity to participate in decision making or to opt out. What about the environmental effects and effects on animals. It is an inescapable situation.
Suggestions for Further Study
A database of raw data should be collected and preserved for the future. Control of data and laboratory testing should be wrested from DOE, due to conflict of interest. Available raw data should be released for re-examination by independent experts. Existing research should not be used for any meta-analytic studies because of potential errors in assumptions and unaddressed confounds. False or questionable assumptions should be pointed out and addressed. Using the precautionary principle, radiation standards should not be relaxed unless and until supporting evidence is found in the new studies and an independent panel examines the scientific status of radiation knowledge.
CONCLUDING REMARKS
The related studies of the Tupippuh Project (2007) and the Yomba Shoshone Tribe bring to mind thoughts of environmental justice. Environmental justice is the concept that no minority or low income population should suffer greater significant and adverse impact from an activity than any other group. Indeed this was an issue from the earliest testing on the Marshall Islands, when native people were removed from their homes without the knowledge that they could never return to their homeland. Certainly the Western Shoshone from this study, and of course, the Paiute and other Indian nations and tribes who lived in nearby areas were most adversely impacted. With little information and with little voice, they were left out of the any decision making, they were unwilling and unwitting subjects who did not give their consent to participate in one of the biggest experiments of all time. And so were we all, so were the animals, so was the environment.

39
And the legacy we leave still remains to be seen. Discussions of a return to
nuclear testing by the U.S. and other developing countries and storage of the nuclear waste that has been created and will remain for tens of thousands of years is unspeakable. But none of us will have a voice until the veil of secrecy is lifted from the DOE and related governmental groups and until they are forced to declassify and make public the findings that protect only them.

40
REFERENCES
Anspaugh, L.R. (2000). Radiation dose to the population of the continental United States from the ingestion of food contaminated with radionuclides from nuclear tests at the Nevada Test Site. Report to National Cancer Institute #263-MQ-912901. Beck, C. M., & Green, H. L. (2004). Oral History: Al O’Donnell. Desert Research Institute: Las Vegas, NV. Black, S. C., Smith, A. E., & Costa, C. F. (1986). Off-site monitoring for the Mighty Oak nuclear test. NV Operations Office: Las Vegas, NV. Bobb, B. E. (1999). Cohort differences in the acculturation of a Native American Indian population: Individualism/collectivism, locus of control, attributional style, epistemological assumptions, and spirituality. Unpublished doctoral dissertation. The Pennsylvania State University. Cheney, G. (1996). They never knew: The victims of nuclear testing. Impact: NY:NY. Clemmer, R. O. (1972). Directed resistance to acculturation: A comparative study of the effects of non-Indian jurisdiction on Hopi and Western Shoshone communities. Unpublished doctoral dissertation, University of Illinois, Urbana-Champaign. 73-17, 158. Crandall, LL., & Dames, T.R. (1951). Report of foundation investigation alternate test site Nye County, Nevada for the U.S. Atomic Energy Commission. Declassified correspondence from Holmes and Narver to Charles Glazbrook, Assistant Chief Engineer. Records of the Atomic Energy Commission. RG-326. National Archives and Records Administration. Pacific Region, Laguna Niguel, CA. Davis, M. G., Flotard, R. D., Fontana, C. A., Hennessey, P. A., Maunu, H. K., Mouck, T. L.Mullen, A. A., Sells, M. D. et al. (1999). Offsite Environmental Monitoring Report: Radiation monitoring around United States nuclear test areas, calendar year 1997. U.S. EPA: Las Vegas, NV. Douglas, G.S. (1983). A community monitoring program surrounding the Nevada Test Site. U.S. EPA: Las Vegas, NV. Fradkin, P. L. (2004). Fallout. Johnson Books: Boulder, CO. Franks, L M. (2001). State of Nevada, Department of Human Services Health Division to Kenneth Hoar, Director Environmental, Safety and Health Division, National Nuclear Security Administration, NV Operations Office.
41
Frohmberg, E. (1994). CCRI Findings on a preliminary report on radiation exposure to Western Shoshone (and Paiute) communities from fallout and traditional foods. CCRI Update. Frohmberg, E., Goble, R., Sanchez, V., & Quigley, D. (2000). The assessment of radiation exposures in Native American communities from nuclear weapons testing in Nevada. Risk Analysis, 20(1), 101-111. http:www.cad.med.utah.edu/Papers/SU_1/SUHP.html http://www.nv.doe.gov.emprograms/biota/evaluating.htm http://www.nv.doe.gov/emprograms/biota/monitoring.htm http://www.nv.doe.gov/emprograms/radiation/radoffsite.htm http://www.nv.doe.ov/nts.htm http://www.epa.gov/radiation/radionuclides/americium.htm http://www.epa.gov/radiation/radionuclides/cesium.htm http://www.epa.gov/radiation/radionuclides/plutonium.htm http://www.epa.gov/radiation/radionuclides/strontium.htm http://www.epa.gov/radiation/radionuclides/tritium.htm http://www.mtafund.org.htm Izell, K. D. (2001). Department of Energy communication to Robert V. Abbey, State Director, Bureau of Land Management. Miller, R. L. (1986). Under the cloud: The decades of nuclear testing. Free Press: NY, NY. National Archives (1939). Folder: “Social and economic information for the Yomba Reservation.” Laguna Niguel, CA. National Archives. (1942). Box 163, Folder “Miscellaneous – Yomba Shoshone Reservation.” San Bruno, CA. Rusco, E. R. (1991). The Indian Reorganization Act in Nevada: Creation of the Yomba Reservation. Journal of California and Great Basin Anthropology, 13(1), 77-94.

42
Schoengold, C. R., DeMarre, M. E., & Kirkwood, E. M. (1996). Radiological effluents released from US continental tests 1961 through 1992. US DOE: Las Vegas, NV. Smith, D. D., & Andrews, V. E. (1981). Selected radiation in animal tissues in Nevada: Sr 90 and Cs 137 measurements from 1956 to 1977. U.S. DOE: Las Vegas, NV. Smith, D. D., Giles, K.R., & Bernhardt, D. E. (1981). Animal investigation program 1979 annual report: Nevada Test Site and Vicinity. US DOE: Las Vegas, NV. Tonopah Archives. Folder “Yomba Shoshone Tribe.” U.S. Department of Energy. (1993). NTS: A historical perspective. NTS News and Views. U.S. Department of Energy. (1994). United States nuclear tests: July 1945 through September 1992 (DOE/NV 209-Rev. 14). U.S. DOE, Nevada Operations Office: Las Vegas, NV. U.S. Department of Energy. (2000). United States nuclear tests: July 1945 through September 1992 (DOE/NV 209-Rev. 15). U.S. DOE, Nevada Operations Office: Las Vegas, NV.

43
APPENDIX
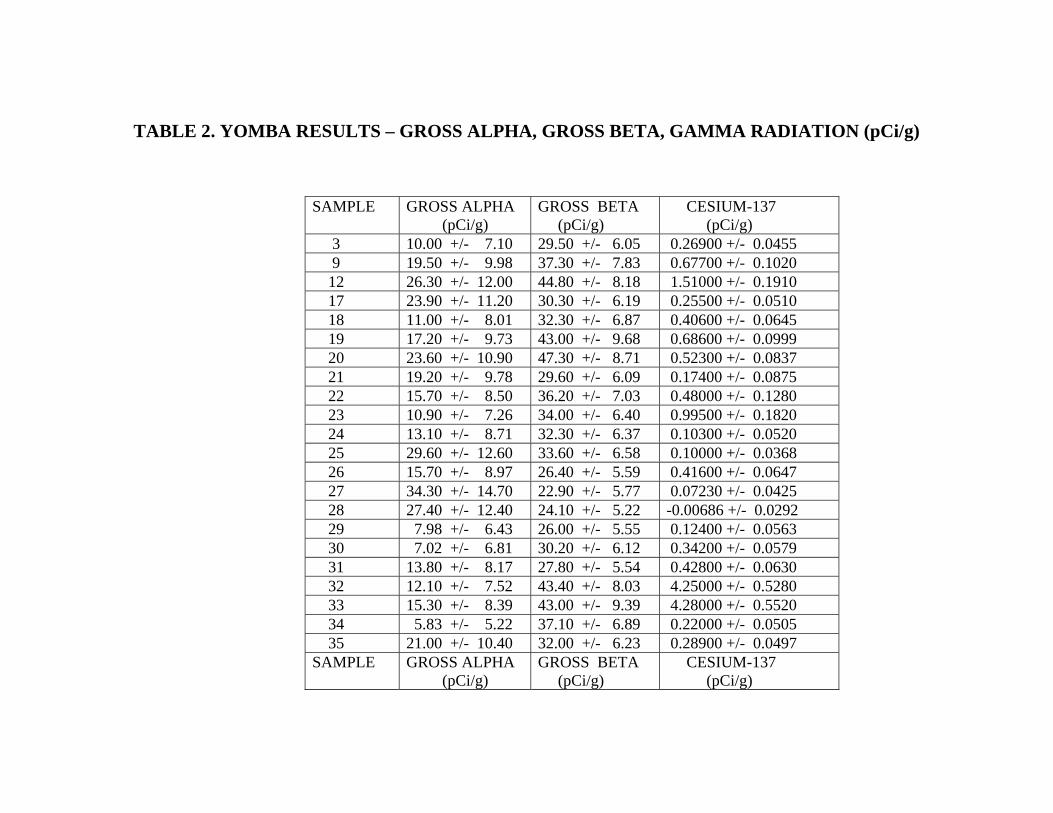
TABLE 2. YOMBA RESULTS – GROSS ALPHA, GROSS BETA, GAMMA RADIATION (pCi/g)
SAMPLE
GROSS ALPHA (pCi/g)
GROSS BETA (pCi/g)
CESIUM-137 (pCi/g)
3 10.00 +/- 7.10 29.50 +/- 6.05 0.26900 +/- 0.0455 9 19.50 +/- 9.98 37.30 +/- 7.83 0.67700 +/- 0.1020 12 26.30 +/- 12.00 44.80 +/- 8.18 1.51000 +/- 0.1910 17 23.90 +/- 11.20 30.30 +/- 6.19 0.25500 +/- 0.0510 18 11.00 +/- 8.01 32.30 +/- 6.87 0.40600 +/- 0.0645 19 17.20 +/- 9.73 43.00 +/- 9.68 0.68600 +/- 0.0999 20 23.60 +/- 10.90 47.30 +/- 8.71 0.52300 +/- 0.0837 21 19.20 +/- 9.78 29.60 +/- 6.09 0.17400 +/- 0.0875 22 15.70 +/- 8.50 36.20 +/- 7.03 0.48000 +/- 0.1280 23 10.90 +/- 7.26 34.00 +/- 6.40 0.99500 +/- 0.1820 24 13.10 +/- 8.71 32.30 +/- 6.37 0.10300 +/- 0.0520 25 29.60 +/- 12.60 33.60 +/- 6.58 0.10000 +/- 0.0368 26 15.70 +/- 8.97 26.40 +/- 5.59 0.41600 +/- 0.0647 27 34.30 +/- 14.70 22.90 +/- 5.77 0.07230 +/- 0.0425 28 27.40 +/- 12.40 24.10 +/- 5.22 -0.00686 +/- 0.0292 29 7.98 +/- 6.43 26.00 +/- 5.55 0.12400 +/- 0.0563 30 7.02 +/- 6.81 30.20 +/- 6.12 0.34200 +/- 0.0579 31 13.80 +/- 8.17 27.80 +/- 5.54 0.42800 +/- 0.0630 32 12.10 +/- 7.52 43.40 +/- 8.03 4.25000 +/- 0.5280 33 15.30 +/- 8.39 43.00 +/- 9.39 4.28000 +/- 0.5520 34 5.83 +/- 5.22 37.10 +/- 6.89 0.22000 +/- 0.0505 35 21.00 +/- 10.40 32.00 +/- 6.23 0.28900 +/- 0.0497 SAMPLE
GROSS ALPHA (pCi/g)
GROSS BETA (pCi/g)
CESIUM-137 (pCi/g)

45
40 24.40 +/- 9.00 44.9 +/- 7.74 0.4600 +/- 0.1570 41 15.40 +/- 6.45 36.6 +/- 7.50 0.3850 +/- 0.1400 42 9.87 +/- 5.09 45.1 +/- 7.56 0.2100 +/- 0.0787 43 9.39 +/- 4.96 39.4 +/- 6.99 0.1340 +/- 0.0968 44 19.70 +/- 7.92 42.8 +/- 7.28 0.3090 +/- 0.1870 45 20.30 +/- 7.51 43.8 +/- 9.00 0.1910 +/- 0.1040 46 10.50 +/- 5.16 38.9 +/- 7.01 0.0362 +/- 0.0870 47 23.40 +/- 8.39 43.4 +/- 7.56 0.2630 +/- 0.0913 48 11.80 +/- 5.52 37.7 +/- 6.79 0.2400 +/- 0.1150 49 25.30 +/- 9.26 34.6 +/- 6.32 0.0685 +/- 0.0538 50 8.74 +/- 4.87 40.2 +/- 7.01 0.2520 +/- 0.1130 51 11.70 +/- 5.32 40.2 +/- 7.00 0.2500 +/- 0.1350 52 17.80 +/- 7.03 43.7 +/- 7.47 0.5120 +/- 0.1190 53 18.30 +/- 7.00 37.8 +/- 6.68 0.2780 +/- 0.1340

46
TABLE 3. YOMBA RESULTS – STRONTIUM, TRITIUM, PLUTONIUM 238, 239/240 AMERICIUM-241(pCi/g)
SAMPLE STRONTIUM
(pCi/g) TRITIUM (pCi/g)
PLUTONIUM-238 (pCi/g)
PLUTONIUM-239/240 (pCi/g)
AMERICIUM-241 (pCi/g)
3 0.0725 +/- 0.0671 0.0156000 +/- 0.0193 -0.00192 +/- 0.00225 0.04730 +/- 0.05610 0.00000 +/- 0.04380 9 0.1770 +/- 0.0940 0.0288000 +/- 0.0238 -0.00835 +/- 0.00583 0.10900 +/- 0.10600 0.03360 +/- 0.06770 12 0.4300 +/- 0.1500 0.0110000 +/- 0.0250 0.03540 +/- 0.08110 0.15900 +/- 0.16500 0.09520 +/- 0.13700 17 0.2060 +/- 0.0927 0.0073100 +/- 0.0136 0.03590 +/- 0.07530 0.03400 +/- 0.07520 0.06920 +/- 0.09920 18 0.2220 +/- 0.0986 0.0165000 +/- 0.0165 -0.00537 +/- 0.00495 0.02460 +/- 0.05390 -0.01510 +/- 0.01550 19 0.2440 +/- 0.1030 -0.0094700 +/- 0.0120 0.00000 +/- 0.09920 -0.00324 +/- 0.00465 0.03130 +/- 0.09100 20 0.1410 +/- 0.0761 0.0000567 +/- 0.0190 0.00000 +/- 0.06650 0.05420 +/- 0.07750 0.02810 +/- 0.05650 21 0.1520 +/- 0.0788 0.0249000 +/- 0.0478 0.00000 +/- 0.03960 -0.00323 +/- 0.00461 0.09770 +/- 0.08210 22 0.2560 +/- 0.1040 0.0059100 +/- 0.0315 -0.00453 +/- 0.00648 0.00181 +/- 0.00458 -0.00334 +/- 0.00673 23 0.1450 +/- 0.0814 0.0166000 +/- 0.0557 0.00000 +/- 0.06750 0.05500 +/- 0.07860 -0.00317 +/- 0.00638 24 0.0764 +/- 0.0630 -0.0026600 +/- 0.0267 0.00000 +/- 0.08840 -0.00721 +/- 0.01030 0.07790 +/- 0.04380 25 0.1070 +/- 0.0712 -0.0016300 +/- 0.0106 0.00000 +/- 0.09340 0.03810 +/- 0.07670 -0.01730 +/- 0.02050 26 0.1800 +/- 0.0812 0.0269000 +/- 0.0463 0.01980 +/- 0.05030 0.04700 +/- 0.07090 0.11500 +/- 0.11800 27 0.0624 +/- 0.0608 -0.0133000 +/- 0.0227 0.02350 +/- 0.04720 0.00000 +/- 0.05750 -0.00282 +/- 0.00567 28 0.0572 +/- 0.0676 -0.0191000 +/- 0.0206 0.00000 +/- 0.04040 -0.00330 +/- 0.00470 0.01820 +/- 0.04080 29 0.0632 +/- 0.0632 -0.0008760 +/- 0.0341 0.00000 +/- 0.06160 -0.02510 +/- 0.05050 0.02440 +/- 0.06170 30 0.1830 +/- 0.0828 0.0017100 +/- 0.0173 0.01900 +/- 0.06490 0.02220 +/- 0.06450 0.05410 +/- 0.09730 31 0.0824 +/- 0.0628 -0.0043500 +/- 0.0220 -0.00842 +/- 0.00986 0.02800 +/- 0.05630 0.02110 +/- 0.06130 32 0.9370 +/- 0.2730 0.0320000 +/- 0.0488 0.00000 +/- 0.11200 1.27000 +/- 0.56800 0.21300 +/- 0.21900 33 2.5100 +/- 0.6950 0.0269000 +/- 0.0643 0.05300 +/- 0.10700 0.67700 +/- 0.41900 0.00000 +/- 0.13600 34 0.1320 +/- 0.0738 0.0127000 +/- 0.0224 0.03190 +/- 0.07160 -0.00354 +/- 0.00712 0.10900 +/- 0.13300 35 0.0678 +/- 0.0622 0.0037100 +/- 0.0111 -0.00227 +/- 0.00455 0.00452 +/- 0.06440 -0.00242 +/- 0.00485 SAMPLE STRONTIUM
(pCi/g) TRITIUM (pCi/g)
PLUTONIUM-238 (pCi/g)
PLUTONIUM-239/240 (pCi/g)
AMERICIUM-241 (pCi/g)
40 0.2670 +/- 0.195 0.03680 +/- 0.0228 -0.00635 +/- 0.01280 0.00000 +/- 0.0777 0.056300 +/- 0.07090

47
41 0.1250 +/- 0.173 0.03220 +/- 0.0331 -0.00907 +/- 0.01290 0.04980 +/- 0.0810 0.032700 +/- 0.04660 42 0.2800 +/- 0.194 0.00706 +/- 0.0126 -0.00332 +/- 0.00666 0.01660 +/- 0.0333 -0.000341 +/- 0.00686 43 0.0310 +/- 0.169 0.01930 +/- 0.0163 -0.00346 +/- 0.00695 0.03460 +/- 0.0492 0.013300 +/- 0.03400 44 0.3830 +/- 0.230 0.01280 +/- 0.0179 0.00000 +/- 0.04380 0.14000 +/- 0.0898 0.000000 +/- 0.04340 45 0.1750 +/- 0.177 0.01070 +/- 0.0186 0.01920 +/- 0.03850 0.01920 +/- 0.0384 0.051100 +/- 0.05970 46 0.1390 +/- 0.186 0.03970 +/- 0.0225 0.01620 +/- 0.04150 0.00000 +/- 0.0496 0.013600 +/- 0.03450 47 0.1900 +/- 0.185 0.03530 +/- 0.0205 -0.00727 +/- 0.01040 0.01450 +/- 0.0371 -0.010200 +/- 0.01450 48 0.0597 +/- 0.186 0.02070 +/- 0.0241 -0.00142 +/- 0.00286 0.01630 +/- 0.0358 -0.003400 +/- 0.00683 49 0.1130 +/- 0.178 0.02620 +/- 0.0196 -0.00510 +/- 0.00596 0.02120 +/- 0.0426 0.012600 +/- 0.03220 50 0.1900 +/- 0.186 0.00592 +/- 0.0159 -0.00369 +/- 0.00526 0.04050 +/- 0.0658 0.000000 +/- 0.04000 51 0.1530 +/- 0.184 0.01740 +/- 0.0217 -0.00754 +/- 0.04410 0.02010 +/- 0.0605 -0.003410 +/- 0.00685 52 0.1360 +/- 0.177 0.02080 +/- 0.0170 -0.01110 +/- 0.00863 0.05320 +/- 0.0696 0.013300 +/- 0.03400 53 0.1710 +/- 0.177 0.01620 +/- 0.0254 -0.00340 +/- 0.00485 0.01780 +/- 0.0429 0.035800 +/- 0.05110

48
TABLE 4. OFFSITE RELEASES FROM UNDERGROUND TESTING AT NTS (Adapted from Schoengold, et al. 1996) TEST DATE LOCATION CLOUD
DIRECTION MAX AIR ACTIVITY
MAX DISTANCE ISOTOPES IDENTIFIED
Small Boy 07/14/62 Area 5 Atmospheric
NE, crossed Hwy 93, S of Alamo, NV
140,000 pCi/cm gross beta at Elko, NV
0.02 mR/h at 7 mi S of Parowan, UT on Hwy 143
Zr-95/Nb-95, RU-103, I-131, Te-132, Ba-140/La-140
Little Feller I 07/17/62 Area 18 Atmospheric
N 4,200 pCi/cm gross beta at Twin Springs, NV
0.1 mR/h at Lockes, NV Zr-95/Nb-95, Ru-103, I-131
Bandicoot 10/19/62 U3bj N for lower part of cloud, SSW for upper portion over Mercury, Cactus Springs, Indian Springs, Lathrop Wells, grew to 9 miles wide when it crossed Hwy 95, SW to Los Angeles
52,000 pCi/cm gross beta at Death Valley Junction, CA
0.01 mR/h at 14.5 mi S of Shoshone, CA
Zr-95/Nb-95, Ru-103, I-131, -133, -135, Te-132, Ba-140/La-140
Double Tracks 05/15/63 NAFR surface N/A 12.1 disintegrations/min Per cubic meter at Scotty’s Junction
Alpha detected in Beatty, NV and Scotty’s Junction, NV
Test of Plutonium Dispersal
Clean Slate I 05/25/63 NAFR surface N/A 0.32 disintegrations/min per cubic meter alpha at Lathrop Wells, NV
Hiko, Lund, Mesquite, Pioche, Tonopah, Warm Springs, Las Vegas, Furnace Creek, Lathrop Wells small concentrations
Test of Plutonium Dispersal Pu-239 component
Yuba 06/05/63 U12b.10 N/A No fresh fission products detected
Two miles offsite at Lathrop Wells, NV
Kr-88, I-131, -133, -135, Xe-135, Cs-138
Clean Slate III 06/09/63 NAFR surface N/A Not above background 47.8+/-1.5 disintegrations per min per sq ft of Pu-239, -240 at Springdale, UT
Eagle 12/12/63 U9av SW over Death Valley and Central S. CA, about 140 mi from point of release
24 pCi/cm gross beta at Death Valley Junction
Death Valley Junction Sr-89, -91, -92, Mo-99, Ru-103, I-132, -133, -134, -135, Te-132, Xe-135, Cs-138, Ba-140/La-140
Oconto 01/23/64 U9ay N No gross beta above normal levels
Hancock Summit, NV Xe-133, -135, I-131, -133
Pike 03/13/64 U3cy SE over Cactus Springs and Las Vegas, over CA and AZ next day
76,000 pCi/cm gross beta 5 mi W of Cactus Springs
0.03 mR/h at 17.8 mi SE of junction of Boulder Hwy and Sahara, Las Vegas, NV; fresh fission products 341 mi from ground zero
I-131, -133, -135

49
TEST DATE LOCATION CLOUD
DIRECTION MAX AIR ACTIVITY
MAX DISTANCE ISOTOPES IDENTIFIED
Alva 08/19/64 U2j N No fresh fission products detected
St. George, UT Xe-133, -135, I-131, -133
Drill (Source-Lower)
12/05/64 U2ai S, East of Lathrop Wells, NV
0.62 pCi/cm gross beta Death Valley Junction, CA; 1.6 pCi/cm Lathrop Wells
0.01 mR/h at 17 mi south of Lathrop Wells, NV, Hwy 29
Mn-56, Kr-87, -88. Rb-88, I-131, -133, -135, Te-132, Xe-133, Xe-133m, -135, -138, Cs-137, -138, La-142
Parrot 12/16/64 U3dk N over Hwy 25, NV. Leak lasted for 8 days
74 pCi/cm gross beta at 12 mi NW of Hancock Summit, NV
0.015 mR/h at 22 mi S of Sunnyside, NV on Sunnyside Rd
Kr-85m, I-131, -133, -135, Xe-135, -138. Cs-138, traces of iodine
Sulky 12/18/64 U18d N, between Clark Station and Nyala, NV. Lasted for 35 days
No fresh fission products detected
0.02 mR/h on Hwy 6, 19 mi W of Lockes, NV
Kr-85m, -87, -88, Sr-89, -91, Y-91, I-131, -132, -133, -134, -135, Xe-133, -135, -138, Cs-138, Ba-139, Ba-140
Alpaca 02/12/65 U2a S to Hwy 95 19 pCi/cm gross beta at Barstow
0.004 mR/h at Johnnie’s Mine, NV
Kr-89, Sr-89, Rb-89, I-131, -133m -135, Xe-133, -135, -137, -138, Cs-137, -138
Palanquin 04/14/65 U20k N to Pine Creek Ranch, NV 23,000 pCi.cm gross beta Clark Station, NV, 87,000 pCi/cm at Hwy 6, 8 mi E of Tonopah Test Range Road
0.03 mR/h at Council ID Sr-91, Y-91m, Zr-95/Nb-95, Zr-97/Nb-97, Mo-99, Tc-99, I-131, -133, -135, Xe-135, Ba-140/La-140
Tee 05/07/65 U2ab S to Hwy 95 28 pCi/cm gross beta 4 mi E of junction Hwy 95 and Mercury turnoff
0.05 mR/h at 14 mi S of Mercury turnoff of Hwy 95
Na-24, Kr-87, -88, -91, Sr-91, Sb-122, -124, I-131, -133, -135, I-132/Te-132, Xe-133, -135, -139, -140, Cs-138, Ba-139, Ba-140
Diluted Waters 06/16/65 U5b NE to Hwy 25 7.6 pCi/cm gross beta Nyala, NV
0.02 mR/h off Test Range Complex
Mo-99, Ru-103, -105, I-131, -133, -134, -135, Te-132, Xe-135, Cs-138, Ba-139, Ba-140/La-140, Ce-141, kryptons
Red Hot 03/05/66 U12g.06 NE 0.69 pCi/cm gross beta Elko, NV
Not above background at ground level, activity in Dubuque, IA
Krypton, xenons, I-131, -133, -135
Fenton 04/23/66 U2m Releases 24.4 days Fresh fission products not detected
Detected by aerial monitoring at Baker, CA
I-131, -133, -135, Xe-133, -135

50
TEST DATE LOCATION CLOUD
DIRECTION MAX AIR ACTIVITY
MAX DISTANCE ISOTOPES IDENTIFIED
Pin Stripe 04/25/66 U11b NE, winds shifted by 4/27 and radiation detected in Indio, CA
25,000 pCi/cm gross beta at Ash Springs, NV; 50,000 pCi/cm 6.5 mi W of Hancock Summit, NV
0.05 mR/h at Pioche, NV Kryptons, xenons, I-131, -133, -135
Double Play 06/15/66 U16a.03 NE about 200 mi 0.83 pCI/cm gross beta at Hiko, NV
None above background level Noble gases, radioiodides
Derringer 09/12/66 U5i NE about 150 mi No fresh fission products detectable
0.003 mR/h at Hancock Summit, NV and 10 mi SE of Coyote Summit, NV
I-131, -133, -135, kryptons, xenons
Nash 01/19/67 U2ce SW 2.6 pCi/cm gross beta Nyala, NV (attributed to Chinese test 12/27/66
0.01 mR/h Diablo Mainenance Station, NV
Kr-87, -88, I-131, -133, -135, Xe-133, -135
Midi Mist 06/26/67 U12n.02 N No fresh fission products detectable
N, toward E side of crest of Belted Range, just off NTS
Kr-85, -88, Rb-88, I-131, -133, -135, Xe-133, -135
Umber 06/29/67 U3em SW, tracked 90-100 mi 0.25 pCi/cm gross beta 10 mi E of Lathrop Wells, NV
0.03 to 0.1 mR/h at Death Valley Junction and Shoshone, CA
I-131, -133, -135, Xe-133, -135
Door Mist 8/31/67 U12g.07 N, tracked 60 mi 0.08 pCi/cm gross beta Diablo, NV
0.003 mR/h Clark Station, NV Ru-103, -106, Rh-106, I-131, -133, -135, Xe-135
Hupmobile 01/18/68 U2y SW, tracked to Death Valley, CA
1,100 pCi/cm gross beta Dansby’s Ranch, NV
0.7 mR/h near Dansby’s Ranch in Amargosa Farm Area, NV
Kr-87, -88, Rb-88, I-131, -133, -134, -135, Xe-133, -135
Cabriolet 01/26/68 U201 N, into S. ID, NE to Big Timber Mountain, MT
33,000 pCi/cm gross beta Stone Cabin Ranch, NV
Wells, NV Kr-87, -88, Rb-88, Sr-91, I-131, -133, -134, -135, Te-132, Xe-133, -135, W-187
Buggy-A, -B, -C, -D, -E
03/12/68 U30a-e N, tracked to MT 12,000 pCi/cm gross beta Warm Springs, NV
0.15 mR/h Hwy 40 Wells, NV Sr-91, I-131, -133, -135, Te-132, Ba-140, W-187
Schooner 12/08/68 U20u NE across UT, CO; base went N to ID, E across MT, ND
280,000 pCi/cm W-187 Clark Station, NV
0.2 mR/h Delta, UT Mn-54, Ru-106, I-131, Cs-137, W-181, -187
Pod-A, -D 10/29/69 U2ck, U2cj
S, tracked 35 mi No fresh fission products detected
4 mi N of Pahrump I-131, -133, -135, Xe-135, Cs-138
Scuttle 11/13/69 U2bh N/A No fresh fission products detected
5 mi SE of Lathrop Wells, NV Rb-88, I-133, Xe-135, Cs-138
51
TEST DATE LOCATION CLOUD DIRECTION
MAX AIR ACTIVITY
MAX DISTANCE ISOTOPES IDENTIFIED
Snubber 04/21/70 U3ev NE, tracked 90 mi from ground zero
6.0 pCi/cm gross beta Coyote Summit, NV
Ground tracked to Koyne’s Mill, NV; by air to N. Central AZ about 200 miles
I-131, -133, -135, Xe-133, -135, -138
Mint Leaf 05/05/70 U12t.01 E 6,000 pCi/cm Xe-135 on Hwy 25 NV, go gross beta
0.02 mR/h at Queen City Summit, NV
Kr-85m, I-131, -133, -135, Xe-133, -133m, -135
Diagonal Line 11/24/71 U11g SW toward Amargosa Desert, NV
Fresh fission products not detected
6 mi SE of Lathrop Wells, NV Kr-85m, -87, -88, I-131, -132, -133, -135, Xe-131m, -133, -133m, -135
Riola 09/25/80 U2eq N/A 34 pCi/cm Xe-133 and 360 pCi/cm Xe-135 at Lathrop Wells, NV
None above background levels Kr-85m, -87, -88, Xe-133, -133m, -135, -135m, tritium, tritiated water
Misty Rain 04/06/85 U12n.17 N/A 47+/-10 pCi/cm Xe-133 at Reed Ranch Road, NV; 11+/-5 pCi Xe-133 at Rachel, NV
None above background levels Xe-133, Xe-133m, Xe-135
Glencoe 03/22/86 U4i N/A N/A 84 pCi/cm if Xe-133 at Lathrop Wells, NV
Xe-133, -135, I-131, -133
Mighty Oak 04/10/86 U12t.08 N/A 430+/-15 pCi/cm Xe-133 Medlins Ranch, NV
None above background levels Kr-85, I-131, Xe-133

52