radiobiology behind dose fractionation
TRANSCRIPT

www.rwww.radbioladbiol.ucla.edu.ucla.edu
WMcB2009
The Radiobiology Behind Dose The Radiobiology Behind Dose Fractionation Fractionation
Bill McBrideBill McBrideDept. Radiation OncologyDept. Radiation Oncology
David Geffen School MedicineDavid Geffen School MedicineUCLA, Los Angeles, Ca.UCLA, Los Angeles, Ca.
[email protected]@mednet.ucla.edu
www.rwww.radbioladbiol.ucla.edu.ucla.edu
WMcB2009
ObjectivesObjectives• To understand the mathematical bases behind survival curvesTo understand the mathematical bases behind survival curves• Know the linear quadratic model formulationKnow the linear quadratic model formulation• Understand how the isoeffect curves for fractionated radiation Understand how the isoeffect curves for fractionated radiation
vary with tissue and how to use the LQ model to change dose vary with tissue and how to use the LQ model to change dose with dose per fractionwith dose per fraction
• Understand the 4Rs of radiobiology as they relate to clinical Understand the 4Rs of radiobiology as they relate to clinical fractionated regimens and the sources of heterogeneity that fractionated regimens and the sources of heterogeneity that impact the concept of equal effect per fractionimpact the concept of equal effect per fraction
• Know the major clinical trials on altered fractionation and their Know the major clinical trials on altered fractionation and their outcomeoutcome
• Recognize the importance of dose heterogeneity in modern Recognize the importance of dose heterogeneity in modern treatment planningtreatment planning

www.rwww.radbioladbiol.ucla.edu.ucla.edu
WMcB2009
Relevance of Radiobiology to Clinical Relevance of Radiobiology to Clinical Fractionation ProtocolsFractionation Protocols
Conventional treatment: Conventional treatment:
Tumors are generally irradiated with 2Gy Tumors are generally irradiated with 2Gy dose per fraction dose per fraction delivered daily delivered daily to a more or less homogeneous field over a 6 week to a more or less homogeneous field over a 6 week time periodtime period to a to a specified specified total dosetotal dose
The purpose of convenntional dose fractionation is to increase dose to the The purpose of convenntional dose fractionation is to increase dose to the tumor while PRESERVING NORMAL TISSUE FUNCTIONtumor while PRESERVING NORMAL TISSUE FUNCTION
• Deviating from conventional fractionation protocol impacts outcomeDeviating from conventional fractionation protocol impacts outcome• How do you know what dose to giveHow do you know what dose to give; for example if you want to change ; for example if you want to change dose per dose per
fraction fraction or or timetime? Radiobiological modeling provide the guidelines. It uses? Radiobiological modeling provide the guidelines. It uses– Radiobiological principles derived from preclinical dataRadiobiological principles derived from preclinical data– Radiobiological parameters derived from clinical altered fractionation protocolsRadiobiological parameters derived from clinical altered fractionation protocols
• hyperfractionation, accelerated fractionation, some hypofractionation scheduleshyperfractionation, accelerated fractionation, some hypofractionation schedules
The number of non-homogeneous treatment plans (IMRT) and extreme hypofractionated The number of non-homogeneous treatment plans (IMRT) and extreme hypofractionated treatments are increasing. Do existing models cope? treatments are increasing. Do existing models cope?
www.rwww.radbioladbiol.ucla.edu.ucla.edu
WMcB2009
In theory, knowing relevant radiobiological parameters In theory, knowing relevant radiobiological parameters one day one day may predict the response formay predict the response for• Dose given in a single or a small number of fractions Dose given in a single or a small number of fractions
• SBRT, SRS, SRT, HDR or LDR brachytherapy, protons, SBRT, SRS, SRT, HDR or LDR brachytherapy, protons, cyberknife, gammaknife cyberknife, gammaknife
• Non-uniform dose distributions optimized by IMRT Non-uniform dose distributions optimized by IMRT • e.g. dose e.g. dose ““paintingpainting”” of radioresistant tumor subvolumes of radioresistant tumor subvolumes
• Combination therapies with chemo- or biological agentsCombination therapies with chemo- or biological agents• Different RT options when tailored by molecular and Different RT options when tailored by molecular and
imaging theragnosticsimaging theragnostics• If you know the molecular profile and tumor phenotype, can you If you know the molecular profile and tumor phenotype, can you
predict the best delivery method?predict the best delivery method?
• Biologically optimized treatment planningBiologically optimized treatment planning

www.rwww.radbioladbiol.ucla.edu.ucla.edu
WMcB2009
The First Radiation DosimeterThe First Radiation Dosimeter
prompted the use of dose fractionation

www.rwww.radbioladbiol.ucla.edu.ucla.edu
WMcB2009
In general, history has shown repeatedly that single high doses of radiation do not allow a therapeutic
differential between tumor and critical normal tissues.
Dose fractionation does.
SBRT/SRS often aims at TISSUE ABLATION
www.rwww.radbioladbiol.ucla.edu.ucla.edu
WMcB2009
How to modify a treatment How to modify a treatment scheduleschedule

www.rwww.radbioladbiol.ucla.edu.ucla.edu
WMcB2009
Which are fitted by a Poisson DistributionWhich are fitted by a Poisson DistributionP of x = eP of x = e-m-m.m.mxx/x! /x!
where m = mean # hits, x is a hitwhere m = mean # hits, x is a hit
P survival P survival (when x = 0) (when x = 0)
100 targets 100 hits m=1 e100 targets 100 hits m=1 e-1-1=0.368=0.368
100 targets 200 hits m=2 e100 targets 200 hits m=2 e-2-2=0.137=0.137
100 targets 300 hits m=3 e100 targets 300 hits m=3 e-3-3=0.05=0.05
Modeling Radiation ResponsesModeling Radiation Responses
N.B. Lethal hits in DNA are not really randomly N.B. Lethal hits in DNA are not really randomly distributed, e.g. condensed chromatin is more distributed, e.g. condensed chromatin is more sensitive, but it is a reasonable approximationsensitive, but it is a reasonable approximation
Assumes that ionizing ‘hits’ are random events in space

www.rwww.radbioladbiol.ucla.edu.ucla.edu
WMcB2009
This Gives a Survival Curve Based on a Model This Gives a Survival Curve Based on a Model where one hit will eliminate a single targetwhere one hit will eliminate a single target
• When there is single lethal hit per target When there is single lethal hit per target S.F.= eS.F.= e-1-1 = 0.37 = 0.37
• This is the mean lethal dose DThis is the mean lethal dose D0 0
• DD1010 = 2.3 xD = 2.3 xD00
• In general, S.F. = eIn general, S.F. = e-D/D-D/D00
or LnS.F. = -D/Dor LnS.F. = -D/D00
or S.F. = eor S.F. = e--D D , i.e. D, i.e. D0 0 = 1/= 1/
Where is the slope of the curve and D0 the reciprocal of the slope
DOSE GyDOSE Gy
1.01.0
0.10.1
0.010.01
0.0010.001 DD00
S.F.S.F.
DD1010
0.37
How many logs of cells would be killed How many logs of cells would be killed by 23 Gy if Dby 23 Gy if D0 0 = 1 Gy?= 1 Gy?

www.rwww.radbioladbiol.ucla.edu.ucla.edu
WMcB2009
Mean Inactivation Dose (Do)Mean Inactivation Dose (Do)
• Virus D0 approx. = 1500 Gy• E. Coli D0 approx. = 100 Gy• Mammalian bone marrow cells D0 = 1 Gy• Generally, for mammalian cells D0 = 1-1.5 Gy
Why the differences?
www.rwww.radbioladbiol.ucla.edu.ucla.edu
WMcB2009
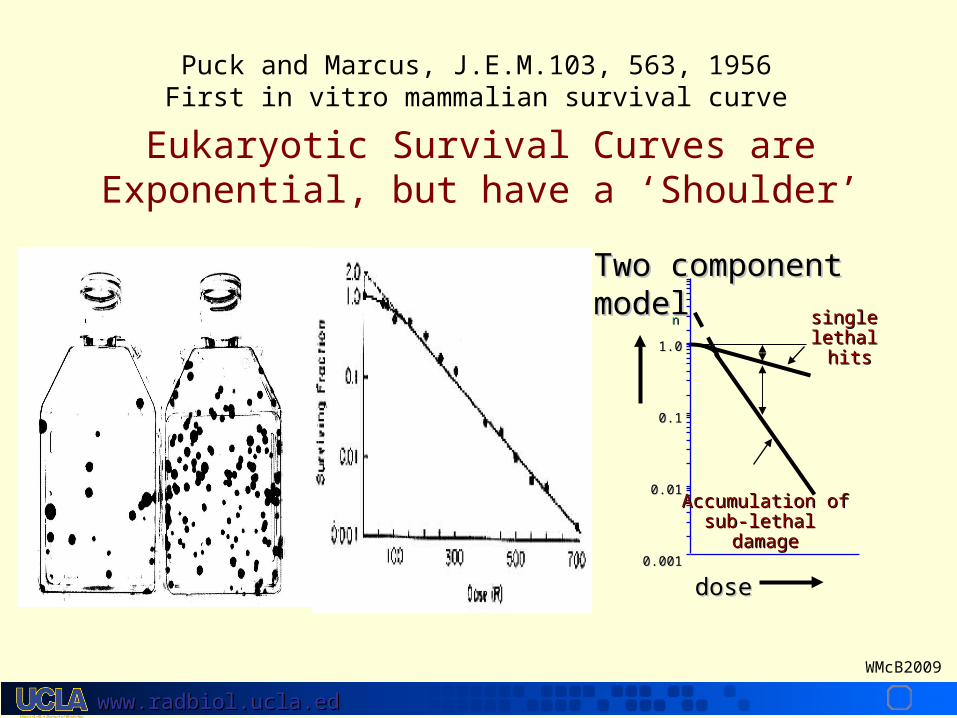
Puck and Marcus, J.E.M.103, 563, 1956First in vitro mammalian survival curve
1.01.0
0.10.1
0.010.01
0.0010.001
Accumulation ofAccumulation ofsub-lethal sub-lethal damagedamage
single single lethal lethal
hitshits
nn
dosedose
Two component modelTwo component model
Eukaryotic Survival Curves are Exponential, but have a ‘Shoulder’

www.rwww.radbioladbiol.ucla.edu.ucla.edu
WMcB2009
DOSE Gy
11DD0 0 = = reciprocal reciprocal initial slopeinitial slope
nnDD00 = = reciprocal reciprocal final slopefinal slope
S.F.
Two Component ModelTwo Component Model
• Two Component Model (or single target, single hit + multi-target (n), single hit)
• S.F.=e-D/1D0[1-(1-e-D/nD0)n]
Single hitSingle hit Accumulated Accumulated damagedamage
1.0
0.1
0.01
0.001
Accumulation of sublethal
damage
single lethal hits
n
ExtrapolationExtrapolationNumberNumber
www.rwww.radbioladbiol.ucla.edu.ucla.edu
WMcB2009
242420201616121288440000
.01.01
.1.1
11
Dose (Gy)Dose (Gy)
S.F.S.F.
Single doseSingle dose
limiting slope/limiting slope/low dose ratelow dose rate
3 fractions3 fractions
5 fractions5 fractions
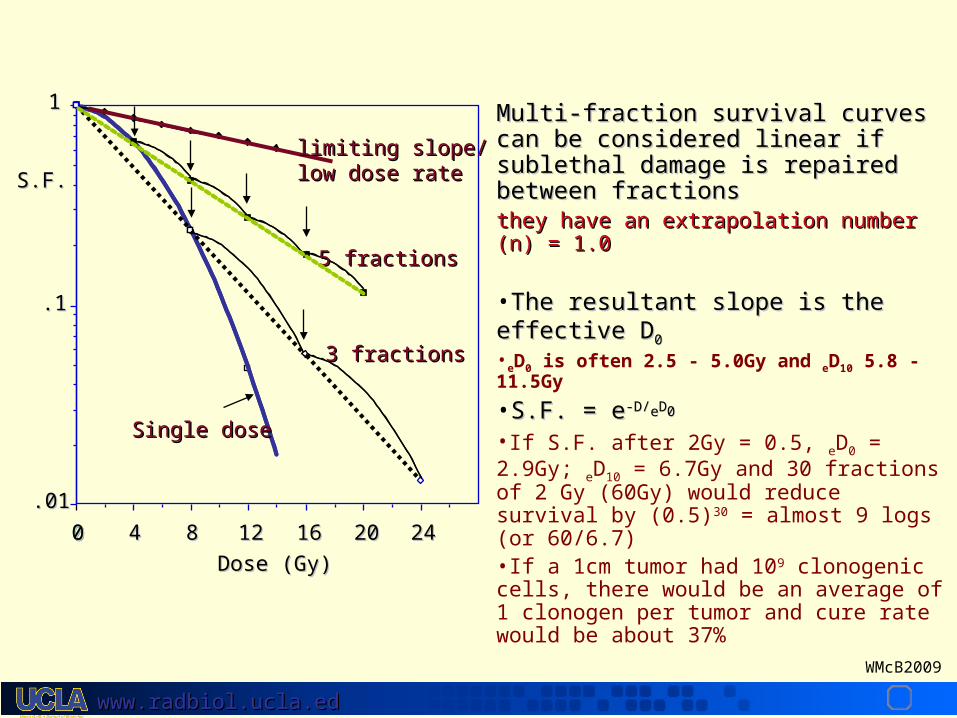
Multi-fraction survival curves can be Multi-fraction survival curves can be considered linear if sublethal damage is considered linear if sublethal damage is repaired between fractions repaired between fractions they have an extrapolation number (n) = 1.0they have an extrapolation number (n) = 1.0
•The resultant slope is the effective DThe resultant slope is the effective D00
•eD0 is often 2.5 - 5.0Gy and eD10 5.8 - 11.5Gy
•S.F. = eS.F. = e-D/-D/eeDD00
•If S.F. after 2Gy = 0.5, eD0 = 2.9Gy; eD10 = 6.7Gy and 30 fractions of 2 Gy (60Gy) would reduce survival by (0.5)30 = almost 9 logs (or 60/6.7)•If a 1cm tumor had 109 clonogenic cells, there would be an average of 1 clonogen per tumor and cure rate would be about 37%

www.rwww.radbioladbiol.ucla.edu.ucla.edu
WMcB2009
S.F. = eS.F. = e--DD
Single lethal hitsSingle lethal hits
S.F. = eS.F. = e-(-(D+D+DD22))
Single lethal hits plus Single lethal hits plus accumulated damageaccumulated damage
• Cell kill is the result of single lethal hits Cell kill is the result of single lethal hits plus accumulated damage from 2 plus accumulated damage from 2 independent sublethal eventsindependent sublethal events
• The generalized formula is E = D + D2
• For a fractionated regimen E= nd( + d) = D ( + d) Where d = dose per fraction and D = total dose
// is dose at which death due to single lethal is dose at which death due to single lethal lesions = death due to accumulation of sublethal lesions = death due to accumulation of sublethal lesions i.e.lesions i.e.D = D = DD22 and D = and D = // in Gy in Gy
S.F.
1.0
0.1
0.01
0.001
DOSE Gy
in Gyin Gy
DD
DD22
Linear Quadratic ModelLinear Quadratic Model

www.rwww.radbioladbiol.ucla.edu.ucla.edu
WMcB2009
• Over 90% of radiation oncologists use the LQ model:Over 90% of radiation oncologists use the LQ model:– it is simple and has a microdosimetric underpinning / is large (> 6 Gy) when survival curve is almost
exponential and small (1-4 Gy) when shoulder is wide– the value quantifies the sensitivity of a
tissue/tumor to fractionated radiation.• But:But:
– Both and vary with the cell cycle. At high doses, S phase and hypoxic cells become more important.
– The / ratio varies depending upon whether a cell is quiescent or proliferative
– The LQ model best describes data in the range of 1 - 6Gy and should not be used outside this range
www.rwww.radbioladbiol.ucla.edu.ucla.edu
WMcB2009
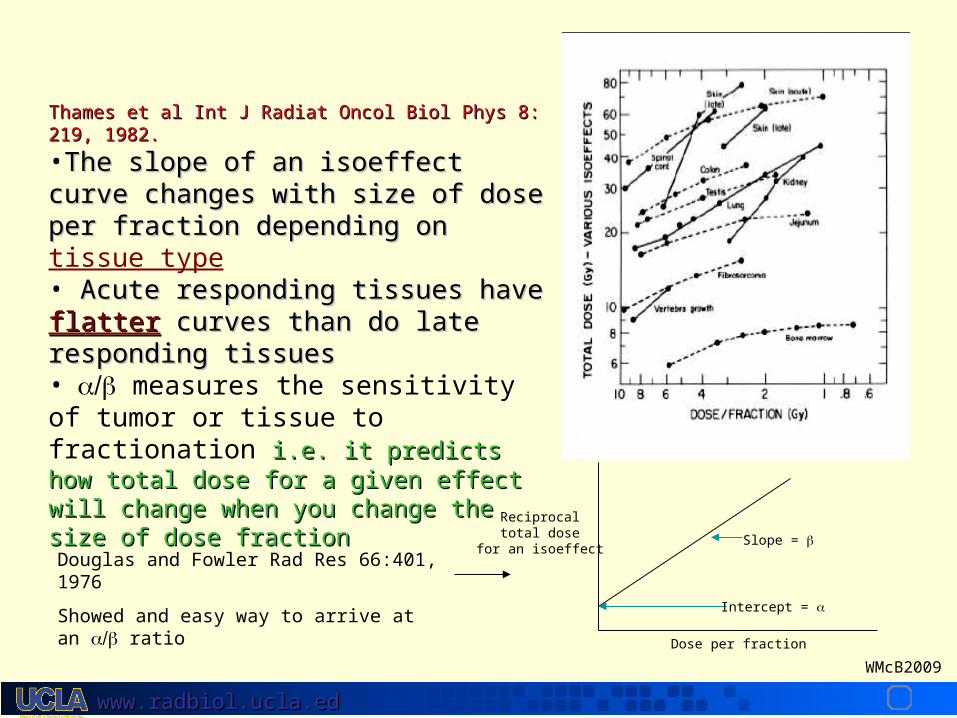
Thames et al Int J Radiat Oncol Biol Phys 8: 219, 1982.Thames et al Int J Radiat Oncol Biol Phys 8: 219, 1982.
•The slope of an isoeffect curve changes The slope of an isoeffect curve changes with size of dose per fraction depending on with size of dose per fraction depending on tissue type• Acute responding tissues have Acute responding tissues have flatterflatter curves than do late responding tissuescurves than do late responding tissues• measures the sensitivity of tumor or tissue to fractionation i.e. it predicts how total i.e. it predicts how total dose for a given effect will change when you dose for a given effect will change when you change the size of dose fractionchange the size of dose fraction
Reciprocaltotal dose
for an isoeffect
Dose per fraction
Intercept =
Slope =
Douglas and Fowler Rad Res 66:401, 1976
Showed and easy way to arrive at an ratio
www.rwww.radbioladbiol.ucla.edu.ucla.edu
WMcB2009
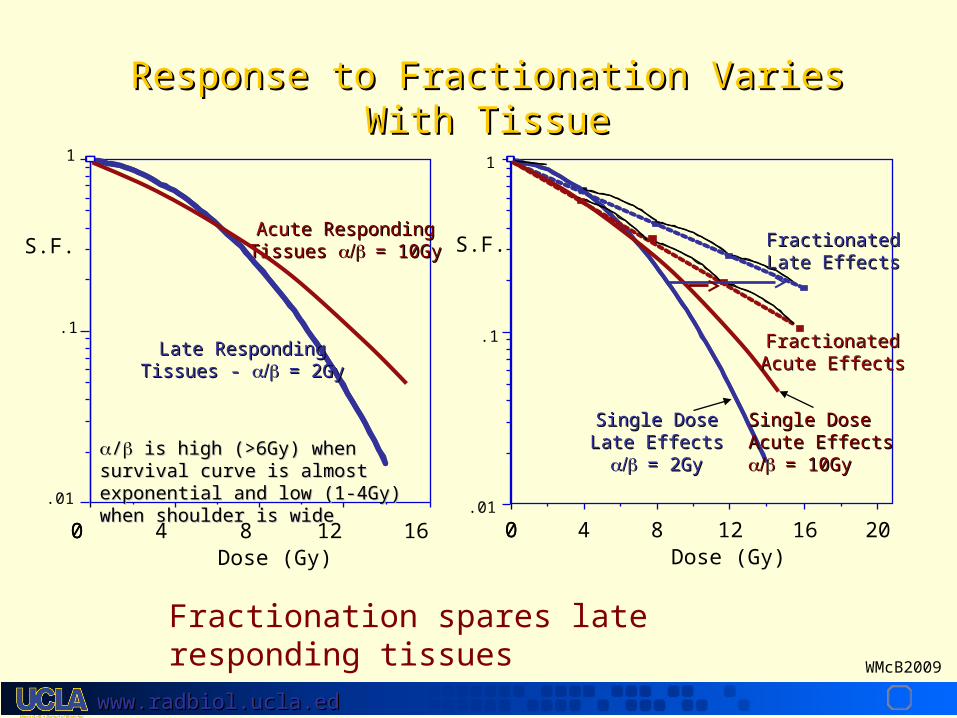
Response to Fractionation Varies With Response to Fractionation Varies With TissueTissue
16128400
.01
.1
1
Dose (Gy)
S.F.
Late RespondingLate RespondingTissues - Tissues - = 2Gy= 2Gy
AcuAcute Respondingte RespondingTissues Tissues = 10Gy= 10Gy
// is high (>6Gy) when survival is high (>6Gy) when survival curve is almost exponential and low curve is almost exponential and low (1-4Gy) when shoulder is wide(1-4Gy) when shoulder is wide
2016128400.01
.1
1
Dose (Gy)
S.F.
Single DoseSingle DoseLate EffectsLate Effects= 2Gy= 2Gy
Single DoseSingle DoseAcute EffectsAcute Effects= 10Gy= 10Gy
FractionatedFractionatedLate EffectsLate Effects
FractionatedFractionatedAcute EffectsAcute Effects
Fractionation spares late responding tissues

www.rwww.radbioladbiol.ucla.edu.ucla.edu
WMcB2009
Sensitivity of Tissue to Dose Sensitivity of Tissue to Dose Fractionation can be estimated by Fractionation can be estimated by
the the ratio ratio

www.rwww.radbioladbiol.ucla.edu.ucla.edu
WMcB2009
What are What are ratios for human ratios for human cancers? cancers?
In fact, for some tumors e.g. prostate, breast, melanoma, soft tissue sarcoma, In fact, for some tumors e.g. prostate, breast, melanoma, soft tissue sarcoma, and liposarcoma and liposarcoma ratios may be moderately low ratios may be moderately low
ProstateProstate
– Brenner and Hall IJROBP 43:1095, 1999 Brenner and Hall IJROBP 43:1095, 1999 • comparing implants with EBRTcomparing implants with EBRT ratio is 1.5 Gy [0.8, 2.2]ratio is 1.5 Gy [0.8, 2.2]
– Lukka JCO 23: 6132, 2005 Lukka JCO 23: 6132, 2005 • Phase III NCIC 66Gy 33F in 45days vs 52.5Gy 20F in 28 daysPhase III NCIC 66Gy 33F in 45days vs 52.5Gy 20F in 28 days• Compatible with Compatible with ratio of 1.12Gy (-3.3-5.6) ratio of 1.12Gy (-3.3-5.6)
BreastBreast– Owen, J.R., et al. Lancet Oncol, 7: 467-471, 2006 and Dewar et al JCO, ASCO Owen, J.R., et al. Lancet Oncol, 7: 467-471, 2006 and Dewar et al JCO, ASCO
Proceedings Part I. Vol 25, No. 18S: LBA518, 2007.Proceedings Part I. Vol 25, No. 18S: LBA518, 2007. • UK START Trial UK START Trial
– 50Gy in 25Fx c.w. 39Gy in 13Fx; or 41.6Gy in 13Fx [or 40Gy in 15Fx (3 wks)]50Gy in 25Fx c.w. 39Gy in 13Fx; or 41.6Gy in 13Fx [or 40Gy in 15Fx (3 wks)]
• Breast Cancer Breast Cancer = 4.0Gy (1.0-7.8) = 4.0Gy (1.0-7.8)• Breast appearance Breast appearance = 3.6Gy; induration = 3.6Gy; induration = 3.1Gy = 3.1Gy
If fractionation sensitivity of a cancer is similar to dose-limiting healthy If fractionation sensitivity of a cancer is similar to dose-limiting healthy tissues, it may be possible to give fewer, larger fractions without tissues, it may be possible to give fewer, larger fractions without
compromising effectiveness or safetycompromising effectiveness or safety

www.rwww.radbioladbiol.ucla.edu.ucla.edu
WMcB2009
What total dose (D) to give if the What total dose (D) to give if the dose/fx (d) is changeddose/fx (d) is changed
NewNew OldOldDDnewnew (d (dnewnew + + ) = D) = Doldold (d (doldold + +))
So, for late responding tissue, what total dose in 1.5Gy So, for late responding tissue, what total dose in 1.5Gy fractions is equivalent to 66Gy in 2Gy fractions?fractions is equivalent to 66Gy in 2Gy fractions?
DDnewnew (1.5+2) = 66 (2 + 2) (1.5+2) = 66 (2 + 2)
DDnewnew = 75.4Gy = 75.4Gy
NB: Small differences in for late responding tissues can make a big difference in estimated D!

www.rwww.radbioladbiol.ucla.edu.ucla.edu
WMcB2009
Biologically Effective Dose (BED)Biologically Effective Dose (BED)
Biologically Biologically Effective DoseEffective Dose Total doseTotal dose
RelativeRelativeEffectivenessEffectiveness
S.F. = eS.F. = e-E -E = e= e-(-(D+D+DD22))
E = nd(E = nd( + + d)d)
E/E/ = nd(1+d/ = nd(1+d/))
35 x 2Gy = B.E.D.of 84Gy35 x 2Gy = B.E.D.of 84Gy1010 and 117Gy and 117Gy33
NOTE: 3 x 15Gy = B.E.D.of 113GyNOTE: 3 x 15Gy = B.E.D.of 113Gy1010 and 270Gy and 270Gy33 Normalized total doseNormalized total dose2Gy2Gy
= BED/RE= BED/RE
= BED/1.2 for = BED/1.2 for of 10Gy of 10Gy
= BED/1.67 for = BED/1.67 for of 3Gyof 3Gy
Equivalent to 162 Gy in 2Gy Fx Equivalent to 162 Gy in 2Gy Fx -unrealistic!-unrealistic!(Fowler et al IJROBP 60: 1241, 2004)(Fowler et al IJROBP 60: 1241, 2004)

www.rwww.radbioladbiol.ucla.edu.ucla.edu
WMcB2009
80807070606050504040303020202020
3030
4040
5050
6060
7070
8080
=30Gy; 4Gy/fx=30Gy; 4Gy/fx
=3Gy; 4Gy/fx=3Gy; 4Gy/fx
=3Gy; 1.5Gy/fx=3Gy; 1.5Gy/fx=30Gy; 1.5Gy/fx=30Gy; 1.5Gy/fx
2.0Gy/fx2.0Gy/fx
D oldD old
D newD new
Note how badly late responding tissues respond to increased dose/fraction

www.rwww.radbioladbiol.ucla.edu.ucla.edu
WMcB2009
Prescribed Dose:25 fractions of 2Gy = 50GyHot spot: 110%Physical dose: 55GyBiological dose: 60.5Gy
Does this Matter?
““Double Double TroubleTrouble””
www.rwww.radbioladbiol.ucla.edu.ucla.edu
WMcB2009
The Linear Quadratic FormulationThe Linear Quadratic Formulation
• Does not work well at high dose/fxDoes not work well at high dose/fx
• Assumes equal effect per fractionAssumes equal effect per fraction

www.rwww.radbioladbiol.ucla.edu.ucla.edu
WMcB2009
N.B. Survival curves may N.B. Survival curves may deviate from L.Q. at low and deviate from L.Q. at low and high dose!!!!high dose!!!!
• Certain cell lines, and tissues, are Certain cell lines, and tissues, are hypersensitive at low doses of 0.05-hypersensitive at low doses of 0.05-0.2Gy. 0.2Gy.
• The survival curve then plateaus over The survival curve then plateaus over 0.05-1Gy0.05-1Gy
• Not seen for all cell lines or tissues, but Not seen for all cell lines or tissues, but has been reported in skin, kidney and has been reported in skin, kidney and lunglung
• At high dose, the model probably does not At high dose, the model probably does not fit data well because Dfit data well because D22 dominates the dominates the equationequation
HT29 cells
Lambin et al. Int J Radiat Biol 63:639 1993

www.rwww.radbioladbiol.ucla.edu.ucla.edu
WMcB2009
The Linear Quadratic FormulationThe Linear Quadratic Formulation
• Does not work well at low or high dose/fxDoes not work well at low or high dose/fx
• Assumes equal effect per fractionAssumes equal effect per fraction

www.rwww.radbioladbiol.ucla.edu.ucla.edu
WMcB2009
RedistributionRedistribution
RepairRepair
RepopulationRepopulation
700R 1500R
4Rs OF DOSE FRACTIONATION4Rs OF DOSE FRACTIONATION
• Assessed by varying the Assessed by varying the time between 2 or more time between 2 or more doses of radiationdoses of radiation

www.rwww.radbioladbiol.ucla.edu.ucla.edu
WMcB2009
4Rs OF DOSE FRACTIONATION4Rs OF DOSE FRACTIONATION
These are radiobiological mechanisms that impact the These are radiobiological mechanisms that impact the response to a fractionated course of radiation therapyresponse to a fractionated course of radiation therapy
• Repair of sublethal damageRepair of sublethal damage– spares late responding normal tissue preferentially spares late responding normal tissue preferentially
• Redistribution of cells in the cell cycleRedistribution of cells in the cell cycle– increases acute and tumor damage, no effect on late responding increases acute and tumor damage, no effect on late responding
normal tissue normal tissue
• RepopulationRepopulation– spares acute responding normal tissue, no effect on late effects,spares acute responding normal tissue, no effect on late effects,
– danger of tumor repopulation danger of tumor repopulation
• ReoxygenationReoxygenation– increases tumor damage, no effect in normal tissuesincreases tumor damage, no effect in normal tissues

www.rwww.radbioladbiol.ucla.edu.ucla.edu
WMcB2009
RepairRepair
• ““RepairRepair”” between fractions should be complete - N.B. we are between fractions should be complete - N.B. we are dealing with tissue recovery rather than DNA repairdealing with tissue recovery rather than DNA repair– Correction for incomplete repair is possible (Thames)Correction for incomplete repair is possible (Thames)
• In general, time between fractions for most tissues should be >6 In general, time between fractions for most tissues should be >6 hourshours
• Some tissues, such as CNS, recover slowly making b.i.d. Some tissues, such as CNS, recover slowly making b.i.d. treatment inadvisabletreatment inadvisable
• Bentzen - Radiother Oncol 53, 219, 1999 Bentzen - Radiother Oncol 53, 219, 1999 – CHART analysis HNC showed that late morbidity was less than CHART analysis HNC showed that late morbidity was less than
would be expected assuming complete recovery between would be expected assuming complete recovery between fractionsfractions
– Is the T1/2 for recovery for late responding normal tissues 2.5-Is the T1/2 for recovery for late responding normal tissues 2.5-4.5hrs? 4.5hrs?

www.rwww.radbioladbiol.ucla.edu.ucla.edu
WMcB2009
Regeneration in Normal TissuesRegeneration in Normal Tissues
• The lag time to regeneration varies with the tissue The lag time to regeneration varies with the tissue • In acute responding tissues,In acute responding tissues,
– Regeneration has a considerable sparing effectRegeneration has a considerable sparing effect
• In human mucosa, regeneration starts 10-12 days into a 2Gy Fx In human mucosa, regeneration starts 10-12 days into a 2Gy Fx protocol and increases tissue tolerance by at least 1Gy/dyprotocol and increases tissue tolerance by at least 1Gy/dy
– Prolonging treatment time has a sparing effect Prolonging treatment time has a sparing effect
– As treatment time is reduced, acute responding tissues become As treatment time is reduced, acute responding tissues become dose-limitingdose-limiting
• In late responding tissues,In late responding tissues, – Prolonging overall treatment time beyond 6wks has little effect, butProlonging overall treatment time beyond 6wks has little effect, but
prolonging time to retreatment may increase tissue toleranceprolonging time to retreatment may increase tissue tolerance

www.rwww.radbioladbiol.ucla.edu.ucla.edu
WMcB2009
Human SCC head and neckHuman SCC head and neck
4 weeks to start of accelerated repopulation. 4 weeks to start of accelerated repopulation. Thereafter T1/2 of 4 days = loss of 0.6Gy per dayThereafter T1/2 of 4 days = loss of 0.6Gy per day
Withers, H.R., Taylor, J.M.G., and Maciejewski, B.
Acta Oncologica 27:131, 1988
TotalTotalDoseDose
(2 Gy equiv.)(2 Gy equiv.)
Treatment DurationTreatment Duration
local controllocal control
no local controlno local control
7070
5555
4040
T2 T3T2 T3
Repopulation in Tumor TissueRepopulation in Tumor Tissue
Hermens and Barendsen, EJC 5:173, 1969
Treatment breaks are often “bad”
Rat rhabdosarcomaRat rhabdosarcoma
www.rwww.radbioladbiol.ucla.edu.ucla.edu
WMcB2009
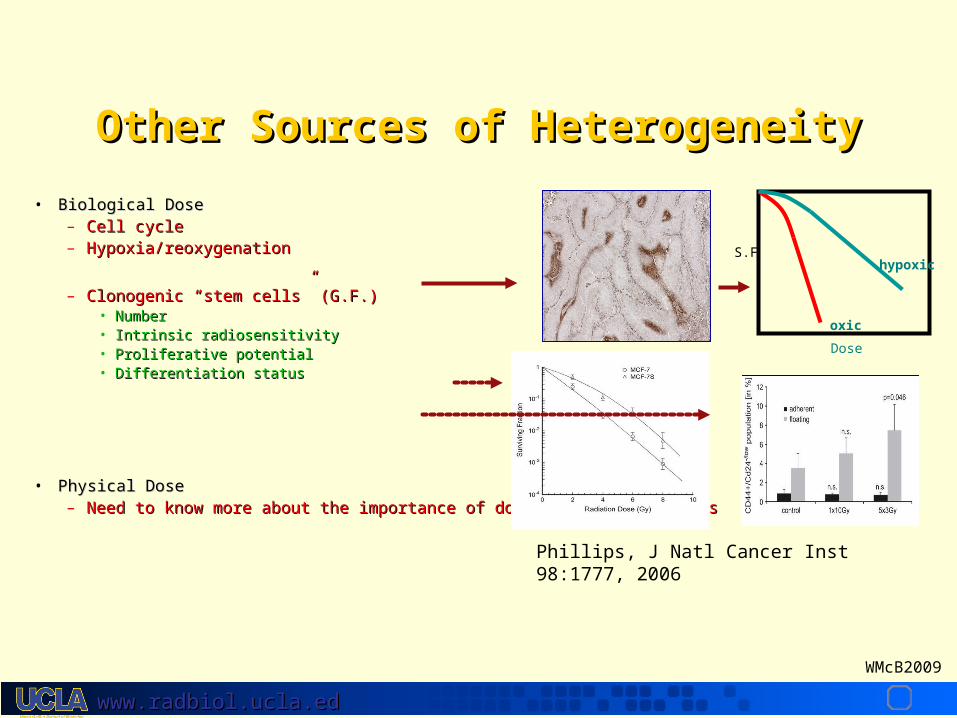
Other Sources of HeterogeneityOther Sources of Heterogeneity
• Biological DoseBiological Dose– Cell cycleCell cycle– Hypoxia/reoxygenation Hypoxia/reoxygenation
– Clonogenic Clonogenic ““stem cellsstem cells”” (G.F.) (G.F.) • NumberNumber• Intrinsic radiosensitivityIntrinsic radiosensitivity• Proliferative potentialProliferative potential• Differentiation statusDifferentiation status
• Physical DosePhysical Dose– Need to know more about the importance of dose-volume constraintsNeed to know more about the importance of dose-volume constraints
Dose
oxic
hypoxicS.F
Phillips, J Natl Cancer Inst 98:1777, 2006

www.rwww.radbioladbiol.ucla.edu.ucla.edu
WMcB2009
• Heterogeneity within and between between tumors in dose-response characteristics, often resulting in large error bars for values
• In spite of this, the outcome of clinical studies of altered fractionation generally fit the models, within the constraints of the clinical doses used
www.rwww.radbioladbiol.ucla.edu.ucla.edu
WMcB2009
Altered FractionationAltered Fractionation
oror
How to optimally distribute dose How to optimally distribute dose over timeover time

www.rwww.radbioladbiol.ucla.edu.ucla.edu
WMcB2009
PlayersPlayers
• Total dose (D)Total dose (D)• Dose per fraction (d)Dose per fraction (d)• Interval between fractions (t)Interval between fractions (t)• Overall treatment time (T)Overall treatment time (T)• Tumor typeTumor type• Acute reacting normal tissuesAcute reacting normal tissues• Late reacting normal tissuesLate reacting normal tissues
www.rwww.radbioladbiol.ucla.edu.ucla.edu
WMcB2009
DefinitionsDefinitions
• Conventional fractionationConventional fractionation– Daily doses (d) of 1.8 to 2 GyDaily doses (d) of 1.8 to 2 Gy– Dose per week of 9 to 10 GyDose per week of 9 to 10 Gy– Total dose (D) of 40 to 70 GyTotal dose (D) of 40 to 70 Gy
• HyperfractionationHyperfractionation– The number of fractions (N) is increasedThe number of fractions (N) is increased– T is kept the sameT is kept the same– Dose per fraction (d) less than 1.8 GyDose per fraction (d) less than 1.8 Gy– Two fractions per day (t)Two fractions per day (t)
Rationale:Rationale: Spares late responding tissuesSpares late responding tissues

www.rwww.radbioladbiol.ucla.edu.ucla.edu
WMcB2009
DefinitionsDefinitions• Accelerated fractionationAccelerated fractionation
– Shorter overall treatment timeShorter overall treatment time
– Dose per fraction of 1.8 to 2 GyDose per fraction of 1.8 to 2 Gy
– More than 10 Gy per weekMore than 10 Gy per week
Rationale:Rationale: Overcome accelerated tumor repopulationOvercome accelerated tumor repopulation
• HypofractionationHypofractionation– Dose per fraction (d) higher than 2.2 GyDose per fraction (d) higher than 2.2 Gy
– Reduced total number of fractions (N)Reduced total number of fractions (N)
Rationale: Tumor has low Rationale: Tumor has low ratio and there is no therapeutic ratio and there is no therapeutic advantage to be gained with respect to late complicationsadvantage to be gained with respect to late complications
www.rwww.radbioladbiol.ucla.edu.ucla.edu
WMcB2009
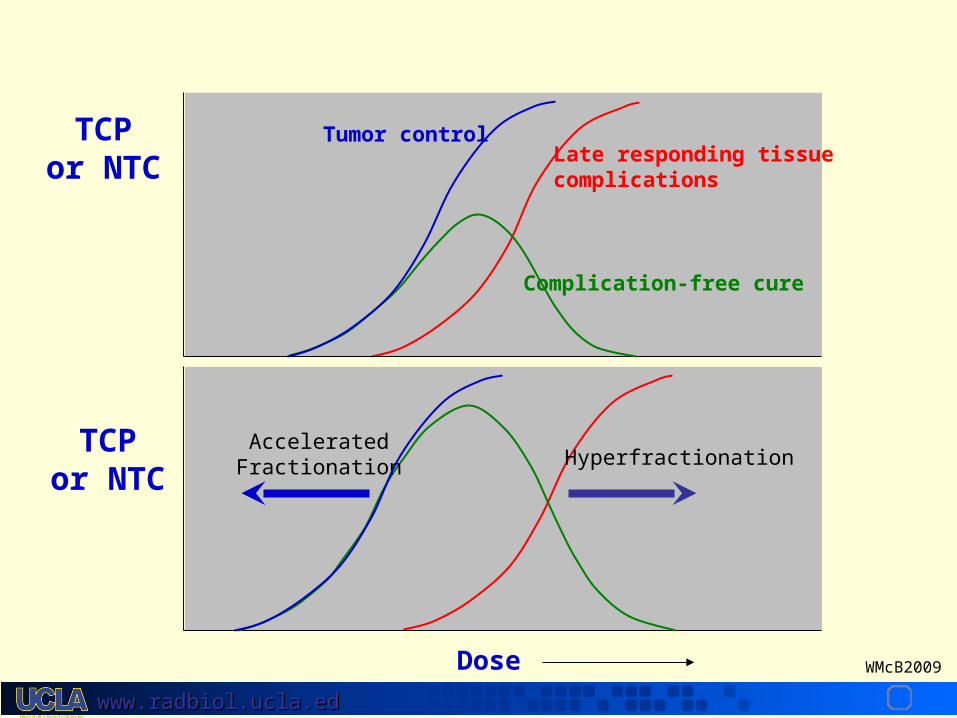
TCPor NTC
Dose
HyperfractionationAcceleratedFractionation
Tumor controlLate responding tissuecomplications
Complication-free cure
TCPor NTC

www.rwww.radbioladbiol.ucla.edu.ucla.edu
WMcB2009
Conventional
70 Gy - 35 fx - 7 wks
Very acceleratedwith reduction of dose
54 Gy - 36 fx - 12 days
Moderately accelerated
72 Gy - 42 fx - 6 wks
Hyperfractionated81.6 Gy - 68 fx - 7 wks
www.rwww.radbioladbiol.ucla.edu.ucla.edu
WMcB2009
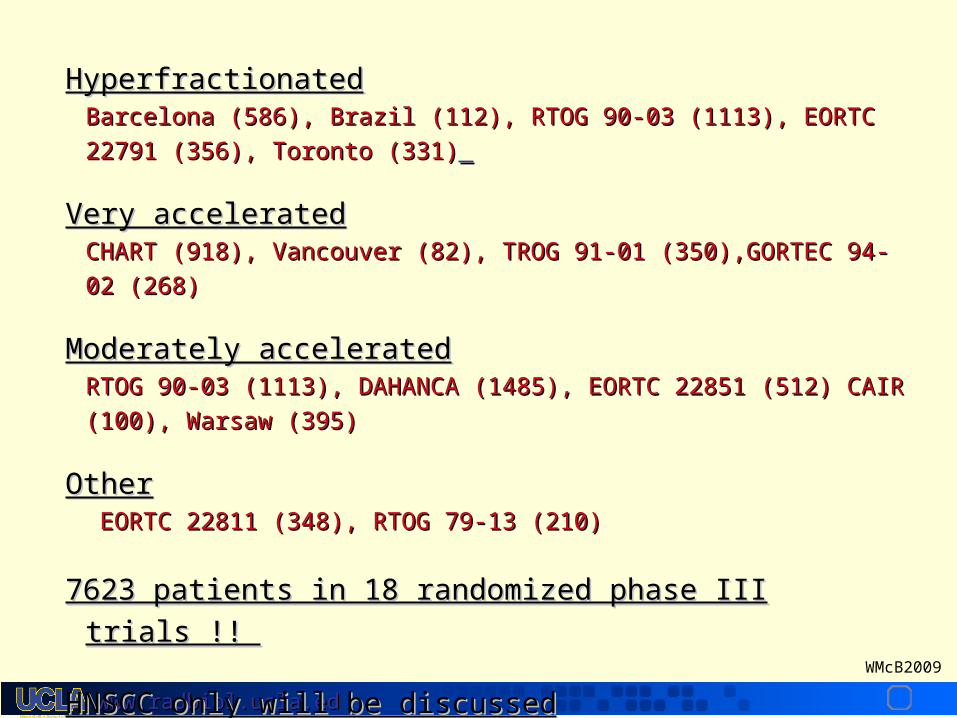
HyperfractionatedHyperfractionatedBarcelona (586), Brazil (112), RTOG 90-03 (1113), EORTC 22791 (356), Barcelona (586), Brazil (112), RTOG 90-03 (1113), EORTC 22791 (356),
Toronto (331)Toronto (331)
Very acceleratedVery acceleratedCHART (918), Vancouver (82), TROG 91-01 (350),GORTEC 94-02 (268)CHART (918), Vancouver (82), TROG 91-01 (350),GORTEC 94-02 (268)
Moderately acceleratedModerately acceleratedRTOG 90-03 (1113), DAHANCA (1485), EORTC 22851 (512) CAIR (100), RTOG 90-03 (1113), DAHANCA (1485), EORTC 22851 (512) CAIR (100),
Warsaw (395)Warsaw (395)
OtherOther EORTC 22811 (348), RTOG 79-13 (210)EORTC 22811 (348), RTOG 79-13 (210)
7623 patients in 18 randomized phase III trials !! 7623 patients in 18 randomized phase III trials !!
HNSCC only will be discussedHNSCC only will be discussed

www.rwww.radbioladbiol.ucla.edu.ucla.edu
WMcB2009
Oropharyngeal Ca T2-3, N0-1Oropharyngeal Ca T2-3, N0-1
YearsYears
LOCAL CONTROL LOCAL CONTROL SURVIVAL SURVIVAL
YearsYears
Horiot 1992Horiot 1992
80.5 Gy - 70 fx - 7 wks80.5 Gy - 70 fx - 7 wks control: 70 Gy - 35-40 fx - 7-8 wks control: 70 Gy - 35-40 fx - 7-8 wks
pp = 0.02 = 0.02 pp = 0.08 = 0.08
EORTC hyperfractionation trial in EORTC hyperfractionation trial in oropharynx cancer (N = 356)oropharynx cancer (N = 356)

www.rwww.radbioladbiol.ucla.edu.ucla.edu
WMcB2009
Loco-regional controlLoco-regional control SurvivalSurvival
conventionalconventionalCHARTCHART
conventionalconventionalCHARTCHART
54 Gy - 36 fx - 12 days control: 66 Gy - 33 fx - 6.5 wks54 Gy - 36 fx - 12 days control: 66 Gy - 33 fx - 6.5 wks
Dische 1997Dische 1997
Favourable outcome with CHART:Favourable outcome with CHART: well differentiated tumors well differentiated tumors larynx carcinomaslarynx carcinomas
Very Accelerated: CHART (N = 918)Very Accelerated: CHART (N = 918)

www.rwww.radbioladbiol.ucla.edu.ucla.edu
WMcB2009
54 Gy - 36 fx - 12 days control: 66 Gy - 33 fx - 6.5 wks54 Gy - 36 fx - 12 days control: 66 Gy - 33 fx - 6.5 wks
CHART: MorbidityCHART: MorbidityDische 1997
Moderate/severe subcutaneousModerate/severe subcutaneousfibrosis and oedemafibrosis and oedema
PP = 0.04 = 0.04
Moderate/severe dysphagiaModerate/severe dysphagia
PP = 0.04 = 0.04
Mucosal ulceration andMucosal ulceration anddeep necrosisdeep necrosis
PP = 0.003 = 0.003
Laryngeal oedemaLaryngeal oedema
PP = 0.009 = 0.009

www.rwww.radbioladbiol.ucla.edu.ucla.edu
WMcB2009
DAHANCA 6: only glottic, (N = 694)DAHANCA 6: only glottic, (N = 694)DAHANCA 7: all other sites, + nimorazole (N = 791)DAHANCA 7: all other sites, + nimorazole (N = 791)
Overgaard 2000Overgaard 2000
66-68 Gy - 33-34 fx - 6 wks control: 66-68 Gy - 33-34 fx - 7 wks66-68 Gy - 33-34 fx - 6 wks control: 66-68 Gy - 33-34 fx - 7 wks
Actuarial 5-year ratesActuarial 5-year ratesLocal controlLocal control
DAHANCA 6DAHANCA 6DAHANCA 7DAHANCA 7
Nodal controlNodal controlDAHANCA 6 + 7DAHANCA 6 + 7 ..
Disease-specific survivalDisease-specific survival DAHANCA 6 + 7 DAHANCA 6 + 7
Overall survivalOverall survivalLate effectsLate effects (edema, fibrosis) (edema, fibrosis)
Moderately AcceleratedModerately Accelerated
5 fx/wk5 fx/wk 6 fx/wk6 fx/wk
73%73% 81% p=0.0481% p=0.0456%56% 68% p=0.00968% p=0.009
87%87% 89% n.s.89% n.s.
65%65% 72% p=0.0472% p=0.04
n.s.n.s.n.s.n.s.
www.rwww.radbioladbiol.ucla.edu.ucla.edu
WMcB2009
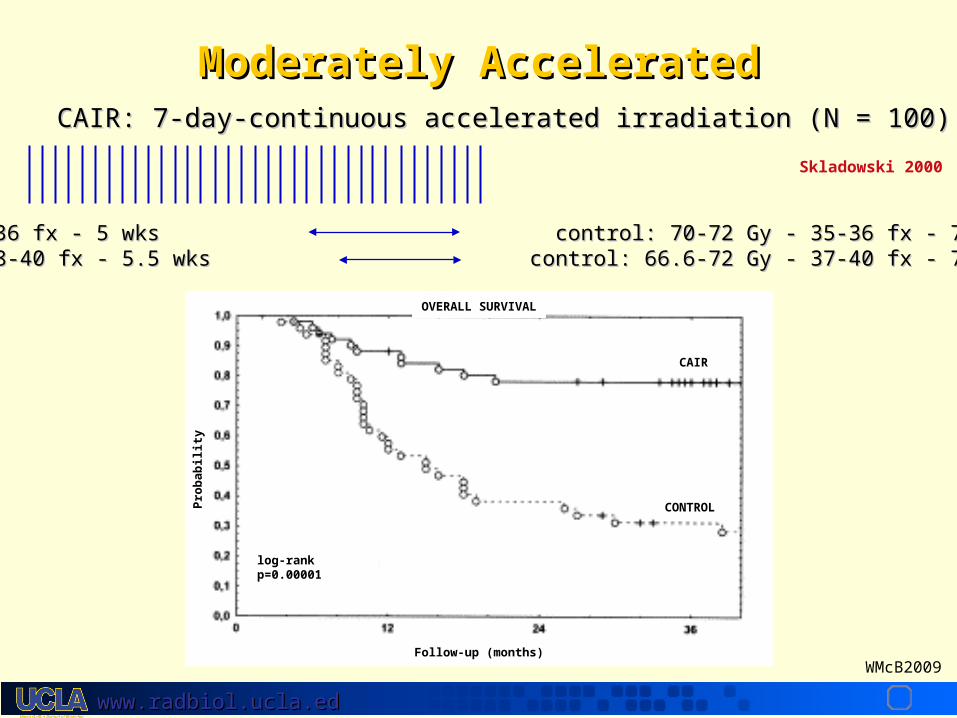
Skladowski 2000
OVERALL SURVIVAL
CONTROL
CAIR
log-rank p=0.00001
Follow-up (months)
Pro
ba
bil
ity
66-72 Gy - 33-36 fx - 5 wks control: 70-72 Gy - 35-36 fx - 7 wks66-72 Gy - 33-36 fx - 5 wks control: 70-72 Gy - 35-36 fx - 7 wks68.4-72 Gy - 38-40 fx - 5.5 wks control: 66.6-72 Gy - 37-40 fx - 7.5-8 wks68.4-72 Gy - 38-40 fx - 5.5 wks control: 66.6-72 Gy - 37-40 fx - 7.5-8 wks
CAIR: 7-day-continuous accelerated irradiation (N = 100)CAIR: 7-day-continuous accelerated irradiation (N = 100)
Moderately AcceleratedModerately Accelerated

www.rwww.radbioladbiol.ucla.edu.ucla.edu
WMcB2009
ConventionalConventional
Accelerated with splitAccelerated with split
70 Gy - 35 fx - 7 wks70 Gy - 35 fx - 7 wks
67.2 Gy - 42 fx - 6 weeks (including 2-week split)67.2 Gy - 42 fx - 6 weeks (including 2-week split)
72 Gy - 42 fx - 6 wks72 Gy - 42 fx - 6 wks
HyperfractionatedHyperfractionated
81.6 Gy - 68 fx - 7 wks81.6 Gy - 68 fx - 7 wks
Accelerated withAccelerated withConcomitant boostConcomitant boost
Fu 2000Fu 2000
RTOG 90-03, Phase III comparison of fractionation RTOG 90-03, Phase III comparison of fractionation schedules in Stage III and IV SCC of oral cavity, schedules in Stage III and IV SCC of oral cavity, oropharynx, larynx, hypopharynx (N = 1113)oropharynx, larynx, hypopharynx (N = 1113)

www.rwww.radbioladbiol.ucla.edu.ucla.edu
WMcB2009
RTOG 90-03,RTOG 90-03, loco-regional controlloco-regional controlFu 2000

www.rwww.radbioladbiol.ucla.edu.ucla.edu
WMcB2009
RTOG 90-03, RTOG 90-03, survivalsurvivalFu 2000

www.rwww.radbioladbiol.ucla.edu.ucla.edu
WMcB2009
RTOG 90-03, adverse effects
Maximum toxicity Conventional Hyperfract Concom Acc +per patient boost split
Grade 1 15% 4% 4% 7%Grade 2 57% 39% 36% 41%Grade 3 35% 54% 58% 49%Grade 4 0% 1% 1% 2%
Fu 2000
Acute
Maximum toxicity Conventional Hyperfract Concom Acc +per patient boost splitGrade 1 11% 8% 7% 16%Grade 2 50% 56% 44% 50%Grade 3 19% 19% 29% 20%Grade 4 8% 9% 8% 7%Grade 5 1% 0% 1% 1%
Late

www.rwww.radbioladbiol.ucla.edu.ucla.edu
WMcB2009
Acute effects in accelerated or hyperfractionated RT
Author Regimen Grade 3-4 mucositis
ContCont ExpExpHoriot (n=356)Horiot (n=356) HFHF 49%49% 67%67%Horiot (n=512) Acc fx + splitHoriot (n=512) Acc fx + split 50%50% 67%67%Dische (n=918)Dische (n=918) CHARTCHART 43%43% 73%73%Fu (n=536)Fu (n=536) Acc fx(CB) Acc fx(CB) 25%25% 46%46%Fu (n=542)Fu (n=542) Acc fx + split Acc fx + split 25%25% 41%41%Fu (n=507)Fu (n=507) HFHF 25%25% 42%42%Skladowski (n=99) Skladowski (n=99) Acc fx Acc fx 26%26% 56%56%
Toxicity of RT in HNSCCToxicity of RT in HNSCC

www.rwww.radbioladbiol.ucla.edu.ucla.edu
WMcB2009
Altered fractionation in head and Altered fractionation in head and neck cancer: meta-analysisneck cancer: meta-analysis
Bourhis, Lancet 2006Randomized trials 1970-1998 (no postop RT)Randomized trials 1970-1998 (no postop RT)15 trials included (6515 patients)15 trials included (6515 patients)
Survival benefit: 3.4% (36% 39% at 5 years, Survival benefit: 3.4% (36% 39% at 5 years, pp = 0.003) = 0.003)Loco-regional control benefit: 7% (46.5% 53% at 5 years, Loco-regional control benefit: 7% (46.5% 53% at 5 years, pp < 0.0001) < 0.0001)

www.rwww.radbioladbiol.ucla.edu.ucla.edu
WMcB2009
Conclusions for HNSCCConclusions for HNSCC
• Hyperfractionation increases TCP and protects late responding tissues• Accelerated treatment increase TCP but also increases acute toxicity• What should be considered standard for patients treated with radiation
only?– Hyperfractionated radiotherapy– Concomitant boost accelerated radiotherapy
• Fractions of 1.8 Gy once daily when given alone, cannot be considered as an acceptable standard of care
• TCP curves for SSC are frustratingly shallow … selection of tumors?

www.rwww.radbioladbiol.ucla.edu.ucla.edu
WMcB2009
Conclusions for HNSCCConclusions for HNSCC• The benefit derived from altered fractionation is consistent The benefit derived from altered fractionation is consistent
with can be of benefit but should be used with carewith can be of benefit but should be used with care• In principle, tumors should be treated for an overall In principle, tumors should be treated for an overall
treatment time that is as short as possible consistent with treatment time that is as short as possible consistent with acceptable acute morbidity, but with a dose per fraction acceptable acute morbidity, but with a dose per fraction that does not compromise late responding normal tissues, that does not compromise late responding normal tissues, or total dose.or total dose.
• Avoid treatment breaks and treatment prolongation Avoid treatment breaks and treatment prolongation wherever possible wherever possible –– and consider playing “catch-up” if and consider playing “catch-up” if there are anythere are any
• Start treatment on a Monday and finish on a Friday, and Start treatment on a Monday and finish on a Friday, and consider working Saturdaysconsider working Saturdays
• Never change a winning horse!Never change a winning horse!
www.rwww.radbioladbiol.ucla.edu.ucla.edu
WMcB2009
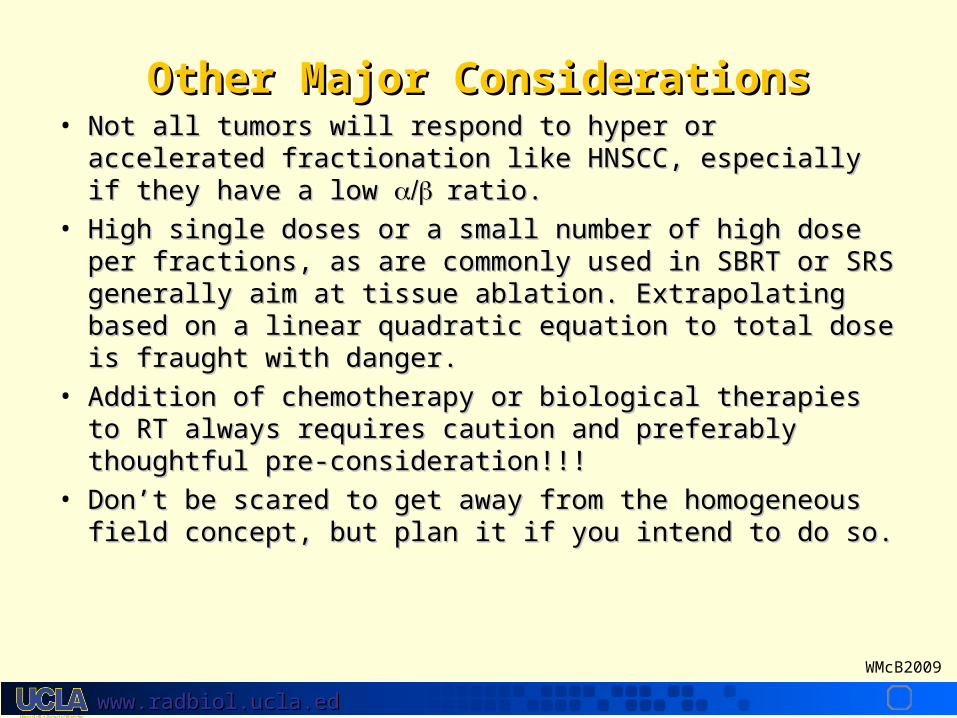
Other Major ConsiderationsOther Major Considerations• Not all tumors will respond to hyper or accelerated Not all tumors will respond to hyper or accelerated
fractionation like HNSCC, especially if they have a low fractionation like HNSCC, especially if they have a low ratio.ratio.
• High single doses or a small number of high dose per High single doses or a small number of high dose per fractions, as are commonly used in SBRT or SRS generally fractions, as are commonly used in SBRT or SRS generally aim at tissue ablation. Extrapolating based on a linear aim at tissue ablation. Extrapolating based on a linear quadratic equation to total dose is fraught with danger.quadratic equation to total dose is fraught with danger.
• Addition of chemotherapy or biological therapies to RT Addition of chemotherapy or biological therapies to RT always requires caution and preferably thoughtful pre-always requires caution and preferably thoughtful pre-consideration!!!consideration!!!
• Don’t be scared to get away from the homogeneous field Don’t be scared to get away from the homogeneous field concept, but plan it if you intend to do so.concept, but plan it if you intend to do so.

www.rwww.radbioladbiol.ucla.edu.ucla.edu
WMcB2009
Questions:Questions: The Radiobiology Behind Dose FractionationThe Radiobiology Behind Dose Fractionation

www.rwww.radbioladbiol.ucla.edu.ucla.edu
WMcB2009
Modeling of radiation responses are based Modeling of radiation responses are based on on
1.1. Random events occurring in cell nucleiRandom events occurring in cell nuclei
2.2. Random events in space as defined by Random events in space as defined by the Poisson distributionthe Poisson distribution
3.3. A Gaussian distributionA Gaussian distribution
4.4. Logarithmic dose response curvesLogarithmic dose response curves

www.rwww.radbioladbiol.ucla.edu.ucla.edu
WMcB2009
D0 isD0 is
1.1. Is a measure of the shoulder of a survival Is a measure of the shoulder of a survival curvecurve
2.2. Is the mean lethal dose of the linear Is the mean lethal dose of the linear portion of the dose-response curveportion of the dose-response curve
3.3. Represents the slope of the log linear Represents the slope of the log linear survival curvesurvival curve
4.4. Is constant at all levels of radiation effect Is constant at all levels of radiation effect

www.rwww.radbioladbiol.ucla.edu.ucla.edu
WMcB2009
Dq isDq is1.1. A measure of the inverse of the terminal A measure of the inverse of the terminal
slope of the survival curveslope of the survival curve2.2. A measure of the inverse of the initial A measure of the inverse of the initial
slope of the survival curveslope of the survival curve3.3. A measure of the shoulder of the survival A measure of the shoulder of the survival
curvecurve4.4. A measure of the intercept of the terminal A measure of the intercept of the terminal
portion of the survival curve on the y axisportion of the survival curve on the y axis
www.rwww.radbioladbiol.ucla.edu.ucla.edu
WMcB2009
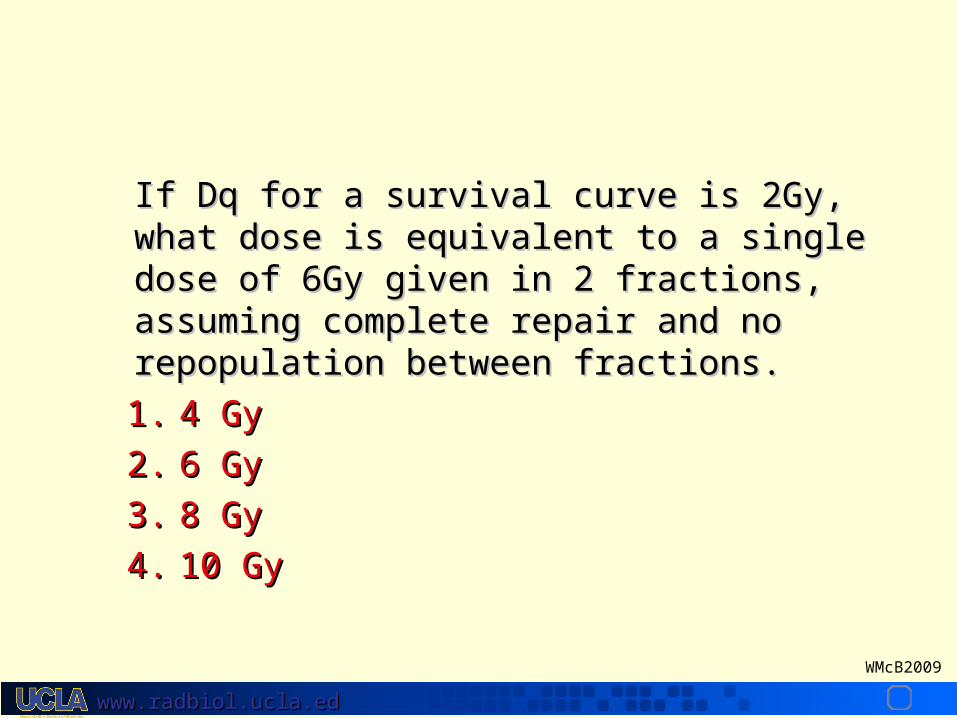
If Dq for a survival curve is 2Gy, what dose If Dq for a survival curve is 2Gy, what dose is equivalent to a single dose of 6Gy given in is equivalent to a single dose of 6Gy given in 2 fractions, assuming complete repair and 2 fractions, assuming complete repair and no repopulation between fractions.no repopulation between fractions.
1.1. 4 Gy4 Gy
2.2. 6 Gy6 Gy
3.3. 8 Gy8 Gy
4.4. 10 Gy 10 Gy
www.rwww.radbioladbiol.ucla.edu.ucla.edu
WMcB2009
A whole body dose of 7 Gy of x‑rays would produce severe, potentially lethal hematologic toxicity. Assuming that the Do of the hematopoietic stem cells is 1 Gy and that these cells have a negligible capacity to repair sublethal radiation damage, what is the surviving fraction of these stem cells after this dose of radiation?
1. 0.00012. 0.0013. 0.0254. 0.0675. 0.1167
www.rwww.radbioladbiol.ucla.edu.ucla.edu
WMcB2009
If 90% of a tumor is removed by surgery, If 90% of a tumor is removed by surgery, what does this likely represent in term of what does this likely represent in term of radiation dose given in 2 Gy fractions?radiation dose given in 2 Gy fractions?1.1. 1-2 Gy1-2 Gy2.2. 3-4 Gy3-4 Gy3.3. 6-7 Gy6-7 Gy4.4. 9-12 Gy9-12 Gy5.5. 20-30 Gy20-30 Gy

www.rwww.radbioladbiol.ucla.edu.ucla.edu
WMcB2009
What is true for the What is true for the ratio ratio1.1. It is unitlessIt is unitless2.2. It is a measure of the shoulder of the It is a measure of the shoulder of the
survival curvesurvival curve3.3. It measures the sensitivity of a tissue to It measures the sensitivity of a tissue to
changes in size of dose fractionschanges in size of dose fractions4.4. It is the ratio where the number of non-It is the ratio where the number of non-
repairable lesions equals that for repairable lesions equals that for repairable lesionsrepairable lesions

www.rwww.radbioladbiol.ucla.edu.ucla.edu
WMcB2009
The alpha component in the linear quadratic The alpha component in the linear quadratic formula for as radiation survival curve formula for as radiation survival curve representsrepresents1.1. Unrepairable DNA double strand breaksUnrepairable DNA double strand breaks2.2. Lethal single track eventsLethal single track events3.3. Multiply damaged sites in DNAMultiply damaged sites in DNA4.4. Damage that can not be altered by Damage that can not be altered by
hypoxiahypoxia
www.rwww.radbioladbiol.ucla.edu.ucla.edu
WMcB2009
Which parameter is most relevant for Which parameter is most relevant for standard clinical regimens in RTstandard clinical regimens in RT
1.1. The The ratio ratio
2.2. DoDo
3.3. AlphaAlpha
4.4. BetaBeta
5.5. The extrapolation numberThe extrapolation number
www.rwww.radbioladbiol.ucla.edu.ucla.edu
WMcB2009
If cells have a Do of 2 Gy, assuming no shoulder, what dose is required to kill 95% of the cells?1. 6 Gy2. 12 Gy3. 18 Gy4. 24 Gy5. 30 Gy

www.rwww.radbioladbiol.ucla.edu.ucla.edu
WMcB2009
The extrapolation number N for a multi-The extrapolation number N for a multi-fraction survival curve, allowing complete fraction survival curve, allowing complete repair between fractions and no repopulation repair between fractions and no repopulation isis1.1. 112.2. < 1< 13.3. >1>14.4. Dependent on the size of the dose per Dependent on the size of the dose per
fraction fraction

www.rwww.radbioladbiol.ucla.edu.ucla.edu
WMcB2009
The extrapolation number N for a single The extrapolation number N for a single dose neutron survival curve isdose neutron survival curve is
1.1. 11
2.2. < 1< 1
3.3. >1>1
4.4. Dependent on the size of the dose per Dependent on the size of the dose per fraction fraction

www.rwww.radbioladbiol.ucla.edu.ucla.edu
WMcB2009
The extrapolation number N for a low dose The extrapolation number N for a low dose rate survival curve israte survival curve is
1.1. 11
2.2. < 1< 1
3.3. >1>1
4.4. Dependent on the size of the dose per Dependent on the size of the dose per fraction fraction

www.rwww.radbioladbiol.ucla.edu.ucla.edu
WMcB2009
The inverse of the slope of a multifraction The inverse of the slope of a multifraction survival curve (survival curve (effeffDo) is generally within the Do) is generally within the
rangerange
1.1. 1.0-1.5 Gy1.0-1.5 Gy
2.2. 1.5-2.5 Gy1.5-2.5 Gy
3.3. 2.5-5.0 Gy2.5-5.0 Gy
4.4. 5.0-10.0 Gy5.0-10.0 Gy

www.rwww.radbioladbiol.ucla.edu.ucla.edu
WMcB2009
If the If the effeffDo for a multifraction survival curve is Do for a multifraction survival curve is
3.5 Gy, what dose would cure 37% of a 3.5 Gy, what dose would cure 37% of a series of 1cm diameter tumors (10series of 1cm diameter tumors (1099 clonogens).clonogens).
1.1. 56 Gy56 Gy
2.2. 64 Gy64 Gy
3.3. 72 Gy72 Gy
4.4. 80 Gy 80 Gy

www.rwww.radbioladbiol.ucla.edu.ucla.edu
WMcB2009
If the If the effeffDo for a multifraction survival curve is Do for a multifraction survival curve is
3.5 Gy, what dose would cure 69% of a 3.5 Gy, what dose would cure 69% of a series of 1cm diameter tumors (10series of 1cm diameter tumors (1099 clonogens).clonogens).
1.1. 56 Gy56 Gy
2.2. 64 Gy64 Gy
3.3. 72 Gy72 Gy
4.4. 80 Gy 80 Gy
www.rwww.radbioladbiol.ucla.edu.ucla.edu
WMcB2009
If a tumor has an effective Do of 3.5 Gy,what is the S.F. after 70 Gy?1. 2 x 10-11
2. 2 x 10⁻⁹
3. 2 x 10⁻⁷
4. 2 x 10⁻⁵
5. 2 x 10⁻³
www.rwww.radbioladbiol.ucla.edu.ucla.edu
WMcB2009
If 16 x 2 Gy fractions reduce survival by 10-4, what dose would be needed to reduce survival to 10-10?1. 50 Gy2. 60 Gy3. 64 Gy4. 70 Gy5. 80 Gy

www.rwww.radbioladbiol.ucla.edu.ucla.edu
WMcB2009
If 16 x 2 Gy fractions reduce survival by 10-4, what is the effective D0?1. 2.0 Gy2. 2.3 Gy3. 3.0 Gy4. 3.5 Gy5. 3.8 Gy

www.rwww.radbioladbiol.ucla.edu.ucla.edu
WMcB2009
The The ratio for mucosal tissues is closest ratio for mucosal tissues is closest toto
1.1. 2 Gy2 Gy
2.2. 4 Gy4 Gy
3.3. 6 Gy6 Gy
4.4. 8 Gy8 Gy
5.5. 10 Gy10 Gy

www.rwww.radbioladbiol.ucla.edu.ucla.edu
WMcB2009
Which of the following human tumors Is Which of the following human tumors Is thought to have an thought to have an ratio of 1-2 Gy ratio of 1-2 Gy
1.1. Oropharyngeal CaOropharyngeal Ca
2.2. Prostate CaProstate Ca
3.3. GlioblastomaGlioblastoma
4.4. Colorectal CaColorectal Ca

www.rwww.radbioladbiol.ucla.edu.ucla.edu
WMcB2009
The TD5/5 for a certain tissue irradiated at 2 Gy/fraction is 60 Gy whereas at 4 Gy/fraction it is 40 Gy. Assuming that the linear quadratic equation, ‑lnSF= N (D + D2), accurately represents cell survival for this tissue, what is the value of ?
1. 1 Gy2. 2 Gy3. 4 Gy4. 10 Gy5. 20 Gy

www.rwww.radbioladbiol.ucla.edu.ucla.edu
WMcB2009
It is decided to treat a patient with hypofractionation at 3 Gy/fraction instead of the conventional schedule of 60 Gy in 2 Gy fractions. What total dose should be delivered in order for the risk of late normal‑tissue damage to remain unchanged according to the linear‑quadratic model with for late damage = 3 Gy?
1. 40 Gy2. 48 Gy3. 50 Gy4. 55.4 Gy5. 75 Gy

www.rwww.radbioladbiol.ucla.edu.ucla.edu
WMcB2009
A standard treatment for HNSCC tumors is 70 Gy delivered at 2 Gy/fraction. Hyperfractionation is being attempted with a fraction size of 1.2 Gy. What total treatment dose should be used to maintain the same complication rate for the late responding normal tissues. Assume full repair of sublethal damage between fractions and an of 3 Gy.
1. 42 Gy2. 58 Gy3. 70 Gy4. 83 Gy5. 117 Gy

www.rwww.radbioladbiol.ucla.edu.ucla.edu
WMcB2009
A standard treatment for HNSCC tumors is 70 Gy delivered at 2 Gy/fraction. Hyperfractionation is being attempted with a fraction size of 1.2 Gy. What total treatment dose should be used to maintain the same complication rate for the late responding normal tissues. Assuming no proliferation and complete repair between fractions, an of 3 Gy for late responding tissue and 12 Gy for tumor, what would be the therapeutic gain.1.1. 6%6%2.2. 12%12%3.3. 18%18%4.4. 24%24%

www.rwww.radbioladbiol.ucla.edu.ucla.edu
WMcB2009
Which of the following sites is the least Which of the following sites is the least suitable for b.i.d. treatmentsuitable for b.i.d. treatment
1.1. Head and neckHead and neck
2.2. BrainBrain
3.3. LungLung
4.4. ProstateProstate

www.rwww.radbioladbiol.ucla.edu.ucla.edu
WMcB2009
The rationale behind accelerated The rationale behind accelerated fractionation isfractionation is1.1. To spare late responding normal tissueTo spare late responding normal tissue2.2. To combat encourage tumor To combat encourage tumor
reoxygenationreoxygenation3.3. To exploit redistribution in tumorsTo exploit redistribution in tumors4.4. To combat accelerated repopulation in To combat accelerated repopulation in
tumorstumors
www.rwww.radbioladbiol.ucla.edu.ucla.edu
WMcB2009
The CHART regimen for HNSCC of 54Gy in 36 fractions over The CHART regimen for HNSCC of 54Gy in 36 fractions over 12 days compared with 66 Gy in 33 fractions in 6.5 weeks, 12 days compared with 66 Gy in 33 fractions in 6.5 weeks, overall showedoverall showed
1.1. Superior locoregional control, no increase in overall Superior locoregional control, no increase in overall survival, increased late effectssurvival, increased late effects
2.2. Superior locoregional control that translated into an Superior locoregional control that translated into an increase in overall survival, no change in late effectsincrease in overall survival, no change in late effects
3.3. No change in locoregional control and overall survival, No change in locoregional control and overall survival, decreased late effectsdecreased late effects
4.4. Superior locoregional control, no increase in overall Superior locoregional control, no increase in overall survival, increased acute effectssurvival, increased acute effects

www.rwww.radbioladbiol.ucla.edu.ucla.edu
WMcB2009
DAHANCA 6 and 7 clinical trials with 66-DAHANCA 6 and 7 clinical trials with 66-68Gy given in 6 compared to 7 weeks68Gy given in 6 compared to 7 weeks
1.1. Was a hyperfractionation trialWas a hyperfractionation trial
2.2. Treated 6 days a weekTreated 6 days a week
3.3. Showed no increase in local controlShowed no increase in local control
4.4. Showed no increase in disease-specific Showed no increase in disease-specific survivalsurvival

www.rwww.radbioladbiol.ucla.edu.ucla.edu
WMcB2009
RTOG 90-03, which compared hyperfractionation, RTOG 90-03, which compared hyperfractionation, accelerated fractionation with a split, and accelerated fractionation with a split, and accelerated fractionation with a boost showedaccelerated fractionation with a boost showed1.1. Hyperfractionation to be superior in terms of Hyperfractionation to be superior in terms of
loco-regional control and late effectsloco-regional control and late effects2.2. Accelerated fractionation with a split to be Accelerated fractionation with a split to be
equivalent to hyperfractionation in terms of loco-equivalent to hyperfractionation in terms of loco-regional controlregional control
3.3. There to be no advantage to altered fractionationThere to be no advantage to altered fractionation4.4. Accelerated fractionation to be superior to Accelerated fractionation to be superior to
hyperfractionationhyperfractionation

www.rwww.radbioladbiol.ucla.edu.ucla.edu
WMcB2009
AnswersAnswers1. NA2. 23. 24. 45. 16. 57. 28. 49. 210. 411. 412. 313. 214. 115. 316. 217. 118. 219. 320. 321. 122. 323. 124. 225. 526. 127. 328. 129. 330. 3