radars and meteorology shri s.h. damle indian institute of tropical meteorology pune
Post on 22-Dec-2015
222 views
TRANSCRIPT

Radars and Meteorology
Shri S.H. Damle
Indian Institute of Tropical Meteorology Pune
Radar & MeteorologyRadar & Meteorology
Historical Back GroundBasic concept of Radar
Nikola Tesla – 1900Article in Century Magazine

Some british & German Patents on Detection & Ranging of Remote metallic objects by Radio Waves – 1900-1906
First practical Demonstration of Ranging using FM-CW transmitter.
Dec 1924Appleton – Kings College LondonBarnet - Cambridge University

They observed the reflections from ionospheric layers beyond 100 km – The Appleton Layer
Use of Pulsed Techniques:
Breit & Tuve – Carneigy Institute 1925, with NRL collaborations.
Again Inospheric Echoes – 150 km away.

Work in another direction was being perused by a young engineer turned Meteorologist (Sir) Watson. Watt – 1915
Study of e-m radiation by lightening in thunderstorms
Objective : Timely thunderstorm warnings to world War I aviations.

1935 : World War II scenarioBritish govt. committee on scientific
survey of Air Defence (CSSAD)Consultations with sir Watson Watt &
WilkinsProposal firmed up – 27 Feb 1935Successful Demonstration of detection
& ranging of aircraft – July 1935.

This early war time effort firmly established that RADAR was a tool of Aviation.
Since it evolved through the effort of meteorologists meteorology was clubbed as part of civil Aviation. Even in India – as in many other countries Dept. of meteorology was a part of Dept of civil Aviation

1940 – Dr. J.W. Ryde work on a 10 cm Radar – Most probably related to precipitation detection; but no direct record of the period – wartime secrecy.
1946 – Ryde’s publication on estimation of attenuation and echoing properties of clouds & rain.
Thus 1940-46 may be marked as the Birth of Radar Meteorology.

Early Radars deployed in RADAR Meteorology
S & C Band 2700 MHz / 5600 MHzMost of these were pulsed incoherent
Radars – the Tx source being high power Magnetrons
These were suitable for receiving echoes form precipitation/detecting, cyclonic/severe weather system: mostly Intensify/reflectivity estimations.

Quantitative Estimation of wind fields could only be done by scan to scan tracking
Reflectivity Mapping : DVIPThe advent of Klystron Technology then
led to development of Doppler weather Radars which could directly measure the average wind speeds in the cyclonic systems:
The advances in digital/computational Technology then gave further impetus to these Radar system developments.

The Polarization diversity Radar – An effort to improve precipitation measurements by weather Radars
**Hydrometeors/Raindrops tend to elongated as they fall from height.
**The scattering x-sections in the two polarizations is therefore different.
**The differential reflectivity in the two polarizations give a better handle on rain rate estimation.
**Typical dual polarization radar requires polarization switching n a pulse to pulse basis requiring advanced high power switching technology.

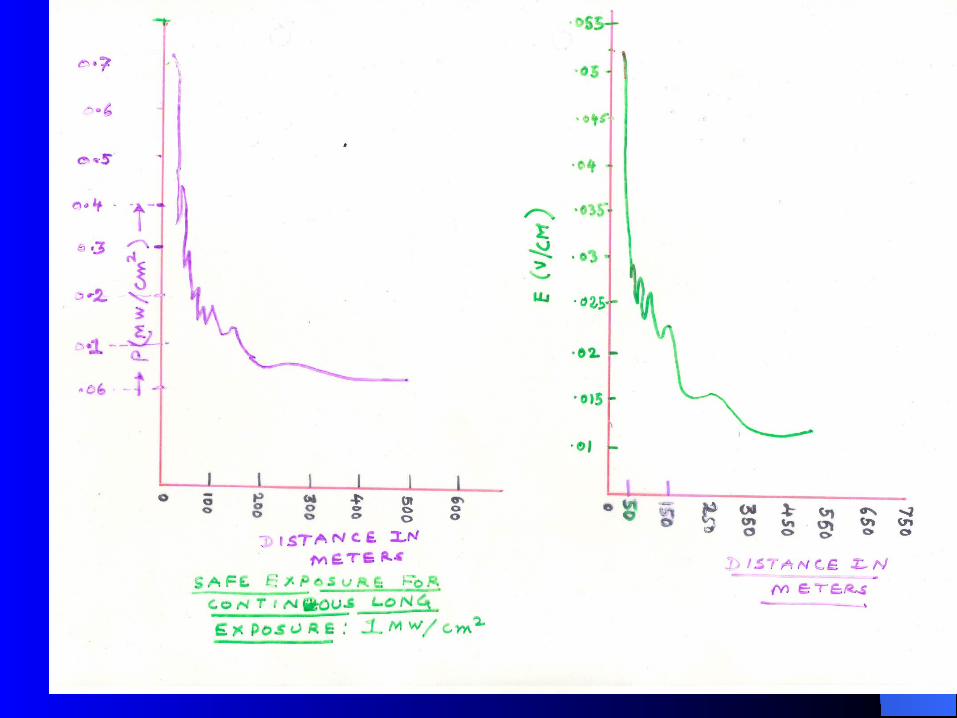
The Clear air Radar – Wind profilerThe Clear air Radar – Wind profiler
Gradients in refractive index fluctuations leading to e-m back scatter
The average wind carries along these irregularities and in turn they become tracers of mean wind.
A Radar operating at wavelength λ is most sensitive to scale sizes of these irregularities of λ/2 or multiples of λ/2.

The atmospheric Radar Eqn – volume Target Eqn : The signal power
..2ln64
,4
..4
.2ln16
.4
2
2
2
2
2
cR
APP
Thus
A
AG
AR
cR
R
GPP
erttr
e
et
erttt
r

Note:Dependence on 1/R2
Proportional to Ae PT : power Aperture product
Proportional to - The Radar pulse length
η: volume Reflectivity of atmospheric Target
c

The Noise PowerThe Noise Power
In Practice:• One integrates nc pulses – assuming the signal remain
coherent during the period - typically upto few seconds in troposphere.
• Invariably use spectral processing to detect the signal and use DFFT techniques with P points DFT
i) Integrate certain number (ni) of spectra ‘incoherently’
the delectability is then defined as (S/N)dt
iBr
tr
dt
nm
Pnc
BTsTkR
cAe
N
S ...
)(2ln64
)(Pr2
BTTkBkTPN nBrsn )(
Coding & DecodingCoding & Decoding
Coding offers dual advantages:*Good/High resolution*High average power*A long single pulse made up of
segment of pulses*Binary phase coding is one convenient
form of coding technique which is suitable for digital implementation
The carrier phase is altered either as 0o or 180o according to a binary code
Complementary code sequences are popular in profiler applications
If A & B are two complementary codes then they possess the property that the range side lobes of autocorrelation function of A are in opposite sign to the autocorrelation function of B.

Thus if the complementary sequences A & B are transmitted one after the other and on receive side their autocorrelation functions are added the range side lobes disappear in the receiver output leaving in the receiver output a single peak at signal location.

Once we know A & B are complementary codes, then &
are also complementary.Examples A ++ AB +++-
B +- AB ++-+
Use of ‘m’ baud complementary code pair sequence, & subsequent decoding & addition on receive side thus provides a (S/N) improvement by a factor m.
BA
BA
AB

This is because all the target returned energy which was distributed in range side lobes is recovered & this is as if Transmit power is increased ‘m’ times compared to a single pulse (code) transmission.
In the Pune profiler a 8 baud code pair sequence (baud length 2 microsecond) is used in the higher height mode of operation. The code pair is +++- ++-+
+++- --+-which can be generated from the basic
pair ++ & +-

Receiver system ‘Hardware consideration’Receiver system ‘Hardware consideration’
Since Cn2 in atmosphere could vary by more
than 70 dB ( 7 orders of magnitude) a high dynamic range receiver is required.
The signal dynamic range is to be achieved without saturation of any stage because of background noise.
RF & video gain is to be adjusted such that the lowest expected signal level at Rx input is amplified upto atleast ‘one bit’ level of the ADC.
This will ensure full utilization of the DSPG
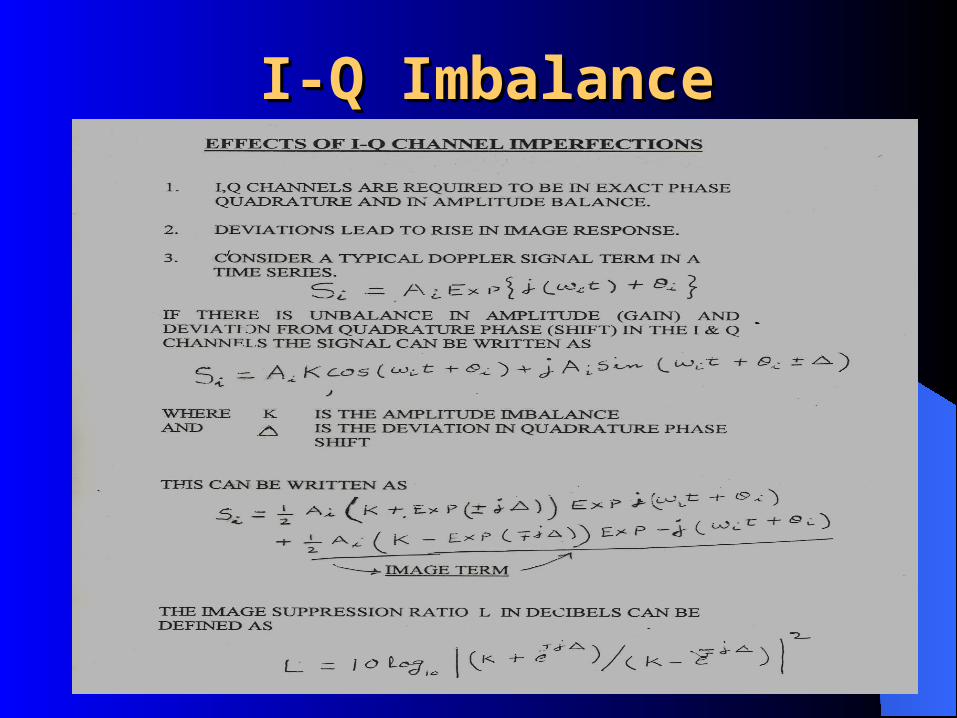
I-Q ImbalanceI-Q Imbalance


The basic vector wind computationThe basic vector wind computation
Vradial(east) = ucosθ + wsinθVradial (north) = vcosθ + wsinθ
W (zenith) = wU &V being Zonal and Meridional
component of the wind.W Zenith beam estimate of vertical velocity.

QualityQuality controlscontrols onon datadataRange tracking; temporal continuity: consensus averagingNeed to know beam position angle θ
accurately.If u>>w
Vre = ucosθ therefore
Thus for 1% accuracy of radial wind Is approximately .170 for θ~750
dV
V
r
r tan
d

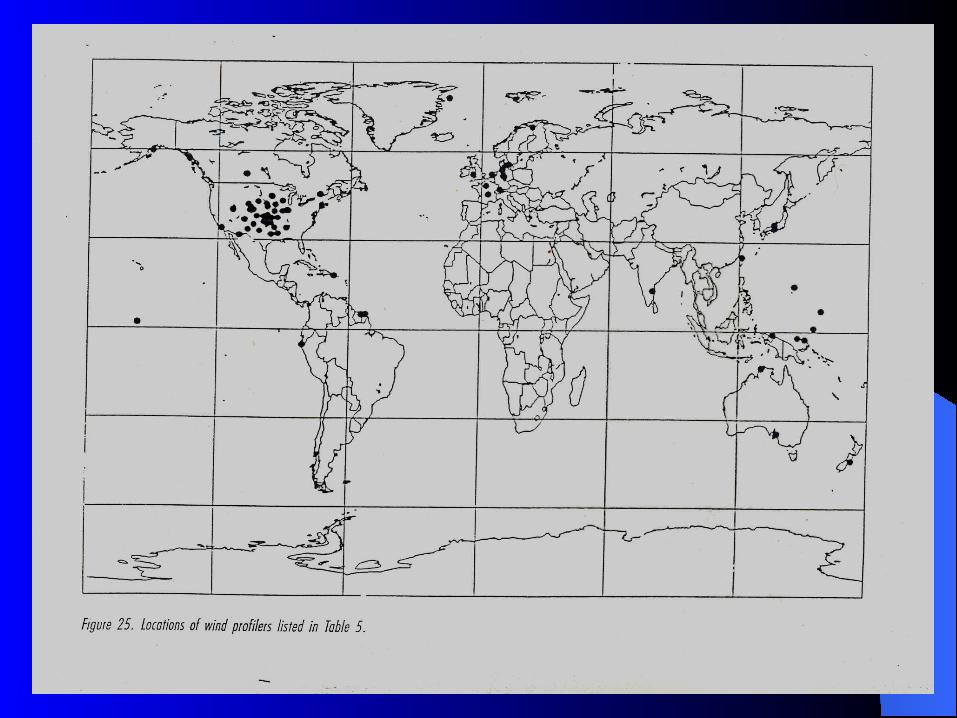
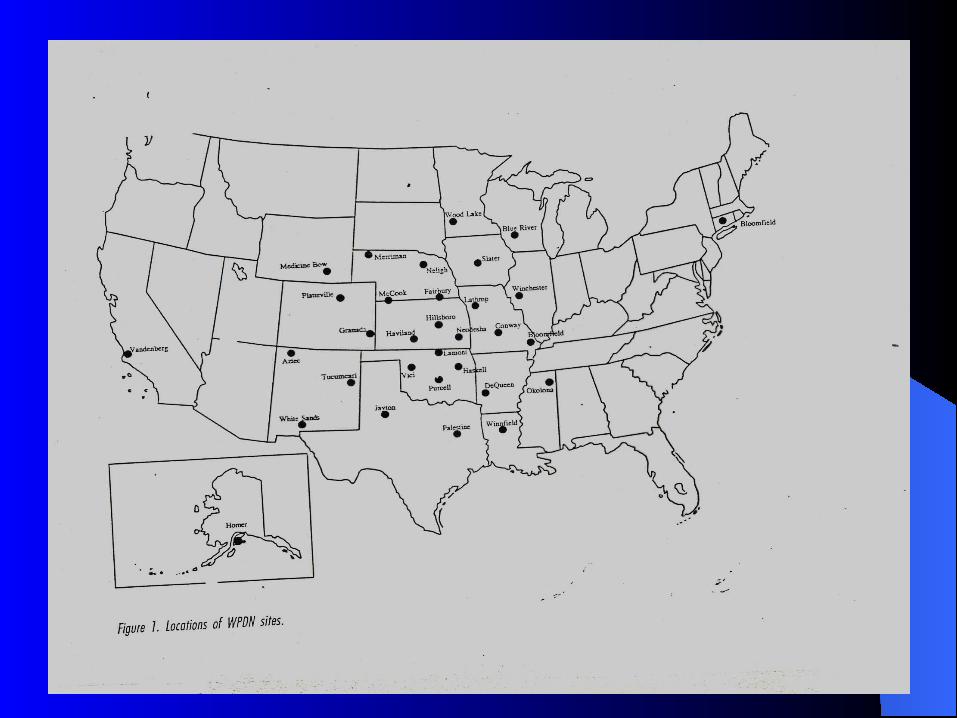
Similar systems abroadSimilar systems abroad NOAA Network at 449 MHz: Typical specs – identical with Pune
profiler-Summary performance


Thank You Thank You