r. wendell williams, mba, ph.d. - emergenetics · the following sections provide background...
TRANSCRIPT


The material contained within this report is for the exclusive use of authorized Emergenetics® trainers and individual clients and is protected by United States copyright and trademark laws. The name Emergenetics is a federally registered trademark of Emergenetics, LLC. No part of this material may be used, sold, or reproduced in any manner without the written permission of Emergenetics, LLC.
©Emergenetics LLC, 2015

©Emergenetics LLC, 2015
R. Wendell Williams, MBA, Ph.D. July 2, 2014
The following sections provide background information to help participants understand the theoretical background, research, and development of the Emergenetics Profile.
Recognizing the need for a practical and easy to apply business personality tool that followed the Standards for Educational and Psychological Testing, R. Wendell Williams, PhD and Geil Browning, PhD, began a project in the late 1980’s to discover the most prevalent thinking and behavioral preferences of healthy working adults. They searched the literature for draft items, repeatedly administered surveys to participants attending personal development workshops, factor-analyzed the data, studied inter-item reliabilities, calculated homogenous item composites, and repeated the discovery process until the survey became psychometrically stable. Seven factors proved robust. They were identified as preferences for thinking analytically, socially, structurally, and conceptually; and, exhibiting behaviors described as expressive, assertive, and flexible. Descriptions were later replaced with colors to minimize perceived undesirability. These factors became the foundation for the Emergenetics Profile (EP). EP technical data include inter-item reliabilities between .71 and .83; ten-year test-retest reliabilities between .68 and .77; constructs validated with the Neo-FFI; and, 3rd party observer content validity correlations between .46 and .67. Most data were statistically significant at the p<.01 level. The current EP contains 100 items with scores normed against a population of over 100,000 adults. Subjects completing the profile learn the basic strengths and weaknesses of their own preferences; are able to compare themselves to others; better manage interpersonal differences; and, use this knowledge to become more productive. The profile follows the tenets of socio-analytic theory which defines self-descriptive tests as a measure of how one chooses to present him or herself to the world. Thus, workshop participants are encouraged to think of their profiles as useful patterns that influence, but not necessarily constrain, personal interactions. As with all self-reported instruments, EP preferences are not intended to imply specific skills.

©Emergenetics LLC, 2015
A quick review of personality instruments used in personal development workshops showed they typically fell into one of three categories: clinical, academic or lay instruments. While clinical instruments such as the MMPI are commonly used in business environments, they are more suited to DSM diagnostic classifications and not applicable to healthy people. Academically-developed instruments had a tendency to define the entire personality domain (e.g., CPI, B5 or HEXACO personality taxonomies). Lay instruments, the most commonly used of all business surveys (e.g. DISC, MBTI, and so forth) usually failed to follow professional test development standards, had unsupported theories, poor test-retest reliabilities, and/or weak to non-existent validity. Needless to say, the authors of the EP felt there was a widespread need for adults to understand, and put to practical use, a fairly simple, yet robust set of personality factors developed according to professional test development standards. Therefore, they conducted a comprehensive review of the literature including decades of academic investigations, neurological factors associated with split-brain research, genetic and environmental factors identified in mono-zygotic twin-research, and job-related factors identified in assessment-center investigations. This review produced an extensive list of potential items that were repeatedly administered to participants attending personal development workshops. After each administration, data were factor-analyzed, inter-item reliabilities were studied, and revisions made. Throughout the process, both rational and empirical methods were used to build homogenous item composites (i.e., a combination of rational and empirical items that define a specific personality space). When analyses showed the instrument was psychometrically stable, it was introduced into workshops where it was immediately well-received.
The authors never intended the EP to be an exhaustive trait taxonomy, nor did they intend to propose a new theory of personality. Rather, its purpose was to provide lay users with a robust research-backed framework of easily recognizable and eminently useful factors they could easily apply to work, communication, and interpersonal relationships. Combined with an accompanying workshop, participants learn how to:
Use basic tools to improve job performance and improve communication. Understand basic motivational drivers within a work environment. Pinpoint strengths and interests based on a heightened knowledge of personal preferences. Understand how behavior affects others and translate this knowledge into more confidence and
self-acceptance when working with others. Build a collaborative organizational workforce. Engage in meaningful dialogue and information about the way they go about their work.
Since its inception, the EP has followed professional validity and reliability standards outlined in the 1999 Standards for Educational and Psychological Testing. The EP report includes normative scores expressed as percentiles for four easily-recognizable thinking preferences as well as three common external behaviors. These include: Preferences for:
Analytical Thinking: problem solving, analysis, mathematical, and investigative interests
Structure and Rules: rule following, administrative guidelines, traditional, methodical
Social Concerns: collaboration, caring, giving, empathy

©Emergenetics LLC, 2015
Conceptualizing Ideas: unconventional, creative, unique, innovative
Behavioral descriptions of:
Expressiveness: ranging from quiet and reserved to outgoing and gregarious
Assertiveness: ranging from peacekeeper and accepting to competitive and driven
Flexibility: ranging from focused and firm to accommodating and easy going Because it yields practical results that can be easily applied within any context, the seven EP principles can be used as a human resource framework on which to build hiring criteria, conduct performance management, provide multi-rater feedback, and facilitate developmental activities.
A reputable developmental survey should meet the following criteria as outlined in the 1999 Standards for Educational and Psychological Testing:
Items that load on a specific factor must be consistent with each other and with the factor score. This is called inter-item reliability.
Factors within the test that are associated with each other should correlate, and ones that are independent should not. This is called convergent/discriminant validity.
Scores on the survey should directly relate to the content, construct, or criterion it is supposed to measure. This is referred to as content, construct, or criterion validity. Since the EP is intended to be a criterion-neutral instrument, no studies of criterion-related validity were conducted.
Subjects should agree items resemble “legitimate” questions. This is called face validity.
Internal integrity of a survey begins by examining Cronbach’s Coefficient-Alpha for each factor. Coefficient-Alpha refers to the average of all possible inter-item and split-half correlations, both strong and weak, without relying on single indicators of reliability which may contain large amounts of error. The inter-item reliabilities of the Emergenetics Profile (N= 89,101) range from .71 to .83 and are shown in Table 1.
Once we know individual items have acceptable inter-item reliabilities, we can examine relationships between factors by examining both convergent and discriminant correlations. This step evaluates factor independence. It should be noted that behavior is seldom “pure”. Like Venn diagrams, macro descriptions often cause some factor scores to co-vary with one another. For example, social assertiveness (i.e., Expressiveness) and task assertiveness (i.e., Assertiveness) both contain items that are related to assertiveness even though their goals are entirely different (e.g., accomplish tasks v. stand-out socially). So, even though factors like Expressiveness and Assertiveness have considerable co-variance (as can be observed in the following convergent-discriminant correlation table), they are both included in the report

©Emergenetics LLC, 2015
because they help subjects understand behavioral differences expressed by one attribute that are not explained by another. The following chart contains a summary of factor-level correlations.
Analytical Social Structure Conceptual Expressive Assertive
Social .090
Structure .029 .070
Conceptual .397 .367 -.464
Expressive .162 .649 -.196 .487
Assertive .316 .284 -.333 .502 .743
Flexibility .155 .858 -.001 .420 .718 .403
(N=89.101, p<.01)
Although a Convergent/Discriminant Correlation Table is an expected part of a technical manual, it reports data at the macro…not the granular… level. An examination of cross-tabulation tables is necessary to show interactions between factors at a more granular level. Tables 2-13 contain scores from 11,578 subjects re-coded into ranked percentiles (i.e., 0 to 33 = 1st, 34 to 66 = 2nd, and 67 to 100 = 3rd). It’s easy to see in Table 8, for example, that 49.6% of participants (n= 1965) who described themselves as high in Structure also had low Expressiveness scores; however, 12.4% of participants (n=492) with the same Structure score described themselves as high in Expressiveness. Similar granular differences between individual subjects illustrates why it’s important to report all seven factors at the granular level even though they might show significant covariance at the macro level. Face Validity refers to whether a survey-taker perceives the survey items to be credible. If thinking and behavioral preferences were to be measured, for example, asking questions about hobbies, vocations or religious preferences would seriously impair face-validity. Participants generally tell us the items are face-valid for describing general thinking and behavioral preferences. Construct Validity refers to whether the survey evaluates a deep-seated construct such as emotional sensitivity or intelligence. Construct validity was examined using the Neo-FFI, a Big-5 preference model published by Psychological Assessment Resources, Inc., Lutz, Florida. The NEO was developed by Paul Costa and Robert McCrae based on personality research conducted in the 1950’s showing that virtually all personality factors tend to cluster into five general factors. The B-5 model is well-respected, widely researched and extensively used for vocational counseling, mental illness and behavior, defining coping systems, and the like. Correlations between EP and the Neo-FFI are found in Tables 14-26. The NEO-FFI evaluates five domains, each consisting of four sub factors as follows:
1. Neuroticism (N): a compound score indicating the tendency to experience negative emotions such as fear, sadness, anger, disgust, embarrassment, and guilt. N1 (high sub-factor score): general anxiety, phobias, tense, jittery

©Emergenetics LLC, 2015
N2 (high sub-factor score): hostility, bitterness, anger, frustration N3 (high sub-factor score): depression, guilt, sadness, hopelessness, loneliness N4 (high sub-factor score): self-consciousness, sensitivity, inferiority, uncomfortable
2. Expressiveness (E): a compound score indicating preferences for liking people, being around
large groups, being assertive and talkative, upbeat, energetic, and active. E1 (high sub-factor score): warmth, affectionate, friendly, close attachments E2 (high sub-factor score): gregarious, other company E3 (high sub-factor score): dominant, forceful, social climbing E4 (high sub-factor score): energy, active, fast moving, thrill seeker
3. Openness (O): a compound score indicating active imagination, aesthetic sensitivity, inner feelings, variety, curiosity, and independence. O1 (high sub-factor score): fantasy, imaginative, daydreamer, creative O2 (high sub-factor score): aesthetic, art, beauty, music, poetry O3 (high sub-factor score): inner feelings, emotive, emotional depth and intensity O4 (high sub-factor score): willingness, try new things, novelty, variety
4. Agreeableness (A): a compound score indicating sympathy and eagerness to help A1 (high sub-factor score): trust, honest, well-intentioned A2 (high sub-factor score): straightforwardness, frank, sincere, ingenuous A3 (high sub-factor score): altruistic, concern for others, generous, helpful A4 (high sub-factor score): compliance, withdrawn, forgive, deference
5. Conscientiousness (C): a compound score indicating strong will, self-control, planning, organizing, purposefulness, and achievement. C1 (high sub-factor score): competence, capable, sensible, prudent effective C2 (high sub-factor score): order, tidy, well organized, planful C3 (high sub-factor score): dutiful, ethical, conscientious, moral obligations C4 (high sub-factor score): achievement, aspiration, diligent, driven
A quick examination of the Big-5 factors shows they are anything but simple… sub-factors in the same cluster are in fact often highly dissimilar and a product of empirical, not rational, classification. For example, the B-5 Conscientiousness factor contains both a planful element (C2) and a driven element (C4). However, notwithstanding the fact the two instruments may use different items to define their factors, items included in the EP convergent/discriminant analysis table indicates that being planful and being driven are negatively related. Table 14, for example, actually shows C4 is correlated with the EP Analytical factor (r=.274) and Table 15 shows C2 is correlated with the EP Structural factor (r=.543). Thus, although all EP correlations with the NEO-PI B5 factors and sub-factors are shown in Tables 14-26, the most significant and rational findings require examination at the sub-factor level. Table 14 also shows significant correlations between Analytical and five B5 sub-factors (i.e., E1, E3, C1, C3, and C4). Table 15 Shows significant correlations between Structural and 13 B5 sub-factors (i.e., N1, N4, E1, E2, E3, E4, O1, O2, O3, O4, A1, A2, and C2).

©Emergenetics LLC, 2015
Table 16 Shows significant correlations between Conceptual and 11 B5 sub-factors (i.e. N1, N4, E1, E3, E4, O1, O2, O3, O4, A1, and C2). Table 17 Shows significant correlations between Social and nine B5 sub-factors (i.e., E1, E2, E3, E4, O1, O2, O3, A2, and, A3). Table 18 Shows significant correlations between Expressiveness and five B5 sub-factors (i.e., E1, E3, C1, C3, and, C4). Table 19 Shows significant correlations between Assertiveness and 11 B5 sub-factors (i.e., N2, N4, E1, E2, E3, E4, O3, A2, A3, A4, and C4). Table 20 Shows significant correlations between Flexibility and 11 B5 sub-factors (i.e., E1, E2, E3, E4, O1, O2, O3, O4, A1, A3, and C1). Correlations with the major B5 factors are shown in Tables 21-26. As can be observed, the Emergenetics Profile shows strong correlations with both the NEO-FFI sub-factors and its main factors. This pattern provides evidence of construct validity with an established Big-5 personality instrument. Although it is a highly popular commercial instrument, correlations were not done with the MBTI typestyles because it does not meet professional test development standards. Content Validity refers to the adequacy of the Emergenetics Profile to measure and predict the behavior it is supposed to measure. This type of external validity was confirmed by comparing Emergenetics Profile scores to ratings from independent observers. Raters selected by 78 Targets were asked to read a short description of each Emergenetics Factor and rate the Target using a 1-7 Likert scale. Final scores were examined. Raters whose scores showed minimal variance between items were eliminated. The remaining scores were averaged for each Target, standardized and correlated with the Target’s self-reported Emergenetics Profile. The results from the 65 remaining Targets who completed the survey with 3 to 7 raters each are shown below.
Factor Correlation
Analytical .460
Structural .637
Social .575
Conceptual .567
Expressive .673
Assertive .563
Flexible .428
(N=65, p<.01)

©Emergenetics LLC, 2015
This analysis confirmed the seven Emergenetics factors are Content valid. That is, self-reported scores on the Emergenetics Profile reflect behaviors that can be observed by independent Raters.
A test-retest/longitudinal study of the Emergenetics Profile was conducted to determine if profile factors were stable over a long time span; i.e., would scores remain essentially the same if someone completed the profile years ago? A test-retest reliability study included 191 Females and 117 Males. The subjects completed their first profiles in late 1993. A second set of profiles was completed by the same subjects about 10 years later in 2003. Means and SD’s for the first and second administration are shown in Table 27. Bivariate correlations ranged between r =.68 and r = .77 depending on the factor (see Table 28). A separate test-retest analysis of 98 subjects using a one-way ANOVA (Table 29) showed six of the seven factors had no statistically significant difference in scores.
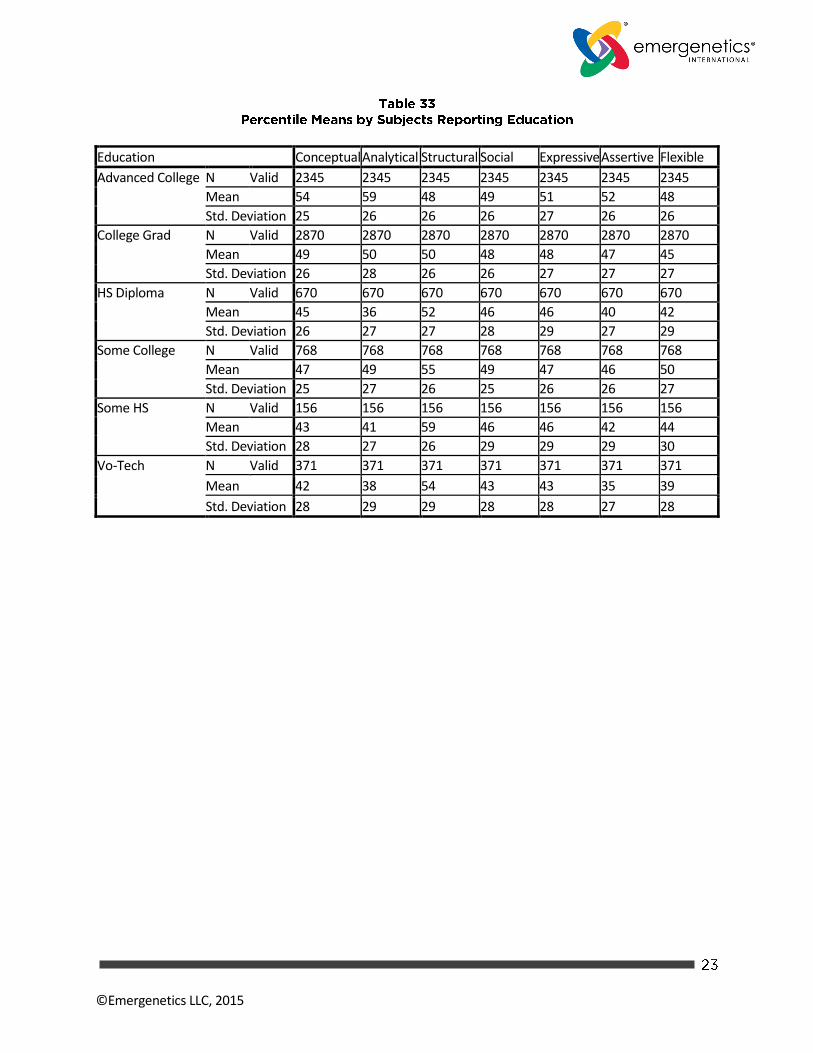
Because organizations tend to expand across all cultures and countries, regardless of the local environment, they share similar expectations for employee behavior and performance objectives even within the same company, department, city, or country. Because we believe it’s increasingly important for people to understand and utilize their individual differences in a global work environment, EP survey raw scores are converted to global norms which are periodically updated every few years. Percentile means of subjects reporting age, ethnicity, gender, and education in 2012 can be found in Tables 31-33 of the Appendix.
The data confirms the Emergenetics Profile instrument meets the criteria for face validity, external validity, split-half reliability, inter-item reliability, and test-retest reliability. It provides valuable information about robust practical thinking and behavioral preferences and stays up to date by gathering norms from tens of thousands of subjects worldwide. Workshop attendees around the world have reported the instrument provides a useful tool for improving interpersonal effectiveness, assembling work teams, enhancing presentations, accepting and appreciating the contributions of people with different preferences.

©Emergenetics LLC, 2015
Emergenetics Factor Coefficient Alpha
Analytical .83
Structural .71
Social .76
Conceptual .76
Expressiveness .78
Assertiveness .78
Flexibility .79
(N=89,101)
Expressive Rank
Total 1st 2nd 3rd
Analytical Rank
1st Count 1229 986 549 2764
% within Analytical Rank 44.5% 35.7% 19.9% 100.0%
2nd Count 1696 1965 917 4578
% within Analytical Rank 37.0% 42.9% 20.0% 100.0%
3rd Count 1203 1912 1121 4236
% within Analytical Rank 28.4% 45.1% 26.5% 100.0%
Total Count 4128 4863 2587 11578
% within Analytical Rank 35.7% 42.0% 22.3% 100.0%
Assertiveness Rank
Total 1st 2nd 3rd
Analytical Rank
1st Count 1390 923 451 2764
% within Analytical Rank 50.3% 33.4% 16.3% 100.0%
2nd Count 1549 2043 986 4578
% within Analytical Rank 33.8% 44.6% 21.5% 100.0%
3rd Count 865 1893 1478 4236
% within Analytical Rank 20.4% 44.7% 34.9% 100.0%
Total Count 3804 4859 2915 11578
% within Analytical Rank 32.9% 42.0% 25.2% 100.0%

©Emergenetics LLC, 2015
Flexible Rank
Total 1st 2nd 3rd
Analytical Rank
1st Count 1207 1056 501 2764
% within Analytical Rank 43.7% 38.2% 18.1% 100.0%
2nd Count 1494 2056 1028 4578
% within Analytical Rank 32.6% 44.9% 22.5% 100.0%
3rd Count 996 1880 1360 4236
% within Analytical Rank 23.5% 44.4% 32.1% 100.0%
Total Count 3697 4992 2889 11578
% within Analytical Rank 31.9% 43.1% 25.0% 100.0%
Expressive Rank
Total 1st 2nd 3rd
Social Rank 1st Count 2383 1144 184 3711
% within Social Rank 64.2% 30.8% 5.0% 100.0%
2nd Count 1482 2534 986 5002
% within Social Rank 29.6% 50.7% 19.7% 100.0%
3rd Count 263 1185 1417 2865
% within Social Rank 9.2% 41.4% 49.5% 100.0%
Total Count 4128 4863 2587 11578
% within Social Rank 35.7% 42.0% 22.3% 100.0%
Assertiveness Rank
Total 1st 2nd 3rd
Social Rank 1st Count 1754 1320 637 3711
% within Social Rank 47.3% 35.6% 17.2% 100.0%
2nd Count 1477 2296 1229 5002
% within Social Rank 29.5% 45.9% 24.6% 100.0%
3rd Count 573 1243 1049 2865
% within Social Rank 20.0% 43.4% 36.6% 100.0%
Total Count 3804 4859 2915 11578
% within Social Rank 32.9% 42.0% 25.2% 100.0%

©Emergenetics LLC, 2015
Flexible Rank
Total 1st 2nd 3rd
Social Rank 1st Count 2713 951 47 3711
% within Social Rank 73.1% 25.6% 1.3% 100.0%
2nd Count 927 3198 877 5002
% within Social Rank 18.5% 63.9% 17.5% 100.0%
3rd Count 57 843 1965 2865
% within Social Rank 2.0% 29.4% 68.6% 100.0%
Total Count 3697 4992 2889 11578
% within Social Rank 31.9% 43.1% 25.0% 100.0%
Expressive Rank
Total 1st 2nd 3rd
Structure Rank
1st Count 451 967 1040 2458
% within Structure Rank 18.3% 39.3% 42.3% 100.0%
2nd Count 1712 2392 1055 5159
% within Structure Rank 33.2% 46.4% 20.4% 100.0%
3rd Count 1965 1504 492 3961
% within Structure Rank 49.6% 38.0% 12.4% 100.0%
Total Count 4128 4863 2587 11578
% within Structure Rank 35.7% 42.0% 22.3% 100.0%
Assertiveness Rank
Total 1st 2nd 3rd
Structure Rank
1st Count 451 908 1099 2458
% within Structure Rank 18.3% 36.9% 44.7% 100.0%
2nd Count 1544 2369 1246 5159
% within Structure Rank 29.9% 45.9% 24.2% 100.0%
3rd Count 1809 1582 570 3961
% within Structure Rank 45.7% 39.9% 14.4% 100.0%
Total Count 3804 4859 2915 11578
% within Structure Rank 32.9% 42.0% 25.2% 100.0%

©Emergenetics LLC, 2015
Flexible Rank
Total 1st 2nd 3rd
Structure Rank
1st Count 647 1048 763 2458
% within Structure Rank 26.3% 42.6% 31.0% 100.0%
2nd Count 1648 2304 1207 5159
% within Structure Rank 31.9% 44.7% 23.4% 100.0%
3rd Count 1402 1640 919 3961
% within Structure Rank 35.4% 41.4% 23.2% 100.0%
Total Count 3697 4992 2889 11578
% within Structure Rank 31.9% 43.1% 25.0% 100.0%
Expressive Rank
Total 1st 2nd 3rd
Conceptual Rank
1st Count 2060 1108 250 3418
% within Conceptual Rank
60.3% 32.4% 7.3% 100.0%
2nd Count 1629 2576 1085 5290
% within Conceptual Rank
30.8% 48.7% 20.5% 100.0%
3rd Count 439 1179 1252 2870
% within Conceptual Rank
15.3% 41.1% 43.6% 100.0%
Total Count 4128 4863 2587 11578
% within Conceptual Rank
35.7% 42.0% 22.3% 100.0%

©Emergenetics LLC, 2015
Assertiveness Rank
Total 1st 2nd 3rd
Conceptual Rank
1st Count 1918 1150 350 3418
% within Conceptual Rank 56.1% 33.6% 10.2% 100.0%
2nd Count 1478 2543 1269 5290
% within Conceptual Rank 27.9% 48.1% 24.0% 100.0%
3rd Count 408 1166 1296 2870
% within Conceptual Rank 14.2% 40.6% 45.2% 100.0%
Total Count 3804 4859 2915 11578
% within Conceptual Rank 32.9% 42.0% 25.2% 100.0%
Flexible Rank
Total 1st 2nd 3rd
Conceptual Rank
1st Count 1817 1300 301 3418
% within Conceptual Rank
53.2% 38.0% 8.8% 100.0%
2nd Count 1434 2557 1299 5290
% within Conceptual Rank
27.1% 48.3% 24.6% 100.0%
3rd Count 446 1135 1289 2870
% within Conceptual Rank
15.5% 39.5% 44.9% 100.0%
Total Count 3697 4992 2889 11578
% within Conceptual Rank
31.9% 43.1% 25.0% 100.0%
E1 -.228 (opposite of ) warmth, affectionate, friendly, close attachments
E3 .207 dominant, forceful, social climbing
C1 .233 competence, capable, sensible, prudent effective
C3 .175 dutiful, ethical, conscientious, moral obligations
C4 .274 achievement, aspiration, diligent, driven
(N=98, p<.01)

©Emergenetics LLC, 2015
N1 .307 general anxiety, phobias, tense, jittery
N4 .293 self-consciousness, sensitivity, inferiority, uncomfortable
E1 -.206 (opposite of ) warmth, affectionate, friendly, close attachments
E2 -.243 (opposite of ) gregarious, other company
E3 -.350 (opposite of ) dominant, forceful, social climbing
E4 -.221 (opposite of ) energy, active, fast moving, thrill seeker
O1 -.362 (opposite of ) fantasy, imaginative, daydreamer, creative
O2 -.340 (opposite of ) aesthetic, art, beauty, music, poetry
O3 -.303 (opposite of ) inner feelings, emotive, emotional depth and intensity
O4 -.508 (opposite of ) willingness, try new things, novelty, variety
A1 -.273 (opposite of ) trust, honest, well-intentioned
A2 .171 straightforwardness, frank, sincere, ingenuous
C2 .543 order, tidy, well organized, planful
(N=98, p<.01)
N1 -.184 (opposite of ) general anxiety, phobias, tense, jittery
N4 -.199 (opposite of ) self-consciousness, sensitivity, inferiority, uncomfortable
E1 .524 warmth, affectionate, friendly, close attachments
E3 .316 dominant, forceful, social climbing
E4 .264 energy, active, fast moving, thrill seeker
O1 .519 fantasy, imaginative, daydreamer, creative
O2 .348 aesthetic, art, beauty, music, poetry
O3 .342 inner feelings, emotive, emotional depth and intensity
O4 .381 willingness, try new things, novelty, variety
A1 .228 trust, honest, well-intentioned
C2 -.516 (opposite of ) order, tidy, well organized, planful
(N=98, p<.01)

©Emergenetics LLC, 2015
E1 .592 warmth, affectionate, friendly, close attachments
E2 .412 gregarious, other company
E3 .235 dominant, forceful, social climbing
E4 .264 energy, active, fast moving, thrill seeker
O1 .300 fantasy, imaginative, daydreamer, creative
O2 .364 aesthetic, art, beauty, music, poetry
O3 .553 inner feelings, emotive, emotional depth and intensity
A2 -.186 (opposite of ) straightforwardness, frank, sincere, ingenuous
A3 .240 altruistic, concern for others, generous, helpful
(N=98, p<.01)
E1 .524 warmth, affectionate, friendly, close attachments
E3 .207 dominant, forceful, social climbing
C1 .233 competence, capable, sensible, prudent effective
C3 .175 dutiful, ethical, conscientious, moral obligations
C4 .274 achievement, aspiration, diligent, driven
(N=98, p<.01)
N2 .226 hostility, bitterness, anger, frustration
N4 -.235 (opposite of ) self-consciousness, sensitivity, inferiority, uncomfortable
E1 .174 warmth, affectionate, friendly, close attachments
E2 .289 gregarious, other company
E3 .706 dominant, forceful, social climbing
E4 .482 energy, active, fast moving, thrill seeker
O3 .385 inner feelings, emotive, emotional depth and intensity
A2 -.316 (opposite of ) straightforwardness, frank, sincere, ingenuous
A3 -.201 (opposite of ) altruistic, concern for others, generous, helpful
A4 -.576 (opposite of ) compliance, withdrawn, forgive, deference
C4 .363 achievement, aspiration, diligent, driven
(N=98, p<.01)

©Emergenetics LLC, 2015
E1 .622 warmth, affectionate, friendly, close attachments
E2 .403 gregarious, other company
E3 .210 dominant, forceful, social climbing
E4 .179 energy, active, fast moving, thrill seeker
O1 .250 fantasy, imaginative, daydreamer, creative
O2 .429 aesthetic, art, beauty, music, poetry
O3 .443 inner feelings, emotive, emotional depth and intensity
O4 .248 willingness, try new things, novelty, variety
A1 .217 trust, honest, well-intentioned
A3 .314 altruistic, concern for others, generous, helpful
C1 .212 competence, capable, sensible, prudent effective
(N=98, p<.01)
Analytical Structural Social Conceptual Expressive Assertive Flexible
N Corr. 0.003 .218(*) 0.088 -0.118 0.006 -0.049 -0.137
Sig 0.490 0.016 0.195 0.126 0.477 0.316 0.091
E Corr. -0.032 -.342(**) .486(**) .269(**) .731(**) .554(**) .457(**)
Sig 0.377 0.000 0.000 0.004 0.000 0.000 0.000
O Corr. -0.077 -.517(**) .459(**) .547(**) .446(**) .223(*) .471(**)
Sig 0.228 0.000 0.000 0.000 0.000 0.014 0.000
A Corr. -0.105 0.029 0.028 -0.027 -.195(*) -.365(**) .170(*)
Sig 0.154 0.388 0.394 0.395 0.028 0.000 0.048
C Corr. .271(**) .201(*) .178(*) -0.167 .225(*) .203(*) .192(*)
Sig 0.004 0.024 0.041 0.052 0.013 0.023 0.030
(N=98, p<= .01)

©Emergenetics LLC, 2015
Analytical Analytical Structural Social Conceptual Expressive Assertive
N1 Corr. 0.136 .307(**) 0.129 -.184(*) 0.022 -0.086 -0.085
Sig 0.092 0.001 0.104 0.035 0.415 0.201 0.204
N2 Corr. -0.063 0.006 0.167 0.055 .251(**) .266(**) -0.059
Sig 0.270 0.476 0.051 0.295 0.007 0.004 0.283
N3 Corr. 0.004 0.091 -0.010 -0.046 -0.069 -0.101 -0.148
Sig 0.485 0.189 0.462 0.327 0.250 0.163 0.074
N4 Corr. -0.087 .293(**) -0.007 -.199(*) -.189(*) -.235(*) -0.153
Sig 0.198 0.002 0.472 0.025 0.032 0.010 0.067
(N=98, p<.01)
Analytical Structural Social Conceptual Expressive Assertive Flexible
E1 Corr. -.228(*) -.206(*) .592(**) .202(*) .524(**) .174(*) .622(**)
Sig 0.012 0.022 0.000 0.024 0.000 0.044 0.000
E2 Corr. -0.146 -.243(**) .412(**) 0.116 .511(**) .289(**) .403(**)
Sig 0.076 0.008 0.000 0.129 0.000 0.002 0.000
E3 Corr. .207(*) -.350(**) .235(*) .316(**) .650(**) .706(**) .210(*)
Sig 0.021 0.000 0.010 0.001 0.000 0.000 0.020
E4 Corr. 0.051 -.221(*) .264(**) .192(*) .526(**) .482(**) .179(*)
Sig 0.311 0.015 0.005 0.030 0.000 0.000 0.039
(N=98, p<.01)

©Emergenetics LLC, 2015
Analytical Structural Social Conceptual Expressive Assertive Flexible
O1 Corr. -0.118 -.362(**) .300(**) .519(**) .251(**) 0.127 .250(**)
Sig 0.126 0.000 0.001 0.000 0.007 0.108 0.007
O2 Corr. -0.051 -.340(**) .364(**) .348(**) .256(**) 0.039 .429(**)
Sig 0.310 0.000 0.000 0.000 0.006 0.351 0.000
O3 Corr. -0.023 -.303(**) .553(**) .342(**) .637(**) .385(**) .443(**)
Sig 0.411 0.001 0.000 0.000 0.000 0.000 0.000
O4 Corr. -0.023 -.508(**) 0.132 .381(**) .204(*) 0.148 .248(**)
Sig 0.410 0.000 0.099 0.000 0.022 0.074 0.007
(N=98, p<.01)
Analytical Structural Social Conceptual Expressive Assertive Flexible
A1 Corr -0.128 -.273(**) 0.148 .228(*) .178(*) 0.036 .217(*)
Sig.
0.106 0.003 0.074 0.012 0.041 0.362 0.016
A2 Corr 0.062 .171(*) -.186(*) -0.148 -.322(**) -.316(**) -0.022
Sig.
0.274 0.047 0.034 0.075 0.001 0.001 0.414
A3 Corr -0.082 0.077 .240(**) -0.009 -0.013 -.201(*) .314(**)
Sig.
0.213 0.228 0.009 0.466 0.451 0.024 0.001
A4 Corr -0.158 0.132 -0.047 -0.148 -.376(**) -.576(**) 0.063
Sig.
0.060 0.099 0.323 0.073 0.000 0.000 0.271
(N=98, p<.01)

©Emergenetics LLC, 2015
(n=98)
(N=98, p<.01)
Analytical Structural Social Conceptual Expressive Assertive Flexible
C1 Corr. .233(*) 0.015 .188(*) 0.060 .169(*) 0.155 .212(*)
Sig 0.011 0.441 0.033 0.280 0.049 0.065 0.019
C2 Corr. 0.116 .543(**) 0.045 -.516(**) 0.027 -0.043 0.049
Sig 0.130 0.000 0.332 0.000 0.396 0.337 0.318
C3 Corr. .175(*) 0.017 0.051 -0.003 0.072 0.153 0.166
Sig 0.043 0.435 0.310 0.487 0.243 0.067 0.052
C4 Corr. .274(**) -0.137 .246(**) 0.128 .397(**) .363(**) 0.158
Sig 0.003 0.090 0.008 0.105 0.000 0.000 0.061

©Emergenetics LLC, 2015
(N=308)
Analysis #2
Structure #2
Social #2
Conceptual #2
Expressive #2
Assertive #2
Flexible #2
Analysis #1 .76
Structural #1 .75
Social #1 .74
Conceptual #1 .76
Expressiveness #1 .77
Assertive #1 .68
Flexibility #1 .71
(N=308, p<.01)
Mean Std. Deviation
Analysis First 51 25
Second 50 26
Structural First 40 24
Second 38 27
Social First 46 24
Second 48 26
Conceptual First 54 25
Second 61 26
Expressiveness First 53 24
Second 53 25
Assertive First 58 23
Second 56 24
Flexibility First 46 24
Second 47 25

©Emergenetics LLC, 2015
Levene's Test for Equality of Variances t-Test for Equality of Means
F Sig. T Df Sig. (2-tailed)
Mean Difference
Std. Error Difference
95% Confidence Interval of the Difference
Lower Upper
Analytical Equal variances assumed
.839 .360 .722 614 .470 1.513 2.094 -2.600 5.626
Equal variances not assumed
.722 613.0
13 .470 1.513 2.094 -2.600 5.626
Structural Equal variances assumed
4.081 .044 1.126 614 .261 2.373 2.108 -1.767 6.513
Equal variances not assumed
1.126 608.8
86 .261 2.373 2.108 -1.767 6.513
Social Equal variances assumed
2.250 .134 -.984 614 .325 -1.990 2.022 -5.961 1.981
Equal variances not assumed
-.984 610.3
18 .325 -1.990 2.022 -5.961 1.981
Conceptual
Equal variances assumed
.570 .450 -3.549
614 .000 -7.484 2.109 -11.625 -3.343
Equal variances not assumed
-3.549
613.115
.000 -7.484 2.109 -11.625 -3.343
Expressiveness
Equal variances assumed
.012 .914 .285 614 .776 .578 2.028 -3.404 4.560
Equal variances not assumed
.285 613.3
85 .776 .578 2.028 -3.404 4.560
Assertive Equal variances assumed
.139 .710 .909 614 .364 1.750 1.924 -2.029 5.529
Equal variances not assumed
.909 613.9
12 .364 1.750 1.924 -2.029 5.529
Flexible Equal variances assumed
1.396 .238 -.354 614 .723 -.714 2.018 -4.676 3.248
Equal variances not assumed
-.354 612.1
26 .723 -.714 2.018 -4.676 3.248
(N=98, p<.01)

©Emergenetics LLC, 2015
Age Conceptual Analytical Structural Social Expressive Assertive Flexible
N Valid 19541 19541 19541 19541 19541 19541 19541
Mean 50 52 50 50 50 51 51
Std. Deviation 28 29 28 28 29 29 28
21 - 30 N Valid 1485 1485 1485 1485 1485 1485 1485
Mean 47 50 51 49 49 46 44
Std. Deviation 26 29 26 27 27 27 28
31 - 40 N Valid 2512 2512 2512 2512 2512 2512 2512
Mean 49 51 50 48 49 49 45
Std. Deviation 26 28 26 26 28 27 27
41 - 50 N Valid 2034 2034 2034 2034 2034 2034 2034
Mean 50 51 49 47 48 47 47
Std. Deviation 26 28 27 26 27 27 27
51 - 60 N Valid 927 927 927 927 927 927 927
Mean 49 50 52 48 46 43 48
Std. Deviation 26 27 26 26 28 27 27
61 - 70 N Valid 185 185 185 185 185 185 185
Mean 45 50 55 46 46 42 45
Std. Deviation 27 28 26 25 27 27 27
71 - Up N Valid 12 12 12 12 12 12 12
Mean 48 57 44 40 44 42 38
Std. Deviation 25 30 29 31 24 19 31
Under 21 N Valid 120 120 120 120 120 120 120
Mean 48 42 57 57 50 45 46
Std. Deviation 27 27 27 27 30 28 30

©Emergenetics LLC, 2015
Percentile Means by Subjects Reporting Gender
African American Asian Caucasian Hispanic Other
Subjects
416 2564 6083 767 379
Analysis 55 53 53 61 54
Social 49 47 46 50 45
Structural 54 57 51 58 53
Conceptual 47 47 47 47 46
Flexibility 52 43 46 54 46
Assertive 48 41 48 52 46
Expressiveness 47 41 46 51 44
Gender N Mean Std. Deviation
Female Analytical 48125 46 11
Social 48125 60 9
Structure 48125 37 8
Conceptual 48125 52 9
Expressive 48125 56 10
Assertive 48125 57 11
Flexibility 48125 60 10
Male Analytical 40976 52 11
Social 40976 58 9
Structure 40976 34 8
Conceptual 40976 54 9
Expressive 40976 55 10
Assertive 40976 60 11
Flexibility 40976 58 10
©Emergenetics LLC, 2015
Education Conceptual Analytical Structural Social Expressive Assertive Flexible
Advanced College N Valid 2345 2345 2345 2345 2345 2345 2345
Mean 54 59 48 49 51 52 48
Std. Deviation 25 26 26 26 27 26 26
College Grad N Valid 2870 2870 2870 2870 2870 2870 2870
Mean 49 50 50 48 48 47 45
Std. Deviation 26 28 26 26 27 27 27
HS Diploma N Valid 670 670 670 670 670 670 670
Mean 45 36 52 46 46 40 42
Std. Deviation 26 27 27 28 29 27 29
Some College N Valid 768 768 768 768 768 768 768
Mean 47 49 55 49 47 46 50
Std. Deviation 25 27 26 25 26 26 27
Some HS N Valid 156 156 156 156 156 156 156
Mean 43 41 59 46 46 42 44
Std. Deviation 28 27 26 29 29 29 30
Vo-Tech N Valid 371 371 371 371 371 371 371
Mean 42 38 54 43 43 35 39
Std. Deviation 28 29 29 28 28 27 28

©Emergenetics LLC, 2015
APA. (1985). Standards for educational and psychological testing . Washington, DC: American Psychological Association. Barrick, M. R., & Mount, M. K. (1991). The big five personality dimensions and job performance: A meta analysis. Personnel Psychology, 44, 1-26. Costa, P. T., & McCrae, R. R. (1988). From catalog to classification: Murray's needs and the Five Factor Model. Journal of Personality and Social Psychology, 55, 258-265. Deiner, E., Larsen, R., & Emmons, R. A. (1984). Person x situation interactions: Choice of situations and congruence response models. Journal of Personality and Social Psychology, 47, 580-592. Furnham, A. (1992). Personality at work: The role of individual differences in the workplace. London: Rutledge. Furnham, A., & Stringfield, P. (1993). Personality and occupational behavior: Meyers-Briggs Type Indicator correlates of managerial practices in two cultures. Human Relations, 47 (7), 827-848. Gottfredson, G. D., & Holland, J. L. (1991). The position classification inventory. Odessa, FL: Psychological Assessment Resources. Hogan, R., Curphy, G. J., & Hogan, J. (1994). What we know about leadership. American Psychologist(June), 493-504. Hogan, R., DeSoto, C. B., & Solano, C. (1977). Traits, tests, and personality research. American Psychologist(April), 255-264. Hogan, R., Hogan, J., & Roberts, B. W. (1996). Personality measurement and employment decisions. American Psychologist, 51 (5)(May). Hogan, R., Raskin, R., & Fazzini, D. (1990). The dark side of charisma. In K. E. Clark & M. B. Clark (Eds.), Measures of Leadership (pp. 343-354). West Orange, NJ: Leadership Library of America. Hogan, R. T. (1991). Personality and personality measurement. In M. D. Dunnette & L. M. Hough (Eds.), Handbook of Industrial and Organizational Psychology (Vol. 2, pp. 873-919). Palo Alto, CA: Consulting Psychologists Press, Inc. Holland, J. L. (1985). Making Vocational Choices: A Theory of vocational personalities and work environments. Englewood Cliffs, NJ: Prentice-Hall. Holland, J. L. (1992). Making vocational choices. (2nd ed.). Odessa, FL: Psychological Assessment Resources. Kinder, A., & Robertson, I. T. (1991). Do you have the personality to be a leader? The importance of personality dimensions for successful managers and leaders. Leadership & Organization Development Journal, 15 (1), 3-12.

©Emergenetics LLC, 2015
Ostroff, C. (1992). The relationship between satisfaction, attitudes, and performance: An organizational level analysis. Journal of Applied Psychology, 77 (6), 963-974. Schmidt, F. L., & Hunter, J. E. (1981). Employment testing: old theories and new research findings. American Psychologist, 36 (10), 1128-1137. Tupes, E. C., & Christal, R. E. (1961). Recurrent personality factors based on trait ratings : United States Air Force. van Zwanenberg, N., & Wilkinson, L. J. (1993). The person specification - a problem masquerading as a solution? Personnel Review, 22 (7), 54-65.

©Emergenetics LLC, 2015
Dr. Wendell Williams is the co-founder of the Emergenetics Profile and the developer of the ESP Hiring Assessment. Dr. Williams has worked with Emergenetics CEO Dr. Geil Browning since the inception of the company and continues in an expert development and advisory role as well as being a close friend. Dr. Williams is a performance expert with a wealth of experience in assessment, testing, and training; including line, staff, and executive management positions. He has worked on production lines, managed work groups of all sizes, established large training departments, managed three companies, and consulted with hundreds of organizations, including many Fortune 500 organizations. Academically, Wendell holds a BS in Industrial Management, MBA, MS in applied social psychology, and a Ph.D. in industrial psychology. In addition, he has earned a Chartered Financial Consultant Certification and once held four NASD securities licenses. Wendell has been widely quoted both nationally and internationally. His comments have been included in the Harvard Business Review and the Wall Street Journal to name a few. He is also an ERE Featured Columnist. He holds memberships in the American Psychological Association and The Society for Industrial and Organizational Psychology. His professional website is www.ScientificSelection.com.