the emergenetics profile technical report
TRANSCRIPT

1
©Emergenetics LLC, 1993-2020
The Emergenetics Profile Technical Report
R. Wendell Williams, MBA, Ph.D.
Revised: March 2020
Introduction
The value of a self-reported personality test depends on its usefulness. Academic studies usually address personality in extremely comprehensive terms. In the late 19th and early 20th centuries, for example, personality investigators based theories on the human lexicon. Sir Frances Galton, as one example, in the late 1800’s extracted about 1,000 personality-related words from the thesaurus; and, in the early 1900’s, Allport and Odbert identified roughly 4,000 adjectives using a dictionary. By eliminating synonyms, Cattell proposed 171 personality factors which he eventually reduced to 16. In the late 1950’s, Tupes and Christal’s analysis showed personality items could be statistically clustered into 20-30 sub-factors arranged into five meta-domains referred to as the Five Factor Model (FFM). However, even the FFM personality taxonomy does not represent settled science. Investigators continue to debate whether there is a unified theory of personality; whether personality is based on temperament, environment, social factors, or heredity; whether it is stable or situational; or, whether models with three, six, or more factors are better. What is clear, though, is the average lay person finds comprehensive personality taxonomies exceptionally difficult to apply. Hogan (Hogan, R, 1991) has long argued the utility of a generalized personality instrument depends on its practicality. Hogan and colleagues have also argued that nomological web clustering should be the basis for personality and its assessment as opposed to the FFM process of granular lexical analysis. Hogan also suggested that by forming clusters of homogeneous personality variables that demonstrate high construct and criterion-related validity, one can identify a practical Socioanalytic framework that provides more actionable information than FFM trait analysis. An informal review of personality instruments used in personal development workshops typically fall into one of three categories: diagnostic, academic, or lay-designed instruments. While diagnostic instruments such as the MMPI are commonly (mis)used in business environments, they are not applicable to healthy people (Drayton, 2009). Academically-developed instruments tend to define the entire personality domain and can be difficult to apply (e.g., CPI, B5 or HEXACO personality taxonomies; Gough, 1956; Barrick & Mount, 1991; Ashton et al., 2004). Lay-designed instruments, including the most commonly used workshop

2
©Emergenetics LLC, 1993-2020
surveys, often fail to meet minimal professional test development standards, have unsupported theories, poor test-retest reliabilities, and/or weak to non-existent validity (Pittenger, 2005). Faced with the current personality-survey market, the Emergenetics authors felt there was a widespread need for a simple, yet robust, personality tool that followed professional test development standards. They began with a comprehensive review of decades of academic investigations; their extensive personal experience with job analyses; a review of job-related factors measured in assessment-centers (Tupes & Christal, 1961; Hogan, DeSoto, & Solano, 1977; Schmidt & Hunter, 1981; Holland, 1985, 1992; Costa & McCrea, 1988, 1992; Barrick & Mount, 1991, 2012; Hogan, 1991; Kinder & Robertson, 1991); research data from Sperry and Gazzaniga’s study of corpus callosotomy patients; and, monozygotic and dizygotic twin studies conducted at the University of Minnesota.
The resulting survey items were assembled to form a nomological and empirical approach to behavior
based on simplified verifiable observation. Unlike comprehensive theories like the FFM which includes all
nuances of the personality domain, Emergenetics measures fundamental preferences for thinking and
acting at a situational level. Mills and Johnson (1978) and Hogan (1982), referred to this as Socioanalytic
theory, suggesting specific human behaviors evolved as people learn to get along with each other, gain
status, secure power, and understand their place in the world. They suggest that human behavior follows a
set predictable patterns representing how people want to present themselves to others. The following Venn diagram represents a simplified visual overlap between theories.
Sperry and Gazzaniga’s Studies
University of Minnesota Studies
Emergenetics
Academic Personality Theories
Management, Assessment Center, and Performance Studies

3
©Emergenetics LLC, 1993-2020
The following are examples of nomological items gathered during the research phase of development.
• Enjoys problem solving and figuring out how things work
• Bases decisions on intuition rather than rigorous analysis
• Likes investigating problems • Is outgoing and expressive
• Enjoys learning • Starts conversations easily with strangers
• Likes working with analytical tools • Enjoys recognition and admiration
• Prefers to follow rules • Feels comfortable in group settings
• Works within established guidelines • Is driven and competitive
• Tends to be methodical • Perceived as pushy
• Is skeptical of new and untried ideas • Willing to argue a point of view
• Likes being organized and cautious • May act or talk without thinking
• Enjoys working with others in close collaboration
• Not discouraged by obstacles
• Shows empathy and caring for others • Accommodates most situations
• Considers how other people feel • Is easy-going
• Enjoys new or unconventional ideas • Feels comfortable with uncertainty
• Enjoys generating new ideas • Seldom gets upset by unexpected events
A nomological network provides a robust model that encourages participants to think of their Profiles as
useful patterns that influence, but not necessarily constrain, personal interactions. As with all self-
descriptive instruments, the Emergenetics Profile does not necessarily predict specific skills; however, when
delivered in combination with an interactive workshop, participants are exposed to:
● Basic tools to improve job performance and improve communication. ● Basic motivational drivers within a work environment. ● Strengths and interests based on a heightened knowledge of personal preferences. ● How behavior affects others and translate this knowledge into more confidence and self-
acceptance when working with others. ● Ways to build a collaborative organizational workforce. ● Tools for engaging in meaningful dialogue and information about the way they go about work.

4
©Emergenetics LLC, 1993-2020
Professional Development of an Instrument
A reputable survey should meet the following criteria as outlined in the Standards for Educational and Psychological Testing (AERA, APA, NCME, 1999, 2014):
● Items that load on a specific factor must be consistent with each other and with the factor score. ● Factors within the test that are associated with each other should correlate, and ones that are
independent should not. ● Scores on the survey should directly relate to the content, construct, or criterion it is supposed to
measure. ● Items should resemble “legitimate” questions. ● To an extent justified by the intended uses of the survey, steps should be taken to keep scores and
scoring methods secure from tampering or observation by unauthorized people, detect and prevent faking (whether good or bad), and limit the ability of users to be ‘coached’ how to make results more favorable. Since, these concerns apply mainly to instruments used for high-stakes’ selection, compensation, or other administrative decisions (Society for Industrial Organizational Psychology, 2003), and not personal development, they did not factor heavily into the development of the instrument.
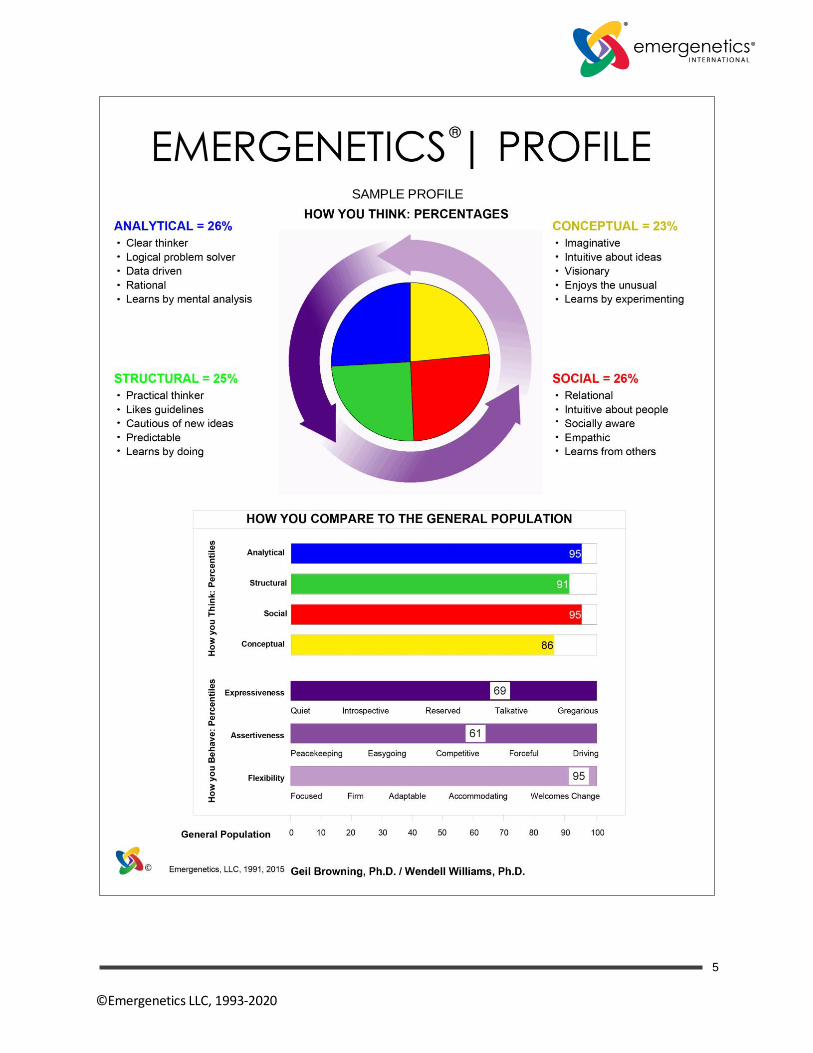
Following the guidelines outlined above, the authors assembled lists of nomological items, constructed questionnaires, administered them to participants attending personal development workshops, factor-analyzed the results, examined scree-charts, and identified discrete factors that were both statistically and rationally related. After multiple edits, items tended to cluster into seven specific homogenous item composites or HICS (i.e., a combination of rational and empirical items that define a specific personality space; Hogan, 1983). Items with suitable inter-item reliabilities within each HIC were retained based on their ability to define a utility-based nomological factor. Dysfunctional and socially undesirable items such as neuroticism, morality, ethics, and so forth, were outside the scope of the survey were excluded from the analysis. Since, the intent of the Profile was to provide robust and useful comparison between and among individuals, raw scores for each HIC were converted into normative percentiles. Because there is a tendency for many personality profiles to confound thinking preferences with behavioral preferences, we report them separately; furthermore, being an internal process (and to partially correct for survey-response bias) the four thinking preferences are additionally represented as a percentage-mix. This provides the subject with a robust model that accounts for what the subject considers important, how these preferences interact, and how strongly how he or she presents these preferences in a relationship as follows.
5
©Emergenetics LLC, 1993-2020
SAMPLE PROFILE

6
©Emergenetics LLC, 1993-2020
The efficacy of a nomological taxonomy is illustrated a post-workshop survey of participants who completed Emergenetics Profiles between June 2012 and June 2015 (i.e., F=229, M=130).
1. When asked, “Since taking Emergenetics, I have used the results to...” o Gain a better understanding of myself (79.3%) o Understand better personal relationships (68.8%) o Understand my team better (63.8%) o Understand my significant other (29.3%) o Achieve success on a specific project (19.9%) o Explain to another how I approach work (18.5%) o Learn how to use my strengths more effectively (12.7%) o Earn a promotion (6.2%) o Referenced the Profile when I was worked-up about another person (5.8%).
2. When asked, “In my organization, Emergenetics is...”
o Used across the organization (36%) o A tool to help work with peers (27.6%). o A common language we can all speak (25.8%) o Used by specific teams (18.5%)
3. When asked, “In your opinion, what is the most appealing part of Emergenetics...”
o It’s applicability in the workplace (14.5%) o It’s simple interpretation (11.6%) o It’s visual display (7.2%) o It’s depth of description (1.8%) o All of the above (59.8%).
This survey suggests participants understand and use Emergenetics to:
• Improve job performance and communication. • Understand basic preferences within a work environment. • Illustrate how personal preferences can be perceived as either strengths or an opportunity to improve. • Understand how personal preferences affect others. • Build a collaborative organizational workforce. • Engage in meaningful dialogue and information about the way individuals approach work activities. As stated earlier, it is important to note that the Emergenetics Profile is a norm-based comparative tool…not a diagnostic analysis of personality type. Normative scoring helps people compare the intensity of their own personal preferences with a database of other people. There is no best or worst profile, only one that provides the subject with enough knowledge to understand how his or her preferences facilitate, or conversely, interfere, with what he/she attempts to achieve. Scores are re-normed biannually and adjusted to reflect the latest two-years of global data.

7
©Emergenetics LLC, 1993-2020
Technically, the current Emergenetics Profile includes:
• 100 items
• Seven Likert-scaled normative scored factors (with 8 – 14 items per factor)
• Within-factor inter-item reliabilities ranging between .71 and .83
• Ten-year test-retest reliabilities between .68 and .77
• Construct validation with FFM, convergent/discriminate validation, and face validity
• Four thinking-style preferences based on percentile strength (interpersonal measure) and percentage mix (intrapersonal measure)
• Three behavioral descriptions based on percentile strength (interpersonal measure)
Social Desirability and “Lie Scales”
Self-reported profiles have been criticized for relying on honesty and accurate self-awareness and often contain “internal consistency” scales to control faking. Although control of response sets is theoretically appealing, it presents certain problems because it is often difficult, if not impossible, to separate the desirability of personality-related items from their content. In fact, removing socially desirable items may make it difficult to measure traits that are themselves desirable in certain situations. Because of these concerns, and the fact the Profile is not presented within a high-stakes environment, social desirability scales were not included in the Profile. This in no way reduces its usefulness. Two large within-person studies found small differences in mean personality test scores when the first test was for selection purposes and the second was for developmental purposes or vice versa (Ellingson, Sackett, & Connelly, 2007). Together, the results suggested that under a wide array of realistic applicant scenarios, faking neither affects the criterion-related validity of personality tests nor the mean levels of performance in those selected.

8
©Emergenetics LLC, 1993-2020
Professional Test Developmental Criteria
Put simply, a professionally developed survey should:
• Include a useful theory of behavior (i.e., practical)
• Be stable (i.e., reliable)
• Accurately measure what it is supposed to measure (i.e., valid)
These processes are expressly described in the Standards for Educational and Psychological Testing, an internationally accepted digest of best survey practices. Since the Emergenetics nomological (i.e., practical) approach was discussed earlier, the remainder of this report will discuss the analytical procedures followed.
1. Reliability
Reliability means the test delivers consistent score-results. This applies to both how the factor items are constructed and whether factor scores are consistent over time (e.g., inter-item and test-retest reliability).
1a. Inter-item Reliability
Internal integrity of a survey begins by examining Cronbach’s Coefficient-Alpha for each factor. Coefficient-Alpha refers to the average of all possible inter-item and split-half correlations, both strong and weak, without relying on single indicators of reliability which may contain large amounts of error (Cronbach, 1951). Inter-item reliability is a measure of how well individual item scores correlate with the overall factor score. The inter-item reliabilities of the Emergenetics Profile (N= 89,101) range from r=.71 to r=.83 and are shown in the following table:
Emergenetics Factor Coefficient Alpha
Analytical .83 Structural .71
Social .76
Conceptual .76 Expressiveness .78
Assertiveness .78
Flexibility .79
N=89,101, average 8 - 14 items per factor, p<.01
1b. Test-Retest Reliability Test-retest reliability refers to the stability of the survey over time; that is, whether survey scores remain the same if the test is taken more than once by the same person.

9
©Emergenetics LLC, 1993-2020
Long-term relationships with clients allowed us the rare opportunity to examine test-retest reliability over a span of ten years. This study indicated whether profile factors are stable over time. The study included 307 subjects (F=191; M=117). The subjects completed their first profiles in late 1993. A second set of profiles was completed by the same subjects about 10 years later in 2003. Bivariate correlations had values between r=.68 and r=.77. A separate test-retest analysis using a one-way ANOVA showed five of the seven factors showed no statistically significant difference in scores. Significance levels above .05 indicate any mean score differences between Time 1 and Time 2 are likely due to chance. This means Analytical (p<.140), Expressive (p<.534), Assertive (p<.104), and Flexibility (p<.535) show no statistically significant change. The mean increase in Structural (p<.020), is significant but the slight decrease in mean-score is negligible (i.e., 40.61 v. 38.17). The apparent increase in Conceptual (i.e., 54.37 v. 61.91) is probably due to a workshop-effect (i.e., participative activities that encourage creativity). The first table shows the paired sample means, the second table shows a paired samples t-test.
Paired Samples Statistics
Mean N Std. Deviation Std. Error Mean
Pair 1 T1 AnaTile 51.52 307 25.386 1.449
T2 AnaTile 50.00 307 26.427 1.508
Pair 2 T1 StrTile 40.61 307 24.891 1.421
T2 StrTile 38.17 307 27.364 1.562
Pair 3 T1 SocTile 46.49 307 24.110 1.376
T2 SocTile 48.39 307 26.089 1.489
Pair 4 T1 ConTile 54.37 307 25.660 1.464
T2 ConTile 61.91 307 26.695 1.524
Pair 5 T1 ExpTile 53.85 307 24.748 1.412
T2 ExpTile 53.24 307 25.512 1.456
Pair 6 T1 AsrTile 57.94 307 23.692 1.352
T2 AsrTile 56.18 307 23.962 1.368
Pair 7 T1 FlexTile 46.64 307 24.372 1.391
T2 FlexTile 47.31 307 25.759 1.470

10
©Emergenetics LLC, 1993-2020
Paired Samples Test
Paired Differences
t df
Sig. (2-
tailed) Mean
Std.
Deviation
Std.
Error
Mean
95% Confidence
Interval of the
Difference
Lower Upper
Pair 1 T1 AnaTile -
T2 AnaTile 1.518 17.954 1.025 -.498 3.534 1.481 306 .140
Pair 2 T1 StrTile -
T2 StrTile 2.440 18.325 1.046 .382 4.498 2.333 306 .020
Pair 3 T1 SocTile -
T2 SocTile -1.902 17.921 1.023 -3.915 .110 -1.860 306 .064
Pair 4 T1 ConTile -
T2 ConTile -7.534 17.881 1.021 -9.542 -5.526 -7.383 306 .000
Pair 5 T1 ExpTile -
T2 ExpTile .606 17.062 .974 -1.310 2.522 .622 306 .534
Pair 6 T1 AsrTile -
T2 AsrTile 1.762 18.935 1.081 -.364 3.889 1.631 306 .104
Pair 7 T1 FlexTile -
T2 FlexTile -.668 18.831 1.075 -2.783 1.447 -.621 306 .535
N=307
2. Validity
Validity means the test measures what it is intended to measure. There are many different measures of validity:
• Face validity
• Convergent/Discriminate validity
• Predictive and Concurrent Criterion validity
• Construct validity
• Content validity Being a normative (i.e., non-criterion referenced) nomological instrument we will limit our examination to Emergenetics’ face validity, convergent/discriminate validity, and construct validity.
2a. Face Validity This refers to how subjects feel about the Emergenetics items. A random sampling of 412 subjects (M=182, F=230) were asked to rate, using a 1 to 5 Likert scale, “To what degree do you feel the items included in the

11
©Emergenetics LLC, 1993-2020
Emergenetics questionnaire reflect everyday behaviors and preferences?” The following table suggests 301 subjects (73%) agreed, 23.3% were neutral, and less than 4% disagreed. This suggests the thinking and behavioral items are face valid.
Frequency Percent
Valid 1 – Strongly disagree 2 .5
2 – Disagree 13 3.2
3 – Neither agree or disagree 96 23.3
4 – Agree 246 59.7
5 – Strongly agree 55 13.3
N=412
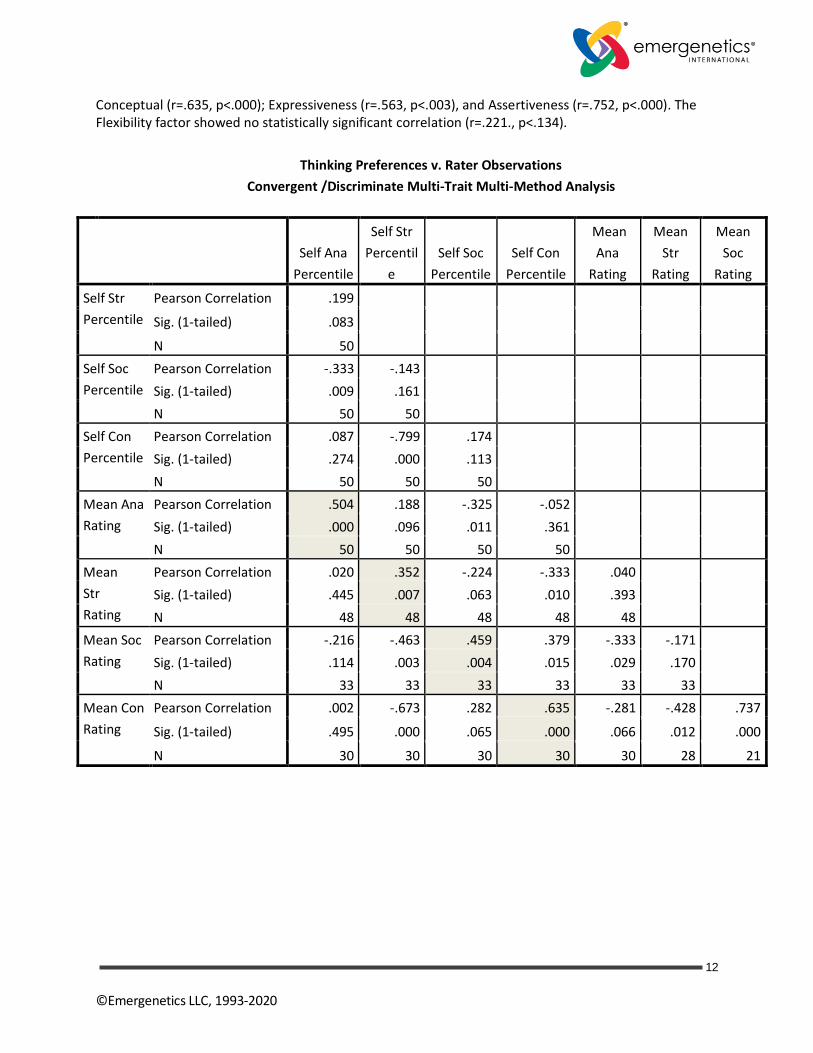
2b. Nomological Convergent/Discriminate Validity This analysis examines relationships between factors by examining both convergent (agreement) and discriminant (non-agreement) correlations within the instrument, as well as with a second independent measure of the same factors. In other words, it evaluates the validity of factors within the Profile and outside the Profile (Society for Industrial Organizational Psychology, 2003; Furr & Bacharach, 2007). In this case, the second measure is an independent 3rd party survey. It should be noted that behavior is seldom “pure”. Like Venn diagrams, macro descriptions often cause some factor scores to share interdependence with one another. For example, social assertiveness (i.e., Expressiveness) and task assertiveness (i.e., Assertiveness) both contain items that are related to assertiveness even though their goals may be entirely different (e.g., stand-out socially vs. accomplish tasks). Some competitive instruments imply that once you know an individual’s thinking preferences, you can use that same information to accurately predict their behaviors. For example, if you are analytical, it is often assumed you must also be quiet and thoughtful. We have found these assumptions to be problematic. To help individuals isolate important personality preferences, we have designed Emergenetics to be a combination of two complimentary sections: 1) how a person prefers to think and process information; and 2) how he/she acts-out these preferences with others. As we noted earlier, personality factors are not always orthogonal making some behaviors covary with others; therefore, some correlations are higher than we would like. Nevertheless, we have included these factors because, in our experience, they help participants better-understand why observing someone’s behavior is insufficient to predict their thinking preferences; and, likewise, why someone’s thinking preferences provide insufficient data to predict their behavior. The following tables represent a multi-trait multi-matrix network showing the correlations between the subject’s responses for each factor (shown as a percentile) and mean-score ratings from at least three independent observers. Rater-scores greater than one standard deviation from the mean were excluded from the analysis. As can be seen in the following tables, self-reported scores converge positively with mean rater observation scores: Analysis (r=.504, p<.000); Structure (r=.352, p<.007); Social (r=.636, p<.004);
12
©Emergenetics LLC, 1993-2020
Conceptual (r=.635, p<.000); Expressiveness (r=.563, p<.003), and Assertiveness (r=.752, p<.000). The Flexibility factor showed no statistically significant correlation (r=.221., p<.134).
Thinking Preferences v. Rater Observations
Convergent /Discriminate Multi-Trait Multi-Method Analysis
Self Ana
Percentile
Self Str
Percentil
e
Self Soc
Percentile
Self Con
Percentile
Mean
Ana
Rating
Mean
Str
Rating
Mean
Soc
Rating
Self Str
Percentile
Pearson Correlation .199
Sig. (1-tailed) .083
N 50
Self Soc
Percentile
Pearson Correlation -.333 -.143
Sig. (1-tailed) .009 .161
N 50 50
Self Con
Percentile
Pearson Correlation .087 -.799 .174
Sig. (1-tailed) .274 .000 .113
N 50 50 50
Mean Ana
Rating
Pearson Correlation .504 .188 -.325 -.052
Sig. (1-tailed) .000 .096 .011 .361
N 50 50 50 50
Mean
Str
Rating
Pearson Correlation .020 .352 -.224 -.333 .040
Sig. (1-tailed) .445 .007 .063 .010 .393
N 48 48 48 48 48
Mean Soc
Rating
Pearson Correlation -.216 -.463 .459 .379 -.333 -.171
Sig. (1-tailed) .114 .003 .004 .015 .029 .170
N 33 33 33 33 33 33
Mean Con
Rating
Pearson Correlation .002 -.673 .282 .635 -.281 -.428 .737
Sig. (1-tailed) .495 .000 .065 .000 .066 .012 .000
N 30 30 30 30 30 28 21

13
©Emergenetics LLC, 1993-2020
Convergent-Discriminate Multi-Trait Multi Method Correlations-Behaving
Exp
Percentile
Asr
Percentile
Flx
Percentile
Mean Exp
Rating
Mean Asr
Rating
Convergent
Self Asr
Percentile
Pearson Correlation .779
Sig. (1-tailed) .000
N 50
Self Flx
Percentile
Pearson Correlation .627 .246
Sig. (1-tailed) .000 .043
N 50 50
Mean
Exp
Rating
Pearson Correlation .563 .650 .357
Sig. (1-tailed) .003 .000 .047
N 23 23 23
Mean Asr
Rating
Pearson Correlation .696 .752 .334 .614
Sig. (1-tailed) .000 .000 .075 .017
N 20 20 20 12
Mean
Flx
Rating
Pearson Correlation .230 .184 .221 .381 .228
Sig. (1-tailed) .125 .178 .134 .100 .238
N 27 27 27 13 12
2c. Validity: Contingency Analyses A correlation coefficient is often misunderstood as probability. This is incorrect. Correlation is a mathematical process of fitting a line between two or more data points based on their mean and standard deviation. Using a grossly over-simplified example, a correlation of .50 simply tells us that a line can be drawn that minimizes the plot distances between roughly 25% of the data points (i.e., .5 squared). The remaining 75% of the data-scatter is technically referred to as “unexplained variance”. On the other hand, a probability of .50 tells us there is a 50/50 chance that “A” happened because of “B”. You could think of correlation as “line-fitting” while probability is the odds of predicting a specific occurrence. Karl Pearson (the father of statistical analysis) argued that some variables are so comingled that, rather than calculating the correlation (i.e., line fitting) between data points, analysis would be better served by calculating probabilities (i.e., contingencies). He referred to this methodology as contingency analysis. Using the analogy of chips on a paint chart, Pearson argued that while paint colors were highly associated, they were also sufficiently important to be examined separately. Contingency analysis is widely used in survey research, business intelligence, engineering, and scientific research. We believe that contingency analyses represents a better understanding of the nomological relationship between a thinking preference and a specific behavior.

14
©Emergenetics LLC, 1993-2020
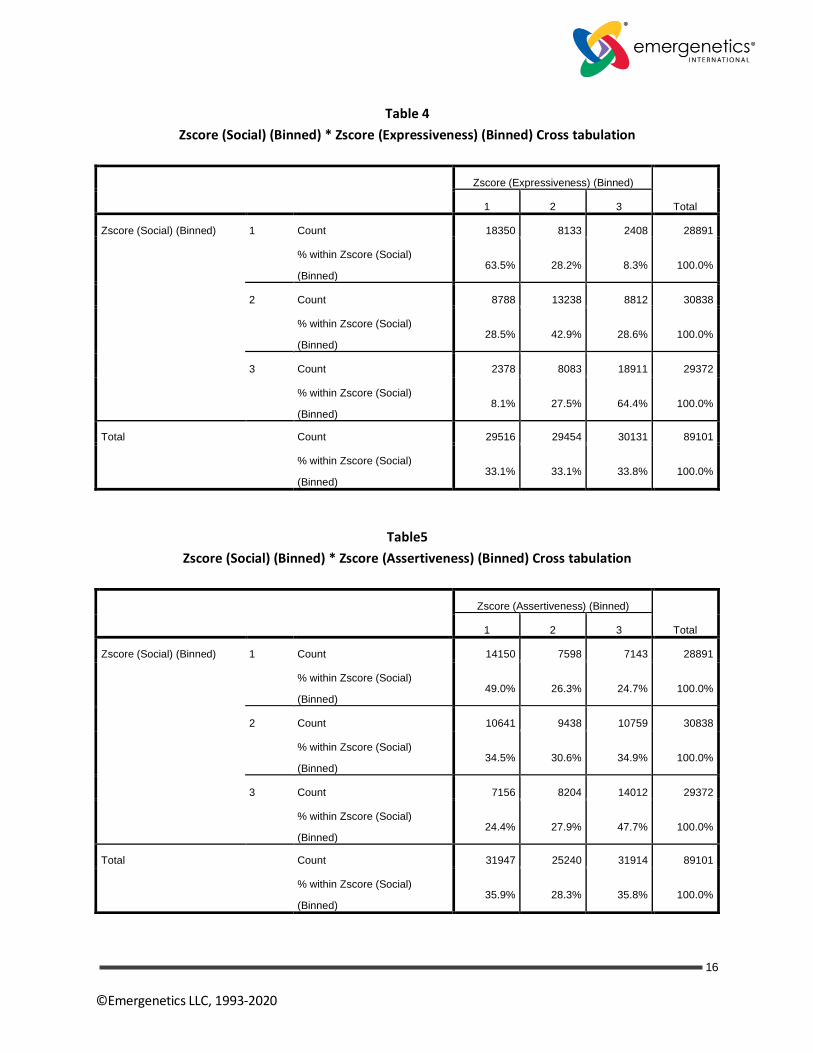
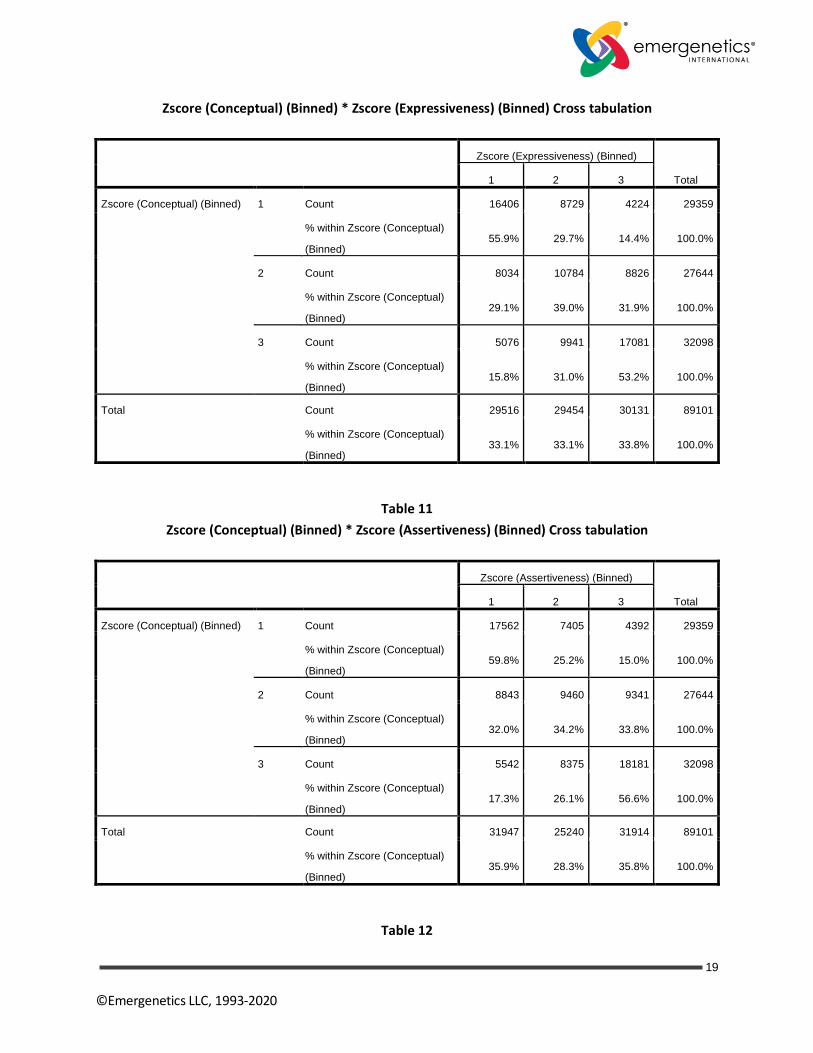
Contingency data are shown in the following tables (N= 89,101). Raw data were collected for each of the seven Emergenetics factors, normalized using Z-Score transformations, and divided into equal thirds based on percentiles. In each table, the probability of an Expressive, Assertive, or Flexibility behavior was calculated for each thinking preference.
Referring to the highlighted numbers in Table 2, for example, of 27,151 participants who rated themselves as being in the top third of Analytical Thinking, 22.9% (6,221) rated themselves as being in the bottom third of Assertiveness; while 49.2% (13,355) described themselves as being in the top third of Assertiveness. Thus, it would seem, that people with strong Analytical preferences do not fit the stereotypical behavior pattern of being peacekeeping and calm. Granular differences between individual subjects in each table illustrates why it’s important to report all seven factors at the contingency level even though they might show covariance at the correlational level. Similar results can be found throughout the tables emphasizing the need for participants to hesitate forming conclusions about how people behave simply because they express a specific thinking preference.
Emergenetics Raw Score Contingency Analysis (1= bottom 33%, 2 = mid 34-65%, 3= top 33%)
Table 1
Zscore (Analytical) (Binned) * Zscore (Expressiveness) (Binned) Cross tabulation
Zscore (Expressiveness) (Binned) Total
1 2 3
Zscore (Analytical) (Binned) 1 Count 11508 8612 8141 28261
% within Zscore (Analytical)
(Binned)
40.7% 30.5% 28.8% 100.0%
2 Count 10584 11845 11260 33689
% within Zscore (Analytical)
(Binned)
31.4% 35.2% 33.4% 100.0%
3 Count 7424 8997 10730 27151
% within Zscore (Analytical)
(Binned)
27.3% 33.1% 39.5% 100.0%
Total Count 29516 29454 30131 89101
% within Zscore (Analytical)
(Binned)
33.1% 33.1% 33.8% 100.0%

15
©Emergenetics LLC, 1993-2020
Table 2
Zscore (Analytical) (Binned) * Zscore (Assertiveness) (Binned) Cross tabulation
Zscore (Assertiveness) (Binned)
Total 1 2 3
Zscore (Analytical) (Binned) 1 Count 14403 7207 6651 28261
% within Zscore (Analytical)
(Binned) 51.0% 25.5% 23.5% 100.0%
2 Count 11323 10458 11908 33689
% within Zscore (Analytical)
(Binned) 33.6% 31.0% 35.3% 100.0%
3 Count 6221 7575 13355 27151
% within Zscore (Analytical)
(Binned) 22.9% 27.9% 49.2% 100.0%
Total Count 31947 25240 31914 89101
% within Zscore (Analytical)
(Binned) 35.9% 28.3% 35.8% 100.0%
Table 3
Zscore (Analytical) (Binned) * Zscore (Flexibility) (Binned) Cross tabulation
Zscore (Flexibility) (Binned)
Total 1 2 3
Zscore (Analytical) (Binned) 1 Count 10353 10777 7131 28261
% within Zscore (Analytical)
(Binned) 36.6% 38.1% 25.2% 100.0%
2 Count 9989 13859 9841 33689
% within Zscore (Analytical)
(Binned) 29.7% 41.1% 29.2% 100.0%
3 Count 7261 10170 9720 27151
% within Zscore (Analytical)
(Binned) 26.7% 37.5% 35.8% 100.0%
Total Count 27603 34806 26692 89101
% within Zscore (Analytical)
(Binned) 31.0% 39.1% 30.0% 100.0%
16
©Emergenetics LLC, 1993-2020
Table 4
Zscore (Social) (Binned) * Zscore (Expressiveness) (Binned) Cross tabulation
Zscore (Expressiveness) (Binned)
Total 1 2 3
Zscore (Social) (Binned) 1 Count 18350 8133 2408 28891
% within Zscore (Social)
(Binned) 63.5% 28.2% 8.3% 100.0%
2 Count 8788 13238 8812 30838
% within Zscore (Social)
(Binned) 28.5% 42.9% 28.6% 100.0%
3 Count 2378 8083 18911 29372
% within Zscore (Social)
(Binned) 8.1% 27.5% 64.4% 100.0%
Total Count 29516 29454 30131 89101
% within Zscore (Social)
(Binned) 33.1% 33.1% 33.8% 100.0%
Table5
Zscore (Social) (Binned) * Zscore (Assertiveness) (Binned) Cross tabulation
Zscore (Assertiveness) (Binned)
Total 1 2 3
Zscore (Social) (Binned) 1 Count 14150 7598 7143 28891
% within Zscore (Social)
(Binned) 49.0% 26.3% 24.7% 100.0%
2 Count 10641 9438 10759 30838
% within Zscore (Social)
(Binned) 34.5% 30.6% 34.9% 100.0%
3 Count 7156 8204 14012 29372
% within Zscore (Social)
(Binned) 24.4% 27.9% 47.7% 100.0%
Total Count 31947 25240 31914 89101
% within Zscore (Social)
(Binned) 35.9% 28.3% 35.8% 100.0%

17
©Emergenetics LLC, 1993-2020
Table 6
Zscore (Social) (Binned) * Zscore (Flexibility) (Binned) Cross tabulation
Zscore (Flexibility) (Binned)
Total 1 2 3
Zscore (Social) (Binned) 1 Count 21587 6993 311 28891
% within Zscore (Social)
(Binned) 74.7% 24.2% 1.1% 100.0%
2 Count 5638 19834 5366 30838
% within Zscore (Social)
(Binned) 18.3% 64.3% 17.4% 100.0%
3 Count 378 7979 21015 29372
% within Zscore (Social)
(Binned) 1.3% 27.2% 71.5% 100.0%
Total Count 27603 34806 26692 89101
% within Zscore (Social)
(Binned) 31.0% 39.1% 30.0% 100.0%
Table 7
Zscore (Structure) (Binned) * Zscore (Expressiveness) (Binned) Cross tabulation
Zscore (Expressiveness) (Binned)
Total 1 2 3
Zscore (Structural) (Binned) 1 Count 7821 10067 13324 31212
% within Zscore (Structural)
(Binned) 25.1% 32.3% 42.7% 100.0%
2 Count 9126 9246 8184 26556
% within Zscore (Structural)
(Binned) 34.4% 34.8% 30.8% 100.0%
3 Count 12569 10141 8623 31333
% within Zscore (Structural)
(Binned) 40.1% 32.4% 27.5% 100.0%
Total Count 29516 29454 30131 89101
% within Zscore (Structural)
(Binned) 33.1% 33.1% 33.8% 100.0%

18
©Emergenetics LLC, 1993-2020
Table 8
Zscore (Structure) (Binned) * Zscore (Assertiveness) (Binned) Cross tabulation
Zscore (Assertiveness) (Binned)
Total 1 2 3
Zscore (Structural) (Binned) 1 Count 7060 8293 15859 31212
% within Zscore (Structural)
(Binned) 22.6% 26.6% 50.8% 100.0%
2 Count 9628 8193 8735 26556
% within Zscore (Structural)
(Binned) 36.3% 30.9% 32.9% 100.0%
3 Count 15259 8754 7320 31333
% within Zscore (Structural)
(Binned) 48.7% 27.9% 23.4% 100.0%
Total Count 31947 25240 31914 89101
% within Zscore (Structurale)
(Binned) 35.9% 28.3% 35.8% 100.0%
Table 9
Zscore (Structure) (Binned) * Zscore (Flexibility) (Binned) Cross tabulation
Zscore (Flexibility) (Binned)
Total 1 2 3
Zscore (Structural) (Binned) 1 Count 9389 12230 9593 31212
% within Zscore (Structural)
(Binned) 30.1% 39.2% 30.7% 100.0%
2 Count 8523 10594 7439 26556
% within Zscore (Structural)
(Binned) 32.1% 39.9% 28.0% 100.0%
3 Count 9691 11982 9660 31333
% within Zscore (Structural)
(Binned) 30.9% 38.2% 30.8% 100.0%
Total Count 27603 34806 26692 89101
% within Zscore (Structural)
(Binned) 31.0% 39.1% 30.0% 100.0%
Table 10
19
©Emergenetics LLC, 1993-2020
Zscore (Conceptual) (Binned) * Zscore (Expressiveness) (Binned) Cross tabulation
Zscore (Expressiveness) (Binned)
Total 1 2 3
Zscore (Conceptual) (Binned) 1 Count 16406 8729 4224 29359
% within Zscore (Conceptual)
(Binned) 55.9% 29.7% 14.4% 100.0%
2 Count 8034 10784 8826 27644
% within Zscore (Conceptual)
(Binned) 29.1% 39.0% 31.9% 100.0%
3 Count 5076 9941 17081 32098
% within Zscore (Conceptual)
(Binned) 15.8% 31.0% 53.2% 100.0%
Total Count 29516 29454 30131 89101
% within Zscore (Conceptual)
(Binned) 33.1% 33.1% 33.8% 100.0%
Table 11
Zscore (Conceptual) (Binned) * Zscore (Assertiveness) (Binned) Cross tabulation
Zscore (Assertiveness) (Binned)
Total 1 2 3
Zscore (Conceptual) (Binned) 1 Count 17562 7405 4392 29359
% within Zscore (Conceptual)
(Binned) 59.8% 25.2% 15.0% 100.0%
2 Count 8843 9460 9341 27644
% within Zscore (Conceptual)
(Binned) 32.0% 34.2% 33.8% 100.0%
3 Count 5542 8375 18181 32098
% within Zscore (Conceptual)
(Binned) 17.3% 26.1% 56.6% 100.0%
Total Count 31947 25240 31914 89101
% within Zscore (Conceptual)
(Binned) 35.9% 28.3% 35.8% 100.0%
Table 12

20
©Emergenetics LLC, 1993-2020
Zscore (Conceptual) (Binned) * Zscore (Flexibility) (Binned) Cross tabulation
Zscore (Flexibility) (Binned)
Total 1 2 3
Zscore (Conceptual) (Binned) 1 Count 14608 10807 3944 29359
% within Zscore (Conceptual)
(Binned) 49.8% 36.8% 13.4% 100.0%
2 Count 7381 12412 7851 27644
% within Zscore (Conceptual)
(Binned) 26.7% 44.9% 28.4% 100.0%
3 Count 5614 11587 14897 32098
% within Zscore (Conceptual)
(Binned) 17.5% 36.1% 46.4% 100.0%
Total Count 27603 34806 26692 89101
% within Zscore (Conceptual)
(Binned) 31.0% 39.1% 30.0% 100.0%
2d. Construct Validity (i.e., Big Five Construct Correlation) Construct validity refers to whether the survey evaluates a deep-seated construct such as emotional sensitivity or intelligence. Construct validity of the seven Emergenetics nomological factors was compared to the NEO-PI, a comprehensive lexical Big Five model published by Psychological Assessment Resources, Inc. This analysis represents the correlations between a well-respected trait-style instrument and the Emergenetics nomological taxonomy. The NEO-PI was developed by Paul Costa and Robert McCrae (1987) based on personality research conducted in the 1950’s showing that virtually all language-based personality traits tend to cluster into roughly 20 sub-groups, which in turn cluster into 5 meta factors. Because the NEO-PI covers the entire personality domain and is based on granular analysis of the human lexicon (as opposed to Emergenetics’ seven nomological observations), we would expect Emergenetics’ nomological constructs to correlate across several FFM lexical constructs. The NEO-PI FFM lexical factors include:
1. Neuroticism (N): a compound score indicating the tendency to experience negative emotions such as fear, sadness, anger, disgust, embarrassment, and guilt.
• N1 (high sub-factor score): general anxiety, phobias, tense, jittery
• N2 (high sub-factor score): hostility, bitterness, anger, frustration
• N3 (high sub-factor score): depression, guilt, sadness, hopelessness, loneliness
• N4 (high sub-factor score): self-consciousness, sensitivity, inferiority, uncomfortable

21
©Emergenetics LLC, 1993-2020
2. Expressiveness (E): a compound score indicating preferences for liking people, being around large groups, being assertive and talkative, upbeat, energetic, and active.
• E1 (high sub-factor score): warmth, affectionate, friendly, close attachments
• E2 (high sub-factor score): gregarious, enjoys the company of others
• E3 (high sub-factor score): dominant, forceful, social climbing
• E4 (high sub-factor score): energy, active, fast moving, thrill seeker
3. Openness (O): a compound score indicating active imagination, aesthetic sensitivity, inner feelings, variety, curiosity, and independence.
• O1 (high sub-factor score): fantasy, imaginative, daydreamer, creative
• O2 (high sub-factor score): aesthetic, art, beauty, music, poetry
• O3 (high sub-factor score): inner feelings, emotive, emotional depth and intensity
• O4 (high sub-factor score): willingness, try new things, novelty, and variety
4. Agreeableness (A): a compound score indicating sympathy and eagerness to help
• A1 (high sub-factor score): trust, honest, well-intentioned
• A2 (high sub-factor score): straightforwardness, frank, sincere, ingenuous
• A3 (high sub-factor score): altruistic, concern for others, generous, helpful
• A4 (high sub-factor score): compliance, withdrawn, forgive, deference
5. Conscientiousness (C): a compound score indicating strong will, self-control, planning, organizing, purposefulness, and achievement.
• C1 (high sub-factor score): competence, capable, sensible, prudent effective
• C2 (high sub-factor score): order, tidy, well organized, planful
• C3 (high sub-factor score): dutiful, ethical, conscientious, moral obligations
• C4 (high sub-factor score): achievement oriented, aspirational, diligent, driven
Nomological Criticism of the FFM Examining the NEO-PI factors, it is easy to see that personality analysis based on language can be complex. For one thing, in the real world, personality interactions rarely occur as a single word. They often occur as components of observable behaviors that vary with emotional state and situation (e.g., someone who is socially warm may concurrently be gregarious and forceful). Thus, researchers using person-descriptive sentences have concluded that although a FFM may be an interesting biologically-based human universal that generalizes across culture, language, gender, and type of assessment rating source; its analytical clustering technique has generated a considerable number of questions whether it should be used as universal taxonomy for predicting actual work behavior. Take, for example, the FFM Conscientiousness factor. While the Conscientiousness factor may appear to be homogenous, it can be argued that it is actually an amalgam of multiple discrete activities (i.e., occupational competence, capability, sensibility, prudence, effectiveness, being orderly, tidy, well organized, planful, being dutiful, ethical, conscientious, having moral obligations, achievement oriented, aspirational, diligent, and driven). Thus, although the Conscientiousness meta factor is generally recognized as a strong predictor of job performance, its multiple traits make practical application as a personality construct problematic.

22
©Emergenetics LLC, 1993-2020
Correlations between the Emergenetics Nomological factors and NEO-PI Lexical Personality Traits Correlating data between two discrete instruments is based on the presumption the factors measure similar domains. For example, if Profile X contains a factor called “Expressiveness” measured using Items A, B, and C, and, Profile Y also contains a factor called “Expressiveness” measured using Items D, E, and F, expecting the two Expressiveness scores to correlate can be challenging. For example, the Emergenetics nomological factors include:
1. Analytical (Ana): having a dominant interest in analytical thinking, problem solving, understanding complex subjects, and mental analysis.
2. Structure (Str): preferences for order, rules and regulations, stability, working with things, and avoiding risk
3. Social (Soc): affiliation with people, building friendships, social concerns, working in teams, seeking approval from others
4. Conceptual (Con): reliance on intuition, seeking new and different activities, abstract thinking, exploration
5. Expressiveness (Exp): Openly showing affection, being admired, seeking leadership, being competitive, impulsive, entertaining
6. Assertive (Asr): comfortable with ambiguity, competitive, argumentative, impulsive, assertive, easily bored
7. Flexibility (Flx): supporting others, even tempered, patient, personally supportive, avoiding confrontation, agreeable
To compare lexical constructs with nomological constructs, we used Stepwise factor analysis. Emergenetics Profile Percentiles were chosen as the independent variables. NEO-PI scores converted using Z-score transformations became the dependent variables. Analytical Factor Stepwise analysis shows the Analytical nomological factor is positively related to C4 (achievement, aspirations, diligence, and drive) and negatively related to E1 (being warm, affectionate, friendly, and having close attachments).
Stepwise EP Analytical Factor Analysis v. FFM Sub-factors
Model R R Square Adjusted R Square
Std. Error of the Estimate
Change Statistics
R Square Change F Change df1 df2 Sig. F Change
1 .274a .075 .065 24.075 .075 7.694 1 95 .007 2 .387b .150 .132 23.200 .075 8.298 1 94 .005

23
©Emergenetics LLC, 1993-2020
Stepwise EP Analytical Factor v. FFM Sub-factor Coefficients
Model
Unstandardized Coefficients Standardized Coefficients
T Sig. B Std. Error Beta
1 (Constant) 17.057 11.936 1.429 .156
C4 1.539 .555 .274 2.774 .007
2 (Constant) 52.977 16.964 3.123 .002
C4 1.783 .541 .317 3.295 .001
E1 -1.668 .579 -.277 -2.881 .005
a. Dependent Variable: Analytical (N=97)
Structural Factor The Emergenetics Structural factor incorporates preferences for rules and order. It correlates positively with FFM C2 (being orderly, tidy and planful). And, as expected, negatively correlates with O4 (willingness, try new things, novelty, variety); E3 (dominant, forceful, social climbing); and O2 (aesthetic, art, beauty, music, poetry). Overall, the nomological Structural factor shows strong positive correlation with the FFM orderliness factor, and as expected, negative association with less structured activities.
Stepwise EP Structural Factor v. FFM Sub-factors
Model R R Square Adjusted R Square
Std. Error of the Estimate
Change Statistics
R Square Change F Change df1 df2 Sig. F Change
1 .543a .295 .287 23.606 .295 39.660 1 95 .000 2 .648b .420 .408 21.509 .126 20.428 1 94 .000 3 .708c .502 .486 20.047 .081 15.210 1 93 .000 4 .738d .545 .525 19.272 .043 8.633 1 92 .004

24
©Emergenetics LLC, 1993-2020
Stepwise EP Structural Factor v. FFM Sub-factor Coefficients
Model
Unstandardized Coefficients Standardized Coefficients
T Sig. B Std. Error Beta
1 (Constant) -6.655 8.737 -.762 .448
C2 2.761 .438 .543 6.298 .000
2 (Constant) 43.643 13.683 3.190 .002
C2 2.161 .421 .425 5.135 .000
O4 -2.199 .487 -.374 -4.520 .000
3 (Constant) 65.381 13.918 4.698 .000
C2 2.238 .393 .440 5.697 .000
O4 -1.870 .461 -.318 -4.055 .000
E3 -1.486 .381 -.290 -3.900 .000
4 (Constant) 72.989 13.628 5.356 .000
C2 2.397 .381 .471 6.284 .000
O4 -1.192 .500 -.203 -2.385 .019
E3 -1.558 .367 -.304 -4.245 .000
O2 -1.096 .373 -.233 -2.938 .004
a. Dependent Variable: Structural N=97
Social Factor The Emergenetics Social nomological factor evaluates concerns for others. It is positively associated with the traits of E1 (warmth, affectionate, friendly, close attachments); O3 (inner- feelings, emotive, emotional depth and intensity); and, N1 (general anxiety, phobias, tense, jittery). It has a negative correlation with A2 (straightforwardness, frank, sincere, ingenuous). While the FFM Neuroticism sub-factor is included in the analysis, it is outside the design intent of the Emergenetics profile to represent healthy nomological behaviors.
Stepwise EP Social Factor v. FFM Sub-factors
Model R R Square Adjusted R Square
Std. Error of the Estimate
Change Statistics
R Square Change F Change df1 df2 Sig. F Change
1 .592a .350 .344 20.673 .350 51.230 1 95 .000 2 .662b .438 .426 19.333 .087 14.616 1 94 .000 3 .692c .479 .462 18.707 .041 7.399 1 93 .008 4 .717d .514 .493 18.169 .035 6.589 1 92 .012

25
©Emergenetics LLC, 1993-2020
Stepwise EP Social Factor v. FFM Sub-factor Coefficients
Model
Unstandardized Coefficients Standardized Coefficients
T Sig. B Std. Error Beta
1 (Constant) -37.105 12.721 -2.917 .004
E1 3.646 .509 .592 7.158 .000
2 (Constant) -57.122 12.998 -4.395 .000
E1 2.587 .551 .420 4.694 .000
O3 1.961 .513 .342 3.823 .000
3 (Constant) -34.647 15.049 -2.302 .024
E1 2.852 .542 .463 5.261 .000
O3 1.726 .504 .301 3.426 .001
A2 -1.079 .397 -.208 -2.720 .008
4 (Constant) -47.573 15.459 -3.077 .003
E1 3.352 .561 .544 5.971 .000
O3 1.298 .517 .226 2.511 .014
A2 -1.134 .386 -.218 -2.939 .004
N1 .834 .325 .202 2.567 .012
Dependent Variable: Social N=97
Conceptual Factor The Emergenetics Conceptual factor incorporates preferences for new and innovative ideas. It positively correlates with the traits of O1 (fantasy, imaginative, daydreamer, creative); E3 (dominant, forceful, social climbing); O2 (aesthetic, art, beauty, music, poetry); and C3 (dutiful, ethical, conscientious, moral obligations). On the other hand, it is negatively correlated with C2 (order, tidy, well-organized, planful); and A3 (altruistic, concern for others, generous, helpful). This indicates the design intent of the nomological Conceptual factor to be open and innovative is consistent across related FFM traits.
Stepwise EP Conceptual Factor v. FFM Sub-factors
Model R R Square Adjusted R Square
Std. Error of the Estimate
Change Statistics
R Square Change F Change df1 df2 Sig. F Change
1 .519a .269 .262 24.348 .269 35.001 1 95 .000 2 .629b .395 .382 22.266 .126 19.597 1 94 .000 3 .679c .461 .443 21.139 .065 11.297 1 93 .001 4 .719d .517 .496 20.106 .057 10.803 1 92 .001 5 .735e .540 .515 19.736 .023 4.481 1 91 .037 6 .751f .564 .535 19.312 .024 5.040 1 90 .027

26
©Emergenetics LLC, 1993-2020
Stepwise EP Conceptual Factor v. FFM Sub-factor Coefficients
Model
Unstandardized Coefficients Standardized Coefficients
T Sig. B Std. Error Beta
1 (Constant) 1.659 9.369 .177 .860
O1 2.754 .466 .519 5.916 .000
2 (Constant) 53.033 14.425 3.676 .000
O1 2.040 .455 .384 4.482 .000
C2 -1.958 .442 -.380 -4.427 .000
3 (Constant) 32.803 14.959 2.193 .031
O1 1.799 .438 .339 4.107 .000
C2 -2.028 .420 -.393 -4.825 .000
E3 1.346 .400 .259 3.361 .001
4 (Constant) 20.922 14.680 1.425 .157
O1 1.308 .443 .246 2.955 .004
C2 -2.170 .402 -.421 -5.397 .000
E3 1.386 .381 .267 3.638 .000
O2 1.206 .367 .253 3.287 .001
5 (Constant) -2.927 18.291 -.160 .873
O1 1.519 .446 .286 3.407 .001
C2 -2.388 .408 -.463 -5.854 .000
E3 1.226 .382 .236 3.214 .002
O2 1.076 .365 .226 2.946 .004
C3 1.201 .567 .167 2.117 .037
6 (Constant) 17.700 20.119 .880 .381
O1 1.856 .461 .350 4.023 .000
C2 -2.322 .400 -.450 -5.802 .000
E3 1.039 .383 .200 2.715 .008
O2 1.185 .361 .249 3.286 .001
C3 1.658 .591 .230 2.804 .006
A3 -1.520 .677 -.179 -2.245 .027
Dependent Variable: Conceptual N=97

27
©Emergenetics LLC, 1993-2020
Expressive Factor The Emergenetics Expressive factor is characterized by being open and socially forceful. It correlates with the FFM sub factor E3 (dominant, forceful, social climbing); O3 (inner- feelings, emotive, emotional depth and intensity); E1 (warmth, affectionate, friendly, close attachments): and, negatively with A2 (straightforwardness, frank, sincere, ingenuous). These correlations would suggest Emergenetics’ Expressive behavior is aligned with the FFM sociability-related traits.
Stepwise EP Expressive Factor v. FFM Sub-factors
Model R
R
Square
Adjusted R
Square
Std. Error of
the Estimate
Change Statistics
R Square
Change
F
Change df1 df2
Sig. F
Change
1 .650a .423 .417 19.757 .423 69.659 1 95 .000
2 .766b .587 .578 16.811 .164 37.211 1 94 .000
3 .799c .638 .626 15.814 .051 13.225 1 93 .000
4 .830d .689 .675 14.749 .050 14.911 1 92 .000
Stepwise EP Expressive Factor v. FFM Sub-factor Coefficients
Model
Unstandardized Coefficients Standardized Coefficients
t Sig. B Std. Error Beta
1 (Constant) -7.046 7.478 -.942 .348
E3 3.081 .369 .650 8.346 .000
2 (Constant) -50.818 9.591 -5.299 .000
E3 2.214 .345 .467 6.422 .000
O3 2.582 .423 .444 6.100 .000
3 (Constant) -72.982 10.888 -6.703 .000
E3 2.190 .324 .462 6.750 .000
O3 1.827 .449 .314 4.069 .000
E1 1.640 .451 .262 3.637 .000
4 (Constant) -45.326 12.426 -3.648 .000
E3 1.929 .310 .407 6.223 .000
O3 1.686 .420 .290 4.010 .000
E1 1.951 .428 .312 4.555 .000
A2 -1.237 .320 -.235 -3.862 .000
Dependent Variable: Exp N=97

28
©Emergenetics LLC, 1993-2020
Assertiveness Factor
The Emergenetics Assertive factor addresses an individual’s drive to accomplish a task as opposed to being open and socially assertive. It correlates positively with E3 (dominant, forceful, social climbing) and negatively with A4 (compliance, withdrawn, forgive, deference). This suggests the Assertive nomological factor correlates with the related rationally-associated FFM traits.
Stepwise EP Assertive Factor v. FFM Sub-factors
Model R R Square Adjusted R Square
Std. Error of the Estimate
Change Statistics
R Square Change F Change df1 df2
Sig. F Change
1 .706a .499 .493 18.670 .499 94.435 1 95 .000 2 .750b .562 .553 17.534 .064 13.715 1 94 .000
Stepwise EP Assertive Factor v. FFM Sub-factor Coefficients
Model
Unstandardized Coefficients Standardized Coefficients
T Sig. B Std. Error Beta
1 (Constant) -14.437 7.067 -2.043 .044
E3 3.390 .349 .706 9.718 .000
2 (Constant) 27.250 13.067 2.085 .040
E3 2.675 .380 .557 7.035 .000
A4 -1.449 .391 -.293 -3.703 .000
Dependent Variable: Assertiveness N=97
29
©Emergenetics LLC, 1993-2020
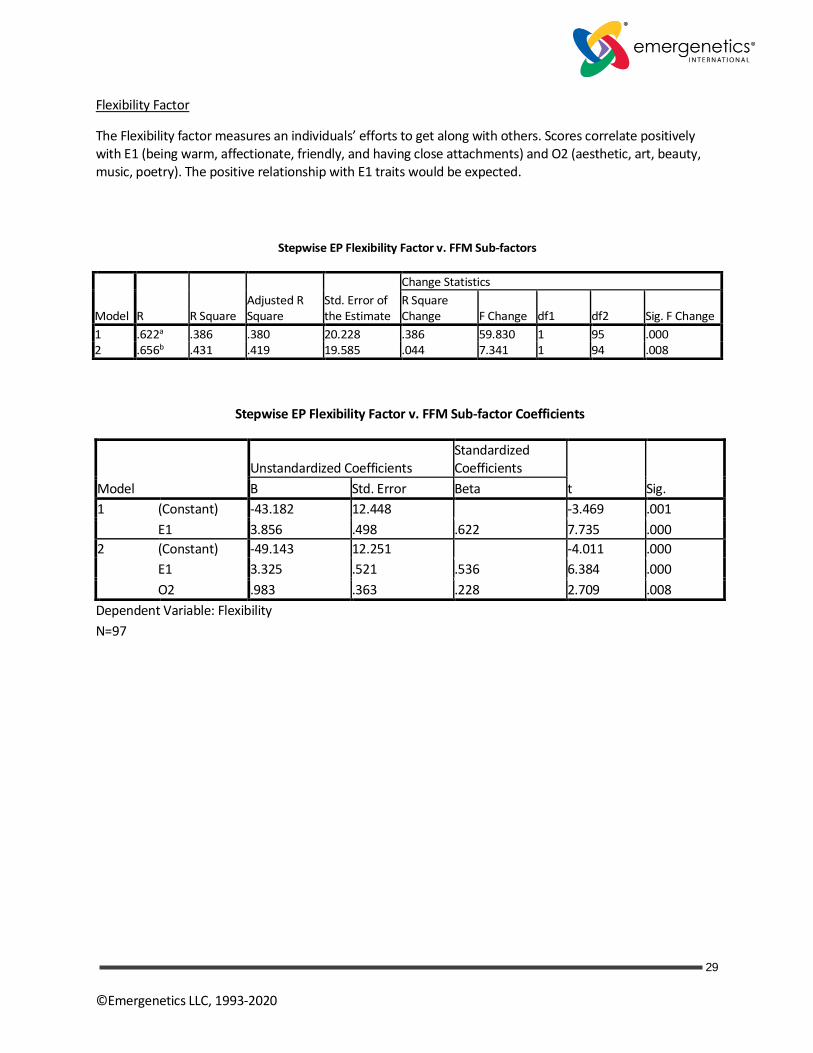
Flexibility Factor
The Flexibility factor measures an individuals’ efforts to get along with others. Scores correlate positively with E1 (being warm, affectionate, friendly, and having close attachments) and O2 (aesthetic, art, beauty, music, poetry). The positive relationship with E1 traits would be expected.
Stepwise EP Flexibility Factor v. FFM Sub-factor Coefficients
Model
Unstandardized Coefficients Standardized Coefficients
t Sig. B Std. Error Beta
1 (Constant) -43.182 12.448 -3.469 .001
E1 3.856 .498 .622 7.735 .000
2 (Constant) -49.143 12.251 -4.011 .000
E1 3.325 .521 .536 6.384 .000
O2 .983 .363 .228 2.709 .008
Dependent Variable: Flexibility
N=97
Stepwise EP Flexibility Factor v. FFM Sub-factors
Model R R Square Adjusted R Square
Std. Error of the Estimate
Change Statistics
R Square Change F Change df1 df2 Sig. F Change
1 .622a .386 .380 20.228 .386 59.830 1 95 .000 2 .656b .431 .419 19.585 .044 7.341 1 94 .008

30
©Emergenetics LLC, 1993-2020
As mentioned earlier, the FFM Conscientiousness factor has a long history of validation with job performance. However, it must be emphasized Conscientiousness is also criticized for being a statistical artifact comprised of discrete activities (i.e., C1=competent/capable, C2=organized/planful, C3=ethical/moral, and C4=driven/diligent) as opposed to a collection of rationally homogenous traits. This table shows the seven Emergenetics constructs regressed against the FFM Conscientiousness meta factor. The model shows statistically significant relationships with the Emergenetics Analytical, Expressiveness, and Conceptual nomological constructs.
Stepwise EP Factors v. FFM Conscientiousness
Model R R Square Adjusted R Square
Std. Error of the Estimate
Change Statistics
R Square Change F Change df1 df2
Sig. F Change
1 .271a .074 .064 .96749586 .074 7.559 1 95 .007 2 .346b .120 .101 .94826776 .046 4.892 1 94 .029 3 .464c .215 .190 .90015542 .096 11.317 1 93 .001
Stepwise EP Factors v. FFM Conscientiousness Coefficients
Model
Unstandardized Coefficients
Standardized Coefficients
t Sig.
Correlations
B Std. Error Beta Zero-order Partial Part
1 (Constant) -.539 .219 -2.458 .016
Ana .011 .004 .271 2.749 .007 .271 .271 .271
2 (Constant) -.961 .287 -3.344 .001
Ana .011 .004 .263 2.712 .008 .271 .269 .262
Ext .008 .004 .214 2.212 .029 .225 .222 .214
3 (Constant) -.614 .292 -2.103 .038
Ana .010 .004 .258 2.803 .006 .271 .279 .257
Ext .015 .004 .384 3.660 .000 .225 .355 .336
Con -.012 .004 -.352 -3.364 .001 -.167 -.329 -.309
Dependent Variable: Zscore(C) N=97
The next table shows the correlations between the FFM Conscientiousness sub-factors and the seven Emergenetics nomological constructs. Statistically significant relationships are shown across three of the four FFM factors (e.g., C1, C2, and C4). The C3 items (i.e., dutiful, ethical, conscientious, moral obligations) that are not part of the Emergenetics nomological constructs and have minimal relationships.

31
©Emergenetics LLC, 1993-2020
C Sub-factor Correlations
Ana Str Soc Con Ext Asr Flx
C1 Pearson Correlation .233 .015 .188 .060 .169 .155 .212
Sig. (1-tailed) .011 .441 .033 .280 .049 .065 .019
N 97 97 97 97 97 97 97
C2 Pearson Correlation .116 .543 .045 -.516 .027 -.043 .049
Sig. (1-tailed) .130 .000 .332 .000 .396 .337 .318
N 97 97 97 97 97 97 97
C3 Pearson Correlation .175 .017 .051 -.003 .072 .153 .166
Sig. (1-tailed) .043 .435 .310 .487 .243 .067 .052
N 97 97 97 97 97 97 97
C4 Pearson Correlation .274 -.137 .246 .128 .397 .363 .158
Sig. (1-tailed) .003 .090 .008 .105 .000 .000 .061
N 97 97 97 97 97 97 97
The next table shows the seven Emergenetics nomological factors correlated with the FFM trait meta-factors. As shown, there are statistically significant relationships between all Emergenetics nomological factors and most of the FFM lexical factors. This suggests the seven Emergenetics nomological factors correlate with, but are less complex and easier to use, than lexical theory.
FFM Meta Factor Correlations
Ana Str Soc Con Exp Asr Flex
N .003 .218 .088 -.118 .006 -.049 -.137
.979 .032 .391 .251 .955 .632 .182
97 97 97 97 97 97 97
E -.032 -.342 .486 .269 .731 .554 .457
.754 .001 .000 .008 .000 .000 .000
97 97 97 97 97 97 97
O -.077 -.517 .459 .547 .446 .223 .471
.455 .000 .000 .000 .000 .028 .000
97 97 97 97 97 97 97
A -.105 .029 .028 -.027 -.195 -.365 .170
.308 .777 .788 .790 .056 .000 .096
97 97 97 97 97 97 97
C .271 .201 .178 -.167 .225 .203 .192
.007 .048 .082 .103 .027 .046 .060
97 97 97 97 97 97 97
N=97
32
©Emergenetics LLC, 1993-2020
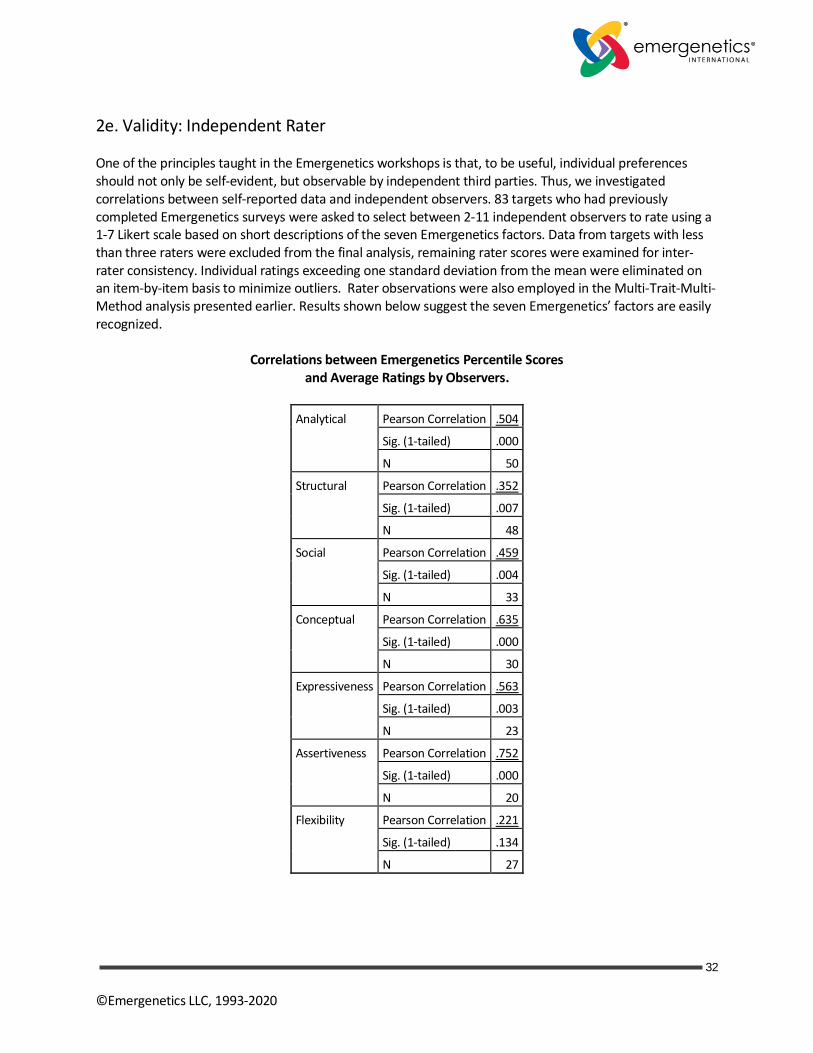
2e. Validity: Independent Rater One of the principles taught in the Emergenetics workshops is that, to be useful, individual preferences should not only be self-evident, but observable by independent third parties. Thus, we investigated correlations between self-reported data and independent observers. 83 targets who had previously completed Emergenetics surveys were asked to select between 2-11 independent observers to rate using a 1-7 Likert scale based on short descriptions of the seven Emergenetics factors. Data from targets with less than three raters were excluded from the final analysis, remaining rater scores were examined for inter-rater consistency. Individual ratings exceeding one standard deviation from the mean were eliminated on an item-by-item basis to minimize outliers. Rater observations were also employed in the Multi-Trait-Multi-Method analysis presented earlier. Results shown below suggest the seven Emergenetics’ factors are easily recognized.
Correlations between Emergenetics Percentile Scores and Average Ratings by Observers.
Analytical Pearson Correlation .504
Sig. (1-tailed) .000
N 50
Structural Pearson Correlation .352
Sig. (1-tailed) .007
N 48
Social Pearson Correlation .459
Sig. (1-tailed) .004
N 33
Conceptual Pearson Correlation .635
Sig. (1-tailed) .000
N 30
Expressiveness Pearson Correlation .563
Sig. (1-tailed) .003
N 23
Assertiveness Pearson Correlation .752
Sig. (1-tailed) .000
N 20
Flexibility Pearson Correlation .221
Sig. (1-tailed) .134
N 27

33
©Emergenetics LLC, 1993-2020
Normative Scores and Demographic Differences
Because organizations tend to expand across all cultures and countries, regardless of the local environment, they share similar expectations for employee behavior and performance objectives even within the same company, department, city, or country. Because it’s increasingly important for people to understand and utilize their individual differences in a global work environment, the Emergenetics Profile questionnaire raw scores are converted to global norms that are revisited bi-annually. The Emergenetics Profile allows individual to individual comparisons regardless of culture, occupation, or demographic background. The authors’ experience with job analysis also suggests that job titles are generally a poor indicator of job requirements and business necessity as outlined in the Department of Labor Uniform Guidelines on Employee Selection Procedures. Therefore, job data are not included in this analysis. Note: although basic demographic data are contained in the following four tables, in no way does the group mean infer an individual’s score.
In the following chart, of 28,816 subjects, 7,275 reported age. Mean percentile scores are reported below. In the following ANOVA table this data is reported by raw score. The data suggest that age has a mixed effect: Assertiveness (F=9.661, p<.000), Social (F=1.23, p<.003), Flexibility (F=4.350, p<.001 and Expressiveness (F=7.0661, p<.000)
Percentile Means by Subjects Reporting Age
Age Conceptual Analytical Structural Social Expressiveness Assertiveness Flexibility
Under 21 N Valid 120 120 120 120 120 120
120
Mean 48 42 57 57 50 45 46
Std. Deviation 27 27 27 27 30 28 30
21 – 30 N Valid 1485 1485 1485 1485 1485 1485 1485
Mean 47 50 51 49 49 46 44
Std. Deviation 26 29 26 27 27 27 28
31 – 40 N Valid 2512 2512 2512 2512 2512 2512 2512
Mean 49 51 50 48 49 49 45
Std. Deviation 26 28 26 26 28 27 27
41 – 50 N Valid 2034 2034 2034 2034 2034 2034 2034
Mean 50 51 49 47 48 47 47
Std. Deviation 26 28 27 26 27 27 27
51 – 60 N Valid 927 927 927 927 927 927 927
Mean 49 50 52 48 46 43 48
Std. Deviation 26 27 26 26 28 27 27
61 – 70 N Valid 185 185 185 185 185 185 185
Mean 45 50 55 46 46 42 45
Std. Deviation 27 28 26 25 27 27 27
71 – Up N Valid 12 12 12 12 12 12 12
Mean 48 57 44 40 44 42 38
Std. Deviation 25 30 29 31 24 19 31
N = as shown

34
©Emergenetics LLC, 1993-2020
ANOVA
Raw Score Based on Age
Sum of Squares df Mean Square F Sig.
RawAna Between Groups 2965.458 5 593.092 1.233 .291
Within Groups 3606203.820 7497 481.020
Total 3609169.278 7502
RawSoc Between Groups 7872.862 5 1574.572 3.584 .003
Within Groups 3439548.479 7830 439.278
Total 3447421.341 7835
RawStr Between Groups 2536.744 5 507.349 1.092 .363
Within Groups 3574348.454 7692 464.684
Total 3576885.198 7697
RawCon Between Groups 4242.950 5 848.590 1.926 .087
Within Groups 3403537.368 7723 440.701
Total 3407780.319 7728
RawFlex Between Groups 9940.654 5 1988.131 4.350 .001
Within Groups 3520444.414 7702 457.082
Total 3530385.069 7707
RawAsr Between Groups 21716.288 5 4343.258 9.661 .000
Within Groups 3438357.114 7648 449.576
Total 3460073.402 7653
RawExp Between Groups 16428.923 5 3285.785 7.066 .000
Within Groups 3546936.078 7628 464.989
Total 3563365.001 7633
N = 7,275
In the next set of data, percentile scores are reported based on Gender. The first chart shows means and standard deviations. The ANOVA chart following shows some strong F-statistics and modest normative differences between the genders particularly in the raw Emergenetics Social (F=21.337, p<.000) and Conceptual factors (F=14.730, p<.000). This would suggest that males and females tend to describe themselves slightly differently.

35
©Emergenetics LLC, 1993-2020
Percentile Means by Subjects Reporting Gender
N=48,125
ANOVA Raw Score Based on Gender
Sum of Squares df Mean Square F Sig.
RawAna Between Groups 2387.212 1 2387.212 4.943 .026
Within Groups 3970891.725 8223 482.901
Total 3973278.936 8224
RawSoc Between Groups 9410.627 1 9410.627 21.377 .000
Within Groups 3770085.704 8564 440.225
Total 3779496.331 8565
RawStr Between Groups 3274.967 1 3274.967 7.059 .008
Within Groups 3922134.751 8454 463.938
Total 3925409.718 8455
RawCon Between Groups 6485.163 1 6485.163 14.730 .000
Within Groups 3727298.190 8466 440.267
Total 3733783.353 8467
RawFlex Between Groups 1851.733 1 1851.733 4.021 .045
Within Groups 3881275.257 8428 460.522
Total 3883126.990 8429
RawAsr Between Groups 2459.542 1 2459.542 5.405 .020
Within Groups 3810082.614 8373 455.044
Total 3812542.156 8374
RawExp Between Groups 2565.371 1 2565.371 5.469 .019
Within Groups 3909392.932 8335 469.033
Total 3911958.303 8336
N =48,125
Female Male
Mean Std. Deviation Mean Std. Deviation
Factor Analytical 46 11 52 11
Social 60 9 58 9
Structural 37 8 34 8
Conceptual 52 9 54 9
Expressiveness 56 10 55 10
Assertiveness 57 11 60 11
Flexibility 60 10 58 10

36
©Emergenetics LLC, 1993-2020
Of 20,144 subjects only 6,672 reported ethnicities. While most of the mean percentile differences are relatively slight, the accompanying ANOVA table shows some strong F-statistics in six of the seven Emergenetics factors: Analytical (F=60.830, p<.000), Structural (F=35.845, p<.000), Social (F=15.177, p<.000), Expressiveness (F=39.842, p<.000), Assertiveness (F=135.437, p<.000), Flexibility (F=94.039, p<.000).
Percentile Means by Subjects Reporting Ethnicity
Ethnicity Concent Anacent Strcent Soccent Expcent Asrcent Flxcent
African American N Valid 170 170 170 170 170 170 170
Mean 48 58 55 48 46 46 53
Std. Deviation 24 24 25 26 24 23 25
Asian N Valid 2673 2673 2673 2673 2673 2673 2673
Mean 48 45 52 46 45 39 41
Std. Deviation 26 28 26 28 28 26 28
Caucasian N Valid 3317 3317 3317 3317 3317 3317 3317
Mean 49 53 47 47 49 50 47
Std. Deviation 25 26 26 24 27 26 25
Hispanic N Valid 512 512 512 512 512 512 512
Mean 52 61 53 53 55 56 55
Std. Deviation 24 26 25 26 24 25 27
N =As shown

37
©Emergenetics LLC, 1993-2020
ANOVA
Sum of Squares df Mean Square F Sig.
Ana raw Between Groups 31292.610 3 10430.870 60.830 .000
Within Groups 1143406.206 6668 171.477
Total 1174698.816 6671
Str Raw Between Groups 9611.075 3 3203.692 35.485 .000
Within Groups 602013.682 6668 90.284
Total 611624.757 6671
Soc Raw Between Groups 4731.608 3 1577.203 15.177 .000
Within Groups 692961.550 6668 103.923
Total 697693.158 6671
Con Raw Between Groups 1162.702 3 387.567 4.338 .005
Within Groups 595733.931 6668 89.342
Total 596896.632 6671
Ex Raw Between Groups 16112.996 3 5370.999 39.842 .000
Within Groups 898899.167 6668 134.808
Total 915012.163 6671
As Raw Between Groups 51798.364 3 17266.121 135.437 .000
Within Groups 850064.139 6668 127.484
Total 901862.503 6671
Flx Raw Between Groups 38853.382 3 12951.127 94.039 .000
Within Groups 918321.469 6668 137.721
Total 957174.851 6671

38
©Emergenetics LLC, 1993-2020
The greatest normative differences in self-reported scores can be attributed to level of education. Indeed, the higher the reported level, the greater the difference in Analytical (F=24.1.1), Structural (F=23.631), and Conceptual (F=27.011). There are lesser differences in Social (F=2.323), Flexibility (F=8.52), Assertiveness (F=12.603), and Expressiveness (F=10.54). This suggests higher education leads to substantial changes in responses, particularly increasing preferences for analysis, organization, and greater interpersonal assertiveness.
Percentile Means by Subjects Reporting Education
Education Conceptual Analytical Structural Social Expressiveness Assertiveness Flexibility
Advanced Degree
N Valid 2345 2345 2345 2345 2345 2345 2345
Mean 54 59 48 49 51 52 48
Std. Dev. 25 26 26 26 27 26 26
College Degree
N Valid 2870 2870 2870 2870 2870 2870 2870
Mean 49 50 50 48 48 47 45
Std. Dev. 26 28 26 26 27 27 27
Some College N Valid 768 768 768 768 768 768 768
Mean 47 49 55 49 47 46 50
Std. Dev. 25 27 26 25 26 26 27
HS Diploma N Valid 670 670 670 670 670 670 670
Mean 45 36 52 46 46 40 42
Std. Dev. 26 27 27 28 29 27 29
Vo-Tech N Valid 371 371 371 371 371 371 371
Mean 42 38 54 43 43 35 39
Std. Dev. 28 29 29 28 28 27 28
Some HS N Valid 156 156 156 156 156 156 156
Mean 43 41 59 46 46 42 44
Std. Dev. 28 27 26 29 29 29 30
N = As shown

39
©Emergenetics LLC, 1993-2020
ANOVA
Education
Sum of Squares df Mean Square F Sig.
RawAna Between Groups 57082.939 5 11416.588 24.101 .000
Within Groups 3534235.362 7461 473.695
Total 3591318.301 7466
RawSoc Between Groups 5102.379 5 1020.476 2.323 .041
Within Groups 3418380.224 7783 439.211
Total 3423482.603 7788
RawStr Between Groups 54027.399 5 10805.480 23.631 .000
Within Groups 3497956.563 7650 457.249
Total 3551983.962 7655
RawCon Between Groups 58389.569 5 11677.914 27.011 .000
Within Groups 3319936.989 7679 432.340
Total 3378326.558 7684
RawFlex Between Groups 19497.187 5 3899.437 8.542 .000
Within Groups 3497769.083 7662 456.509
Total 3517266.270 7667
RawAsr Between Groups 28313.143 5 5662.629 12.603 .000
Within Groups 3414609.795 7600 449.291
Total 3442922.938 7605
RawExp Between Groups 24440.421 5 4888.084 10.554 .000
Within Groups 3512554.858 7584 463.153
Total 3536995.279 7589
Conclusion The data suggests the Emergenetics nomological approach to personality differences cuts across multiple
lexical personality theory factors; shows construct convergent/discriminate validity; scores are relatively
stable across age, but differ with gender, and ethnicity; and, rise substantially with education. Subjects
report Emergenetics has robust utility in real-world applications. Separation of thought preferences and
behaviors provides a simple way for lay users to better understand interpersonal and intrapersonal
differences yet is simpler for the lay person to understand and apply.

40
©Emergenetics LLC, 1993-2020
References
Allport, G. W., & Odbert, H. S. (1936). Trait-names: A psycho-lexical study. Albany, NY: Psychological Review Company.
American Psychological Association. (2014). Standards for educational and psychological testing.
Washington, DC: American Psychological Association. American Educational Research Association, American Psychological Association, National Council on
Measurement in Education [AERA/APA/NCME]. (1999). Standards for educational and psychological testing. Washington, DC: American Psychological Association
Ashton, M. C., Lee, K., Perugini, M., Szarota, P., De Vries, R. E., Di Blas, L., ... & De Raad, B. (2004). A six-factor structure of personality-descriptive adjectives: solutions from psycholexical studies in seven languages. Journal of personality and social psychology, 86, 356.
Barrick, M. R., & Mount, M. K. (1991). The big five personality dimensions and job performance: A meta
analysis. Personnel Psychology, 44, 1-26. Browning, G. (2006). Emergenetics: Tap into the new science of success. New York, NY: Harper Collins. Burns, W.C. (1996). Content validity, face validity, and quantitative face validity [online article]. Retrieved
from http://www.burns.com/wcbcontval.htm Cattell, R. B. (October 1943). The description of personality: Basic traits resolved into clusters. Journal of
Abnormal and Social Psychology, 38 (4): 476–506. doi:10.1037/h0054116 Costa, P. T., & McCrae, R. R. (1988). From catalog to classification: Murray's needs and the Five Factor
Model. Journal of Personality and Social Psychology, 55, 258-265. Costa, P. T., & McCrae, R. R. (1992). Revised Neo Personality Inventory (NEO-PI-R) and NEO Five-Factor
Inventory (NEO-FFI). Psychological Assessment Resources. Cronbach, L. J. (1951). Coefficient alpha and the internal structure of tests. Psychometrika, 16, 297-334.
Cronbach, L. J., & Meehl, P. E. (1955). Construct validity in psychological tests. Psychological Bulletin, 52, 281-302.
Deiner, E., Larsen, R., & Emmons, R. A. (1984). Person x situation interactions: Choice of situations and
congruence response models. Journal of Personality and Social Psychology, 47, 580-592. Drayton, M. (2009). The Minnesota Multiphasic Personality Inventory-2 (MMPI-2). Occupational Medicine,
59, 135-136 Ellingson, J. E., Sackett, P. R., & Connelly, B. S. (2007). Personality assessment across selection and
development contexts: Insights into response distortion. Journal of Applied Psychology, 92, 386–395. doi:10.1037/0021-9010.92.2.386.

41
©Emergenetics LLC, 1993-2020
Fiske, D. W. (July 1949). Consistency of the factorial structures of personality ratings from different sources. Journal of Abnormal and Social Psychology, 44 (3): 329–344. doi:10.1037/h0057198.
Fiske, D. W. (1981). Problems with Language Imprecision: New Directions for Methodology of Social and
Behavioral Science. San Francisco, CA: Jossey-Bass. pp. 43–65. Furnham, A. (1992). Personality at work: The role of individual differences in the workplace. London:
Rutledge. Furnham, A., & Stringfield, P. (1993). Personality and occupational behavior: Meyers-Briggs Type Indicator
correlates of managerial practices in two cultures. Human Relations, 47 (7), 827-848. Furr, M. R. & Bacharach, V. R. (2007). Validity. In Psychometrics: An Introduction (pp. 191-235). Thousand
Oaks, CA: Sage. Goldberg, L. R. (1981) Language and individual differences: The search for universals in personality lexicons.
In L. Wheeler (Ed.), Review of Personality and Social Psychology, Vol. 2. Beverly Hills, CA: Sage. Goldberg, L. R. (December 1990). An alternative "description of personality": The Big-Five factor structure.
Journal of Personality and Social Psychology, 59 (6): 1216–1229. doi:10.1037/0022-3514.59.6.1216. PMID 2283588.
Gottfredson, G. D., & Holland, J. L. (1991). The position classification inventory. Odessa, FL: Psychological
Assessment Resources.
Gough, H. G., (1956). California Psychological Inventory. Palo Alto, CA, England: Consulting Psychologists
Press.
Hoffman, B. J., Kennedy, C. L., LoPilato, A. C., Monahan, E. L., & Lance, C. E. (2015, March 23). A Review of
the Content, Criterion-Related, and Construct-Related Validity of Assessment Center Exercises. Journal of Applied Psychology. Advance online publication. http://dx.doi.org/10.1037/a0038707.
Hogan, R., A socioanalytic theory of personality. Nebraska Symposium on Motivation, 1982, 55-89. Hogan, R., Jones, W. H., & Cheek, J. M. (1985). Socioanalytic theory: An alternative to armadillo psychology.
In B. R. Schlenker (Ed.), The self and social life (pp. 175-198). New York: McGraw Hill. Hogan, R., Curphy, G. J., & Hogan, J. (June 1994). What we know about leadership. American Psychologist,
493-504. Hogan, R., DeSoto, C. B., & Solano, C. (April 1977). Traits, tests, and personality research. American
Psychologist, 255-264. Hogan, R., Hogan, J., & Roberts, B. W. (May 1996). Personality measurement and employment decisions.
American Psychologist, 51.

42
©Emergenetics LLC, 1993-2020
Hogan, R., Raskin, R., & Fazzini, D. (1990). The dark side of charisma. In K. E. Clark & M. B. Clark (Eds.), Measures of Leadership (pp. 343-354). West Orange, NJ: Leadership Library of America.
Hogan, R. T. (1991). Personality and personality measurement. In M. D. Dunnette & L. M. Hough (Eds.),
Handbook of Industrial and Organizational Psychology, Vol. 2, pp. 873-919. Palo Alto, CA: Consulting Psychologists Press, Inc.
Hogan, R. T. (2005). In defense of personality measurement: New wine for old whiners. Human Performance,
18, 331-341. Holland, J. L. (1985). Making Vocational Choices: A Theory of vocational personalities and work
environments. Englewood Cliffs, NJ: Prentice-Hall. Holland, J. L. (1992). Making vocational choices (2nd ed.). Odessa, FL: Psychological Assessment Resources. Kinder, A., & Robertson, I. T. (1991). Do you have the personality to be a leader? The importance of
personality dimensions for successful managers and leaders. Leadership & Organization Development Journal, 15 (1), 3-12.
McCrae, R.R., & Costa, P.T. (1987) Validation of the five-factor model of personality across instruments and
observers. Journal of Personality and Social Psychology, 52, 81-90. McCrae, R.R., & Costa, P.T. (1997) Personality trait structure as a human universal. American Psychologist,
52, 509-516. Mills, C., & Hogan, R. (1978). A role theoretical interpretation of personality scale item responses. Journal of
Personality, 46, 778-785. Norman, W. T. (June 1963). Toward an adequate taxonomy of personality attributes: Replicated factor
structure in peer nomination personality ratings. Journal of Abnormal and Social Psychology 66 (6): 574–583. doi:10.1037/h0040291. PMID 13938947.
Norman, W. T. (1967). 2800 personality trait descriptors: Normative operating characteristics for a university
population. Ann Arbor, MI: University of Michigan, Dept. of Psychology. Ostroff, C. (1992). The relationship between satisfaction, attitudes, and performance: An organizational
level analysis. Journal of Applied Psychology, 77 (6), 963-974. Oswald, F. L., & Hough, L. M. (2010). Personality and its assessment in organizations: Theoretical and empirical
developments. In S. Zedeck (Ed.), APA handbook of industrial and organizational psychology: Vol. 2. Selecting and developing members for the organization (pp. 153–184). Washington, DC: American Psychological Association.
Peabody, D., & Goldberg, L. R. (September 1989). Some determinants of factor structures from personality-
trait descriptors. Journal of Personality and Social Psychology, 57 (3): 552–567. doi:10.1037/0022-3514.57.3.552. PMID 2778639.

43
©Emergenetics LLC, 1993-2020
(Pearson, K. 1903. On the theory of contingency and its relation to association of normal correlation, Mathematical contributions to the theory of evolution, Drapers Company Research Memoirs Biometric Series No.1 , Department of Applied Mathematics, University college, University of London, Dulou and Company, London).
Pittenger, D. (2005). Cautionary comments regarding the Myers-Briggs Type Indicator. Consulting Psychology
Journal: Practice and Research, 57, 210-221. Revelle, W. (2013). Personality Theory and Research. In The Personality Project. Retrieved March 23, 2015,
from http://personality-project.org/. Schmidt, F. L., & Hunter, J. E. (1981). Employment testing: old theories and new research findings. American
Psychologist, 36 (10), 1128-1137. Tupes, E. C., & Christal, R. E. (1961). Recurrent personality factors based on trait ratings. United States Air
Force. Zonderman, A. B. (1980). Inventory construction by the method of homogeneous item composites.
Unpublished manuscript, Johns Hopkins University . Van Zwanenberg, N., & Wilkinson, L. J. (1993). The person specification - a problem masquerading as a
solution? Personnel Review, 22 (7), 54-65.

44
©Emergenetics LLC, 1993-2020
R. Wendell Williams, MBA, Ph.D. Co-Creator of the Emergenetics Profile Creator of Emergenetics Selection Program Dr. Wendell Williams is the co-founder of the Emergenetics Profile and the developer of the Emergenetics Selection Hiring Assessment. Dr. Williams has worked with Emergenetics CEO Dr. Geil Browning since the inception of the company and continues in an expert development and advisory role as well as being a close friend. Dr. Williams is a performance expert with a wealth of experience in assessment, testing, and training; including line, staff, and executive management positions. He has worked on production lines, managed work groups of all sizes, established large training departments, managed three companies, and consulted with hundreds of organizations, including many Fortune 500 organizations. Academically, Wendell holds a Bachelor of Science in Industrial Management, Master of Business Administration, Master of Science in Applied Social Psychology, and a Ph.D. in Industrial Psychology. In addition, he has earned a Chartered Financial Consultant Certification and once held four NASD securities licenses. Wendell has been widely quoted both nationally and internationally. His comments have been included in the Harvard Business Review and the Wall Street Journal to name a few. He is also an ERE Featured Columnist. He holds memberships in the American Psychological Association and The Society for Industrial and Organizational Psychology. His professional website is www.ScientificSelection.com.