r. nassar et al- a global inventory of stratospheric chlorine in 2004
TRANSCRIPT
8/2/2019 R. Nassar et al- A global inventory of stratospheric chlorine in 2004
http://slidepdf.com/reader/full/r-nassar-et-al-a-global-inventory-of-stratospheric-chlorine-in-2004 1/13
A global inventory of stratospheric chlorine in 2004
R. Nassar,1,2 P. F. Bernath,1 C. D. Boone,1 C. Clerbaux,3,4 P. F. Coheur,4 G. Dufour,5
L. Froidevaux,6 E. Mahieu,7 J. C. McConnell,8 S. D. McLeod,1 D. P. Murtagh,9
C. P. Rinsland,10 K. Semeniuk,8 R. Skelton,1 K. A. Walker,1,11 and R. Zander 7
Received 12 January 2006; revised 21 July 2006; accepted 7 August 2006; published 30 November 2006.
[1] Total chlorine (ClTOT) in the stratosphere has been determined using the AtmosphericChemistry Experiment Fourier Transform Spectrometer (ACE-FTS) measurements of HCl, ClONO2, CH3Cl, CCl4, CCl3F (CFC-11), CCl2F2 (CFC-12), CHClF2 (HCFC-22),CCl2FCClF2 (CFC-113), CH3CClF2 (HCFC-142b), COClF, and ClO supplemented bydata from several other sources, including both measurements and models. Separatechlorine inventories were carried out in five latitude zones (60° –82° N, 30° –60° N,30°S–30° N, 30° –60°S, and 60° –82°S), averaging the period of February 2004 toJanuary 2005 inclusive, when possible, to deal with seasonal variations. The effect of diurnal variation was avoided by only using measurements taken at local sunset. Meanstratospheric ClTOT values of 3.65 ppbv were determined for both the northern and
southern midlatitudes (with an estimated 1s accuracy of ±0.13 ppbv and a precision of ±0.09 ppbv), accompanied by a slightly lower value in the tropics and slightly higher values at high latitudes. Stratospheric ClTOT profiles in all five latitude zones are nearlylinear with a slight positive slope in ppbv/km. Both the observed slopes and pattern of latitudinal variation can be interpreted as evidence of the beginning of a decline in globalstratospheric chlorine, which is qualitatively consistent with the mean stratosphericcirculation pattern and time lag necessary for transport.
Citation: Nassar, R., et al. (2006), A global inventory of stratospheric chlorine in 2004, J. Geophys. Res., 111, D22312, doi:10.1029/
2006JD007073.
1. Introduction
[2] The decrease in stratospheric ozone since the mid-1970s is largely due to the anthropogenic emission of organic chlorine and bromine compounds. Many of theorganic chlorine compounds including chlorofluorcarbons(CFCs), hydrochlorofluorocarbons (HCFCs), halons and
others are chemically stable in the troposphere where they behave as greenhouse gases, contributing to global climate
change. Brewer-Dobson circulation transports these com- pounds to the tropical stratosphere and subsequently dis-tributes them to the middle and high latitudes. In thestratosphere, they are broken down by UV photolysis or reaction with radicals such as O(1 D) and OH, ultimatelyresulting in the formation of active chlorine species such aschlorine monoxide (ClO). Active chlorine species partici-
pate in catalytic cycles destroying stratospheric ozone[ Molina and Rowland , 1974; Stolarski and Cicerone,1974; Farman et al., 1985; Molina and Molina, 1987],until they undergo conversion to reservoir species such aschlorine nitrate (ClONO2) or hydrogen chloride (HCl). Adetailed review of these processes is given by Solomon[1999].
[3] Prior to the widespread use of ozone depletinggases only a few decades ago, total chlorine (ClTOT) inthe stratosphere had a volume mixing ratio (VMR) equalto the natural background level of about 0.6 ppbv (parts
per billion by volume), which is primarily due to CH3Cl.Measurements indicate that mean stratospheric ClTOT
reached 3.70 ± 0.20 ppbv around 1997 [Sen et al.,1999] and has recently begun a slow decline [ Andersonet al., 2000; Mahieu et al., 2004] as a result of theemission restrictions required by the Montreal Protocoland its amendments, but the exact date and the VMR of the maximum in stratospheric ClTOT are somewhat ill
JOURNAL OF GEOPHYSICAL RESEARCH, VOL. 111, D22312, doi:10.1029/2006JD007073, 2006ClickHere
for
Full Article
1Department of Chemistry, University of Waterloo, Waterloo, Ontario,Canada.
2 Now at Department of Earth and Planetary Sciences and Division of Engineering and Applied Sciences, Harvard University, Cambridge,Massachusetts, USA.
3Service d ’Aeronomie, Institut Pierre Simon Laplace, Universite Pierreet Marie Curie, Paris, France.
4Spectroscopie de l’Atmosphere, Service de Chimie Quantique et Photophysique, Universite Libre de Bruxelles, Brussels, Belgium.
5Laboratoire de Meteorologie Dynamique, Institut Pierre Simon
Laplace, Ecole Polytechnique, Palaiseau, France.6Jet Propulsion Laboratory, California Institute of Technology,
Pasadena, California, USA.7Institute of Astrophysics and Geophysics, University of Liege, Liege,
Belgium.8Department of Earth and Space Science and Engineering, York
University, Toronto, Ontario, Canada.9Department of Radio and Space Science, Chalmers University of
Technology, Goteborg, Sweden.10 NASA Langley Research Center, Hampton, Virginia, USA.11 Now at Department of Physics, University of Toronto, Toronto,
Ontario, Canada.
Copyright 2006 by the American Geophysical Union.0148-0227/06/2006JD007073$09.00
D22312 1 of 13
8/2/2019 R. Nassar et al- A global inventory of stratospheric chlorine in 2004
http://slidepdf.com/reader/full/r-nassar-et-al-a-global-inventory-of-stratospheric-chlorine-in-2004 2/13
defined [Waugh et al., 2001]. Most modeling studies predict that global stratospheric ozone should fully recover shortly after stratospheric chlorine declines to 2.0 ppbv[World Meteorological Organization (WMO), 1999;
Prather and Watson, 1990; Prather et al., 1996], but predictions of the date that chlorine will reach this levelrange from 2040 to 2070 [ Engel et al., 2002]. Further-more, increases in stratospheric water vapor and strato-
spheric cooling associated with climate change bothenhance polar stratospheric cloud (PSC) formation, whichmakes predicting the exact date of ozone recovery evenmore difficult [ Austin et al., 1992, 2002; Shindell et al.,1998; Shindell and Grewe, 2002].
[4] Until there is more certainty regarding the recoveryof global stratospheric ozone, it will remain necessary tomonitor ozone levels and make continual measurementsof the species that contribute to stratospheric chlorine.There are currently a variety of different instruments that can measure chlorinated species in the atmosphere fromthe ground, aircraft, balloons or space-based platforms.
Zander et al. [1992, 1996] determined mean stratosphericClTOT values of 2.58 ± 0.10 ppbv in 1985 and 3.53 ±
0.10 ppbv in 1994 for northern midlatitudes, primarilyusing measurements from the Atmospheric Trace Mole-cule Spectroscopy (ATMOS) instrument which flew four times on the NASA Space Shuttle (1985, 1992, 1993, and1994). Similarly, a value of 3.70 ± 0.20 ppbv wasdetermined based on measurements by the balloon-borneMkIV interferometer during the Arctic summer of 1997[Sen et al., 1999]. Both of these instruments are high-resolution infrared Fourier transform spectrometers, whichare capable of measuring a large number of chlorine-containing species. The determination of total chlorinefrom their measurements was made by summing thechlorine contributions from all significant individual spe-cies averaged over a range of stratospheric altitudes.During the Stratospheric Aerosol and Gas Experiment (SAGE) III Ozone Loss and Validation Experiment (SOLVE) campaign, air samples were collected from a
NASA ER-2 aircraft between 10 and 21 km altitude inthe 2000 Arctic winter [Schauffler et al., 2003]. Labora-tory analysis of the air samples gave individual VMR
profiles of 15 chlorine-containing species and a similar approach of summing profiles yielded a ClTOT value of about 3.6 ppbv.
[5] The Halogen Occultation Experiment (HALOE) onthe Upper Atmosphere Research Satellite (UARS) has
produced a record of HCl at 55 km from 1991 to 2005[ Russell et al., 1996b; Anderson et al., 2000], but hasnow been retired. According to the HALOE method, theratio of HCl to total inorganic chlorine (Cly) at 55 kmaltitude is 0.93 at the equator and 0.95 at high latitudes,so measurements of HCl at a given latitude are divided
by this ratio to obtain Cly, which has often been used asan approximation for ClTOT. Russell et al. [1996b] statethat HCl/ClTOT is less than 1 mostly due to CHClF2
(HCFC-22), one of the few organic chlorine species knownto exist in the upper stratosphere in significant amountsat that time [Weisenstein et al., 1992; Rummukainen, 1996;Coheur et al., 2003]. HALOE determined Cly values of 3.3 ± 0.33 ppbv in June 1995 [ Russell et al., 1996b]and over 3.5 ppbv in 2000 [ Anderson et al., 2000]
which indicate that HALOE Cly are somewhat lower than ClTOT determined by ATMOS or MkIV at a similar time.
[6] Although ground-based measurements provide lessglobal coverage than satellites, a large number of sitesmake measurements of chlorine-containing species, whichtogether make an important contribution to assessingchlorine levels in the atmosphere and their temporal
evolution. Some of the most important sets of ground- based measurements come from the Atmospheric LifetimeExperiment, the Global Atmospheric Gases Experiment and the Advanced Global Atmospheric Gases Experiment (ALE/GAGE/AGAGE) [ Prinn et al., 2000], the NationalOceanic and Atmospheric Administration Climate Moni-toring and Diagnostics Laboratory (NOAA/CMDL) meas-urements [ Montzka et al., 1996, 1999] and the Network for the Detection of Stratospheric Change (NDSC)[ Rinsland et al., 2003], which has recently been renamedthe Network for the Detection of Atmospheric CompositionChange (NDACC). The in situ ALE/GAGE/AGAGE and
NOAA/CMDL measurements both indicate declining lev-els of tropospheric chlorine, largely driven by declines in
CH3CCl3 and CCl4 [ Prinn et al., 2000]. The NDSC solar absorption measurements are used to infer total columnamounts of a number of species, including HCl andClONO2. These measurements indicate that Cly in thelower stratosphere has been decreasing very slowly(À0.7 ± 0.3%/yr, 1s ) since it peaked in late 1996 [ Mahieuet al., 2004].
[7] Comparisons between measurement sets and indus-try-reported levels of source gas production and emissionwith modeling studies of chemistry and transport helps toobtain a complete understanding of the distribution andcomposition of chlorine species in the stratosphere, whichaids in making accurate predictions about ozone recovery.In the present work, stratospheric ClTOT is calculated bytaking the sum of the chlorine contribution from VMR
profiles of individual chlorine-containing species mea-sured by the Atmospheric Chemistry Experiment Fourier Transform Spectrometer (ACE-FTS), supplemented by
profiles of species measured by other instruments or, insome cases, calculated profiles. Daytime ClTOT profilesare determined separately in five latitude zones (60° – 82° N, 30° –60° N, 30°S–30° N, 30° –60°S and 60° –82°S)during the period of February 2004 to January 2005inclusive. ClTOT profiles are then averaged over a rangeof stratospheric altitudes to obtain a value for meanstratospheric ClTOT, a s b y Zander et al. [1992, 1996].The results of this global inventory of stratosphericchlorine can be used for comparing with other measure-ments as well as reported emission inventories, for assessing the effectiveness of the Montreal Protocol andfor incorporating into models to predict the eventual dateof recovery of the ozone layer.
2. Definitions of Total Stratospheric Chlorine
[8] The method for determination of stratospheric ClTOT
in this work is similar to the method of Zander et al. [1992,1996] based on the sum of all significant chlorine-containing species in the stratosphere. In the present work,total organic chlorine CCly, total inorganic chlorine Cly, and
D22312 NASSAR ET AL.: 2004 STRATOSPHERIC CHLORINE INVENTORY
2 of 13
D22312

8/2/2019 R. Nassar et al- A global inventory of stratospheric chlorine in 2004
http://slidepdf.com/reader/full/r-nassar-et-al-a-global-inventory-of-stratospheric-chlorine-in-2004 3/13

8/2/2019 R. Nassar et al- A global inventory of stratospheric chlorine in 2004
http://slidepdf.com/reader/full/r-nassar-et-al-a-global-inventory-of-stratospheric-chlorine-in-2004 4/13
values for 2004, while attempting to account for seasonalvariations; however, the limited coverage provided by theACE orbit often results in periods of more than a monthwhere no measurements are made for some latitude zones.
3.1. Organic Species: CH3Cl, CCl3F, CCl2F2,CCl2FClF2, CH3CClF2, CCl4, and CHClF2
[12 ] Profiles of methyl chloride (CH3Cl), CFC-11(CCl3F), CFC-12 (CCl2F2), and HCFC-22 (CHClF2) wereretrieved using the ACE-FTS version 2.2 retrieval algorithm
Table 1. Microwindows for Chlorine Species Retrieved From ACE-FTS Measurements
SpeciesRetrieved Altitude Range for
Average Profile, km
Microwindow
Center, cmÀ1 Width, cmÀ1 Range, km
HCl 8.5 – 56.5 2701.26 0.30 8.5 – 35.5HCl 8.5 – 56.5 2703.03 0.30 35.5 – 46.5HCl 8.5 – 56.5 2727.77 0.40 8.5 – 44.5HCl 8.5 – 56.5 2751.97 0.30 47.5 – 54.5HCl 8.5 – 56.5 2775.75 0.30 40.5 – 56.5
HCl 8.5 – 56.5 2798.95 0.35 51.5 – 56.5HCl 8.5 – 56.5 2819.48 0.30 20.5 – 53.5HCl 8.5 – 56.5 2821.47 0.30 18.5 – 56.5HCl 8.5 – 56.5 2841.63 0.40 20.5 – 49.5HCl 8.5 – 56.5 2843.67 0.30 15.5 – 56.5HCl 8.5 – 56.5 2865.16 0.26 38.5 – 56.5HCl 8.5 – 56.5 2906.30 0.30 45.5 – 56.5HCl 8.5 – 56.5 2923.57 0.50 20.5 – 47.5HCl 8.5 – 56.5 2923.73 0.30 44.5 – 49.5HCl 8.5 – 56.5 2925.90 0.30 17.5 – 56.5HCl 8.5 – 56.5 2942.67 0.40 15.5 – 53.5HCl 8.5 – 56.5 2944.95 0.30 10.5 – 56.5HCl 8.5 – 56.5 2961.00 0.40 25.5 – 47.5HCl 8.5 – 56.5 2963.11 0.50 8.5 – 56.5HCl 8.5 – 56.5 2981.00 0.50 40.5 – 56.5HCl 8.5 – 56.5 2995.88 0.30 45.5 – 50.5HCl 8.5 – 56.5 2998.14 0.30 52.5 – 56.5
ClONO2 12.5 – 34.5 780.15 0.60 12.5 – 19.5ClONO2 12.5 – 34.5 1202.86 0.50 12.5 – 17.5ClONO2 12.5 – 34.5 1292.60 1.60 18.5 – 34.5ClONO2 12.5 – 34.5 1728.28 0.50 12.5 – 17.5COClFa 17/19–30 b 1860.35 0.70 17/19 – 30 b
COClFa 17/19–30 b 1862.55 1.30 17/19 – 30 b
COClFa 17/19–30 b 1864.30 0.60 17/19 – 30 b
COClFa 17/19–30 b 1865.45 1.10 17/19 – 30 b
COClFa 17/19–30 b 1866.80 0.40 17/19 – 30 b
COClFa 17/19–30 b 1868.80 0.60 17/19 – 30 b
COClFa 17/19–30 b 1870.575 0.35 17/19 – 30 b
COClFa 17/19–30 b 1874.95 0.90 17/19 – 30 b
ClOc 12.5 – 24.5 823.475 5.00 11.5 – 29.5ClOc 12.5 – 24.5 828.475 5.00 11.5 – 29.5ClOc 12.5 – 24.5 833.475 5.00 11.5 – 29.5ClOc 12.5 – 24.5 838.475 5.00 11.5 – 29.5ClOc 12.5 – 24.5 843.475 5.00 11.5 – 29.5
CH3Cl 9.5 – 24.5 2966.50 0.40 9.5 – 24.5CH3Cl 9.5 – 24.5 2966.90 0.40 9.5 – 24.5CH3Cl 9.5 – 24.5 2967.30 0.70 9.5 – 24.5CCl4 8.5 – 22.5 799.85 11.00 8.5 – 22.5CCl3F (CFC-11) 5.5 – 21.5 842.50 25.00 5.5 – 21.5CCl2F2 (CFC-12) 6.5 – 27.5 922.00 4.00 6.5 – 27.5CCl2F2 (CFC-12) 6.5 – 27.5 1161.00 1.20 12.5 – 24.5CHClF2 (HCFC-22) 5.5 – 24.5 809.30 1.10 5.5 – 14.5CHClF2 (HCFC-22) 5.5 – 24.5 820.85 0.70 5.5 – 11.5CHClF2 (HCFC-22) 5.5 – 24.5 829.03 0.50 5.5 – 24.5CCl2FClF2 (CFC-113) 7.5 – 16.5 817.50 25.00 7.5 – 16.5CH3CClF2 (HCFC-142b) 8.5 – 18.5 1134.50 4.00 8.5 – 18.5CH3CClF2 (HCFC-142b) 8.5 – 18.5 1193.60 3.60 8.5 – 18.5
a Special circumstances for the retrieval of this species are outlined in the text. bThe lower altitude limit for COClF is 19 km for tropical occultations and 17 km for midlatitudes.cThe ACE-FTS ClO retrieval was only used for southern high latitudes over a reduced altitude range.
Table 2. Number of Profiles Averaged in Each Latitude Zone for
the Period of February 2004 to January 2005 Inclusive
MaximumACE-FTS
ProfilesOdin SMR ClO
Profiles
Northern high latitudes (60° –82° N) 63 72 Northern midlatitudes (30° –60° N) 131 58Tropics (30°S–30° N) 170 157Southern midlatitudes (30° –60°S) 180 22Southern high latitudes (60° –82°S) 135 38
D22312 NASSAR ET AL.: 2004 STRATOSPHERIC CHLORINE INVENTORY
4 of 13
D22312
8/2/2019 R. Nassar et al- A global inventory of stratospheric chlorine in 2004
http://slidepdf.com/reader/full/r-nassar-et-al-a-global-inventory-of-stratospheric-chlorine-in-2004 5/13
which is described by Boone et al. [2005]. CFC-113(CCl2FClF2), HCFC-142b (CH3CClF2) and carbon tetra-chloride (CCl4) were specially retrieved for this work. TheACE-FTS retrievals of CCl2FClF2 and CH3CClF2 used inthis work are the first retrievals of these two species fromspaceborne measurements [ Dufour et al., 2005].
[13] In the troposphere and lower stratosphere CClyspecies dominate ClTOT, with the largest contributions from
CH3Cl (the only significant natural source of organicchlorine), CCl2F2, and CCl3F. From the surface up to themiddle stratosphere, CCl2F2 with two chlorine atoms,makes the largest contribution to ClTOT of all CCly species.CHClF2 (HCFC-22) is only the fourth largest organicchlorine species in the upper troposphere, but in the middleand upper stratosphere it is long-lived and is the dominant CCly species.
[14] The ATMOS and MkIV chlorine budgets [ Zander et al., 1992, 1996; Sen et al., 1999] did not include CHClF2 inthe upper stratosphere because its VMR was below their detection limits. However, Weisenstein et al. [1992] haveshown that it exists in the upper stratosphere in significant quantities. Their modeled value in the upper stratosphere
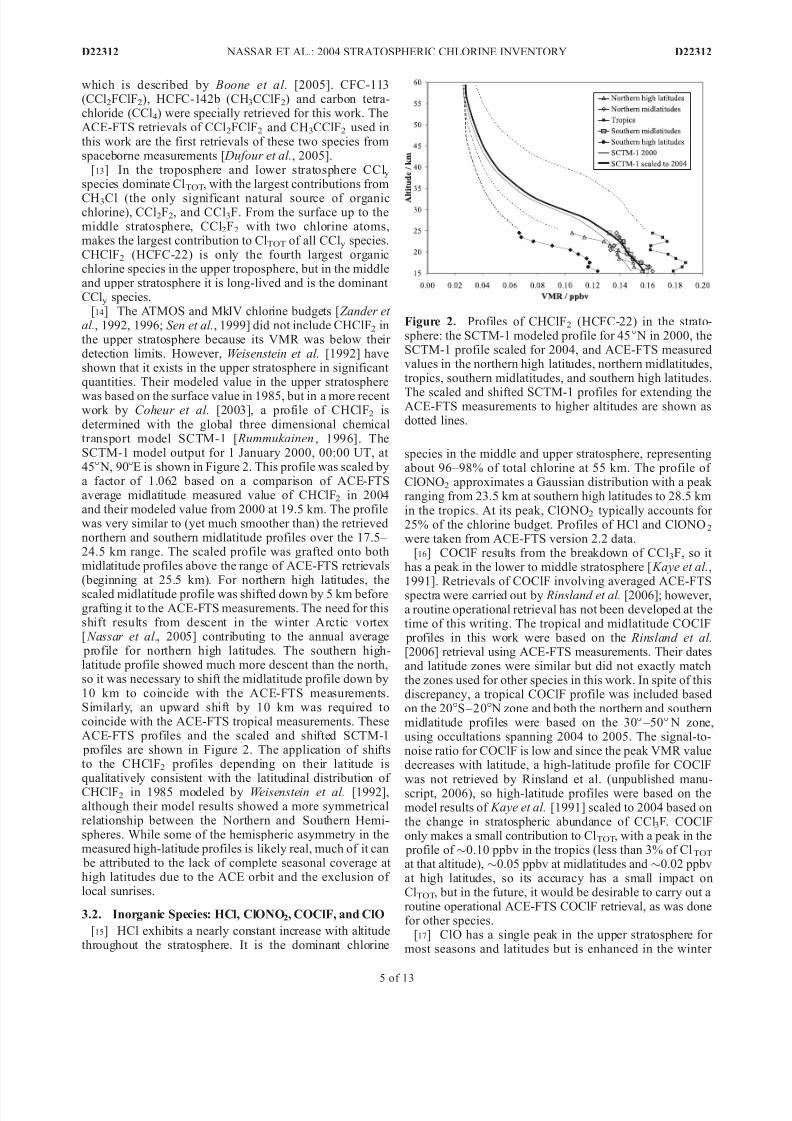
was based on the surface value in 1985, but in a more recent work by Coheur et al. [2003], a profile of CHClF2 isdetermined with the global three dimensional chemicaltransport model SCTM-1 [ Rummukainen , 1996]. TheSCTM-1 model output for 1 January 2000, 00:00 UT, at 45° N, 90°E is shown in Figure 2. This profile was scaled bya factor of 1.062 based on a comparison of ACE-FTSaverage midlatitude measured value of CHClF2 in 2004and their modeled value from 2000 at 19.5 km. The profilewas very similar to (yet much smoother than) the retrievednorthern and southern midlatitude profiles over the 17.5– 24.5 km range. The scaled profile was grafted onto bothmidlatitude profiles above the range of ACE-FTS retrievals(beginning at 25.5 km). For northern high latitudes, thescaled midlatitude profile was shifted down by 5 km beforegrafting it to the ACE-FTS measurements. The need for thisshift results from descent in the winter Arctic vortex[ Nassar et al., 2005] contributing to the annual average
profile for northern high latitudes. The southern high-latitude profile showed much more descent than the north,so it was necessary to shift the midlatitude profile down by10 km to coincide with the ACE-FTS measurements.Similarly, an upward shift by 10 km was required tocoincide with the ACE-FTS tropical measurements. TheseACE-FTS profiles and the scaled and shifted SCTM-1
profiles are shown in Figure 2. The application of shiftsto the CHClF2 profiles depending on their latitude isqualitatively consistent with the latitudinal distribution of CHClF2 in 1985 modeled by Weisenstein et al. [1992],although their model results showed a more symmetricalrelationship between the Northern and Southern Hemi-spheres. While some of the hemispheric asymmetry in themeasured high-latitude profiles is likely real, much of it can
be attributed to the lack of complete seasonal coverage at high latitudes due to the ACE orbit and the exclusion of local sunrises.
3.2. Inorganic Species: HCl, ClONO2, COClF, and ClO
[15] HCl exhibits a nearly constant increase with altitudethroughout the stratosphere. It is the dominant chlorine
species in the middle and upper stratosphere, representingabout 96–98% of total chlorine at 55 km. The profile of ClONO2 approximates a Gaussian distribution with a peak ranging from 23.5 km at southern high latitudes to 28.5 kmin the tropics. At its peak, ClONO2 typically accounts for 25% of the chlorine budget. Profiles of HCl and ClONO2
were taken from ACE-FTS version 2.2 data.[16] COClF results from the breakdown of CCl3F, so it
has a peak in the lower to middle stratosphere [ Kaye et al.,1991]. Retrievals of COClF involving averaged ACE-FTSspectra were carried out by Rinsland et al. [2006]; however,a routine operational retrieval has not been developed at thetime of this writing. The tropical and midlatitude COClF
profiles in this work were based on the Rinsland et al.[2006] retrieval using ACE-FTS measurements. Their datesand latitude zones were similar but did not exactly matchthe zones used for other species in this work. In spite of thisdiscrepancy, a tropical COClF profile was included basedon the 20°S–20° N zone and both the northern and southernmidlatitude profiles were based on the 30° –50° N zone,using occultations spanning 2004 to 2005. The signal-to-noise ratio for COClF is low and since the peak VMR valuedecreases with latitude, a high-latitude profile for COClF
was not retrieved by Rinsland et al. (unpublished manu-script, 2006), so high-latitude profiles were based on themodel results of Kaye et al. [1991] scaled to 2004 based onthe change in stratospheric abundance of CCl3F. COClFonly makes a small contribution to ClTOT, with a peak in the
profile of $0.10 ppbv in the tropics (less than 3% of ClTOT
at that altitude), $0.05 ppbv at midlatitudes and $0.02 ppbvat high latitudes, so its accuracy has a small impact onClTOT, but in the future, it would be desirable to carry out aroutine operational ACE-FTS COClF retrieval, as was donefor other species.
[17] ClO has a single peak in the upper stratosphere for most seasons and latitudes but is enhanced in the winter
Figure 2. Profiles of CHClF2 (HCFC-22) in the strato-sphere: the SCTM-1 modeled profile for 45° N in 2000, theSCTM-1 profile scaled for 2004, and ACE-FTS measuredvalues in the northern high latitudes, northern midlatitudes,tropics, southern midlatitudes, and southern high latitudes.
The scaled and shifted SCTM-1 profiles for extending theACE-FTS measurements to higher altitudes are shown asdotted lines.
D22312 NASSAR ET AL.: 2004 STRATOSPHERIC CHLORINE INVENTORY
5 of 13
D22312

8/2/2019 R. Nassar et al- A global inventory of stratospheric chlorine in 2004
http://slidepdf.com/reader/full/r-nassar-et-al-a-global-inventory-of-stratospheric-chlorine-in-2004 6/13
polar vortices causing a second highly variable peak in thelower stratosphere. In the upper stratosphere, it can com-
prise close to 20% of ClTOT. Since the signal-to-noise ratiofor ClO in ACE-FTS spectra is usually very low, most of theClO measurements used in this work are from the submil-limeter receiver (SMR) [Urban et al., 2005] on the Odinsatellite [ Murtagh et al., 2002], just as Zander et al. [1996]used ClO measurements from the Millimeter-wave Atmo-
spheric Sounder (MAS) [ Hartmann et al., 1996; Aellig et al., 1996] for the ATMOS chlorine budget. Version 1.2SMR ClO profiles were obtained for the period of February2004 to January 2005 inclusive, to match the temporal rangeof the ACE-FTS measurements. From the SMR data set,only measurements with a solar zenith angle between 88°and 92° and made during local sunset were chosen. Thelatitudes for the SMR data were selected to match the ACE-FTS mean latitudes in the five latitude zones, 71 ± 2° for high latitudes, 45 ± 1° for midlatitudes and 15 ± 2° for thetropics (assuming symmetry about the equator). Since allACE-FTS southern high latitude daytime measurementsoccurred during the Southern Hemisphere winter months,SMR ClO profiles were selected for this date range rather
than using data with full seasonal coverage.[18] The SMR profiles were interpolated to the ACE-FTS
1-km grid using a cubic spline interpolation, then averagedin each latitude zone. The number of SMR profiles includedin each average is shown in Table 2. Profiles with unphys-ical shapes were discarded as outliers, as was done with theACE-FTS data. In a few cases, an unphysical increase inSMR ClO profiles above 51.5 km was manually removed,
but this is above the range of altitude considered in thecalculation of stratospheric ClTOT. This lower mesosphericincrease has recently been identified as an artifact in version1.2 of the SMR data and has apparently been corrected inSMR version 2.0 data (D. P. Murtagh, private communica-tion, 2006).
[19] At southern high latitudes in the 12.5– 24.5 kmrange, strong ClO enhancement was measured by theACE-FTS. Since lower stratospheric ClO enhancement isextremely variable, these measurements have been used sothat the ClO profiles are properly matched to those of other species. The ACE-FTS ClO retrievals are somewhat noisy
but averaging 119 southern high-latitude profiles produceda smooth result. Weak ClO enhancement is observed for northern high latitudes, but since the signal-to-noise ratio isstill low, the SMR profiles were used rather than ACE-FTSmeasurements in this altitude range.
4. Chlorine-Containing Species Not Measured
by the ACE-FTS[20] Some species that contribute to stratospheric chlorine
were not measured by the ACE-FTS, so they have beenincluded in this inventory based on measurements by other instruments, model values or estimates as described in thefollowing subsections.
4.1. Organic Species: CH3CCl3 and Minor CFCs,HCFCs, and Halons
[21] CH3CCl3 and a number of minor organic chlorinespecies make a small contribution to ClTOT in the strato-sphere. Measurements from the SAGE III Ozone Loss and
Validation Experiment (SOLVE) campaign [Schauffler et al., 2003] were used to estimate profiles of CH3CCl3,CClF2CClF2 ( CF C- 11 4 ) , CCl2FCF3 (CFC-114a),CCl2FCF3 (CFC-115), CH3CCl2F (HCFC-141b), andCBrClF2 (Halon-1211). The SOLVE measurements weremade from whole air samples collected during an aircraft campaign from January to March 2000, between 52° and88° N latitude over a range of 10–21 km altitude. Empirical
equations for the SOLVE VMR profiles of the chlorinecontribution from these species were provided on an N2Oscale [Schauffler et al., 2003]. These were converted to analtitude scale using ACE-FTS retrieved mean N2O profilesfrom each of the five latitude zones then the profiles of eachchlorine-containing species were multiplied by a scalefactor to account for the changes in abundance whichoccurred between 2000 and 2004. Scaling was carried out using the ratio between the 2004 to 2000 surface values inTable 1–16 of WMO [2003]. The profiles should theoret-ically scale without significant changes to their shapes sincetheir stratospheric VMRs were increasing or decreasing at an approximately constant rate in 2000 which was at least 4 years before (or after) the year of maximum VMR for any
of these species.[22] The SOLVE profiles are only valid over the 50–
315 ppbv N2O range [Schauffler et al., 2003], where50 ppbv corresponds to an altitude of $23.5 km at southernhigh latitudes and $39.5 km in the tropics. CFC-114aand Halon-1211 were negligible above this altitude. TheHCFC-141b and CFC-115 profiles appeared satisfactoryabove this altitude range, each with only a small contributionin the upper stratosphere. Since CH3CCl3 is expected tocompletely break down in the stratosphere [Weisenstein et al., 1992], the CH3CCl3 profiles were manually extrapolatedto smoothly reach zero VMR above the measured altituderange.
[23] At 17.5 km in altitude, CH3CCl3 contributes between0.015 ppbv chlorine at southern high latitudes and 0.08 ppbvchlorine in the tropics (0.4–2.2% respectively). The com-
bined total chlorine contribution from the other species at 17.5 km is 0.04 ppbv at southern high latitude and 0.08 ppbvin the tropics and decreases to just over 0.01 ppbv at the topof the stratosphere, with the largest contributions from theminor species due to CFC-114 and HCFC-141b. When allof these species are combined, their contribution to ClTOT issignificant, but errors of 20–30% on any individual specieswould make a very small change to ClTOT; therefore,although an accurate estimate of profiles for each of theseminor species was sought, it is not critical to main objectiveof this paper.
4.2. Inorganic Species: HOCl, COCl2, and ClOOCl[24] Efforts to retrieve HOCl from ACE-FTS spectra are
in progress; however, von Clarmann et al. [2006] haveretrieved HOCl from MIPAS spectra, so these profiles arethe basis for the HOCl profiles in this chorine inventory.Since their work indicates that HOCl exhibits a smalldiurnal variation, and the selected ACE-FTS measurementsare at sunset, a day-night average of their profiles has beenused which was manually extrapolated to 54 km to obtain asmooth transition to zero, since the published profilesabruptly end at 50 km. The work of von Clarmann et al.[2006] indicates latitudinal variation in HOCl with the
D22312 NASSAR ET AL.: 2004 STRATOSPHERIC CHLORINE INVENTORY
6 of 13
D22312

8/2/2019 R. Nassar et al- A global inventory of stratospheric chlorine in 2004
http://slidepdf.com/reader/full/r-nassar-et-al-a-global-inventory-of-stratospheric-chlorine-in-2004 7/13
altitude of the maximum 2.2 ± 0.3 km lower for the 45° N – 45°S latitude zone than for the more poleward latitudes of 45° –90° in each hemisphere. This is a 2.2 km shift for achange in mean latitude from 22.5° to 67.5°, or 0.0488 km
per degree. To account for latitudinal variability in both the altitude and value of the maximum VMR,scale factors and shifts were applied to the mean (day-night) 30° N profile. The resulting HOCl profiles make a
maximum contribution to ClTOT of 0.192 ppbv (5.3%) at 35.5 km for the tropics, 0.167 ppbv (4.6%) at 36.5 km for midlatitudes, and 0.098 ppbv (2.6%) at 37.5 km for highlatitudes.
[25] Efforts to retrieve phosgene (COCl2) from ACE-FTS spectra have recently begun, but no ACE-FTSCOCl2 product was available at the time of this writing.I t i s v e r y d i f f i c u l t t o r e t r i e v e
because its spectral lines are buried in the stronger spectrum of CCl3F. COCl2 was not included in thechlorine budgets based on ATMOS [ Zander et al.,1992, 1996] or MkIV measurements [Sen et al., 1999];however, it has since been successfully retrieved fromMkIV balloon-borne infrared solar occultation spectra by
Toon et al. [2001]. A line of best fit was drawn throughthe MkIV points in the 6– 30 km range measured
between September 1992 and March 2000. The COCl2 profile based on these points was included directly(without scaling or shifting) in each of the five latitudezones since no clear latitudinal shift can be determinedfrom the data. Although some change to the shape of theCOCl2 profile would be expected due the decrease inCCl3F emission which has occurred since about 1994[WMO, 2003], this can be ignored since COCl2 makesonly a very minor contribution to total stratosphericchlorine (a maximum of $0.065 ppbv Cl at 20 km).
[26] The ClO dimer (ClOOCl) only occurs in significant quantities in the polar vortices, where it exists in equilibri-um with ClO. Although no known remote measurements of ClOOCl were found, Stimpfle et al. [2004] have made insitu measurements in the Arctic vortex from a NASA ER-2aircraft during the SOLVE/THESEO-2000 campaign. Morerecently, Von Hobe et al. [2005] made in situ aircraft measurements during the SOLVE II/VINTERSOL-EUPLEX and ENVISAT validation campaigns using theHALOX instrument. The measurements by Stimpfle et al.[2004] confirm the basic mechanism for loss and productionof ClOOCl (equations (5)– (7)) but indicate some uncer-tainty in the rate constants.
ClO þ ClO þ M ÀÀÀÀÀ!k prod
ClOOCl þ M ð5Þ
ClOOCl ÀÀÀÀÀ! j
ClO þ ClO ð6Þ
ClOOCl þ M ÀÀÀÀÀ!k loss
ClO þ ClO þ M ð7Þ
Using these reactions and solving the rate law, a relationshipfor the expected ClOOCl profile can be determined from the
profile of ClO and the appropriate values of the rateconstants for ClOOCl production (k prod), loss by thermal
decomposition (k loss) and loss by photolytic decomposition(j).
d ClOOCl½
dt ¼ k prod ClO½ 2
M½ À j ClOOCl½
À k loss M½ ClOOCl½ ¼ 0 ð8Þ
k prod ClO½ 2M½ ¼ j þ k loss M½
À ÁClOOCl½ ð9Þ
K eq¼ClOOCl½
ClO½ 2¼
k prod M½
j þ k loss M½ ð10Þ
Stimpfle et al. [2004] recommend combinations of theabove three rate constants that give results consistent withtheir observations. The value of the photolysis rate constant (j) used here, is the value determined by Stimpfle et al.[2004] based on cross sections determined by Burkholder et al. [1990] shown by Stimpfle et al. [2004] as a function of solar zenith angle (SZA). Since all ACE-FTS measurements
occur at a SZA of 90°, a value of j = 4.4 Â 10À4 sÀ1 at aSZA = 90° was used in this work. k loss is determined fromthe empirical equation k loss(T) = 9.81 Â 10À7 exp(À7980/T)moleculesÀ1 cm3 sÀ1 from Nickolaisen et al. [1994] andk prod(T) = 1.49 Â 10À32 (T/300)À4.50 moleculesÀ2 cm6 sÀ1
from Bloss et al. [2001]. (The uncertainties for both rateconstants have been ignored in this approximation of theClOOCl concentration.)
[27] Using the above rate constants, the ratio k prod[M]/(j +k loss[M]) was then calculated using ACE-FTS retrievedvalues of temperature and density for each high-latitude
profile. Since ACE-FTS individual ClO profiles tend to benoisy, the ratio of constants for each profile was applied tothe averaged ClO profile to calculate ClOOCl profiles.
From the individual ClOOCl profiles, an average profileis calculated over the altitude range of 12.5–26.5 km whereClO enhancement is observed at high latitudes in eachhemisphere.
5. Results
[28] Mean profiles for each latitude zone of all chlorinecontaining species in section 4 are available as auxiliarymaterial.1 The chlorine contribution based on species mea-sured by the ACE-FTS varies with altitude, although for thenorthern midlatitudes at 17.5 km where CCly dominates,87% of the chlorine comes from species measured by ACE.The percentage gradually decreases to 80% between 37.5
and 40.5 km, then gradually increases up to almost 98%above 54.5 km, where nearly all chlorine is contained inHCl. Figure 3 shows profiles of CCly, HCl, ClONO2, ClO,and a combined profile for the chlorine contribution fromHOCl, COCl2, COClF and ClOOCl, between 15 and 55 kmaltitude. It indicates that total chlorine is nearly constant throughout this altitude range. Zander et al. [1996] deter-mined mean ClTOT by averaging all points in the 16.4– 50.2 km altitude range which was intended to span the
1Auxiliary materials are available at ftp://ftp.agu.org/apend/jd/ 2006jd007073.
D22312 NASSAR ET AL.: 2004 STRATOSPHERIC CHLORINE INVENTORY
7 of 13
D22312

8/2/2019 R. Nassar et al- A global inventory of stratospheric chlorine in 2004
http://slidepdf.com/reader/full/r-nassar-et-al-a-global-inventory-of-stratospheric-chlorine-in-2004 8/13
stratosphere for the northern midlatitudes or subtropics in November. The positions of the tropopause and stratopauseexhibit large seasonal and latitudinal variations such that thelapse rate definition of the tropopause recommended by theWMO often places the tropopause as low as $6 – 8 k mduring winter near the poles. In this work, mean strato-spheric ClTOT for each latitude zone was based on points
between 17.5 km and 50.5 km altitude, which are close tothe positions of the local minima and maxima in meanACE-FTS temperature profiles. One can argue that thisaltitude range is too high and therefore not the best representation of the stratosphere for high latitudes, but it was chosen in part to avoid the large deviation fromlinearity seen in the ClTOT profile at southern high latitudes,which will be discussed later.
[29] Stratospheric ClTOT values for 2004 are shown inTable 3 and the mean ClTOT values are shown in Table 4.
The method of error determination used by Zander et al.[1996] based on the standard deviation of points over agiven altitude range was adopted here and should give areasonable estimate of the precision of mean ClTOT. Prop-agating the uncertainty on each species to obtain theuncertainty on total chlorine would largely overestimatethe overall uncertainty because the variability in any givenspecies is mostly a result of conversion to another species.Furthermore, it is difficult to make accurate estimates of theuncertainty for the modeled data. Perhaps the best simpleestimate of the absolute uncertainty on ClTOT can be made
based on the uncertainty of HCl at high altitudes, where it isthe dominant contributor to ClTOT. The retrieval of HClutilized spectroscopic parameters from the HITRAN 2004database [ Rothman et al., 2005]. The HCl line intensities inHITRAN that lie in the microwindows shown in Table 1,have uncertainties in the 1–2% range, which translates to a
Figure 3. Stratospheric chlorine inventory for 2004 for (a) northern midlatitudes (30° –60° N),(b) southern midlatitudes(30° –60°S),(c) northern high latitudes (60° –82° N), (d) tropics (30°S–30° N), and(e) southern high latitudes (60° –82°S). Each plot shows the VMR profiles for HCl (solid squares),ClO (solid triangles), ClONO2 (circles), the combined chlorine contribution from CCly (open triangles),the combined chlorine contribution from ‘‘other species’’ composed of HOCl, COClF, COCl2, andClOOCl (open squares), and ClTOT (thick line). Error bars indicating the 1s precision are included on thetotal chlorine profiles for the 17.5–50.5 km range.
D22312 NASSAR ET AL.: 2004 STRATOSPHERIC CHLORINE INVENTORY
8 of 13
D22312

8/2/2019 R. Nassar et al- A global inventory of stratospheric chlorine in 2004
http://slidepdf.com/reader/full/r-nassar-et-al-a-global-inventory-of-stratospheric-chlorine-in-2004 9/13
maximum of 0.08 ppbv. The uncertainty contribution to theVMR of HCl from the retrieval of pressure and temperatureis also estimated to be about 2% or about 0.08 ppbv. Anadditional source of uncertainty for the HCl retrieval comesfrom the precision of the fit, which reaches a maximum at high altitudes, although this random error is reduced byaveraging multiple profiles. The 1s error contribution fromthe precision of the fit for the southern midlatitude mean
profile, which had the highest number of profiles used todetermine its mean, is only 0.003 ppbv at 18 km, andincreases to 0.04 ppbv (or 1.1%) at 50 km, while for thenorthern high-latitude mean profile, which used the fewest
profiles, the precision is 0.06 ppbv (or 1.7%) at 50 km.
Combining these three sources of error gives an accuracy of 0.12–0.13 ppbv for HCl at 50 km, which includes both asystematic and random component. This value can be usedto estimate the accuracy of the ClTOT values. Since HClcomprises 93% of ClTOT at 50 km (at midlatitudes), scalingthe error would give an accuracy of 0.13–0.14 ppbv for ClTOT, which is equivalent to less than 4% of mean Cl TOT.This uncertainty is smaller than the estimated precision fromrandom variability in the HCl mean values at 50 km, but slightly greater than the variability of 0.09 ppbv in themidlatitude ClTOT profile over the 17.5– 50.5 km range.Although the variability in the ClTOT profiles in some other
latitude zones was larger than at midlatitudes, the accuracyshould be comparable.
[30] In the lower to middle stratosphere, where HCl onlycomprises approximately half of ClTOT, an alternative meth-od of estimating the uncertainty on ClTOT can be carried out using ClONO2 in addition to HCl. At 27.5 km, ClONO2
peaks at northern midlatidudes with a value of about 1.0 ppbv. The contribution to the uncertainty on ClONO2
from the absorption cross sections in the microwindows usedin the retrieval (Table 1) is about 5% or 0.05 ppbv, the
pressure and temperature contribution is 2% or 0.02 ppbv andthe contribution due to the precision of the fit at this altitude is0.005 ppbv. These sources give a combined uncertainty of 0.054 ppbv. Using the same approach, HCl has a value of about 2.0 ppbv and a very similar uncertainty of 0.057 ppbvat this altitude. Combining the uncertainties from HCl andClONO2 gives 0.08 ppbv at an altitude where these speciescontribute approximately 80% of the chlorine in ClTOT, thusscaling the uncertainty would give a value of 0.10 ppbv for ClTOT. The lower-middle stratosphere uncertainty estimateis about 30–40% lower than the uncertainty estimate for 50 km, which is qualitatively consistent with the fact that
the signal-to-noise ratio is better in the lower-middle strato-sphere than above, but the larger estimate can be applied tothe entire altitude range to provide a more conservativeuncertainty estimate.
[31] If the points in the 17.5– 50.5 km altitude range arefit to a straight line, in all cases, they yield a slight positiveslope in ppbv/km. These slopes and the associated 1s
precision on each slope, as a result of the fit, are alsoshown in Table 4 and discussed in the next section. Noestimate of the absolute accuracy on the slopes has beenmade.
6. Discussion
[32] A principal improvement of the present chlorineinventory with respect to most earlier studies is that theACE-FTS measures a large number of species relative toother satellite instruments but also provides better globalcoverage than aircraft, balloon or ground-based measure-ments. The altitude coverage and vertical resolution of theACE-FTS measurements are also better than those of ground-based measurements; however, the small number of measurements per day is a significant disadvantage of solar occultation relative to other observation techniques.ACE is often lacking measurements in a particular latitudezone for periods of one month or more. In this work,roughly 50% of measurements were also neglected in order to avoid averaging over diurnal variability. The seasonal
Table 3. ClTOT as a Function of Altitude From 17.5 to 50.5 km in
Five Latitude Zones for the Period of February 2004 to January
2005 Inclusive
Altitude,km
Total Chlorine, ppbv
60° –82° N 30° –60° N 30°S–30° N 30° –60°S 60° –82°S
17.5 3.64 3.56 3.49 3.50 3.3318.5 3.53 3.51 3.41 3.50 3.3419.5 3.53 3.50 3.49 3.53 3.4620.5 3.65 3.58 3.47 3.57 3.4421.5 3.69 3.57 3.53 3.60 3.5122.5 3.71 3.64 3.55 3.64 3.6523.5 3.69 3.63 3.64 3.65 3.6324.5 3.64 3.61 3.58 3.67 3.7025.5 3.60 3.57 3.57 3.64 3.6926.5 3.63 3.60 3.64 3.65 3.7127.5 3.68 3.64 3.69 3.65 3.7128.5 3.72 3.67 3.67 3.66 3.6929.5 3.72 3.68 3.63 3.66 3.6730.5 3.73 3.67 3.58 3.64 3.6531.5 3.74 3.64 3.56 3.62 3.6432.5 3.76 3.63 3.53 3.59 3.6533.5 3.75 3.60 3.52 3.56 3.6534.5 3.74 3.59 3.54 3.56 3.6535.5 3.69 3.58 3.53 3.57 3.6836.5 3.64 3.55 3.51 3.56 3.7037.5 3.63 3.56 3.53 3.59 3.7438.5 3.68 3.61 3.57 3.64 3.7839.5 3.71 3.65 3.60 3.67 3.8040.5 3.73 3.69 3.65 3.69 3.8241.5 3.77 3.72 3.68 3.72 3.8442.5 3.81 3.71 3.72 3.74 3.8543.5 3.84 3.71 3.72 3.75 3.8744.5 3.86 3.72 3.72 3.77 3.8945.5 3.87 3.75 3.72 3.78 3.9046.5 3.90 3.76 3.75 3.78 3.9047.5 3.94 3.77 3.78 3.77 3.8948.5 3.97 3.80 3.82 3.77 3.8949.5 3.97 3.83 3.82 3.78 3.9050.5 3.98 3.84 3.81 3.79 3.89
Table 4. Mean Total Chlorine With 1s Precision and the Slope
With 1s Standard Precision for the Points From 17.5 to 50.5 km
Altitude in Five Latitude Zones
Mean ClTOT, pp bv Slop e, p pb v/km
Northern high latitudes 3.74 ± 0.12 0.010 ± 0.001 Northern midlatitudes 3.65 ± 0.09 0.007 ± 0.001Tropics 3.62 ± 0.11 0.009 ± 0.001Southern midlatitudes 3.65 ± 0.09 0.007 ± 0.001Southern high latitudes 3.71 ± 0.16 0.014 ± 0.001
D22312 NASSAR ET AL.: 2004 STRATOSPHERIC CHLORINE INVENTORY
9 of 13
D22312

8/2/2019 R. Nassar et al- A global inventory of stratospheric chlorine in 2004
http://slidepdf.com/reader/full/r-nassar-et-al-a-global-inventory-of-stratospheric-chlorine-in-2004 10/13

8/2/2019 R. Nassar et al- A global inventory of stratospheric chlorine in 2004
http://slidepdf.com/reader/full/r-nassar-et-al-a-global-inventory-of-stratospheric-chlorine-in-2004 11/13
high, but it is unlikely that they are the sole cause of thelarge difference with respect to HALOE.
[37] The most important implication of a difference inupper stratospheric HCl values obtained by the variousinstruments is the effect that it will have on ClTOT.
Froidevaux et al. [2006b] have derived a value of 3.65 ppbv for near global (82°S–82° N) ClTOT for August 2004 based on MLS measurements of HCl from 0.7 to 0.1
hPa. Their value compares extremely well with both ACE-FTS midlatitude values of 3.65 ppbv in 2004, further rein-forcing the good agreement between these two instruments.Since the discrepancy between MLS and ACE appearslimited to altitudes above 1 hPa or approximately 45 km at midlatitudes ($48 km in the tropics or $42 km for the polar winter), high biased ACE-FTS values of HCl would cause asmall error in the determination of tropical mean ClTOT, but a more significant error at higher latitudes, all of which are
based on the 17.5–50.5 km range. By determining meanClTOT using a reduced altitude range of 20.5– 39.5 km,values of 3.69 ± 0.05, 3.61 ± 0.04, 3.57 ± 0.06, 3.62 ± 0.04,and 3.67 ± 0.08 ppbv are obtained for northern highlatitudes, northern midlatitudes, tropics, southern midlati-
tudes, and southern high latitudes, respectively (where theuncertainty is the 1s precision from 20.5 to 39.5 kmaltitude). These values are all slightly lower than thosedetermined using the wider altitude range.
[38] Previous chlorine inventories often neglected CCly inthe upper stratosphere [ Zander et al., 1992, 1996; Sen et al.,1999], thus assuming ClTOT was equal to Cly at highaltitudes. Dividing the HALOE 2004 globally averagedHCl value of 3.13 ppbv at 55 km (J. Anderson, privatecommunication, 2006) by the HCl/Cly ratios (0.93– 0.95)results in Cly estimates of 3.29–3.37 ppbv. The difference
between ACE-FTS mean ClTOT values and HALOE Clyvalues is larger than the contribution from CCly at 55 km,which is expected to be less than 0.06 ppbv. From this work,on the basis of the work by Weisenstein et al. [1992] andCoheur et al. [2003] and additional knowledge of sourcegas trends and lifetimes [WMO, 2003], one can estimate avalue of HCl/ClTOT near 55 km altitude, since HCFC-22accounts for about 1% (0.027–0.040 ppbv) of ClTOT and acontribution of only about 0.5% (0.019–0.023 ppbv) is dueto other organic chlorine gases mainly CFC-114, CFC-115,HCFC-142b. Inorganic chlorine species that may contributeto ClTOT at this altitude include ClO, HOCl and Cl. It isdifficult to determine accurate values of the contributionsfrom these species, although a reasonable estimate wouldattribute the largest contribution ($0.07 pbbv at highlatitudes) to ClO. Unfortunately, the version of SMR ClOmeasurements used here, did not appear reliable at thisaltitude. These estimates imply that HCl may comprise asmuch as $98–99% of Cly or $96–98% of ClTOT at 55 km,in contrast to the above values used by others.
[39] When using HCl at 55 km to determine stratosphericCly, it is rarely emphasized that 55 km is typically in thelower mesosphere, not the stratosphere. Thus relating theCly value at 55 km to ClTOT in the stratosphere is compli-cated both by assumptions about the value of CCly at that altitude and by the presence of slightly sloped stratosphericClTOT profiles as determined in this work. Small changes inClTOT associated with the slope, coupled with differencesattributable to CCly, should all be considered in very
accurate comparisons of HALOE Cly values with ATMOS,MkIV, SOLVE and ACE-FTS ClTOT values. While there is agood theoretical foundation for slightly sloped stratosphericClTOT profiles, the present uncertainty in many parameters
prevents a quantitative treatment of the slope or its use in ameaningful quantitative comparison such as the one men-tioned above. However, it does imply that prior to the peak in upper stratospheric chlorine, ClTOT at 55 km should be
slightly less than a true stratospheric value (below $50 km),and after the peak it should be slightly more, which adds tothe discrepancy between ACE-FTS and HALOE values.
[40] Ideally, a technique or combination of techniquesthat could accurately measure all relevant chlorine speciesover a large altitude range, would provide the most reliableapproach to determining stratospheric ClTOT or Cly. Whileeleven important chlorine species have been retrieved fromACE-FTS measurements in this work, some key species arestill missing, thus ACE-FTS data can only provide a partialsolution at the current time, but the results obtained here aresignificant since they indicate that stratospheric ClTOT in2004 may have been higher than expected from estimatesderived using other techniques.
7. Summary and Conclusions
[41] A global inventory of stratospheric chlorine has beencreated which includes all significant inorganic and organicchlorine species in five latitude zones during the period of February 2004 to January 2005 inclusive, based on measure-ments by the ACE-FTS supplemented by measurements byother instruments and model results. The sum of allsignificant chlorine species at each altitude nearly makesa straight line, with a slight positive slope (ppbv/km). Theaverage of these points in the 17.5–50.5 km altitude rangeis used to determine mean stratospheric ClTOT for eachlatitude zone yielding values of 3.62 ± 0.11 ppbv for the
tropics, 3.65 ± 0.09 ppbv for both the northern and southernmidlatitudes, 3.74 ± 0.12 ppbv for the northern highlatitudes, and 3.71 ± 0.16 ppbv for the southern highlatitudes (where the uncertainty given is the 1s precisionfor points between 17.5 and 50.5 km and the estimatedaccuracy is 0.13–0.14 ppbv). Both the latitudinal variationand the slopes can be interpreted as evidence that strato-spheric ClTOT is now declining, but the accuracy of theslopes does not permit quantitative conclusions.
[42] HCl is the principal component of high altitudeClTOT, and ACE-FTS and MLS HCl measurements agreevery well up to 1 hPa (or $45 km altitude). Because of the
possibility that ACE-FTS HCl values above this range are biased high, an alternate set of mean ClTOT values based
only on the 20.5–39.5 km altitude range were determinedfor the five latitude zones. These values are 0.03 – 0.06 ppbvlower than those based on the wider altitude range. ACE-FTS or MLS measurements and historical ATMOS or MkIVmeasurements, all yield higher HCl values than HALOE,which translate to larger inferred stratospheric ClTOT (or Cly) than obtained using HALOE data. The cause of thisdiscrepancy cannot be determined at present. In spite of thehigher stratospheric chlorine values determined in thiswork, the latitudinal variation in mean ClTOT and the ClTOT
slopes obtained here, as well as a comparison of meanClTOT values to past ATMOS and MkIV measurements, all
D22312 NASSAR ET AL.: 2004 STRATOSPHERIC CHLORINE INVENTORY
11 of 13
D22312
8/2/2019 R. Nassar et al- A global inventory of stratospheric chlorine in 2004
http://slidepdf.com/reader/full/r-nassar-et-al-a-global-inventory-of-stratospheric-chlorine-in-2004 12/13
indicate that stratospheric ClTOT is now decreasing, whichreinforces previous work that has shown the success of theMontreal Protocol and its amendments at controlling andreducing chlorine levels.
[43] Acknowledgments. We would like to thank the Canadian SpaceAgency (CSA) for providing the primary funding for the SCISAT-1/ACEmission and the Natural Sciences and Engineering Research Council of Canada (NSERC) for their funding contribution. Support at Waterloo wasalso provided by the NSERC-Bomem-CSA-MSC Research Chair in Fourier Transform Spectroscopy. R. Nassar would like to acknowledge direct funding from NSERC and the CSA. Work at the Jet Propulsion Laboratory,California Institute of Technology, was done under contract to NASA.Contributions from the University of Liege were supported by the BelgianFederal Science Policy Office, Brussels. P.F. Coheur was funded by theFonds National de la Recherche Scientifique (FNRS, Belgium), the BelgianScience Policy, and the European Space Agency (ESA-Prodex arrangement C90-219). Financial support by the ‘‘Actions de Recherche Concertees’’(Communaute Francaise de Belgique) is also acknowledged. Furthermore,we thank the numerous other organizations which we have not explicitlymentioned that also contributed funding to the ACE mission. We wouldalso like to thank Jianjun Jin and Andreas Jonsson for their assistance withthe Odin SMR data and John Anderson for providing HALOE HCl values.Finally, we thank the anonymous reviewers for their helpful comments andsuggestions.
ReferencesAellig, C. P., et al. (1996), Latitudinal distribution of upper stratosphericClO as derived from space-borne microwave spectroscopy, Geophys. Res.
Lett., 23(17), 2321– 2324.Anderson, J., J. M. Russell III, S. Solomon, and L. E. Deaver (2000),
Halogen Occultation Experiment confirmation of stratospheric chlorinedecreases in accordance with the Montreal Protocol, J. Geophys. Res.,105(D4), 4483– 4490.
Austin, J., N. Butchart, and K. Shine (1992), Possibility of an Arctic ozonehole in a doubled-CO2 climate, Nature, 360, 221– 225.
Austin, J., et al. (2002), Uncertainties and assessments of chemistry-climatemodels of the stratosphere, Atmos. Chem. Phys. Disc., 2, 1035–1096.
Barret, B., D. Hurtmans, M. Carleer, M. De Maziere, E. Mahieu, and P.-F.Coheur (2005), Line narrowing effect on the retrieval of HF and HClvertical profiles from ground-based FTIR measurements, J. Quant. Spec-trosc. Radiat. Transfer , 95(4), 499–519.
Bernath, P. F., et al. (2005), Atmospheric Chemistry Experiment (ACE):Mission overview, Geophys. Res. Lett., 32, L15S01, doi:10.1029/
2005GL022386.Berthet, G., P. Ricaud, F. Lefevre, E. Le Flochmoen, J. Urban, B. Barret,
N. Lautie, E. Dupuy, J. De La Noe, and D. Murtagh (2005 ), Nighttimechlorine monoxide observations by the Odin satellite and implicationsfor the ClO/Cl2O2 equilibrium, Geophys. Res. Lett., 32, L11812,doi:10.1029/2005GL022649.
Bloss, W. J., S. L. Nickolaisen, R. J. Salawitch, R. R. Friedl, and S. P.Sander (2001), Kinetics of the ClO self-reaction and 210 nm absorptioncross section of the ClO dimer, J. Phys. Chem., 105, 11,226–11,239.
Boakes, G., W. H. H. Mok, and D. M. Rowley (2005), Kinetic studies of theClO + ClO association reaction as a function of temperature and pressure,
Phys. Chem. Chem. Phys., 7 , 4102–4113.Boone, C. D., R. Nassar, K. A. Walker, Y. Rochon, S. D. McLeod, C. P.
Rinsland, and P. F. Bernath (2005), Retrievals for the Atmospheric Chem-istry Experiment Fourier Transform Spectrometer, Appl. Opt., 44(33),7218–7231.
Burkholder, J. B., J. J. Orlando, and C. J. Howard (1990), Ultraviolet absorption cross sections of the Cl2O2 between 210 and 410 nm, J. Phys.
Chem., 94, 687– 695.Canty, T., et al. (2005), Nighttime OClO in the winter Arctic vortex,
J. Geophys. Res., 110, D01301, doi:10.1029/2004JD005035.Coheur, P. F., C. Clerbaux, and R. Colin (2003), Spectroscopic measure-
ments of halocarbons and hydrohalocarbons by satellite-borne remotesensors, J. Geophys. Res., 108(D4), 4130, doi:10.1029/2002JD002649.
Dufour, G., C. D. Boone, and P. F. Bernath (2005), First measurements of CFC-113 and HCFC-142b from space using ACE-FTS infrared spectra,Geophys. Res. Lett., 32, L15S09, doi:10.1029/2005GL022422.
Engel, A., M. Strunk, M. Muller, H.-P. Haase, C. Poss, and I. Levin (2002),Temporal development of total chlorine in the high-latitude stratosphere
based on reference distributions of mean age derived from CO2 and SF6, J. Geophys. Res., 107 (D12), 4136, doi:10.1029/2001JD000584.
Farman, J. C., B. G. Gardiner, and J. D. Shanklin (1985), Large losses of total ozone in Antarctica reveal seasonal ClOx/NOx interaction, Nature,315, 207– 210.
Froidevaux, L., et al. (2006a), Early validation analyses of atmospheric profiles from EOS MLS on the Aura satellite, IEEE Trans. Geosci. Re-mote Sens., 44(5), 1106–1121.
Froidevaux, L., et al. (2006b), Temporal decrease in upper atmosphericchlorine, Geophys. Res. Lett., doi:10.1029/2006GL027600, in press.
Hartmann, G. K., et al. (1996), Measurements of O3, H2O and ClO in themiddle atmosphere using the millimeter-wave atmospheric sounder (MAS), Geophys. Res. Lett., 23, 2313–2316.
Kaye, J. A., A. R. Douglass, C. H. Jackman, and R. S. Stolarski (1991),Two-dimensional model calculation of fluorine-containing reservoir spe-
cies in the stratosphere, J. Geophys. Res., 96 , 12,865– 12,881.Mahieu, E., P. Duchatelet, R. Zander, P. Demoulin, C. Servais, C. P.Rinsland, M. P. Chipperfield, and M. De Maziere (2004), The evolutionof inorganic chlorine above the Jungfraujoch station: An update, inOzone, vol. II, Proceedings of the XX Quadrennial Ozone Symposium,
Kos, Greece, 1–8 June 2004, edited by C. S. Zerefos, pp. 997–998,Univ. of Athens, Athens.
McHugh, M., B. Magill, K. A. Walker, C. D. Boone, P. F. Bernath, andJ. M. Russell III (2005), Comparison of atmospheric retrievals fromACE and HALOE, Geophys. Res. Lett., 32, L15S10, doi:10.1029/ 2005GL022403.
Molina, L. T., and M. J. Molina (1987), Production of Cl 2O2 from the self-reaction of the ClO radical, J. Phys. Chem., 91, 433– 436.
Molina, M. J., and F. S. Rowland (1974), Stratospheric sink for chloro-fluoromethanes: Chlorine atom-catalysed destruction of ozone, Nature,249, 810– 812.
Montzka, S. A., J. H. Butler, R. C. Myers, T. M. Thompson, T. H. Swanson,A. D. Clarke, L. T. Lock, and J. W. Elkins (1996), Decline in tropospheric
abundance of halogen from halocarbons: Implications for stratosphericozone depletion, Science, 272, 1318–1322.Montzka, S. A., J. H. Butler, J. W. Elkins, T. M. Thompson, A. D. Clarke,
and L. T. Lock (1999), Present and future trends in the atmospheric burden of ozone-depleting halogens, Nature, 398, 690– 694.
Murtagh, D., et al. (2002), An overview of the Odin atmospheric mission,Can. J. Phys., 80, 309–319, doi:10.1139/P01-157.
Nassar, R., P. F. Bernath, C. D. Boone, G. L. Manney, S. D. McLeod, C. P.Rinsland, R. Skelton, and K. A. Walker (2005), ACE-FTS measurementsacross the edge of the winter 2004 Arctic vortex, Geophys. Res. Lett., 32,L15S05, doi:10.1029/2005GL022671.
Nickolaisen, S. L., R. R. Friedl, and S. P. Sander (1994), Kinetics of theClO + ClO reaction: Pressure and temperature dependences of the bimo-lecular and thermolecular channels and thermal decomposition of chlor-ine peroxide, J. Phys. Chem., 98, 155– 169.
Prather, M. J., and R. T. Watson (1990), Stratospheric ozone depletion andfuture levels of atmospheric chlorine and bromine, Nature, 344, 729–734.
Prather, M., P. Midgely, F. S. Rowland, and R. Stolarski (1996), The ozone
layer: The road not taken, Nature, 381, 551– 554.Prinn, R. G., et al. (2000), A history of chemically and radiatively important gases in air deduced from ALE/GAGE/AGAGE, J. Geophys. Res., 105,17,751–17,792.
Rinsland, C. P., et al. (2003), Long-term trends of inorganic chlorine fromground-based infrared solar spectra: Past increases and evidence for sta-
bilization, J. Geophys. Res., 108(D8), 4252, doi:10.1029/2002JD003001.Rinsland, C. P., et al. (2006), Spectroscopic detection of COCIF in the
tropical and mid-latitude lower stratosphere, J. Quant. Spectrosc. Radiat.Transfer , in press.
Rothman, L. S., et al. (2005), The HITRAN 2004 molecular spectroscopicdatabase, J. Quant. Spectrosc. Radiat. Transfer , 96 , 139– 204.
Rummukainen, M. (1996), Modeling stratospheric chemistry in a globalthree-dimensional chemical transport model, SCTM-1: Model develop-ment, Finn. Meteorol. Inst. Contrib., 19, 206 pp.
Russell, J. M., III, et al. (1996a), Validation of hydrogen chloride measure-ments made by the Halogen Occultation Experiment from the UARS
platform, J. Geophys. Res., 101, 10,151– 10,162.
Russell, J. M., III, M. Luo, R. J. Cicerone, and L. E. Deaver (1996b),Satellite confirmation of the dominance of chlorofluorocarbons in theglobal stratospheric chlorine budget, Nature, 379, 526– 529.
Schauffler, S. M., E. L. Atlas, S. G. Donnelly, A. Andrews, S. A. Montzka,J. W. Elkins, D. F. Hurst, P. A. Romashkin, G. S. Dutton, and V. Stroud(2003), Chlorine budget and partitioning during the Stratospheric Aerosoland Gas Experiment (SAGE) III Ozone Loss and Validation Experiment (SOLVE), J. Geophys. Res., 108(D5), 4173, doi:10.1029/2001JD002040.
Sen, B., et al. (1999), The budget and partitioning of stratospheric chlorineduring the 1997 Arctic summer, J. Geophys. Res., 104, 26,653– 26,665.
Shindell, D. T., and V. Grewe (2002), Separating the influence of halogenand climate changes on ozone recovery in the upper stratosphere,
J. Geophys. Res., 107 (D12), 4144, doi:10.1029/2001JD000420.Shindell, D. T., D. Rind, and P. Lonergan (1998), Increased polar strato-
spheric ozone losses and delayed eventual recovery due to increasinggreenhouse gas concentrations, Nature, 392, 589– 592.
D22312 NASSAR ET AL.: 2004 STRATOSPHERIC CHLORINE INVENTORY
12 of 13
D22312

8/2/2019 R. Nassar et al- A global inventory of stratospheric chlorine in 2004
http://slidepdf.com/reader/full/r-nassar-et-al-a-global-inventory-of-stratospheric-chlorine-in-2004 13/13