r a p characterisation of a czt detector for dosimetry of
TRANSCRIPT

proofs JINST_025P_1216
P�������� �� IOP P��������� ��� S���� M�������R�������: December 9, 2016
R������: January 23, 2017A�������: February 16, 2017
P��������: ???, 2017
Characterisation of a CZT detector for dosimetry ofmolecular radiotherapy
L.H. McAreavey,a,1 L.J. Harkness-Brennan,a S.J. Colosimo,a D.S. Judson,a A.J. Boston,a
H.C. Boston,a P.J. Nolan,a G.D. Flux,b A.M. Denis-Bacelar,c B. Harris,d I. Radley,e
and M. Carroll faThe Oliver Lodge Laboratory, University of Liverpool, Liverpool, L69 7ZE, U.K.bThe Royal Marsden Hospital, Sutton, SM2 5PT, U.K.cThe Institute of Cancer Research, Sutton, SM2 5NG, U.K.deV Products Inc. (Kromek U.S.A.), Saxonburg, PA 16056, U.S.A.eKromek Group plc, Sedgefield, TS21 3FD, U.K.f The Royal Liverpool and Broadgreen University Hospital, Liverpool, L7 8XP, U.K.
E-mail: [email protected]
A�������: A pixelated cadmium zinc telluride (CZT) detector has been characterised for thepurpose of developing a quantitative single photon emission computed tomography (SPECT) systemfor dosimetry of molecular radiotherapy (MRT). This is the aim of the Dosimetric Imaging withCZT (DEPICT) project, which is a collaboration between the University of Liverpool, The RoyalMarsden Hospital, The Royal Liverpool and Broadgreen University Hospital, and the commercialpartner Kromek. CZT is a direct band gap semiconductor with superior energy resolution andstopping power compared to scintillator detectors in current SPECT systems. The inherent detectorproperties have been investigated and operational parameters such as bias voltage and peaking timehave been selected to optimise the performance of the system. Good energy resolution is requiredto discriminate �-rays that are scattered as they are emitted from the body and within the collimator,and high photon throughput is essential due to the high activities of isotopes administered in MRT.The system has an average measured electronic noise of 3.31 keV full width at half maximum(FWHM), determined through the use of an internal pulser. The energy response of the systemwas measured across the energy region of interest 59.5 keV to 364.5 keV and found to be linear.The reverse bias voltage and peaking time producing the optimum FWHM and maximum photonthroughput were 600 V and 0.5 µs respectively. The average dead time of the system was measuredas 4.84 µs and charge sharing was quantified to be 0.71 % at 59.5 keV. A pixel sensitivity calibrationmap was created and planar images of the medical imaging isotopes 99mTc and 123I were acquired bycoupling the device to a prototype collimator, thereby demonstrating the suitability of the detectorfor the DEPICT project.
K�������: Gamma camera, SPECT, PET PET/CT, coronary CT angiography (CTA); Gammadetectors (scintillators, CZT, HPG, HgI etc); Radiotherapy concepts; Solid state detectors
1Corresponding author.
c� 2017 IOP Publishing Ltd and Sissa Medialab srl doi:xxxxxxx

proofs JINST_025P_1216
Contents
1 Introduction 1
2 Detector system 2
3 Optimising CZT detector performance 33.1 Electronic noise 33.2 Operating voltage 43.3 Detector linearity 43.4 Peaking time 5
4 Dead time 7
5 Pixel sensitivity calibration 8
6 Charge sharing 10
7 Planar images 12
8 Conclusions 15
1 Introduction
Molecular radiotherapy (MRT) involves the internal administration of radiopharmaceuticals todeliver high absorbed doses to targeted tumour tissue whilst minimising the dose to surroundinghealthy tissue. Although MRT has been used clinically for around 75 years [1], there are nostandardised dosimetry practices to calculate the absorbed dose delivered to tumour targets ororgans at risk from the administered activity. Current MRT treatment plans are undesirably genericas the administered activity is often fixed for a given procedure or scaled according to the weightor body surface area of the patient [2]. However, the uptake and retention of the MRT therapeuticagents and hence the absorbed dose can vary by up to two orders of magnitude between patients [3, 4]due to the wide range of biokinetics and disease status. The outcome of the treatment is thereforesomewhat uncertain and can lead to unnecessary expense.
MRT utilises a radionuclide that emits charged particles, as their high linear energy transfercauses damage to local cells. For dosimetry purposes, �-rays are also emitted that can be detectedto track the biodistribution of activity. This is currently achieved with scintillation imaging such assingle photon emission computed tomography (SPECT) [5]. However, quantitative information issometimes lost in current diagnostic SPECT systems due to dead time as they are not optimised forthe levels of activity administered in MRT, which can typically range from 3.7–10 GBq [6]. Thehigh activities cause large count losses, which entail an underestimation of the doses received by
– 1 –
proofs JINST_025P_1216
organs, and therefore it is essential to correct for this e�ect in dosimetric studies [7]. The challengewith image quantification is exacerbated by the fact that current gamma cameras are optimisedfor use with low energy diagnostic imaging isotopes, mainly 99mTc (140.5 keV �-ray), rather thanhigher energy therapeutic isotopes, such as 131I (364.5 keV �-ray). Therefore, a custom-designedcompact SPECT system is being developed to facilitate quantitative imaging for MRT based on acollimated, pixelated, cadmium zinc telluride (CZT) detector. This is the aim of the DosimetricImaging with CZT (DEPICT) project, which is a collaboration between the University of Liverpool,The Royal Marsden Hospital, The Royal Liverpool and Broadgreen University Hospital and thecommercial partner Kromek. The system will facilitate real-time assessment of the absorbed dosedelivered to the patient, which may then be tailored specifically for MRT of the thyroid using an 131Itracer. CZT is a room temperature, direct band gap semiconductor with superior energy resolution,spatial resolution and stopping power compared to conventional scintillator based SPECT detectorsystems [8]. These favourable physical characteristics have led to considerable research on the useof CZT detectors in nuclear medicine [9].
There are three interlinking work packages in the DEPICT project: optimisation of the detector,and the development of a custom-designed high-energy collimator suitable for use with 131I andappropriate SPECT reconstruction algorithms, to visualise the 3-dimensional distribution of theradiopharmaceutical in the body to obtain quantitative activity information. The aims of thedetector optimisation work package are to:
• Optimise and evaluate detector performance
• Quantify dead time, to input to collimator design criteria
• Provide a pixel sensitivity calibration map, as input for the reconstruction algorithm
• Produce planar images for preliminary performance evaluation
This paper outlines the experimental methods used to achieve these aims and evaluatesthe results.
2 Detector system
The DMatrix Nuclear Imager manufactured by Kromek, shown in figure 1, is a fully integrated,photon counting, pixelated, 12-bit energy discriminating CZT detector with modular design thatenables large field of view scaling [10]. Its end-user applications include gamma spectroscopy fornuclear security and as a SPECT demonstrator in the medical industry. It consists of four CZTdetector modules, each coupled to an application specific integrated circuit (ASIC) to process andread out the signals, ADC converters, and an aggregator field programmable gate array (FPGA).Each detector module is 22 ⇥ 22 ⇥ 5 mm with 11 ⇥ 11 pixels at 2 mm pitch. Each ASIC has 128anode channels (121 used) for anode pixels and 2 cathode channels (1 used) performing chargeamplification and shaping, and providing both energy and timing information. Both the anode andcathode channels utilise a charge sensitive preamplifier with adaptive reset, a 5th order unipolarshaping amplifier, baseline stabiliser and discriminator with trimming. After shaping, the analogoutputs of the ASIC are digitized. The aggregated 2 ⇥ 2 units communicate with a master FPGA
– 2 –

proofs JINST_025P_1216
over a low-voltage di�erential signaling (LVDS) tether, where the data is formed into packets. Thepackets are received by a PC where the DMatrix API decodes them, and presents the end userwith list-mode data. Suitable software is then used to view this list-mode data as a �-ray energyspectrum. For the 2 ⇥ 2 configuration, Gigabit Ethernet is su�cient for communication with a PC.A carbon fiber window covers the active area of the detector at a height of 1.36 cm from the closestface of the detector, and this can be removed to allow a mechanical collimator to be mounted. TheCZT detectors and associated electronics are encased in aluminium to allow shielding from visiblelight, which would otherwise induce noise.
Figure 1. DMatrix external housing, 4 CZT detector modules and simplified block diagram [10].
3 Optimising CZT detector performance
Measurements were taken to optimise and evaluate the performance of the CZT detector for MRT todetermine settings that facilitate both good energy resolution and high photon throughput. Unlessotherwise stated, throughout the investigation the reverse bias voltage was set at the recommendedoperating voltage of 600 V and internal cooling fans were switched on to stabilise the temperatureof the electronics, which has been shown to prevent photopeak drift. The basic sparsified photoncollection mode was used, which entails only collecting data from the anode channels that exceed auser-defined threshold. For a pixel to trigger the data read out, its voltage pulse height must be greaterthan the threshold set in mV for that pixel, which is adjustable by a 10-bit DAC. A global thresholdsets the same value for all pixels, and a threshold of 380 mV was applied, calculated to be equivalentto ⇠15 keV. The threshold was used to remove electronic noise contributions at low energy.
3.1 Electronic noise
An internal digital test pulser was used to estimate the electronic noise contribution to the total energyresolution, allowing noise contributions from charge production and collection to be excluded.Pulser circuitry is internal to the ASIC and charge is injected to the front of the preamplifier. Thepulser amplitude is controlled by a 10-bit DAC in the ASIC. A test pulse of amplitude 52.86 mV wasinduced for 60 seconds, allowing a peak in each pixel to be produced with approximately 45,000gross counts. Overall, the system had an average measured electronic noise of 3.31 ± 0.24 keVFWHM. Electronic noise of around 3 keV in pixelated CZT detectors have been reported in [11, 12].
– 3 –

proofs JINST_025P_1216
3.2 Operating voltage
Measurements were made at reverse bias voltages between 300 V to 1000 V, in steps of 100 V, todetermine the voltage that produced the best energy resolution of an 131I 364.5 keV photopeak. Thepeak fitting programme GF3 [13] was utilised to apply a skewed Gaussian fit to the photopeak, ofwhich an example is shown in figure 2a. The two smooth lines show the total fit to a 364.5 keVphotopeak and the background fit. The residual plot indicating the di�erence between the data andthe fit is also illustrated by the irregular line across the x-axis. A skewed Gaussian fit is required dueto low energy tailing, which is characteristic of incomplete charge collection in the CZT detectordue to hole trapping [14, 15]. The data plotted in figure 2b shows an average energy resolution(FWHM %) of the 364.5 keV photopeak calculated by noting the FWHM and photopeak centroidposition from a typical pixel from each detector module and calculating the average FWHM (%)value, at each bias voltage. The experimental data has a fit of the form:
f (x) = 281.8· e(�0.01x) + 1.9· e(0.0006x) (3.1)
The results presented in figure 2b demonstrate that as the voltage is increased from 300V to600V, the FWHM (%) decreases from 7.8 % to 2.9 %, due to improved charge collection. However,as the bias voltage is increased above 600 V, the FWHM (%) degrades due to increasing leakagecurrent. Therefore 600 V was selected as the optimum reverse bias voltage for operation.
(a) (b)
Figure 2. (a) 364.5 keV 131I photopeak illustrating appropriate skewed Gaussian fit. (b) Detector averageFWHM (%) values calculated for the 131I 364.5 keV photopeak as a function of bias voltage.
3.3 Detector linearity
Data were acquired with 241Am (59.5 keV �-ray, 179.5 kBq), 133Ba (81, 356 keV �-rays, 138.9 kBq),57Co (122 kev �-ray, 343.3 kBq) and 139Ce (165.9 keV �-ray, 26.4 kBq) point sources and an 131I(364.5 keV �-ray, ⇠8 MBq) distributed source to determine if the detector and associated electronicswere linear in energy response. The energy range provided by these sources [16, 17] correspondsto the current energy region of interest in the DEPICT project. The gain on the anode channel can
– 4 –

proofs JINST_025P_1216
be set to one of four values in the ASIC; 20 mV/fC, 40 mV/fC, 60 mV/fC and 120 mV/fC, so thesewere investigated to maximise the use of the dynamic range. The sources were sequentially placed4 cm from the carbon fiber window for 600 seconds at each gain setting.
Figure 3a shows the ADC channel number of the measured photopeak centroid plotted as afunction of known �-ray energy for all the acquired data sets. It can be seen that the energy responseis linear below 364.5 keV for all gain settings. A linear calibration was therefore applied acrossthe energy range. Figure 3a shows the intercept at ADC channel 500, which is due to a baselineo�set of 230 mV in the pulses. The dynamic range was known to be approximately 2 V from thisbaseline and the total range consists of 4096 channels. The 120 mV/fC setting is optimum in thisenergy region as the data best fills the dynamic range, and will be used in remaining measurements.Therefore the % deviation of the measured ADC channel from the ADC channel calculated from thelinear fit for the 120 mV/fC data is plotted in figure 3b. The measured ADC channel numbers forall energies are within ± 0.5 % of the calculated ADC channel numbers. The maximum theoreticalenergy that can be resolved at this gain setting has been calculated to be 558 keV, however it isunlikely that the detector would have suitable e�ciency at detecting �-ray energies above 364.5 keVdue to the 5 mm crystal thickness.
(a) (b)
Figure 3. (a) Plot of photopeak ADC channel as a function of known �-ray energy. (b) % deviation ofmeasured photopeak ADC channel from ADC channel calculated from the linear fit, at 120 mV/fC.
3.4 Peaking time
To determine the energy of an incident photon, the voltage pulse produced by the detector must beshaped. The amount of shaping depends on the peaking time, illustrated in figure 4a. Four peakingtime values can be set by the user in the ASIC; 0.25, 0.5, 1.0 and 2.0 µs. The energy resolution(FWHM %) of an 131I 364.5 keV photopeak from a single pixel was measured to be 8.66 ± 0.05 %,2.94 ± 0.02 % and 4.56 ± 0.21 % at peaking times of 0.25, 0.5, and 1.0 µs respectively. At 2.0 µspeaking time, the photopeak was no longer resolvable. It is known that lowering the threshold helpsto recover the spectrum at the longer peaking time, although this is not desirable for the high-countrate application of DEPICT. The best energy resolution of 2.94 ± 0.02 % was observed at a peakingtime of 0.5 µs. An example 131I spectrum acquired at this peaking time is shown in figure 4b with
– 5 –

proofs JINST_025P_1216
the photopeak centroids labeled. The 80.2 keV (P� = 2.6 %), 284.3 keV (P� = 6.1 %) and 364.5 keV(P� = 81.5 %) 131I photopeaks are clearly identified. There are multiple unresolvable low energyx-rays with energies between 29.5–34.5 keV, and a combined intensity of 4.86 %. For comparison,a typical energy resolution for NaI (Tl) scintillator detectors currently used in SPECT systems is⇠10 % FWHM at 364.5 keV. The superior CZT detector energy resolution will facilitate improvedscatter correction over scintillation SPECT systems, improving quantitative imaging and volumedelineation, which are key aims of the DEPICT project.
(a) (b)
Figure 4. (a) Illustration of a shaped preamplifier pulse to define peaking time, pulse height and pulseduration. (b) An example 131I energy spectrum acquired at 0.5 µs peaking time.
The setup parameters of bias voltage and peaking time have been selected so far to optimiseenergy resolution for good discrimination of scattered �-rays. However, the DEPICT project alsorequires the detector to operate with high photon throughput, due to the high activities of isotopesadministered in MRT. This could potentially be achieved by reducing the peaking time. Therefore,the photon throughput was compared at peaking times of 0.25 and 0.5 µs. The detector was exposedto a 3.54 MBq 133Ba point source for measurement periods of 300 seconds, at a range of distancesfrom 0 cm (on the carbon fiber window) to 14 cm, to vary the incident count rate. The incidentcount rate was calculated using the activity of the source, the time taken for data collection and asolid angle,⌦, correction for a square detector shown in equations. (3.2) and (3.3), at each distance.
⌦ = (1 � f
s
) · 4 · arcsin (sin2 ↵) (3.2)
where↵ = arctan
✓ w2d
◆(3.3)
and where f
s
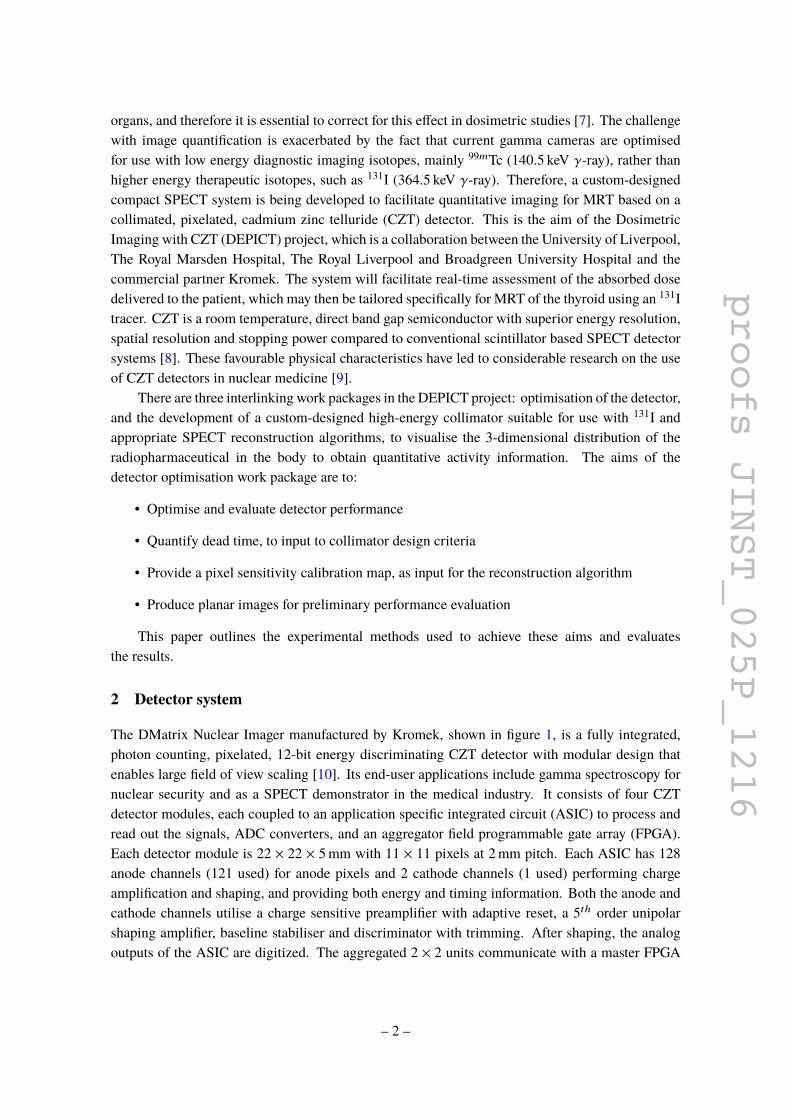
is an pre-factor to account for any physical shadowing of the detector area by ancillarywindows, w is the active width of the detector and d is the distance from the detector to thesource [18]. The 133Ba point source emits a 356 keV �-ray, an analogue to the 364.5 keV 131I �-ray,and was used for this measurement due to the uncertainties that would arise in the solid anglecorrection to be applied to the 131I distributed source. The total measured count rate was recordedand shown as a function of the incident count rate for the data acquired for peaking times of 0.25and 0.5 µs in figure 5.
– 6 –
proofs JINST_025P_1216
Figure 5. Measured photon count rate as a function of incident photon count rate at peaking times of 0.25 µsand 0.5 µs.
These results show shortening the peaking time to 0.25 µs slightly decreased the photonthroughput, which may be due to ballistic deficit e�ects. The error on the measured photoncount rate is statistical, whereas the error on the incident count rate takes into account geometricaluncertainties. Since the peaking time is not the limiting factor for throughput, the detector couldtherefore be operated at 0.5 µs to ensure best spectroscopic performance.
4 Dead time
The dead time of a SPECT system has always been a main limitation for quantitative imaging inMRT and it is therefore essential to minimise the e�ect where possible. It can be seen in figure 5that the relationship between the incident and measured count rates is non-linear. If the gradientof the graph is non-zero, it is possible to apply a dead time correction. However, it is seen thatthe data begins to plateau around 160 ⇥ 103 measured photon counts per second, which indicatesthe incident count rate can no longer be calculated from the known relationship to the measuredcount rate, and dead time corrections can no longer be used. This maximum operating count rateof 160 kcps is in agreement with the manufacturers specifications and will be used to determine thetransmission required from the custom-designed DEPICT collimator.
The two-source method [19] was used with 3.54 MBq and 0.95 MBq 133Ba point sources at theoptimised peaking time of 0.5 µs, to determine the system dead time. Count rates were measuredwhen the sources were placed at heights of 4 cm and 8 cm above the carbon fiber window, for 600seconds. A background measurement was also acquired. The dead time, ⌧, of the system can becalculated from the following two-source method equation:
⌧ =X (1 �
p1 � Z )
Y
(4.1)
where
X ⌘ m1m2 � m
b
m12 (4.2)Y ⌘ m1m2(m12 + m
b
) � m
b
m12(m1 + m2) (4.3)
Z ⌘ Y (m1 + m2 � m12 � m
b
)X
2 (4.4)
– 7 –

proofs JINST_025P_1216
and where m1 = measured count rate of source 1, m2 = measured count rate of source 2, m12 =measured count rate of sources 1 and 2 combined and m
b
is a measure of the background counts.The values for m1, m2, m12, m
b
and ⌧ at each height are shown in table 1. The average dead timewas calculated to be 4.84 ± 0.05 µs.
Table 1. Values used for calculation of dead time.
Height (cm) m1 (cps) m2 (cps) m12 (cps) mb
(cps) ⌧ (µs) Error (µs)4 1.08 ⇥ 105 4.99 ⇥ 104 1.21 ⇥ 105 3.29 ⇥ 101 4.80 0.078 6.43 ⇥ 104 2.36 ⇥ 104 8.80 ⇥ 104 3.29 ⇥ 101 4.87 0.08
5 Pixel sensitivity calibration
In order to extract quantitative information from the DEPICT SPECT images, it is necessary tocalibrate the position-dependent sensitivity of the CZT detector and the collimator. In this phaseof work, the CZT detector sensitivity has been calculated for each pixel, so that a pixel sensitivitycalibration map can be input to the image reconstruction algorithms, which are currently underdevelopment. A 1.64 GBq 241Am source collimated by lead into a 1 mm beam, was mounted on aVelmex VXM x-y positioning table 1.5 cm above the carbon fiber window, to acquire data for �-raysincident on the detector at known x-y positions, as shown in figures 6a and 6b. The collimatedsource was moved across the face of the detector in an x-y grid. The step between collimatorpositions was set at 1 mm and data collected for 10 seconds at each position. The optimised biasvoltage of 600 V, gain setting of 120 mV/fC and peaking time of 0.5 µs were set for data acquisition.
(a) (b)
Figure 6. (a) Photograph of the CZT detector and collimated 241Am source mounted on the Velmex scanningtable. (b) Photograph of the end of the collimator. The collimated �-rays are incident on the carbon fiberentrance window.
Figure 7a shows a plot of the total counts in the detector recorded as a function of x-y gridscan position. Figure 7a shows the four separate gamma modules are easily discernible, howeverthe modules are not accurately aligned with one another. It was observed that detector modules 3and 0 have approximately 11 % more counts, with respect to modules 2 and 1. The yellow areas of
– 8 –

proofs JINST_025P_1216
reduced intensity, approximately 3500 counts per position, arise due to the diverging photon beaminteracting with the detector module edge pixels, when the collimated source was positioned overthe gap between the modules. The black pixel in module 1 is due to an issue in the software thatstopped data collection at 1 scan position, and the dark blue pixels of approximately 1000 counts inmodule 0 highlight two defective pixels. The pixels surrounding the two defective pixels also havereduced counts, due to the photon beam diverging as it leaves the end of the collimator and countsbeing lost in the defective pixels.
An energy gated plot is shown in figure 7b with an energy gate of 52–62 keV applied around the59.5 keV 241Am photopeak. It highlights degradation of the outer pixels, predominantly in module3, showing that less events have been detected. It is expected this is due to poor charge collection.Comparison of the 241Am energy spectra obtained from an inner module pixel and a degraded edgepixel from detector module 3 are shown in figure 7c, and the spectrum from the edge pixel has apoorer peak-to-total ratio. Edge pixels can degrade due to environmental e�ects, and also due tolight passing through gaps in the aluminium case, inducing noise. The pixel sensitivity maps willbe used to calibrate future imaging data sets through normalisation of the count rate. They willallow pixel-by-pixel activity quantification, that will be input to dosimetry calculations.
(a) (b)
(c)
Figure 7. (a) A plot of total counts as a function of x-y position of a collimated 241Am source and (b) a plotof photopeak gated counts as a function of x-y position of a collimated 241Am source. (c) Comparison of241Am energy spectra from an inner module pixel and a degraded edge pixel.
– 9 –

proofs JINST_025P_1216
6 Charge sharing
Pixelated CZT detectors allow increased spatial resolution compared to planar detectors, and thise�ect improves as the pixel size decreases due to the small pixel e�ect [20]. However, when the pixelsize is decreased to be comparable to the size of the electron charge cloud created when the �-rayinteracts, the charge may be shared between multiple pixels and degrade the spatial resolution. Toquantify the amount of charge sharing in the DMatrix system, a 1.64 GBq 241Am source collimatedinto a 1 mm beam was mounted on the Velmex VXM x-y positioning table, 1.5 cm above the carbonfiber window. The step between collimator positions was set at 1 mm and data were collected for 1second at each step. For this data collection, the readout mode was changed from the basic sparsifiedphoton collection mode used thus far, that only read out triggered channels above a threshold, toreadout all mode. This meant that any event above the set global threshold of ⇠15 keV would triggerthe readout of all events in that detector module.
Multiple pixel events can occur either due to the aforementioned charge sharing phenomena,or because the �-ray Compton scatters from one pixel into another, where it deposits its remainingenergy. Therefore it was essential to read out the data from all pixels, in order to observe low energyCompton scattering or charge shared events that occur, with energy below 15 keV. The relative crosssections for Compton scattering and photoelectric absorption interactions by a 59.5 keV �-ray are0.116 cm2/g (2.13 %) and 5.315 cm2/g (97.86 %) respectively, for a total attenuation cross sectionof 5.431 cm2/g [21]. To discriminate between charge shared and Compton scattered events, theCompton scattering formula given in equation (6.1) was used to determine the allowed energies ofthe scattered photon E
f
and recoil electron, given the incident �-ray had energy E0 = 59.5 keV andthe rest mass equivalent energy of the electron m0c2 = 511 keV.
E
f
=E0
1 + E0m0c2 (1 � cos ✓)
(6.1)
The range of allowed energies was calculated to be 0–11.3 keV for the energy absorbed bythe electron and 48.3–59.5 keV for the scattered �-ray, for values of ✓ between 0 and 180�. Thelowest energy for the scattered photon results when it emerges at 180� with respect to its originaldirection. Therefore, any multiple pixel event, with energy outside these limits would be tagged asa charge shared event. Since the detector was in readout all mode, all pixels will have a voltagevalue corresponding to the collection of real charge, or due to electronic noise. Figure 8a showsan example energy spectrum acquired with the 241Am source. As a result of the read out mode, alarge amount of low energy noise below ⇠10 keV is exhibited due to background noise events beingsummed every time a �-ray interacts with energy greater than 15 keV. Therefore, a threshold of5 keV was set in post processing when quantifying the charge shared events, to discriminate somenoise events. It is known however that this threshold will also remove a proportion of Comptonscattered and charged shared events, with an energy less than 5 keV. The criteria for a multiplepixel event to be classed as a charge shared event is as follows:
• Energy deposited is outside Compton scatter limits
• Energy is above the post processing threshold of 5 keV
– 10 –

proofs JINST_025P_1216
• Energy is deposited in neighbouring pixels
• Energy is deposited in the same time stamp
• Sum of energy deposited in pixel 1 and pixel 2 is less than or equal to 59.5 keV
A 2D energy spectrum is shown in figure 8b, which depicts the energy recorded in each pixel,for events in which 2 pixels pass the threshold in the same time stamp. The applied threshold of5 keV is evident due to the lack of data below 5 keV on both the x and y axis. The red areas of counts16,000 at 59.5 keV for both pixels corresponds to a 59.5 keV �-ray being detected in coincidencewith noise of energy between ⇠5–8 keV. A straight diagonal line between these regions woulddemonstrate Compton scattering between the two pixels, with the energy in each pixel summing togive 59.5 keV. Since there is curvature of the data, it illustrates the Compton scatter events do nothave 100 % e�cient charge collection, likely due to charge being trapped in the gap between thepixels [22]. There is also a small concentration of data points at 59.5, 59.5 keV, corresponding to acoincidence event where two 59.5 keV �-rays were detected simultaneously in the two pixels.
(a) (b)
Figure 8. (a) 241Am energy spectrum acquired in readout all mode, illustrating low energy noise. (b) 2Denergy spectrum depicting the energy recorded in each pixel, for events in which 2 pixels pass the thresholdin the same time stamp. Only data below 70 keV is included.
Following the application of the charge shared selection criteria, at 59.5 keV the ratio ofcharge shared events to all �-ray interactions was determined to be 0.71 %. This is the minimumcontribution of charge sharing as some events have been lost with the post processing threshold.This methodology for quantifying charge sharing is not applicable with 131I, as the allowed energiesfor the scattered �-ray and recoil electron are 150.2–364.5 keV and 0–214.3 keV respectively. Theallowed energies of the electron and scattered �-ray overlap, therefore the charge shared eventscannot be distinguished from Compton scatter events. This is further complicated by the largeincrease in Compton scattering cross section by a 364.5 keV �-ray which is 0.083 cm2/g (72.81 %)for a total attenuation cross section of 0.114 cm2/g [21].
– 11 –

proofs JINST_025P_1216
7 Planar images
Data were acquired to observe imaging capability, as this is the required purpose of the CZT detectorfor the DEPICT project. A prototype parallel hole collimator optimised for use with 140.5 keV �-rays was coupled to the detector to produce experimental planar images with the medical imagingisotopes 99mTc (140.5 keV �-ray, t1/2 = 6.01 hours) and 123I (159 keV �-ray, t1/2 = 13.27 hours).The lead collimator was designed with hexagonal holes of size 1.2 mm, septa thickness 0.2 mm andlength 23 mm. Data were acquired simultaneously with six 8 mm inner diameter vials of length4.5 cm, filled with aqueous 123I and 99mTc solutions, placed in the 6 spaces of a custom-designedPerspex phantom highlighted in figure 9a. Data were collected for 30 minutes. Figure 9b illustratesa cross sectional schematic of the position of each isotope in these 6 vials.
(a) (b)
Figure 9. (a) Photograph of the phantom positioned above the parallel hole collimator and (b) phantomschematic illustrating positions of 3 vials of 123I and 3 vials of 99mTc.
The total activities of the 123I and 99mTc sources were calibrated at the Royal UniversityLiverpool Hospital, on the morning of measurement. The sources were dispensed into the 6 vialswith an activity at the time of data collection of ⇠300 kBq and ⇠200 kBq in the 123I and 99mTcvials, respectively. Uncertainties in the activities arise due to calibration and dispensing methods.The total energy reconstructed across all pixels within the trigger time window was calculated.This corresponds to the total energy deposited by the �-rays in the detector system. The associatedaddback energy spectrum acquired with the 6 vials simultaneously, is shown in figure 10a. TheFWHM of the 99mTc and 123I photopeaks were measured to be 7.2 keV and 7.4 keV respectively, andthe peaks are clearly resolvable, demonstrating the good energy resolution of CZT. For comparison,a typical value for the energy resolution of a 140.5 keV photopeak with a scintillator detector is⇠14 keV FWHM [23]. The two peaks at approximately 75 and 85 keV correspond to lead x-rays produced in fluorescence from the collimator. Figure 10b illustrates the pixel intensity mapproduced, for events with energy between 130 and 170 keV to encompass the photopeaks of bothsources, whilst reducing contributions from scattered �-rays. This energy gate is indicated in redin figure 10a.
– 12 –

proofs JINST_025P_1216
(a) (b)
Figure 10. (a)The addback energy spectrum corresponding to the total energy reconstructed across all pixelswithin the trigger time window, with energy gate applied to (b) highlighted (b) gated pixel intensity mapacquired with 3 vials of 123I and 3 vials of 99mTc, positioned as per figure 9b.
Figures 11a and 12a show single pixel energy spectra selected from the pixel map regionscorresponding to 123I and 99mTc, respectively. Figures 11b and 12b show the corresponding energygated intensity pixel maps of the 123I and 99mTc vials, respectively. The red highlighted regionon each spectrum indicates the applied energy gate to achieve the gated pixel maps; 150–165 keVfor the 159 keV 123I photopeak and 130–145 keV around the 140.5 keV 99mTc photopeak. The redsquare on the pixel map highlights which pixel the spectrum shown was obtained from.
(a) (b)
Figure 11. (a) 123I energy spectrum acquired from the single pixel highlighted by the red square in the pixelintensity map and (b) pixel intensity map gated on the 123I 159 keV photopeak. Gate shown as solid redshaded area in (a).
It can be seen in figure 11b that when an energy gate is applied to the 123I data, only the 3rods filled with 123I are visible. However, even though a background subtraction has been applied,figure 12b exhibits regions of intensity of approximately 100 counts above background on the 99mTcgated pixel map where the 123I rods are known to be. Although the energy gate is applied around the99mTc photopeak, it sits on the Compton background of 123I, demonstrated in figure 10a. Therefore
– 13 –

proofs JINST_025P_1216
(a) (b)
Figure 12. (a) 99mTc energy spectrum acquired from the single pixel highlighted by the red square in thepixel intensity map and (b) pixel intensity map gated on the 99mTc 140.5 keV photopeak. Gate shown as solidred shaded area in (a).
events in the 99mTc pixel map arise from 123I emissions, but at ⇠15 % of the rate of observed 99mTccounts. It was not possible to perform a detailed quantitative analysis due to the uncertainties inknown vial activities. The results however do use multi-isotope imaging to demonstrate the powerof discriminating events by detected �-ray energy in the CZT detector, which will be important forrejecting events scattered within the patient and collimator during MRT.
Improving volume delineation in SPECT is an important aim of the DEPICT project. In orderto determine the accuracy of deducing the size of a vial from a planar image, an intensity profilewas taken through x pixel number = 4 from the 99mTc pixel intensity map shown in figure 12b andis plotted in figure 13. This corresponds to the position of maximum inner diameter of one of the99mTc vials, known to be 8 mm.
The fit applied to the data was a Gaussian with a quadratic background correction:
f (x) = a1e
�✓x�b1c1
◆2!
+ p1x
2 + p2x + p3. (7.1)
The standard deviation � of the peak was determined by �1 = c1p2
to be 1.61 ± 0.10, and wasinput to FWHM = 2
p2ln(2) �. Therefore the FWHM of the peak is 3.80 ± 0.24 pixels. Since each
pixel is 2 mm, it demonstrates the region of high intensity is 7.60 ± 0.48 mm. This is consistent withthe experimental set up as the vials used had an 8 mm internal diameter. Therefore, the pixel sizeand prototype collimator successfully facilitate area delineation of the rods. These imaging resultsare the first steps towards producing tomographic images with the custom-designed collimator andreconstruction algorithms later in the DEPICT project. The excellent spatial resolution in theseplanar images, coupled with excellent energy discrimination underpin the future success of theproject. Volume delineation will be investigated following tomographic reconstruction of planarimages acquired using DEPICT.
– 14 –

proofs JINST_025P_1216
Figure 13. Profile from a slice through the 99mTc pixel intensity map at x = 4.
8 Conclusions
A pixelated CZT detector has been characterised at the University of Liverpool for application asan imaging dosimeter in MRT, for the DEPICT project. The detector has been optimised for bothenergy resolution and throughput with a peaking time of 0.5 µs and a reverse bias voltage of 600 V.Good energy resolution is required due to the large contribution from scattered �-rays as they areemitted from the body, and high throughput is necessary due to the large activities administered inMRT. The average dead time was calculated to be 4.84± 0.05 µs, and it is possible to apply dead timecorrections up to approximately 160 kcps detected count rate. Pixel sensitivity calibration mapswere produced and will be used to calibrate future imaging sets through normalisation of the countrate, and allow pixel-by-pixel activity quantification. Charge sharing was investigated and 0.71 %of the �-ray events, above a 5 keV threshold, were calculated to be charge shared events at 59.5 keVand will be corrected for. The results of this paper are being input to the design of a collimator anddevelopment of image reconstruction algorithms. The experimental characterisation demonstratesthat the CZT detector is ideally suited for this particular application, due to its measured count ratecapabilities, position sensitivity and energy resolution. Future work will include imaging a thyroidphantom with high activity 131I to evaluate the performance of the detector in a clinical setting.
Acknowledgments
The authors wish to acknowledge financial support from the U.K. Science and Technology FacilitiesCouncil through the research award ST/M007847/1.
References
[1] S. Hertz and A. Roberts, Radioactive Iodine in the Study of Thyroid Physiology VII. The Use ofRadioactive Iodine Therapy in Hyperthyroidism, J. Am. Med. Assoc. (1946) 81.
[2] D.R. McGowan and M.J. Guy, Time to demand dosimetry for molecular radiotherapy?, Br. J. Radiol.88 (2015) 20140720.
[3] G.D. Flux et al., A dose-e�ect correlation for radioiodine ablation in di�erentiated thyroid cancer,Eur. J. Nucl. Med. Mol. Imaging 37 (2010) 270.
– 15 –

proofs JINST_025P_1216
[4] G. Sgouros et al., Patient-Specific Dosimetry for 131I Thyroid Cancer Therapy Using 124I PET and3-Dimensional-Internal Dosimetry (3D-ID) Software, J. Nucl. Med. 45 (2004) 1366.
[5] G.D. Flux et al., The impact of PET and SPECT on dosimetry for targeted radionuclide therapy, Z.Med. Phys. 16 (2006) 47.
[6] M. Lassmann, C. Reiners and M. Luster, Dosimetry and thyroid cancer: the individual dosage ofradioiodine, Endocr. Relat. Cancer 17 (2010) R161.
[7] L. Ferrer et al., Dosimetric Impact of Correcting Count Losses due to Deadtime in ClinicalRadioimmunotherapy Trials Involving Iodine-131 Scintigraphy, Cancer Biother. Radiopharm. 18(2003) 117.
[8] K. Iniewski, CZT detector technology for medical imaging, 2014 JINST 9 C11001.
[9] C. Scheiber, CdTe and CdZnTe detectors in nuclear medicine, Nucl. Instrum. Meth. A 448 (2000) 513.
[10] Kromek: DMatrix — nuclear imager gamma spectroscopy detector/imager and software,http://www.kromek.com/index.php/medical/all-medical-products/dmatrix.
[11] J.C. Kim et al., Charge sharing in common-grid pixelated CdZnTe detectors, Nucl. Instrum. Meth. A654 (2011) 233.
[12] Y. Yin, Q. Liu, D. Xu and X. Chen, Charge sharing e�ect on 600 µm pitch pixelated CZT detector forimaging applications, Chin. Phys. C 38 (2014) 116002 [arXiv:1312.6766].
[13] D.C. Radford, Radware software package, (2000).
[14] Q. Zhang et al., Progress in the Development of CdZnTe Unipolar Detectors for Di�erent AnodeGeometries and Data Corrections, Sensors 18 (2013) 2447.
[15] A. Shor et al., Gamma Spectroscopy With Pixelated CdZnTe Detectors, IEEE Trans. Nucl. Sci. 51(2004) 1204.
[16] M.-M. Bé et al., Table of radionuclides, Vol. 1 — A = 1 to 150, Monographie BIPM-5 BureauInternational des Poids et Mesures (2004).
[17] M.-M. Bé et al., Table of radionuclides, Vol. 2 — A = 151 to 242, Monographie BIPM-5 BureauInternational des Poids et Mesures (2004).
[18] N.J. Zaluzec, Analytical Formulae for Calculations of X-ray Detector Solid Angles in the Scanningand Scanning/Transmission Analytical Electron Microscope, Microsc. Microanal. 20 (2014) 1.
[19] G.F. Knoll et al., Radiation Detection and Measurement Fourth Edition, John Wiley & Sons Inc.(2010), pg. 124.
[20] Z. He, Review of the Shockley-Ramo theorem and its application in semiconductor gamma-raydetectors, Nucl. Instrum. Meth. 463 (2001) 250.
[21] XCOM: Photon Cross sections Database | NIST,http://physics.nist.gov/PhysRefData/Xcom/Text/XCOM.html.
[22] I. Kuvvetli and C. Budtz-Jørgensen, Measurements of charge sharing e�ects in pixilated CZT/CdTedetectors, IEEE Nucl. Sci. Symp. Conf. Rec. 3 (2007) 2252.
[23] T.E. Peterson and L.R. Furenlid, SPECT detectors: the Anger Camera and beyond, Phys. Med. Biol.56 (2011) R145.
– 16 –