r-10 maths nov04 v2 - sacsa framework · • contains a concept map which illustrates mathematics...
TRANSCRIPT

SACSA Companion Document SERIES R–10 Mathematics
R–10 MathematicsTeaching Resource

Additional copies of this publication are available from: • For South Australian government schools ONLY
E-mail: [email protected]
• For other requests, contact Curriculum Corporation PO Box 177, Carlton South Victoria 3053 Telephone orders: 1800 337 405 Facsimile orders: 1300 780 545 E-mail: [email protected] Website: www.curriculum.edu.au
2004, The State of South Australia, Department of Education and Children’s Services Produced by DECS Publishing 266 Port Road, Hindmarsh SA 5007 Edited by Gunta Groves Cover design by Triple Image Design Printed by Gillingham Printers, South Australia ISBN 0 7308 7765 5 R2233/D

FOREWORD
The R–10 Mathematics teaching resource is part of the SACSA Companion Documents series. Underlying
the development of this series is the need to promote consistency of curriculum within and across schools in
South Australia.
These resources are designed to support teachers to engage further with the SACSA Framework and work
towards maximising students’ achievement. They arise from the need expressed by many teachers for the
requirements of the SACSA Framework to be made more explicit for each year level.
The documents are written by practising teachers in close collaboration with curriculum officers, members of
professional associations and other committed educators.
This resource is a valuable support for teachers working to meet the diverse needs of learners in the range of
settings across South Australia.
Steve Marshall CHIEF EXECUTIVE

ACKNOWLEDGMENTS
The following people and groups are acknowledged for their valuable contribution to the development of this resource.
TEACHER-WRITERS
EARLY YEARS MIDDLE YEARS Leanne Heaven North Adelaide Primary School Heather Birbeck Highgate Primary School Joy Keddie Para Hills Junior Primary School Helen Hall Stirling East Primary School Lynne Lang Direk Schools—Salisbury Cheryl Ross Gilles Street Primary School Ann-Marie Maney Para Hills Junior Primary School Kathy Smith Brighton Secondary School Julie Omand West Lakes Shore Primary School Mandy Spiers Stirling East Primary School Lynda Palmer Woodend Primary School Les Williams Westbourne Park Primary School Jean Scarborough West Lakes Shore Primary School MIDDLE–SENIOR YEARS PRIMARY YEARS Louise Barry Loxton High School Tony Baverstock Walkerville Primary School Peter Briggs Underdale High School Carmel Dineen Burnside Primary School Ken Cheel Morphett Vale High School Ann McCabe Braeview Primary School/Open Access College Helen Hall Stirling East Primary School Ann McMillan East Torrens Primary School David Jeanes Seaview High School Sheryl Mickan Paringa Park Primary School Ian Robertson DECS
SUPPORT TEAM Kym Linke Policy and Program Officer, R–12 Mathematics Julie Baillie Project Officer, SACSA Companion Documents Development Support Rob Harding Manager, SACSA Companion Documents Program Pip Field Project Officer, Leadership Development John Walsh Manager, SACSA Teaching Resources Program Carolyn Cockburn Policy and Program Officer, Publishing Jill McDonald Policy and Program Officer, Primary and Middle Years Pamela Ball Manager, Publishing Ken Francou Principal, Walkerville Primary School/SAPPA representative Irene Smith Administration/Keyboarding Support Bridgid Laheney Project Officer, SACSA Companion Documents
Development Support

CONTENTS
Introduction 6 Middle–Senior Years (9–10) Exploring, analysing and modelling data 76 Mathematics learning and the SACSA Framework (concept map) 9 Measurement 78 Number 80 Overview of Key Ideas and Developmental Outcomes 10 Pattern and algebraic reasoning 82 Spatial sense and geometric reasoning 84 Early Years (R–2) Analysing and modelling change 85 Exploring, analysing and modelling data (including concept map) 11 Measurement 15 Terminology Number 18 Early Years 86 Pattern and algebraic reasoning (including concept map) 24 Primary Years 87 Spatial sense and geometric reasoning 27 Middle Years 89 Equipment 30 Middle–Senior Years 91 Primary Years (3–5) Resources Exploring, analysing and modelling data (including concept map) 31 Early Years 93 Measurement 35 Primary Years 93 Number 41 Middle Years 94 Pattern and algebraic reasoning (including concept map) 46 Middle–Senior Years 95 Spatial sense and geometric reasoning 50 Middle Years (6–8)
R–10 suggested websites R–10 Outreach and other services
96 97
Exploring, analysing and modelling data (including concept map) 54 Measurement 57 Number 63 Pattern and algebraic reasoning (including concept map) 67 Spatial sense and geometric reasoning 70
6
INTRODUCTION
This R–10 Mathematics teaching resource is one in a series of companion documents to the South Australian Curriculum, Standards and Accountability (SACSA) Framework and provides specific support for planning, teaching and learning. It has been written by junior primary, primary and secondary teachers with the support of and in collaboration with curriculum officers, professional associations and other committed educators. The document has been drafted in workshops, initially circulated in draft R–7 and 8–10 forms to all South Australian DECS schools, and reviewed and refined by teachers as the result of feedback from colleagues. Preceding this consolidated R–10 document, an R–7 revised edition has also been circulated to schools. Support for using the SACSA Framework The purpose of this document is to provide support for teachers in planning, programming and assessing using the SACSA Framework. This teaching resource details a sample range of learning descriptors relating to the Key Ideas and Outcomes in mathematics R–10. These descriptors, in dot point format: • make explicit the knowledge, skills and understandings reflected in
the Key Ideas and Outcomes • make consistent the expectations for learning at specific year levels
within and across sites
• are written from the learner’s perspective • help to make explicit the development of Essential Learnings
identified within each Key Idea • help to make explicit the teaching and learning processes of this
Learning Area • make visible the literacy and numeracy practices of the Learning
Area • provide examples for the use of a range of ICTs sequenced
developmentally across the Bands. The learning descriptors are not prescriptive. They describe the possible growth points of learners as they progress towards demonstrating Outcomes to reach a Standard. Learning does not develop in a linear fashion. Teachers will continue to use their professional knowledge, skills and judgment to provide the rich array of learning experiences that cater for all learners in their classrooms. This teaching resource is a tool to support this process. Planning for teaching and learning When using this resource for planning, teaching and learning, teachers will also need to engage with the following core principles: • Learning involves building on prior knowledge, with learners active
in constructing their own learning as they progress through cycles of growth.
• Linked and integrated learning with other Learning Areas are vital components of program planning and learning development.
7
• Equity Cross-curriculum Perspectives and Enterprise and Vocational Education are critical considerations.
• In the Early Years, when planning for teaching, learning and assessing children’s progress, it is important that teachers refer to the Developmental Learning Outcomes. The Overview of Key Ideas and Developmental Learning Outcomes chart has been included at the beginning of the Early Years section, particularly for use by those teachers of Reception and Year 1 children.
• Safe and secure teaching and learning environments should be established in which managers and teachers use appropriate risk management processes to minimise risks to health and safety. This should be done in accordance with the department’s Risk Management Framework, the principles of hazard management and Occupational Health, Safety and Welfare legislation.
At Years 9 and 10, in particular, the teacher-writers have identified only the new learning in each strand. This encourages teachers to assess student needs before commencing programming and planning. It also assists in planning across the Middle Years. The mathematics Learning Area In the context of the SACSA Framework, the mathematics Learning Area is structured around the strands of: • Exploring, analysing and modelling data • Measurement • Number • Pattern and algebraic reasoning • Spatial sense and geometric reasoning • Analysing and modelling change (Senior Years Band only).
Mathematics learning is central to numeracy. Numeracy is the ability to understand, critically respond to and use mathematics in different social, cultural and work contexts. This includes understanding how mathematics can be used in other Learning Areas. Learning mathematics is an active and engaging process and through thinking and working mathematically learners should develop and use the processes of problem solving, reasoning and proof, communication, making and using connections and the skills of representation. Worldwide developments in mathematics mean that it is necessary to use technologies, including information and communication technologies, to be able to represent and model contextual applications of mathematics, to manage and interpret data and to critically use mathematics to understand the physical and social environment. All mathematics curriculum should consider the changing nature of society and the importance of mathematics in addressing, understanding and further enhancing those changes. Achieving a balance of mathematics learning experiences Mathematics learning for many years has been regarded as the acquisition and practice of skills associated with a known body of knowledge that depends on rituals and procedures. Students and young people are now being encouraged to construct their own knowledge actively and make decisions about their learning. It needs to be acknowledged that learning occurs in a range of ways and learners need a variety and range of opportunities to engage with mathematical concepts. It is essential that the learning of mathematics becomes an active process that engages students by using relevant contexts and learning processes.

8
Format of this resource The format of this document has been developed: • for practical use by teachers • to ensure consistency across Curriculum Bands • with consideration to the organisation of the SACSA Framework,
including the following pattern: Year levels, Key Ideas and Outcomes, and Standards
Year Level R 1 2 3 4 5 6 7 8 9 10
Key Ideas and
Outcomes Early Years Primary Years Middle Years Senior
Years
Standards Towards 1
Towards 1
1
Towards 2
2
Towards 3
3
Towards 4
4
Towards 5
5
To meet these purposes the document:
• is organised in Curriculum Bands for the following year levels: Early Years (R–2), Primary Years (3–5), Middle Years (6–8) and in a combined Middle–Senior Years Band (9–10)
• is structured into the strands with sub-headings to provide clarity within these strands
• contains a concept map which illustrates mathematics learning in the context of the SACSA Framework
• contains concept maps that precede two of the five strands in each Band, providing teachers with a visual representation of the Key Ideas and Outcomes. Teachers may use the concept maps to support them further in their work or they may prefer to develop their own
• includes cross-referencing to allow navigation between Bands and strands
• provides examples of content at particular levels, while not constraining the possibilities to these examples
• includes at the Middle–Senior Bands (specifically at the 7–10 year levels) investigation text blocks, which can support ways of introducing students to the applications of mathematics in a broader sense. They could present opportunities to address the Essential Learnings, Equity and Enterprise through discussion and/or project based learning.
• provides some examples of resources including references, suggested resources, suggested websites, equipment (Early Years) and Outreach and other services.
Assessment to support learning A range of negotiated and inclusive assessment practices are needed to continuously gather evidence of learner achievement in relation to the Outcomes. This document contains a number of questions to stimulate reflection and ideas about assessment, as teachers undertake their planning of teaching, learning and assessing. The sample learning descriptors also provide a rich source of ideas for appropriate assessment tasks.
Further assistance To further assist in planning, programming and assessing: • a copy of this document in Word format is available on the SACSA
website. This format allows teachers to cut, paste and modify the document to suit individual needs. Go to <http://www.sacsa.sa.edu.au/companion>
• a professional learning package, Planning for teaching and learning, which includes a PowerPoint presentation, has been developed to support use of this and the other SACSA Companion Documents and is also available on the SACSA website. Go to <http://www.sacsa.sa.edu.au/companion>.

MATHEMATICS LEARNING AND THE SACSA FRAMEWORK
Learners’engagement
Comm
unic
ation
IdentityInterdependence
Futures Thinking
Equity Cross-curriculum Perspectives
Enterprise and Vocational Education
Working Mathematically
Thinking Mathematically
Data Measurement
Number Change
Pattern Space
Worldwide developments in mathematicscurriculum include:● using technologies, including information and
communication technologies, interactive softwareand calculators to explore mathematics and workmathematically in the world around us
● developing and using mathematical structures torepresent, model and manipulate patterns andrelationships in order to make sense of the worldand make connections between ideas withinmathematics
● developing the learner's ability to handle datacritically, and increasing their understanding of thenotion of chance
● working mathematically to empower the learner toengage critically with their physical and socialenvironment to envisage more just futures.
The mathematics Learning Area aims to developin all learners capabilities to:● understand the social and work purposes, uses
and practices of mathematics and how these relateto each other and shape futures
● understand and use mathematical language increative and critical ways—both terminology andsymbols
● be confident users of mathematics, who chooseappropriate and accurate means for exploring theworld and conducting their lives
● gain pleasure from mathematics and appreciateits fascination and power
● appreciate that mathematics is a dynamic fieldwith roots in all cultures
● apply their mathematics learning to other LearningAreas, to life in the wider community, and inaccessing further education and training.
Learning mathematics is an engaging and activeprocess where learners:● construct their own mathematical meaning through
interaction with ideas they hold and alternativeideas held by others; and interact with their physicaland social environments, and with technologies,manipulative equipment and texts
● have their concepts challenged by experiencesand interactions with their physical and socialenvironments and by mathematics itself
● are encouraged and supported to take risks andpersevere with new or different ways of thinkingand doing things, and see making mistakes as animportant part of their learning
● participate independently and collaborativelythrough authentic experiences, discussion anddebate, planning and taking action towards a betterfuture, and reflecting upon their mathematicalactivity in a range of contexts.
When working mathematicallylearners develop and use thefollowing mathematical processes:
● problem solving
● reasoning and proof
● communicating
● connecting
● representing.
9

Overview of Key Ideas and Developmental Learning Outcomes: BIRTH to AGE 5 South Australian Curriculum, Standards and Accountability Framework
AGE 3 to AGE 5BIRTH to AGE 3
In partnership with educators in respectful and caringenvironments:
Children form secure attachments developing close bonds withone and then more educators. Id • In • KC4
Children begin to develop trust in themselves and others andtheir environments. F • Id • In • KC4
Children construct a secure sense of self and a confidentpersonal and group identity within their family, their communitiesand their out-of-home care. Id • In
Children develop self-awareness and a sense of beingconnected with others within the context of their environments.These connections foster increasing appreciation of caringrelations and a basis for shared understandings.F • In • KC4
Children develop autonomy and a sense of agency, as well asdispositions and skills for self-regulation, decision-making andan understanding of their interdependence with others.F • Id • In • T • KC4 • KC6
Children explore and develop emotional wellbeing.F • In • KC1
Children begin to explore and develop understandings andstrategies to effectively manage change. F • KC1 • KC6
In partnership with educators in safe and plannedenvironments:
Children use their sensory capabilities with increasingintegration, skill and purpose to connect with, perceive, exploreand respond to their world. Id • In • T • KC1 • KC2
Children explore a range of movement patterns involvingstrength, body control and coordination for increasingly skilledvoluntary actions. Id • In • KC6
Children develop balance for stability and movement and anawareness of their body in space, in order to move with purpose,safety and expression. Id • In • T • KC1
Children develop an awareness of their body’s needs and theirroutines for food, relaxation, activity and sleep, and developincreasing independence in their personal care. In • KC1
In partnership with educators in language-rich and thoughtfulenvironments:
Children accept challenges to wonder and find answers in theirnatural and socially constructed environments.F • T • C • KC6
Children ask questions, wonder, and discover a range of waysto explore and find answers to problems. F • T • KC6
Children discover a range of ways to recognise, investigate,manipulate, use, represent and invent phenomena in theirnatural and constructed environments.In • F • T • C • KC1 • KC2
Children begin to develop concern for, and appreciation of,others and their environments. F • In • KC4
Children develop and use a wide range of both non-verbal andverbal communication to convey and construct meaning andshare in the enjoyment of language. In • C • KC1 • KC2
The Developmental Learning
Outcomes are deliberately broadlong-term accomplishments.They reflect the integration oflearning and developmentthrough the Essential Learningsand all Learning Areas and allowfor different developmental
pathways
Children develop trust andconfidence. F • Id
Children develop a positivesense of self and aconfident personal andgroup identity. Id • In
Children develop a senseof being connected withothers and their worlds.F • Id • In
Children are intellectuallyinquisitive. F • T • C
Children develop a range ofthinking skills. F • T • C
Children are effectivecommunicators. T • C
Children develop a senseof physical wellbeing.Id • In
Children develop a range ofphysical competencies. Id
Children extend their sense of personal and group identity. Id • In
Children develop autonomy and a sense of agency.Id • In • KC4 • KC6
Children contribute in a variety of ways as members of groups.Id • In • KC4
Children explore arts forms including visual arts, drama, music, danceand media through symbolic and creative expression.Id • T • C • KC2 • KC6
Children develop processes, understandings and skills to support theirartistic expression. T • C • KC1
Children interact with and respond to arts works. In • C • KC2
Children continue to acquire and are supported in the language oftheir homes, families and communities. Id • In • C • KC2
Children are purposeful and effective users of communication andlanguage. Id • C • KC2
Children increase their understanding of the power and complexity oflanguage and communication. T • C • KC2
Children examine, identify and critique processes, products andsystems. In • T • C • KC1
Children use their imagination to generate ideas and participate inprocesses of design. F • T • C • KC3 • KC6
Children use materials, equipment and processes to design anddevelop products and systems. In • T • C • KC3 • KC7
Children develop a respect for, and appreciation of, the diverse natureof their communities. In • KC1
Children begin to develop an understanding of Aboriginal and TorresStrait Islander peoples as the indigenous inhabitants of Australia.In • KC1
Children begin to recognise and question the way society privilegesor excludes particular ways of knowing and being. F • In • T • KC1
Children learn to take action to bring about change for a just society.F • In • T • KC4
Children extend their range of physical skills and strengthen theirphysical vitality. Id
Children develop understandings about their physical capabilitiesthrough individual and shared activities. Id • In • KC1 • KC4
Children begin to develop responsibility for their personal health andsafety. Id • In
Children develop a sense of responsibility for natural and socialenvironments and an understanding that their world is shared.F • In • KC1
Children develop confidence through making sense of their world bythinking, acting and working scientifically. Id • In • T • KC6
Children develop and use mathematical skills and understandings toinvestigate their physical and social worlds, both natural andconstructed. In • T • KC1 • KC5
The Developmental Learning Outcomesare deliberately broad long-termaccomplishments. They reflect theintegration of learning and developmentthrough the Essential Learnings and allLearning Areas and allow for different
developmental pathways
Children develop trust andconfidence. F • Id
Children develop a positivesense of self and a confidentpersonal and group identity.Id • In
Children develop a sense ofbeing connected with others andtheir worlds. F • Id • In
Children are intellectuallyinquisitive. F • T • C
Children develop a range ofthinking skills. F • T • C
Children are effectivecommunicators. T • C
Children develop a sense ofphysical wellbeing. Id • In
Children develop a range ofphysical competencies. Id
. . . . . . . . . . . . . . . . . . . . . . . . . . .
The Birth to Age 5 Key Ideas and theDevelopmental Learning Outcomescomplement and connect with theReception to Year 2 Key Ideas andCurriculum Standards. Together theycomprise the requirements for the EarlyYears Band.Reference to the Reception to Year 2phase will support continuity in teachingand learning (see Learning Areaoverviews).
Thepsycho-socialself
Thephysicalself
Thethinking andcommunicatingself
Self andsocialdevelopment
Arts andcreativity
Communicationand language
Design andtechnology
Diversity
Health andphysicaldevelopment
Understandingour world
LEARNING KEY IDEAS DEVELOPMENTAL LEARNING KEY IDEAS DEVELOPMENTALAREAS LEARNING OUTCOMES AREAS LEARNING OUTCOMES
10

11
Id T C KC3
F T C KC6
C KC2 KC6 KC7
Id T C KC1 KC3 KC6 KC7
DEVELOPMENTAL LEARNING OUTCOMESChildren develop trust and confidenceChildren develop a positive sense of self and a confident personal and group identityChildren develop a sense of being connected with others and their worldsChildren are intellectually inquisitive Children develop a range of thinking skillsChildren are effective communicatorsChildren develop a sense of physical wellbeing Children develop a range of physical competencies
Generating data
Investigating chance and randomness
Using data
Representing
Organising
Collecting
Posing questions
Making plans
Conducting interviews/ surveys
Sorting/classifying objects
Communicating with othersUsing a range of strategies
Recording in different ways
Reflecting on data gathering processes
Making predictions for use in similar
situations
Recognising chance inown lives
Using prior knowledge to predict likely outcomes
Exploring comparative
language
Exploring,analysing and modelling data
KEY IDEASChildren generate data about the world around them. They developstrategies, including using technology, to collect, organise andrepresent data, and use it to describe situations and to makedecisions and personal plans.
Children explore ways of using comparative language and numberto describe and represent data and to communicate responsesabout their questions. They make predictions about similarsituations based upon the conclusions drawn from data theycollect and digitalise.
Children construct an understanding of chance and randomnessthrough exploring the variety of possibilities presented both bytheir daily activities and phenomena in their environment.
OUTCOMES1.1 Generates and organises data and uses it to make personaland collective plans.
1.2 Uses everyday comparative language and number to describethe data they have generated in parts and as a whole and describehow the data assists them to answer their own questions.C KC2
F T C KC2
1.3 Recognises situations whose outcomes are certain, impossibleor unpredictable; states possible outcomes for particular events anduses everyday language to describe the likelihood of the outcomesoccurring.
Complementary use of ICTs
Exploring Representing Communicating
Identifying possible
outcomes
Answering own
questions
Describing with
Number
Comparative language
Educators' questionsHow can the generation and analysis of data help children plan for action?
How can the analysis of collected data help children identify with a group?
How do data generating and reporting methods help children collaborate and negotiate?
Through a range of indoor and outdoor games, how can children explore the concepts of bias and chance events?
How can children use data to communicate different points of view and interests?
Learners' questionsWhat data do I need to collect?
Are there any patterns in the data I have collected?
How can I organise and present my data?
Can others understand the way I represented my data?
How likely is it that I’ll get the same results again?
This concept map provides a visual representation of the Key Ideas and Outcomes below. Educators may prefer to develop their own.CONCEPT MAP: EXPLORING, ANALYSING AND MODELLING DATA BAND: Early Years

12
Learning Area: Mathematics Band: Early Years Strand: Exploring, analysing Standard: 1 and modelling data KEY IDEAS Data collection and representation (refer p32 for Primary Years) OUTCOMES
Reception Towards Standard 1
Year 1 Towards Standard 1
Year 2 Standard 1
Children generate data about the world around them. They develop strategies, including using technology, to collect, organise and represent data, and use it to describe situations and to make decisions and personal plans. Id T C KC1 KC3 KC6 KC7
relating to Outcome 1.1
Children explore ways of using comparative language and number to describe and represent data and to communicate responses about their questions. They make predictions about similar situations based upon the conclusions drawn from data they collect and digitalise. C KC2 KC6 KC7
relating to Outcome 1.2
KEY TO SYMBOLS Essential Learnings: F Futures Id Identity In Interdependence T Thinking C Communication
• Sorts collections of objects using familiar criteria (eg using junk materials).
• Compares and describes objects according to similarities and differences (eg colour, shape, size, function).
• Talks about data collection (eg responds to ‘What information do we want to collect; how, why and from where?’).
• Organises concrete materials into graph/table form.
• Makes and records picture graphs/tallies.
• Talks about graphs/tallies, and asks and answers questions about the information generated.
• Sorts, compares and analyses collections of objects.
• Talks about data collection (eg
responds to ‘What information do we want to collect; how, why and from where?’).
• Discusses a variety of ways to organise the data.
• Represents data in a variety of ways
(eg using concrete objects or pictures, picture graphs, lists, numbers, symbols, tallies).
• Generates picture/column graphs
using software such as Kid Pix/Max Count.
• Interprets and discusses information generated from the graphs/tallies.
• Sorts and organises objects/ information using more than one criterion (eg using popular and peer group artefacts).
• Gathers, organises, represents and
interprets data to find answers to student-generated questions.
• Practises using a formal tally system (eg 1111).
• Investigates a variety of ways to collect and organise data.
• Compares ways of collecting and organising data.
• Uses picture, column and bar graphs and simple spreadsheets to represent data including electronic resources such as Kid Pix, Max Count and websites.
• Understands need for 1:1 correspondence and common baseline data when making comparisons.
• Reads and interprets data from a variety of sources (eg timetables, rosters, charts).
1.1 Generates and organises data and uses it to make personal and collective plans. Id T C KC3 1.2 Uses everyday comparative language and number to describe the data they have generated in parts and as a whole and describe how the data assists them to answer their own questions. C KC2
Possible starting points for planning, programming and assessing
(refer p10 for DLO overview)
13
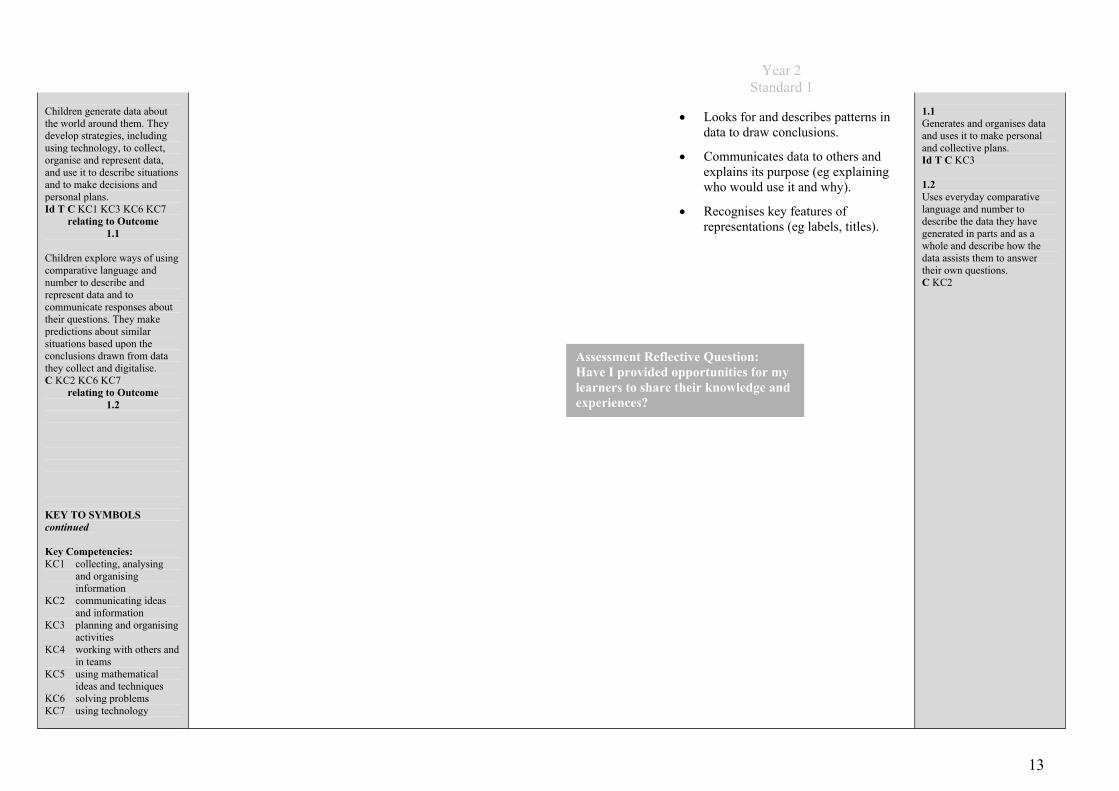
Children generate data about the world around them. They develop strategies, including using technology, to collect, organise and represent data, and use it to describe situations and to make decisions and personal plans. Id T C KC1 KC3 KC6 KC7
relating to Outcome 1.1
Children explore ways of using comparative language and number to describe and represent data and to communicate responses about their questions. They make predictions about similar situations based upon the conclusions drawn from data they collect and digitalise. C KC2 KC6 KC7
relating to Outcome 1.2
KEY TO SYMBOLS continued Key Competencies: KC1 collecting, analysing and organising information KC2 communicating ideas and information KC3 planning and organising activities KC4 working with others and in teams KC5 using mathematical ideas and techniques KC6 solving problems KC7 using technology
• Looks for and describes patterns in
data to draw conclusions.
• Communicates data to others and explains its purpose (eg explaining who would use it and why).
• Recognises key features of representations (eg labels, titles).
1.1 Generates and organises data and uses it to make personal and collective plans. Id T C KC3 1.2 Uses everyday comparative language and number to describe the data they have generated in parts and as a whole and describe how the data assists them to answer their own questions. C KC2
Assessment Reflective Question: Have I provided opportunities for my learners to share their knowledge and experiences?
Year 2 Standard 1

14
Learning Area: Mathematics Band: Early Years Strand: Exploring, analysing Standard: 1 and modelling data
KEY IDEAS (refer p10 for DLO overview) Chance, data and probability (refer p34 for Primary Years) OUTCOMES
Reception Towards Standard 1
Year 1 Towards Standard 1
Year 2 Standard 1
Children construct an understanding of chance and randomness through exploring the variety of possibilities presented both by their daily activities and the phenomena in their environments. F T C KC6
relating to Outcome 1.3
• Recognises situations in their familiar environment where chance is a factor (eg after rain: ‘We might see a rainbow’).
• Recognises that there is an element of uncertainty about some events (eg cautiously places blocks on top of a tower to see if they will fall).
• Constructs an understanding of
chance through the playing of simple games/activities where chance is involved (eg using dice, tossing a coin, adventure computer games).
• Explores the everyday usage of expressions of chance (eg being lucky, fair).
• Explores language of chance relating
to everyday events (eg maybe/maybe not, will/won’t, never/always).
• Recognises situations where chance is a factor and begins to predict/record likely outcomes.
• Recognises that repetitions of the
same event can produce different results (eg ‘Last time I rolled a 3 but next time I could roll something else’).
• Refines understanding of chance through the playing of games/activities where chance is involved (eg using dice, tossing a coin, adventure computer games).
• Orders outcomes for familiar
events/experiments from those least likely to occur to those most likely to happen.
• Explores the language of chance (eg certain, uncertain, likely, unlikely, possible, impossible, less/more likely, maybe).
• Recognises situations where chance is a factor and begins to predict/record likely outcomes.
• Uses prior knowledge to predict
likely outcomes (eg ‘When I roll the die I might get a 5 or 6 or …’).
• Lists possible outcomes for a chance event and investigates these outcomes using materials available (eg tossing a coin).
• Understands that the possible outcomes for a chance event can change if the event is modified (biased).
• Draws conclusions from data collected and compares conclusions to make predictions for what might happen next.
• Uses the language of chance (eg certain, uncertain, likely, unlikely, possible, impossible, less/more likely, maybe).
1.3 Recognises situations whose outcomes are certain, impossible or unpredictable; states possible outcomes for particular events and uses everyday language to describe the likelihood of the outcomes occurring. F T C KC2
Assessment Reflective Question: Do I allow time for my learners to reflect on their discoveries?
Possible starting points for planning, programming and assessing

15
Learning Area: Mathematics Band: Early Years Strand: Measurement Standard: 1
KEY IDEAS (refer p10 for DLO overview) Length, perimeter and area (refer p35 for Primary Years) OUTCOMES
Reception Towards Standard 1
Year 1 Towards Standard 1
Year 2 Standard 1
Children construct concepts of size and measurable attributes by comparing a wide variety of familiar figures, objects and events drawn from the world around them. Id T C KC1
relating to Outcome 1.4
Children develop strategies that directly compare and quantify measurable attributes of a wide variety of figures, objects and events drawn from the world around them. T C KC6
relating to Outcome 1.5
• Sorts, orders and compares objects according to their length/area.
• Uses everyday language to describe length (eg short/long).
• Demonstrates an understanding of what it means to ‘match’ lengths/area (eg placing the measuring units with no gaps/overlapping).
• Compares lengths/areas directly by placing objects side by side, aligning the ends or on top of each other.
• Uses estimation and direct comparison to match, sort and order objects with increasingly less difference in length/area/perimeter.
• Uses increasingly graduated
comparative language of measurement (eg shorter than, taller than, same length).
• Uses arbitrary units to accurately match/measure length/area/perimeter.
• Demonstrates an understanding of the need to use consistent units when measuring.
• Identifies the need for a baseline when accurately comparing lengths.
• Estimates and uses arbitrary units to accurately measure length/area/perimeter (eg ‘This is 4½ straws long’, ‘I can cover this paper with 24 flip tiles’).
• Recognises that the unit of measure influences the outcomes of the measure (eg it takes more toothpicks and less pop sticks because pop sticks are longer than toothpicks).
• Begins to understand and use mathematical terms (eg centimetre, metre).
• Discusses what needs measuring,
chooses the appropriate unit, and considers the size of the object in comparison to the size of the measuring unit.
• Begins to use standard units with increasing accuracy when measuring.
1.4 Compares and orders the measurable attributes of distance, surface, space, mass, turn/angle and time to describe the size of a wide range of familiar figures, objects and events. T C KC1 1.5 Chooses and uses a variety of strategies to measure the size of a wide variety of figures, objects and events drawn from the world around them. T C KC6
Possible starting points for planning, programming and assessing

16
Learning Area: Mathematics Band: Early Years Strand: Measurement Standard: 1
KEY IDEAS (refer p10 for DLO overview) Volume, capacity and mass (refer p36 & p37 for Primary Years) OUTCOMES
Reception Towards Standard 1
Year 1 Towards Standard 1
Year 2 Standard 1
Children construct concepts of size and measurable attributes by comparing a wide variety of familiar figures, objects and events drawn from the world around them. Id T C KC1
relating to Outcome 1.4
Children develop strategies that directly compare and quantify measurable attributes of a wide variety of figures, objects and events drawn from the world around them. T C KC6
relating to Outcome 1.5
• Sorts, orders and compares objects according to their capacity, mass and volume.
• Uses everyday language to describe capacity, mass and volume (eg full, heavy, light).
• Demonstrates an understanding of what it means to ‘match’ capacity, mass and volume.
• Compares capacity, mass and volume
directly (eg pouring water from one container into another).
• Uses estimation and direct comparison to match, sort and order objects with increasingly less difference in capacity, mass and volume.
• Uses increasingly graduated
comparative language of measurement (eg heavier than, lighter than, holds more).
• Uses arbitrary units to accurately match/measure capacity, mass and volume.
• Demonstrates an understanding of the need to use consistent units when measuring.
• Identifies the need for a baseline when accurately comparing capacity, mass and volume (eg making sure the containers are empty before filling).
• Estimates and uses arbitrary units to measure capacity, mass and volume accurately (eg ‘This jug holds 4 cups’, ‘3 blocks balance with this pencil’).
• Recognises that the unit of measure influences the outcomes of the measure (eg ‘It takes more teaspoons and fewer cups because teaspoons hold less’).
• Continues to use comparative language (eg heavier, lighter).
• Begins to understand and use mathematical terms (eg litres, millilitres, grams, kilograms).
• Discusses what it is that needs measuring, chooses the appropriate unit, and considers the size of the object in comparison to the size of the measuring unit.
• Begins to use standard units with increasing accuracy when measuring.
1.4 Compares and orders the measurable attributes of distance, surface, space, mass, turn/angle and time to describe the size of a wide range of familiar figures, objects and events. T C KC1 1.5 Chooses and uses a variety of strategies to measure the size of a wide variety of figures, objects and events drawn from the world around them. T C KC6
Possible starting points for planning, programming and assessing

17
Learning Area: Mathematics Band: Early Years Strand: Measurement Standard: 1
KEY IDEAS (refer p10 for DLO overview) Time and temperature (refer p38 & p40 for Primary Years) OUTCOMES
Reception Towards Standard 1
Year 1 Towards Standard 1
Year 2 Standard 1
Children construct concepts of size and measurable attributes by comparing a wide variety of familiar figures, objects and events drawn from the world around them. Id T C KC1
relating to Outcome 1.4
Children develop strategies that directly compare and quantify measurable attributes of a wide variety of figures, objects and events drawn from the world around them. T C KC6
relating to Outcome 1.5
• Describes familiar events and routines/periods of time in everyday language (eg ‘three more sleeps to my birthday/name day’, ‘library day is Monday’).
• Associates events/routines in their lives with particular times (eg cultural celebrations, religious holidays).
• Compares lengths of time (eg ‘It
takes me longer to get home from school than you’, ‘I ate my lunch faster than you’).
• Understands that clocks can be used to show the passing of time.
• Describes temperature using everyday language (eg ‘This feels cold’).
• Responds to and uses everyday comparative and descriptive language of time (eg before, after, now, longer, sooner, day, night, summer).
• Explores the sequence of events in
familiar situations (eg getting ready for school, daily timetable).
• Sorts, orders and compares events within their day, week, month, year.
• Investigates measurement of time, seasons, days of week and months of the year.
• Investigates features and purposes of
a variety of clocks (eg digital, stopwatch, analogue, timers).
• Makes and uses digital/analogue clocks to explore o’clock/half past.
• Describes and compares temperature using everyday language (eg ‘Today it feels hotter than yesterday’).
• Understands and uses terms appropriately (eg minutes, seconds, hours, o’clock, half past).
• Sorts/orders days of week/months of
year/seasons.
• Measures the passing of time with tools such as a calendar, stopwatch and digital/analogue clock.
• Compares and orders standard
measurements of time (eg minutes are longer than seconds).
• Makes, draws and uses digital/analogue clocks to explore minutes, 5 minute intervals etc.
• Constructs devices to measure passing of time (eg calendars, sand clocks).
• Explores devices that measure temperature.
1.4 Compares and orders the measurable attributes of distance, surface, space, mass, turn/angle and time to describe the size of a wide range of familiar figures, objects and events. T C KC1 1.5 Chooses and uses a variety of strategies to measure the size of a wide variety of figures, objects and events drawn from the world around them. T C KC6
Possible starting points for planning, programming and assessing
18
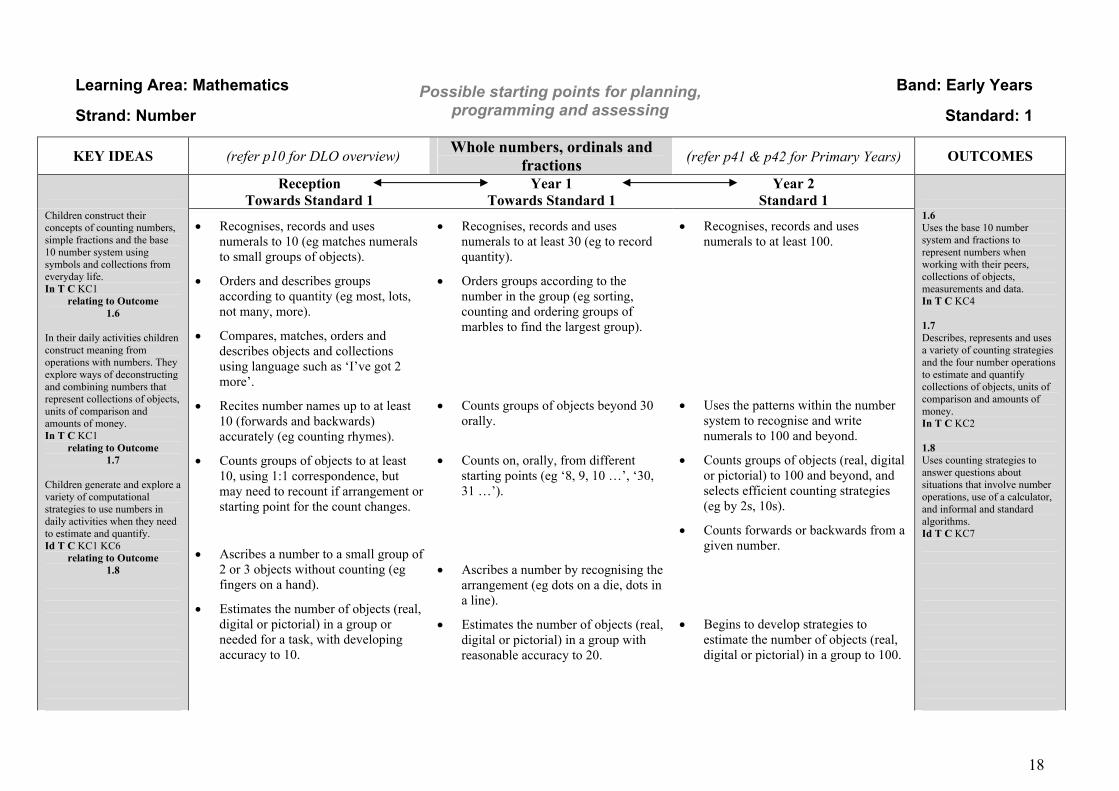
Learning Area: Mathematics Band: Early Years Strand: Number Standard: 1
KEY IDEAS Whole numbers, ordinals and fractions (refer p41 & p42 for Primary Years) OUTCOMES
Reception Towards Standard 1
Year 1 Towards Standard 1
Year 2 Standard 1
Children construct their concepts of counting numbers, simple fractions and the base 10 number system using symbols and collections from everyday life. In T C KC1
relating to Outcome 1.6
In their daily activities children construct meaning from operations with numbers. They explore ways of deconstructing and combining numbers that represent collections of objects, units of comparison and amounts of money. In T C KC1
relating to Outcome 1.7
Children generate and explore a variety of computational strategies to use numbers in daily activities when they need to estimate and quantify. Id T C KC1 KC6
relating to Outcome 1.8
• Recognises, records and uses numerals to 10 (eg matches numerals to small groups of objects).
• Orders and describes groups according to quantity (eg most, lots, not many, more).
• Compares, matches, orders and describes objects and collections using language such as ‘I’ve got 2 more’.
• Recites number names up to at least 10 (forwards and backwards) accurately (eg counting rhymes).
• Counts groups of objects to at least 10, using 1:1 correspondence, but may need to recount if arrangement or starting point for the count changes.
• Ascribes a number to a small group of 2 or 3 objects without counting (eg fingers on a hand).
• Estimates the number of objects (real, digital or pictorial) in a group or needed for a task, with developing accuracy to 10.
• Recognises, records and uses numerals to at least 30 (eg to record quantity).
• Orders groups according to the number in the group (eg sorting, counting and ordering groups of marbles to find the largest group).
• Counts groups of objects beyond 30 orally.
• Counts on, orally, from different
starting points (eg ‘8, 9, 10 …’, ‘30, 31 …’).
• Ascribes a number by recognising the arrangement (eg dots on a die, dots in a line).
• Estimates the number of objects (real, digital or pictorial) in a group with reasonable accuracy to 20.
• Recognises, records and uses numerals to at least 100.
• Uses the patterns within the number system to recognise and write numerals to 100 and beyond.
• Counts groups of objects (real, digital or pictorial) to 100 and beyond, and selects efficient counting strategies (eg by 2s, 10s).
• Counts forwards or backwards from a given number.
• Begins to develop strategies to estimate the number of objects (real, digital or pictorial) in a group to 100.
1.6 Uses the base 10 number system and fractions to represent numbers when working with their peers, collections of objects, measurements and data. In T C KC4 1.7 Describes, represents and uses a variety of counting strategies and the four number operations to estimate and quantify collections of objects, units of comparison and amounts of money. In T C KC2 1.8 Uses counting strategies to answer questions about situations that involve number operations, use of a calculator, and informal and standard algorithms. Id T C KC7
Possible starting points for planning, programming and assessing
(refer p10 for DLO overview)

19
Children construct their concepts of counting numbers, simple fractions and the base 10 number system using symbols and collections from everyday life. In T C KC1
relating to Outcome 1.6
In their daily activities children construct meaning from operations with numbers. They explore ways of deconstructing and combining numbers that represent collections of objects, units of comparison and amounts of money. In T C KC1
relating to Outcome 1.7
Children generate and explore a variety of computational strategies to use numbers in daily activities when they need to estimate and quantify. Id T C KC1 KC6
relating to Outcome 1.8
• Describes outcomes and events using ordinals: first, second, third (eg ‘I’m first, Yousef’s second, Jing’s third’).
• Engages in free play with fractions
and begins to use their own language to describe fractions (eg ‘I want the biggest bit’, ‘I’ve eaten half my sandwich’).
• Explores base 10 using concrete materials and number grids.
• Estimates, then uses, groups of tens and ones to describe and make numbers to 30.
• Begins to group objects for more efficient counting (eg counting groups by 2s, 5s, 10s).
• Begins to use ordinal numbers to 31
(eg linked to calendar).
• Describes and records position by using ordinal sequences to 10 (eg 1st, 2nd, 3rd or first, second …).
• Recognises that fractions are part of a whole.
• Uses the terms ‘half’ and ‘quarter’
with increasing precision (eg to describe something cut into two: ‘Let’s have half each’).
• Uses the structure of the base 10 number system to arrange and rearrange numbers (eg ‘27 is 27 ones or 1 ten and 17 ones or 2 tens and 7 ones’).
• Identifies odd and even numbers.
• Describes patterns by their rules (eg ‘Counting backwards means take off one number every time; counting forwards means add on one every time’; ‘1, 6, 11 is a pattern of 5 and so is 5, 10, 15’).
• Uses ordinals (words and symbols) beyond 10 (eg ‘My birthday is on the 22nd of November’).
• Uses simple fractions accurately to
describe parts of a whole or quantity (eg folds the paper into quarters; ‘We go home in ½ an hour’, ‘3 is half of 6’).
• Compares reads and writes simple fractions (eg 1/2, 1/4).
1.6 Uses the base 10 number system and fractions to represent numbers when working with their peers, collections of objects, measurements and data. In T C KC4 1.7 Describes, represents and uses a variety of counting strategies and the four number operations to estimate and quantify collections of objects, units of comparison and amounts of money. In T C KC2 1.8 Uses counting strategies to answer questions about situations that involve number operations, use of a calculator, and informal and standard algorithms. Id T C KC7
Assessment Reflective Question: Do I give my learners the opportunity to talk about their own learning?
Reception Towards Standard 1
Year 1 Towards Standard 1
Year 2 Standard 1

20
Learning Area: Mathematics Band: Early Years Strand: Number Standard: 1
KEY IDEAS Addition and subtraction (refer p42 for Primary Years) OUTCOMES
Reception Towards Standard 1
Year 1 Towards Standard 1
Year 2 Standard 1
Children construct their concepts of counting numbers, simple fractions and the base 10 number system using symbols and collections from everyday life. In T C KC1
relating to Outcome 1.6
In their daily activities children construct meaning from operations with numbers. They explore ways of deconstructing and combining numbers that represent collections of objects, units of comparison and amounts of money. In T C KC1
relating to Outcome 1.7
Children generate and explore a variety of computational strategies to use numbers in daily activities when they need to estimate and quantify. Id T C KC1 KC6
relating to Outcome 1.8
• Recognises equality/inequality in quantity using terms like ‘same as’ and ‘more’ (eg ‘She’s got the same as me’, ‘They’ve got more than us’).
• Estimates how many objects are needed to complete a task (eg ‘I think I need 3 more’).
• Understands that groups can be put
together and taken apart (eg join 2 groups with 5 or fewer objects in each, estimate total).
• Records addition/subtraction informally (eg pictures/words).
• Begins to experiment with symbols
(eg + – =).
• Explores visual representations of verbal problems (eg stamping in Kid Pix, putting out blocks).
• Identifies and describes equality/inequality between groups to 10 using numbers (eg ‘You have 3 more blocks in your pile’).
• Develops strategies to estimate totals and differences.
• Makes reasonable predictions about the outcome of combining groups of objects.
• Uses addition and subtraction to make oral statements of equality (eg ‘2 and 3 is 5’, ‘7 take away 4 makes 3’).
• Begins to use counting on or backwards for efficiency when adding/subtracting numbers.
• Uses objects to add/subtract numbers to 20.
• Records addition/subtraction informally and begins to use symbols.
• Explores possible combinations for a given number (eg 9 = 8+1 = 7+2 = 5+4 …).
• Recognises which operation to use for a particular situation.
• Solves problems relating to equality/inequality by using counting and ordering strategies.
• Estimates with greater accuracy the result of number sentences.
• Uses knowledge of number, number relationships and operations to construct statements of equality/inequality (eg ‘6 is more than 4’, ‘2+5 = 5+2’).
• Understands and uses horizontal and vertical representations of operations.
• Recognises that addition and subtraction are inverse operations (eg 2+3 = 5, 5–3 = 2).
• Writes number sentences to represent situations (beyond 20).
• Uses materials to compose and decompose numbers when adding and subtracting two-digit numbers (eg 23–8 is the same as 10 and 13–8).
1.6 Uses the base 10 number system and fractions to represent numbers when working with their peers, collections of objects, measurements and data. In T C KC4 1.7 Describes, represents and uses a variety of counting strategies and the four number operations to estimate and quantify collections of objects, units of comparison and amounts of money. In T C KC2 1.8 Uses counting strategies to answer questions about situations that involve number operations, use of a calculator, and informal and standard algorithms. Id T C KC7
Possible starting points for planning, programming and assessing
(refer p10 for DLO overview)

21
Children construct their concepts of counting numbers, simple fractions and the base 10 number system using symbols and collections from everyday life. In T C KC1
relating to Outcome 1.6
In their daily activities children construct meaning from operations with numbers. They explore ways of deconstructing and combining numbers that represent collections of objects, units of comparison and amounts of money. In T C KC1
relating to Outcome 1.7
Children generate and explore a variety of computational strategies to use numbers in daily activities when they need to estimate and quantify. Id T C KC1 KC6
relating to Outcome 1.8
• Uses a calculator to represent and
explore number.
• Develops mental computation strategies of number facts to 10 (eg using doubles and adjusting up or down, 5+5 = 10, so 4+6 = 10).
• Uses a calculator and software
programs to explore simple number operations.
• Develops and explains mental computation strategies of number facts to 20 (eg using doubles and adjusting up or down, 5+5 = 10 so 5+6 = 11).
• Begins to apply place value knowledge to compute mentally beyond 20 (eg 6+7 = 13 so 16+7 = 23).
• Uses a calculator and a range of software to compute addition and subtraction.
1.6 Uses the base 10 number system and fractions to represent numbers when working with their peers, collections of objects, measurements and data. In T C KC4 1.7 Describes, represents and uses a variety of counting strategies and the four number operations to estimate and quantify collections of objects, units of comparison and amounts of money. In T C KC2 1.8 Uses counting strategies to answer questions about situations that involve number operations, use of a calculator, and informal and standard algorithms. Id T C KC7
Assessment Reflective Question: Have I provided learners and their families the opportunity to work together and learn?
Reception Towards Standard 1
Year 1 Towards Standard 1
Year 2 Standard 1

22
Learning Area: Mathematics Band: Early Years Strand: Number Standard: 1
KEY IDEAS (refer p10 for DLO overview) Multiplication and division (refer p42 for Primary Years) OUTCOMES
Reception Towards Standard 1
Year 1 Towards Standard 1
Year 2 Standard 1
Children construct their concepts of counting numbers, simple fractions and the base 10 number system using symbols and collections from everyday life. In T C KC1
relating to Outcome 1.6
In their daily activities children construct meaning from operations with numbers. They explore ways of deconstructing and combining numbers that represent collections of objects, units of comparison and amounts of money. In T C KC1
relating to Outcome 1.7
Children generate and explore a variety of computational strategies to use numbers in daily activities when they need to estimate and quantify. Id T C KC1 KC6
relating to Outcome 1.8
• Recognises and makes groups that are of the same number.
• Groups and shares collections of objects equally.
• Records the grouping and sharing informally.
• Makes and records repeated groups of the same number.
• Relates addition of equal groups to interval counting and begins to explore multiplication (eg ‘There are 10 people, therefore there are 20 shoes’).
• Relates subtraction of equal groups to interval counting and begins to explore division (eg divides collections into equal groups for sharing).
• Recognises multiplication as repeated addition or grouping, and division as repeated subtraction or sharing.
• Experiments with multiplication symbol in relation to ‘groups of’.
1.6 Uses the base 10 number system and fractions to represent numbers when working with their peers, collections of objects, measurements and data. In T C KC4 1.7 Describes, represents and uses a variety of counting strategies and the four number operations to estimate and quantify collections of objects, units of comparison and amounts of money. In T C KC2 1.8 Uses counting strategies to answer questions about situations that involve number operations, use of a calculator, and informal and standard algorithms. Id T C KC7
Possible starting points for planning, programming and assessing

23
Learning Area: Mathematics Band: Early Years Strand: Number Standard: 1
KEY IDEAS (refer p10 for DLO overview) Money (refer p44 for Primary Years) OUTCOMES
Reception Towards Standard 1
Year 1 Towards Standard 1
Year 2 Standard 1
Children construct their concepts of counting numbers, simple fractions and the base 10 number system using symbols and collections from everyday life. In T C KC1
relating to Outcome 1.6
In their daily activities children construct meaning from operations with numbers. They explore ways of deconstructing and combining numbers that represent collections of objects, units of comparison and amounts of money. In T C KC1
relating to Outcome 1.7
Children generate and explore a variety of computational strategies to use numbers in daily activities when they need to estimate and quantify. Id T C KC1 KC6
relating to Outcome 1.8
• Sorts and compares coins and uses the language of money (eg cents, dollars, change, coin, notes).
• Understands that money may be used in exchange for goods/services.
• Recognises $ and c symbols.
• Sorts, compares, orders and names all coins.
• Uses concrete materials to explore the value of coins (eg 10c is 10).
• Makes up and records amounts of money using 5c, 10c and 20c.
• Begins to understand purchasing value of coins (eg in the school canteen) and that sometimes you may need change.
• Recognises and begins to use $ and c
symbols.
• Recognises all coins and some notes and their value by sorting, comparing and ordering them.
• Understands value of money (eg recognises that $1 is equal to 100c).
• Gives change from amounts less than $1 by counting on.
• Reads, makes up and records amounts of money to $1, and experiments with amounts greater than $1.
• Makes up and records amounts of money by counting on or using patterns (eg counting by 5s, 10s, 20s, 50s).
• Uses symbols consistently when recording money amounts.
1.6 Uses the base 10 number system and fractions to represent numbers when working with their peers, collections of objects, measurements and data. In T C KC4 1.7 Describes, represents and uses a variety of counting strategies and the four number operations to estimate and quantify collections of objects, units of comparison and amounts of money. In T C KC2 1.8 Uses counting strategies to answer questions about situations that involve number operations, use of a calculator, and informal and standard algorithms. Id T C KC7
Possible starting points for planning, programming and assessing

24
1.9 Recognises and constructs spatial and numerical patterns with concrete
F T C KC1materials, continues these patterns and predicts what comes next.F T C KC1 KC2 KC6
Children recognise, describe, predict, represent and communicate patterns.
F C KC6
Children make predictions and informal generalisations about their dailyactivities, aspects of their natural world and environments using patterns theygenerate or identify.
personal experiences and interactions with their environments. They use
F Id In C KC1 KC2 KC6
Children use mathematics to explore and describe change based on their
these predictions to make connections between the past, present and future.
Pattern and algebraic reasoning
Predicting and
generalisingusing
patterns
KEY IDEASDEVELOPMENTAL LEARNING OUTCOMESChildren develop trust and confidenceChildren develop a positive sense of self and a confidentpersonal and group identityChildren develop a sense of being connected with others and their worlds Children are intellectually inquisitive Children develop a range of thinking skillsChildren are effective communicatorsChildren develop a sense of physical wellbeing Children develop a range of physical competencies
OUTCOMES
1.10 Represents and communicates spatial and numerical patterns.F C KC2
Recognising and
continuing patterns
Investigating change
PredictingDescribing
Representing
Exploring
Predicting
Identifying
Recording
Constructing patterns
Spatial
Complementary use of ICT
Exploring
Representing
Communicating
Numerical
Predicting
Continues patterns
Identifying patterns
Daily activities Variety of attributes
Generalising
Constant patterns
Growth patterns
Natural worldDaily activities
Representing
Daily activities
Environmental
Cause and effect
Educators' questionsHow can understandings about patterns and connections help children make predictions about preferred and non-preferred future events?
How does investigating patterns and change help children understand advantage anddisadvantage?
How can children co-construct understandings and participate as teammembers through the constructing and predicting of patterns?
How can the use of spatial patterns and transformations generated with multimedia, popular culture and graphic images help children explore the effects of stereotyping?
How do you ensure that the learning environment enables all children to confidently develop and share their understanding in a range of ways?
Learners' questionsHow can I record my pattern to share with others?What is the repeating pattern and what comes next?How can I use numbers to describe mypattern?
This concept map provides a visual representation of the Key Ideas and Outcomes below. Educators may prefer to develop their own.
CONCEPT MAP: PATTERN AND ALGEBRAIC REASONING
F Id In T C KC2
1.11 Describes and represents situations from personal and family experiences and interaction with the environment where there is change over time.
BAND: Early Years

25
Learning Area: Mathematics Band: Early Years Strand: Pattern and algebraic reasoning Standard: 1
KEY IDEAS (refer p10 for DLO overview) Pattern and algebra (refer p47 & p48 for Primary Years) OUTCOMES
Reception Towards Standard 1
Year 1 Towards Standard 1
Year 2 Standard 1
Children recognise, describe, predict, represent and communicate patterns. F T C KC1 KC2 KC6
relating to Outcome 1.9
Children make predictions and informal generalisations about their daily activities, aspects of the natural world and environments, using patterns they generate or identify. F C KC6
relating to Outcome 1.10
• Sorts and describes a collection of objects.
• Recognises that repetition is what makes a pattern.
• Joins in with and follows movement patterns as a part of games, songs and rhymes.
• Copies and continues a simple pattern.
• Constructs and records simple patterns in a variety of ways, including the use of a range of software programs (eg big, little, big; gumnut, gumnut, block) and describes them using everyday language.
• Recognises patterns in design, works
of art/symbols from other cultures, and the environment.
• Sorts and classifies by more than one criterion.
• Identifies the repetitive unit in a number pattern.
• Joins in with and follows movement patterns as a part of games, songs and rhymes.
• Constructs, continues, records and describes patterns (eg 6 red, 2 blue, 6 red …).
• Identifies similarities and differences in patterns (eg ‘Your pattern goes 2, 3; mine goes 4, 1 but they’re both patterns of 5’).
• Recognises and represents the same pattern in different forms (eg 1, 1, 2 is the same pattern unit as red, red, blue).
• Produces patterns in artworks.
• Recognises and describes patterns in design, works of art/symbols from other cultures, and the environment.
• Sorts and classifies by a variety of criteria.
• Identifies, continues and constructs spatial and number patterns.
• Continues and represents what comes next in a given numerical pattern (eg 1, 3, 5, 7, …; 5, 10, 15, …).
• Joins in with and follows movement patterns as a part of games, songs and rhymes.
• Begins to use their understanding of equality and patterns in addition and subtraction facts to make further predictions (eg ‘If 1+9 = 10 and 2+8 = 10, then 3+7 must equal 10’).
• Investigates multiplication through the use of patterns.
• Describes and explains patterns on a 100 chart.
• Produces patterns in artworks.
• Recognises and talks about patterns and design, works of art/symbols from other cultures, and the environment.
1.9 Recognises and constructs spatial and numerical patterns with concrete materials, continues these patterns and predicts what comes next. F T C KC1 1.10 Represents and communicates spatial and numerical patterns. F C KC2
Assessment Reflective Question: Have I been explicit to learners about the purpose of the activity?
Possible starting points for planning, programming and assessing
26
Learning Area: Mathematics Band: Early Years Strand: Pattern and algebraic reasoning Standard: 1
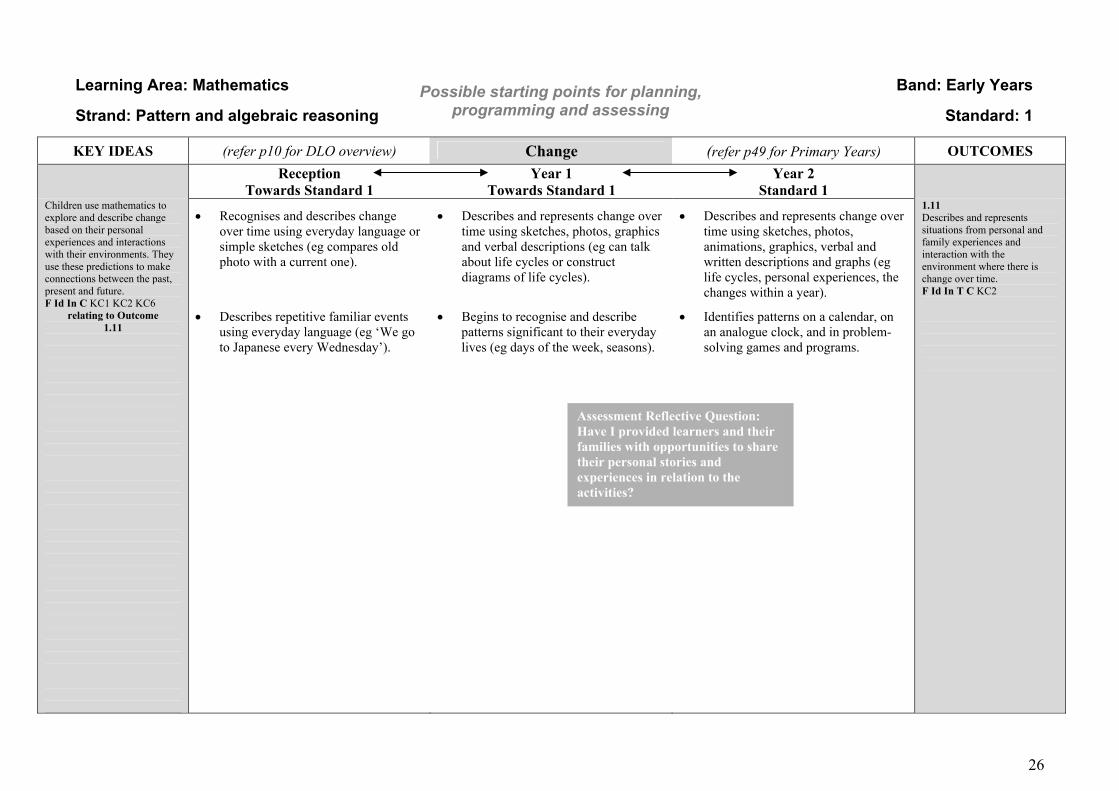
KEY IDEAS (refer p10 for DLO overview) Change (refer p49 for Primary Years) OUTCOMES
Reception Towards Standard 1
Year 1 Towards Standard 1
Year 2 Standard 1
Children use mathematics to explore and describe change based on their personal experiences and interactions with their environments. They use these predictions to make connections between the past, present and future. F Id In C KC1 KC2 KC6
relating to Outcome 1.11
• Recognises and describes change over time using everyday language or simple sketches (eg compares old photo with a current one).
• Describes repetitive familiar events
using everyday language (eg ‘We go to Japanese every Wednesday’).
• Describes and represents change over time using sketches, photos, graphics and verbal descriptions (eg can talk about life cycles or construct diagrams of life cycles).
• Begins to recognise and describe
patterns significant to their everyday lives (eg days of the week, seasons).
• Describes and represents change over time using sketches, photos, animations, graphics, verbal and written descriptions and graphs (eg life cycles, personal experiences, the changes within a year).
• Identifies patterns on a calendar, on an analogue clock, and in problem-solving games and programs.
1.11 Describes and represents situations from personal and family experiences and interaction with the environment where there is change over time. F Id In T C KC2
Assessment Reflective Question: Have I provided learners and their families with opportunities to share their personal stories and experiences in relation to the activities?
Possible starting points for planning, programming and assessing

27
Learning Area: Mathematics Band: Early Years Strand: Spatial sense and Standard: 1 geometric reasoning
KEY IDEAS (refer p10 for DLO overview) 2-D and 3-D objects (refer p50 for Primary Years) OUTCOMES
Reception Towards Standard 1
Year 1 Towards Standard 1
Year 2 Standard 1
Children explore their social and natural environments, identifying and mathematically describing key features of shapes and objects around them. In the process they learn more about themselves and their integral relationship with the environments. Id In C KC1 KC2 KC6
relating to Outcome 1.12
• Manipulates, sorts and describes 2-D shapes.
• Records/represents 2-D shapes using drawing tools.
• Identifies and names circles, squares, triangles and rectangles in pictures and in the environment.
• Manipulates and sorts 3-D objects.
• Uses informal language to describe
objects (eg round, flat, like a ball).
• Uses objects for particular purposes (eg when constructing, chooses a toothpaste box for a chimney, uses a cylinder to roll).
• Recognises, draws and labels 2-D shapes (eg circle, triangle, square, oval, rectangle) using drawing tools.
• Identifies and names a variety of 2-D
shapes in pictures and in the environment.
• Manipulates and sorts 3-D objects.
• Identifies 3-D objects in the environment (eg ‘A can is a cylinder’).
• Describes features of 3-D objects using everyday language.
• Begins to use mathematical language
to describe and label 3-D objects (eg edges, faces, cube).
• Uses knowledge of spatial properties when selecting objects to construct a model (eg chooses a cylinder for a neck).
• Investigates, identifies and describes 2-D shapes (eg pentagon, trapezium, octagon, hexagon, rhombus) using drawing tools including software.
• Explores and describes regular and irregular 2-D shapes using a variety of materials.
• Investigates, identifies and describes 3-D objects (eg ‘It has 6 square faces and 12 edges—it’s a cube’).
• Explores and represents views of 3-D objects (top view, side view, cross-sections) using materials such as play dough and a range of drawing programs.
• Explores, designs and constructs nets of 3-D objects.
• Uses language to differentiate 2-D shapes from 3-D objects.
• Uses knowledge of spatial properties when selecting objects to construct a model (eg chooses a cylinder for a rolling pin).
1.12 Uses key spatial features to describe and represent 2-D and 3-D shapes from personal and community activities. Id In C KC2
Possible starting points for planning, programming and assessing

28
Learning Area: Mathematics Band: Early Years Strand: Spatial sense and Standard: 1 geometric reasoning
KEY IDEAS Transformation and symmetry (refer p52 for Primary Years) OUTCOMES
Reception Towards Standard 1
Year 1 Towards Standard 1
Year 2 Standard 1
Children explore and experiment with simple transformations to predict and change the orientation and position of figures and objects in their daily activities. In C KC6
relating to Outcome 1.13
• Explores and experiments with arrangements of shapes by turning, flipping and sliding.
• Matches shapes one-to-one by flipping, sliding and rotating.
• Experiments with linear and rotational symmetry using a few shapes.
• Locates examples of simple
transformations and symmetry in the environment (eg tiles, bricks).
• Completes 7–8 piece puzzle with interlocking pieces by rotating, fitting and matching.
• Uses everyday language to describe the movement of shapes.
• Explores, makes and describes simple arrangements of shapes by flipping, sliding and turning.
• Makes and describes patterns with figures and objects that tessellate.
• Creates designs with linear and rotational symmetry (eg designing with pattern blocks).
• Locates examples of simple
transformations and symmetry in the environment (eg tiles, bricks).
• Completes complex jigsaws, rotating, fitting, matching and flipping puzzle pieces to fit.
• Describes simple transformations, tessellations and symmetry in the environment using everyday language.
• Explores, makes and describes arrangements of shapes by flipping, sliding and turning.
• Sorts and identifies figures that tessellate.
• Constructs symmetrical pictures in a variety of ways (eg using cut-out shapes) by flipping, turning and using templates and drawing software.
• Recognises lines of symmetry in environment/designs/shapes.
• Completes complex jigsaws (eg 3-D
puzzles, computer puzzles/simulation software, tangrams).
• Explores mathematical language to describe transformations, orientation and position (eg reflection, translation, rotation, symmetrical).
1.13 Uses simple transformations to orientate and move familiar objects and themselves when they are constructing, arranging and locating. Id C
Assessment Reflective Question: Have my learners been given the opportunity to celebrate their learning?
Possible starting points for planning, programming and assessing
(refer p10 for DLO overview)

29
Learning Area: Mathematics Band: Early Years Strand: Spatial sense and Standard: 1 geometric reasoning
KEY IDEAS (refer p10 for DLO overview) Location and position (refer p53 for Primary Years) OUTCOMES
Reception Towards Standard 1
Year 1 Towards Standard 1
Year 2 Standard 1
Children explain ways of representing themselves and familiar locations in spatial terms, and begin to think in geometric ways. Id T C KC2
relating to Outcome 1.14
• Locates objects and places related to themselves (eg ‘Put it in my bag’).
• Locates relevant objects and places
within their class unit and around the school (eg meets carer by the swings, finds way to the toilet).
• Makes and explores different pathways (eg in the sandpit, making roadways/train tracks with Lego/blocks).
• Gives and follows simple directions
(eg ‘Put it under the table’). • Uses everyday language to describe
position (eg on, off, in, out, near, far, in front, next to, behind, above, below, away from, through).
• Locates objects and places within their own experience (eg ‘Our house is next to the shops’).
• Uses pictures to describe location (eg ‘The dog is behind the tree’).
• Describes and records locations and pathways (eg makes simple models, draws simple maps, including the use of a range of software).
• Records simple maps/pathways with
increasing attention to accurate position and orientation.
• Explores the visual concept of a ‘bird’s-eye view’.
• Explores pathways through mazes.
• Gives and follows directions both in oral and written form.
• Understands and uses spatial
terminology such as right, left, back, forward, around and past.
• Finds and explains paths between particular points (eg ‘To get to the library from the canteen go …’).
• Constructs, explains and follows pathways (eg draws path from school to home, draws plan of desk top).
• Begins to interpret simple maps (eg zoo, student made maps).
• Discusses and experiments with using key features of maps (eg legends/ keys/coordinates).
• Records maps/pathways using ‘bird’s-eye view’.
• Creates paths on squared paper/digitally (eg following directions: forward 3, turn right, forward 7).
• Understands and uses spatial terminology such as between, third from the left, clockwise/anti-clockwise and half turn.
1.14 Uses everyday and positional language and makes informal maps to represent their location and familiar places. In T C
Possible starting points for planning, programming and assessing

30
EQUIPMENT
Exploring, analysing and modelling data • Dice (six-sided, multi-sided, coloured) • Spinners • Coins • Flip blocks • Grid chart • Grid paper • Electronic media (eg Kid Pix, website lists) • Newspapers • Maths dictionary (electronic and print)
Measurement • Maths dictionary (electronic and print) • Clocks: analogue, digital • Timers: sand, egg, digital, stopwatches, ticker timers,
candles, sundials, water, shadow, kitchen • Calendars, timetables • Rulers, tape measures, trundle wheels, height chart • Rotagrams • Scales: bathroom, balance, kitchen • Spring balances • Weights • Thermometer • Containers: digital, uniform, non-uniform, standard
measure • Junk materials • Straws, sticks, lids • Blocks • Computers
Number • Maths dictionary (electronic and print) • Arbitrary counting units/blocks • MAB, popsticks, rubber bands, base 10 boards • Grids (blank and numbered) • Dice, spinners, flip blocks, variety of counters/blocks • Johnson lines • Cards: playing, dot, number • Dominoes • Number charts (different languages and structures) • Number lines • Number games (eg matching, ordering) • Electronic media (eg calculators, websites) • Grids
Pattern and algebraic reasoning • Grid paper • Number charts • Junk materials (eg keys, buttons, gumnuts, seeds,
fabric, wrapping paper) • Blocks and counters • Regular and irregular figures and objects • Calendars, timetables, diaries • Weather charts • Electronic media (eg Kid Pix, calculator) • Musical instruments, tape recorder, music • Pattern making materials: stamps, paints, coloured
paper shapes/cut-outs, paper shape punchers • Maths dictionary (electronic and print)
Spatial sense and geometric reasoning • Maths dictionary (electronic and print) • Junk materials (eg cardboard, boxes, cylinders) • Blocks (eg pattern, wooden cubes) • 2-D shapes and 3-D objects • Grids, grid paper, dot paper • Electronic media: drawing and design programs,
Lego, websites • Commercial maps, mazes, street directories, school
maps • Play dough, plasticine, clay • Geoboards • Construction sets: polydrons, geoshapes

31
Students engage with data by formulating and answering questions, and collecting, organising and representing data in order to investigate and understand the world around them. Students use statistical methods to reduce, analyse and interpret data, while critically evaluating the cultural and social inclusivity ofthe samples used. Students engage with data to understand, analyse and apply notions of chance and probability in the social and natural worlds.
BAND: Primary Years
KEY IDEASStudents generate and analyse data from a diverse range of sources (including online) and perspectives to investigate situations drawn from their personal lives and the world around them. They use this data to explore patterns and relationships, and to inform their choices and actions. Students draw conclusions from data they collect from diverse sources and perspectives, using descriptions of the spread of data and of relationships within it. They make predictions and informal inferences for larger populations or similar situations, and communicate their conclusions and predictions to a variety of audiences. Students refine their understanding of chance and randomness by using data from their daily activities to describe possible outcomes and their likelihood. They analyse trends and relationships and make predictions about possibilities in the future.
OUTCOMES3.1 Poses questions, determines a sample, collects and records data including related data, represents sample data in order to investigate the world around them. In T C KC1 KC6 3.2 Summarises, recognizes bias, draws conclusions and makes conjectures about data. Understands how different organization and representations influence data interpretation. In T KC1 3.3 Analyses data to search for patterns in events where the range of outcomes is generated by situations where chance plays a role. F In T KC1
OUTCOMES2.1 Poses questions, explores patterns, and collects relevant data. They record and represent the data and also use data presented by others. T C KC1 KC2 2.2 Describes key features of data and draws conclusions from similar data from different groups. They make general predictions based on results. F T C KC1 KC2 KC6 2.3 Describes situations where chance plays a role; collects, organises and represents data to identify possible outcomes; and uses comparative language to describe the likelihood of each outcome. F T
Exploring, analysing and modelling data
CollectingPosing
questions Issues
Learners' own
LocalGlobal
Drawing conclusions
Predicting
Constructing arguments
Recommending action
Communicating(oral, written, ICTs)
Surveys
Sampling techniques
Representing
Graphs (mostly ICTs)Choose from- bar graphs- column graphs- pie charts- line graphs- other
Criticallyanalysing
Collection techniques
Data representation
Interpretation
Posing questionsUsing
data fromdaily
activities
Identifies possible outcomes
Describes likelihood
Uses language of chance
Makes predictions
Whose interest?
Whose question?
What are other questions?
Chance
Generating, analysing
and informing
Reviewingand
predicting
Tables, spreadsheets
Observations
Measurements
Taking action Describing
spread
Essential Learnings,, Equity Cross-curriculum Perspectives and Enterprise and Vocational Education, embedded in the SACSA Framework's Key Ideas and Outcomes, can be developed through critical questions such as: How can data help learners to better understand the needs and interests of themselves, groups and other people?
How can data help young people to understand and address issues relevant to their lives and affecting human and community wellbeing?
How can learners use data to develop enterprising and creative solutions to issues of personal, social and cultural significance? How do different ways of communicating data serve different purposes and interests? What and whose interests (eg personal, social, political and economic) are reflected in, and served by, this data?
This concept map provides a visual representation of the Key Ideas and Outcomes below. Educators may prefer to develop their own.
CONCEPT MAP: EXPLORING, ANALYSING AND MODELLING DATA
KEY IDEAS
(eg internet, ABS)Accessing existing data

32
Learning Area: Mathematics Band: Primary Years Strand: Exploring, analysing and Standards: 2 & 3 modelling data
KEY IDEAS (refer p12 for Early Years) Data collection and representation (refer p55 for Middle Years) OUTCOMES Year 3
Towards Standard 2 Year 4
Standard 2 Year 5
Towards Standard 3 Students generate and analyse data from a diverse range of sources (including online) and perspectives to investigate situations drawn from their personal lives and the world around them. They use this data to explore patterns and relationships, and to inform their choices and actions. Id T C KC1
relating to Outcome 2.1
Students engage with data by formulating and answering questions and collecting, organising and representing data in order to investigate and understand the world around them. In T C KC2 KC6
relating to Outcome 3.1
KEY TO SYMBOLS Essential Learnings: F Futures Id Identity In Interdependence T Thinking C Communication
Key Competencies: KC1 collecting, analysing and organising information KC2 communicating ideas and information KC3 planning and organising activities KC4 working with others and in teams KC5 using mathematical ideas and techniques KC6 solving problems KC7 using technology
• Develops questions to collect data.
• Uses tallying to collect data (eg 1111).
• Constructs bar, column and picture graphs from collected data.
• Recognises, interprets and constructs scaled picture graphs (eg 1 car = 5 cars).
• Collects, organises, represents, analyses and saves data electronically (eg draws up a table and chooses a pictorial representation).
• Recognises and begins to use graph labels, titles, and x and y axes.
• Clarifies questions to decide what data to collect.
• Prepares questionnaires to enable data collection.
• Collects and organises data (eg uses tables, charts, tallies).
• Constructs bar and column graphs using a scale and labelled axes, including using graphing software.
• Collects, organises, analyses and saves data electronically.
• Recognises and uses graph labels, titles, and x and y axes.
• Prepares questionnaires and surveys to enable data collection.
• Collects, organises, analyses, displays and saves data on paper and using a range of software (eg spreadsheets).
• Constructs and interprets line, bar, column and composite graphs using a scale.
• Recognises pie graphs.
• Uses graph labels, titles, and x and y axes confidently.
2.1 Poses questions, explores patterns, and collects relevant data. They record and represent the data, and also use data presented by others. T C KC1 KC2 3.1 Poses questions, determines a sample, collects and records data including related data, represents sample data in order to investigate the world around them. In T C KC1 KC6
Assessment Reflective Question: Have I provided to my learners opportunities for further learning in meaningful ways?
Possible starting points for planning, programming and assessing

33
Learning Area: Mathematics Band: Primary Years Strand: Exploring, analysing Standards: 2 & 3 and modelling data
KEY IDEAS (refer p12 for Early Years) Data collection and representation (refer p55 for Middle Years) OUTCOMES Year 3
Towards Standard 2 Year 4
Standard 2 Year 5
Towards Standard 3 Students draw conclusions from data they collect from diverse sources and perspectives, using descriptions of the spread of the data and of relationships within it. They make predictions and informal inferences for larger populations or similar situations, and communicate their conclusions and predictions to a variety of audiences. F Id T C KC1 KC2 KC6
relating to Outcome 2.2
Students use statistical methods to reduce, analyse and interpret data, while critically evaluating the cultural and social inclusivity of the samples used. In T KC1
relating to Outcome 3.2
• Recognises and interprets bar, column and picture graphs.
• Explores how data can be used to present a particular point of view (eg in advertising).
• Discusses future plans based on data collected.
• Interprets information from tables, and bar, column and picture graphs.
• Continues to explore how data can be used to present a particular point of view (eg in advertising).
• Discusses and makes plans based on data collected.
• Reads and interprets graphs from real-life applications (eg graphs and tables found in newspapers).
• Analyses and makes judgments based on statistical information and makes predictions and generalisations.
• Understands how data can be used to present a particular point of view (eg in advertising).
2.2 Describes key features of data and draws conclusions from similar data from different groups. They make general predictions based on results. F T C KC1 KC2 KC6 3.2 Summarises, recognises bias, draws conclusions and makes conjectures about data. Understands how different organisation and representations influence data interpretation. In T KC1
Assessment Reflective Question: Have I provided to my learners opportunities for further learning in meaningful ways?
Possible starting points for planning, programming and assessing

34
Learning Area: Mathematics Band: Primary Years Strand: Exploring, analysing and Standards: 2 & 3 modelling data
KEY IDEAS (refer p14 for Early Years) Chance, data and probability (refer p56 for Middle Years) OUTCOMES Year 3
Towards Standard 2 Year 4
Standard 2 Year 5
Towards Standard 3 Students refine their understanding of chance and randomness by using data from their daily activities to describe possible Outcomes and their likelihood. They analyse trends and relationships and make predictions about possibilities in the future. F Id T KC1 KC6
relating to Outcome 2.3
Students engage with data to understand, analyse and apply notions of chance and probability in the social and natural worlds. F In T KC1
relating to Outcome 3.3
• Identifies events/activities that have an element of chance (eg likely or unlikely, possible or impossible).
• Predicts and records outcomes of simple chance events (eg tossing coins or flip tiles).
• Uses tallying to record events.
• Appreciates that actions can bias the likelihood of outcomes (eg survey of boys’ favourite TV programs or sports).
• Discusses future plans and actions based upon their understanding of a familiar chance situation.
• Identifies events/activities that have an element of chance.
• Predicts possible results of
experiments (eg more likely/less likely).
• Records outcomes of chance experiments (eg coin toss, dice roll).
• Collects, organises, analyses and
saves data electronically.
• Uses whole numbers and fractions to
describe the likelihood of outcomes (eg 50:50 chance, ½ a chance).
• Identifies events/activities in everyday situations that have an element of chance.
• Predicts possible events from least likely to most likely and identifies trends.
• Conducts experiments, records and organises the data and compares results to make predictions.
• Collects, organises, analyses and saves data electronically using a range of software (eg Excel, Claris Works, Kid Pix).
• Uses whole numbers and fractions to describe the likelihood of outcomes (eg 1 in 6 chance of drawing a 4).
• Uses common percentages to describe likelihood of outcomes (eg 50%, 25%, 75%, 100% chance).
2.3 Describes situations where chance plays a role; collects, organises and represents data to identify possible outcomes; and uses comparative language to describe the likelihood of each outcome. F T 3.3 Analyses data to search for patterns in events where the range of outcomes is generated by situations where chance plays a role. F In T KC1
Possible starting points for planning, programming and assessing

35
Learning Area: Mathematics Band: Primary Years Strand: Measurement Standards: 2 & 3
KEY IDEAS (refer p15 for Early Years) Length, perimeter and area (refer p57 for Middle Years) OUTCOMES Year 3
Towards Standard 2 Year 4
Standard 2 Year 5
Towards Standard 3 Students refine their concepts of measurable attributes and units of comparison. They choose the most appropriate attributes and units to quantify 2-D figures, 3-D solids and time for a wide variety of purposes, and are able to justify their choices to others. T C KC2
relating to Outcome 2.4 Students use direct measurement strategies and relationships between particular attributes to quantify the size of 2-D figures, 3-D solids and time. They identify, plan and act to address measurement problems. T C KC3
relating to Outcome 2.5 Students understand attributes, units and systems of measurement. They research and report on how measurement is used in the home, community and paid workforce, and recognise transferability between these and other contexts. In T C KC1 KC2 KC6
relating to Outcome 3.4 Students recognise and develop and report on connections between mathematical ideas and representations. They employ logical strategies to solve problems in measurement situations, and reflect on the reasonableness of their answers. T KC1 KC2 KC6
relating to Outcome 3.5
• Sorts, classifies, orders, describes and compares objects by length using non-standard and standard units.
• Chooses appropriate metric units (mm, cm, m) for measuring and understands these abbreviations.
• Uses a variety of length measuring tools (eg rulers, trundle wheels, tape measures, own measuring devices).
• Practises measuring metres and centimetres.
• Develops a range of estimating strategies.
• Understands and recalls length measurement (eg 100cm = 1m).
• Calculates perimeter of regular
shapes.
• Investigates area in cm² using
concrete materials.
• Recognises and uses standard metric units (mm, cm, m, km).
• Uses a variety of length measuring
tools (eg rulers, trundle wheels, tape measures).
• Understands the meanings of prefixes such as milli and centi.
• Understands and recalls length
measurements (eg 1km = 1000m 10mm = 1cm).
• Estimates and measures the perimeter of regular shapes in cm.
• Estimates, measures, compares and
records the area of regular surfaces in cm².
• Uses a range of estimation and measuring strategies to refine accuracy in measuring length.
• Recognises the relationship between units of length and writes them in decimal form (eg 156cm = 1.56m).
• Converts measurements (eg m to cm, m to km).
• Estimates, measures, compares and records the perimeter of regular shapes.
• Estimates, measures, compares and records the area of regular shapes in cm² and m².
• Understands that the area of a square or rectangle can be found by using the formula A = (LxB) or A = (LxW).
2.4 Chooses, estimates and uses metric units to measure attributes of figures and objects; orders events or cycles of events; estimates the duration and time of events; constructs and uses measuring tools, and explains that all measurement is approximate and that some tools increase precision. T KC2 2.5 Uses direct measuring strategies to represent, communicate and record measurements graphically in symbols with correct units and performs simple operations on measures. T C KC2 3.4 Selects appropriate attributes and systems to measure for a variety of purposes and reports on how measurement is used in social practice. In T C KC1 KC2 3.5 Uses a range of standard tools to measure relationships between distances and other measurable attributes to calculate size. T
Possible starting points for planning, programming and assessing

36
Learning Area: Mathematics Band: Primary Years Strand: Measurement Standards: 2 & 3
KEY IDEAS (refer p16 for Early Years) Volume and capacity (refer p59 for Middle Years) OUTCOMES Year 3
Towards Standard 2 Year 4
Standard 2 Year 5
Towards Standard 3 Students refine their concepts of measurable attributes and units of comparison. They choose the most appropriate attributes and units to quantify 2-D figures, 3-D solids and time for a wide variety of purposes, and are able to justify their choices to others. T C KC2
relating to Outcome 2.4 Students use direct measurement strategies and relationships between particular attributes to quantify the size of 2-D figures, 3-D solids and time. They identify, plan and act to address measurement problems. T C KC3
relating to Outcome 2.5 Students understand attributes, units and systems of measurement. They research and report on how measurement is used in the home, community and paid workforce, and recognise transferability between these and other contexts. In T C KC1 KC2 KC6
relating to Outcome 3.4 Students recognise and develop and report on connections between mathematical ideas and representations. They employ logical strategies to solve problems in measurement situations, and reflect on the reasonableness of their answers. T KC1 KC2 KC6
relating to Outcome 3.5
• Estimates, measures and compares the capacity of objects of relevance to themselves, such as water bottles.
• Records capacity using litres and millilitres.
• Memorises and recalls 1000mL = 1L.
• Understands and uses mL and L.
• Estimates, measures, compares and records capacity using litres and millilitres.
• Estimates, measures, compares and records volume using cubic centimetres.
• Memorises and recalls 1000mL = 1L.
• Compares simple fractional amounts (eg ½L = 500mL).
• Writes common capacity measurements in decimal form (eg 1.25L).
• Estimates, measures, compares and records volume and capacity using litres, millilitres and cubic centimetres.
• Memorises and recalls 1000mL =
1L).
• Writes common capacity measurements in decimal form (eg 1.25L).
• Converts mL to L, L to mL.
• Constructs 3-D objects using standard cubic units and online resources.
• Measures the volume of shapes by counting the number of cm cubes.
• Recognises that 1cm3 = 1mL.
2.4 Chooses, estimates and uses metric units to measure attributes of figures and objects; orders events or cycles of events; estimates the duration and time of events; constructs and uses measuring tools, and explains that all measurement is approximate and that some tools increase precision. T KC2 2.5 Uses direct measuring strategies to represent, communicate and record measurements graphically in symbols with correct units and performs simple operations on measures. T C KC2 3.4 Selects appropriate attributes and systems to measure for a variety of purposes and reports on how measurement is used in social practice. In T C KC1 KC2 3.5 Uses a range of standard tools to measure relationships between distances and other measurable attributes to calculate size. T
Possible starting points for planning, programming and assessing

37
Learning Area: Mathematics Band: Primary Years Strand: Measurement Standards: 2 & 3
KEY IDEAS (refer p16 for Early Years) Mass (refer p60 for Middle Years) OUTCOMES Year 3
Towards Standard 2 Year 4
Standard 2 Year 5
Towards Standard 3 Students refine their concepts of measurable attributes and units of comparison. They choose the most appropriate attributes and units to quantify 2-D figures, 3-D solids and time for a wide variety of purposes, and are able to justify their choices to others. T C KC2
relating to Outcome 2.4 Students use direct measurement strategies and relationships between particular attributes to quantify the size of 2-D figures, 3-D solids and time. They identify, plan and act to address measurement problems. T C KC3
relating to Outcome 2.5 Students understand attributes, units and systems of measurement. They research and report on how measurement is used in the home, community and paid workforce, and recognise transferability between these and other contexts. In T C KC1 KC2 KC6
relating to Outcome 3.4 Students recognise and develop and report on connections between mathematical ideas and representations. They employ logical strategies to solve problems in measurement situations, and reflect on the reasonableness of their answers. T KC1 KC2 KC6
relating to Outcome 3.5
• Sorts, classifies, orders, describes and compares objects found at home and school by mass using grams and kilograms.
• Chooses most appropriate unit to measure mass.
• Estimates, measures, compares and records mass using kilograms and grams up to 2kg.
• Experiences measuring in grams and kilograms up to 5kg.
• Understands and recalls 1000g = 1kg.
• Uses comparative language to describe mass (eg heavy, heavier, heaviest).
• Sorts, classifies, orders, describes and compares objects by mass using grams and kilograms.
• Chooses most appropriate unit of
measure and justifies their choice.
• Measures accurately in grams and kilograms using everyday objects up to 5kg.
• Understands and recalls 1000g = 1kg.
• Compares fractional amounts (eg ½ kg = 500g).
• Recognises conversions (eg 2kg = 2000g).
• Estimates, measures, compares and records mass using kilograms and grams.
• Compares then chooses most
appropriate unit of measure.
• Converts tonnes to kilograms, kilograms to tonnes, kilograms to grams and grams to kilograms.
• Understands and recalls 1000g = 1kg,
500g = ½ kg or 0.5kg.
• Understands the meaning of the prefix kilo.
• Uses simple mass measurements in decimal form (eg 1.5kg = 1500g = 1½kg).
2.4 Chooses, estimates and uses metric units to measure attributes of figures and objects; orders events or cycles of events; estimates the duration and time of events; constructs and uses measuring tools, explains that all measurement is approximate and that some tools increase precision. T KC2 2.5 Uses direct measuring strategies to represent, communicate and record measurements graphically in symbols with correct units and performs simple operations on measures. T C KC2 3.4 Selects appropriate attributes and systems to measure for a variety of purposes and reports on how measurement is used in social practice. In T C KC1 KC2 3.5 Uses a range of standard tools to measure relationships between distances and other measurable attributes to calculate size. T
Possible starting points for planning, programming and assessing

38
Learning Area: Mathematics Band: Primary Years Strand: Measurement Standards: 2 & 3
KEY IDEAS (refer p17 for Early Years) Time (refer p61 for Middle Years) OUTCOMES
Students refine their concepts of measurable attributes and
Year 3 Towards Standard 2
Year 4 Standard 2
Year 5 Towards Standard 3
units of comparison. They choose the most appropriate attributes and units to quantify 2-D figures, 3-D solids and time for a wide variety of purposes, and are able to justify their choices to others. T C KC2
relating to Outcome 2.4 Students use direct measurement strategies and relationships between particular attributes to quantify the size of 2-D figures, 3-D solids and time. They identify, plan and act to address measurement problems. T C KC3
relating to Outcome 2.5 Students understand attributes, units and systems of measurement. They research and report on how measurement is used in the home, community and paid workforce, and recognise transferability between these and other contexts. In T C KC1 KC2 KC6
relating to Outcome 3.4 Students recognise and develop and report on connections between mathematical ideas and representations. They employ logical strategies to solve problems in measurement situations, and reflect on the reasonableness of their answers. T KC1 KC2 KC6
relating to Outcome 3.5
• Draws and makes clocks (eg analogue and digital).
• Reads and writes the time in hours and minutes on digital clocks.
• Uses ‘to’ and ‘past’ terms.
• Applies timeframes (eg 24 hours in a day, 60 minutes in an hour, 60 seconds in a minute, 7 days in a week, 12 months in a year, 365 days in a year, 366 days in a leap year).
• Records times as am or pm.
• Reads and writes the time in hours and half hours on analogue clocks.
• Converts digital time to ‘past’ the hour or ‘to’ the hour.
• Reads and interprets a year calendar.
• Reads and writes clock time in
quarter hour and 5 minute intervals in analogue and digital time.
• Uses ‘to’ and ‘past’ terms.
• Understands and recalls 24 hours in a day, 60 minutes in an hour, 60 seconds in a minute, 7 days in a week, 12 months in a year, 365 days in a year, 366 days in a leap year, 10 years in a decade, and 100 years in a century.
• Records times as am or pm.
• Converts analogue to digital time in 5
and 1 minute intervals.
• Reads and interprets calendars from different times and cultures, and timetables (eg class timetable).
• Reads and writes clock time in
1-minute intervals in analogue and digital forms.
• Understands and recalls 24 hours in a day, 60 minutes in an hour, 60 seconds in a minute, 7 days in a week, 12 months in a year, 365 days in a year, 366 days in a leap year, 10 years in a decade, and 100 years in a century.
• Reads and interprets calendars from
different times and cultures, and timetables (eg bus, train, TV guide), and uses online resources to access timetables and world times.
• Uses software to create calendars.
2.4 Chooses, estimates and uses metric units to measure attributes of figures and objects; orders events or cycles of events; estimates the duration and time of events; constructs and uses measuring tools, explains that all measurement is approximate and that some tools increase precision. T KC2 2.5 Uses direct measuring strategies to represent, communicate and record measurements graphically in symbols with correct units and performs simple operations on measures. T C KC2 3.4 Selects appropriate attributes and systems to measure for a variety of purposes and reports on how measurement is used in social practice. In T C KC1 KC2 3.5 Uses a range of standard tools to measure relationships between distances and other measurable attributes to calculate size. T
Possible starting points for planning, programming and assessing

39
Students refine their concepts of measurable attributes and units of comparison. They choose the most appropriate attributes and units to quantify 2-D figures, 3-D solids and time for a wide variety of purposes, and are able to justify their choices to others. T C KC2
relating to Outcome 2.4
Students use direct measurement strategies and relationships between particular attributes to quantify the size of 2-D figures, 3-D solids and time. They identify, plan and act to address measurement problems. T C KC3
relating to Outcome 2.5
Students understand attributes, units and systems of measurement. They research and report on how measurement is used in the home, community and paid workforce, and recognise transferability between these and other contexts. In T C KC1 KC2 KC6
relating to Outcome 3.4
Students recognise and develop and report on connections between mathematical ideas and representations. They employ logical strategies to solve problems in measurement situations, and reflect on the reasonableness of their answers. T KC1 KC2 KC6
relating to Outcome 3.5
• Estimates length of time in seconds and minutes to 2 minutes.
• Develops a timeline of daily events.
• Investigates and interprets Roman numerals I–XII.
• Estimates length of time in seconds and minutes to 5 minutes.
• Develops, creates and uses timelines (eg birth to Year 4).
• Interprets patterns of numbers (eg
Roman numerals such as C, M, L).
• Estimates length of time in seconds and minutes to 10 minutes.
• Uses a stopwatch and/or digital watch to time events accurately.
• Converts 24 hour clock time to analogue time.
• Calculates differences in time (eg time between 11.17am and 12.49pm).
• Converts hours to minutes.
• Problem solves using time (eg How many minutes in 3½ hours?).
• Develops, creates and uses timelines (eg important social and cultural dates of the 20th Century).
2.4 Chooses, estimates and uses metric units to measure attributes of figures and objects; orders events or cycles of events; estimates the duration and time of events; constructs and uses measuring tools, and explains that all measurement is approximate and that some tools increase precision. T KC2 2.5 Uses direct measuring strategies to represent, communicate and record measurements graphically in symbols with correct units and performs simple operations on measures. T C KC2 3.4 Selects appropriate attributes and systems to measure for a variety of purposes and reports on how measurement is used in social practice. In T C KC1 KC2 3.5 Uses a range of standard tools to measure relationships between distances and other measurable attributes to calculate size. T
Year 5 Towards Standard 3
Year 4 Standard 2
Year 3 Towards Standard 2

40
Learning Area: Mathematics Band: Primary Years Strand: Measurement Standards: 2 & 3
KEY IDEAS (refer p17 for Early Years) Temperature (refer p62 for Middle Years) OUTCOMES Year 3
Towards Standard 2 Year 4
Standard 2 Year 5
Towards Standard 3 Students refine their concepts of measurable attributes and units of comparison. They choose the most appropriate attributes and units to quantify 2-D figures, 3-D solids and time for a wide variety of purposes, and are able to justify their choices to others. T C KC2
relating to Outcome 2.4 Students use direct measurement strategies and relationships between particular attributes to quantify the size of 2-D figures, 3-D solids and time. They identify, plan and act to address measurement problems. T C KC3
relating to Outcome 2.5 Students understand attributes, units and systems of measurement. They research and report on how measurement is used in the home, community and paid workforce, and recognise transferability between these and other contexts. In T C KC1 KC2 KC6
relating to Outcome 3.4 Students recognise and develop and report on connections between mathematical ideas and representations. They employ logical strategies to solve problems in measurement situations, and reflect on the reasonableness of their answers. T KC1 KC2 KC6
relating to Outcome 3.5
• Practises using a thermometer.
• Reads the temperature scale on a thermometer.
• Understands the terms maximum and
minimum temperature.
• Estimates, measures, records and orders temperatures in degrees Celsius.
• Practises using a thermometer.
• Reads a temperature scale.
• Knows and understands temperatures
at boiling and freezing points.
• Uses and records maximum and minimum temperatures.
• Records and graphs temperature readings (eg using graphing software).
• Estimates and then measures accurately and records temperatures in degrees Celsius using a thermometer.
• Demonstrates understanding of minus degrees Celsius (eg –10°C).
• Records and graphs temperature readings (eg maximum and minimum temperatures over a day, a week) and uses online resources to compare world temperatures.
• Compares temperatures of localities (eg Darwin and Hobart, and other places in the world).
• Understands that some countries use the imperial system.
• Demonstrates awareness of higher temperatures (eg oven temperatures for cooking).
2.4 Chooses, estimates and uses metric units to measure attributes of figures and objects; orders events or cycles of events; estimates the duration and time of events; constructs and uses measuring tools, and explains that all measurement is approximate and that some tools increase precision. T KC2 2.5 Uses direct measuring strategies to represent, communicate and record measurements graphically in symbols with correct units and performs simple operations on measures. T C KC2 3.4 Selects appropriate attributes and systems to measure for a variety of purposes and reports on how measurement is used in social practice. In T C KC1 KC2 3.5 Uses a range of standard tools to measure relationships between distances and other measurable attributes to calculate size. T
Possible starting points for planning, programming and assessing
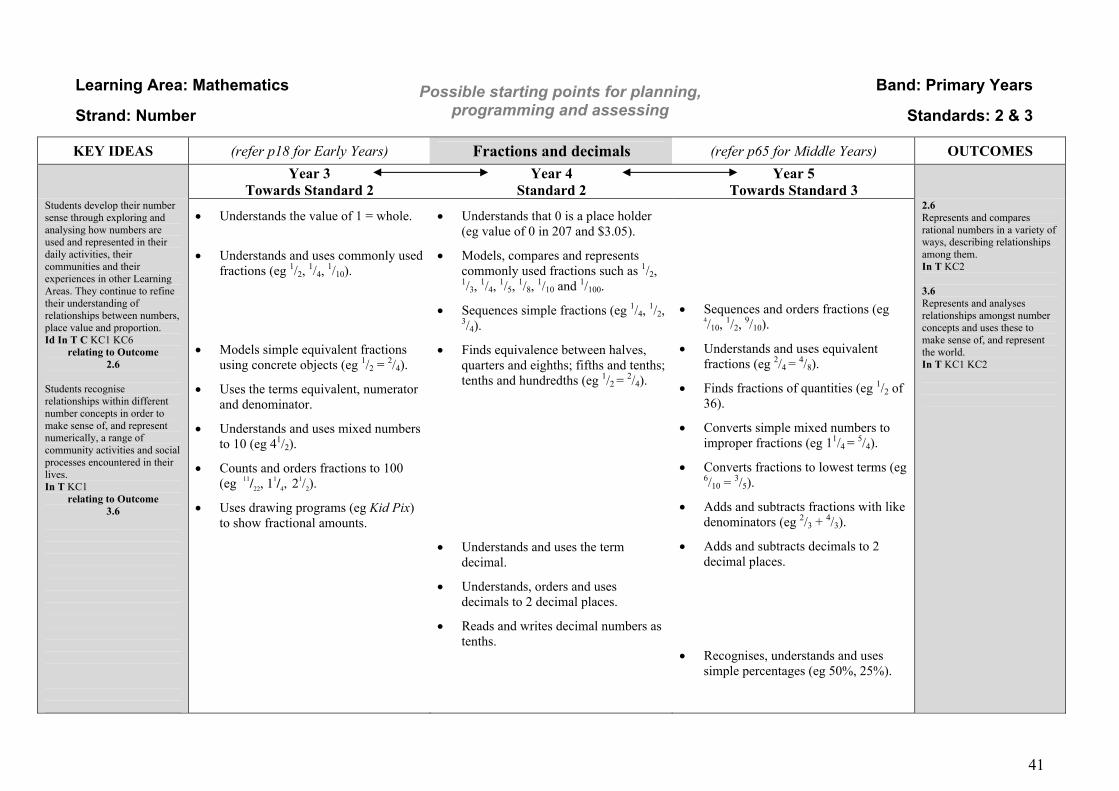
41
Learning Area: Mathematics Band: Primary Years Strand: Number Standards: 2 & 3
KEY IDEAS (refer p18 for Early Years) Fractions and decimals (refer p65 for Middle Years) OUTCOMES
Year 3 Towards Standard 2
Year 4 Standard 2
Year 5 Towards Standard 3
Students develop their number sense through exploring and analysing how numbers are used and represented in their daily activities, their communities and their experiences in other Learning Areas. They continue to refine their understanding of relationships between numbers, place value and proportion. Id In T C KC1 KC6
relating to Outcome 2.6
Students recognise relationships within different number concepts in order to make sense of, and represent numerically, a range of community activities and social processes encountered in their lives. In T KC1
relating to Outcome 3.6
• Understands the value of 1 = whole.
• Understands and uses commonly used
fractions (eg 1/2, 1/4, 1/10).
• Models simple equivalent fractions using concrete objects (eg 1/2 = 2/4).
• Uses the terms equivalent, numerator and denominator.
• Understands and uses mixed numbers to 10 (eg 41/2).
• Counts and orders fractions to 100 (eg 11/22, 1
1/4, 21/2).
• Uses drawing programs (eg Kid Pix) to show fractional amounts.
• Understands that 0 is a place holder (eg value of 0 in 207 and $3.05).
• Models, compares and represents commonly used fractions such as 1/2, 1/3, 1/4, 1/5, 1/8, 1/10 and 1/100.
• Sequences simple fractions (eg 1/4, 1/2, 3/4).
• Finds equivalence between halves, quarters and eighths; fifths and tenths; tenths and hundredths (eg 1/2 = 2/4).
• Understands and uses the term decimal.
• Understands, orders and uses decimals to 2 decimal places.
• Reads and writes decimal numbers as tenths.
• Sequences and orders fractions (eg 4/10, 1/2, 9/10).
• Understands and uses equivalent fractions (eg 2/4 = 4/8).
• Finds fractions of quantities (eg 1/2 of 36).
• Converts simple mixed numbers to improper fractions (eg 11/4 = 5/4).
• Converts fractions to lowest terms (eg 6/10 = 3/5).
• Adds and subtracts fractions with like denominators (eg 2/3 + 4/3).
• Adds and subtracts decimals to 2 decimal places.
• Recognises, understands and uses simple percentages (eg 50%, 25%).
2.6 Represents and compares rational numbers in a variety of ways, describing relationships among them. In T KC2 3.6 Represents and analyses relationships amongst number concepts and uses these to make sense of, and represent the world. In T KC1 KC2
Possible starting points for planning, programming and assessing

42
Learning Area: Mathematics Band: Primary Years Strand: Number Standards: 2 & 3
KEY IDEAS Whole number + – x ÷ (refer p63 for Middle Years) OUTCOMES
Year 3 Towards Standard 2
Year 4 Standard 2
Year 5 Towards Standard 3
Students develop their understanding of the four operations (+ - x ÷) and the relationships between them. They use mathematical terminology, symbols and conventions to communicate their understanding to others. T C KC2
relating to Outcome 2.7
Students use their number sense to refine their ability to estimate, calculate and present using spreadsheets, measurements and amounts of money in their personal, family and community activities, and in their experiences in other Learning Areas. Id T C KC7
relating to Outcome 2.8
Students understand the meaning of operations and how they relate to each other, and can communicate these through a range of media, including information and communication technologies. In T C KC2 KC7
relating to Outcome 3.7
Students use computational tools and strategies, and understand and represent the thinking processes employed in solving problems involving proportions. T KC6
relating to Outcome 3.8
• Practises, understands and recalls basic addition and subtraction and number facts to 20.
• Understands that the order of numbers in addition does not change the result.
• Demonstrates that addition and subtraction are inverse operations (eg 14+3 = 17 and 17–3 = 14, subtracting 3 is the inverse of adding 3 and so 3–3 = 0).
• Understands the place value of digits up to 1000.
• Consolidates number concepts using online resources and software.
• Adds 2 and 3 digit numbers with and without exchanging.
• Subtracts 2 and 3 digit numbers with and without exchanging.
• Practises, understands and recalls basic addition and subtraction number facts to 50.
• Writes, orders and expands 2, 3 and 4 digit numbers.
• Reads and records numbers to 1000 using numerals and words.
• Adds up to 4 digit numbers with and without exchanging.
• Subtracts up to 4 digit numbers with and without exchanging.
• Determines prime, composite and square numbers.
• Counts, orders, reads and records 2, 3, 4 and 5 digit numbers (place value, expanding numbers).
• Reads, writes and records 5 and 6
digit numbers using numerals and words.
• Writes numbers in expanded form to 100 000.
• Rounds off to the nearest thousand.
• Estimates, approximates and performs mental computations to 4 numbers.
• Practises, understands and recalls basic addition and subtraction number facts to 100.
• Adds, with exchanging, up to 5 and 6 digit numbers.
• Subtracts, with exchanging, up to 5 and 6 digit numbers.
2.7 Describes, represents and applies operations with whole numbers. T C KC2 2.8 Uses a variety of estimating and calculating strategies, including memorising addition and subtraction facts with whole numbers, and with money represented as decimals. Id In T 3.7 Describes, represents and analyses operations with rational numbers and relationships between them. In T C KC1 KC2 3.8 Uses a variety of estimating and calculating strategies with whole numbers, including memorising multiplication and division facts, fractions and decimals. T KC6
Possible starting points for planning, programming and assessing
(refer p20 & p22 for Early Years)

43
Students develop their understanding of the four operations (+ - x ÷) and the relationships between them. They use mathematical terminology, symbols and conventions to communicate their understanding to others. T C KC2
relating to Outcome 2.7
Students use their number sense to refine their ability to estimate, calculate and present using spreadsheets, measurements and amounts of money in their personal, family and community activities, and in their experiences in other Learning Areas. Id T C KC7
relating to Outcome 2.8
Students understand the meaning of operations and how they relate to each other, and can communicate these through a range of media, including information and communication technologies. In T C KC2 KC7
relating to Outcome 3.7
Students use computational tools and strategies, and understand and represent the thinking processes employed in solving problems involving proportions. T KC6
relating to Outcome 3.8
• Recognises and uses the multiplication symbol.
• Explains relationship between multiplication and addition.
• Explains relationship between subtraction and division.
• Explores relationships between table facts (eg multiples of 2, 4).
• Builds up understanding and knowledge of table facts (eg 10 to 100, 5 to 50, 2 to 20, 4 to 40, 3 to 30).
• Multiplies 2 digit numbers by 1 digit.
• Estimates, approximates and performs mental computations to 2 digits.
• Understands that the order of numbers in multiplication does not change the result (eg 6x3 = 3x6).
• Divides 2 and 3 digit numbers by 1 digit numbers with and without remainders (eg 11÷2 = 5r1).
• Understands and describes the term remainder.
• Recognises and uses odd and even numbers.
• Rounds off to the nearest 10.
• Uses calculators and electronic media to compute +, –, x and ÷.
• Memorises, practises and recalls times tables up to 10x.
• Understands and uses factors and multiples of numbers.
• Multiplies by 10 and by 100.
• Multiplies 2 and 3 digit numbers by 1 digit.
• Estimates, approximates and performs mental computations to 3 digits.
• Demonstrates that multiplication and division are reverse operations (eg 3x6 = 18 and 18÷6 = 3).
• Divides 3 digits by 1 digit with and without remainders (eg 2345÷5 = 469).
• Divides by 10 and by 100.
• Determines prime, composite and square numbers.
• Rounds off to the nearest 10 and 100.
• Uses calculators and electronic media to compute +, –, x and ÷.
• Understands and recalls times tables up to 10x.
• Multiplies 2, 3 and 4 digit numbers by 1 digit.
• Multiplies 2 digit numbers by 2 digit numbers up to 12.
• Divides 4 digit numbers with divisors
up to 10, with and without remainders.
• Understands and uses factors and multiples of numbers up to 100.
• Understands the term percentage.
• Uses symbols <, > and =.
• Uses calculators and electronic media
to compute +, –, x and ÷.
2.7 Describes, represents and applies operations with whole numbers. T C KC2 2.8 Uses a variety of estimating and calculating strategies, including memorising addition and subtraction facts with whole numbers, and with money represented as decimals. Id In T 3.7 Describes, represents and analyses operations with rational numbers and relationships between them. In T C KC1 KC2 3.8 Uses a variety of estimating and calculating strategies with whole numbers, including memorising multiplication and division facts, fractions and decimals. T KC6
Assessment Reflective Question: Have I enabled my learners to engage with self-assessment?
Year 3 Towards Standard 2
Year 4 Standard 2
Year 5 Towards Standard 3

44
Learning Area: Mathematics Band: Primary Years Strand: Number Standards: 2 & 3
KEY IDEAS (refer p23 for Early Years) Money OUTCOMES
Year 3 Towards Standard 2
Year 4 Standard 2
Year 5 Towards Standard 3
Students use their number sense to refine their ability to estimate, calculate and present using spreadsheets, measurements and amounts of money in their personal, family and community activities, and in their experiences in other Learning Areas. Id T C KC7
relating to Outcome 2.8
Students use computational tools and strategies, and understand and represent the thinking processes employed in solving problems involving proportions. T KC6
relating to Outcome 3.8
• Recognises and names coins and notes to $100.
• Counts coins in multiples of 5c, 10c, 20c, 50c, $1, $2.
• Reads and writes amounts in words and numerals up to $20.
• Understands value of money (eg ‘What can you buy for $1, $10, $100?’).
• Tenders amounts up to $10.
• Adds and subtracts money amounts
up to $10.
• Calculates change from amounts to
$5.
• Investigates rounding off amounts of money to nearest 5c.
• Reads and writes amounts in numerals and words up to $100.
• Tenders amounts using coins and notes up to $100.
• Adds and subtracts money amounts up to $100.
• Calculates change from $50.
• Multiplies and divides amounts by 1 digit up to $100.
• Uses the least number of coins needed to make money amounts.
• Rounds off to the nearest 5c.
• Creates personal budgets up to $100.
• Reads and writes amounts in numerals and words up to $1000.
• Adds and subtracts money amounts up to $500.
• Calculates change from $100.
• Multiplies and divides money amounts up to $500.
• Multiplies using the symbol @ (eg 5 @ 35c = $1.75).
• Estimates total costs by rounding (eg when shopping).
• Creates personal and household budgets up to $500.
2.8 Uses a variety of estimating and calculating strategies, including memorising addition and subtraction facts with whole numbers, and with money represented as decimals. Id In T 3.8 Uses a variety of estimating and calculating strategies with whole numbers, including memorising multiplication and division facts, fractions and decimals. T KC6
Possible starting points for planning, programming and assessing

45
Students use their number sense to refine their ability to estimate, calculate and present using spreadsheets, measurements and amounts of money in their personal, family and community activities, and in their experiences in other Learning Areas. Id T C KC7
relating to Outcome 2.8
Students use computational tools and strategies, and understand and represent the thinking processes employed in solving problems involving proportions. T KC6
relating to Outcome 3.8
• Uses a calculator to solve money problems up to $20.
• Use online shopping programs.
• Uses a calculator to solve money problems (eg using +, –, %, ÷ functions).
• Problem solves using at least 2 combinations of processes (eg ‘Find the total cost, then work out the change’).
• Uses a calculator to solve money problems (eg using +, –, %, ÷ functions).
2.8 Uses a variety of estimating and calculating strategies, including memorising addition and subtraction facts with whole numbers, and with money represented as decimals. Id In T 3.8 Uses a variety of estimating and calculating strategies with whole numbers, including memorising multiplication and division facts, fractions and decimals. T KC6
Year 3 Towards Standard 2
Year 4 Standard 2
Year 5 Towards Standard 3

46
Students demonstrate, record and report on logical and critical thought processes by searching for and abstracting generational algebraic representations from patterns drawn from current social situations. Students analyse mathematical structures and use algebraic formulae to represent situations. They further develop the capacity to express themselves, and to solve problems involving linear relationships. Students use mathematical models to make connections and analyse how things might change in both real and abstract contexts. They extract information from tables of data and graphs, making comparisons between varying rates of change, and predicting future events.
BAND: Primary Years
Pattern and algebraicreasoning
Exploring change
Identifying connected variables
Rate of change
Constant Variable
Representing change
Physical models
DataInformal graphs
Symbols
Investigating the impact of
change
SocialPhysical
Environmental
Digital simulations
ExcelSodaplay website
Real time projects/websites
Investigatingrelationships
Representing and
constructing
Predicting
Concrete materials Diagrams
DatabasesDrawing software
Graphs
Identifying, describing and generalising
Using words Using symbols
Representing and communicating generalistaions
Expressing functions in words
and symbols
Interpreting graphs
Representing variables
Using
Concrete
Investigating relationships in
context
Social relevance
Planning for
Learner Local
Global
Modelling
Graphs Tables
Formulae Databases
materials
KEY IDEASStudents identify, describe, construct, represent and predict patterns and relationships when working with data, measuring and calculating. They relate these patterns and relationships to their everyday lives. Students employ everyday language and mathematical symbols to represent and communicate their generalizations about mathematical situations and structures. Students collect and analyse information in understanding that the social and physical world is constantly changing, and that such change can be represented in symbols and mathematicalmodels.
OUTCOMES2.9 Searches for, represents and analyses different forms of spatial and numerical patterns, and relates these to everyday life. F Id T KC1 KC2 2.10 Represents and communicates patterns with everyday and mathematical language, including symbols, sketches, materials, number lines and graphs. C KC2 2.11 Uses materials, data and informal graphs to represent change. F C KC2
OUTCOMES3.9 Describes and generalises relationships between measurable attributes as patterns and explains the impact of varying one aspect of the relationship. F T KC1 KC2 3.10 Analyses, creates and generalizes numerical and spatial patterns and solves problems with such patterns. T C KC6 3.11 Uses mathematical representations to make connections and analyse change. In T
This concept map provides a visual representation of the Key Ideas and Outcomes below. Educators may prefer to develop their own.CONCEPT MAP: PATTERN AND ALGEBRAIC REASONING
KEY IDEAS
formulae
the future

47
Learning Area: Mathematics Band: Primary Years
Strand: Pattern and algebraic Standards: 2 & 3 reasoning
KEY IDEAS (refer p25 for Early Years) Patterns (refer p68 for Middle Years) OUTCOMES
Year 3 Towards Standard 2
Year 4 Standard 2
Year 5 Towards Standard 3
Students identify, describe, construct, represent and predict patterns and relationships when working with data, measuring and calculating. They relate these patterns and relationships to their everyday lives. F Id T KC1 KC2 KC6
relating to Outcome 2.9
Students demonstrate, record and report on logical and critical thought processes by searching for and abstracting generational algebraic representations from patterns drawn from current social situations. In T KC2
relating to Outcome 3.9
• Describes and uses interval counting to show patterns (eg 2, 5, 8, 11).
• Recognises and uses number patterns.
• Recognises odd and even numbers.
• Counts forwards and backwards to 100 by 1, 5 and 10.
• Recognises, describes and discusses patterns in a 100s number chart.
• Investigates shape and measurement patterns (eg ).
• Uses drawing programs to create
simple patterns.
• Describes and uses interval counting (eg 23, 26, 29 …).
• Investigates number patterns.
• Recognises patterns in a
multiplication chart.
• Investigates shape and measurement patterns (eg using computer-generated shapes including tessellations).
• Describes and uses interval counting (eg 345, 350, 355 …).
• Understands and continues number, letter and shape patterns.
• Recognises patterns in a multiplication chart.
• Records patterns in the local environment (eg uses digital camera).
• Uses drawing programs to create more complex patterns.
2.9 Searches for, represents and analyses different forms of spatial and numerical patterns, and relates these to everyday life. F Id T KC1 KC2 3.9 Describes and generalises relationships between measurable attributes as patterns and explains the impact of varying one aspect of the relationship. F T KC1 KC2
Possible starting points for planning, programming and assessing

48
Learning Area: Mathematics Band: Primary Years Strand: Pattern and algebraic Standards: 2 & 3 reasoning
KEY IDEAS (refer p25 for Early Years) Algebra (refer p68 for Middle Years) OUTCOMES
Year 3 Towards Standard 2
Year 4 Standard 2
Year 5 Towards Standard 3
Students employ everyday language and mathematical symbols to represent and communicate their generalisations about mathematical situations and structures. Id C KC2
relating to Outcome 2.10
Students use mathematical models to make connections and analyse how things might change in both real and abstract contexts. They extract information from tables of data and graphs, making comparisons between varying rates of change, and predicting future events. F T KC1 KC6
relating to Outcome 3.11
• Completes simple number sentences by calculating the value of a missing number (eg 2+ … = 8).
• Constructs and uses number lines to investigate patterns of numbers (eg 20, 30, 40, …).
• Completes simple number sentences by calculating the value of a missing number (eg 4x … = 24).
• Constructs and uses number lines (eg counting decimals and fractions 5.0, 5.2, 5.4, 5.6, 5.8 …).
• Creates a variety of symbols and graphics using drawing software to make algebraic number sentences (eg +8 = 10).
• Constructs and completes number sentences involving a mixture of the four operations (eg [2x3] + [5–2]).
• Constructs and uses number lines (eg counting decimals and fractions).
• Uses factor trees to find factors.
• Determines number patterns of square and triangular numbers.
• Calculates the value of symbols in a number sentence (eg ∇ + ∇ + ∇ = 18).
2.10 Represents and communicates patterns with everyday and mathematical language, including symbols, sketches, materials, number lines and graphs. C KC2 3.11 Uses mathematical representations to make connections and analyse change. In T
Assessment Reflective Question: Have my learners engaged in peer assessment?
Possible starting points for planning, programming and assessing
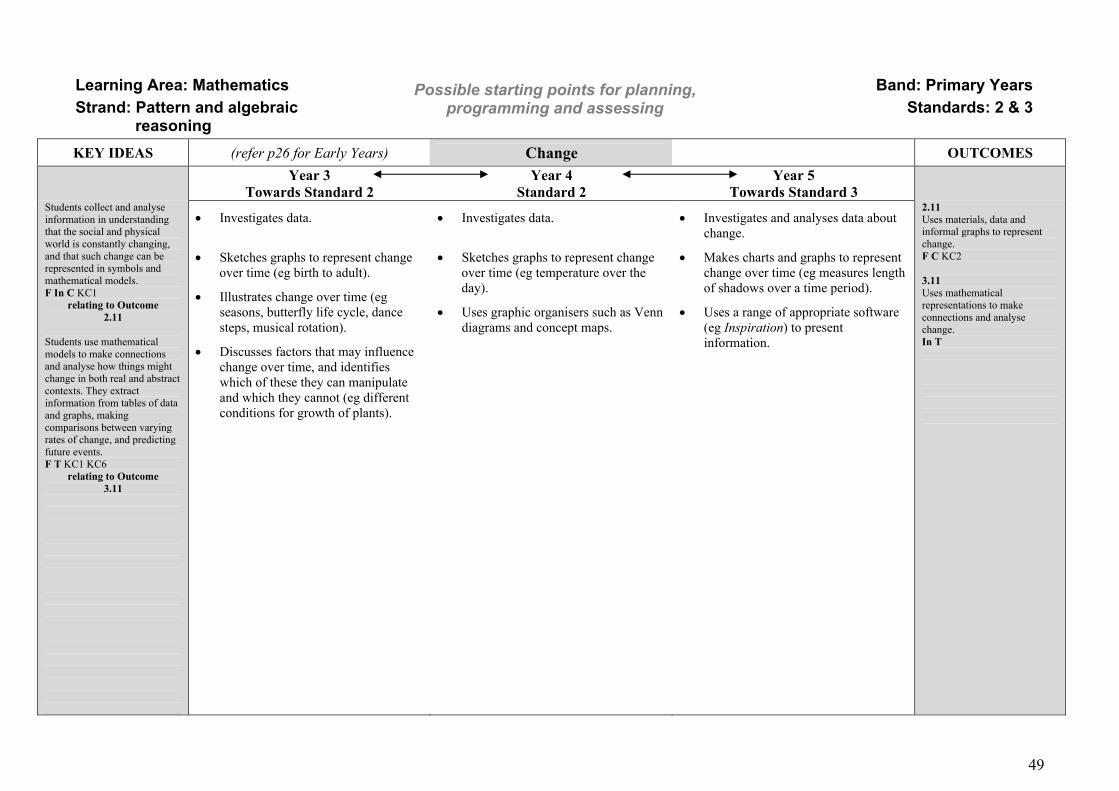
49
Learning Area: Mathematics Band: Primary Years Strand: Pattern and algebraic Standards: 2 & 3 reasoning
KEY IDEAS (refer p26 for Early Years) Change OUTCOMES
Year 3 Towards Standard 2
Year 4 Standard 2
Year 5 Towards Standard 3
Students collect and analyse information in understanding that the social and physical world is constantly changing, and that such change can be represented in symbols and mathematical models. F In C KC1
relating to Outcome 2.11
Students use mathematical models to make connections and analyse how things might change in both real and abstract contexts. They extract information from tables of data and graphs, making comparisons between varying rates of change, and predicting future events. F T KC1 KC6
relating to Outcome 3.11
• Investigates data.
• Sketches graphs to represent change
over time (eg birth to adult).
• Illustrates change over time (eg seasons, butterfly life cycle, dance steps, musical rotation).
• Discusses factors that may influence change over time, and identifies which of these they can manipulate and which they cannot (eg different conditions for growth of plants).
• Investigates data.
• Sketches graphs to represent change
over time (eg temperature over the day).
• Uses graphic organisers such as Venn diagrams and concept maps.
• Investigates and analyses data about change.
• Makes charts and graphs to represent change over time (eg measures length of shadows over a time period).
• Uses a range of appropriate software (eg Inspiration) to present information.
2.11 Uses materials, data and informal graphs to represent change. F C KC2 3.11 Uses mathematical representations to make connections and analyse change. In T
Possible starting points for planning, programming and assessing

50
Learning Area: Mathematics Band: Primary Years Strand: Spatial sense and Standards: 2 & 3 geometric reasoning
KEY IDEAS (refer p27 for Early Years) 2-D shapes and 3-D objects (refer p72 for Middle Years) OUTCOMES
Year 3 Towards Standard 2
Year 4 Standard 2
Year 5 Towards Standard 3
Students understand and appreciate the extent to which shape and structure help them to make sense of their world. F Id T
relating to Outcome 2.12
Students explore and analyse features in their immediate and extended environment in geometric terms. They compare perspectives of spatial sense and geometric reasoning in order to understand different human interactions with their environment. Id In T KC1
relating to Outcome 3.12
• Recognises parallel, horizontal, vertical, oblique, diagonal and intersecting lines.
• Identifies, recognises in the environment and names common 2-D shapes (eg square, rectangle, circle, oval, triangle, pentagon, octagon).
• Draws and constructs 2-D shapes with and without a ruler.
• Describes and compares the
properties of different quadrilaterals (eg square, rectangle, kite).
• Describes irregular polygons.
• Recognises, sorts and names familiar
3-D objects (eg cylinder, cone, sphere, cube, prism).
• Draws top (bird’s-eye), side and front views of 3-D objects.
• Describes 2-D shapes and 3-D objects using terms such as base, surface, edge, face and vertex.
• Draws parallel, horizontal, vertical, oblique, diagonal and intersecting lines.
• Describes and compares properties of polygons, prisms and pyramids (eg faces, bases, edges and vertices).
• Draws top, side, front and cross-
sections of 3-D objects.
• Draws 2-D shapes and makes 3-D objects and nets from real-life objects (eg tin can or ice cream cone) using pen, paper and drawing software.
• Explains and compares the spatial features of objects (eg faces, edges, vertices).
• Describes the properties of circles, regular polygons and solids.
• Recognises and names regular and
irregular polygons (eg triangle, quadrilateral, pentagon, hexagon, octagon).
2.12 Compares and analyses relationships between and within 2-D and 3-D shapes and objects to represent their world. F T KC1 KC2 3.12 Describes and generalises spatial relationships within and between groups of 2-D and 3-D shapes and objects and appreciates their application in a range of cultural contexts. Id In KC2
Possible starting points for planning, programming and assessing

51
Students understand and appreciate the extent to which shape and structure help them to make sense of their world. F Id T
relating to Outcome 2.12
Students explore and analyse features in their immediate and extended environment in geometric terms. They compare perspectives of spatial sense and geometric reasoning in order to understand different human interactions with their environment. Id In T KC1
relating to Outcome 3.12
• Constructs 3-D objects from nets.
• Experiments with 7 piece tangram puzzles.
• Recognises and draws lines of symmetry in nature, the human body and drawn shapes.
• Explores symmetrical patterns using grid paper, geoboards and drawing programs.
• Uses drawing programs to draw symmetrical shapes.
• Recognises right angles in everyday objects.
• Understands and uses the terms smaller than a right angle and larger than a right angle.
• Makes and draws acute and obtuse angles.
• Constructs 3-D objects from nets.
• Interprets, recognises and names 3-D objects (eg cubes, prisms and pyramids).
• Solves 7 piece tangram puzzles.
• Works with shapes to find the lines of
symmetry.
• Uses drawing programs to draw symmetrical shapes.
• Recognises angles in the environment (eg takes digital photos).
• Constructs and compares a variety of angles (eg acute, square, straight, reflex, obtuse).
• Uses a set square to measure and draw angles (eg right angles).
• Understands that an angle is an
amount of turn and can be measured in degrees.
• Draws symmetrical shapes and patterns.
• Identifies angles in everyday objects.
• Knows, uses and recognises obtuse, reflex, right and acute angles.
• Uses a range of drawing software (eg drawing tools) to construct angles.
• Uses a set square and protractor to measure and draw angles accurately (eg right angles, 30°, 45°, 60°).
• Understands and recalls 90° in a right angle, and 180° in a straight angle.
2.12 Compares and analyses relationships between and within 2-D and 3-D shapes and objects to represent their world. F T KC1 KC2 3.12 Describes and generalises spatial relationships within and between groups of 2-D and 3-D shapes and objects and appreciates their application in a range of cultural contexts. Id In KC2
Assessment Reflective Question: Do I use learner achievement data to support and plan for future learning?
Year 3 Towards Standard 2
Year 4 Standard 2
Year 5 Towards Standard 3

52
Learning Area: Mathematics Band: Primary Years Strand: Spatial sense and Standards: 2 & 3 geometric reasoning
KEY IDEAS (refer p28 for Early Years) Transformation and symmetry (refer p73 for Middle Years) OUTCOMES
Year 3 Towards Standard 2
Year 4 Standard 2
Year 5 Towards Standard 3
Students explore and communicate the ideas and language of geometric change and transformation. They use combinations of mathematical transformations. T C KC2
relating to Outcome 2.13
Students analyse and understand the uses and purposes of flips (reflection), slides (translation), rotations and dilations to explore geometric relationships and alternative preferred possibilities in the physical world. F T KC1 KC6
relating to Outcome 3.13
• Uses and understands the terms flip, slide and rotate, and begins to use mathematical language (eg reflection for flip).
• Creates patterns and tessellations with regular polygons.
• Makes shape patterns electronically, using concrete materials and on paper.
• Understands the terms flip (as reflection), slide (as translation) and turn (as rotation).
• Uses the terms reflect, translate and rotate to describe movement.
• Creates and draws repeated patterns with translations, rotations and reflections.
• Creates tessellating patterns with regular polygons.
• Uses drawing programs and online resources to make shape patterns.
• Uses simple grids to enlarge shapes and simple diagrams.
• Understands the term transformation.
• Uses the terms reflect, translate and rotate to describe movement.
• Creates and draws repeated patterns with translations, rotations and reflections.
• Predicts the result of a combination of 2 or 3 reflections, translations or rotations on paper or by using concrete materials.
• Produces enlargements and reductions using simple scales and grids on paper and using ICTs.
• Makes maps and creates patterns using drawing software.
2.13 Predicts, describes and represents the result of using combinations of reflections (flips), translations (slides) and rotations when arranging shapes, searching for patterns and describing pathways. T C KC1 KC2 KC6 3.13 Analyses the result of a series of flips, slides, rotations and reflections and translations and uses scales to undertake enlargements and reductions of figures and objects. T C KC1
Assessment Reflective Question: Have I provided feedback that is constructive and informs the direction for future learning during this activity?
Possible starting points for planning, programming and assessing

53
Learning Area: Mathematics Band: Primary Years Strand: Spatial sense and Standards: 2 & 3 geometric reasoning
KEY IDEAS (refer p29 for Early Years) Location and position (refer p74 for Middle Years) OUTCOMES
Year 3 Towards Standard 2
Year 4 Standard 2
Year 5 Towards Standard 3
Students develop their capacity to think about and describe geometrical form, using a variety of spatial attributes, in more abstract and precise formulations. T C KC2
relating to Outcome 2.14
Students develop and extend their capacity to solve problems in multi-layered and abstract ways in order to produce accurate maps, graphs and models. T C KC6
relating to Outcome 3.14
• Locates features when interpreting maps of familiar locations (eg using legends/keys).
• Draws views of a model (eg bird’s-eye and side view).
• Describes a route around the school and marks it on a simple plan.
• Follows directions and walks a route marked on a simple plan or given orally (eg obstacle course, treasure hunt).
• Gives and follows directions through a simple maze.
• Draws a simple plan of a room or a building using pen and paper and drawing programs.
• Uses coordinates to mark positions on simple grids.
• Draws different views of a model (ie top, left, right and back view).
• Gives and follows directions to locate objects in familiar settings and on maps (eg using paces, direction).
• Begins to construct site maps for
school/class websites.
• Draws a simple plan of a room or a building using pen and paper and drawing programs.
• Reads, marks and joins coordinate points on a grid.
• Gives and follows directions to locate objects in familiar settings (eg ¼ turn, ½ turn, cardinal compass points, grid coordinates, orienteering).
• Constructs own coordinate points for a selected simple picture.
• Uses street directories and/or local maps.
• Produces simple plans demonstrating appreciation of scale (eg bedroom, classroom).
• Draws and describes a path or route using coordinates on a simple map or plan.
• Constructs own coordinate points for a selected simple picture.
2.14 Uses positional language and measurements to formally map location and arrangements. T C KC2 3.14 Produces, uses and critiques scaled maps and plans and envisages alternative possibilities. F T KC3
Possible starting points for planning, programming and assessing

54
BAND: Middle Years
Accessing existing data (eg internet,
ABS)
Constructingarguments
Recommending action
Reporting(oral, written, ICTs)
Graphs (mostly ICTs)Choose from- bar graphs- column graphs- pie charts- line graphs- scatter plots- stem and leaf plots- other
Collectiontechniques
Investigating chance
situations
Exploring, analysing and modelling data
Collecting
Posing questions
Issues
Learners' own
Local Global
Responding to questions
Analysing
Surveys
Sampling techniques
Instruments
Representing
Distribution
Spread
Central tendency
Mean
Median
Mode
Critically analysing
Data representation
Interpretation
Posing questions
Interpreting chance
situations
Identifies possible
outcomes Assigns
probabilities
Estimates probabilities
Uses languageof chance
Makes predictions
From trials
Theoretical
SpinnersDice
Random number generator
HealthGambling
Insurance Games/sport
Opinion polls
KEY IDEASStudents engage with data by formulating and answering questions,and collecting, organising and representing data in order toinvestigate and understand the world around them. Students use statistical methods to reduce, analyse and interpret data,while critically evaluating the cultural and social inclusivity of the samples used.
Students engage with data to understand, analyse and apply notionsof chance and probability in the social and natural worlds.
OUTCOMES
In T C KC1 KC6
3.1 Poses questions, determines a sample, collects and records data including related data, represents sample data in order to investigate the world around them.
In T KC1
3.2 Summarises, recognises bias, draws conclusions and makesconjectures about data. Understands how different organisation and representations influence data interpretation.
F In T KC1 outcomes is generated by situations where chance plays a role.
OUTCOMES
In T C KC1 KC2 KC7
4.1 Poses questions, appropriately designs a survey, collects data and classifies,sequences, collapses, tabulates and represents the data with and without ICTs.
In T KC1 KC6
4.2 Reads and describes information in given tables, diagrams, line and bar graphs.Makes predictions based on the information, understanding the limitations of data interpretation and the possible social consequences of these limitations.
F In T KC1
4.3 Interprets data and makes numerical statements about probability, and models situations using data to validate their theories about the fairness of everyday situations including hypothetical situations.
Whose interest?
Whose question?
What are other questions?
From data sets
Chance
Questioning, collecting, organising
andrepresenting
Analysing and
interpreting
Tables
Hypothetical
How does working with data support Middle Years learners to: • explore issues of
personal and social significance?
• develop perspectives to critically reflect on who they are, where they belong, what they value and what their preferred future would look like?
• negotiate, plan and act to enhance their lives and the lives of others?
• develop greater independence and connectedness with their peers, other people and systems (local, national and global)?
• connect their learning across the curriculum?
• produce, create, perform and present?
This concept map provides a visual representation of the Key Ideas and Outcomes below. Educators may prefer to develop their own.CONCEPT MAP: EXPLORING, ANALYSING AND MODELLING DATA
Modelling chance
situations
3.3 Analyses data to search for patterns in events where the range of

55
Learning Area: Mathematics Band: Middle Years Strand: Exploring, analysing Standards: 3 & 4 and modelling data
KEY IDEAS (refer p32 for Primary Years) Data collection and representation (refer p76 for Years 9 and 10) OUTCOMES
Year 6 Standard 3
Year 7 Towards Standard 4
Year 8 Standard 4
Students engage with data by formulating and answering questions, and collecting, organising and representing data in order to investigate and understand the world around them. In T C KC2 KC6
relating to Outcomes 3.1, 4.1
Students use statistical methods to reduce, analyse and interpret data, while critically evaluating the cultural and social inclusivity of the samples used. In T KC1
relating to Outcomes 3.2, 4.2
KEY TO SYMBOLS Essential Learnings: F Futures Id Identity In Interdependence T Thinking C Communication Key Competencies: KC1 collecting, analysing and organising information KC2 communicating ideas and information KC3 planning and organising activities KC4 working with others and in teams KC5 using mathematical ideas and techniques KC6 solving problems KC7 using technology
• Conducts surveys to collect data.
• Utilises tally system.
• Presents data graphically (eg frequency table).
• Constructs graphs on grid paper (eg pictographs, bar graphs, composite bar graphs, column graphs, line graphs).
• Constructs and interprets tables and graphs using graphing software (eg finds graphs in newspapers and considers how they can be interpreted).
• Labels graphs with titles, axes, keys and scales.
• Calculates the mean (average) of a set of data.
• Interprets graphs, including pie graphs, from various sources.
• Understands the purpose of taking a sample population.
• Explains the difference between a
random sample and a biased sample (eg examines surveys conducted in the media: Why were they undertaken? How are they conducted? What types of questions were asked?).
• Plans a range of ways to collect data (eg surveys, interviews).
• Records data using spreadsheets, and uses simple formulae to create graphs using graphing software.
• Constructs and interprets pie graphs using graphing software.
• Finds the mean, median and mode from given data.
• Interprets information from data, graphs and tables.
• Explores a process for statistical enquiry by: - formulating key questions to
explore (eg social and environmental issues)
- collecting data (eg pets, hand span, siblings, use of spare time)
- classifying data as categorical or quantitative (discrete or continuous)
- organising and displaying data in table and graph form (eg spread-sheets, rainfall of the local area compared with another area, space given to male and female sports in newspapers)
- analysing data and making general comments on its distribution
- presenting results of surveys; describing initial questions, data collection processes and conclusions; and commenting on how they might be improved.
• Understands and uses terms in constructing and interpreting tables and graphs.
• Interprets information from data, graphs and tables.
3.1 Poses questions, determines a sample, collects and records data including related data, represents sample data in order to investigate the world around them. In T C KC1 KC6 3.2 Summarises, recognises bias, draws conclusions and makes conjectures about data. Understands how different organisation and representations influence data interpretation. In T KC1 4.1 Poses questions, appropriately designs a survey, collects data and classifies sequence, collapses, tabulates and represents the data with and without ICTs. In T C KC1 KC2 KC7 4.2 Reads and describes information in given tables, diagrams, line and bar graphs. Makes predictions based on the information, understanding the limitations of data interpretation and the possible social consequences of these limitations. In T KC1 KC6
Possible starting points for planning, programming and assessing
Assessment Reflective Question: Have I made the criteria for success clear at the beginning?

56
Learning Area: Mathematics Band: Middle Years Strand: Exploring, analysing Standards: 3 & 4 and modelling data
KEY IDEAS (refer p34 for Primary Years) Chance and probability (refer p77 for Years 9 and 10) OUTCOMES
Year 6 Standard 3
Year 7 Towards Standard 4
Year 8 Standard 4
Students engage with data to understand, analyse and apply notions of chance and probability in the social and natural worlds. F In T KC1
relating to Outcomes 3.3, 4.3
• Describes the likelihood of events in everyday situations using appropriate everyday language (eg likely, unlikely, possible, probable, certain, impossible).
• Orders the terms from impossible to certain.
• Describes the likelihood of events in everyday situations using appropriate mathematical terminology (eg 50:50 chance, 1 in 4 chance, no chance, equal chance).
• Utilises graphic organisers (eg tree diagrams) to identify possible outcomes.
• Predicts and records possible outcomes of an event.
• Uses data to order chance events from least likely to most likely (eg roll 2 dice 20 times, record the total each time, order the results from the least likely result to the most likely).
• Explains the differences between predicted results and actual results of an experiment (eg coin tossing).
• Uses samples to make predictions about a larger population from which the sample comes (eg using coin tossing, predict the result from a sample of 100 tosses).
• Identifies risks and consequences of taking chances.
• Demonstrates an understanding of what constitutes gambling (eg lotto, raffles, poker machines).
• Identifies some of the social consequences of gambling (eg implications for families adversely affected by problem gambling).
• Assigns numbers and percentages to chance (ie if it has no chance of occurring it is assigned 0 or 0%; if it is certain to occur it is assigned 1 or 100%).
• Makes their own probability generator (eg a spinner to show P [red] = 2/5).
• Assigns probabilities for given situations (eg ‘Five discs are placed in a bag, two are blue and three are black. What is the probability of drawing a blue disc?’).
• Tests predictions (eg coin tossing).
• Lists possible outcomes for an event (eg uses tree diagrams, matrix diagrams).
• Investigates experimental and theoretical probabilities.
• Writes formulae to determine probability (eg P =
number of outcomes in event ), total number of possible outcomes and considers: - What type of occurrence has a
50:50 chance of happening? Consider birth of a boy/girl.
- What is the probability of an astrologer’s prediction being accurate?
• Lists some events that will never happen and some events that are certain.
3.3 Analyses data to search for patterns in events where the range of outcomes is generated by situations where chance plays a role. F In T KC1 4.3 Interprets data and makes numerical statements about probability, and models situations using data to validate their theories about the fairness of everyday situations including hypothetical situations. F In T KC1
Possible starting points for planning, programming and assessing
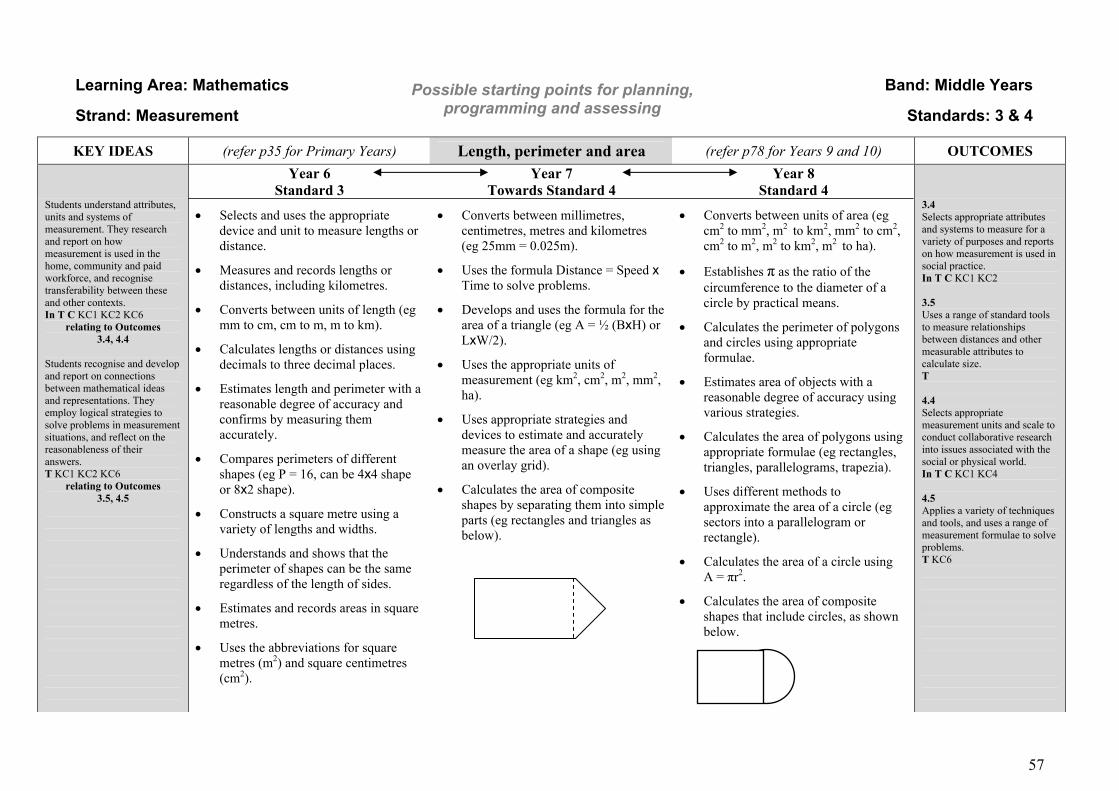
57
Learning Area: Mathematics Band: Middle Years Strand: Measurement Standards: 3 & 4
KEY IDEAS (refer p35 for Primary Years) Length, perimeter and area (refer p78 for Years 9 and 10) OUTCOMES Year 6
Standard 3 Year 7
Towards Standard 4 Year 8
Standard 4 Students understand attributes, units and systems of measurement. They research and report on how measurement is used in the home, community and paid workforce, and recognise transferability between these and other contexts. In T C KC1 KC2 KC6
relating to Outcomes 3.4, 4.4
Students recognise and develop and report on connections between mathematical ideas and representations. They employ logical strategies to solve problems in measurement situations, and reflect on the reasonableness of their answers. T KC1 KC2 KC6
relating to Outcomes 3.5, 4.5
• Selects and uses the appropriate device and unit to measure lengths or distance.
• Measures and records lengths or distances, including kilometres.
• Converts between units of length (eg mm to cm, cm to m, m to km).
• Calculates lengths or distances using decimals to three decimal places.
• Estimates length and perimeter with a reasonable degree of accuracy and confirms by measuring them accurately.
• Compares perimeters of different shapes (eg P = 16, can be 4x4 shape or 8x2 shape).
• Constructs a square metre using a variety of lengths and widths.
• Understands and shows that the perimeter of shapes can be the same regardless of the length of sides.
• Estimates and records areas in square metres.
• Uses the abbreviations for square metres (m2) and square centimetres (cm2).
• Converts between millimetres, centimetres, metres and kilometres (eg 25mm = 0.025m).
• Uses the formula Distance = Speed x Time to solve problems.
• Develops and uses the formula for the area of a triangle (eg A = ½ (BxH) or LxW/2).
• Uses the appropriate units of measurement (eg km2, cm2, m2, mm2, ha).
• Uses appropriate strategies and devices to estimate and accurately measure the area of a shape (eg using an overlay grid).
• Calculates the area of composite shapes by separating them into simple parts (eg rectangles and triangles as below).
• Converts between units of area (eg cm2 to mm2, m2 to km2, mm2 to cm2, cm2 to m2, m2 to km2, m2 to ha).
• Establishes π as the ratio of the circumference to the diameter of a circle by practical means.
• Calculates the perimeter of polygons and circles using appropriate formulae.
• Estimates area of objects with a reasonable degree of accuracy using various strategies.
• Calculates the area of polygons using appropriate formulae (eg rectangles, triangles, parallelograms, trapezia).
• Uses different methods to approximate the area of a circle (eg sectors into a parallelogram or rectangle).
• Calculates the area of a circle using A = πr2.
• Calculates the area of composite shapes that include circles, as shown below.
3.4 Selects appropriate attributes and systems to measure for a variety of purposes and reports on how measurement is used in social practice. In T C KC1 KC2 3.5 Uses a range of standard tools to measure relationships between distances and other measurable attributes to calculate size. T 4.4 Selects appropriate measurement units and scale to conduct collaborative research into issues associated with the social or physical world. In T C KC1 KC4 4.5 Applies a variety of techniques and tools, and uses a range of measurement formulae to solve problems. T KC6
Possible starting points for planning, programming and assessing

58
Students understand attributes, units and systems of measurement. They research and report on how measurement is used in the home, community and paid workforce, and recognise transferability between these and other contexts. In T C KC1 KC2 KC6
relating to Outcomes 3.4, 4.4
Students recognise and develop and report on connections between mathematical ideas and representations. They employ logical strategies to solve problems in measurement situations, and reflect on the reasonableness of their answers. T KC1 KC2 KC6
relating to Outcomes 3.5, 4.5
• Explains that the area of squares and rectangles can be found by multiplying the length by the breadth: A = LxW or A = LxB.
• Calculates the area of irregular shapes composed of square and rectangular sections.
• Applies knowledge of length, perimeter and area through practical problem-solving activities.
• Demonstrates understanding of the relationship between perimeter and area through practical problem-solving activities (eg investigating floor plans of the classroom or sports fields).
• Uses scale in ratio form to calculate either original size or drawing size (eg explores different methods of estimating the area of an irregular shape, cube houses (Maths 300 refer to Suggested Website in Resources list).
• Applies knowledge of perimeter, circumference and area through practical problem-solving activities.
3.4 Selects appropriate attributes and systems to measure for a variety of purposes and reports on how measurement is used in social practice. In T C KC1 KC2 3.5 Uses a range of standard tools to measure relationships between distances and other measurable attributes to calculate size. T 4.4 Selects appropriate measurement units and scale to conduct collaborative research into issues associated with the social or physical world. In T C KC1 KC4 4.5 Applies a variety of techniques and tools, and uses a range of measurement formulae to solve problems. T KC6
INVESTIGATION Given an area of 20cm2, draw shapes which have the same area but a different perimeter (eg body maths—how many palms cover the body, compare area of the different parts of the body, as used to determine the extent of burns).
Year 6 Standard 3
Year 7 Towards Standard 4
Year 8 Standard 4

59
Learning Area: Mathematics Band: Middle Years Strand: Measurement Standards: 3 & 4
KEY IDEAS (refer p36 for Primary Years) Volume and capacity (refer p78 for Years 9 and 10) OUTCOMES
Year 6 Standard 3
Year 7 Towards Standard 4
Year 8 Standard 4
Students understand attributes, units and systems of measurement. They research and report on how measurement is used in the home, community and paid workforce, and recognise transferability between these and other contexts. In T C KC1 KC2 KC6
relating to Outcomes 3.4, 4.4
Students recognise and develop and report on connections between mathematical ideas and representations. They employ logical strategies to solve problems in measurement situations, and reflect on the reasonableness of their answers. T KC1 KC2 KC6
relating to Outcomes 3.5, 4.5
• Understands the concept of kilolitre (ie 1000 litres = 1 kilolitre).
• Uses the abbreviations for millilitres (mL), litres (L) and kilolitres (kL).
• Constructs 3-D objects using cubic centimetre blocks and measures volume by counting the number of blocks.
• Uses the abbreviations for cubic centimetres (cm3) and cubic metres (m3).
• Estimates the volume of rectangular prisms using cubic centimetres.
• Explains that the volume of rectangular prisms can be found by multiplying the length by the width by the height: V = LxWxH.
• Selects and uses the appropriate device and unit to measure capacity.
• Calculates capacity using millilitres and litres to 3 decimal places.
• Converts mL to L and L to kL and vice versa.
• Uses the symbols cm3, m3, mL, L and kL.
• Demonstrates understanding of volume through practical problem-solving activities.
• Develops and uses formula for
volume of rectangular prisms: V = LxWxH or V = LxBxH.
• Demonstrates awareness that capacity is related to volume (eg through displacement activities where 1mL = 1cm3).
• Converts between mL, L, kL and ML.
• Converts between units of capacity
and units of volume (ie 1cm3 = 1mL, 1000cm3 = 1L, 1m3 = 1kL).
• Calculates the volume of prisms using Volume = area of base x height, and uses appropriate units (eg mm3, cm3 and m3).
• Applies knowledge of volume through practical problem-solving activities (eg estimates the number of bottles of water to fill a rubbish bin).
3.4 Selects appropriate attributes and systems to measure for a variety of purposes and reports on how measurement is used in social practice. In T C KC1 KC2 3.5 Uses a range of standard tools to measure relationships between distances and other measurable attributes to calculate size. T 4.4 Selects appropriate measurement units and scale to conduct collaborative research into issues associated with the social or physical world. In T C KC1 KC4 4.5 Applies a variety of techniques and tools, and uses a range of measurement formulae to solve problems. T KC6
Possible starting points for planning, programming and assessing

60
Learning Area: Mathematics Band: Middle Years Strand: Measurement Standards: 3 & 4
KEY IDEAS (refer p37 for Primary Years) Mass OUTCOMES
Year 6 Standard 3
Year 7 Towards Standard 4
Year 8 Standard 4
Students understand attributes, units and systems of measurement. They research and report on how measurement is used in the home, community and paid workforce, and recognise transferability between these and other contexts. In T C KC1 KC2 KC6
relating to Outcomes 3.4, 4.4
Students recognise and develop and report on connections between mathematical ideas and representations. They employ logical strategies to solve problems in measurement situations, and reflect on the reasonableness of their answers. T KC1 KC2 KC6
relating to Outcomes 3.5, 4.5
• Estimates the mass of familiar objects.
• Selects and uses the appropriate device and unit to measure mass.
• Compares the mass of different objects.
• Uses the abbreviations for milligrams (mg), grams (g), tonnes (t) and kilograms (kg).
• Converts between milligrams, kilograms, grams and tonnes to 3 decimal places.
• Applies the knowledge of mass to practical problem-solving situations.
• Chooses the appropriate units and tools to measure weight of a variety of objects.
• Identifies the relationships between milligrams, grams, kilograms and tonnes (eg 1kg = 1000g, 1t = 1000kg, 1g = 1000mg).
• Applies the knowledge of mass (eg mass of 1 litre of water = 1 kilogram) to practical problem-solving situations.
• Converts between units of mass.
• Recognises that the units for volume, mass and capacity, are related as follows: 1000cm3 or 1L of pure water has a mass of 1kg.
• Solves problems involving capacity, mass and volume.
3.4 Selects appropriate attributes and systems to measure for a variety of purposes and reports on how measurement is used in social practice. In T C KC1 KC2 3.5 Uses a range of standard tools to measure relationships between distances and other measurable attributes to calculate size. T 4.4 Selects appropriate measurement units and scale to conduct collaborative research into issues associated with the social or physical world. In T C KC1 KC4 4.5 Applies a variety of techniques and tools, and uses a range of measurement formulae to solve problems. T KC6
Possible starting points for planning, programming and assessing

61
Learning Area: Mathematics Band: Middle Years Strand: Measurement Standards: 3 & 4
KEY IDEAS (refer p38 for Primary Years) Time OUTCOMES
Year 6 Standard 3
Year 7 Towards Standard 4
Year 8 Standard 4
Students understand attributes, units and systems of measurement. They research and report on how measurement is used in the home, community and paid workforce, and recognise transferability between these and other contexts. In T C KC1 KC2 KC6
relating to Outcomes 3.4, 4.4
Students recognise and develop and report on connections between mathematical ideas and representations. They employ logical strategies to solve problems in measurement situations, and reflect on the reasonableness of their answers. T KC1 KC2 KC6
relating to Outcomes 3.5, 4.5
• Uses a stopwatch to time events accurately to hundredths of seconds.
• Tells the time using analogue, 24 hour and digital clocks.
• Reads a simple timetable.
• Converts between analogue, 24 hour and digital time.
• Converts from one time unit to another (eg ‘How many seconds are there in 1 hour?’).
• Calculates the duration of an event using starting and finishing times.
• Uses a calendar as a planning tool.
• Understands terminology such as AD, BC, CE, BCE (eg 400 BC).
• Reads and constructs a timeline, including AD and BC.
• Makes comparisons between time zones in Australia and calculates changes incorporating daylight saving.
• Reads and uses a variety of timetables.
• Explains ways in which time is measured in other cultures (eg calendars which are calculated by moon cycles).
• Uses Speed = Distance/Time to answer problems.
• Constructs and interprets timelines using appropriate scales.
• Uses a standard time zone map to answer questions related to time differences.
• Uses bus, train and plane timetables to plan a journey, calculating departure and arrival time, and the time taken for sections of the journey.
• Solves problems by using the
relationship of Speed = Distance/Time.
3.4 Selects appropriate attributes and systems to measure for a variety of purposes and reports on how measurement is used in social practice. In T C KC1 KC2 3.5 Uses a range of standard tools to measure relationships between distances and other measurable attributes to calculate size. T 4.4 Selects appropriate measurement units and scale to conduct collaborative research into issues associated with the social or physical world. In T C KC1 KC4 4.5 Applies a variety of techniques and tools, and uses a range of measurement formulae to solve problems. T KC6
Possible starting points for planning, programming and assessing

62
Learning Area: Mathematics Band: Middle Years Strand: Measurement Standards: 3 & 4
KEY IDEAS (refer p40 for Primary Years) Temperature OUTCOMES
Year 6 Standard 3
Year 7 Towards Standard 4
Year 8 Standard 4
Students understand attributes, units and systems of measurement. They research and report on how measurement is used in the home, community and paid workforce, and recognise transferability between these and other contexts. In T C KC1 KC2 KC6
relating to Outcomes 3.4, 4.4
Students recognise and develop and report on connections between mathematical ideas and representations. They employ logical strategies to solve problems in measurement situations, and reflect on the reasonableness of their answers. T KC1 KC2 KC6
relating to Outcomes 3.5, 4.5
• Determines and records temperature variations.
• Estimates and reads maximum and minimum temperatures in Centigrade.
• Calculates and interprets average temperature.
• Demonstrates awareness of the Fahrenheit temperature scale (ºF).
• Uses online resources to compare current temperatures in different parts of the world.
3.4 Selects appropriate attributes and systems to measure for a variety of purposes and reports on how measurement is used in social practice. In T C KC1 KC2 3.5 Uses a range of standard tools to measure relationships between distances and other measurable attributes to calculate size. T 4.4 Selects appropriate measurement units and scale to conduct collaborative research into issues associated with the social or physical world. In T C KC1 KC4 4.5 Applies a variety of techniques and tools, and uses a range of measurement formulae to solve problems. T KC6
Possible starting points for planning, programming and assessing

63
Learning Area: Mathematics Band: Middle Years Strand: Number Standards: 3 & 4
KEY IDEAS (refer p42 for Primary Years) Whole numbers (refer p80 for Years 9 and 10) OUTCOMES Year 6
Standard 3 Year 7
Towards Standard 4 Year 8
Standard 4 Students recognise relationships within different number concepts in order to make sense of, and represent numerically, a range of community activities and social processes encountered in their lives. In T KC1
relating to Outcomes 3.6, 4.6
Students understand the meaning of operations and how they relate to each other, and can communicate these through a range of media, including information and communication technologies. In T C KC2 KC7
relating to Outcomes 3.7, 4.7
Students use computational tools and strategies, and understand and represent the thinking processes employed in solving problems involving proportions. T KC6
relating to Outcomes 3.8, 4.8
• Recognises the existence of different number systems (eg Greek, Roman, Hindu–Arabic).
• Provides examples of the use of number in everyday life.
• Reads, writes and records numbers to 1 000 000, using numerals and words.
• Explains place value of digits in numbers to 1 000 000.
• Writes numbers to 1 000 000 in expanded form.
• Rounds to the nearest 10, 100, 1000, 10 000 and 100 000.
• Places numbers in descending and ascending order.
• Compares numbers and uses symbols (eg =, ≠, < and >).
• Explains mental strategies used to solve addition and subtraction problems.
• Chooses appropriately between mental, written and calculator methods for addition and subtraction problems.
• Develops an understanding of number systems across time and place (eg Mayan, Chinese).
• Recognises, uses and writes in words, numbers beyond 1 000 000.
• Identifies place value of numbers over 1 000 000.
• Compares numbers and uses symbols (eg ≈, ( ), ≥, ≤).
• Write numbers up to 1 000 000 in expanded form (eg using powers of 10).
• Uses power or index (exponents) notation.
• Writes numbers over 100 000 in ascending and descending order.
• Identifies large numbers in everyday use (eg comparing populations).
• Identifies factors, common factors, prime factors, highest common factor and lowest common multiple.
• Uses arrays and divisibility rules.
• Identifies triangular and cubic numbers.
• Applies square root to square numbers and uses the symbol √.
• Researches a different culture’s number system, past and present, and compares it to the Hindu–Arabic system used today.
• Rounds off numbers in multiples of 10 and to 1 and 2 significant figures.
• Uses index notation to express powers of numbers (positive indices only) and links this to the calculator using the power key.
• Recognises the link between squares and square roots, cubes and cube roots and uses the correct notation.
• Estimates using 1 and 2 figure working and applies this to problem solving.
• Uses the calculator to perform calculations including exponents.
• Explores common uses of positive and negative signs (eg temperature, loss and gain, north and south).
• Adds and subtracts directed numbers using a number line.
• Understands and uses rules for adding and subtracting directed numbers.
3.6 Represents and analyses relationships amongst number concepts and uses these to make sense of, and represent the world. In T KC1 KC2 3.7 Describes, represents and analyses operations with rational numbers and relationships between them. In T C KC1 KC2 3.8 Uses a variety of estimating and calculating strategies with whole numbers, including memorising multiplication and division facts, fractions and decimals. T KC 4.6 Represents and analyses relationships amongst integers and rational numbers and commonly encountered irrational numbers. In T KC1 4.7 Communicates understanding of the meaning of operations with integers and rational numbers, and how they relate to each other. In T C KC2 4.8 Applies appropriate computational tools and strategies to proportional situations involving integers, and rational numbers. T KC6 KC7
Possible starting points for planning, programming and assessing
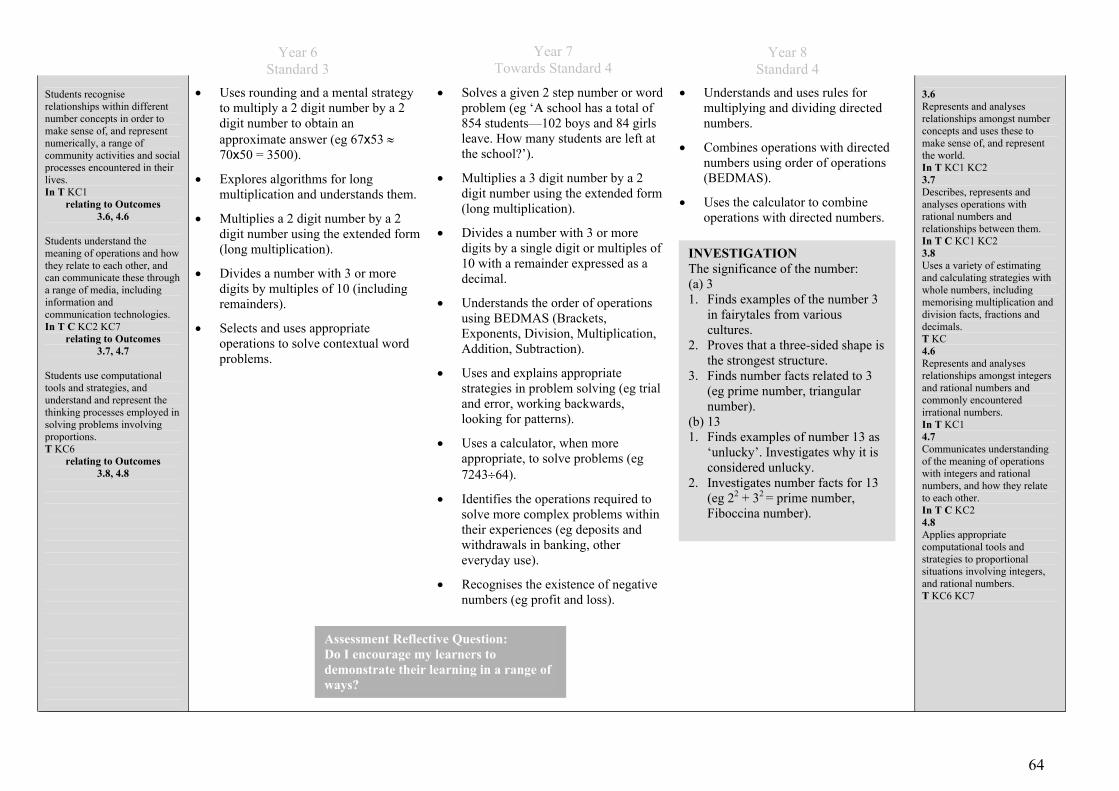
64
Students recognise relationships within different number concepts in order to make sense of, and represent numerically, a range of community activities and social processes encountered in their lives. In T KC1
relating to Outcomes 3.6, 4.6
Students understand the meaning of operations and how they relate to each other, and can communicate these through a range of media, including information and communication technologies. In T C KC2 KC7
relating to Outcomes 3.7, 4.7
Students use computational tools and strategies, and understand and represent the thinking processes employed in solving problems involving proportions. T KC6
relating to Outcomes 3.8, 4.8
• Uses rounding and a mental strategy to multiply a 2 digit number by a 2 digit number to obtain an approximate answer (eg 67x53 ≈ 70x50 = 3500).
• Explores algorithms for long multiplication and understands them.
• Multiplies a 2 digit number by a 2 digit number using the extended form (long multiplication).
• Divides a number with 3 or more digits by multiples of 10 (including remainders).
• Selects and uses appropriate operations to solve contextual word problems.
• Solves a given 2 step number or word problem (eg ‘A school has a total of 854 students—102 boys and 84 girls leave. How many students are left at the school?’).
• Multiplies a 3 digit number by a 2 digit number using the extended form (long multiplication).
• Divides a number with 3 or more digits by a single digit or multiples of 10 with a remainder expressed as a decimal.
• Understands the order of operations using BEDMAS (Brackets, Exponents, Division, Multiplication, Addition, Subtraction).
• Uses and explains appropriate strategies in problem solving (eg trial and error, working backwards, looking for patterns).
• Uses a calculator, when more appropriate, to solve problems (eg 7243÷64).
• Identifies the operations required to solve more complex problems within their experiences (eg deposits and withdrawals in banking, other everyday use).
• Recognises the existence of negative numbers (eg profit and loss).
• Understands and uses rules for multiplying and dividing directed numbers.
• Combines operations with directed numbers using order of operations (BEDMAS).
• Uses the calculator to combine operations with directed numbers.
3.6 Represents and analyses relationships amongst number concepts and uses these to make sense of, and represent the world. In T KC1 KC2 3.7 Describes, represents and analyses operations with rational numbers and relationships between them. In T C KC1 KC2 3.8 Uses a variety of estimating and calculating strategies with whole numbers, including memorising multiplication and division facts, fractions and decimals. T KC 4.6 Represents and analyses relationships amongst integers and rational numbers and commonly encountered irrational numbers. In T KC1 4.7 Communicates understanding of the meaning of operations with integers and rational numbers, and how they relate to each other. In T C KC2 4.8 Applies appropriate computational tools and strategies to proportional situations involving integers, and rational numbers. T KC6 KC7
Assessment Reflective Question: Do I encourage my learners to demonstrate their learning in a range of ways?
INVESTIGATION The significance of the number: (a) 3 1. Finds examples of the number 3
in fairytales from various cultures.
2. Proves that a three-sided shape is the strongest structure.
3. Finds number facts related to 3 (eg prime number, triangular number).
(b) 13 1. Finds examples of number 13 as
‘unlucky’. Investigates why it is considered unlucky.
2. Investigates number facts for 13 (eg 22 + 32 = prime number, Fiboccina number).
Year 6 Standard 3
Year 7 Towards Standard 4
Year 8 Standard 4

65
Learning Area: Mathematics Band: Middle Years Strand: Number Standards: 3 & 4
KEY IDEAS (refer p41 for Primary Years) Fractions, decimals, percentages, ratios and rates OUTCOMES
Year 6 Standard 3
Year 7 Towards Standard 4
Year 8 Standard 4
Students recognise relationships within different number concepts in order to make sense of, and represent numerically, a range of community activities and social processes encountered in their lives. In T KC1
relating to Outcomes 3.6, 4.6
Students understand the meaning of operations and how they relate to each other, and can communicate these through a range of media, including information and communication technologies. In T C KC2 KC7
relating to Outcomes 3.7, 4.7
Students use computational tools and strategies, and understand and represent the thinking processes employed in solving problems involving proportions. T KC6
relating to Outcomes 3.8, 4.8
• Provides examples of the use of decimals in everyday life.
• Explains the place value of tenths, hundredths and thousandths.
• Reads and writes decimals to thousandths, in both numerals and words.
• Writes decimals in expanded form (eg 1.25 = 1unit +2tenths +5hundreths or 1+0.2+0.05).
• Rounds to the nearest whole number, tenth or hundredth.
• Compares and orders decimals (descending and ascending).
• Uses symbols (eg =, ≠, < and >) to compare decimals.
• Adds or subtracts decimal numbers that have a different number of decimal places.
• Multiplies and divides tenths, hundredths and thousandths by a single digit to terminating numbers.
• Multiplies and divides decimal numbers, including money, by 10, 100 and 1000.
• Rounds off decimals to 3 places.
• Divides decimals by a whole number.
• Uses notation for recurring decimals such as 0.3.
• Multiplies decimal numbers by decimal numbers (eg 0.2x0.3 = 0.06).
• Divides decimals using a calculator (eg calculating averages).
• Converts decimals to fractions (eg 4.258 = 4258/1000).
• Uses decimals in problem solving.
• Compares the size of fractions (eg ‘Which is larger: 2/5 or 1/3?’).
• Compares and orders fractions in ascending or descending order (eg 1/3, 2/5, 7/8).
• Adds and subtracts fractions with different denominators, including improper fractions and whole numbers.
• Multiplies fractions including whole numbers and mixed numbers.
• Converts fractions to frequently used decimals and percentages (eg 2/5, 5/8, 2/3).
• Rounds numbers correctly to a given number of decimal places including when using a calculator.
• Adds, subtracts, multiplies and divides decimal numbers.
• Uses decimals in problem solving.
• Adds and subtracts mixed numbers.
• Multiplies and divides fractions.
• Finds the reciprocals of numbers.
• Uses the calculator to perform operations on fractions.
• Solves real-life problems involving fractions.
• Determines sets of equivalent fractions.
• Expresses information as a ratio.
• Simplifies ratios.
• Finds equal ratios.
• Uses equal ratios (proportion) to solve real-life problems (eg compares size of a photocopy with the original; ‘What is the ratio of teeth per gears on a bicycle? Is this the same for all bicycles?’).
3.6 Represents and analyses relationships amongst number concepts and uses these to make sense of, and represent the world. In T KC1 KC2 3.7 Describes, represents and analyses operations with rational numbers and relationships between them. In T C KC1 KC2 3.8 Uses a variety of estimating and calculating strategies with whole numbers, including memorising multiplication and division facts, fractions and decimals. T KC6 4.6 Represents and analyses relationships amongst integers and rational numbers and commonly encountered irrational numbers. In T KC1 4.7 Communicates understanding of the meaning of operations with integers and rational numbers, and how they relate to each other. In T C KC2 4.8 Applies appropriate computational tools and strategies to proportional situations involving integers, and rational numbers. T KC6
Possible starting points for planning, programming and assessing

66
Students recognise relationships within different number concepts in order to make sense of, and represent numerically, a range of community activities and social processes encountered in their lives. In T KC1
relating to Outcomes 3.6, 4.6
Students understand the meaning of operations and how they relate to each other, and can communicate these through a range of media, including information and communication technologies. In T C KC2 KC7
relating to Outcomes 3.7, 4.7
Students use computational tools and strategies, and understand and represent the thinking processes employed in solving problems involving proportions. T KC6
relating to Outcomes 3.8, 4.8
• Multiplies and divides decimal numbers, including money, by single digit numbers in everyday contexts (eg cost of 3 computer games at $29.95 each, cost of 1 iceblock if a pack of 8 costs $3.90).
• Continues, creates and describes patterns involving fractions (eg ¼, ½, ¾, 1).
• Converts fractions to lowest terms.
• Converts improper fractions to mixed numbers by division.
• Converts mixed numbers to improper fractions.
• Adds and subtracts simple fractions by changing one denominator (eg 2/3 + 1/6).
• Demonstrates understanding of addition and subtraction of fractions through everyday problem solving (eg ‘I ate half a pie and my friend ate two-thirds of a pie. How many pies did we need? How much pie is left over?’).
• Converts simple decimals to fractions (eg 0.125 = 125/1000 = 1/8, 0.25 = 25/100 = 1/4).
• Converts fractions to decimals (eg 3/4 = 75/100 = 0.75).
• Explains the use of percentages in everyday life.
• Expresses simple fractions and decimals as percentages (eg 50% = 50/100 = 1/2).
• Expresses everyday percentages as fractions and decimals (eg 10%, 20%, 25%, 50%, 75%, 100%).
• Compares quantities using ratios.
• Converts percentages to fractions and decimals.
• Converts fractions and decimals to percentages.
• Expresses fractions of quantities as percentages (eg 20 out of 25 is 4/5 is 80%).
• Finds simple percentages of quantities (eg 20% of $80) using both pen and paper and calculator.
• Finds discount as a percentage of a given amount of money.
• Solves practical problems involving percentage (eg simple interest, banking problems).
• Compares quantities using ratios in problem solving.
• Uses ratios to divide quantities (eg divide $120 in the ratio 2:3).
• Applies ratios to scale diagrams.
• Expresses information as a rate (eg a runner sprints 100 metres in 12 seconds: expressed as a rate = 8.3m/s).
• Uses rates to solve real-life problems.
• Expresses one quantity as a percentage of another.
• Finds percentages of quantities (eg 18% of $72).
• Finds a percentage of a quantity when given another (eg finds 80% of a quantity if 15% is 30).
• Calculates percentage change.
• Uses percentages to calculate profit and loss.
• Calculates the GST on various items.
3.6 Represents and analyses relationships amongst number concepts and uses these to make sense of, and represent the world. In T KC1 KC2 3.7 Describes, represents and analyses operations with rational numbers and relationships between them. In T C KC1 KC2 3.8 Uses a variety of estimating and calculating strategies with whole numbers, including memorising multiplication and division facts, fractions and decimals. T KC6 4.6 Represents and analyses relationships amongst integers and rational numbers and commonly encountered irrational numbers. In T KC1 4.7 Communicates understanding of the meaning of operations with integers and rational numbers, and how they relate to each other. In T C KC2 4.8 Applies appropriate computational tools and strategies to proportional situations involving integers, and rational numbers. T KC6 KC7
INVESTIGATION Newspapers provide a rich source of mathematical investigations. Examine bias in reporting with respect to elections, refugees, religion and terrorism using the number of stories, pictures and columns. Compare the television coverage and pages allocated to various sports.
Year 6 Standard 3
Year 7 Towards Standard 4
Year 8 Standard 4

67
BAND: Middle Years
Pattern andalgebraic reasoning
Representing
Describing
Analysing
Creating patterns
Tables
Graphs
Words
WordsSymbols
Predicting
Numeric Spatial
Modelling
Investigating (rates of change)
Range of contexts
Extracting information
Linear equations
Social relevance
Explaining real
situations
Predicting
Questioning
Science
Business
Social
Sport
KEY IDEAS Students demonstrate, record and report on logical and criticalthought processes by searching for and abstracting generationalalgebraic representations from patterns drawn from current social situations. Students analyse mathematical structures and use algebraic formulae to represent situations. They further develop the capacity to express themselves, and to solve problems involving linear relationships. Students use mathematical models to make connections and analyse how things might change in both real and abstract contexts. They extract information from tables of data and graphs, making comparisons between varying rates of change, and predicting future events.
OUTCOMES
F T KC1 KC2
3.9 Describes and generalises relationships between measurable attributes as patterns and explains the impact of varying one aspect of the relationship.
T C KC6
3.10 Analyses, creates and generalises numerical and spatial patterns and solves problems with such patterns.
In T
3.11 Uses mathematical representations to make connections and analyse change.
Generalising relationships
AnalysingchangeTables
Graphs
Representing change
Algebraic expressions
Linear Non-linear
Predicting
Using symbolicrepresentations
Solving problems
Investigating linear inequations
Generalising
Variables and constants
Graphically
Backtracking
Trial and error
Cause and effect
OUTCOMES
F T KC1 KC6
4.9 Analyses, creates and generalises numeric and visual patterns to solve problems in a range of situations.
T C KC6
4.10 Uses symbolic algebra to represent situations and manipulate the symbolic representations to solve problems involving linear equations and inequations; gives simple algebraic proofs.
In T
4.11 Models contextualised situation, making connections and analysing change.
This concept map provides a visual representation of the Key Ideas and Outcomes below. Educators may prefer to develop their own.
CONCEPT MAP: PATTERN AND ALGEBRAIC REASONING
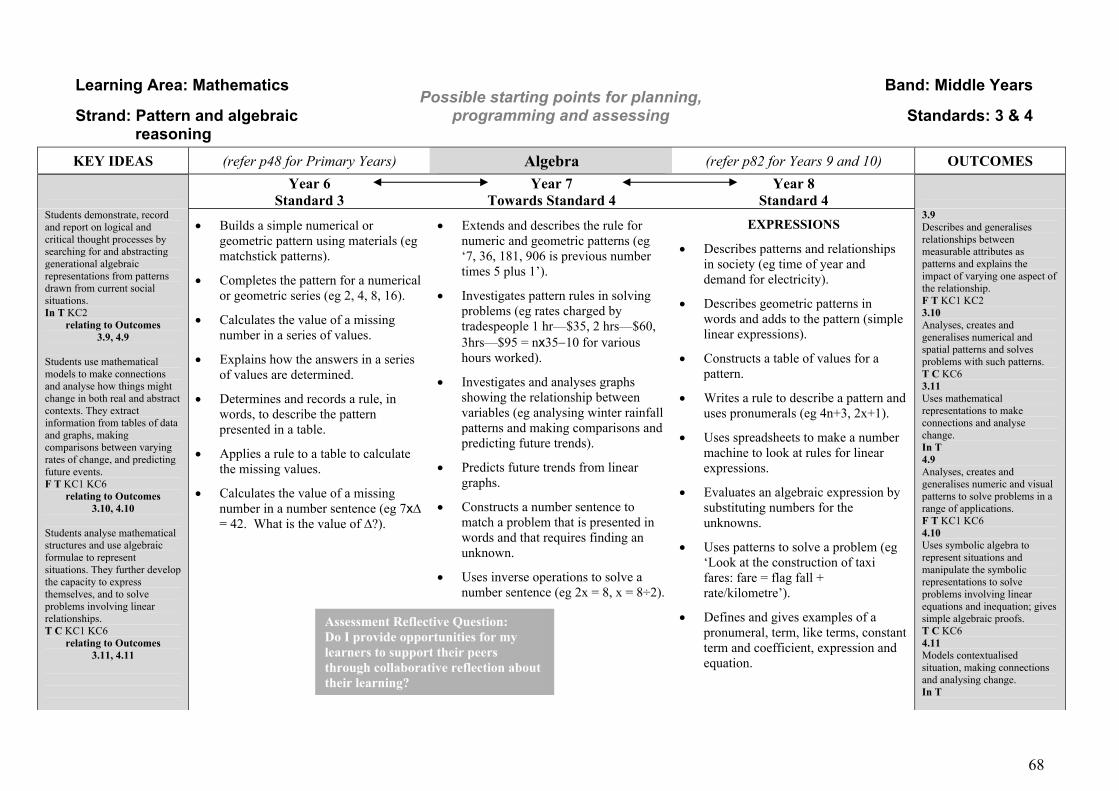
68
Learning Area: Mathematics Band: Middle Years Strand: Pattern and algebraic Standards: 3 & 4 reasoning
KEY IDEAS (refer p48 for Primary Years) Algebra (refer p82 for Years 9 and 10) OUTCOMES
Year 6 Standard 3
Year 7 Towards Standard 4
Year 8 Standard 4
Students demonstrate, record and report on logical and critical thought processes by searching for and abstracting generational algebraic representations from patterns drawn from current social situations. In T KC2
relating to Outcomes 3.9, 4.9
Students use mathematical models to make connections and analyse how things might change in both real and abstract contexts. They extract information from tables of data and graphs, making comparisons between varying rates of change, and predicting future events. F T KC1 KC6
relating to Outcomes 3.10, 4.10
Students analyse mathematical structures and use algebraic formulae to represent situations. They further develop the capacity to express themselves, and to solve problems involving linear relationships. T C KC1 KC6
relating to Outcomes 3.11, 4.11
• Builds a simple numerical or geometric pattern using materials (eg matchstick patterns).
• Completes the pattern for a numerical or geometric series (eg 2, 4, 8, 16).
• Calculates the value of a missing number in a series of values.
• Explains how the answers in a series of values are determined.
• Determines and records a rule, in words, to describe the pattern presented in a table.
• Applies a rule to a table to calculate the missing values.
• Calculates the value of a missing number in a number sentence (eg 7x∆ = 42. What is the value of ∆?).
• Extends and describes the rule for numeric and geometric patterns (eg ‘7, 36, 181, 906 is previous number times 5 plus 1’).
• Investigates pattern rules in solving problems (eg rates charged by tradespeople 1 hr—$35, 2 hrs—$60, 3hrs—$95 = nx35−10 for various hours worked).
• Investigates and analyses graphs showing the relationship between variables (eg analysing winter rainfall patterns and making comparisons and predicting future trends).
• Predicts future trends from linear graphs.
• Constructs a number sentence to match a problem that is presented in words and that requires finding an unknown.
• Uses inverse operations to solve a number sentence (eg 2x = 8, x = 8÷2).
EXPRESSIONS
• Describes patterns and relationships in society (eg time of year and demand for electricity).
• Describes geometric patterns in words and adds to the pattern (simple linear expressions).
• Constructs a table of values for a pattern.
• Writes a rule to describe a pattern and uses pronumerals (eg 4n+3, 2x+1).
• Uses spreadsheets to make a number machine to look at rules for linear expressions.
• Evaluates an algebraic expression by substituting numbers for the unknowns.
• Uses patterns to solve a problem (eg ‘Look at the construction of taxi fares: fare = flag fall + rate/kilometre’).
• Defines and gives examples of a pronumeral, term, like terms, constant term and coefficient, expression and equation.
3.9 Describes and generalises relationships between measurable attributes as patterns and explains the impact of varying one aspect of the relationship. F T KC1 KC2 3.10 Analyses, creates and generalises numerical and spatial patterns and solves problems with such patterns. T C KC6 3.11 Uses mathematical representations to make connections and analyse change. In T 4.9 Analyses, creates and generalises numeric and visual patterns to solve problems in a range of applications. F T KC1 KC6 4.10 Uses symbolic algebra to represent situations and manipulate the symbolic representations to solve problems involving linear equations and inequation; gives simple algebraic proofs. T C KC6 4.11 Models contextualised situation, making connections and analysing change. In T
Possible starting points for planning, programming and assessing
Assessment Reflective Question: Do I provide opportunities for my learners to support their peers through collaborative reflection about their learning?

69
Students demonstrate, record and report on logical and critical thought processes by searching for and abstracting generational algebraic representations from patterns drawn from current social situations. In T KC2
relating to Outcomes 3.9, 4.9
Students use mathematical models to make connections and analyse how things might change in both real and abstract contexts. They extract information from tables of data and graphs, making comparisons between varying rates of change, and predicting future events. F T KC1 KC6
relating to Outcomes 3.10, 4.10
Students analyse mathematical structures and use algebraic formulae to represent situations. They further develop the capacity to express themselves, and to solve problems involving linear relationships. T C KC1 KC6
relating to Outcomes 3.11, 4.11
• Collects like terms in expressions with 1 and 2 pronumerals.
• Uses index notation to collect like items (eg 3xaxaxbxbxb = 3a2b3).
• Uses the distributive law to expand brackets and simplify (eg 3(2x+y) = 6x+3y).
EQUATIONS
• Solves simple linear equations by inspection or trial and error.
• Undoes algebraic expressions using inverse operations.
• Solves linear equations containing 2 or more operations.
• Solves worded problems by constructing equations and solving them.
• Plots and describes points in the four quadrants of the Cartesian plane.
• Graphs the values from a given table or a grid.
• Describes the pattern formed when a graph is drawn from a table of values (ie writes the rule).
• Describes and models a situation, makes connections and analyses it (eg looks at a fun run fundraiser in relation to sponsorship rates, models the different rates, graphs and analyses).
3.9 Describes and generalises relationships between measurable attributes as patterns and explains the impact of varying one aspect of the relationship. F T KC1 KC2 3.10 Analyses, creates and generalises numerical and spatial patterns and solves problems with such patterns. T C KC6 3.11 Uses mathematical representations to make connections and analyse change. In T 4.9 Analyses, creates and generalises numeric and visual patterns to solve problems in a range of applications. F T KC1 KC6 4.10 Uses symbolic algebra to represent situations and manipulate the symbolic representations to solve problems involving linear equations and inequation; gives simple algebraic proofs. T C KC6 4.11 Models contextualised situation, making connections and analysing change. In T
Year 8 Standard 4

70
Learning Area: Mathematics Band: Middle Years Strand: Spatial sense and Standards: 3 & 4 geometric reasoning
KEY IDEAS Lines and angles (refer p84 for Years 9 and 10) OUTCOMES Year 6
Standard 3 Year 7
Towards Standard 4 Year 8
Standard 4 Students explore and analyse features in their immediate and extended environment in geometric terms. They compare perspectives of spatial sense and geometric reasoning in order to understand different human interactions with their environment. Id In T KC1
relating to Outcomes 3.12, 4.12
• Uses symbols for ‘is parallel to’ ( ║ ) and ‘is perpendicular to’ ( ┴ ).
• Identifies and draws perpendicular lines.
• Names and labels lines, rays and line segments (eg AB, AB, AB).
• Uses common conventions to indicate right angles, equal angles and parallel lines, as shown below.
• Classifies and identifies angles as right, acute, obtuse, reflex, straight or a revolution.
• Constructs, labels and names angles using letters of the alphabet (eg ∠ABC).
• Estimates and measures angles in degrees using protractor and geometry software.
• Constructs an angle of a given size using a protractor.
• Applies understanding of angles to spatial sense and geometric reasoning activities (eg movement of the hands of a clock).
• Proves and uses the fact that the sum of the interior angles of a triangle is 180º.
• Uses the terms lines, points, rays, segments, intersections, parallel and perpendicular when constructing diagrams (eg using drawing software to design a moving analogue clock).
• Bisects angles using a compass.
• Constructs triangles when only the lengths of sides are given.
• Uses understanding of angles to determine compass bearings and true bearings.
• Draws a 2-D shape given a description of its side and angle properties, using geometric software or a ruler, protractor and set square.
• Identifies the terminology of a circle: radius, diameter, circumference.
• Determines angle properties relating to straight lines, intersecting lines, parallel lines and a transversal by using geometry software.
• Uses the angle properties of parallel lines to determine unknown angles: corresponding, alternate, allied and vertically opposite.
• Calculates unknown interior and exterior angles of a triangle.
• Determines the sum of interior angles of any n-sided polygon using triangles.
3.12 Describes and generalises spatial relationships within and between groups of 2-D and 3-D shapes and objects and appreciates their application in a range of cultural contexts. Id In KC2 4.12 Identifies characteristics and properties of 2-D and 3-D shapes and objects and understands how these have influenced the built environment. In KC1
Possible starting points for planning, programming and assessing

71
Students explore and analyse features in their immediate and extended environment in geometric terms. They compare perspectives of spatial sense and geometric reasoning in order to understand different human interactions with their environment. Id In T KC1
relating to Outcomes 3.12, 4.12
• Proves and uses the fact that the sum of the interior angles of a quadrilateral is 360º.
• Understands the meaning of the term congruence.
• Recognises congruence in lines, shapes and solids.
• Applies understanding of angles to spatial sense and geometric reasoning activities (eg movement of the hands of a clock).
3.12 Describes and generalises spatial relationships within and between groups of 2-D and 3-D shapes and objects and appreciates their application in a range of cultural contexts. Id In KC2 4.12 Identifies characteristics and properties of 2-D and 3-D shapes and objects and understands how these have influenced the built environment. In KC1
Year 6 Standard 3

72
Learning Area: Mathematics Band: Middle Years Strand: Spatial sense and Standards: 3 & 4 geometric reasoning
KEY IDEAS (refer p50 for Primary Years) 2-D shapes and 3-D objects OUTCOMES
Year 6 Standard 3
Year 7 Towards Standard 4
Year 8 Standard 4
Students explore and analyse features in their immediate and extended environment in geometric terms. They compare perspectives of spatial sense and geometric reasoning in order to understand different human interactions with their environment. Id In T KC1
relating to Outcomes 3.12, 4.12
• Constructs a model of a simple 3-D object from drawings of different views.
• Uses the appropriate terms in describing 3-D objects, including base, edge, surface, vertex and face.
• Visualises and sketches simple solids from different views.
• Constructs a model of a simple solid from an isometric drawing.
• Identifies and names the properties of rectangular prisms and triangular prisms.
• Identifies and names the properties of square-based and triangular-based pyramids.
• Uses the formal names for prisms and identifies pyramids.
• Names the properties of square-based and triangular-based pyramids.
• Compares and describes the side and angle properties of isosceles, equilateral and scalene triangles.
• Identifies isosceles, scalene and equilateral triangles.
• Identifies 2-D shapes within patterns across cultures and in nature (eg an investigation of Islamic design).
• Classifies solids in terms of their geometric properties (ie faces, edges, vertices and cross-sections).
• Draws 3-D solids.
• Identifies and names properties of polyhedra (eg tetrahedron, pentagonal prism, hexagonal prism).
• Constructs complex solids from nets (eg hexagonal-based pyramid).
• Draws oblique and isometric projections of cubes using paper or drawing software.
• Recognises the properties of quadrilaterals.
• Constructs, names and classifies scalene, isosceles and equilateral triangles.
• Determines unknown angles in quadrilaterals and triangles.
• Identifies faces, vertices and edges of polyhedra and looks at relationships (eg Euler’s formula).
• Develops nets to construct complex 3-D objects (eg soccer ball).
• Uses ICTs to investigate nets of more complex objects (eg crystals, soccer ball).
• Critiques the use of 2-D shapes and 3-D objects in common applications (eg Packaging: ‘Why are milk cartons square in cross-section?’, Architecture: ‘How are triangles used for strength in building?’).
• Uses isometric graph paper to draw 3-D constructions.
3.12 Describes and generalises spatial relationships within and between groups of 2-D and 3-D shapes and objects and appreciates their application in a range of cultural contexts. Id In KC2 4.12 Identifies characteristics and properties of 2-D and 3-D shapes and objects and understands how these have influenced the built environment. In KC1
Possible starting points for planning, programming and assessing
Assessment Reflective Question: Do I use learner achievement data to support and plan for future learning?

73
Learning Area: Mathematics Band: Middle Years Strand: Spatial sense and Standards: 3 & 4 geometric reasoning
KEY IDEAS (refer p52 for Primary Years) Transformation OUTCOMES
Year 6 Standard 3
Year 7 Towards Standard 4
Year 8 Standard 4
Students analyse and understand the uses and purposes of flips (reflection), slides (translation), rotations and dilations to explore geometric relationships and alternative preferred possibilities in the physical world. F T KC1 KC6
relating to Outcomes 3.13, 4.13
• Rotates shapes clockwise and anticlockwise.
• Identifies and names shapes that have rotational symmetry.
• Uses both pen and paper and geometry software to construct a shape that has rotational symmetry.
• Recognises tessellations in the everyday environment (eg weaving).
• Makes enlargements and reductions of 2-D shapes, pictures and maps using pen and paper or using geometry software.
• Discusses similarities and differences of the same object or scene represented in different sizes (eg drawings enlarged on a photocopier, drawings or pictures using geometry software).
• Rotates a shape about a point (eg rotates 90º clockwise).
• Reflects a complex shape or design on a line.
• Translates shapes over a given distance (eg translates the shape 5 squares horizontally to the left on grid paper).
• Enlarges and reduces shapes using a scale.
• Creates tessellation using rotation, translation and reflection (eg using drawing software).
• Identifies rotational symmetry.
• Constructs a mirror image of designs using a line of symmetry.
• Uses line and rotational symmetry to classify polygons and polyhedra.
• Creates a complex tessellating shape by using translation, rotation or reflection to modify a simple shape.
• Identifies functional and aesthetic uses of tessellation in social contexts (eg paving, the works of M C Escher, patterns).
• Performs 2 step geometrical transformations using grid paper or drawing software.
• Describes various transformations.
3.13 Analyses the result of a series of flips, slides, rotations and reflections and translations and uses scales to undertake enlargements and reductions of figures and objects. T C KC1 4.13 Identifies, represents and justifies one and two step geometrical transformations. T C KC1
Possible starting points for planning, programming and assessing

74
Learning Area: Mathematics Band: Middle Years Strand: Spatial sense and Standards: 3 & 4 geometric reasoning
KEY IDEAS (refer p53 for Primary Years) Location and position OUTCOMES
Year 6 Standard 3
Year 7 Towards Standard 4
Year 8 Standard 4
Students develop and extend their capacity to solve problems in multi-layered and abstract ways in order to produce accurate maps, graphs and models. T C KC6
relating to Outcomes 3.14, 4.14
• Uses a coordinate grid to make simple 2-D shapes (eg ‘At what coordinates would the vertices of a square be placed?’).
• Reads and interprets maps, plans, scale drawings and diagrams that have been drawn to scale.
• Reads and writes scales in words and through diagrams (eg 1cm represents 5km; 1:500 000).
• Recognises and uses the cardinal and intermediate points on a magnetic compass.
• Uses a magnetic compass to find north and hence the direction associated with the other three major compass points.
• Identifies and records familiar routes, locations and objects in their environment.
• Draws environmental and geometric objects from different perspectives.
• Describes and draws what is seen and not seen from different views of 3-D objects (eg pyramids, prisms).
• Draws 3-D objects using solid lines for visible edges and dotted lines for invisible edges (eg makes use of interactive geometry software).
• Recognises that a location can be represented on maps or plans using different scales.
• Uses a scale to calculate the distance between two points on a map.
• Reads, writes and uses scales in words in problem solving.
• Produces scaled plans (eg classroom, bedroom) and responds to the question: ‘What scales are used in commercial applications (eg buildings, orienteering maps, atlas maps)?’
• Evaluates maps and plans in terms of appropriateness of scale, use of symbols, appropriateness for task, clarity of purpose and accuracy etc.
• Uses a Cartesian grid to plot points and lines and develop a relationship to describe the lines.
• Uses bearings and distance to describe a position (eg street directories, treasure maps).
3.14 Produces, uses and critiques scaled maps and plans and envisages alternative possibilities. F T KC3 4.14 Represents and uses location maps, pathways diagrams and network diagrams to describe current and possible future characteristics of the physical world. F T KC1 KC6
Possible starting points for planning, programming and assessing

75
Students develop and extend their capacity to solve problems in multi-layered and abstract ways in order to produce accurate maps, graphs and models. T C KC6
relating to Outcomes 3.14, 4.14
• Uses coordinate grids to make more complex 2-D shapes (eg making a picture).
• Explains a pathway to a location on a model, map or plan using distance, direction, angle multiples of 45º, compass points and coordinates.
• Finds alternative routes using a scale (eg to find the shortest route between two points).
• Follows simple directions to move from point to point on a given path, using maps, a magnetic compass and written and oral instructions.
• Develops a simple orienteering course.
3.14 Produces, uses and critiques scaled maps and plans and envisages alternative possibilities. F T KC3 4.14 Represents and uses location maps, pathways diagrams and network diagrams to describe current and possible future characteristics of the physical world. F T KC1 KC6
Year 7 Towards Standard 4

76
Learning Area: Mathematics Band: Middle–Senior Years Strand: Exploring, analysing and Standard: 5 modelling data
KEY IDEAS (refer p55 for Years 6, 7 and 8) OUTCOMES Year 9
Towards Standard 5 Year 10
Standard 5 Students engage with data by developing skills in posing questions, and collecting, organising, representing, critiquing and communicating data to help answer those questions. In T C KC1 KC2
relating to Outcome 5.1
Students use critical appraisal to interpret data using methods of exploratory data analysis, while developing and evaluating predictions, inferences and arguments from data. F T C KC1 KC6
relating to Outcome 5.2
Students understand basic notions of chance and probability, apply them to social situations, and report on their findings. F In T KC2
relating to Outcome 5.3
REFER: Concept Map p54
• Works with student generated and published data.
• Recognises bias in a sample.
• Arranges discrete data in an ordered stem and leaf plot (eg What is the price of petrol over a week?).
• Places dependent and independent variables from a data set on appropriate axes.
• Organises and displays discrete data by creating a frequency table and column graph, with and without ICTs.
• Recognises the symmetry or skewness of a distribution.
• Recognises outliers through observation.
• Compares data sets using compound graphs including back to back stem and leaf plots, side by side column graphs (eg compares sports people from different eras such as Bradman and Ponting).
• Finds the mean, median and mode from a table, column graph or stem and leaf plot (eg body maths: calculate the average student in the class using height and hand span).
• Represents data using box plots and uses them for statistical argument.
• Makes predictions based on data representations.
• Interprets data and demonstrates an understanding of the limitations of any data set.
• Uses random sampling techniques to collect data.
• Organises, sorts and stores raw data and scans it for errors, and reports on reasons for inconsistencies.
• Interprets data presented as graphs and tables and describes the distribution of the data.
• Constructs histograms for continuous data sets (eg Dying for a smoke in Chance & data investigations. Vol 2—refer Resources).
• Finds measures of the centre from a distribution when data is given in various forms, and chooses which measures are appropriate (eg body maths: measure the growth in height of the class over the year).
• Finds measures of spread of a data set including range, interquartile range and standard deviation.
• Finds the minimum value, lower quartile, upper quartile, median and maximum value for a data set (5 number summary) using manual and electronic means.
• Represents and records trends in scatter plots and, where appropriate, sketches lines of best fit, reporting on implications (eg compare height with arm span—‘Are Year 10 students squares?’).
• Represents and analyses data (eg ‘Is the AFL a truly national competition?’ Hint: compare the clubs from which players are recruited).
5.1 Plans experiments and surveys; checks data for inconsistencies; and represents and reports on central tendency and spread of data. T C KC2 KC3 5.2 Displays and summarises data to show location and spread, while interpreting and critiquing collected and published data from a variety of sources and perspectives (describing distributions, and making comparisons, inferences and predictions where appropriate). F T C KC1 5.3 Calculates probabilities in a variety of situations involving chance, including situations involving compound events. F In T KC6
Possible starting points for planning, programming and assessing

77
Learning Area: Mathematics Band: Middle–Senior Years Strand: Exploring, analysing and Standard: 5 modelling data
KEY IDEAS (refer p56 for Years 6, 7 and 8) OUTCOMES Year 9
Towards Standard 5 Year 10
Standard 5 Students engage with data by developing skills in posing questions, and collecting, organising, representing, critiquing and communicating data to help answer those questions. In T C KC1 KC2
relating to Outcome 5.1
Students use critical appraisal to interpret data using methods of exploratory data analysis, while developing and evaluating predictions, inferences and arguments from data. F T C KC1 KC6
relating to Outcome 5.2
Students understand basic notions of chance and probability, apply them to social situations, and report on their findings. F In T KC2
relating to Outcome 5.3
• Describes probabilities in qualitative terms ranging from impossible to certain.
• Selects and adds own choice of five chance events to a class number line of 0 to 100% certainty of occurring (eg chance of getting a puncture this week).
• Assigns and interprets numerical values in decimal/fraction form to probabilities.
• Performs experiments and determines probabilities (eg uses computer generated simulations).
• Determines probabilities using tree diagrams and 2-D grids, with and without replacement (eg Duelling dice, Pass the pigs and Yahtzee).
• Interprets data and makes numerical statements about probability.
• Understands and uses complementary events in probability.
• Investigates and calculates probabilities involving compound events (eg If 85% is returned to the owner of a poker machine, calculate the chance of winning).
• Writes a report using maths reporting writing genre.
• Calculates the probability of independent and dependent events, using Venn diagrams where appropriate (eg boys, girls and pets, large Venn diagram circles in the yard—students stand in the appropriate region).
Website: <http://www.mercury.com.au/nie/mathguys/details>
5.1 Plans experiments and surveys; checks data for inconsistencies; and represents and reports on central tendency and spread of data. T C KC2 KC3 5.2 Displays and summarises data to show location and spread, while interpreting and critiquing collected and published data from a variety of sources and perspectives (describing distributions, and making comparisons, inferences and predictions where appropriate). F T C KC1 5.3 Calculates probabilities in a variety of situations involving chance, including situations involving compound events. F In T KC6
Possible starting points for planning, programming and assessing
INVESTIGATIONS Discuss the reliable and ethical use of data. How can data be used to solve a complex problem? Consider posing a question and using data to support your discussion.
INVESTIGATION Lobby groups can often change decisions made. Can you plan for the use of data to provide input into supporting one side of a local issue?

78
Learning Area: Mathematics Band: Middle–Senior Years Strand: Measurement Standard: 5
KEY IDEAS (refer p57 for years 6, 7 and 8) OUTCOMES Year 9
Towards Standard 5 Year 10
Standard 5 Students extend their capacity to think mathematically. They analyse and make connections between measurements, select and develop strategies to solve a variety of problems, and select means of communicating results appropriate in a range of contexts. In T C KC1 KC2 KC6
relating to Outcome 5.4
Students select from and apply a variety of techniques, tools and formulae for determining measurements accurately in a range of educational, recreational and occupational situations. Id T C KC2
relating to Outcome 5.5
LENGTH, AREA AND VOLUME
• Chooses appropriate instruments to measure in 2-D and 3-D situations.
• Gives reasonable estimates of length, area or volume of an original from a scaled map, model, plan or photograph.
• Selects and uses suitable formulae and measurements to calculate a wide range of quantities including perimeter, area and volume.
• Constructs formulae for composite shapes.
• Makes conversions between volume units: mm3, cm3, m3, km3.
• Calculates surface areas of regular shapes.
• Develops techniques to calculate irregular areas.
• Develops processes for determining dimensions of 2-D shapes and 3-D objects given a fixed area or volume (eg ‘If volume = 1 litre, what are the possible dimensions?’).
PYTHAGORAS THEOREM • Uses investigation to find the rule of Pythagoras,
using terms that include hypotenuse, adjacent side and opposite side.
LENGTH, AREA AND VOLUME
• Understands and uses formulae in practical situations for the surface area of cones and spheres (eg Maths 300: cylinder, volumes and Pacific Ocean).
• Uses formulae for the volume of a pyramid, cone and sphere and applies these to practical situations (eg compare the volume of a piece of A4 paper folded lengthwise or widthwise. Maths 300: cylinder, volumes and Pacific Ocean).
• Analyses problems and chooses the appropriate measurement formulae to solve them (eg ‘Given this object, calculate its density’).
• Explains the compounding effect of errors in calculations involving measurement.
TRIGONOMETRY • Investigates the relationships between angles and
lengths of sides in similar right-angled triangles.
• Understands the three trigonometric ratios: sine θ, cosine θ and tangent θ.
5.4 Appropriately selects, uses and communicates attributes, units and systems of measurement. In T C KC1 KC2 5.5 Applies a variety of techniques and tools, and manipulates formulae to solve and report on everyday and community problems. In T C KC2 KC6
INVESTIGATION There are many moral, ethical and mathematical issues related to packaging. What methods could you use to solve some of the issues and do these help to design better packaging to suit a commonly used product (eg a container for fruit juice)?
Possible starting points for planning, programming and assessing

79
Students extend their capacity to think mathematically. They analyse and make connections between measurements, select and develop strategies to solve a variety of problems, and select means of communicating results appropriate in a range of contexts. In T C KC1 KC2 KC6
relating to Outcome 5.4
Students select from and apply a variety of techniques, tools and formulae for determining measurements accurately in a range of educational, recreational and occupational situations. Id T C KC2
relating to Outcome 5.5
• Finds the lengths of sides of right-angled triangles using Pythagoras theorem.
• Uses the converse of Pythagoras theorem to check for right-angled triangles.
• Applies Pythagoras theorem in appropriate contexts (eg MCTP—Right-angle police, Maths 300 Sliding ladder).
• Draws and compares graphs of y = sine θ, y = cosine θ and y = tangent θ.
• Uses the three trigonometric ratios to find unknown sides and angles in right-angled triangles.
5.4 Appropriately selects, uses and communicates attributes, units and systems of measurement. In T C KC1 KC2 5.5 Applies a variety of techniques and tools, and manipulates formulae to solve and report on everyday and community problems. In T C KC2 KC6
Year 9 Towards Standard 5
Year 10 Standard 5

80
Learning Area: Mathematics Band: Middle–Senior Years Strand: Number Standard: 5
KEY IDEAS (refer p63 for Years 6, 7 and 8) OUTCOMES Year 9
Towards Standard 5 Year 10
Standard 5 Students understand concepts of ‘number’, ways of representing numbers, relationships among numbers, number systems and the concept of numbers represented in logarithmic form. They report on their conceptualisation, and understand that numbers have cultural bases. In T C KC2
relating to Outcome 5.6
Students understand and report on the meaning of operations, how they relate to each other and their use in modelling growth and change. F In T C KC2
relating to Outcome 5.7
Students select and use computational tools and strategies fluently, and estimate appropriately. T C KC6
relating to Outcome 5.8
IRRATIONAL NUMBERS • Evaluates and/or approximates square roots.
• Understands the difference between rational and irrational numbers (eg π Website: Can you find your telephone number in π to ten million places?).
• Understands what a surd is and uses a calculator to approximate the value of any surd.
SCIENTIFIC NOTATION • Uses scientific notation in developing an
understanding of very large and very small numbers (eg develops a poster showing examples of very large and very small numbers).
• Interprets and uses scientific notation using a calculator and/or computer to do calculations involving very large or very small numbers.
BUSINESS APPLICATIONS • Develops further understanding of financial
applications by: - using and understanding the simple interest
formula
INDEX FORM • Simplifies surds.
• Operates with surds (eg The Golden Ratio—refer to Suggested Websites in Resources list).
• Evaluates numbers in index form with positive and negative powers.
• Evaluates numbers in index form with rational powers (eg Calculator search for √2 in MCTP Vol 2—refer to Resources list—uses iterations).
• Evaluates expressions using numbers in scientific notation.
• Applies knowledge of index rules to real-world situations.
BUSINESS APPLICATIONS • Shows understanding of a range of financial
mathematics calculations using ICTs and other methods by: - calculating incomes based on different modes of
payment
5.6 Uses numbers, relationships among numbers and number systems and represents and discusses these understandings with others. In T C KC2 5.7 Demonstrates and justifies understanding of the meaning of operations with numbers, and how they relate to each other in modelling growth and change. F In T C KC2 5.8 Uses computational tools and strategies fluently and can estimate appropriately. T C
Possible starting points for planning, programming and assessing
INVESTIGATION Estimate the diameter of a circle where the centre is not shown.

81
Students understand concepts of ‘number’, ways of representing numbers, relationships among numbers, number systems and the concept of numbers represented in logarithmic form. They report on their conceptualisation, and understand that numbers have cultural bases. In T C KC2
relating to Outcome 5.6
Students understand and report on the meaning of operations, how they relate to each other and their use in modelling growth and change. F In T C KC2
relating to Outcome 5.7
Students select and use computational tools and strategies fluently, and estimate appropriately. T C KC6
relating to Outcome 5.8
- performing and understanding compound interest
calculations with and without the compound interest formula
- using percentage calculations with graphs, charts and tables to analyse information (eg Roll your own discount in Finlay & Lowe Chance and data—refer to Resources list).
- calculating additional payments based on
overtime, annual leave loading, allowance and bonuses
- calculating net pay - calculating taxable income and tax payable - comparing operating costs of various mobile
phone plans - working out how long will it take for $10 to
become a $1 000 000 at different rates of interest - pay rates—Sunday trading and age of workers - calculating percentage mark-ups and mark-downs
(eg poker machines, newspapers) - understanding and performing percentage chain
calculations - calculating loan repayments - constructing personal budgets.
(refer to Suggested Websites: Dollars and sense, Infochoice, Spend well in Resources list.)
5.6 Uses numbers, relationships among numbers and number systems and represents and discusses these understandings with others. In T C KC2 5.7 Demonstrates and justifies understanding of the meaning of operations with numbers, and how they relate to each other in modelling growth and change. F In T C KC2 5.8 Uses computational tools and strategies fluently and can estimate appropriately. T C
Year 9 Towards Standard 5
INVESTIGATION There is a commonly held view that the ability of Australian students to understand fractions, has decreased since February 14, 1966. Why is this so? Apart from this event, what other events may have contributed further to a decline in the ability to manipulate fractions?
INVESTIGATION Is it true that some banks in Australia make profits in excess of $2 000 000 000 per year? How are bank fees structured? Demonstrate how they are related to bank profits.
Year 10 Standard 5

82
Learning Area: Mathematics Band: Middle–Senior Years Strand: Pattern and algebraic Standard: 5 reasoning
KEY IDEAS (refer p68 for Years 6, 7 and 8) OUTCOMES Year 9
Towards Standard 5 Year 10
Standard 5 Students recognise various families of functions, and analyse the effects of changes, in describing and analysing local and global behaviour of functions from a variety of contexts. In T C KC1
relating to Outcome 5.9
Students use symbolic forms to represent, analyse and communicate mathematical situations and structure, in order to devise logical and creative solutions to contemporary problems ranging from proving identities to logical understanding of the argument by mathematical induction. T C KC1 KC2
relating to Outcome 5.10
Students use mathematical models to make connections and analyse how things might change in both real and abstract contexts. They employ skills of interpolation and extrapolation to make and communicate informed judgments about future events, and what could influence them. F In T C KC1 KC2 KC6
relating to Outcome 5.11
REFER: Concept Map p67
EXPRESSIONS • Uses the distributive rule to expand and simplify
(a+b)(c+d).
• Investigates special cases, difference of two squares, and perfect squares.
• Factorises algebraic expressions by removing highest common factor (HCF).
• Builds an understanding of Index Laws through discovery methods (eg Tower of Hanoi, paper folding, ratios of paper sizes A6, A5, A4, ...).
• Understands and uses the Zero Index Law and the Negative Index Law.
LINEAR EQUATIONS AND INEQUATIONS • Understands the purpose of an equal sign in linear
equations.
• Solves linear equations that require simplification before solution.
• Writes linear inequalities involving algebraic notation.
• Solves linear inequalities and uses number lines to display solutions.
FORMULAE • Substitutes into formulae and finds unknowns (eg
‘How many ways can you make 10? Table your results.’).
EXPRESSIONS/EQUATIONS • Understands the difference between an expression and
an equation (eg website: The Golden Ratio—navel height and sports—refer to Resources list).
• Explores the existence of quadratic relationships in contextual situations (eg Given a perimeter, what is the maximum area? Given length, develop triangles—use a graphics calculator).
• Investigates the form of quadratic equations.
• Factorises quadratic expressions by: - recognising and using the sum and product
pattern - recognising and using the perfect square pattern - recognising and using the difference of two
squares pattern - using ‘trial and error’ and/or other methods for
factorising quadratics that do not fit known patterns.
• Solves quadratic equations by factorising.
• Interprets and solves simple, worded problems using quadratics (eg Directed investigation: Is the McDonalds M a quadratic?—Draw the McDonalds M on a graphics calculator. Hint: Draw the M on graph paper and assign co-ordinate points. Input these points into the graphics calculator. Compare with a quadratic in the form of ax2+bx+c. Discuss domain and range).
• Finds quadratic equations given their solutions.
5.9 Recognises equivalent forms of an expression, equation, function or relation; and recognises range of families of function, analyses parameter changes, and describes local and global behaviour of such functions. In T C KC1 KC2 5.10 Represents advanced functions with symbolic algebra, sketches, graphs and tables; solves problems by manipulating equations involving advanced functions. T C KC6 5.11 Uses a variety of mathematical models to make connections and analyse how things might change in both real and abstract contexts. F T C KC1
Possible starting points for planning, programming and assessing
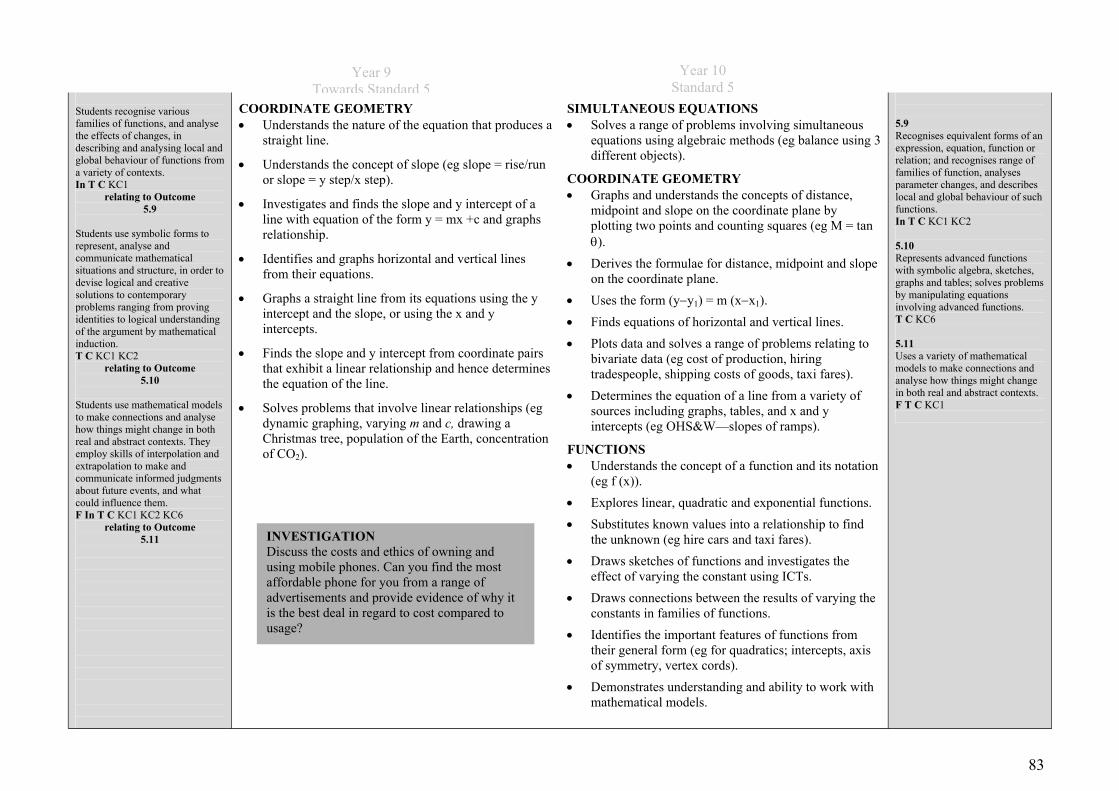
83
Students recognise various families of functions, and analyse the effects of changes, in describing and analysing local and global behaviour of functions from a variety of contexts. In T C KC1
relating to Outcome 5.9
Students use symbolic forms to represent, analyse and communicate mathematical situations and structure, in order to devise logical and creative solutions to contemporary problems ranging from proving identities to logical understanding of the argument by mathematical induction. T C KC1 KC2
relating to Outcome 5.10
Students use mathematical models to make connections and analyse how things might change in both real and abstract contexts. They employ skills of interpolation and extrapolation to make and communicate informed judgments about future events, and what could influence them. F In T C KC1 KC2 KC6
relating to Outcome 5.11
COORDINATE GEOMETRY • Understands the nature of the equation that produces a
straight line.
• Understands the concept of slope (eg slope = rise/run or slope = y step/x step).
• Investigates and finds the slope and y intercept of a line with equation of the form y = mx +c and graphs relationship.
• Identifies and graphs horizontal and vertical lines from their equations.
• Graphs a straight line from its equations using the y intercept and the slope, or using the x and y intercepts.
• Finds the slope and y intercept from coordinate pairs that exhibit a linear relationship and hence determines the equation of the line.
• Solves problems that involve linear relationships (eg dynamic graphing, varying m and c, drawing a Christmas tree, population of the Earth, concentration of CO2).
SIMULTANEOUS EQUATIONS • Solves a range of problems involving simultaneous
equations using algebraic methods (eg balance using 3 different objects).
COORDINATE GEOMETRY • Graphs and understands the concepts of distance,
midpoint and slope on the coordinate plane by plotting two points and counting squares (eg M = tan θ).
• Derives the formulae for distance, midpoint and slope on the coordinate plane.
• Uses the form (y−y1) = m (x−x1). • Finds equations of horizontal and vertical lines. • Plots data and solves a range of problems relating to
bivariate data (eg cost of production, hiring tradespeople, shipping costs of goods, taxi fares).
• Determines the equation of a line from a variety of sources including graphs, tables, and x and y intercepts (eg OHS&W—slopes of ramps).
FUNCTIONS • Understands the concept of a function and its notation
(eg f (x)). • Explores linear, quadratic and exponential functions. • Substitutes known values into a relationship to find
the unknown (eg hire cars and taxi fares). • Draws sketches of functions and investigates the
effect of varying the constant using ICTs. • Draws connections between the results of varying the
constants in families of functions. • Identifies the important features of functions from
their general form (eg for quadratics; intercepts, axis of symmetry, vertex cords).
• Demonstrates understanding and ability to work with mathematical models.
5.9 Recognises equivalent forms of an expression, equation, function or relation; and recognises range of families of function, analyses parameter changes, and describes local and global behaviour of such functions. In T C KC1 KC2 5.10 Represents advanced functions with symbolic algebra, sketches, graphs and tables; solves problems by manipulating equations involving advanced functions. T C KC6 5.11 Uses a variety of mathematical models to make connections and analyse how things might change in both real and abstract contexts. F T C KC1
Year 10 Standard 5
INVESTIGATION Discuss the costs and ethics of owning and using mobile phones. Can you find the most affordable phone for you from a range of advertisements and provide evidence of why it is the best deal in regard to cost compared to usage?
Year 9 Towards Standard 5

84
Learning Area: Mathematics Band: Middle–Senior Years Strand: Spatial sense and Standard: 5 geometric reasoning
KEY IDEAS (refer p70 for Years 6, 7 and 8) OUTCOMES Year 9
Towards Standard 5 Year 10
Standard 5 Students plan, test and refine their geometric reasoning, understanding and language through critical analysis and conjecture, and use alternatives to validate and formalise proofs. T C KC2 KC3 KC6
relating to Outcome 5.12
Students extend their geometric understanding and language through the use of different representational systems to solve complex spatial problems. In T C KC2 KC6
relating to Outcome 5.13
Students gain confidence in their capacity to use symbolic forms to analyse mathematical situations and structures, and to establish and communicate proofs and envisage other possibilities. T C KC2
relating to Outcome 5.14
PLANAR GEOMETRY • Proves triangle congruence.
• Investigates similarities between triangles using ICTs.
• Proves two triangles are similar using an appropriate test.
• Finds missing sides and angles in similar triangles.
• Applies knowledge of similar triangles to solve practical problems (eg investigates similar triangles in the environment—in buildings).
TRANSFORMATION • Applies transformations to coordinate axes.
• Determines the translation vector in a translation.
• Determines the centre and angle of rotation.
• Finds the axis (axes) of symmetry of a figure where possible.
• Finds the scale factor and centre of enlargement.
PLANAR GEOMETRY • Understands terms that relate to a circle, including
diameter and chord (eg ‘finds the centre of a circle’).
• Investigates circle properties in order to develop theorems.
• Uses circle theorems to solve problems (eg using interactive geometry software).
• Uses previously learned geometric theorems to construct proofs.
NETWORKS AND MAPS • Finds paths that meet specifications (eg the shortest
route, the most efficient way to deliver mail, flight paths—different routes Adelaide to London).
• Produces maps and plans, labelling key features of a location or path according to the purpose of the map.
• Recognises and explains loci (paths) of moving objects (eg valve on a travelling bicycle wheel).
5.12 Makes and tests conjectures involving 2-D and 3-D shapes and objects. T C KC6 5.13 Examines conjectures using geometric transformations. T C KC6 5.14 Selects and uses different representational systems to describe, analyse and interpret objects, pathways and arrangements. T C KC1
INVESTIGATION Discuss the issues related to urban sprawl and the city of Adelaide. What are the environmental and economic implications of establishing a modern housing development?
INVESTIGATION Discuss the systems for transferring goods around the world. What is the cheapest and quickest way to transport a parcel from Roxby Downs to New York? What other factors did you take into consideration?
Possible starting points for planning, programming and assessing

85
Learning Area: Mathematics Band: Middle–Senior Years Strand: Analysing and modelling Standard: 5 change
KEY IDEAS OUTCOMES Year 9
Towards Standard 5 Year 10
Standard 5 Students express personal ideas and analyse graphical representations. They make and justify predictions about relationships between variables, including variables involving a range of times and cultures. In T C KC1 KC2
relating to Outcome 5.15
Students analyse change and rates of change in a range of contexts, and use experimental and theoretical data to make logical statements about these understandings. T C KC1 KC2
relating to Outcome 5.16
Students use and interpret relationships between variables as tools for analysing and modelling change, and to make reasonable predictions about future events. F In T C KC1 KC6
relating to Outcome 5.17
This strand begins at Year 10.
CHANGE • Explores the relationship between variables (eg
volume of fluid and height of fluid for different shaped bottles and a baby in the bath).
• Uses scatter graphs to plot data (eg ABS, number of women competing in the Olympic Games).
• Expresses the relationship between variables represented on the scatter graph as strong or weak, positive or negative correlations.
• Visualises the line of best fit and uses ICTs to determine the equation.
• Uses equations to make predictions.
RATES • Determines whether two quantities are directly or
inversely proportional.
• Recognises and draws the graphs associated with quantities which are directly or inversely proportional.
• Solves real-life problems involving quantities that are directly or inversely proportional (eg heat energy).
• Graphs and understands the nature of rectangular hyperbolae (eg cost of sponsoring a child for one person, two people …).
• Draws graphs of exponential functions.
• Solves growth and decay problems.
5.15 Draws, describes and justifies graphical relationships between variables. T C KC2 5.16 Describes change and varying rates of change and makes predictions when analysing graphical information. T C KC2 5.17 Uses and interprets relationships between variables as a tool for analysing and modelling change in a range of contexts. F In T C KC1
INVESTIGATION (YEAR 10) Discuss the importance of weather forecasts. Analyse the accuracy of short, medium and long term weather forecasts and develop a model to support your analysis.
Possible starting points for planning, programming and assessing

86
TERMINOLOGY BAND: EARLY YEARS
Strand: Exploring, analysing and modelling data Data, Question, Ask, Survey, Collect, Find, Organise, Sort, Group, Collate, Represent, Record, Tally, Graph, Table, Compare, Predict, Pattern, Equal, Same, Different, More than, Less than, Pictogram, Column graph, Bar graph, Line graph, Pie graph, Spreadsheet, Database, Axis, x axis, y axis, Base line, Title, Labels, Everyday chance language (eg likely, will, perhaps). Strand: Measurement Everyday language (eg big, small, heavy), Measure, Estimate, Approximate, Accurate, Attributes, Length, Height, Perimeter, Distance, Metre, Centimetre, Area, Covers, Space, Temperature, Capacity, Fill, Full, Empty, Litres, Millilitre, Volume, Angle, Turn, Wide, Narrow, Mass, Kilograms, Grams, Time, Weekend, Months, Days, Minutes, Seconds, Hours, Weeks, Seasons, Before/after, Inbetween, Nearly, Half, Abbreviations (eg mm, cm, kg). Strand: Number More, Less, As many, Same, Equal, Not equal, Greater, Less, Estimate, Sort, Order, Compare, Add, Plus, Sum, Total, Counting on, Counting back, Forwards, Backwards, Subtract, Take away, Minus, Difference, Group, Multiply, Divide, Share, Hundreds, Tens, Ones, Digits, Number, Numeral, Fraction, Part, Piece, Half, Third (etc), Whole, Double, Record, Patterns, Symbols (eg + - ÷ x > < = ). Strand: Pattern and algebraic reasoning Pattern, Repeat, Repetition, Dance, Rhythm, Predict, Next, Before/after, Design, Explore, Record, Represent, Describe, Explain, Rule, Count, Number, Groups, Multiply, Add, Odd/even.
Strand: Spatial sense and geometric reasoning Geometric, Shape, Object, Plane, Figure, Solid, 2-D, 3-D, Closed, Open, Boundary, Polygon, Quadrilateral, Pentagon, Hexagon, Octagon, Square, Triangle, Rectangle, Rhombus, Trapezium, Circle, Oval, Ellipse, Curved, Straight, Symmetry, Transformation, Translate/Slide, Rotate/Turn, Reflect/Flip, Tessellate, Tessellation, Cube, Cone, Sphere, Prism, Pyramid, Properties, Attributes, Side, Corner, Surface, Edge, Face, Vertices, Vertex, Angle, Degrees, Amount, Count, Number, Line, Label, Arrange, Rearrange, Vertical, Horizontal, Oblique, Right, Left, Clockwise, Anti-clockwise, Map, Net, Cross-section, Scale, Bird’s-eye view, Coordinates, Direction, Model, Pack and stack, Function, Use.

87
TERMINOLOGY BAND: PRIMARY YEARS
Strand: Exploring, analysing and modelling data Graphing Certain, Possible, Very likely, Equally likely, Always, Impossible, Data, Graph, Axis, Scale, Tally, Survey, Statistic, Composite.
Chance, data and probability Least likely, Possible, Chance, Certain, Random, Never, Possibility, Analyse, Predict, Order, Probability, Tally, Experiment, Outcome, Probable, Event, Trial.
Strand: Measurement Mass Light, Lightest, Heavy, Heaviest, Grams, Kilograms, Tonnes. Symbols g kg t
Temperature Degree, Hot, Cold, Freezing, Boiling, Thermometer, Rising, Falling, Celsius, Fahrenheit, Maximum, Minimum, Minus. Symbols °C °F
Time Noon, Midday, Midnight, Afternoon, Calendar, Season, Week, Annual, Month, Decade, Century, Leap year, Timetable, Arrive, Depart, Stopwatch, Time zone, Digital, Analogue, O’clock, Past, To, Second, Minute, Hour, Day, Duration, Elapse, Timeline.
Symbols am pm AD BC I =1 V= 5 X = 10 L = 50 C = 100 D = 500 M = 1000
Volume and capacity Full, Millilitres, Empty, Different, Same, Amount, Level, Litres, Capacity, Volume, Measure, Liquid, Cubic measure, Displacement. Symbols L mL cm3
Length, perimeter, area Millimetre, Centimetre, Metre, Kilometre, Perimeter, Area, Wide, Long, Straight, Metric, Width, Length, Height, Depth, Formula, Diameter, Boundary, Circumference, Trundle wheel. Symbols mm cm m km cm² m²
Strand: Number Fractions and decimals Unit, Whole, Denominator, Tenth, Numerator, Equivalent, Fraction, Decimal, Mixed fraction, Sequence, Hundredth, Percentage, Factor, Improper fraction, Divisor, Multiples, Square number, Prime number.
Whole number + – x ÷ Subtraction, Add, Minus, Plus, Take away, Total, Difference, Sum of, Remainder, Product, Times, Share, Multiply, Divide, Exchanging, Group, Numeral, Figure. Symbols + – x ÷ % # ≠ / ( )
Money Cheapest, Profit, Expensive, Loss, Change, Budget, Tender, Change, Currency, Amount, Rounding off, Least, Ascending , Most, Descending. Symbols @ $ c

88
TERMINOLOGY continued BAND: PRIMARY YEARS
Strand: Pattern and algebraic reasoning Patterns Interval, Pattern, Odd, Even, Dimension, Forward, Backward, Scale, Factors, Symbol, Number line, Increase, Decrease, Repetition.
Algebra Symbol, Factor trees, Square number, Triangular number.
Data representation Data, Change, Prediction, Logical.
Strand: Spatial sense and geometric reasoning 2-D shapes and 3-D objects Rectangle, Circle, Square, Hexagon, Triangle, Pentagon, Semicircle, Angle, Vertex, Right angle, Obtuse, Reflex, Net, Symmetry, Congruence, Prism, Pyramid, Solid, Cylinder, Dimensional, Sphere, Cone, Pentagon, Heptagon.
Transformation Transformation, Reflection, Rotation, Translation, Flip, Slide, Turn, Tessellation, Congruent, Enlargement, Reduction, Polygon.
Position North, South, East, West, Compass points, Cardinal points, Under, Above, Below, Behind, Around, Beside, Between, Centre, Further, Left, Right, Through, Chart, Path, Route, Direction, Location, Position, Grid, Coordinates, Plot, Map, Model, Row, Column.
Symbols
N W E S

89
TERMINOLOGY BAND: MIDDLE YEARS
Strand: Exploring, analysing and modelling data Data collection and representation Scatterplot, Stemplot, Cartesian plane, Collinear, Dependent variable, Gradient, Independent variable, Linear graph, Non-linear graph, Ordered pair, Point of intersection, Quadrant, Simultaneous solution, Substitute, Intercept, Biased, Bimodal, Box and whisker plot, Categorical, Conjecture, Skewed, Outlier, Quartile, Distributive, Bar graph, Column graph, Pictograph, Histogram, Composite bar graph, Pie graph, Line graph, Tally, Data, Mean, Mode, Median, Sample, Table, Categorical, Quantitative, Survey sample, Statistics, Percentage, Title, Axis.
Chance and probability Compound events, Dependent, Simultaneous, Expectation, Occurrence, Random, Relative frequency, Simulation, Theoretical probability, Possible, Probable, Likelihood, Predict, Relationship, Impossible, Possibility, Experiment, Tree diagram, Gamble, Certain, Event, Trial, Consequence, Likely, Unlikely, Sample, Population, Variable.
Strand: Measurement Length, perimeter and area; Volume and capacity; Mass; Time; Angles; Temperature Area, Diameter, Angles, Tonne, Speed, Metre, Kilometre, Perimeter, Timetable, Prism, Gram, Millimetre, Capacity, Radius, Metric system, Centimetre, Hectare, Volume, Surface area, Kilogram, Kilolitre, Millilitre, Megalitre, Length, Circumference, Mass, Weight, Litre, Timeline, Formula, Daylight saving, Timetable, Time zone, Digital, Analogue, Calendar, Schedule, Duration, AD, BC, CE (Common Era), Approximation, Converse, Hypotenuse, Integer, Surd, Apex, Boundary, Conversion, Concentric. Strand: Number Whole numbers; Fractions, decimals, percentages, ratios and rates Decimal, Numerator, Denominator, Rational, Irrational, Percentage, Reciprocal, Equivalent, Mixed number, Improper fraction, Fraction, Quantity, Number system, Thousandths, Divisor, Spreadsheet, Prime, Composite, Digit, Divisibility, Test, Exponent, Infinite, Integer, Proportion, Ratio, Scientific notation, Compound, Interest, Invest, Principal, Unitary method, Rate, Quadratic, Depreciation, Appreciation, Commission, Deduction, Discount, Exchange rate, Gross, Inflation, Piece work, Retainer, Superannuation. Strand: Pattern and algebraic reasoning Patterns Pronumerals, Variables, Equations, Formula, Number sentence, Pattern, Linear graphs, Predict, Substitute, Numerical, Geometric, Abstract relationship, Structure, Model, Inequation, Coefficient, Elimination, Induction, Interchange, Inverse, Linear equation, Binomial, Consecutive, Distributive, Identity, Quadratic, Direct variation, Negative reciprocal, Proportionality constant, Rectangular hyperbola, Asymptote, Exponential decay/growth.

90
TERMINOLOGY continued BAND: MIDDLE YEARS
Strand: Spatial sense and geometric reasoning 2-D shapes and 3-D objects Isometric, Bisect, Perspective, Base, Edge, Surface, Vertex, Face, Cross-section, Isosceles, Scalene, Equilateral, Oblique, Polyhedra, Acute, Obtuse, Reflex, Points, Rays, Segments, Intersections, Parallel, Perpendicular, Centre, Radius, Diameter, Circumference, Quadrilateral, Interior, Exterior, Euler, Arc, Segment, Tangent, Ellipse, Net, Curved surface, Parallelogram, Plane face, Prism, Pyramid, Sphere, Surface area. Trapezium, Adjacent, Alternate, Apex, Co-interior, Allied, Complementary, Concurrent, Congruence, Converse, Corresponding, Deductive.
Transformation Tessellation, Rotate, Symmetry, Enlarge, Reduce, 2 dimensional/2-D, 3 dimensional/3-D, Reflect, Translate, Transform, Clockwise, Anti-clockwise, Adjacent, Axis of symmetry, Cosine, Equiangular, Perpendicular bisector, Proportion, Rotational symmetry, Sine, Trigonometric ratio, Tangent, Trigonometry.
Location and position Magnetic compass, Scale drawings, Map, Plan, Ratio, Cardinal, Diagram, Orienteering, Intermediate points, Coordinate grid, Models, Pathways, Location, Vertices, Routes.

91
TERMINOLOGY BAND: MIDDLE–SENIOR YEARS
Strand: Exploring, analysing and modelling data Data collection and representation Scatterplot, Stemplot, Cartesian plane, Collinear, Dependent variable, Gradient, Independent variable, Linear graph, Non-linear graph, Ordered pari, Point of intersection, Quadrant, Simultaneous solution, Substitute, Intercept, Biased, Bimodal, Box and whisker plot, Categorical, Conjecture, Skewed, Outlier, Quartile, Distributive, Bar graph, Column graph, Pictograph, Histogram, Composite bar graph, Pie graph, Line graph, Tally, Data, Mean, Mode, Median, Sample, Table, Categorical, Quantitative, Survey sample, Statistics, Percentage, Title, Axis.
Chance and probability Compound events, Dependent, Simultaneous, Expectation, Occurrence, Random, Relative frequency, Simulation, Theoretical probability, Possible, Probable, Likelihood, Predict, Relationship, Impossible, Possibility, Experiment, Tree diagram, Gamble, Certain, Event, Trial, Consequence, Likely, Unlikely, Sample, Population, Variable.
Strand: Measurement Length, perimeter and area; Volume and capacity; Mass; Time; Angles; Temperature Area, Diameter, Angles, Tonne, Speed, Metre, Kilometre, Perimeter, Timetable, Prism, Gram, Millimetre, Capacity, Radius, Metric system, Centimetre, Hectare, Volume, Surface area, Kilogram, Kilolitre, Millilitre, Megalitre, Length, Circumference, Mass, Weight, Litre, Timeline, Formula, Daylight saving, Timetable, Time zone, Digital, Analogue, Calendar, Schedule, Duration, AD, BC, CE (Common Era) Approximation, Converse, Hypotenuse, Integer, Surd, Apex, Boundary, Conversion, Concentric. Strand: Number Whole numbers; Fractions, decimals, percentages, ratios and rates Decimal, Numerator, Denominator, Rational, Irrational, Percentage, Reciprocal, Equivalent, Mixed number, Improper fraction, Fraction, Quantity, Number system, Thousandths, Divisor, Spreadsheet, Prime, Composite, Digit, Divisibility, Test, Exponent, Infinite, Integer, Proportion, Ratio, Scientific rotation, Compound, Interest, Invest, Principal, Unitary method, Rate, Quadratic, Depreciation, Appreciation, Commission, Deduction, Discount, Exchange rate, Gross, Inflation, Piece work, Retainer, Superannuation. Strand: Pattern and algebraic reasoning Patterns Pronumerals, Variables, Equations, Formula, Number sentence, Pattern, Linear graphs, Predict, Substitute, Numerical, Geometric, Abstract relationship, Structure, Model, Inequation, Coefficient, Elimination, Induction, Interchange, Inverse, Linear equation, Binomial, Consecutive, Distributive, Identity, Quadratic, Direct variation, Negative reciprocal, Proportionality constant, Rectangular hyperbola, Asymptote, Exponential decay/growth.

92
TERMINOLOGY continued BAND: MIDDLE–SENIOR YEARS
Strand: Spatial sense and geometric reasoning 2-D shapes and 3-D objects Isometric, Bisect, Perspective, Base, Edge, Surface, Vertex, Face, Cross-section, Isosceles, Scalene, Equilateral, Oblique, Polyhedra, Acute, Obtuse, Reflex, Points, Rays, Segments, Intersections, Parallel, Perpendicular, Centre, Radius, Diameter, Circumference, Quadrilateral, Interior, Exterior, Euler, Arc, Segment, Tangent, Ellipse, Net, Curved surface, Parallelogram, Plane face, Prism, Pyramid, Sphere, Surface area. Trapezium, Adjacent, Alternate, Apex, Co-interior, Allied, Complementary, Concurrent, Congruence, Converse, Corresponding, Deductive.
Transformation Tessellation, Rotate, Symmetry, Enlarge, Reduce, 2 dimensional/2-D, 3 dimensional/3-D, Reflect, Translate, Transform, Clockwise, Anti-clockwise, Adjacent, Axis of symmetry, Cosine, Equiangular, Perpendicular bisector, Proportion, Rotational symmetry, Sine, Trigonometric ratio, Tangent, Trigonometry.
Location and position Magnetic compass, Scale drawings, Map, Plan, Ratio, Cardinal, Diagram, Orienteering, Intermediate points, Coordinate grid, Models, Pathways, Location, Vertices, Routes.

93
RESOURCES EARLY YEARS REFERENCES Department of Education and Children’s Services (2004) SACSAconnect. A directory of curriculum resources. Adelaide SA: DECS.
Department of Education and Children’s Services (1996) R–10 mathematics programming guide. Adelaide SA: DECS.
Department of Education, Training and Employment (2000) South Australian Curriculum, Standards and Accountability Framework Part A. Adelaide SA: DETE.
Department of Education, Training and Employment (2000) South Australian Curriculum, Standards and Accountability Framework Part B. Adelaide SA: DETE.
Department of Education, Training and Employment (2000) South Australian Curriculum, Standards and Accountability Framework Part C (English as a second language). Adelaide SA: DETE.
VandeWalle J (2001) Elementary and middle school mathematics—Teaching mathematically. Sydney NSW: Longman.
SUGGESTED RESOURCES Curriculum Corporation (2000) Numeracy benchmarks years 3, 5 and 7. Carlton, Victoria: Curriculum Corporation.
PRIMARY YEARS REFERENCES Department of Education and Children’s Services (2004) SACSAconnect. A directory of curriculum resources. Adelaide SA: DECS.
Department of Education, Training and Employment (2000) South Australian Curriculum, Standards and Accountability Framework Part A. Adelaide SA: DETE.
Department of Education, Training and Employment (2000) South Australian Curriculum, Standards and Accountability Framework Part B. Adelaide SA: DETE.
Department of Education, Training and Employment (2000) South Australian Curriculum, Standards and Accountability Framework Part C (English as a second language). Adelaide SA: DETE.
Erickson T (1989) Get it together: Maths problems for groups grades 4–12. Berkeley USA: Equals.
Williams G & Bradby J (2000) Rigby maths South Australia book 3. Pt Melbourne Victoria: Rigby.
Williams G & Bradby J (2000) Rigby maths South Australia book 4. Pt Melbourne Victoria: Rigby.
Williams G & Bradby J (2000) Rigby maths South Australia book 5. Pt Melbourne Victoria: Rigby.
SUGGESTED RESOURCES Cockburn Y & Bernard C (1996) South Australian maths book 3. Sydney NSW: Pearson Education.
Curriculum Corporation (2000) Numeracy benchmarks. Years 3, 5 and 7 with professional elaboration. Carlton, Victoria: Curriculum Corporation.

94
Green M (2003) Understanding year 3 and 4 maths. Sydney NSW: Accelerated Maths Learning.
Lutheran Schools South Australia District Office (2001) Mathematics—A developmental continuum for Lutheran schools. Adelaide SA: South Australia District Office.
Marlin W (2003) Understanding year 5 and 6 maths. Sydney NSW: Accelerated Maths Learning.
Parker A, McSeveny A & Collard R (2000) Queensland signpost maths book 3. Sydney NSW: Pascal Press.
Parker A, McSeveny A & Collard R (2000) Queensland signpost maths book 4. Sydney NSW: Pascal Press.
Parker A, McSeveny A & Collard R (2000) Queensland signpost maths book 5. Sydney NSW: Pascal Press.
MIDDLE YEARS REFERENCES Department of Education and Children’s Services (2004) SACSAconnect. A directory of curriculum resources. Adelaide SA: DECS.
Department of Education, Training and Employment (2000) South Australian Curriculum, Standards and Accountability Framework Part A. Adelaide SA: DETE.
Department of Education, Training and Employment (2000) South Australian Curriculum, Standards and Accountability Framework Part B. Adelaide SA: DETE.
Department of Education, Training and Employment (2000) South Australian Curriculum, Standards and Accountability Framework Part C (English as a second language). Adelaide SA: DETE.
Erickson T (1989) Get it together: Maths problems for groups grades 4–12. Berkeley USA: Equals.
Lynch B, Picking L, Anders J & Coffey M (1994). Maths 7. Sydney NSW: Longman.
SUGGESTED RESOURCES Bull I (1999) Preparing for secondary school maths. Sydney NSW: Phoenix Education.
Curriculum Corporation (2000) Numeracy benchmarks. Years 3, 5 and 7 with professional elaboration. Carlton, Victoria: Curriculum Corporation.
Frank M (2002) Maths yellow pages. Melbourne Victoria: Hawker Brownlow.
Hall H, Spiers M & Pulgies S (2003) Core skills mathematics 6. Adelaide SA: Haese & Haese.
Lappan G, Fey JT, Fitzgerald WM, Friel SN & Phillips ED (1998) Connected mathematics. Menlo Park USA: Dale Seymour Publications. A series for grades 6 to 8 (addresses number, geometry and measurement, algebra and statistics and probability).
Merrigan R, Haralambous H, Hyland M & McLynskey O (1995) Profile mathematics. Adelaide SA: Macmillan.
O’Brien H (2001) Advanced primary maths 6. Adelaide SA: Horwitz Martin.
Parker A, McSeveny A & Collard R (1995) Signpost maths book 7. Sydney NSW: Pascal Press.
Pulgies S, Haese R & Haese S (2003) Mathematics for year 6. 2nd edition. Adelaide SA: Haese & Haese.
Pulgies S, Haese R & Haese S (2003) Mathematics for year 7. 2nd edition. Adelaide SA: Haese & Haese.

95
Schnabl L & Wagstaff D (1994) New 7 plus. Sydney NSW: Longman.
Stimson W, Hall H, Spiers M, Pulgies S, Ross C, Norris S & Haines C (2003) Core skills mathematics 7. Adelaide SA: Haese & Haese.
MIDDLE–SENIOR YEARS REFERENCES Blane D & Booth L (1989) Moving through maths stage 2. Adelaide SA: Rigby Educational.
Department of Education and Children’s Services (2004) SACSAconnect. A directory of curriculum resources. Adelaide SA: DECS.
Department of Education, Training and Employment (2000) South Australian Curriculum, Standards and Accountability Framework Part A. Adelaide SA: DETE.
Department of Education, Training and Employment (2000) South Australian Curriculum, Standards and Accountability Framework Part B. Adelaide SA: DETE.
Department of Education, Training and Employment (2000) South Australian Curriculum, Standards and Accountability Framework Part C (English as a second language). Adelaide SA: DETE.
Driver D, Macleod J, Ganderton G & Creeley T (1992) Maths alive, year 8. Melbourne Victoria: Macmillan Education Australia.
Driver D, Macleod J, Ganderton G & Creeley T (1992) Maths alive, year 9. Melbourne Victoria: Macmillan Education Australia.
Driver D, Macleod J, Ganderton G & Creeley T (1992) Maths alive, year 10. Melbourne Victoria: Macmillan Education Australia.
Erickson T (1989) Get it together: Maths problems for groups grades 4–12. Berkeley USA: Equals.
Erickson T (1989) Towards better trigonometry teaching: A handbook for teaching. Glen Waverley Vic: Latitude Publications.
Finlay E & Lowe I (1993) Chance and data: Exploring real data. Carlton Vic: Curriculum Corporation.
Lovitt C & Lowe I (1993) Mathematics curriculum and teaching program volume 1: Chance and data investigations. Carlton Vic: Curriculum Corporation.
Lovitt C & Lowe I (1993) Mathematics curriculum and teaching program volume 2: Chance and data investigations. Carlton Vic: Curriculum Corporation.
Lovitt C & Clarke D (1992) Mathematics curriculum and teaching project (MCTP): Activity bank volumes 1 and 2. Carlton Vic: Curriculum Corporation.
Lovitt C & Clarke D (1988) MCTP: The mathematics curriculum and teaching program activity bank volume 2. Canberra ACT: Curriculum Development Centre.
Lowe I, Johnston J, Kissane B & Willis S (1995) Access to algebra. Books 1, 2, 3, 4 and two teacher’s guides. Carlton Vic: Curriculum Corporation.
Winter JW & Carlson RJ (1993) Algebra experiments I—Exploring linear functions. Menlo Park USA: Dale Seymour Publications.
Winter JW & Carlson RJ (1993) Algebra experiments II—Exploring nonlinear functions. Menlo Park USA: Dale Seymour Publications.
SUGGESTED RESOURCES Haese R, Haese S, Bruce M, Harris K, Olesnicky A & Kapelle D (2001) Mathematics for year 8. 5th edition. Adelaide SA: Haese & Haese Publications.
Haese R, Haese S, Bruce M, Harris K & Kapelle D (2001) Mathematics for year 9. 5th edition. Adelaide SA: Haese & Haese Publications.
Haese R, Haese S, Bruce M, Harris K & Kapelle D (2001) Mathematics for year 10. 5th edition. Adelaide SA: Haese & Haese Publications.

96
Lappan G, Fey JT, Fitzgerald WM, Friel SN & Phillips ED (1998) Connected mathematics. Menlo Park USA: Dale Seymour Publications. A series for grades 6 to 8 (addresses number, geometry and measurement, algebra and statistics and probability).
Serra M (1989) Discovering geometry: An inductive approach. Berkeley USA: Key Curriculum Press.
R–10 SUGGESTED WEBSITES 2-D & 3-D drawings: math.exeter.edu/rparris/wingeom.html
Body Maths: www.coursework.info/i/13506.html
Bureau of Metrorology: www.bom.gov.au
Calculator search for √2: www.mcpt.org
Curriculum Corporation: www.curriculum.edu.au/
Dollars and sense: www.curriculum.edu.au/download/lesspln/dollars.htm
Exploring Data: exploringdata.cqu.edu.au/
Fibonacci and The Golden Ratio: www.mcs.surrey.ac.uk/Personal/R.Knott/Fibonacci/fib.html
Geometer’s Sketchpad: www.keypress.com/sketchpad/sketchdemo.html
Graphics calculators: [Casio] www.mathtype.com/features/eeform.stm
Graphics calculators: [General] www.eddept.wa.edu.au/graphcalc/sup/
Graphics calculators: [Hewlett Packard] www.hp.com/calculators/educators.html
Graphics calculators: [Texas Instruments] education.ti.com/educator/hilight/hilight.html
Histograms: www.shodor.org/interactivate/activities/histogram/index.html
Human race: www.human-race.org/
Infochoice: www.infocoice.com.au
Investigating patterns: Symmetry and Tesselations: ccins.camosun.bc.ca/~jbritton/jbsymteslk.htm
Juggling: www.maths.monash.edu.au/~bpolster/adelaide.html
MASA: www.masa.on.net
Maths300: www.curriculum.edu.au/maths300
Plotting: math.exeter.edu/rparris/winplot.html
Powers of 10: www.wordwizz.com/pwrsof10.htm
Probability: www.themercury.com.au/nie/mathguys/
Puzzles: www.puzzlemaker.com

97
Spendwell: www.b4usplashcash.ocba.sa.gov.au/spendwell/buying/
Spreadsheets in Education: www.sie.bond.edu.au/index.htm
Statistics: math.exeter.edu/rparris/winstats.html
The best and worst of statistical graphs: math.youku.ca/SCS/Gallery/
The Golden Ratio: jwilson.coe.uga.edu/emt669/Student.Folders/Frietag.Mark/Homepage/Goldenratio
R–10 OUTREACH AND OTHER SERVICES Aboriginal Education Resource Centre (DECS), 5 Harewood Avenue, Enfield SA 5085 Phone (08) 8343 6500 Fax (08) 8343 6515 Web www.aboriginaleducation.sa.edu.au
Adelaide Festival Centre Education Service, King William Road, Adelaide SA 5000 Phone (08) 8216 8861 Fax (08) 8212 7849
Adelaide Zoo Education Service, Frome Road, Adelaide SA 5000 Phone (08) 8267 2434 Fax (08) 8239 1329
Arbury Park Outdoor School, Arbury Park Road, Bridgewater SA 5155 Phone (08) 8339 3237 Fax (08) 8339 3313
Art Gallery of SA Education Service, North Terrace, Adelaide SA 5000 Phone (08) 8207 7033 Fax (08) 8207 7070
Botanic Gardens of Adelaide Education Service, North Terrace, Adelaide SA 5000 Phone (08) 8222 9344 Fax (08) 8222 9399
Languages and Multicultural Resource Centre (DECS), 12 Robson Road, Hectorville SA 5073 Phone (08) 8366 8532 Fax (08) 8365 0571 Web www.lmrc.sa.edu.au
Migration Museum Education Service, 82 Kintore Avenue, Adelaide SA 5000 Phone (08) 8207 7586 Fax (08) 8207 7591
Parliament House Education Service, Parliament House, North Terrace, Adelaide SA 5000 Phone (08) 8237 9386 Fax (08) 8212 5792
SA Maritime Museum Education Service, 119 Lipson Street, Port Adelaide SA 5015 Phone (08) 8207 6255 Fax (08) 8207 6266
SA Museum Education Service, North Terrace, Adelaide SA 5000 Phone (08) 8207 7429 Fax (08) 8207 7430
Special Education Resource Unit, 72A Marlborough Street, Henley Beach SA 5022 Phone (08) 8235 2871 Fax (08) 8235 1907 Web web.seru.sa.edu.au
Tape Services, 266 Port Road, Hindmarsh SA 5007 Phone (08) 8241 5615 Fax (08) 8241 5708 Web www.tapeservices.sa.edu.au
Technology School of the Future, Education Development Centre, Milner Street, Hindmarsh SA 5007 Phone (08) 8463 5999 Fax (08) 8463 5900
The Investigator Science and Technology Centre, Days Road, Regency Park SA 5010 Phone (08) 8348 2400 Fax (08) 8346 6311