quintana capital group, l.p. - wikileaks 3q qep bod meeting... · quintana capital group, l.p....
TRANSCRIPT

Quintana Capital Group, L.P.3RD QUARTER MEETING 2011The Petroleum ClubMonday, September 12th, 20118:30 a.m. to 5:00 p.m.

3RD QUARTER MEETINGThe Petroleum ClubMonday, September 12th, 20118:30 a.m. to 5:00 p.m.
Meeting Objectives
8:30 a.m. to 9:00 a.m.
Fund Level o Alignment on Return and Timing Objectives (Fund I/II)
Investment Level: o Alignment on Valuation and Exit Objectives for Key Investments o Identify Critical Path Issues and Milestones for Key Investmentso Revisit and Align on Plan to Track Performance Against Objectives
Establish Fund III Objectives
Fund Level Performance and Strategic Assessment
9:00 a.m. to 10:00 a.m.
Fund Performance Return Analysis (as of 6/30/11) Exit and Return Scenarios Uncommitted Capital and Balance Sheet Current Valuations vs. Exit Scenarios (Opportunity Cost Analysis)J. McDonald
10:00 a.m. to 11:00 a.m.
Strategic Assessment Investment Horizon Peer/Vintage Analysis & LP Expectations Long Term QEP Objectives (Fund III)L. Soetenga
Investment Level Valuation and Exit Assessment
11:00 a.m. to 1:00 p.m.
Downstream and Coal Services Talen’s (30 Min each) Taggart AmerCable
12:00 p.m. Working Lunch – to be served at 12:00
1:00 p.m. to 2:30 p.m.Oil and Gas Services MWD Services Quintana WellPro
2:30 pm to 4:00 pm
Oil and Gas Upstream Irion Minerals Prize Petroleum Deep Gulf Energy I/II
Board Meeting
4:00pm – 5:00 pm Board Meeting

Quintana Capital Group, L.P.Financial Overview
September 12, 2011 9:00am to 10:00am
Jimmy McDonald

3|
Quintana Capital Group, L.P.
Status of Funds
Fund I & II Scenarios
Hurdle Review

4|
Quintana Capital Group, L.P.Status of Funds
Fund I $0.00 Unallocated Dry Powder
$40.0 million Allocated Dry Powder
$46.6 million outstanding under the Citi facility (including Kopper Glo Note Payable)
– $4.0 million available under the Citi facility
Approximately $5.3 million of liquidity available for portfolio company capital calls (capital needs in excess of current liquidity will require a Fund capital call)
Fund II $56.4 million Unallocated Dry Powder
$155.0 million Allocated Dry Powder
$58.4 million outstanding under the Natixisfacility (including Chase LC’s)
– $16.6 million available under the Natixis facility
Approximately $18.3 million of liquidity available for portfolio company capital calls (capital needs in excess of current liquidity will require a Fund capital call)

5|
Quintana Capital Group, L.P.Fund I & II Scenarios
Fund I Scenario Total Proceeds Capital ReturnedPref
ReturnUndistr
PrefProfit Split
Carried Interest ROI IRR
GP LP GP LP LP LP LP GPTotal Fund GP LP
GP (Capital interest)
Total Fund GP LP
GP (Capital interest)
Scenario I - 6-30-11 Hypothetical Liquidation (p. 5) $32.8 $597.7 $24.7 $509.7 $88.0 $67.7 $0.0 $0.0 1.2x 1.3x 1.2x 1.3x 4.9% 8.1% 4.7% 8.1%
Scenario II – exit scenarios (no impairments) (p. 6) $42.7 $775.3 $24.7 $522.8 $252.5 $24.7 $0.0 $0.0 1.5x 1.7x 1.5x 1.7x 8.8% 22.0% 8.3% 11.6%
Scenario III – exit scenarios (with impairments1) (p. 6) $65.2 $752.8 $24.7 $520.3 $226.9 $0.0 $5.6 $22.0 1.5x 2.6x 1.4x 1.7x 8.8% 20.1% 8.1% 11.6%
1Investment in EFH and Talen's are impaired in Scenario III.
Fund II Scenario Total Proceeds Capital ReturnedPref
ReturnUndistr
PrefProfit Split
Carried Interest ROI IRR
GP LP GP LP LP LP LP GPTotal Fund GP LP
GP (Capital interest)
Total Fund GP LP
GP (Capital interest)
Scenario I - 6-30-11 Hypothetical Liquidation (p. 7) $33.9 $164.9 $9.2 $105.2 $14.0 $0.0 $45.7 $14.9 1.7x 3.7x 1.6x 2.1x 35.9% 73.4% 29.7% 35.4%
Scenario II – Chase development fee2
(p. 8) $67.9 $264.8 $9.2 $120.9 $28.6 $0.0 $115.2 $36.0 2.6x 7.4x 2.2x 3.5x 34.7% 64.9% 29.4% 36.9%
Scenario III – Chase = cost (p. 9) $51.1 $221.0 $9.2 $120.9 $28.6 $0.0 $71.4 $25.0 2.1x 5.6x 1.8x 2.8x 26.3% 52.2% 21.9% 29.6%
Scenario IV – Chase = 50% cost (p. 10) $45.3 $206.0 $9.2 $120.9 $28.6 $0.0 $56.4 $21.3 1.9x 4.9x 1.7x 2.6x 23.1% 47.1% 19.1% 26.9%
Scenario V – Chase = 0 (p. 11) $39.6 $191.0 $9.2 $120.9 $28.8 $0.0 $41.3 $17.5 1.8x 4.3x 1.6x 2.4x 20.0% 42.2% 16.3% 24.3%
2Chase development fee scenario assumes $75 million development fee plus expenses received by Chase Power Development LLC.

6|
Quintana Capital Group, L.P.Fund I & II Scenarios - Assumptions
Fund I 6-30-11 Hypothetical Liquidation (FAS Values reduced by outstanding fund debt)
EXIT ASSUMPTIONS
Exit Date / Distribution
Date Enterprise Value Net Debt 8/8 Equity Value
QEP share net of
promote per 6/30/11 FAS
QEP Proceeds Net of Fund Debt
Previously Distributed
Capital / Realized
InvestmentsTotal
DistributionsXL Prospect 12/31/2009 - - - - - - - Beryl Oil & Gas Company GP 12/31/2009 - - - - - 315,821 315,821 Gulfstream Terminals & Marketing, LLC 5/25/2011 - - - - - 4,407,189 4,407,189 IRION Minerals (partial interest) 5/25/2011 - - - - - 7,477,564 7,477,564 Cypress Eaglewood 5/25/2011 - - - - - 7,415,625 7,415,625 Stone Mountain Resources, Ltd 6/30/2011 150,510,000 18,700,000 131,810,000 26,362,000 6,843,320 - 6,843,320 Quintana WellPro 6/30/2011 90,800,000 (9,000,000) 99,800,000 92,800,000 89,490,000 9,500,000 98,990,000 Q Consolidated Oil Well Services, LLC 6/30/2011 173,800,000 21,500,000 152,300,000 142,837,000 142,837,000 - 142,837,000 Taggart Global, LLC 6/30/2011 79,240,426 6,900,000 72,340,426 34,000,000 34,000,000 1,768,793 35,768,793 AmerCable Incorporated 6/30/2011 201,823,949 122,100,000 79,723,949 43,609,000 43,609,000 687,195 44,296,195 Q Directional Drilling Company, LLC 6/30/2011 118,861,724 27,100,000 91,761,724 72,400,000 69,090,000 7,581,650 76,671,650 MWD Services, LLC (includes NES) 6/30/2011 35,000,000 (1,000,000) 36,000,000 26,600,000 25,080,070 173,298 25,253,368 Deep Gulf Energy, L.P. 6/30/2011 277,911,019 (33,200,000) 311,111,019 13,500,000 13,500,000 3,003,290 16,503,290 Kopper Glo Fuel Inc. 6/30/2011 70,926,316 10,400,000 60,526,316 48,325,000 48,325,000 - 48,325,000 Deep Gulf Energy II, L.P. 6/30/2011 211,055,726 (14,200,000) 225,255,726 9,980,000 6,049,375 - 6,049,375 Prize Petroleum, LLC 6/30/2011 160,757,211 48,400,000 112,357,211 58,819,000 56,486,437 - 56,486,437 Texas Energy Future LP 6/30/2011 35,000,000,000 34,000,000,000 1,000,000,000 4,180,000 4,180,000 - 4,180,000 IDS 6/30/2011 3,000,000 - 3,000,000 2,625,000 2,625,000 - 2,625,000 Talen's Marine & Fuel, LLC 6/30/2011 41,000,000 12,800,000 28,200,000 28,200,000 28,200,000 - 28,200,000 Team CO2, LLC 6/30/2011 8,122,511 (600,000) 8,722,511 4,363,000 3,535,500 154,166 3,689,666 IRION Minerals, LLC (remaining interest) 6/30/2011 5,060,000 (1,600,000) 6,660,000 6,660,000 6,660,000 - 6,660,000 Falcon VPP, LP 6/30/2011 209,570,000 198,300,000 11,270,000 11,270,000 2,043,015 5,488,359 7,531,374
Total QEP I 36,837,438,882 34,406,600,000 2,430,838,882 626,530,000 582,553,717 47,972,950 630,526,667
7|
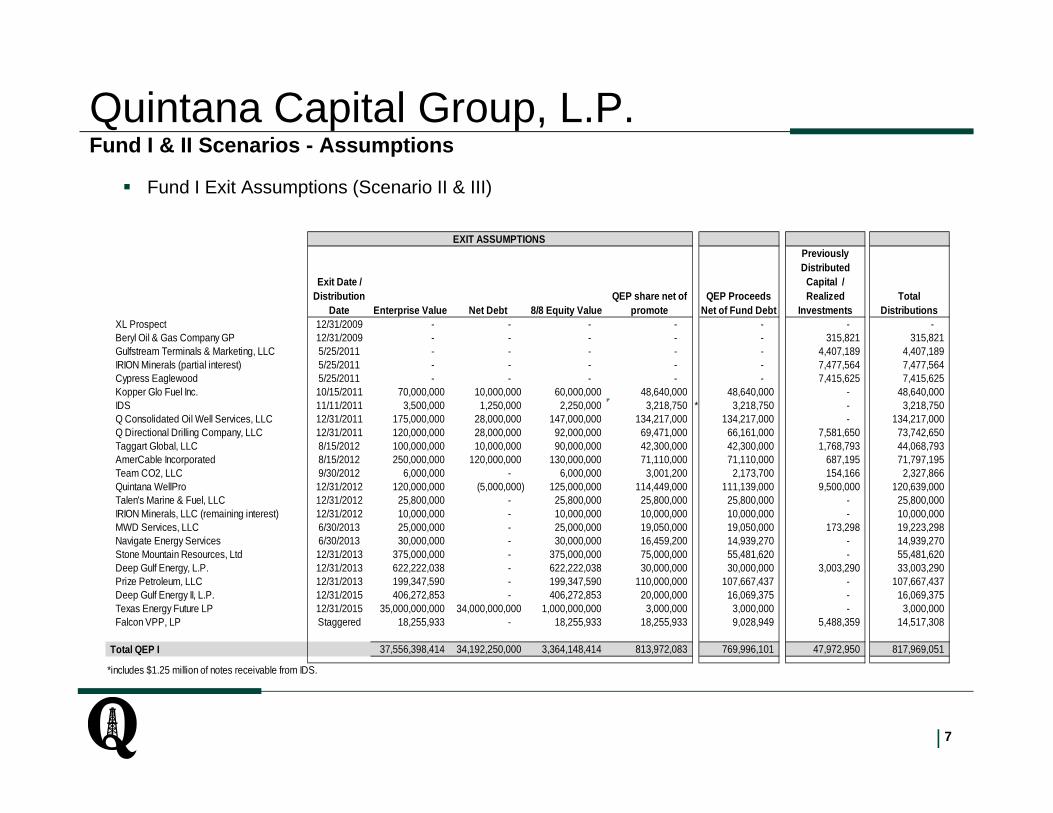
Quintana Capital Group, L.P.Fund I & II Scenarios - Assumptions
Fund I Exit Assumptions (Scenario II & III)
EXIT ASSUMPTIONS
Exit Date / Distribution
Date Enterprise Value Net Debt 8/8 Equity ValueQEP share net of
promote QEP Proceeds
Net of Fund Debt
Previously Distributed
Capital / Realized
InvestmentsTotal
DistributionsXL Prospect 12/31/2009 - - - - - - - Beryl Oil & Gas Company GP 12/31/2009 - - - - - 315,821 315,821 Gulfstream Terminals & Marketing, LLC 5/25/2011 - - - - - 4,407,189 4,407,189 IRION Minerals (partial interest) 5/25/2011 - - - - - 7,477,564 7,477,564 Cypress Eaglewood 5/25/2011 - - - - - 7,415,625 7,415,625 Kopper Glo Fuel Inc. 10/15/2011 70,000,000 10,000,000 60,000,000 48,640,000 48,640,000 - 48,640,000 IDS 11/11/2011 3,500,000 1,250,000 2,250,000 3,218,750 * 3,218,750 - 3,218,750 Q Consolidated Oil Well Services, LLC 12/31/2011 175,000,000 28,000,000 147,000,000 134,217,000 134,217,000 - 134,217,000 Q Directional Drilling Company, LLC 12/31/2011 120,000,000 28,000,000 92,000,000 69,471,000 66,161,000 7,581,650 73,742,650 Taggart Global, LLC 8/15/2012 100,000,000 10,000,000 90,000,000 42,300,000 42,300,000 1,768,793 44,068,793 AmerCable Incorporated 8/15/2012 250,000,000 120,000,000 130,000,000 71,110,000 71,110,000 687,195 71,797,195 Team CO2, LLC 9/30/2012 6,000,000 - 6,000,000 3,001,200 2,173,700 154,166 2,327,866 Quintana WellPro 12/31/2012 120,000,000 (5,000,000) 125,000,000 114,449,000 111,139,000 9,500,000 120,639,000 Talen's Marine & Fuel, LLC 12/31/2012 25,800,000 - 25,800,000 25,800,000 25,800,000 - 25,800,000 IRION Minerals, LLC (remaining interest) 12/31/2012 10,000,000 - 10,000,000 10,000,000 10,000,000 - 10,000,000 MWD Services, LLC 6/30/2013 25,000,000 - 25,000,000 19,050,000 19,050,000 173,298 19,223,298 Navigate Energy Services 6/30/2013 30,000,000 - 30,000,000 16,459,200 14,939,270 - 14,939,270 Stone Mountain Resources, Ltd 12/31/2013 375,000,000 - 375,000,000 75,000,000 55,481,620 - 55,481,620 Deep Gulf Energy, L.P. 12/31/2013 622,222,038 - 622,222,038 30,000,000 30,000,000 3,003,290 33,003,290 Prize Petroleum, LLC 12/31/2013 199,347,590 - 199,347,590 110,000,000 107,667,437 - 107,667,437 Deep Gulf Energy II, L.P. 12/31/2015 406,272,853 - 406,272,853 20,000,000 16,069,375 - 16,069,375 Texas Energy Future LP 12/31/2015 35,000,000,000 34,000,000,000 1,000,000,000 3,000,000 3,000,000 - 3,000,000 Falcon VPP, LP Staggered 18,255,933 - 18,255,933 18,255,933 9,028,949 5,488,359 14,517,308
Total QEP I 37,556,398,414 34,192,250,000 3,364,148,414 813,972,083 769,996,101 47,972,950 817,969,051
*includes $1.25 million of notes receivable from IDS.

8|
Quintana Capital Group, L.P.Fund I & II Scenarios - Assumptions
Fund II 6-30-11 Hypothetical Liquidation (FAS Values reduced by outstanding fund debt)
EXIT ASSUMPTIONS
Exit Date / Distribution
DateEnterprise
Value Net Debt 8/8 Equity Value
QEP share net of promote per
6/30/11 FASQEP Proceeds
Net of Fund Debt
Previously Distributed
Capital / Realized Investments Total Distributions
Mustang Creek Holdings LP 11/24/2010 - - - - - 9,850,000 9,850,000 Genesis Energy LP 11/24/2010 - - - - - 2,200,433 2,200,433 Chase Power Development LLC 6/30/2011 45,800,000 (900,000) 46,700,000 40,336,861 31,800,865 - 31,800,865 East Texas Oil & Gas LLC 6/30/2011 37,000,000 (3,500,000) 40,500,000 39,027,000 26,184,791 - 26,184,791 Quality Magnetite LLC 6/30/2011 22,500,000 1,800,000 20,700,000 17,591,000 17,591,000 5,530,073 23,121,073 Genesis Energy LP 6/30/2011 2,395,200,000 650,600,000 1,744,600,000 118,800,000 104,887,666 - 104,887,666 Q Argentina E&P Holdings 6/30/2011 1,100,000 (1,100,000) 2,200,000 2,078,975 809,060 - 809,060 CIM 6/30/2011 10,600,000 (3,400,000) 14,000,000 8,260,173 - - - Quintana Shipping 6/30/2011 53,000,000 24,000,000 29,000,000 2,173,395 - - -
Total QEP II 2,565,200,000 667,500,000 1,897,700,000 228,267,404 181,273,382 17,580,506 198,853,888

9|
Quintana Capital Group, L.P.Fund I & II Scenarios - Assumptions
Fund II Exit Assumptions (Scenario II)
Scenario : Chase development fee 1 EXIT ASSUMPTIONS
Exit Date / Distribution
Date Enterprise Value Net Debt 8/8 Equity Value
QEP share net of
promoteQEP Proceeds
Net of Fund Debt
Previously Distributed
Capital / Realized Investments Total Distributions
Mustang Creek Holdings LP 11/24/2010 - - - - - 9,850,000 9,850,000 Genesis Energy LP 11/24/2010 - - - - - 2,200,433 2,200,433 Genesis Energy LP (partial interest) 7/22/2011 - - - - - 29,810,793 29,810,793 Genesis Energy LP (remaining interest) Staggered (a) - - - 101,163,591 87,729,858 - 87,729,858 Q Argentina E&P Holdings 12/31/2011 - - - 1,269,915 - - - Chase Power Development LLC 12/31/2012 117,500,000 - 117,500,000 102,107,500 91,937,188 - 91,937,188 Quality Magnetite LLC 5/15/2013 35,000,000 - 35,000,000 34,405,000 34,405,000 5,530,073 39,935,073 East Texas Oil & Gas LLC 12/31/2013 75,033,817 - 75,033,817 72,257,566 58,337,768 - 58,337,768 CIM 12/31/2013 40,000,000 5,000,000 35,000,000 24,500,000 12,883,969 - 12,883,969 Quintana Shipping 12/31/2014 64,200,000 24,000,000 40,200,000 3,000,000 - - -
Total QEP II 331,733,817 29,000,000 302,733,817 338,703,572 285,293,783 47,391,299 332,685,082 1Chase development fee scenario assumes $75 million development fee plus expenses received by Chase Power Development LLC.(a) Remaining common units sold and distributed to LP's by 12/31/2012. 1st - 4th tranche waivers sold and distributed to LP's by 12/31/2012, 12/31/2013, 12/31/2014, 12/31/2015, respectively. Unit price assumed to be $23 for remaining common units and $25 for waiver units. Vesting of waiver units determined by $0 .0075 increase in distributions per quarter.

10|
Quintana Capital Group, L.P.Fund I & II Scenarios - Assumptions
Fund II Exit Assumptions (Scenario III)
Scenario : Chase = cost EXIT ASSUMPTIONS
Exit Date / Distribution
Date Enterprise Value Net Debt 8/8 Equity Value
QEP share net of
promoteQEP Proceeds
Net of Fund Debt
Previously Distributed
Capital / Realized Investments Total Distributions
Mustang Creek Holdings LP 11/24/2010 - - - - - 9,850,000 9,850,000 Genesis Energy LP 11/24/2010 - - - - - 2,200,433 2,200,433 Genesis Energy LP (partial interest) 7/22/2011 - - - - - 29,810,793 29,810,793 Genesis Energy LP (remaining interest) Staggered (a) - - - 101,163,591 87,729,858 - 87,729,858 Q Argentina E&P Holdings 12/31/2011 - - - 1,269,915 - - - Chase Power Development LLC 12/31/2012 47,798,459 - 47,798,459 41,536,861 31,366,549 - 31,366,549 Quality Magnetite LLC 5/15/2013 35,000,000 - 35,000,000 34,405,000 34,405,000 5,530,073 39,935,073 East Texas Oil & Gas LLC 12/31/2013 75,033,817 - 75,033,817 72,257,566 58,337,768 - 58,337,768 CIM 12/31/2013 40,000,000 5,000,000 35,000,000 24,500,000 12,883,969 - 12,883,969 Quintana Shipping 12/31/2014 64,200,000 24,000,000 40,200,000 3,000,000 - - -
- Total QEP II 262,032,276 29,000,000 233,032,276 278,132,933 224,723,144 47,391,299 272,114,443
(a) Remaining common units sold and distributed to LP's by 12/31/2012. 1st - 4th tranche waivers sold and distributed to LP's by 12/31/2012, 12/31/2013, 12/31/2014, 12/31/2015, respectively. Unit price assumed to be $23 for remaining common units and $25 for waiver units. Vesting of waiver units determined by $0 .0075 increase in distributions per quarter.

11|
Quintana Capital Group, L.P.Fund I & II Scenarios - Assumptions
Fund II Exit Assumptions (Scenario IV)
Scenario : Chase = 50% cost EXIT ASSUMPTIONS
Exit Date / Distribution
Date Enterprise Value Net Debt 8/8 Equity Value
QEP share net of
promoteQEP Proceeds
Net of Fund Debt
Previously Distributed
Capital / Realized Investments Total Distributions
Mustang Creek Holdings LP 11/24/2010 - - - - - 9,850,000 9,850,000 Genesis Energy LP 11/24/2010 - - - - - 2,200,433 2,200,433 Genesis Energy LP (partial interest) 7/22/2011 - - - - - 29,810,793 29,810,793 Genesis Energy LP (remaining interest) Staggered (a) - - - 101,163,591 87,729,858 - 87,729,858 Q Argentina E&P Holdings 12/31/2011 - - - 1,269,915 - - - Chase Power Development LLC 12/31/2012 23,899,230 - 23,899,230 20,768,430 10,598,118 - 10,598,118 Quality Magnetite LLC 5/15/2013 35,000,000 - 35,000,000 34,405,000 34,405,000 5,530,073 39,935,073 East Texas Oil & Gas LLC 12/31/2013 75,033,817 - 75,033,817 72,257,566 58,337,768 - 58,337,768 CIM 12/31/2013 40,000,000 5,000,000 35,000,000 24,500,000 12,883,969 - 12,883,969 Quintana Shipping 12/31/2014 64,200,000 24,000,000 40,200,000 3,000,000 - - -
- Total QEP II 238,133,047 29,000,000 209,133,047 257,364,502 203,954,713 47,391,299 251,346,012
(a) Remaining common units sold and distributed to LP's by 12/31/2012. 1st - 4th tranche waivers sold and distributed to LP's by 12/31/2012, 12/31/2013, 12/31/2014, 12/31/2015, respectively. Unit price assumed to be $23 for remaining common units and $25 for waiver units. Vesting of waiver units determined by $0 .0075 increase in distributions per quarter.

12|
Quintana Capital Group, L.P.Funds I & II Scenarios - Assumptions
Fund II Exit Assumptions (Scenario V)
Scenario : Chase = 0 EXIT ASSUMPTIONS
Exit Date / Distribution
Date Enterprise Value Net Debt 8/8 Equity Value
QEP share net of
promoteQEP Proceeds
Net of Fund Debt
Previously Distributed
Capital / Realized Investments Total Distributions
Mustang Creek Holdings LP 11/24/2010 - - - - - 9,850,000 9,850,000 Genesis Energy LP 11/24/2010 - - - - - 2,200,433 2,200,433 Genesis Energy LP (partial interest) 7/22/2011 - - - - - 29,810,793 29,810,793 Genesis Energy LP (remaining interest) Staggered (a) - - - 101,163,591 87,729,858 - 87,729,858 Q Argentina E&P Holdings 12/31/2011 - - 1,269,915 - - - Chase Power Development LLC 12/31/2012 - - - - - - Quality Magnetite LLC 5/15/2013 35,000,000 - 35,000,000 34,405,000 34,405,000 5,530,073 39,935,073 East Texas Oil & Gas LLC 12/31/2013 75,033,817 - 75,033,817 72,257,566 48,167,456 - 48,167,456 CIM 12/31/2013 40,000,000 5,000,000 35,000,000 24,500,000 12,883,969 - 12,883,969 Quintana Shipping 12/31/2014 64,200,000 24,000,000 40,200,000 3,000,000 - - -
- Total QEP II 214,233,817 29,000,000 185,233,817 236,596,072 183,186,283 47,391,299 230,577,582
(a) Remaining common units sold and distributed to LP's by 12/31/2012. 1st - 4th tranche waivers sold and distributed to LP's by 12/31/2012, 12/31/2013, 12/31/2014, 12/31/2015, respectively. Unit price assumed to be $23 for remaining common units and $25 for waiver units. Vesting of waiver units determined by $0 .0075 increase in distributions per quarter.

13|
Quintana Capital Group, L.P.
Hurdle Review

Quintana Capital Group, L.P.Strategic Assessment
September 12, 2011 10:00 am – 11:00 am
Loren Soetenga
Confidential – Do Not Distribute

15|
Quintana Capital Group, L.P.Expected hold periods
Commitment period ends September 15th
2011
Investment period ends September 15th 2016
Commitment period ends December 4th 2013
Investment period ends December 4th 2018
16|16
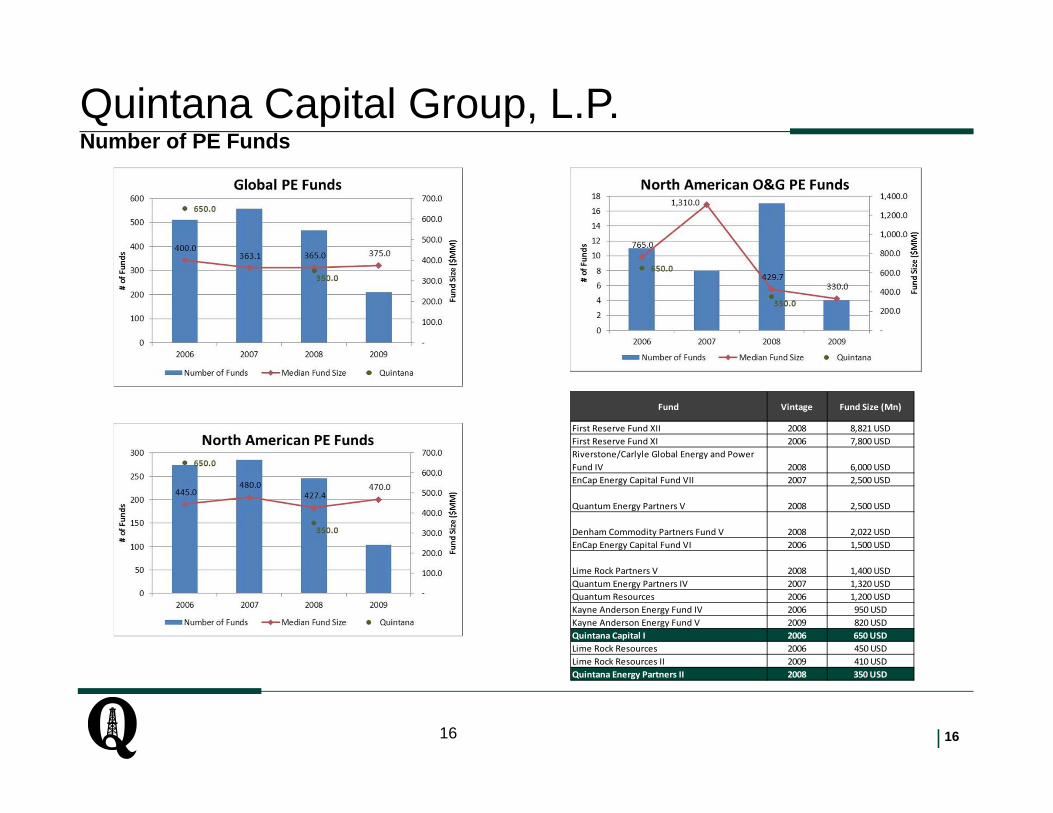
Fund Vintage Fund Size (Mn)
First Reserve Fund XII 2008 8,821 USDFirst Reserve Fund XI 2006 7,800 USDRiverstone/Carlyle Global Energy and Power Fund IV 2008 6,000 USDEnCap Energy Capital Fund VII 2007 2,500 USD
Quantum Energy Partners V 2008 2,500 USD
Denham Commodity Partners Fund V 2008 2,022 USDEnCap Energy Capital Fund VI 2006 1,500 USD
Lime Rock Partners V 2008 1,400 USDQuantum Energy Partners IV 2007 1,320 USDQuantum Resources 2006 1,200 USDKayne Anderson Energy Fund IV 2006 950 USDKayne Anderson Energy Fund V 2009 820 USDQuintana Capital I 2006 650 USDLime Rock Resources 2006 450 USDLime Rock Resources II 2009 410 USDQuintana Energy Partners II 2008 350 USD
Quintana Capital Group, L.P.Number of PE Funds

17|17
Fund VintageDistr. (%)
DPICalled (%)
Lime Rock Resources 2006 46% 102%EnCap Energy Capital Fund VI 2006 86% 88%
First Reserve Fund XI 2006 33% 86%Quantum Resources 2006 6% 86%
Quintana Capital I 2006 8% 83%Riverstone/Carlyle Global Energy and Power Fund IV 2008 20% 69%Lime Rock Partners V 2008 1% 64%
EnCap Energy Capital Fund VII 2007 32% 63%Denham Commodity Partners Fund V 2008 31% 54%First Reserve Fund XII 2008 8% 52%Kayne Anderson Energy Fund IV 2006 0% 51%Quantum Energy Partners IV 2007 25% 39%Lime Rock Resources II 2009 0% 35%Quintana Energy Partners II 2008 6% 33%Quantum Energy Partners V 2008 13% 8%Kayne Anderson Energy Fund V 2009 0% 6%
Quintana Capital Group, L.P.Capital ratios – report date 12/31/10 or later

18|18
Fund VintageDistr. (%)
DPICalled (%)
Lime Rock Resources 2006 46% 102%EnCap Energy Capital Fund VI 2006 86% 88%
First Reserve Fund XI 2006 33% 86%Quintana Capital I 2006 8% 83%Riverstone/Carlyle Global Energy and Power Fund IV 2008 20% 69%
Lime Rock Partners V 2008 1% 64%EnCap Energy Capital Fund VII 2007 32% 63%
Denham Commodity Partners Fund V 2008 31% 54%First Reserve Fund XII 2008 8% 52%Kayne Anderson Energy Fund IV 2006 0% 51%Lime Rock Resources II 2009 0% 35%Quintana Energy Partners II 2008 6% 33%Quantum Energy Partners V 2008 13% 8%Kayne Anderson Energy Fund V 2009 0% 6%
Quintana Capital Group, L.P.Capital ratios – report date 3/31/11 or later

19|19
Fund Vintage QuartileNet IRR (%)
Multiple (X)
Quintana Energy Partners II 2008 1 36% 1.74xEnCap Energy Capital Fund VI 2006 1 25% 1.63xRiverstone/Carlyle Global Energy and Power Fund IV 2008 1 21% 1.5xLime Rock Resources 2006 1 9% 1.39x
Lime Rock Partners V 2008 1 25% 1.38x
EnCap Energy Capital Fund VII 2007 1 16% 1.25xQuintana Capital I 2006 2 5% 1.18x
Denham Commodity Partners Fund V 2008 2 10% 1.17xFirst Reserve Fund XI 2006 2 3% 1.08xLime Rock Resources II 2009 n/a n/m 1.08xQuantum Energy Partners IV 2007 3 % 1.xKayne Anderson Energy Fund IV 2006 3 ‐6% .92xFirst Reserve Fund XII 2008 4 ‐18% .84xQuantum Resources 2006 4 ‐11% .82xKayne Anderson Energy Fund V 2009 n/a n/m .64xQuantum Energy Partners V 2008 4 ‐33% .42x
Quintana Capital Group, L.P.Performance Ratios - report date 12/30/10 or later

20|
Quintana Capital Group, L.P.Performance Ratios - report date 3/31/11 or later
Fund Vintage QuartileNet IRR (%)
Multiple (X)
Quintana Energy Partners II 2008 1 36% 1.74xEnCap Energy Capital Fund VI 2006 1 25% 1.63xRiverstone/Carlyle Global Energy and Power Fund IV 2008 1 21% 1.5xLime Rock Resources 2006 1 9% 1.39x
Lime Rock Partners V 2008 1 25% 1.38x
EnCap Energy Capital Fund VII 2007 1 16% 1.25xQuintana Capital I 2006 2 5% 1.18x
Denham Commodity Partners Fund V 2008 2 10% 1.17xFirst Reserve Fund XI 2006 2 3% 1.08xLime Rock Resources II 2009 n/a n/m 1.08xKayne Anderson Energy Fund IV 2006 3 ‐6% .92xFirst Reserve Fund XII 2008 4 ‐18% .84xKayne Anderson Energy Fund V 2009 n/a n/m .64xQuantum Energy Partners V 2008 4 ‐33% .42x

21|21
x
[BLANK]

22|22
x
[BLANK]

23|
Actions
– Return of capital $450-$550m (fund I & fund II)
– Be firm on exit timeline
Fund III
– Placement agents
– Marketing timeline
Quintana Capital Group, L.P.Long Term Objectives

Downstream and Coal ServicesTalen’s Marine & Fuel Inc.
September 12, 2011 11:00 am – 1:00 pm
George Dethlefsen
25|
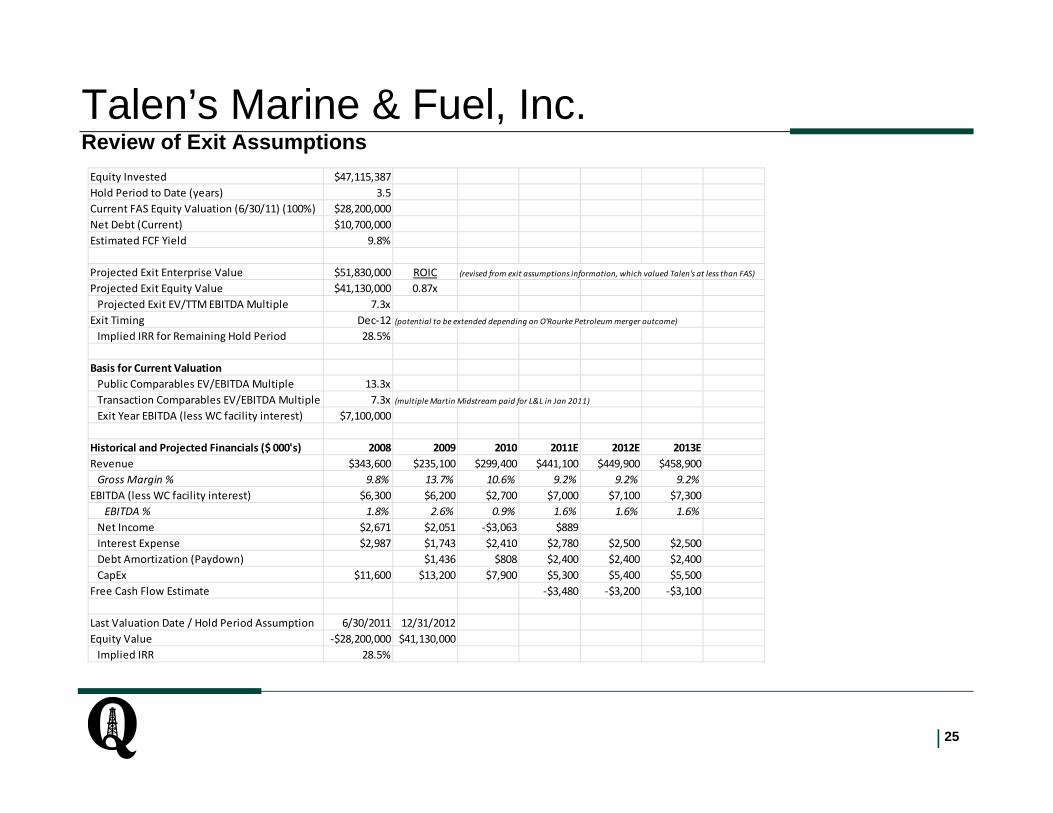
Talen’s Marine & Fuel, Inc.Review of Exit AssumptionsEquity Invested $47,115,387Hold Period to Date (years) 3.5Current FAS Equity Valuation (6/30/11) (100%) $28,200,000Net Debt (Current) $10,700,000Estimated FCF Yield 9.8%
Projected Exit Enterprise Value $51,830,000 ROIC (revised from exit assumptions information, which valued Talen's at less than FAS)
Projected Exit Equity Value $41,130,000 0.87xProjected Exit EV/TTM EBITDA Multiple 7.3x
Exit Timing Dec‐12 (potential to be extended depending on O'Rourke Petroleum merger outcome)
Implied IRR for Remaining Hold Period 28.5%
Basis for Current ValuationPublic Comparables EV/EBITDA Multiple 13.3xTransaction Comparables EV/EBITDA Multiple 7.3x (multiple Martin Midstream paid for L&L in Jan 2011)
Exit Year EBITDA (less WC facility interest) $7,100,000
Historical and Projected Financials ($ 000's) 2008 2009 2010 2011E 2012E 2013ERevenue $343,600 $235,100 $299,400 $441,100 $449,900 $458,900Gross Margin % 9.8% 13.7% 10.6% 9.2% 9.2% 9.2%
EBITDA (less WC facility interest) $6,300 $6,200 $2,700 $7,000 $7,100 $7,300EBITDA % 1.8% 2.6% 0.9% 1.6% 1.6% 1.6%
Net Income $2,671 $2,051 ‐$3,063 $889Interest Expense $2,987 $1,743 $2,410 $2,780 $2,500 $2,500Debt Amortization (Paydown) $1,436 $808 $2,400 $2,400 $2,400CapEx $11,600 $13,200 $7,900 $5,300 $5,400 $5,500
Free Cash Flow Estimate ‐$3,480 ‐$3,200 ‐$3,100
Last Valuation Date / Hold Period Assumption 6/30/2011 12/31/2012Equity Value ‐$28,200,000 $41,130,000Implied IRR 28.5%
26|
Talen’s Marine & Fuel, Inc.Strategic Growth Initiatives
Expand land-based lubricants business, potentially through a merger with O'Rourke Petroleum
Expand services revenues and other non-fuel, non-lubricants businesses
Rationalize pricing for high capital intensity businesses (midstreaming)
Increase exposure to growing markets, such as unconvential gas plays
Increase contract-based business with customers and attract new customers to full service docks

27|
Talen’s Marine & Fuel, Inc.Key Milestones
Target Date
1. Restore positive free cash flow and reduce leverage by expanding higher margin product lines and activities
Jan-12
2. Increase return on capital employed by adjusting midstreaming pricing and rationalizing assets
Dec-11
3. Address incentives for non-management level employees Dec-11
4. Review systems needs and upgrade where appropriate Dec-11
5. Fully integrate UFL acquisition Mar-12
6. Market window staying open - MLP acquirers having a currency Jun-12
28|
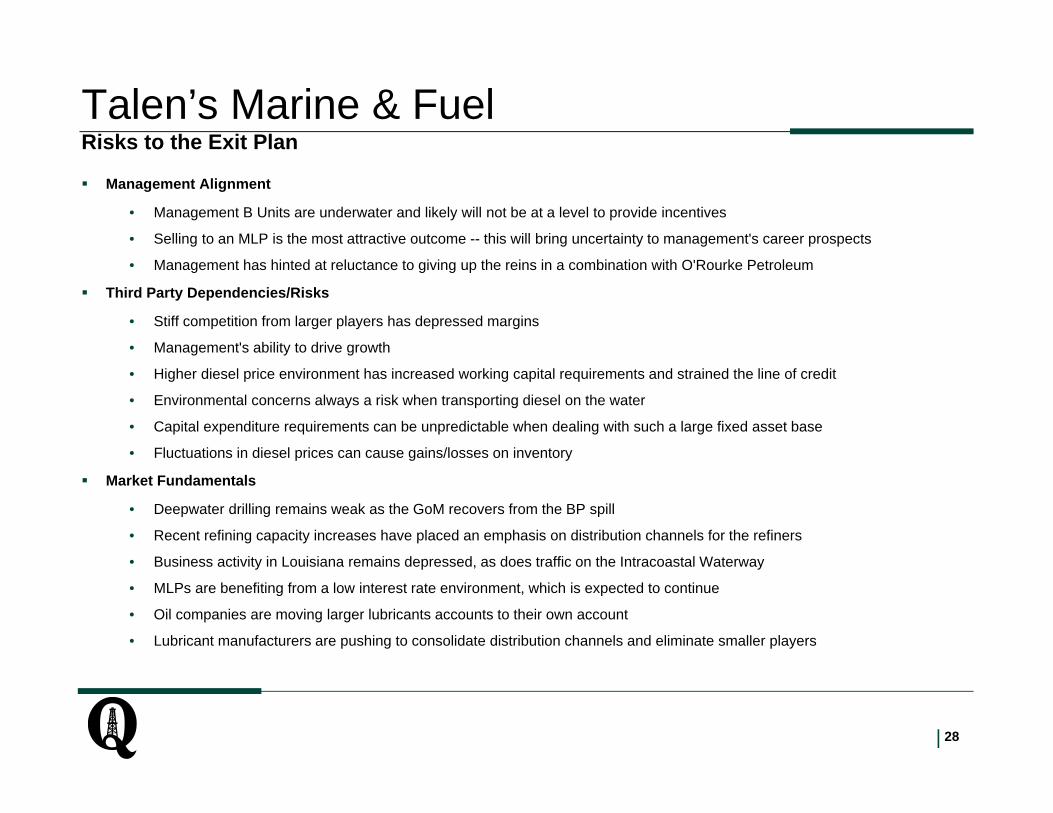
Talen’s Marine & FuelRisks to the Exit Plan
Management Alignment
• Management B Units are underwater and likely will not be at a level to provide incentives
• Selling to an MLP is the most attractive outcome -- this will bring uncertainty to management's career prospects
• Management has hinted at reluctance to giving up the reins in a combination with O'Rourke Petroleum
Third Party Dependencies/Risks
• Stiff competition from larger players has depressed margins
• Management's ability to drive growth
• Higher diesel price environment has increased working capital requirements and strained the line of credit
• Environmental concerns always a risk when transporting diesel on the water
• Capital expenditure requirements can be unpredictable when dealing with such a large fixed asset base
• Fluctuations in diesel prices can cause gains/losses on inventory
Market Fundamentals
• Deepwater drilling remains weak as the GoM recovers from the BP spill
• Recent refining capacity increases have placed an emphasis on distribution channels for the refiners
• Business activity in Louisiana remains depressed, as does traffic on the Intracoastal Waterway
• MLPs are benefiting from a low interest rate environment, which is expected to continue
• Oil companies are moving larger lubricants accounts to their own account
• Lubricant manufacturers are pushing to consolidate distribution channels and eliminate smaller players

Taggart USA Global, LLC

30|
Taggart Global USA, LLCReview of Exit Assumptions
Equity Invested $47,500,000Hold Period to Date (years) 4.5Current FAS Equity Valuation (6/30/11) (100%) $80,000,000Net Debt (Current) $10,000,000Weighted Average Cost of Capital (6/30) 25.1%
Projected Exit Enterprise Value $100,000,000 ROICProjected Exit Equity Value $90,000,000 0.9x (excludes distributions)
Exit Year TTM EBITDA $22,634,000Projected Exit EV/TTM EBITDA Multiple 4.4xExit Year Forward EBITDA $10,500,000Projected Exit EV/Forward EBITDA Multiple 9.5x
Exit Timing Aug‐12Implied IRR for Remaining Hold Period 11.0%
Basis for Current ValuationPublic Comparables EV/EBITDA Multiple 8.0xTransaction Comparables EV/EBITDA Multiple 7.9x
FAS ProjectionsHistorical and Projected Financials ($ 000's) 2007 2008 2009 2010 2011E 2012E 2013ERevenue $171,131 $244,699 $422,472 $369,661 $413,101 $350,000 $385,000Gross Margin % 13% 15% 13% 9% 14% 11% 10%
EBITDA ‐$5,650 $5,049 $15,861 $4,159 $22,634 $10,500 $11,600EBITDA % ‐3.3% 2.1% 3.8% 1.1% 5.5% 3.0% 3.0%
Net Income ‐$6,500 $2,662 $12,125 ‐$1,591 $14,415 ‐ ‐CapEx $2,270 $1,721 $2,634 $1,583 $2,148 $1,300 $1,500
Backlog at 12/31 $145,438 $202,062 $188,833 $217,724 $234,000Gross Profit Backlog at 12/31 $20,866 $27,392 $25,875 $28,869 $30,088Prior Year Backlog GP as % of Actual GP 68% 58% 52% 75% 50%
Last Valuation Date / Hold Period Assumption 6/30/2011 8/15/2012Equity Value ‐$80,000,000 $90,000,000Implied IRR 11.0%
31|
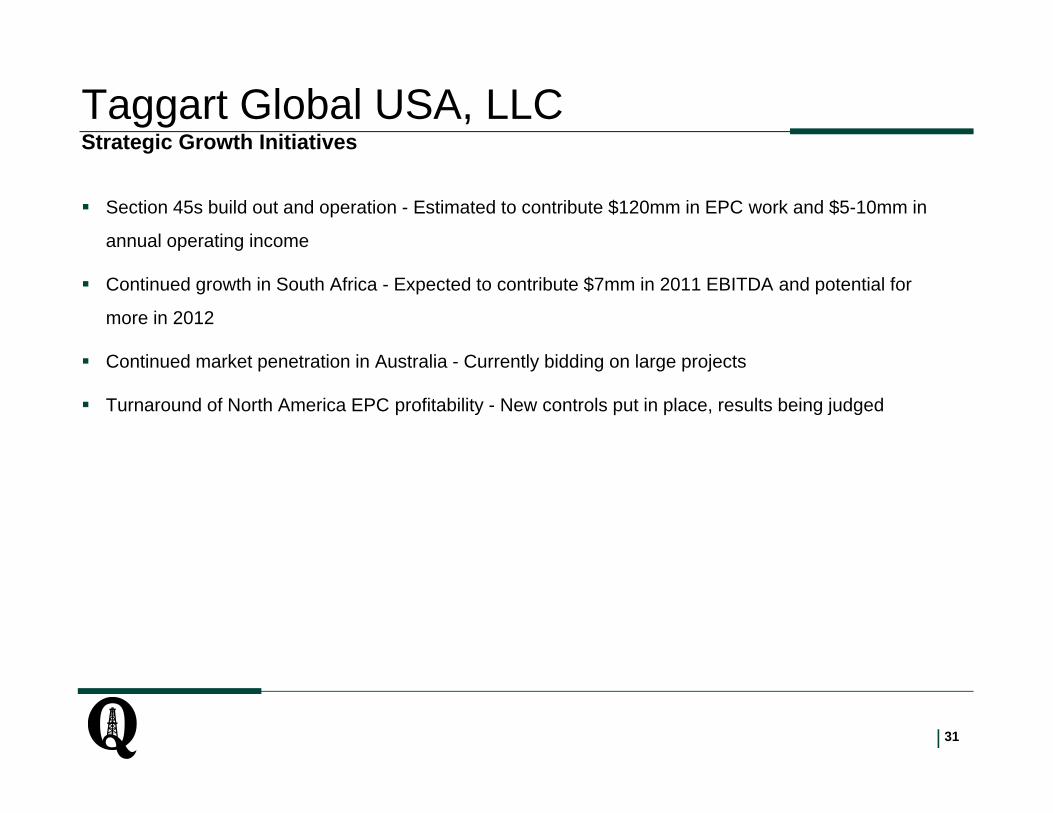
Taggart Global USA, LLCStrategic Growth Initiatives
Section 45s build out and operation - Estimated to contribute $120mm in EPC work and $5-10mm in
annual operating income
Continued growth in South Africa - Expected to contribute $7mm in 2011 EBITDA and potential for
more in 2012
Continued market penetration in Australia - Currently bidding on large projects
Turnaround of North America EPC profitability - New controls put in place, results being judged

32|
Taggart Global USA, LLCKey Milestones
Target Date
1. Cleaning up of related party transactions, minority interests, contingent liabilities, litigation, and excess G&A
Jan -12
2. Achieving >$20mm of EBITDA in 2011 Dec-11
3. Achieving profitability in North America Dec-11
4. Restructuring operations contracts to ensure profitability Dec-11
5. Growing backlog (specifically gross profit in backlog) Mar-12
6. Market window staying open - Potential acquirers having a currency Mar-12

33|
Taggart Global USA, LLCRisks to the Exit Plan
Management Alignment
• Management must buy in to cleaning up due diligence issues that arose in FLSmidth transaction
• Taggart management owns slightly more than 50% of the equity
• The Board, including management, has agreed to an exit plan that includes a 2012 auction process and sale
• Management is motivated and willing to sell
Third Party Dependencies/Risks
• KPMG Audit
• Potential management changes
• Overall coal/commodity price environment
• Section 45 legislation / permitting
• Incorporation of Australia JV / Partnership with Ausenco
• Sale of Langfang business in China
• Litigation with Arcelor Mittal
Market Fundamentals
• Robust demand for metallurgical coal worldwide
• Reduced demand for steam coal projects in North America - little room for growth from 2011 base in N.A.
• Strong demand for coal projects in China, Australia, Western Canada, and South Africa
• Seaborne-traded coal prices justify new infrastructure…for now
• Growth coming from international markets

AmerCable, Inc.

35|
AmerCable, Inc.Review of Exit AssumptionsEquity Invested $52,386,000Hold Period to Date (years) 4.1Current FAS Equity Valuation (6/30/11) (54.6%) $43,609,000Net Debt (Current) $124,292,000Cost of Capital 19.2%
Projected Exit Enterprise Value $250,000,000 ROICProjected Exit Equity Value $125,708,000 1.3xProjected Exit EV/TTM EBITDA Multiple 8.7x
Exit Timing Aug‐12Implied IRR for Remaining Hold Period 49.5%
Basis for Current ValuationPublic Comparables EV/EBITDA Multiple 7.0xTransaction Comparables EV/EBITDA Multiple 8.7xExit Year EBITDA ($ 000's) $31,700
Historical and Projected Financials ($ 000's) 2007 2008 2009 2010 2011E 2012E 2013ERevenue $202,797 $232,202 $155,331 $184,703 $253,700 $286,900 $256,800Contribution Margin % 47.7% 44.9% 47.1% 45.2% 42.3% 43.9% 43.9%
EBITDA $30,800 $31,700 $23,400 $21,000 $25,600 $31,700 $36,300EBITDA % 15.2% 13.7% 15.1% 11.4% 10.1% 11.0% 14.1%
Net Income ‐$5,500 $15,600 ‐$3,000 ‐$1,100 $4,800 $9,300 $12,500CapEx $13,828 $6,807 $2,801 $3,022 $4,469 $3,419 $3,500Taxes NA NA $700 NA $3,200 $6,200 $8,300
Last Valuation Date / Hold Period Assumption 6/30/2011 8/15/2012Equity Value ‐$43,609,000 $68,636,568Implied IRR 49.5%

36|
AmerCable, Inc.Strategic Growth Initiatives
Oil & Gas solutions - increasing sales to oil & gas drillers targeting shale plays
Renewed focus on large offshore oil & gas projects (Chevron and Shell)
MRO Business - increasing after-market sales to mining customers and partnering with new distributors on the oil & gas side
International Mining - Panther brand rollout in China, Australia, and Latin America
China Manufacturing Plant - Considering a scaled down version
Alternative Energy - Expanding sales to non-First Solar customers and partnering with another assemblies manufacturer

37|
AmerCable, Inc.Key Milestones
Target Date
1. Demonstrate progress in turning around the oil & gas division Dec-11
2. Succession planning - putting in place a SVP of Oil & Gas and a SVP of Mining Dec-11
3. Achieving >$30mm of EBITDA in 2012 or having a credible plan to get there (if we sell prior to Dec-12)
Jun-12
4. Establishing a manufacturing presence in China (to provide a growth story to potential buyers)
Dec-11
5. Market window(s) staying open - Debt and equity capital markets Jun-12
6. Winning large oil & gas projects (Chevron Jack St Malo, Bigfoot and Shell Olympus)
Dec-11
7. Increasing penetration in international markets (China, Australia in particular) Dec-11

38|
AmerCable, Inc.Risks to the Exit Plan Management Alignment
• Management must buy in to selling to a strategic acquirer for full value to be achieved
• Short term vs. Long term incentives must be reviewed and reconciled
• Most of management's options are out of the money below $270mm of EV
• The Board, including management, has agreed to an exit plan (timing)
Third Party Dependencies/Risks
• Credit Agreement -- covenants are expected to be breached in 2H 2011; Refinancing is expensive
• Market window(s) staying open - Debt and equity capital markets
• Overall commodity price environment
• Margins -- raw material costs increasing, AmerCable has not had success in passing costs through to customers
• Competition from large, well capitalized organizations who are eyeing the energy/infrastructure space
• Regulatory environment in the Gulf of Mexico
Market Fundamentals
• Robust demand for coal projects worldwide / Growth coming from international markets
• Solar installations continuing to climb
• Land drilling business in US extremely strong
• Offshore oil & gas projects moving forward globally, GoM still lagging
• Korean manufacturers putting pricing pressure on the cable market in oil & gas
• Shipyards making more purchasing decisions, focused on price

Oil and Gas ServicesMWD Services & NES
September 12, 2011 1:00 pm – 2:30 pm
Steve Thompson and Chris Baker

40|
MWD Services, LLC6/30/2011 MWD & NES FAS Overview
SummaryEquity Invested $27,900,000Hold Period to Date (years) 4Current FAS Equity Valuation (6/30/11) (100%) $28,210,830Cash (6/30/11) $1,011,905Debt (6/30/11) $0OwnershipQEP 76.2%Mgmt 23.8%
Valuation Summary - MWD Services, LLC - 06.30.2011 ValuationGross NetEquity QEP Equity Relative Applicable
Valuation Method ($MM) Value Ownership Value Weighting Value
Discounted Cash Flow - Multiple Method $23.2 78.3% $18.2 17.5% $3.2
Discounted Cash Flow - Perpetual Growth Method $13.9 78.3% $10.9 17.5% $1.9
Precedent Transaction Comparables - 6/30/11 LTM EBITDA $24.7 78.3% $19.3 35.0% $6.8
Public Trading Comparables - 6/30/11 LTM EBITDA $30.0 78.3% $23.5 15.0% $3.5
Public Trading Comparables - 2011E EBITDA $17.2 78.3% $13.4 15.0% $2.0
Implied Valuation Recommendation 100.0% $17.4
Investment in NES 13.8$ 78.3% $10.8 100.0% $10.8
Total Value Recommendation $28.2
Basis for Current FAS ValuationPublic Comparables EV/2011 EBITDA Multiple 6.4xPublic Comparables EV/LTM EBITDA Multiple 8.0xTransaction Comparables EV/LTM EBITDA Multiple 6.6xWACC 15.0%2011P EBITDA $2,671,767
FAS 157 Implied Enterprise Value MultiplesLTM 7.3x2011E 10.2x
FAS 157 Implied Enterprise Value Multiples (Excl. NES)LTM 5.7x2011E 7.9x

41|
MWD Services, LLC
Continue to work to resolve MWD tool reliability issues and regain lost customers
– MWDS lost 10 “Follow-me” rigs this year due to tool reliability issues (7 for Integrity, 3 for DDS, plus 1 job for Tri-City); Appendix I details drop in utilization.
– Subsequently MWDS quarantined (“Q’d”) 7 boxes (14 strings) until they determined root cause.
– Despite these issues, MWDS has recently picked up 7 jobs for Wolverine and Helmer and has additional work promised for 6 additional jobs once tools are available.
– As of 9/7/11 all Q’d tools have been released back into the fleet.
– Achieve stable utilization above 55% and correct MWDS market perception prior to marketing Company.
NES achieving successful mwd runs in the lateral
NES technology developments:
– Single board design
– High temperature mwd
– EM proto-type by 1/1/2012
After the DDC transaction closes, potentially merge MWD with NES creating a new directional platform
– Creates a directional platform with proprietary technology and scale providing NES with the tool run hours needed to prove commerciality of their mwd tool.
– MWDS/NES/QEP to provide a business plan to enter the directional space by 10/31/2011
Milestones/Growth Initiatives Threats / Risks
MWD tool reliability issues remain unresolved.
NES’ mwd tool proved unreliable in commercial applications.
Archer responds with a negative view on NES’ technology andtools post their review and analysis.
Macroeconomic weakness causing declining horizontal rig count.
Material build out of incremental mwd capacity by major andindependent service providers delaying NES mwd commercialityand test runs.
NES management incentive model currently has their c-units belowwater requiring ~$42 million equity exit value for NES stand-alonein order for c-unit holders to be in the money.
Achieving alignment with both management teams to approveMWDS/NES merger.
Milestones/Growth and Threats

42|
MWD Services, LLCSummary Financials & Projected Investment Returns
NES Equity Returns**
MWD Summary Financials
MWD Equity Returns*
2007 2008 2009 2010 2011E* 2012PRevenue $11.0 $13.4 $7.9 $14.1 $14.5 $15.58EBITDA 3.3 $3.8 $0.9 $3.7 $3.3 $4.0EBITDA % 30.1% 28.5% 11.7% 26.3% 22.5% 25.7%Monthly EBITDA / Kit** $16,346.2 $11,733.8 $2,854.5 $11,649.0 $9,740.8 $11,500.0* Estimated based on Y.T.D. As of 6/30 plus annual average run rate** Represents Y.T.D. through June
* Fleet of 29 kits. ** QEP makes $2mm investment in NES over next 12 months. NES achieved run-rate Revenue of $10.4 million in July 2011.
IRR (Benchmarked to 6/30/11 FAS)*Consolidated Equity Returns
* 6/30/2013 exit.
Case 1 $26.2 $29.4 $32.6 $35.8 $39.1Case 2 $37.7 $42.2 $46.8 $51.4 $55.9Case 3 $49.1 $55.1 $61.0 $66.9 $72.8Case 4 $60.6 $67.9 $75.1 $82.4 $89.7Case 5 $72.1 $80.7 $89.3 $97.9 $106.5
Case 1 -3.1% 2.6% 8.1% 13.3% 18.3%Case 2 16.2% 23.0% 29.5% 35.6% 41.5%Case 3 32.7% 40.4% 47.7% 54.7% 61.4%Case 4 47.3% 55.9% 64.0% 71.7% 79.1%Case 5 60.7% 70.0% 78.8% 87.2% 95.2%
Revenue NES 2013 RevenueExit Multiple $8.0 $9.0 $10.0 $11.0 $12.0
2.0x $14.0 $16.0 $18.0 $20.0 $22.03.0x $22.0 $25.0 $28.0 $31.0 $34.04.0x $30.0 $34.0 $38.0 $42.0 $46.05.0x $38.0 $43.0 $48.0 $53.0 $58.06.0x $46.0 $52.0 $58.0 $64.0 $70.0
EBITDA Monthly EBITDA/KitExit Multiple $10,000.0 $11,000.0 $12,000.0 $13,000.0 $14,000.0
2.5x $12.2 $13.4 $14.6 $15.8 $17.13.5x $15.7 $17.2 $18.8 $20.4 $21.94.5x $19.1 $21.1 $23.0 $24.9 $26.85.5x $22.6 $24.9 $27.1 $29.4 $31.76.5x $26.1 $28.7 $31.3 $33.9 $36.5

43|
MWD Services, LLCMWD / NES Combined Directional Business Model Case
Directional Business Model Rational Current MWDS projections and valuation support the NES investment to date, i.e. NES sunk cost of $14.5 million to date is potentially
97% covered off by MWDS’ projected valuation.
Creating a combined directional platform provides the optionality to quickly recreate a sizeable independent directional player with proprietary technology providing for:
– Creates a directional platform with proprietary technology and scale providing NES with the tool run hours needed to prove commerciality of their mwdtool.
– Larger buyer universe for the combined companies as a standalone MWDS transaction will not hit the radar of most buyers and a full service directional platform could command a higher multiple.
Estimated total capital to build a combined directional business with 62 kit capability is $ 30.0 million (based on DDC).
Estimated 2013 EBITDA of $29.8 million to $44.6 million.
IRR (Benchmarked to 6/30/11 FAS)*EBITDA Multiple Monthly EBITDA/Kit
59.8% $40,000.0 $45,000.0 $50,000.0 $55,000.0 $60,000.03.5x 29.6% 36.5% 43.0% 49.2% 55.0%4.5x 44.8% 52.5% 59.8% 66.6% 73.1%5.5x 58.2% 66.6% 74.5% 81.9% 89.0%6.5x 70.3% 79.3% 87.8% 95.7% 103.3%7.5x 81.3% 90.9% 99.9% 108.4% 116.4%
* 12/31/2013 exit.
Equity ReturnsEBITDA Multiple Monthly EBITDA/Kit
20460.0% $40,000.0 $45,000.0 $50,000.0 $55,000.0 $60,000.03.5x $104.2 $117.2 $130.2 $143.2 $156.24.5x $133.9 $150.7 $167.4 $184.1 $200.95.5x $163.7 $184.1 $204.6 $225.1 $245.56.5x $193.4 $217.6 $241.8 $266.0 $290.27.5x $223.2 $251.1 $279.0 $306.9 $334.8

44|
MWD Services, LLC
APPENDIX

45|
MWD Services, LLCMWD Utilization
MWD’s currently has 29 tools and utilization remains above 2009 levels (when the Company averaged 26 tools for the year)

46|
MWD Services, LLC
Comparable Transactions
NES Comparable Transactions
Date Acquiror Target TEV/ TTM
Revenue
6/24/2008 Schlumberger Extreme Engineering 8.0x2/2/2008 Flotek Teledrift 5.7x9/15/2007 GE Sondex 4.5x6/30/2004 Sondex Geolink 2.6x
Mean 5.2xMedian 5.1x
Comparable downhole tool transactions have commanded robust 3.0x – 8.0x TTM revenue multiples.

47|
MWD Services, LLC
DDC Monthly EDITDA / Kit
Historical DDC EBITDA / Kit
2008 2009 2010 2011E 2012PEBITDA ($MM) $18.6 $4.4 $12.4 $25.1 $34.0Kit 28 26 32 44 52Monthly EBITDA / KIT $55,357 $14,103 $32,292 $47,538 $54,487
Average('08,'10-'12) $47,418

Quintana WellPro S.A.Investment Level Valuation & Exit Assessment

49|
Quintana WellPro S.A.
Management Overview / Concerns:
– B-unit alignment – Based on IRR threshold rather than ROI, B-unit contribution relative to Tom’s A-units is minimal
– Broad process vs. focused process vs. merger IPO; Tom has material concerns regarding a broad marketing effort
– Tom’s base salary, expense acct, etc. are sufficient to allow him to “time” the exit to maximize returns
– Succession planning ($5million key man insurance)– Ensure exit incentives are aligned via a transaction bonus (to be
shared amongst all senior management) Political instability in Las Heras has halted all activity and driving
utilization lower, 3 rigs idled and 4 others disrupted by instability
– Many operators are waiting on 2011 election results and unionsolutions to contract rigs
DLS, ODE, and H&P are main competition in the high HP drillingrig market. Rumor is that Archer is moving GWES pressurepumping and completion assets to Argentina, potential for Saxon,and other NA drilling firms to chase Argentine shale market
Tom recently stated that San Antonio (All rigs<1,250 HP) hasembraced a strategy “bidding utilization at all costs”
Key Energy recently fired their operations manager and replacedhim with a lower level manager to manage workover business(potential positive)
Exit Risks and Threats Exit Discussion
Consistent with previous discussions, QEP plans to exit QWP via asale or merger in 2012 once:
– Rig #20 is constructed and contracted,
– Rigs 18 and 19 are re-contracted, and
– Overall contracted fleet utilization reaches 65-80%, and/or absentlonger term contracts the track record for short term workdemonstrates acceptable rig utilization capacity.
Exit Assumptions & Threats

50|
Quintana WellPro S.A. 6/30/2011 FAS Overview
Summary
* Includes cash held at IPE.
Valuation Summary
Equity Relative ApplicableValuation Method ($m) Value Weighting Value
Discounted Cash Flow (Average Value) $94.4 70.0% $66.1
Public Trading Comparables $119.8 10.0% $12.0
Precedent Transaction Comparables $108.5 20.0% $21.7
Implied Valuation - Consolidated 100% $99.8Implied ROI - Consolidated 1.60x
Management A-Unit Value $3.5Management B-Unit Value $3.5Net Value to QEP $92.8Implied QEP ROI 1.54x
Equity Invested $62,441,731Hold Period to Date (years) 5Current FAS Equity Valuation (6/30/11) (100%) $99,767,925Cash (6/30/11)* $18,343,449Debt (6/30/11) $9,388,200A‐Unit OwnershipQEP 96.5%Tom Murphy 3.5%
Basis for Current FAS ValuationPublic Comparables EV/2011 EBITDA Multiple 4.8xPublic Comparables EV/LTM EBITDA Multiple 8.1xTransaction Comparables EV/LTM EBITDA Multiple 4.9xWACC 22.4%2011P EBITDA $17,092,000
FAS 157 Implied Enterprise Value MultiplesLTM 4.4x2011E 5.3x

51|
Quintana WellPro S.A.Historical Results & Projections
Historical & Projected Income Statement
2012 and 2013 projections are based on long-term historical fleet utilization of ~65%, inclusive of $500,000 of TA EBITDA for all periods, utilizing Tom’s latest update for day rates and EBITDA margin assumptions.– Note: historical financial results yielded much higher EBITDA margins and total nominal cash flow on a smaller rig fleet relative to
current forward projections due to Tom’s view on the market and pricing pressure.
– Utilizing historical day rates and EBITDA margin assumptions for drilling and workover rigs, QWP’s fleet has a total annual cash flow capacity of approximately $47 million.
(USDinthousands) 2008A 2009A 2010A 2011E 2012E 2013E
TotalRevenue 64,336.6 55,379.9 78,308.2 73,595.8 79,369.5 80,735.7GrowthRate (13.9%) 41.4% (6.0%) 7.8% 1.7%DirectCosts 37,750.3 32,403.9 49,519.8 57,717.0 51,380.9 51,240.5EBITDA 26,586.3 22,976.0 28,788.4 15,878.8 20,131.2 21,522.1%Margin 41.3% 41.5% 36.8% 21.6% 25.4% 26.7%

52|
Quintana WellPro S.A.Projected Investment Returns
Implied Equity Value
Implied IRR (Benchmarked to 6/30/11 FAS)
* Long-term historical fleet utilization of ~65%.
2012 Exit 2013 Exit
2012 Exit 2013 Exit
Fleet UtilizationExit Multiple ‐20% ‐10% LT Average* + 10% + 20%
4.0x 73.7$ 77.9$ 104.0$ 126.9$ 128.2$ 4.5x 79.7 84.6 114.1 139.6 141.5 5.0x 85.6 91.2 124.1 152.4 154.8 5.5x 91.5 97.9 134.2 165.2 168.1 6.0x 97.4 104.5 144.3 177.9 181.4
Fleet UtilizationExit Multiple ‐20% ‐10% LT Average* + 10% + 20%
4.0x 84.0$ 89.1$ 119.5$ 147.9$ 150.0$ 4.5x 90.4 96.3 130.2 161.5 164.2 5.0x 96.8 103.5 141.0 175.1 178.4 5.5x 103.2 110.6 151.7 188.7 192.6 6.0x 109.6 117.8 162.5 202.2 206.8
Fleet UtilizationExit Multiple ‐20% ‐10% LT Average* + 10% + 20%
4.0x (18.2%) (15.1%) 2.8% 17.3% 18.1%4.5x (13.9%) (10.4%) 9.3% 25.0% 26.1%5.0x (9.7%) (5.8%) 15.6% 32.5% 33.9%5.5x (5.6%) (1.3%) 21.7% 39.7% 41.4%6.0x (1.6%) 3.1% 27.7% 46.8% 48.7%
Fleet UtilizationExit Multiple ‐20% ‐10% LT Average* + 10% + 20%
4.0x (10.8%) (7.2%) 12.7% 29.9% 31.1%4.5x (6.3%) (2.3%) 19.3% 37.7% 39.2%5.0x (2.0%) 2.4% 25.8% 45.2% 47.1%5.5x 2.3% 7.1% 32.1% 52.6% 54.7%6.0x 6.4% 11.7% 38.2% 59.8% 62.2%

53|
Quintana WellPro S.A.Projected Investment Returns – NAV
NAV2012 Exit 2013 Exit
# of Rigs Value / Rig Total # of Rigs Value / Rig TotalDrilling Rigs 9 $11.4 $102.6 Drilling Rigs 9 $11.4 $102.6Workover Rig 9 $1.0 $9.0 Workover Rig 9 $1.0 $9.0Pulling Rigs 2 $1.0 $2.0 Pulling Rigs 2 $1.0 $2.0Rig value $113.6 Rig value $113.6Working Capital (12/31/12) $25.0 Working Capital (12/31/13) $25.5Top Drives 3 $1.5 $4.5 Top Drives 3 $1.5 $4.5Net Debt (12/31/12) -$23.5 Net Debt (12/31/13) -$33.4
Equity Value $166.6 Equity Value Total $177.0
Discount To Bronco Valuation: Discount To Bronco Valuation:10% $149.92 10% $159.2815% $141.59 15% $150.4320% $133.26 20% $141.58

54|
Quintana WellPro S.A.Projected Investment Returns – Maximum Cash Flow Potential* (100% Utilization)
Implied Equity Value
The table below is based on QWP’s maximum cash flow capacity of $47 million based on historical day rates and EBITDA margins at 100% utilization.
Exit YearExit Multiple 2012 2013
4.0x 224.4$ 250.2$ 4.5x 247.9 273.5 5.0x 271.5 296.8 5.5x 295.0 320.0 6.0x 318.5 343.3

55|
Quintana WellPro S.A. Appendix
APPENDIX

56|
Quintana WellPro S.A. 2011 Budgeted Utilization vs. Actual Utilization Y.T.D.
QUINTANA WELLPROCurrent Contract Schedule & Expected Utilization (Expected Case) Date: 1/1/11
FY2011Rig Base Type D HRS Jan-11 Feb-11 Mar-11 Apr-11 May-11 Jun-11 Jul-11 Aug-11 Sep-11 Oct-11 Nov-11 Dec-11 Total
Rig 1 Neuquen Workover 7.0D 24Hrs 100% 100% 95% 95% 95% 95% 95% 95% 95% 95% 95% 95% 95.8%Rig 2 Neuquen Workover 7.0D 24Hrs 0% 0% 0% 0% 0% 95% 95% 95% 95% 95% 95% 95% 55.4%Rig 3 Neuquen Workover 7.0D 24Hrs 0% 0% 0% 0% 95% 95% 95% 95% 95% 95% 95% 95% 63.3%Rig 4 Comodoro Pulling 7.0D 24Hrs 100% 100% 95% 95% 95% 95% 95% 95% 95% 95% 95% 95% 95.8%Rig 5 Neuquen Pulling 7.0D 24Hrs 76% 80% 95% 95% 95% 95% 95% 95% 95% 95% 95% 95% 92.2%Rig 6 Neuquen Drilling 7.0D 24Hrs 0% 18% 0% 95% 95% 95% 95% 95% 95% 95% 95% 95% 72.7%Rig 7 Comodoro Workover 7.0D 24Hrs 0% 0% 0% 0% 50% 50% 50% 50% 50% 50% 50% 50% 33.3%Rig 8 Comodoro Workover 7.0D 24Hrs 0% 0% 0% 0% 0% 0% 0% 0% 0% 50% 50% 50% 12.5%Rig 9 Chile Drilling 7.0D 24Hrs 0% 12% 95% 95% 95% 95% 95% 95% 95% 95% 95% 95% 80.2%Rig 10 Comodoro Workover 7.0D 24Hrs 0% 0% 0% 0% 0% 0% 0% 0% 0% 0% 50% 50% 8.3%Rig 11 Comodoro Workover 7.0D 24Hrs 0% 0% 0% 0% 0% 0% 0% 0% 0% 0% 0% 50% 4.2%Rig 12 Chile Drilling 7.0D 24Hrs 0% 0% 0% 0% 0% 0% 95% 95% 95% 95% 95% 95% 47.5%Rig 13 Neuquen Drilling 7.0D 24Hrs 100% 100% 95% 95% 95% 95% 95% 95% 95% 95% 95% 95% 95.8%Rig 14 Neuquen Workover 7.0D 24Hrs 0% 0% 0% 0% 0% 0% 0% 95% 95% 95% 95% 95% 39.6%Rig 15 Comodoro Workover 7.0D 24Hrs 100% 100% 95% 95% 95% 95% 95% 95% 95% 95% 95% 95% 95.8%Rig 16 Chile Drilling 7.0D 24Hrs 0% 0% 0% 0% 95% 95% 95% 95% 95% 95% 95% 95% 63.3%Rig 17 Neuquen Drilling 7.0D 24Hrs 0% 0% 0% 0% 0% 0% 0% 0% 0% 95% 95% 95% 23.8%Rig 18 Neuquen Drilling 7.0D 24Hrs 100% 100% 95% 95% 95% 95% 95% 95% 95% 95% 95% 95% 95.8%Rig 19 Neuquen Drilling 7.0D 24Hrs 100% 100% 95% 95% 95% 95% 95% 95% 95% 95% 95% 95% 95.8%Rig 20 Neuquen Drilling 7.0D 24Hrs 0% 0% 0% 0% 0% 0% 0% 95% 95% 95% 95% 95% 39.6%
Average: 33.8% 35.5% 38.0% 42.8% 54.8% 59.5% 64.3% 73.8% 73.8% 81.0% 83.5% 86.0% 60.5%
QUINTANA WELLPROUpdated Contract Schedule & Expected Utilization Date: 7/31/11
FY2011Rig Base Type D HRS Jan-11 Feb-11 Mar-11 Apr-11 May-11 Jun-11 Jul-11 Aug-11 Sep-11 Oct-11 Nov-11 Dec-11 Total
Rig 1 Neuquen Workover 7.0D 24Hrs 95% 100% 99% 98% 97% 99% 100% 98.2%Rig 2 Neuquen Workover 7.0D 24Hrs 0% 0% 0% 98% 100% 100% 100% 56.9%Rig 3 Neuquen Workover 5.0D 24Hrs 0% 0% 30% 100% 100% 100% 100% 61.5%Rig 4 Comodoro Pulling 7.0D 24Hrs 100% 100% 100% 100% 99% 98% 100% 99.6%Rig 5 Neuquen Pulling 7.0D 24Hrs 57% 67% 100% 99% 98% 98% 98% 88.2%Rig 6 Neuquen Drilling 7.0D 24Hrs 0% 18% 67% 100% 100% 100% 51% 62.3%Rig 7 Comodoro Workover 7.0D 24Hrs 0% 0% 0% 0% 0% 0% 0% 0.0%Rig 8 Comodoro Workover 7.0D 24Hrs 0% 0% 0% 0% 0% 0% 0% 0.0%Rig 9 Chile Drilling 7.0D 24Hrs 0% 12% 100% 100% 80% 0% 0% 41.8%Rig 10 Comodoro Workover 7.0D 24Hrs 0% 0% 0% 0% 0% 0% 0% 0.0%Rig 11 Comodoro Workover 7.0D 24Hrs 0% 0% 0% 0% 0% 0% 0% 0.0%Rig 12 Chile Drilling 7.0D 24Hrs 0% 0% 0% 0% 0% 0% 0% 0.0%Rig 13 Neuquen Drilling 7.0D 24Hrs 100% 100% 100% 98% 100% 80% 0% 82.5%Rig 14 Neuquen Workover 7.0D 24Hrs 0% 0% 0% 0% 0% 0% 0% 0.0%Rig 15 Comodoro Workover 7.0D 24Hrs 100% 99% 100% 100% 98% 100% 99% 99.5%Rig 16 Chile Drilling 7.0D 24Hrs 0% 0% 0% 92% 100% 100% 100% 56.0%Rig 17 Neuquen Drilling 7.0D 24Hrs 0% 0% 0% 0% 70% 93% 99% 37.3%Rig 18 Neuquen Drilling 7.0D 24Hrs 100% 97% 100% 100% 99% 13% 99% 86.9%Rig 19 Neuquen Drilling 7.0D 24Hrs 100% 90% 100% 100% 100% 99% 100% 98.4%Rig 20 Neuquen Drilling 7.0D 24Hrs 0% 0% 0% 0% 0% 0% 0% 0.0%
Average: 34.3% 36.0% 47.2% 62.4% 65.2% 56.9% 55.1% 0.0% 0.0% 0.0% 0.0% 0.0% 48.5%
Regimen Contract Counterparty
Regimen Contract Counterparty

57|
Quintana WellPro S.A. Current Active Rigs and Contract Tenor
Rig Status Date: 09/04/11Contracted / Counterparty Remaining Comments (Status of contract, tender market for rig, expectations for default/repricing requests, etc)
Standby / ContractTendering Tenor
Rig 1 Contracted Entre Lomas 1 Normal Operations.Rig 2 Contracted San Jorge 2 Preparing to mobilize for San Jorge.Rig 3 Contracted Medanito 2 Normal Operations.Rig 4 Contracted Sinopec 3 Operating with risk of social unrest.Rig 5 Contracted Entre Lomas 1 Normal Operations.Rig 6 Tendering Damaged mast after rig move. Under repair in Neuquen.Rig 7 Tendering Ready in Las Heras Yard. Marketing.Rig 8 Contracted Entre Lomas 2 Normal Operations.Rig 9 Tendering Ready in Punta Arenas Yard. Marketing.Rig 10 Contracted Crown Point 1 Force majeure for Crown Point due to social unrest.Rig 11 Tendering Ready in Las Heras Yard. Marketing.Rig 12 Tendering In Rio Grande yard. Marketing.Rig 13 Contracted Crown Point 1 Force majeure for Crown Point due to social unrest.Rig 14 Tendering Ready in Neuquen Yard. Marketing.Rig 15 Contracted Sinopec 3 Operating with risk of social unrest.Rig 16 Contracted Medanito 2 Normal Operations.Rig 17 Tendering Ready in Neuquen Yard. Marketing.Rig 18 Contracted San Jorge 1 Normal Operations.Rig 19 Contracted Apache 1 Drilling last well under well-to-well contract for Apache. Marketing.Rig 20 Construction On Hold Rigging up in Neuquén yard. Started SCR and raised mast. De-bugging SCR. Testing rig equipment. Preparing to install top drive.
One engine has factory flaw. Dealer repairing under warranty

58|
Quintana WellPro S.A.
Partner with Tom Murphy to form a new company focused on meeting the drilling and workover needs of the Argentine and SouthAmerican O&G markets.
Original Investment Thesis
Original Risks & Mitigants
Political – current President Néstor Kirchner has a high approval rating although recent international trade conference underscores region’s hostility toward the US; present relations with Chile (violated gas export agreement) and Bolivia (nervous that Argentina will import gas and re-sell to Chile) are strained; tax laws (i.e., see below point about export tax duties); union labor
Regulatory – Ministry of Energy provides the broadest regulatory oversight with certain other agencies and associations created to monitorspecific sectors (e.g., El Ente Nacional Regulador de la Electridad (ENRE) and El Ente Nacional Regulador del Gas (ENARGAS); American Petroleum Institute services/equipment specifications; two year mast inspections, pollution control, night move restrictions and specific operating procedures are among regulatory requirements
Business – level of capital spending (usually depends on current/expected commodity prices) by companies for exploration, development andproduction activities affect the drilling service industry; rates depend on rig supply/demand, equipment condition, and service/safety record; equipment purchases might encounter time delays or cost fluctuations due to current strength in global oil and gas markets
Competition – Pride, DLS, WellTech, and Nabors comprise the key competitors (each has scale); Murphy has had numerous interactions with likely key customers and interest is strong; should the market slacken, QWP’s equipment (though additive to the overall Argentine fleet) will remain under contract longer as it is higher quality than mom-and-pops’ and other competitors’ equipment
Exchange rate fluctuations – Argentina appears to have stabilized economically with inflation down from yesteryear peaks of 20%+, which should foster more direct investment, stability in, and demand for the Argentine peso (already down from a high of 3.88 Pesos:$US1 to 2.97:1 today); payment for drilling services will be based on dollars so there will be a currency risk re: US$

59|
Quintana WellPro S.A.
QWP out-performed the initial financial projections in all periods driven by a strong demand for drilling/workover services during these time periods and the ability to obtain long term contracts and high mobilization fees
The QWP rig fleet has grown faster than expected (20 rigs currently vs. 17 projected) and includes larger HP rigs than projected
Greater than expected tax leakage due to legal structure
– Largely the result of transferring the investment from a Robertson family holding to a QEP portfolio company.
Difficulty in transferring funds from Argentina
Material Differences to Plan
Original EBITDA & Rig Count Projections/Results
Year End Rig Count2007 2008 2009 2010E 2011P
Original Projections 11 13 15 17 17Actual Results 13 17 19 19 20
$3.5
$8.0$10.7
$12.5 $13.6$13.8
$26.6
$23.0
$28.8
$15.9
0
5
10
15
20
25
30
35
2007 2008 2009 2010 2011E
Original Proj. Actuals

60|
Quintana WellPro S.A.
QWP will follow a disciplined strategy toward creating value for its stakeholders:
Create a talented team of senior and field-level personnel focused on low-cost, nimble operations
Cost effectively build quality assets through remanufacturing stacked rigs and tuck-in acquisitions
Provide first-in-class service at every level of the organization
Pursue long-term relationships and drilling contracts with escalators from active E&P companies
Opportunistically seek to provide supplemental oilfield services and to participate in E&P projects
Secondarily, QWP strategy includes the following principles:
Maintain flexibility to respond to changing conditions
Maintain a conservative and flexible balance sheet
Continually improve safety, quality and efficiency
Implement leading edge technology where cost-effective to do so
Original Business Strategy
Original Growth Initiatives
2 pulling rigs, 3 workover rigs, and 1 drilling rig put into service starting in December 2006
4 workover rigs and 1 drilling rig put into service in mid-March 2007
1 workover rig and 1 drilling rig put into service in mid-March 2008
1 workover rig and 1 drilling rig put into service in mid-March 2009
1 workover rig and 1 drilling rig put into service in mid-March 2010
61|
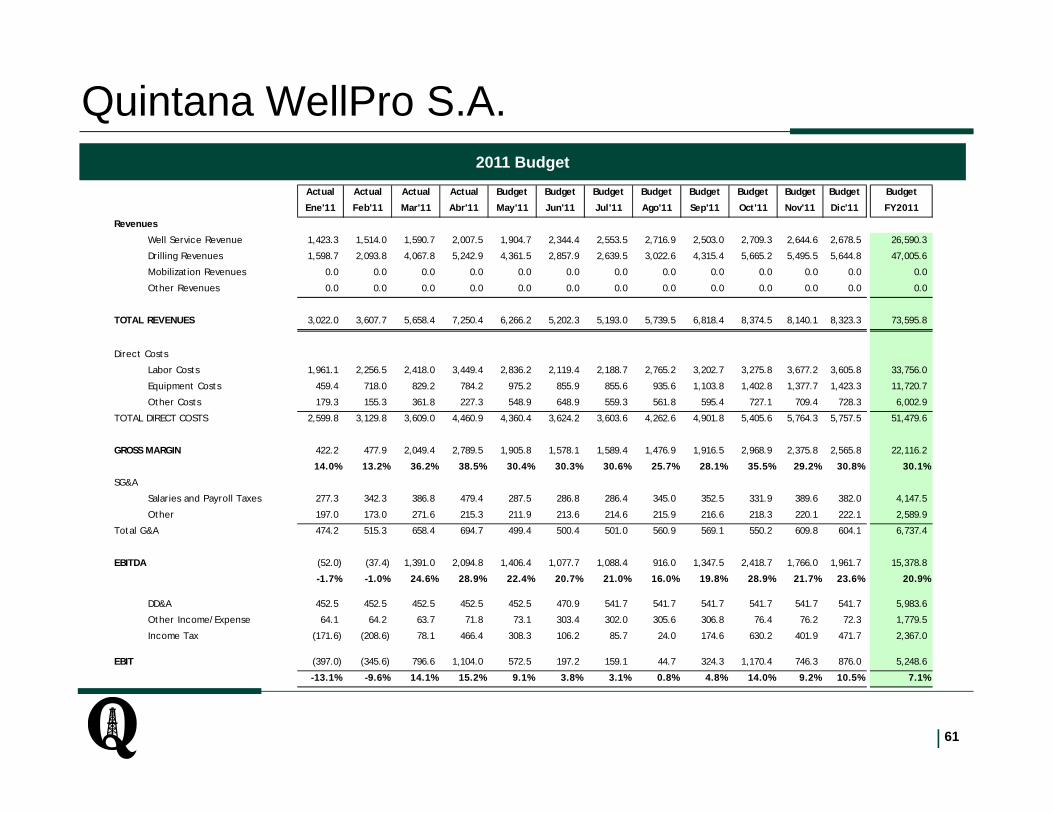
Quintana WellPro S.A. 2011 Budget
Actual Actual Actual Actual Budget Budget Budget Budget Budget Budget Budget Budget Budget
Ene'11 Feb'11 Mar'11 Abr'11 May'11 Jun'11 Jul'11 Ago'11 Sep'11 Oct'11 Nov'11 Dic'11 FY2011
Revenues
Well Service Revenue 1,423.3 1,514.0 1,590.7 2,007.5 1,904.7 2,344.4 2,553.5 2,716.9 2,503.0 2,709.3 2,644.6 2,678.5 26,590.3
Drilling Revenues 1,598.7 2,093.8 4,067.8 5,242.9 4,361.5 2,857.9 2,639.5 3,022.6 4,315.4 5,665.2 5,495.5 5,644.8 47,005.6
Mobilization Revenues 0.0 0.0 0.0 0.0 0.0 0.0 0.0 0.0 0.0 0.0 0.0 0.0 0.0
Other Revenues 0.0 0.0 0.0 0.0 0.0 0.0 0.0 0.0 0.0 0.0 0.0 0.0 0.0
TOTAL REVENUES 3,022.0 3,607.7 5,658.4 7,250.4 6,266.2 5,202.3 5,193.0 5,739.5 6,818.4 8,374.5 8,140.1 8,323.3 73,595.8
Direct Costs
Labor Costs 1,961.1 2,256.5 2,418.0 3,449.4 2,836.2 2,119.4 2,188.7 2,765.2 3,202.7 3,275.8 3,677.2 3,605.8 33,756.0
Equipment Costs 459.4 718.0 829.2 784.2 975.2 855.9 855.6 935.6 1,103.8 1,402.8 1,377.7 1,423.3 11,720.7
Other Costs 179.3 155.3 361.8 227.3 548.9 648.9 559.3 561.8 595.4 727.1 709.4 728.3 6,002.9
TOTAL DIRECT COSTS 2,599.8 3,129.8 3,609.0 4,460.9 4,360.4 3,624.2 3,603.6 4,262.6 4,901.8 5,405.6 5,764.3 5,757.5 51,479.6
GROSS MARGIN 422.2 477.9 2,049.4 2,789.5 1,905.8 1,578.1 1,589.4 1,476.9 1,916.5 2,968.9 2,375.8 2,565.8 22,116.2
14.0% 13.2% 36.2% 38.5% 30.4% 30.3% 30.6% 25.7% 28.1% 35.5% 29.2% 30.8% 30.1%
SG&A
Salaries and Payroll Taxes 277.3 342.3 386.8 479.4 287.5 286.8 286.4 345.0 352.5 331.9 389.6 382.0 4,147.5
Other 197.0 173.0 271.6 215.3 211.9 213.6 214.6 215.9 216.6 218.3 220.1 222.1 2,589.9
Total G&A 474.2 515.3 658.4 694.7 499.4 500.4 501.0 560.9 569.1 550.2 609.8 604.1 6,737.4
EBITDA (52.0) (37.4) 1,391.0 2,094.8 1,406.4 1,077.7 1,088.4 916.0 1,347.5 2,418.7 1,766.0 1,961.7 15,378.8
-1.7% -1.0% 24.6% 28.9% 22.4% 20.7% 21.0% 16.0% 19.8% 28.9% 21.7% 23.6% 20.9%
DD&A 452.5 452.5 452.5 452.5 452.5 470.9 541.7 541.7 541.7 541.7 541.7 541.7 5,983.6
Other Income/Expense 64.1 64.2 63.7 71.8 73.1 303.4 302.0 305.6 306.8 76.4 76.2 72.3 1,779.5
Income Tax (171.6) (208.6) 78.1 466.4 308.3 106.2 85.7 24.0 174.6 630.2 401.9 471.7 2,367.0
EBIT (397.0) (345.6) 796.6 1,104.0 572.5 197.2 159.1 44.7 324.3 1,170.4 746.3 876.0 5,248.6
-13.1% -9.6% 14.1% 15.2% 9.1% 3.8% 3.1% 0.8% 4.8% 14.0% 9.2% 10.5% 7.1%

62|
Quintana WellPro S.A. Balance Sheet / Covenant Projections
Budget Budget Budget Budget1Q11 2Q11 3Q11 4Q11
AssetsCash and Banks 20,765 15,784 12,997 11,221
Account Receivable 11,584 19,317 20,635 25,361
Inventory Parts & Supplies 11,739 11,717 10,937 10,037
VAT 171 0 0 0
Other Current Assets 5,404 6,555 7,198 7,198
Work in Progress (Capex) 8,311 3,981 7,696 8,781
Equipment & Other No Current Assets 43,599 50,543 48,918 49,493
Total Assets 101,573 107,896 108,381 112,091
LiabilitiesAccounts Payable (165) 3,404 3,643 4,197
Salaries/ Payroll Taxes Payable 2,291 2,406 3,555 3,988
Taxes Payables (1,717) 106 0 884
VAT 0 201 800 1,019
Accrued Expense 7,449 6,767 6,017 6,017
Loan Standard Bank 10,562 9,388 8,215 7,041
Other Liabilities 1,003 1,013 1,013 1,013
Total Liabilities 19,423 23,285 23,242 24,159
Stockholders EquityCommon Stock 44,806 44,806 44,806 44,806
Retained Earnings 38,060 38,381 38,381 38,381
YTD Net Income (717) 1,424 1,952 4,745
Total Shareholders Equity 82,150 84,611 85,139 87,932
Total Liabilities and S/H Equity 101,573 107,896 108,381 112,091
Financial Covenants - Loan Debt 1Q11 2Q11 3Q11 4Q11Senior Debt Coverage Ratio 0.56 0.75 1.03 0.91
Liabilities 12,138.78 13,114.39 13,582.26 13,945.10
Ebitda 21,862.46 17,384.93 13,143.12 15,378.78
Requirement < 2,50 2.50 2.50 2.50 2.50
Senior Debt Interest Coverage Ratio 23.15 17.41 11.75 14.34
Ebitda 21,862.46 17,384.93 13,143.12 15,378.78
Capex 8,688.99 8,505.81 7,975.00 9,760.00
Interest Expense 569.17 510.03 439.71 391.86
Requirement > 4,00 4.00 4.00 4.00 4.00
VTL Ratio 3.45 3.88 4.43 5.17
Value + Reserve 36,408.00 36,408.00 36,408.00 36,408.00
Amount of All Outstanding Loans 10,561.76 9,388.24 8,214.71 7,041.18
Requirement > 1,25 1.25 1.25 1.25 1.25
Tangible Net Worth
Assets 101,573.08 107,896.48 108,381.32 112,090.99
Liabilities 19,423.47 23,285.50 23,242.25 24,159.21
Minimun Tangible Net Worth 22,000.00 22,000.00 22,000.00 22,000.00
Excess 60,149.61 62,610.98 63,139.07 65,931.79
Leverage Ratio 0.56 0.75 1.03 0.91
Requirement < 2,50 2.50 2.50 2.50 2.50

63|
Quintana WellPro S.A.
Market Overview Historical Rig Count*
Latin America is forecasted to be a growth market.
– Forecasted to grow at a CAGR of 12% from 2010 to 2012.
Increasing Argentine oil prices are projected to drive continued exploration in the country.
– Oil prices are projected to increase at a CAGR of 4% from 2011 through 2026
ExxonMobil, Total, Apache, NOCs, and others have all recently announced initiatives to explore for unconventional oil and gas in Argentina
Rig Count Outlook – U.S. and Latin America*Source: Smithbits Rig Count
1,892 1,881 1,9422,068 1,990
1,257
9321,035
1,1951,409
1,5881,736 1,801 1,760
376 373 403 430 448 432 425 431 435 442 441 447 460 471
96 90 90 90 81 65 51 56 60 71 79 87 85 83
0
500
1,000
1,500
2,000
2,500
Q4 2007
Q1 2008
Q2 2008
Q3 2008
Q4 2008
Q1 2009
Q2 2009
Q3 2009
Q4 2009
Q1 2010
Q2 2010
Q3 2010
Q4 2010
Q1 2011
U.S. Latin America Argentina
0
100
200
300
400
500
600
700
800
0
500
1,000
1,500
2,000
2,500
Q1 2006
Q2 2006
Q3 2006
Q4 2006
Q1 2007
Q2 2007
Q3 2007
Q4 2007
Q1 2008
Q2 2008
Q3 2008
Q4 2008
Q1 2009
Q2 2009
Q3 2009
Q4 2009
Q1 2010
Q2 2010
Q3 2010
Q4 2010
Q1 2011
Q2 2011
Q3 2011
Q4 2011
2012
Latin
America
n Rig Co
unt
U.S. Rig Cou
nt
US Latin America
G&G Consulting Oil Price Forecasts
$20
$30
$40
$50
$60
$70
$80
$90
$100
$110
$120
$/Bb
l
Base Case Upside Case Downside Case Actual
Source: Tudor Pickering & Holt ResearchSource: G&G Consulting

64|
Quintana WellPro S.A.
Argentine Drilling Rig Market*
Fleet Contracted Market ShareContractor Size Rigs % Total % Contracted %
San Antonio 42 33 79% 36% 38%DLS 21 18 86% 18% 21%H&P 9 4 44% 8% 5%Quintana WellPro 9 7 78% 8% 8%Nabors 8 4 50% 7% 5%YPF 7 2 29% 6% 2%Key 6 5 83% 5% 6%Ensign 5 5 100% 4% 6%Petreven 4 4 100% 3% 5%Venver 3 2 67% 3% 2%Sinopec 1 1 100% 1% 1%Estrella 1 1 100% 1% 1%Total 116 86 74% 100% 100%
Fleet Contracted Market ShareContractor Size Rigs % Total % Contracted %
San Antonio 113 98 87% 41% 45%DLS 45 43 96% 16% 20%Key 33 23 70% 12% 11%Venver 12 9 75% 4% 4%Emepa 11 9 82% 4% 4%Quintana WellPro 11 6 55% 4% 3%Nabors 10 7 70% 4% 3%YPF 8 4 50% 3% 2%Oil 6 3 50% 2% 1%Taker 5 5 100% 2% 2%Ensign 4 3 75% 1% 1%Estrella 3 3 100% 1% 1%Geopatagonia 3 0 0% 1% 0%Macrico 3 3 100% 1% 1%Petroneu 3 2 67% 1% 1%SPS 2 1 50% 1% 0%Other 6 0 0% 2% 0%Total 278 219 79% 100% 100%
Argentine Workover Rig Market*
*Data for reference purposes, note fleet size and contracted rig numbers as of April 2011 LP meeting
65|
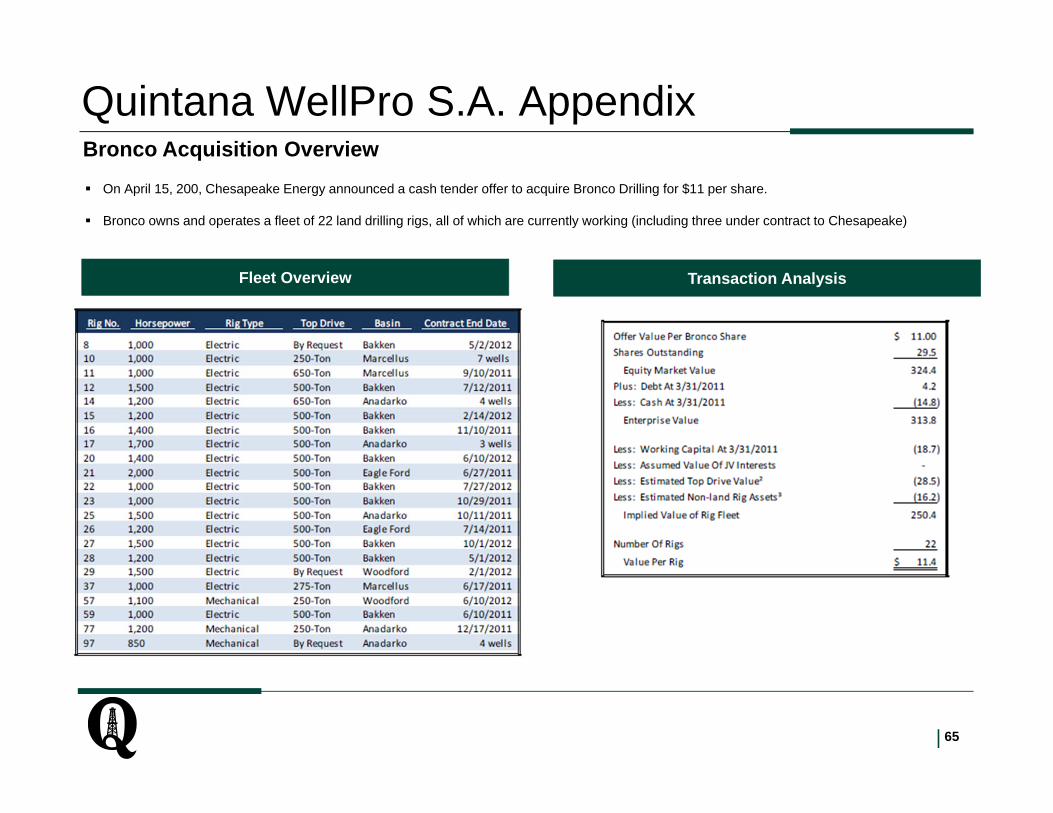
Quintana WellPro S.A. Appendix
On April 15, 200, Chesapeake Energy announced a cash tender offer to acquire Bronco Drilling for $11 per share.
Bronco owns and operates a fleet of 22 land drilling rigs, all of which are currently working (including three under contract to Chesapeake)
Fleet Overview Transaction Analysis
Bronco Acquisition Overview

Oil and Gas UpstreamIrion Minerals, LLC
September 12, 2011 2:30 pm – 4:00 pm
Brock Morris and Stephen Dexter

67|

68|
Irion Minerals, LLCProjected Investment Returns by Year
Irion Minerals LLC Exit Analysis ($'000)($ in thousands) Dec‐11 Dec‐12 Dec‐13 Dec‐14 Dec‐15 Dec‐16 Dec‐17 Dec‐18 Dec‐19 Dec‐20Exit yearYearly Cash Flow $1,008 $4,678 $7,153 $8,498 $8,961 $5,069 $3,248 $2,382 $1,850 $1,483Net Proved Reserves (MBoe) 935.8 864.0 759.5 636.9 508.3 432.0 379.5 338.4 304.2 274.9 Net Production (Boe/d) 76.7 249.0 312.6 353.3 284.1 169.3 126.7 102.6 86.8 75.4 % PDP Reserves 17.8% 34.3% 54.2% 79.9% 100.0% 100.0% 100.0% 100.0% 100.0% 100.0%
Exit Assumptions (1)
Proved Reserves ($/Boe) $6.94 $10.55 $15.05 $17.73 $17.73 $17.73 $17.73 $17.73 $17.73 $17.73Producing ($/Boed) $111,325 $111,988 $94,538 $89,062 $89,062 $89,062 $89,062 $89,062 $89,062 $89,062PV Discount Rate 22.4% 19.9% 16.5% 12.2% 8.0% 8.0% 8.0% 8.0% 8.0% 8.0%% value captured 100% 100% 100% 100% 100% 100% 100% 100% 100% 100%
Exit Value WeightingsReserves 33% $6,496 $9,119 $11,427 $11,292 $9,013 $7,660 $6,729 $6,000 $5,394 $4,874Production 33% $8,535 $27,885 $29,552 $31,469 $25,301 $15,076 $11,282 $9,139 $7,727 $6,715PV of Reserve Report Cash Flows 33% $9,963 $14,702 $18,607 $21,900 $21,742 $17,995 $15,855 $14,450 $13,489 $12,838Weighted Value 100% $8,331 $17,235 $19,862 $21,554 $18,685 $13,577 $11,289 $9,863 $8,870 $8,143
Net Debt (251) ‐ (683) (2,700) (7,881) (12,950) (16,198) (18,581) (20,430) (21,913)
Net Equity ValueReserves $6,747 $9,119 $12,109 $13,993 $16,894 $20,610 $22,927 $24,580 $25,824 $26,787Production $8,786 $27,885 $30,234 $34,170 $33,182 $28,026 $27,481 $27,719 $28,157 $28,628PV of Reserve Report Cash Flows $10,214 $14,702 $19,289 $24,601 $29,623 $30,945 $32,053 $33,030 $33,919 $34,751Weighted Value $8,583 $17,235 $20,544 $24,254 $26,566 $26,527 $27,487 $28,443 $29,300 $30,056
Invested Equity 6,500 7,511 7,520 7,520 7,520 7,520 7,520 7,520 7,520 7,520
Irion Minerals LLC Exit Valuation Analysis (2)
ROIReserves 2.2x 2.2x 2.6x 2.9x 3.2x 3.7x 4.0x 4.3x 4.4x 4.6xProduction 2.5x 4.7x 5.0x 5.5x 5.4x 4.7x 4.6x 4.7x 4.7x 4.8xPV of Reserve Report Cash Flows 2.7x 3.0x 3.6x 4.3x 4.9x 5.1x 5.3x 5.4x 5.5x 5.6xWeighted Value 2.5x 3.3x 3.7x 4.2x 4.5x 4.5x 4.6x 4.8x 4.9x 5.0x
IRRReserves 25.0% 24.4% 25.4% 24.3% 24.0% 23.8% 22.8% 21.6% 20.4% 19.3%Production 29.9% 47.9% 41.4% 37.5% 32.6% 27.2% 24.5% 22.6% 21.1% 19.8%PV of Reserve Report Cash Flows 33.1% 33.2% 32.9% 32.3% 31.0% 28.3% 26.1% 24.2% 22.6% 21.2%Weighted Value 29.5% 36.5% 34.0% 32.1% 29.6% 26.6% 24.5% 22.9% 21.4% 20.2%
Average MOIC 2.5x 3.3x 3.7x 4.2x 4.5x 4.5x 4.6x 4.8x 4.9x 5.0xAverage IRR 29.4% 35.5% 33.4% 31.6% 29.3% 26.5% 24.5% 22.8% 21.4% 20.1%
(1) Exit multiples based on a precedent transaction comps which are correlated to % PDP Reserves & PV Discount Rates which are correlated to % PDP Reserves(2) IRRs and ROIs reflect $7.478mm distribution made in 1Q 2011.

69|
Irion Minerals, LLCEstimated Period-Over-Period Value Accretion
Estimated Period‐Over‐Period Value Accretion of Irion Minerals, LLC Investment($ in thousands) 6/30/11 YE 2011 YE 2012 YE 2013 YE 2014 YE 2015
FAS Value Est. Value Est. Value Est. Value Est. Value Est. ValuePeriod End Valuation (Weighted Value) $6,660 $8,583 $17,235 $20,544 $24,254 $26,566Less: Incremental Capital Invested $0 $0 (1,011) (9) ‐ ‐ Net Period End Valuation (Weighted Value) $6,660 $8,583 $16,224 $20,535 $24,254 $26,566Annualized Period‐Over‐Period Growth / (Decline) NA 66.07% 89.04% 26.57% 18.11% 9.53%
$0
$5,000
$10,000
$15,000
$20,000
$25,000
$30,000
6/30/11 YE 2011 YE 2012 YE 2013 YE 2014 YE 2015 QEP ExitAssumption ‐12/30/2012

70|
Irion Minerals, LLCMajor Assumptions Behind Exit Analysis
Major Assumption Category Modeled Assumption Risks Related to Assumption Upside Related to Assumption
Wells Drilled / Development Plan
49 Wells Drilled on 11,426 Gross Acres (~233 Acre Spacing)
[See Drilling Schedule Below]
• QEP is not in control over the pace ofdevelopment
• EOG has stated that they intend to more slowlydevelop the Munson acreage (~27 of 49 wells)due to lease related issues
• EOG could possibly accelerate the pace ofdevelopment (relative to QEP’s forecast)
• Development of the upper or lower Wolfcampshale sections would substantially increase thenumber of locations to develop
Reserves (EUR / Well) 271 Mboe Type Curve
• Minimal production history is available from veryfew wells
• As a result, there is substantial risk in the typecurve assumptions being utilized for economics
• EOG has publically hinted at an upward biasrelative to their ~270 Mboe / well type curve
• AREX has publically announced a 450 Mboe typecurve for the play
Commodity Prices
2011 - $93.56 / Bbl2012 - $90.06 / Bbl2013 - $92.21 / Bbl2014 - $92.78 / Bbl2015 - $93.39 / Bbl
• Lower commodity prices would lower asset cashflows and likely necessitate additional fundcapital to fund the development program
• Type Well PV-10 Breakeven Price = ~$60.00/ Bbl
• Improving commodity prices would enhanceeconomics of investment
Assumed Exit Multiples
Reserves - $6.94 / Proved Boe– $17.73 / Proved Boe
Production - $89,062 / Boed– $111,325 / Boed
Present Value – PV-22.4% to PV-8.0%
• EOG (most logical buyer for assets) is historicallynot an aggressive acquirer of producing assets
• Buyer universe for small, non-op interest islimited vs. buyers for operated assets
• Financial buyer would have a more difficult timeascribing value to upside opportunities
• Size of the asset could limit interest from qualitysell side advisors, which could impair theefficiency of the marketing process
• MLP buyer could likely take a more aggressiveapproach in valuing the assets
• Economies of scale (and resulting superiorvaluations) could be realized by adding the Irionassets to a marketing process for PrizePetroleum, LLC
0
2
4
6
8
10
12
14
2011 2012 2013 2014 2015
Wells Drilled / Ye
ar
Irion Minerals LLC Modeled Development Program

71|
Irion Minerals, LLCAdditional Considerations Regarding Exit Timing
Exit Valuation Considerations
• Successful testing of the Upper and Lower Wolfcamp shale sections could add significant, realizableupside to the Irion Minerals assets. Timing and number of these upper and lower Wolfcamp shale testsmust be taken into consideration when contemplating the timing of an exit event.
• QEP is actively evaluating opportunities to increase its exposure to the horizontal Wolfcamp shale play.Execution on any of these expansion opportunities could potentially extend the exit horizon for the Irioninvestment as: (i) adequate testing / development of any new acreage would be necessary to maximizevalue and (ii) separate monetization events of existing and new Wolfcamp shale assets would not takeadvantage of potential premium value associated with asset scale.
• Most buyers of non-operated, small working interest are focused on PDP cash flows and typically do notascribe significant value to undeveloped upside. Accordingly, the balance of producing vs. non-producingreserves must be considered when contemplating an exit.
Potential Impediments to Investment Exit
• Nature of assets may limit universe of potential buyers as many strategic acquirers don’t actively pursuenon-operated assets.
• Size of assets will likely limit QEP’s choice of advisors when marketing the assets of Irion Minerals. Aquality advisor capable of running an efficient, competitive process is key in maximizing value upon exit.
E&P Team’s Thoughts & Recommendation
• Allow the upside story of the Upper and Lower Wolfcamp shale section to play out prior to putting the IrionMinerals assets on the market.
• If timing is compatible, consider adding the Irion Minerals assets to the asset package associated with themonetization of Prize Petroleum.
• Operated assets of Prize Petroleum will attract a much larger and diverse set of potential buyers• Size of Prize’s assets will draw attention from top tier of sell-side A&D advisors
C t f it l d t f MLP b (l i l b f P i ’ t ) ld l d t i d

Prize Petroleum, LLCInvestment Level Valuation & Exit Assessment

73|
Prize Petroleum, LLCProjected Investment Returns by Year
Prize Petroleum, LLC Management Milestons & Resulting Exit Analysis ($'000) Prize Petroleum LLC Forecasted Equity Returns($ in thousands) Dec‐11 Dec‐12 Jun‐13 ($ in thousands) Dec‐11 Dec‐12 Jun‐13Exit year Exit yearPrize Management Goals / Milestones QEP Equity Ownership % 52.71% 52.71% 52.71%Daily Production (Boe/d) 1,477 1,835 2,000Proved Reserve (Mboe) 15,857.0 16,754.6 17,203.4 QEP Net Exit Values (Equity Values) (2)
Tier 1 $50,259 $66,778 $74,407Exit Multiples ‐ MLP Production Based Exit Multiples (1) Tier 2 $55,984 $72,404 $78,604$95,000 / Flowing Boed $140,315 $174,325 $190,000 Tier 3 $61,027 $78,030 $83,629$100,000 / Flowing Boed $147,700 $183,500 $200,000 Tier 4 $66,071 $81,297 $89,015$105,000 / Flowing Boed $155,085 $192,675 $210,000 Tier 5 $71,114 $86,430 $94,401$110,000 / Flowing Boed $162,470 $201,850 $220,000$115,000 / Flowing Boed $169,855 $211,025 $230,000 Forecasted QEP Rates of Return
Tier 1 ‐0.1% 5.9% 7.4%Exit Multiples ‐ MLP Reserve Based Exit Multiples (1) Tier 2 2.7% 7.6% 8.5%$10.00 / Proven Boe $158,570 $167,546 $172,034 Tier 3 5.0% 9.3% 9.8%$11.00 / Proven Boe $174,427 $184,301 $189,237 Tier 4 7.1% 10.2% 11.1%$12.00 / Proven Boe $190,284 $201,055 $206,441 Tier 5 9.2% 11.6% 12.3%$13.00 / Proven Boe $206,141 $217,810 $223,644$14.00 / Proven Boe $221,998 $234,564 $240,847 Forecasted QEP Raturn on Investment
Tier 1 1.00x 1.32x 1.47xAverage Gross Exit Values (Enterprise Values) Tier 2 1.11x 1.43x 1.56xTier 1 $149,443 $170,936 $181,017 Tier 3 1.21x 1.55x 1.66xTier 2 $161,064 $183,900 $194,619 Tier 4 1.31x 1.61x 1.76xTier 3 $172,685 $196,865 $208,220 Tier 5 1.41x 1.71x 1.87xTier 4 $184,306 $209,830 $221,822 (2) QEP Net Exit Values account for distributions to management incentiveTier 5 $195,927 $222,795 $235,424
Forecasted Net Debt $51,000 $36,000 $28,500
Average Gross Exit Values (Equity Values) Tier 1 $98,443 $134,936 $152,517Tier 2 $110,064 $147,900 $166,119Tier 3 $121,685 $160,865 $179,720Tier 4 $133,306 $173,830 $193,322Tier 5 $144,927 $186,795 $206,924
(1) Base case (Tier III) multiples based on median values from comparable transaction comps (see last page of presentation)

74|
Prize Petroleum, LLCEstimated Period-Over-Period Value Accretion
Estimated Period‐Over‐Period Value Accretion of Prize Petroleum, LLC Investment($ in thousands) 6/30/2011 YE 2011 YE 2012 6/30/2013
FAS Value Est. Value Est. Value Est. ValuePeriod End Valuation (Tier III) $58,819 $61,027 $78,030 $83,629Less: Incremental Capital Invested 0 $0 ‐ ‐ Net Period End Valuation (Tier III) $58,819 $61,027 $78,030 $83,629Annualized Period‐Over‐Period Growth / (Decline) NM 7.65% 27.86% 14.87%
(1) QEP's Exit Assumption assumes that Prize is able to further bolster equity value through accretive, bolt‐on acquisitions
$0
$20,000
$40,000
$60,000
$80,000
$100,000
$120,000
6/30/2011 YE 2011 YE 2012 6/30/2013 QEP Exit Assumption ‐12/30/2013 (1)

75|
Prize Petroleum, LLCMajor Assumptions Behind Exit Analysis
Major Assumption Category Modeled Assumption Risks Related to Assumption Upside Related to Assumption
Production Increases
Reserve Report Production + Low Resistivity Woodbine / Subclarksville Waterflood
Contribution[Production Breakdown Below]
• Production assumes unrisked execution ofproduction enhancement and undevelopedopportunities in the 12/31/10 Reserve Report.
• Low Resistivity Woodbine / Subclarksvilleproduction wedge is largely not in the reservereport, is in the very early stages of testing, andthe ultimate potential of these opportunities isunknown.
• Low Resistivity Woodbine / Subclarksvilledevelopments have the potential to besubstantial and contribute more meaningfully tofuture production.
• Initial focus on the Neches field has keptmanagement from prioritizing productionenhancement of the Homer and Rich fields.
• The Prize team is currently focused onaccretive, bolt-on acquisitions that couldcontribute significant, incremental productionvolumes.
Reserves Management has goal of
increasing proven reserves by 6% per annum
• Prior management’s results in executingundeveloped and non-producing opportunitiesgenerally underperformed reserve reportestimates.
• Additional infrastructure work is necessary toexecute on all identified reserve additions.
• Low Resistivity Woodbine / Subclarksvilledevelopments could represent a meaningfulincrease in reserve report volumes.
• The Prize team is currently focused onaccretive, bolt-on acquisitions that couldmeaningfully add to Prize’s reserves.
Assumed Exit Multiples
Precedent transactions in OK, TX, and LA between $50mm and
$500mm since 2005; R/P >20 years; and % Oil > 65%.
• Average 5 year strip of precedent transactions =$84.10 / Bbl. Multiples will likely degrade ifprices dip below this average.
• Rising interest rates would likely impact MLP’s(logical buyers) cost of capital, negativelyaffecting valuation.
• Long R/P nature of assets… production multiplevalues could limit buyer’s ability to give full valuebased on assets’ PV and reserve metricvaluation.
• Multiple expansion at prices above the average5 year strip of precedent transactions = $84.10 /Bbl.
• MLP’s ability to pay (publically tradedvaluations) is, on average, substantially higherthan precedent transaction values ($20.66 /Proven Boe & ~$150,000 / Flowing Boed as of6/30/11).
• Acquisitions could improve exit valuation ifaccretive and if they serve to shorten CompanyR/P.

76|
Prize Petroleum, LLCAdditional Considerations Regarding Exit TimingExit Valuation
Considerations / Milestones
enhanced value of the assets upon completion. This work needsto be completed before an educated buyer could give Prize fullvalue for undeveloped and non-producing opportunities in thereserve report.
• To date, Prize management has been focused on optimizingoperations and exploiting upside within the Neches field.Sufficient time to do the same work on the Homer and Richfields would likely lead to additional enhanced value for Prizeupon exit.
• Prize management is currently evaluating and testing thepotential associated with a low resistivity zone at the top of theWoodbine section and the re-initiation of a Subclarksvillewaterflood that was abandoned by Exxon in the mid-to-late1960’s. Either of these projects could meaningfully increasereserves and production in the Neches field.
• Prize management is actively engaged in acquisitive businessdevelopment and has recently submitted offers on a number ofproperty packages. Major theme of the business developmentefforts to date has been to shorten the R/P of the Company’sasset base by acquiring shorter-lived, out-of-favor natural gasassets.
Potential Impediments to Investment Exit
• The structure of Prize management / Redman Resourcesincentives structure could lead to some misalignment with QEPat some very specific points in the spectrum of returns (primarilyrelated to two “catch-up” points in the distribution waterfall).
• Rising interest rate environment could degrade the cost ofcapital for E&P MLPs (logical acquirer for Prize’s assets) whichwould lead to lower valuations for the asset.
E&P Team’s Thoughts &
Recommendation
• Need to test and quantify the upside story of the low resistivityWoodbine and the Subclarksville waterflood to ensure maximumpotential value upon exit.
• To enhance value of existing assets upon exit, the infrastructureprojects at the Neches and Homer fields need to be completedand need enough time to adequately demonstrate theassociated cost savings.
• Allow Prize management enough time to execute and integratebolt-on, accretive acquisition opportunities that could help justifyhigher valuations from potential buyers when consideringacquisition multiples.
• Prior to monetization, need to dedicate sufficient resources tooptimizing and exploiting upside at both the Homer and Rich

77|
Prize Petroleum, LLCAppendix A: Precedent Transactions Analysis
AverageTransaction Proved % Proved Proved Reserve TV/Daily Boe 5 Yr. Strip
Date Buyer Seller Location Value Reserves % Oil Developed R/P Value Produced @ Transaction(MMBoe) (Years) ($/Proved Boe) ($/boed)
Feb‐11 Linn Energy LLC Undisclosed Permian $238.00 14.0 88.0 48.0 32.2 $16.98 $144,242.40 $99.81Oct‐10 Berry Petroleum Company Undisclosed (Various) Mid‐Continent $180.00 N/A 76.0 N/A N/A N/A $150,000.00 $87.12Sep‐10 Linn Energy LLC Undisclosed (Three parties) Mid‐Continent $352.20 30.0 72.0 23.3 24.9 $11.74 $106,727.27 $84.35Aug‐10 Energen Corporation; Energen Resources Corporation Undisclosed private company Mid‐Continent $185.00 18.0 86.6 10.9 54.7 $10.29 $205,555.56 $80.27Jul‐10 Linn Energy LLC Undisclosed Gulf Coast $95.00 8.0 93.0 100.0 24.4 $11.88 $105,555.56 $81.69Jul‐10 Linn Energy LLC Undisclosed Mid‐Continent $90.00 7.0 78.0 28.0 20.2 $12.86 $94,736.84 $78.93May‐10 PDC Energy Undisclosed private company Mid‐Continent $75.00 8.5 70.0 N/A 25.9 $8.82 $83,333.33 $78.09Jan‐10 Berry Petroleum Company Undisclosed private company Mid‐Continent $126.00 11.2 85.0 23.0 23.6 $11.25 $96,923.08 $90.46Dec‐09 Denbury Resources Incorporated Wapiti Energy LLC Gulf Coast $409.55 20.0 90.0 100.0 21.9 $20.48 $163,820.80 $88.86Sep‐09 Pioneer Southwest Energy Partners LP Pioneer Natural Resources Company Mid‐Continent $171.20 18.9 85.0 37.0 39.8 $9.06 $131,692.31 $77.21Aug‐09 Linn Energy LLC Forest Oil Corporation Mid‐Continent $113.70 10.0 86.0 58.0 20.3 $11.37 $84,222.22 $83.02Dec‐07 Mariner Energy Inc Undisclosed Mid‐Continent $122.50 16.0 75.0 45.0 35.1 $7.66 $98,000.00 $87.52Dec‐07 Linn Energy LLC Lamamco Drilling Company Mid‐Continent $552.00 50.0 88.0 70.0 34.2 $11.04 $138,000.00 $87.13Dec‐07 Windsor Permian LLC Undisclosed Mid‐Continent $85.00 6.9 87.0 23.0 23.6 $12.32 $106,250.00 $85.46Dec‐07 Gulfport Energy Corporation Undisclosed Mid‐Continent $85.00 6.9 87.0 23.0 23.6 $12.32 $106,250.00 $85.46Nov‐07 Pioneer Natural Resources Company Cimarex Energy Co Mid‐Continent $90.00 15.0 100.0 20.0 58.7 $6.00 $128,571.43 $84.64Jun‐06 Foothills Resources Inc Texas American Resources Company Gulf Coast $62.00 5.1 97.4 66.1 20.1 $12.08 $88,571.43 $69.77
Deal Count 17Average $178.36 15.3 84.9 45.0 30.2 $11.63 $119,556.01 84.10Median $122.50 12.6 86.6 37.0 24.6 $11.56 $106,250.00 84.64
Note: Transactions between $50mm and $500mm in OK, TX, LA since 2005; R/P >20 years; % Oil > 65%.
Source: IHS – John S. Herolds.

Deep Gulf Energy, LP

79|
Deep Gulf Energy, LPProjected Investment Returns (DGE Management Projections)
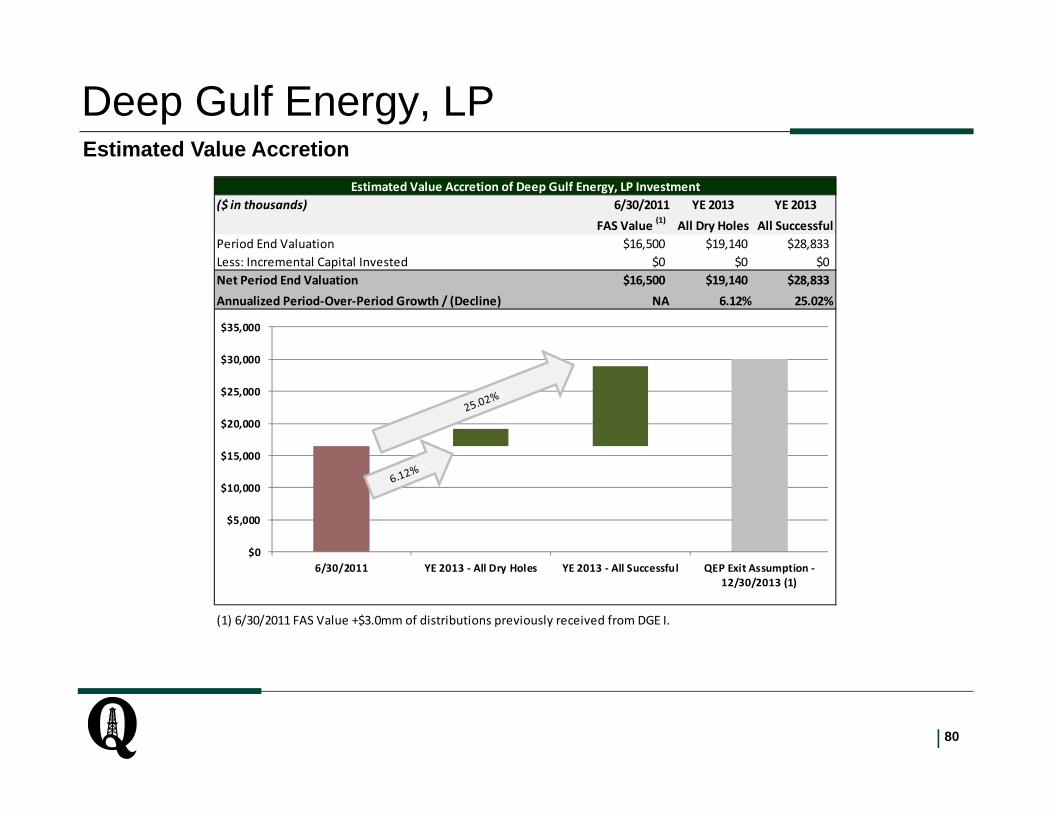
80|
Deep Gulf Energy, LPEstimated Value Accretion
Estimated Value Accretion of Deep Gulf Energy, LP Investment($ in thousands) 6/30/2011 YE 2013 YE 2013
FAS Value (1) All Dry Holes All SuccessfulPeriod End Valuation $16,500 $19,140 $28,833Less: Incremental Capital Invested $0 $0 $0Net Period End Valuation $16,500 $19,140 $28,833Annualized Period‐Over‐Period Growth / (Decline) NA 6.12% 25.02%
(1) 6/30/2011 FAS Value +$3.0mm of distributions previously received from DGE I.
$0
$5,000
$10,000
$15,000
$20,000
$25,000
$30,000
$35,000
6/30/2011 YE 2013 ‐ All Dry Holes YE 2013 ‐ All Successful QEP Exit Assumption ‐12/30/2013 (1)

81|
Deep Gulf Energy, LPMajor Assumptions Behind Exit Analysis
Major Assumption Category Modeled Assumption Risks Related to Assumption Upside Related to Assumption
Operating & Capital Assumptions
(Incremental Production, Reserves, & Capital)
Danny II (50% POS) & Perseides(50% POS) are drilled in
November 2011 & September 2012, respectively
• Danny II (50% POS) & Perseides (50% POS)could be unsuccessful exploration wells and costcould be in excess of budgeted levels.
• Issues with permitting could cause delays indrilling the Perseides well.
• Natural disasters (hurricanes) could result indamaged infrastructure and substantial downtimefor currently producing wells.
• Water drive reservoirs increases risks associatedwith forecasting well results and, consequently,future cash flows.
• Wells (both producing and exploration wells)could perform better than current forecasts.
Commodity Prices [See Charts Below]
• Future realized commodity prices could come inbelow strip pricing. However, 46% of remaining2011 and 28% of 2012 gas production iscurrently hedged at $5.50 and $5.27 respectively.
• DGE’s forward cash flow projections do not factorin ~$14.00 LLS premium that they are currentlyreceiving relative to NYMEX prices.
Assumed Exit Multiples Remaining Production is sold at PV-25% in 2013
• May be difficult to run a competitive auctionprocess surrounding short lived, fully developedGOM assets.
• PV-25% is a very punitive discount rate on anassumed exit.
• In calculating exit scenarios, no value has beenascribed to the Mississippi Lime assets by DGEmanagement.

82|
Deep Gulf Energy, LPAdditional Considerations Regarding Exit Timing
Exit Valuation Considerations / Milestones
• DGE I has three more projects left in its portfolio (Danny II, Perseides, and Mississippi Lime) and theultimate timing of the exit from this investment will be driven by execution (or lack there of) on these threeremaining initiatives.
• QEP is a 4.82% owner of DGE I and FRC is the controlling shareholder of the Company. QEP’s minoritystake in the business limits our ability to control the decisions surrounding exit.
Potential Impediments to Investment Exit
• Management’s incentives in DGE I are purely ROI driven, so management is incentivized to generate themaximum profits from the investment regardless of the resulting IRR for the equity sponsor.
• This dynamic is likely leading to a Board level decision surrounding the timing of an exit event withmanagement potentially pushing for an exit date beyond 2013.
E&P Team’s Thoughts & Recommendation
• Potential upside and sunk costs associated with the three remaining projects justifies attempted executionprior to any contemplated exit event.
• Attempt to influence, as best as possible, future discussions surrounding the timing and avenues for exit forthe Company from our position on the Board of Directors.
• DGE & QEP need to seek advice on options available for monetizing DGE I. More specifically, (i) structuralalternatives to an outright sales process, (ii) universe of interested parties given the nature of the assets,and (iii) reasonable valuation expectations for the assets.

Deep Gulf Energy II, LLCInvestment Level Valuation & Exit Assessment

84|
Deep Gulf Energy II, LLCProjected Investment Returns (DGE II Management Projections)

85|
Deep Gulf Energy II, LLCEstimated Value Accretion
Estimated Value Accretion of Deep Gulf Energy II, LLC Investment($ in thousands) 6/30/2011 YE 2016 YE 2016
FAS Value All Dry Holes All SuccessfulPeriod End Valuation $9,980 $10,284 $63,733Less: Incremental Capital Invested $0 ($424) ($1,484)Net Period End Valuation $9,980 $10,708 $62,249Annualized Period‐Over‐Period Growth / (Decline) NA 1.29% 39.41%
$0
$10,000
$20,000
$30,000
$40,000
$50,000
$60,000
$70,000
6/30/2011 YE 2016 ‐ All Dry Holes YE 2016 ‐ All Successful QEP Exit Assumption ‐12/30/2015 (1)

86|
Deep Gulf Energy II, LLCMajor Assumptions Behind Exit Analysis
Major Assumption Category Modeled Assumption Risks Related to Assumption Upside Related to Assumption
Operating & Capital Assumptions
(Incremental Production, Reserves, & Capital)
Prospect POS Spud Date
• All of the wells remaining in inventory areexploratory in nature with substantial risks relatedto size, costs, and timing.
• Issues with permitting and rig availability couldcause delays in drilling DGE II’s remaininginventory of projects.
• Natural disasters (hurricanes) could result indamaged infrastructure and substantial downtimefor currently producing wells.
• Water drive reservoirs increases risks associatedwith forecasting well results and, consequently,future cash flows.
• Wells (both producing and exploration wells)could perform better than current forecast.
Danny II 50% Nov-11
Perseides 50% Nov-11
Marmalard 50% Dec-11
SOB 2 50% Sept-12
Troubador 70% Mar-12
Leatherneck 33% June-12
Commodity Prices [See Charts Below]
• Future realized commodity prices could come inbelow strip pricing. However, DGE II plans tomitigate some of this risk through an activehedging program.
• DGE’s forward cash flow projections do not factorin ~$14.00 LLS premium that they are currentlyreceiving relative to NYMEX prices.
Assumed Exit Multiples Remaining Production is sold at PV-25% in 2016
• Depending upon the status of DGE II’sexploration portfolio, it may be difficult to run acompetitive auction process surrounding shortlived, fully developed GOM assets.
• PV-25% is a very punitive discount rate on anassumed exit.
• In calculating exit scenarios, no value has beenascribed to the Mississippi Lime assets by DGE IImanagement.
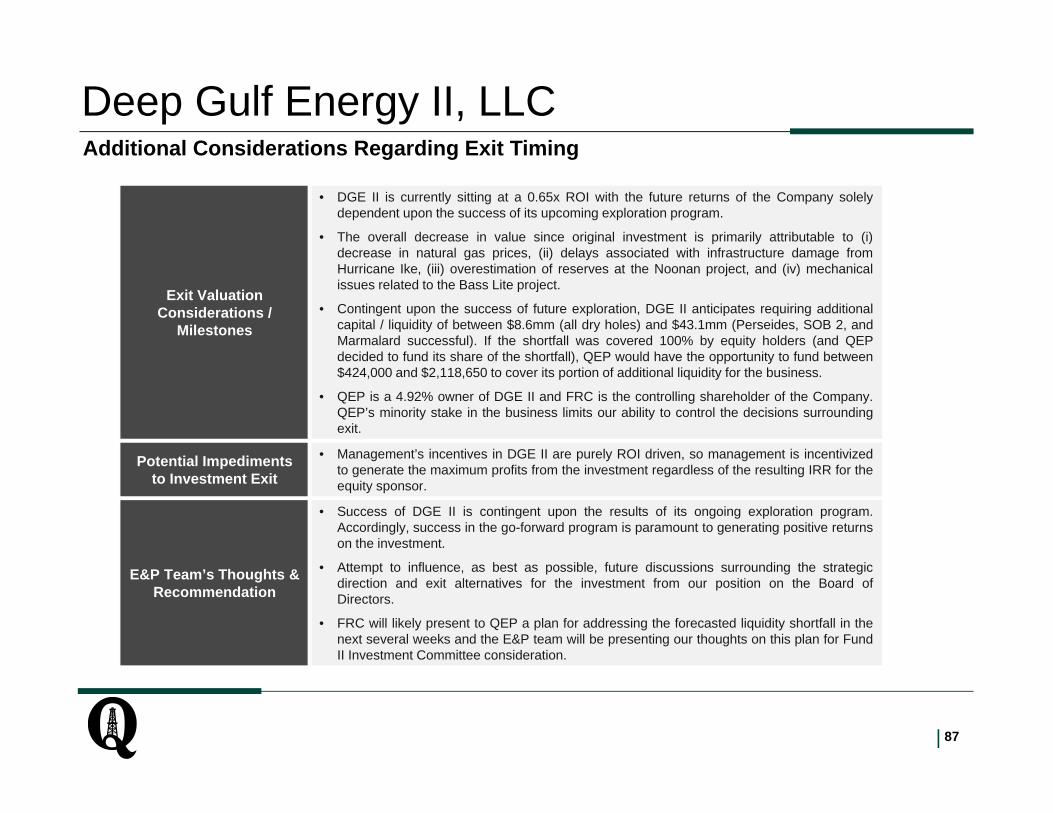
87|
Deep Gulf Energy II, LLCAdditional Considerations Regarding Exit Timing
Exit Valuation Considerations /
Milestones
• DGE II is currently sitting at a 0.65x ROI with the future returns of the Company solelydependent upon the success of its upcoming exploration program.
• The overall decrease in value since original investment is primarily attributable to (i)decrease in natural gas prices, (ii) delays associated with infrastructure damage fromHurricane Ike, (iii) overestimation of reserves at the Noonan project, and (iv) mechanicalissues related to the Bass Lite project.
• Contingent upon the success of future exploration, DGE II anticipates requiring additionalcapital / liquidity of between $8.6mm (all dry holes) and $43.1mm (Perseides, SOB 2, andMarmalard successful). If the shortfall was covered 100% by equity holders (and QEPdecided to fund its share of the shortfall), QEP would have the opportunity to fund between$424,000 and $2,118,650 to cover its portion of additional liquidity for the business.
• QEP is a 4.92% owner of DGE II and FRC is the controlling shareholder of the Company.QEP’s minority stake in the business limits our ability to control the decisions surroundingexit.
Potential Impediments to Investment Exit
• Management’s incentives in DGE II are purely ROI driven, so management is incentivizedto generate the maximum profits from the investment regardless of the resulting IRR for theequity sponsor.
E&P Team’s Thoughts & Recommendation
• Success of DGE II is contingent upon the results of its ongoing exploration program.Accordingly, success in the go-forward program is paramount to generating positive returnson the investment.
• Attempt to influence, as best as possible, future discussions surrounding the strategicdirection and exit alternatives for the investment from our position on the Board ofDirectors.
• FRC will likely present to QEP a plan for addressing the forecasted liquidity shortfall in thenext several weeks and the E&P team will be presenting our thoughts on this plan for FundII Investment Committee consideration.