quick service and food-to-go insights report - bord · pdf filedynamics of the quick service...
TRANSCRIPT

SECTION
Introduction
About the Research
3
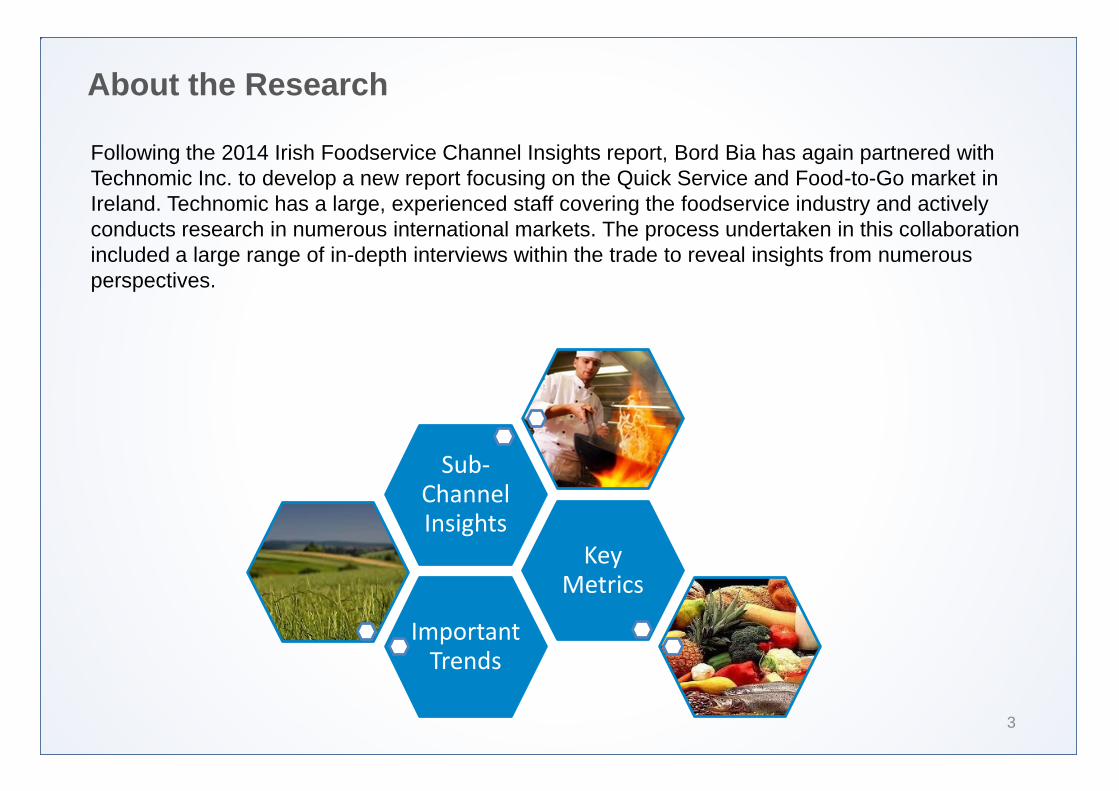
Following the 2014 Irish Foodservice Channel Insights report, Bord Bia has again partnered with Technomic Inc. to develop a new report focusing on the Quick Service and Food-to-Go market in Ireland. Technomic has a large, experienced staff covering the foodservice industry and actively conducts research in numerous international markets. The process undertaken in this collaboration included a large range of in-depth interviews within the trade to reveal insights from numerous perspectives.
Important Trends
Key Metrics
Sub-Channel Insights
About the Consumer Research
4
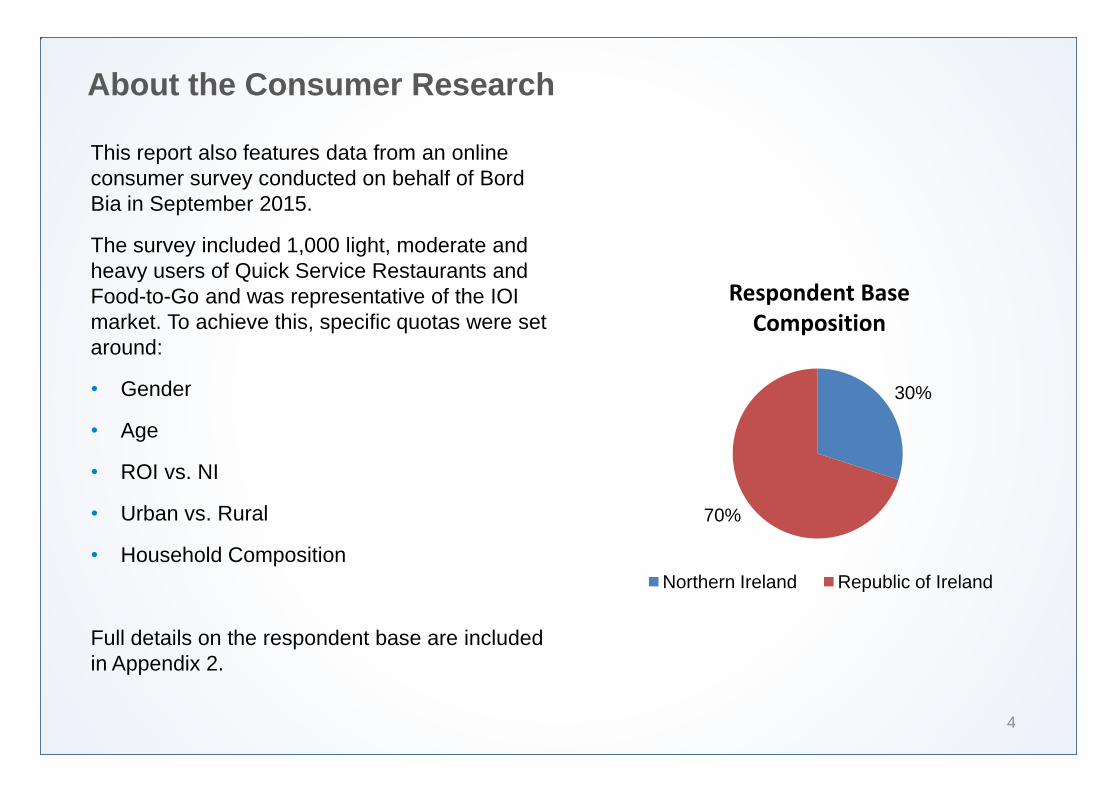
This report also features data from an online consumer survey conducted on behalf of Bord Bia in September 2015.
The survey included 1,000 light, moderate and heavy users of Quick Service Restaurants and Food-to-Go and was representative of the IOI market. To achieve this, specific quotas were set around:
• Gender
• Age
• ROI vs. NI
• Urban vs. Rural
• Household Composition
Full details on the respondent base are included in Appendix 2.
30%
70%
Northern Ireland Republic of Ireland
Respondent Base Composition
Scope of Research
5
QSR (also known as fast food) is the term given to food that can be prepared and served very quickly. The term typically refers to food sold in a restaurant or store with preheated or precooked ingredients. It is distinguished in the foodservice market by:
• Counter service (as opposed to table service in full service restaurants)
• Limited menus sold in large quantities, low price points against other channels
• Systematized operation requiring low skill levels and culinary expertise on the part of staff
• Aggressive marketing strategies
The QSR marketplace is further segmented into two additional tiers:
• Traditional fast food – with relatively lower price points and mainstream offerings.
• Fast casual – with higher price points, more innovative offerings and an enhanced aesthetic.
Scope of Research (continued)
6
Food-to-Go items are also covered within the scope of this research programme. These include grab-and-go, prepared individual meals and similar offerings that are taken off premises and eaten out of home. Food-to-Go is generally sourced from a variety of commercial outlets, including:
• Multiple Retails (generally front of store space)
• Convenience Retailers
• Forecourt Convenience Retailers
• Other Retailers (e.g. High Street independents, etc.)
Note that values associated with takeaway and delivery from quick service, coffee shops and cafes and fast casual operators are included within their respective channels.
Approach
7
As part of its dedicated Ireland Market Foodservice Programme, Bord Bia has operated a Market Intelligence programme since 2009 - delivering resources to both client companies (Irish food and drink manufacturers) and customers (domestic foodservice buyers) alike.
For the development of this study, Bord Bia collaborated closely with Technomic to deliver insights necessary to develop detailed market strategies and to highlight potential opportunities.
Technomic used a robust, multi-step methodology to collect and synthesize information and to develop new insights on the foodservice market in Ireland, including:
• One-on-one trade interviews
• Quantitative consumer research
• Data collection from numerous secondary sources, Technomic industry studies and Knowledge Center, Technomic international tracking and published materials.
The combination of these sources allowed the Technomic team to better understand the size and dynamics of the Quick Service and Food-to-Go marketplace in Ireland and to identify future trends, drivers and predicted growth rates.
In-Depth Interview Methodology
8
To complete market sizing, segmentation, trend identification and forecasting, Technomic utilised numerous resources including:
• In-depth interviews with Fast Food and Fast Casual operators
• In-depth interviews with foodservice distributors and suppliers to the market
• In-depth interviews with key Trade Associations
• In-depth interviews with key players in the Convenience Retail and Food-to-Go sub channels
• Technomic subject matter experts
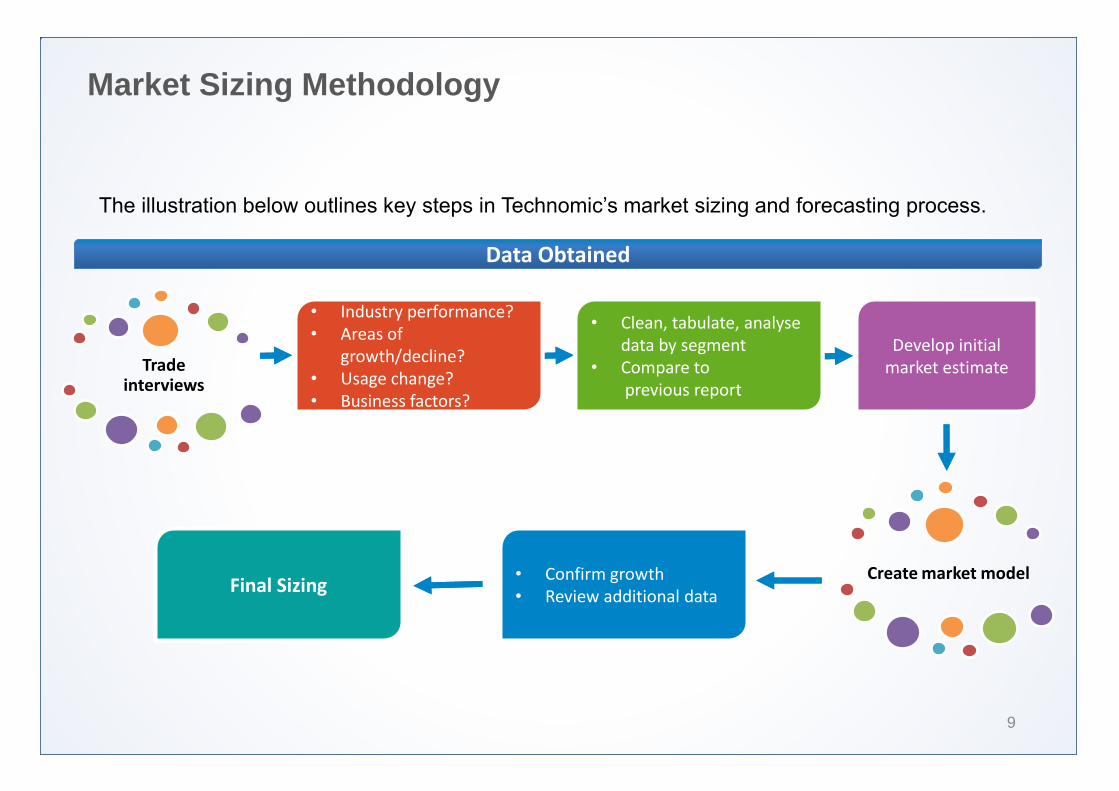
Market Sizing Methodology
9
Trade interviews
Data Obtained Data Obtained
• Industry performance? • Industry performance? • Areas of
growth/decline? • Usage change? • Business factors?
• Clean, tabulate, analyse data by segment
• Compare to previous report
Develop initial market estimate
• Confirm growth • Review additional data
Create market model Final Sizing
The illustration below outlines key steps in Technomic’s market sizing and forecasting process.

Qualifications
10
Technomic is uniquely qualified to conduct this assignment. For 50 years, Technomic has been assisting clients with interests in the food industry obtain a better understanding of the marketplace and potential opportunities.
Technomic is considered to be the leading research and consulting firm specialising in the foodservice or Out of Home (OOH) industry. Technomic’s broad based expertise and second-to-none knowledge of the OOH channels and categories positions them as an industry leader in this growing marketplace.
Technomic is active in numerous international OOH markets.
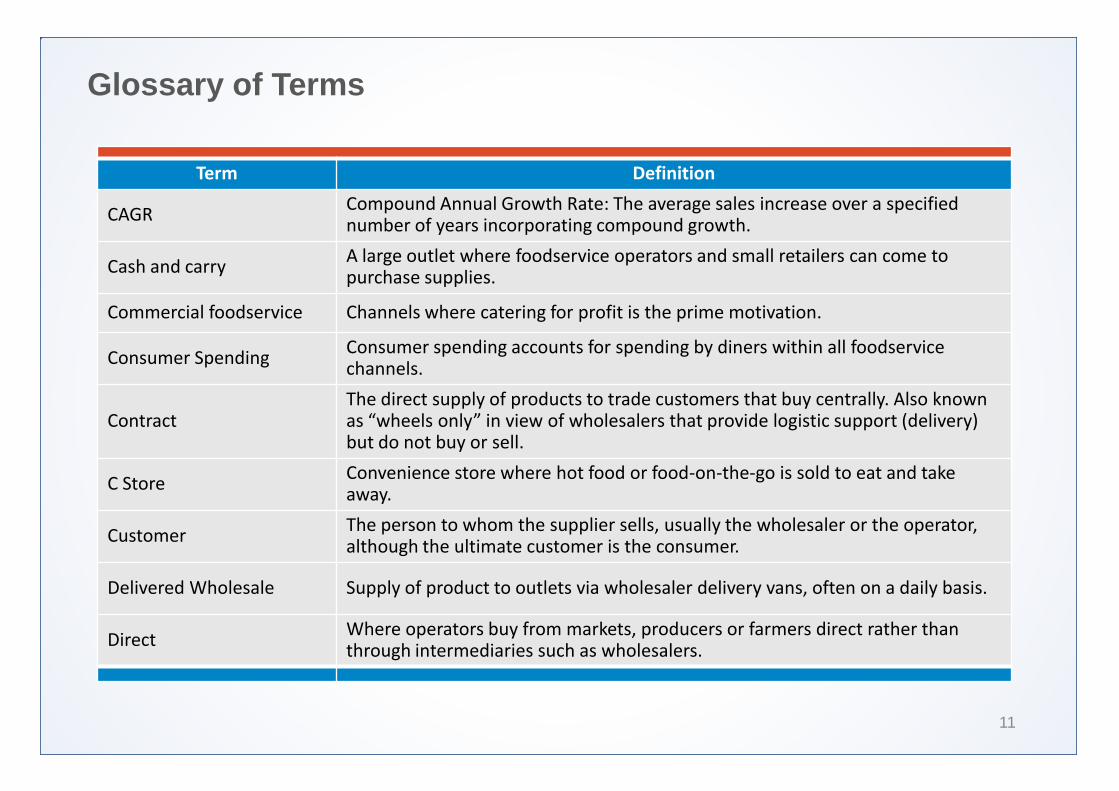
Glossary of Terms
11
Term Definition
CAGR Compound Annual Growth Rate: The average sales increase over a specified number of years incorporating compound growth.
Cash and carry A large outlet where foodservice operators and small retailers can come to purchase supplies.
Commercial foodservice Channels where catering for profit is the prime motivation.
Consumer Spending Consumer spending accounts for spending by diners within all foodservice channels.
Contract The direct supply of products to trade customers that buy centrally. Also known as “wheels only” in view of wholesalers that provide logistic support (delivery) but do not buy or sell.
C Store Convenience store where hot food or food-on-the-go is sold to eat and take away.
Customer The person to whom the supplier sells, usually the wholesaler or the operator, although the ultimate customer is the consumer.
Delivered Wholesale Supply of product to outlets via wholesaler delivery vans, often on a daily basis.
Direct Where operators buy from markets, producers or farmers direct rather than through intermediaries such as wholesalers.
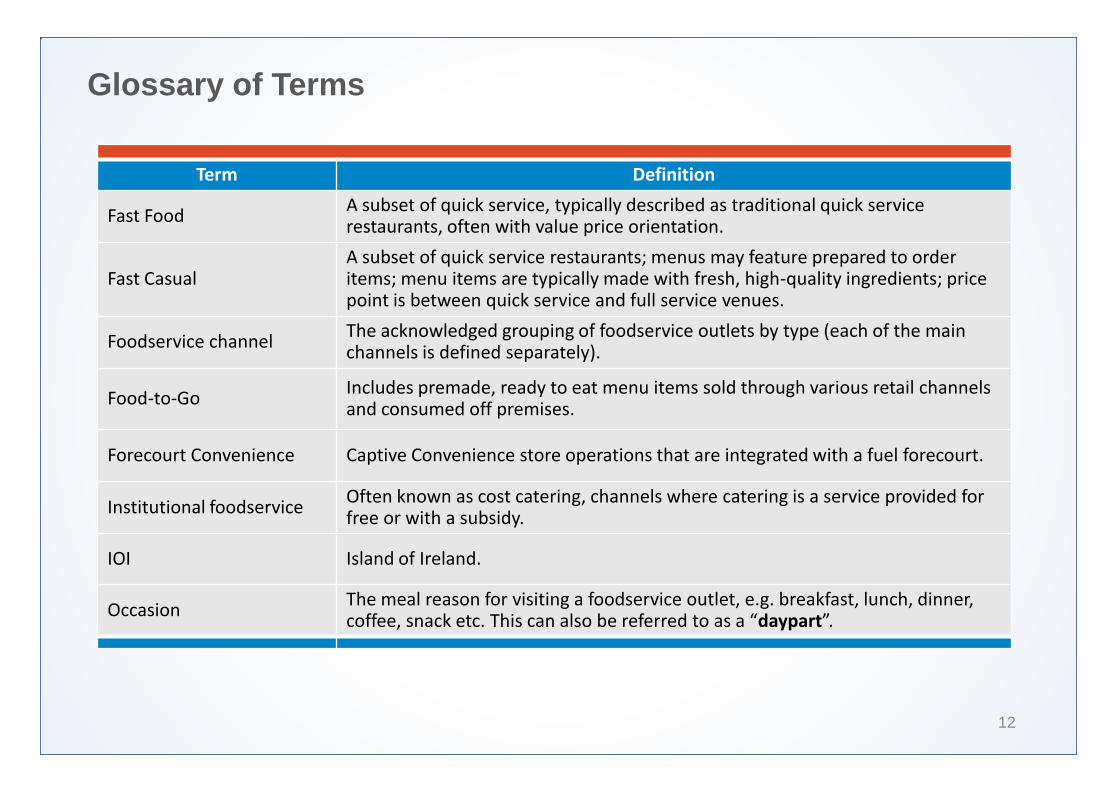
Glossary of Terms
12
Term Definition
Fast Food A subset of quick service, typically described as traditional quick service restaurants, often with value price orientation.
Fast Casual A subset of quick service restaurants; menus may feature prepared to order items; menu items are typically made with fresh, high-quality ingredients; price point is between quick service and full service venues.
Foodservice channel The acknowledged grouping of foodservice outlets by type (each of the main channels is defined separately).
Food-to-Go Includes premade, ready to eat menu items sold through various retail channels and consumed off premises.
Forecourt Convenience Captive Convenience store operations that are integrated with a fuel forecourt.
Institutional foodservice Often known as cost catering, channels where catering is a service provided for free or with a subsidy.
IOI Island of Ireland.
Occasion The meal reason for visiting a foodservice outlet, e.g. breakfast, lunch, dinner, coffee, snack etc. This can also be referred to as a “daypart”.
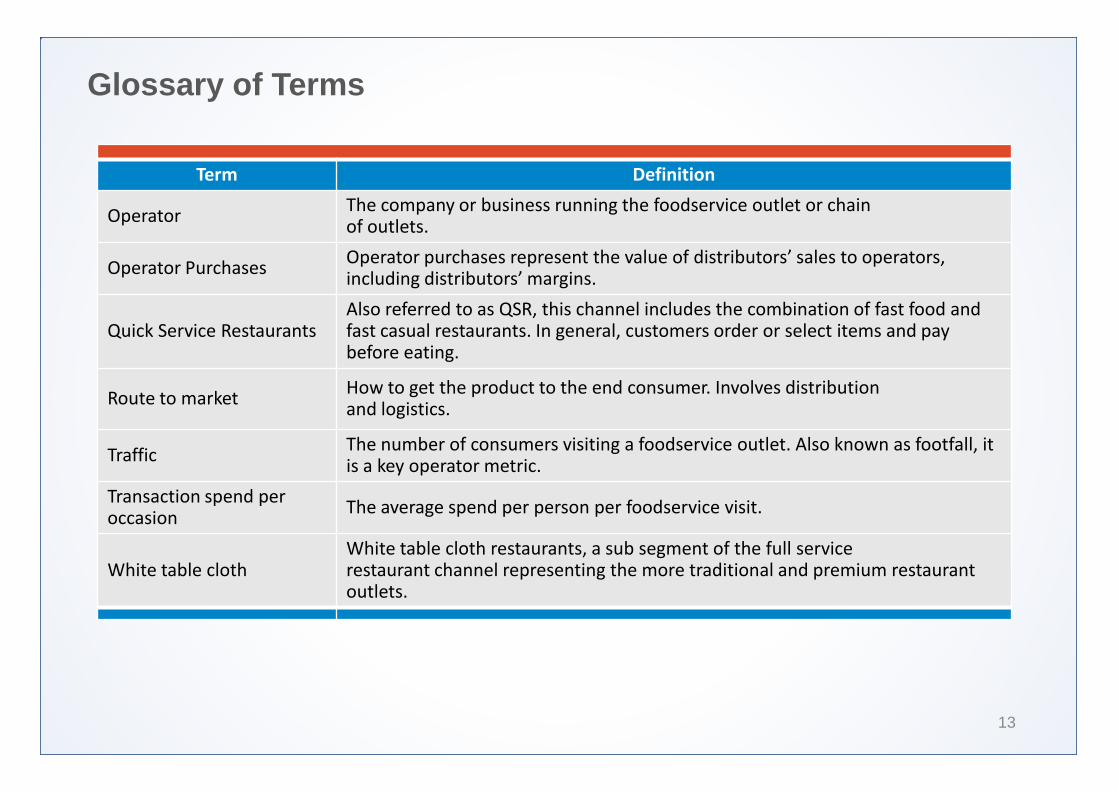
Glossary of Terms
13
Term Definition
Operator The company or business running the foodservice outlet or chain of outlets.
Operator Purchases Operator purchases represent the value of distributors’ sales to operators, including distributors’ margins.
Quick Service Restaurants Also referred to as QSR, this channel includes the combination of fast food and fast casual restaurants. In general, customers order or select items and pay before eating.
Route to market How to get the product to the end consumer. Involves distribution and logistics.
Traffic The number of consumers visiting a foodservice outlet. Also known as footfall, it is a key operator metric.
Transaction spend per occasion
The average spend per person per foodservice visit.
White table cloth White table cloth restaurants, a sub segment of the full service restaurant channel representing the more traditional and premium restaurant outlets.
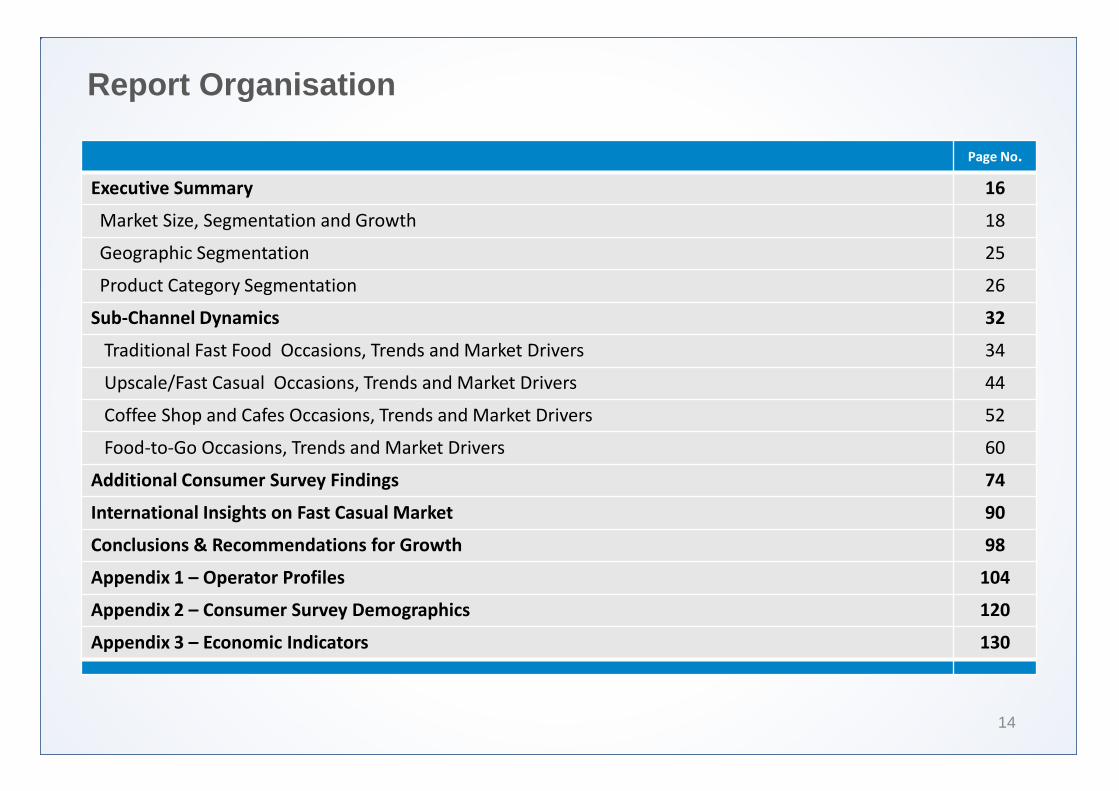
Report Organisation
14
Page No.
Executive Summary 16
Market Size, Segmentation and Growth 18
Geographic Segmentation 25
Product Category Segmentation 26
Sub-Channel Dynamics 32
Traditional Fast Food Occasions, Trends and Market Drivers 34
Upscale/Fast Casual Occasions, Trends and Market Drivers 44
Coffee Shop and Cafes Occasions, Trends and Market Drivers 52
Food-to-Go Occasions, Trends and Market Drivers 60
Additional Consumer Survey Findings 74
International Insights on Fast Casual Market 90
Conclusions & Recommendations for Growth 98
Appendix 1 – Operator Profiles 104
Appendix 2 – Consumer Survey Demographics 120
Appendix 3 – Economic Indicators 130

SECTION
Executive Summary
1
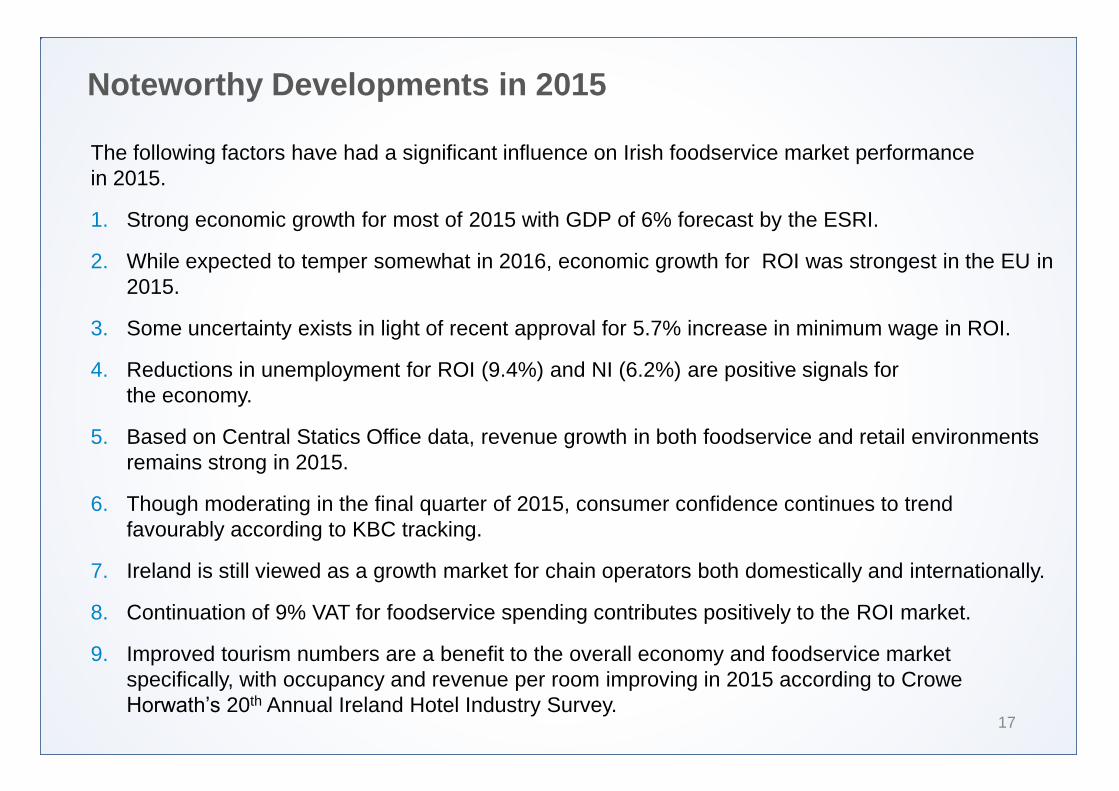
Noteworthy Developments in 2015
17
The following factors have had a significant influence on Irish foodservice market performance in 2015.
1. Strong economic growth for most of 2015 with GDP of 6% forecast by the ESRI.
2. While expected to temper somewhat in 2016, economic growth for ROI was strongest in the EU in 2015.
3. Some uncertainty exists in light of recent approval for 5.7% increase in minimum wage in ROI.
4. Reductions in unemployment for ROI (9.4%) and NI (6.2%) are positive signals for the economy.
5. Based on Central Statics Office data, revenue growth in both foodservice and retail environments remains strong in 2015.
6. Though moderating in the final quarter of 2015, consumer confidence continues to trend favourably according to KBC tracking.
7. Ireland is still viewed as a growth market for chain operators both domestically and internationally.
8. Continuation of 9% VAT for foodservice spending contributes positively to the ROI market.
9. Improved tourism numbers are a benefit to the overall economy and foodservice market specifically, with occupancy and revenue per room improving in 2015 according to Crowe Horwath’s 20th Annual Ireland Hotel Industry Survey.
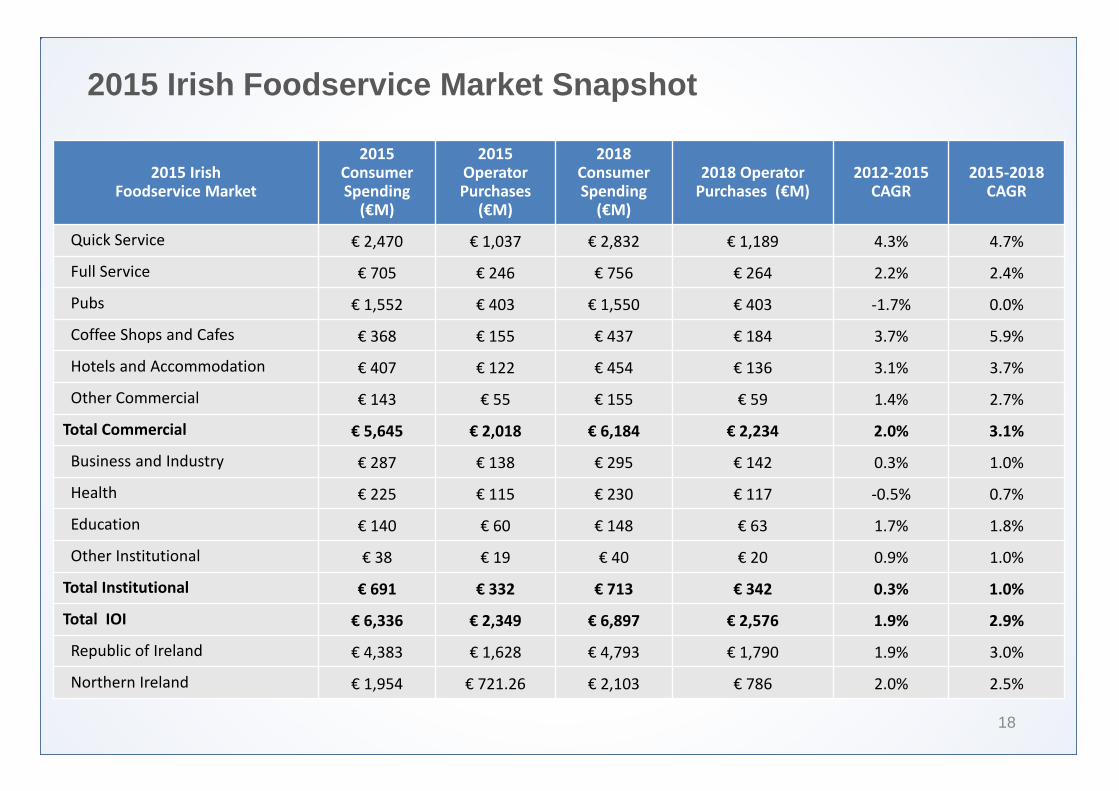
2015 Irish Foodservice Market Snapshot
18
2015 Irish Foodservice Market
2015 Consumer Spending
(€M)
2015 Operator Purchases
(€M)
2018 Consumer Spending
(€M)
2018 Operator Purchases (€M)
2012-2015 CAGR
2015-2018 CAGR
Quick Service € 2,470 € 1,037 € 2,832 € 1,189 4.3% 4.7%
Full Service € 705 € 246 € 756 € 264 2.2% 2.4%
Pubs € 1,552 € 403 € 1,550 € 403 -1.7% 0.0%
Coffee Shops and Cafes € 368 € 155 € 437 € 184 3.7% 5.9%
Hotels and Accommodation € 407 € 122 € 454 € 136 3.1% 3.7%
Other Commercial € 143 € 55 € 155 € 59 1.4% 2.7%
Total Commercial € 5,645 € 2,018 € 6,184 € 2,234 2.0% 3.1%
Business and Industry € 287 € 138 € 295 € 142 0.3% 1.0%
Health € 225 € 115 € 230 € 117 -0.5% 0.7%
Education € 140 € 60 € 148 € 63 1.7% 1.8%
Other Institutional € 38 € 19 € 40 € 20 0.9% 1.0%
Total Institutional € 691 € 332 € 713 € 342 0.3% 1.0%
Total IOI € 6,336 € 2,349 € 6,897 € 2,576 1.9% 2.9%
Republic of Ireland € 4,383 € 1,628 € 4,793 € 1,790 1.9% 3.0%
Northern Ireland € 1,954 € 721.26 € 2,103 € 786 2.0% 2.5%
2015 Irish Foodservice Market
19
Overall, the total commercial market has grown at a CAGR of 2.0% over the last four years and is expected to grow faster (3.1%) over the next three years. Each channel of the Irish foodservice market is growing at a somewhat different rate, as shown in the proceeding table.
• Growth among quick service restaurants have historically outpaced full service operators by a factor of about two to one. A portion of this growth is driven by heavy chain presence among quick service operators.
• Coffee shops and cafes have grown significantly over the review period and growth is expected to continue to remain strong moving forward. Expanded food range and growth in the number of locations have both been key factors influencing this growth.
• Hotels and tourism continue to perform strongly, boosted by both inbound and domestic travelers. The presence of overseas tourists in Ireland also has a positive impact on other foodservice channels.
• Growth within the institutional sub-segment has been slower overall (relative to commercial operators). These channels are less impacted by direct consumer spending.
• Growth in ROI is expected to outpace growth in NI over the forecast period.
Historic Growth and Forecast
20
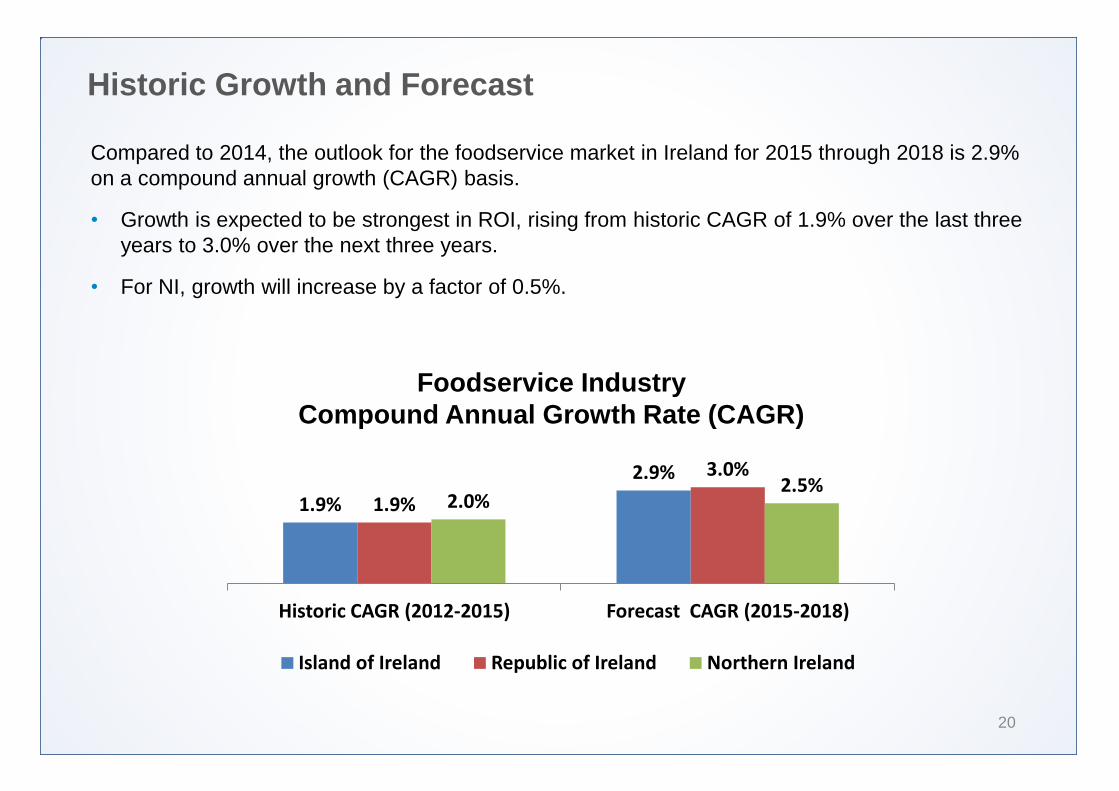
Compared to 2014, the outlook for the foodservice market in Ireland for 2015 through 2018 is 2.9% on a compound annual growth (CAGR) basis.
• Growth is expected to be strongest in ROI, rising from historic CAGR of 1.9% over the last three years to 3.0% over the next three years.
• For NI, growth will increase by a factor of 0.5%.
Foodservice Industry Compound Annual Growth Rate (CAGR)
1.9%
2.9%
1.9%
3.0%
2.0% 2.5%
Historic CAGR (2012-2015) Forecast CAGR (2015-2018)
Island of Ireland Republic of Ireland Northern Ireland
2015 Irish Quick Service and Food-to-Go Market Snapshot
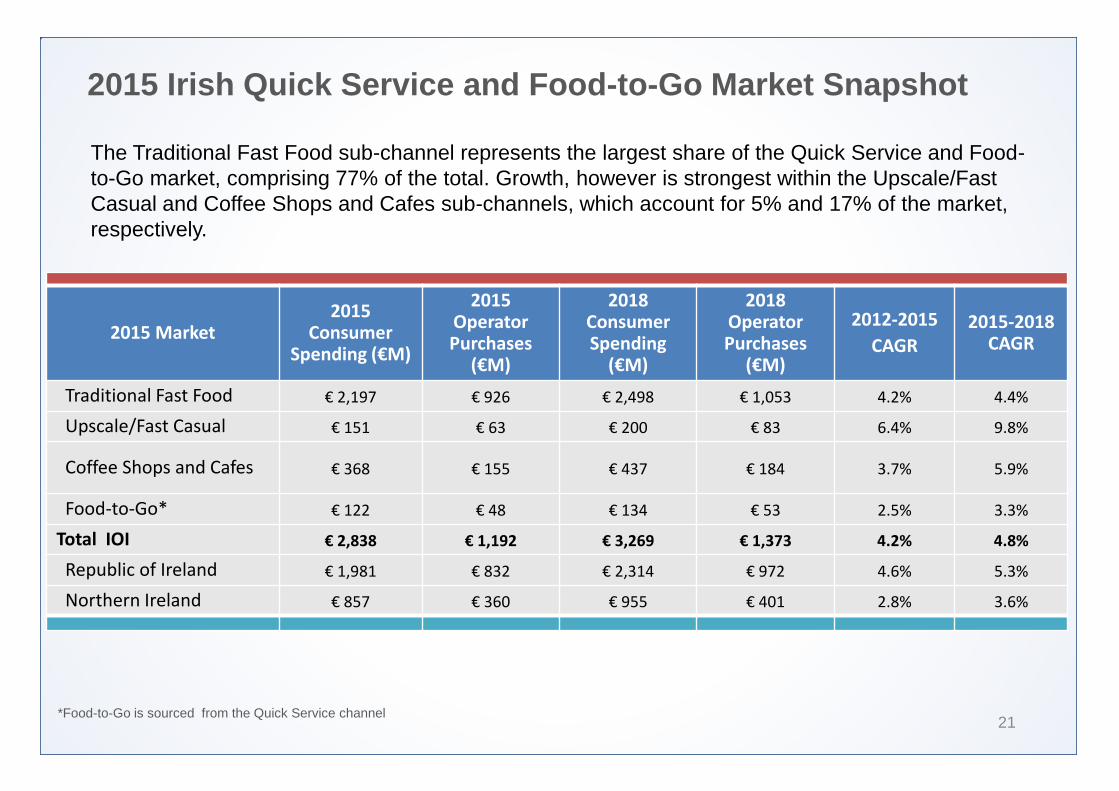
21 *Food-to-Go is sourced from the Quick Service channel
2015 Market 2015
Consumer Spending (€M)
2015 Operator Purchases
(€M)
2018 Consumer Spending
(€M)
2018 Operator Purchases
(€M)
2012-2015
CAGR 2015-2018
CAGR
Traditional Fast Food € 2,197 € 926 € 2,498 € 1,053 4.2% 4.4%
Upscale/Fast Casual € 151 € 63 € 200 € 83 6.4% 9.8%
Coffee Shops and Cafes € 368 € 155 € 437 € 184 3.7% 5.9%
Food-to-Go* € 122 € 48 € 134 € 53 2.5% 3.3%
Total IOI € 2,838 € 1,192 € 3,269 € 1,373 4.2% 4.8%
Republic of Ireland € 1,981 € 832 € 2,314 € 972 4.6% 5.3%
Northern Ireland € 857 € 360 € 955 € 401 2.8% 3.6%
The Traditional Fast Food sub-channel represents the largest share of the Quick Service and Food-to-Go market, comprising 77% of the total. Growth, however is strongest within the Upscale/Fast Casual and Coffee Shops and Cafes sub-channels, which account for 5% and 17% of the market, respectively.
Quick Service and Food-to-Go Market Characteristics
22
Traditional Fast Food
The €2.2 billion euro Traditional Fast Food market in IOI strengthened over the last three years (most robustly in 2015) and is expected to continue this growth at a compound annual growth rate (CAGR) of 4.4% through 2018.
Value positioning continues to be a key driver for consumers within this sub-segment. However, operators
are turning their attention to ways to improve quality. With the rise of Fast Casual operators, this is an
imperative for Traditional Fast Food operators.
Traditional Fast Food operators remain focused on innovation in numerous areas. Menu development is a
primary area of activity and operators are continuously working on limited time menu items. Many of these
feature ethnic and fresh ingredients. Technology driven enhancements are also changing operational
dynamics within the sub-channel and are improving aspects of service both front-of-house and back-of-
house activities. Provenance and sourcing from local suppliers are other areas where both chain and
independent operators are working with IOI suppliers to build localised menu differentiation.
Quick Service and Food-to-Go Market Characteristics
23
Upscale/Fast Casual
The Upscale/Fast Casual segment is forecast to grow faster than any other sub-channel in IOI, with 9.8% annual growth expected over the next three years. By 2018, the market will reach €200 million in consumer spending. This growth is driven by more robust consumer spending, a high degree of interest in the menu variety offered by operators and the ability for consumers to customise menu items.
One of the key reasons why Upscale/Fast Casual operators have such a positive position in the market is
their usage of premium and unique (ethnic, local, etc.) ingredients. Operators are also adapting their menus
to further capitalise on their existing customers (by raising spend averages) through expansion of the
assortment of beverages on the menu. Increasingly, IOI is gaining the attention of international Upscale/Fast
Casual chains, which will result in a broader portfolio of Upscale/Fast Casual brands in IOI over the upcoming
years.
Coffee Shops and Cafes
The Coffee Shops and Cafes segment reached €368 million in consumer spending in 2015 and is forecast to grow 5.9% annually through 2018. Growth in this sub-channel is driven by several factors, including increased consumer spending per occasion, unit count growth, expansion of food items on the menu and food offerings targeted for lunch and dinner dayparts.
Quick Service and Food-to-Go Market Characteristics
24
Coffee Shops and Cafes (continued)
Operators in this segment invest significantly in staff training and venue atmosphere, as the Coffee Shops and Cafes sub-channel use experiential factors as a central point of differentiation. Similar to other channels, provenance and ingredient quality play an important role in these operations. Additionally, the Coffee Shops and Cafes sub-channel is heavily reliant on impulse purchases.
Food-to-Go
Food-to-Go occasions in IOI account for €122 million in consumer spending and are growing slower than the other Quick Service sub-channels. In IOI, Food-to-Go will grow 3.3% annually through 2018, though growth is notably higher (3.5%) in ROI versus NI (2.7%). This difference is driven, in part, by the growing presence of more elaborate foodservice offerings from Forecourt Convenience stores and other retailers.
Several factors are driving growth in the Food-to-Go market, resulting in more options for customers through this sub-channel. Improved food quality and expanded assortment of foodservice items are key contributors. Additionally, remodeled retail locations in IOI within the Food-to-Go sub-channel tend to feature expanded foodservice offerings. Overall, retailers view Food-to-Go options as a growth strategy and a way to enhance their overall offer.
Geographic Segmentation
25
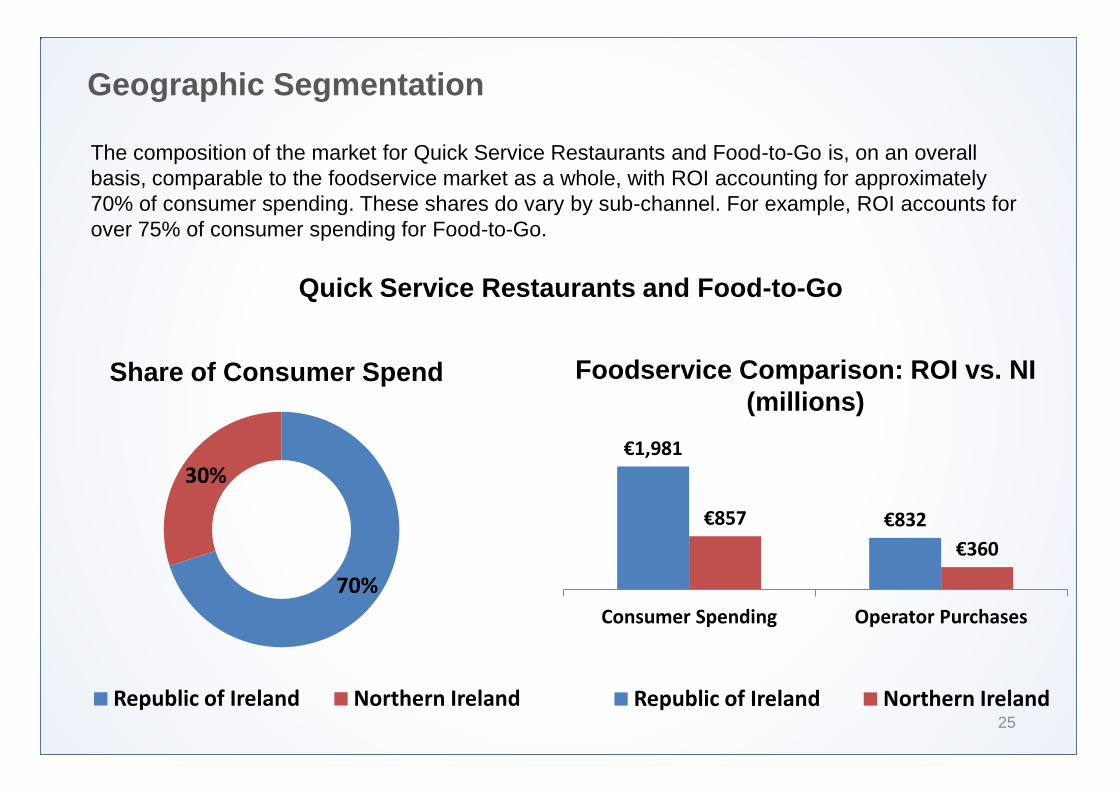
The composition of the market for Quick Service Restaurants and Food-to-Go is, on an overall basis, comparable to the foodservice market as a whole, with ROI accounting for approximately 70% of consumer spending. These shares do vary by sub-channel. For example, ROI accounts for over 75% of consumer spending for Food-to-Go.
70%
30%
Republic of Ireland Northern Ireland
Share of Consumer Spend Foodservice Comparison: ROI vs. NI (millions)
€1,981
€832 €857
€360
Consumer Spending Operator Purchases
Republic of Ireland Northern Ireland
Quick Service Restaurants and Food-to-Go
Product Category Segmentation for Quick Service Restaurants and Food-to-Go
26
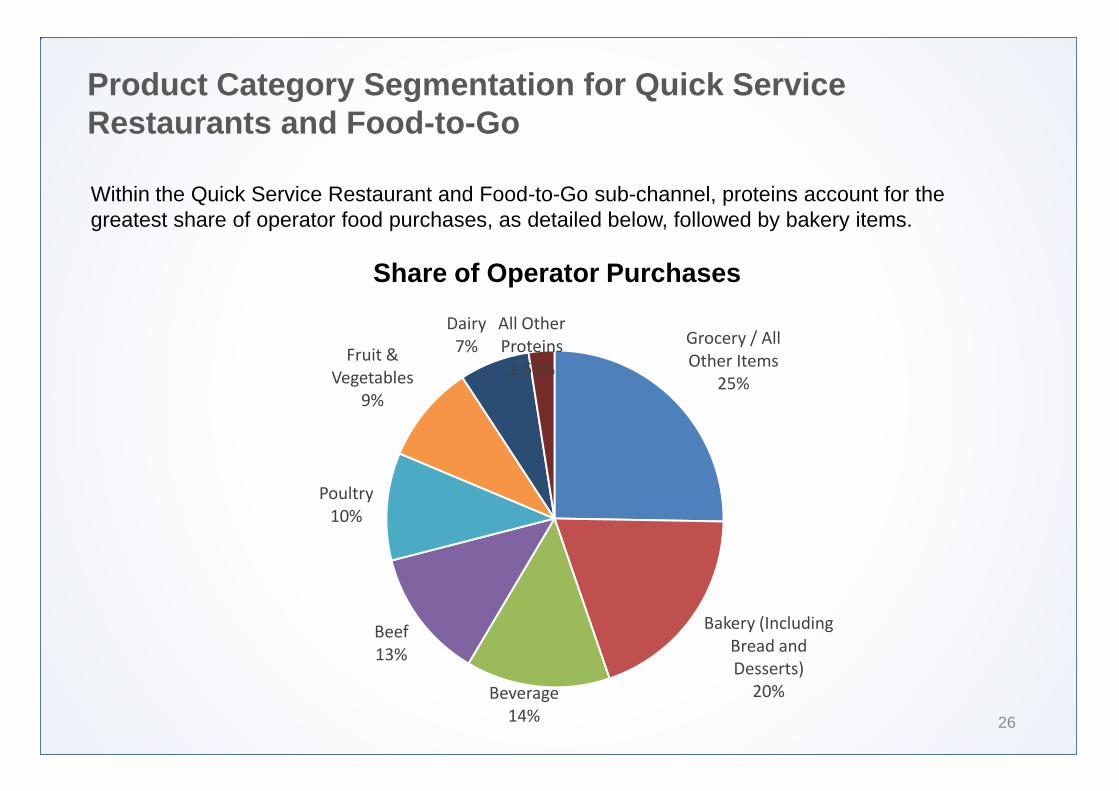
Within the Quick Service Restaurant and Food-to-Go sub-channel, proteins account for the greatest share of operator food purchases, as detailed below, followed by bakery items.
Share of Operator Purchases
Grocery / All Other Items
25%
Bakery (Including Bread and Desserts)
20% Beverage 14%
Beef 13%
Poultry 10%
Fruit & Vegetables
9%
Dairy 7%
All Other Proteins 2.51%
Overarching Product Trends
27
Several trends are impacting product sourcing decisions among Quick Service Restaurants and Food-to-Go operators.
• Provenance and local sourcing are important drivers for decision makers across all four Quick Service Restaurant and Food-to-Go sub-channels, though Traditional Fast Food operators face the most significant challenges for using these items on the menu due to supply chain issues.
• Ingredients related to artisan and craft menu items are gaining attention, especially within Upscale/Fast Casual and the Coffee Shops and Cafes sub-channels.
• Better-for-you ingredients are growing in importance, as they provide a “health halo” for menu
items that can help operators differentiate from the competition in a manner that is highly relevant to their customer base.
• Within Food-to-Go, operators are developing more customised offerings and are seeking support from their product supplier partners to help them create and develop new menu items.
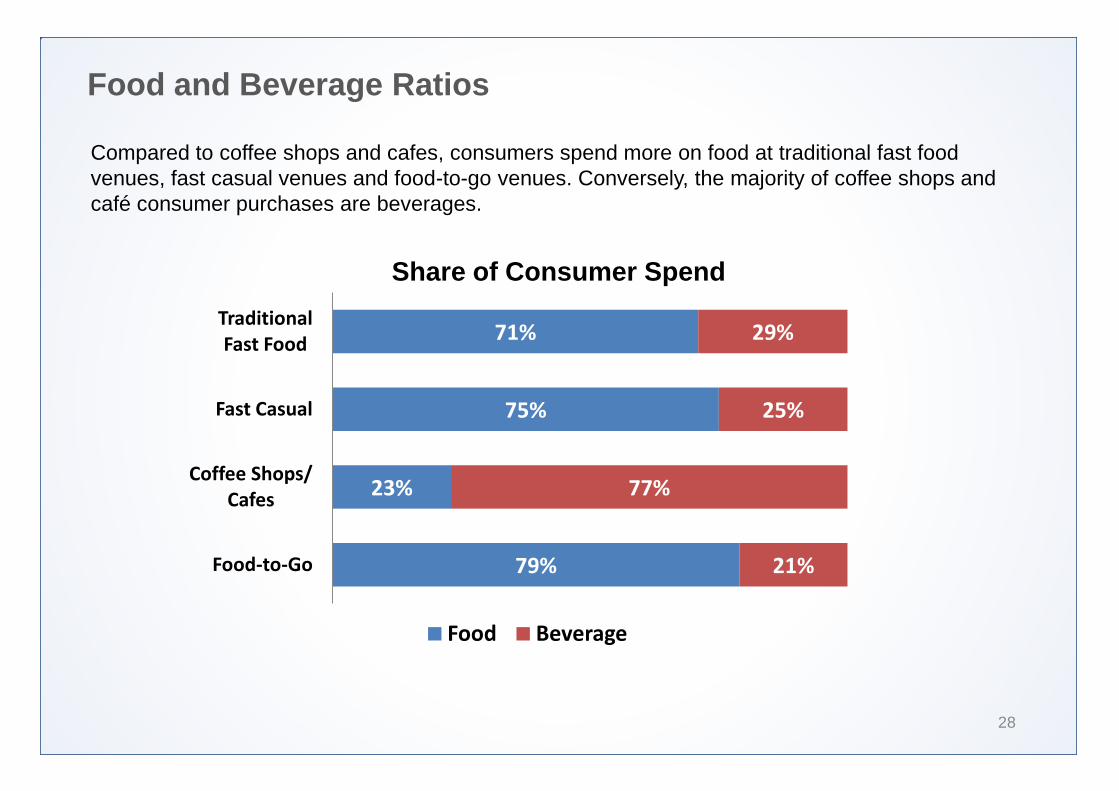
Food and Beverage Ratios
28
Compared to coffee shops and cafes, consumers spend more on food at traditional fast food venues, fast casual venues and food-to-go venues. Conversely, the majority of coffee shops and café consumer purchases are beverages.
Share of Consumer Spend
71%
75%
23%
79%
29%
25%
77%
21%
Traditional Fast Food
Fast Casual
Coffee Shops/ Cafes
Food-to-Go
Food Beverage
Top Consumer Findings
29
The following insights were identified during the evaluation of the online consumer survey data that was generated for this study.
• Food from upscale/fast casual operators is perceived to be healthier in general.
• “Better-for-you” positioned foods are viewed favorably by consumers.
• Speed of service is of central importance, pricing and transparency in terms of preparation are also important factors for consumers.
• Generally, local sourcing and provenance are important considerations for Irish consumers.
• Consumers are seeking food quality improvements from both QSR operators as well as Food-to-Go offerings from C-stores.
• There is growth in the frequency of consumer orders for handhelds and ethnic items.
Top Consumer Findings (continued)
30
• Consumers are actively seeking out fresh options when dining away from home.
• Only half of respondents indicate that new ordering technology and related delivery services enhance the convenience and overall experience. Because these services are still in a relatively early stage of adoption, reviews from consumers are mixed. As user experience with the technologies improve, it is reasonable to expect that response to next generation ordering technology will improve over time.
• Those aged 25 to 44 are most concerned with transparency when going out to eat.
• Heavy quick service users are most likely to make special requests for menu item customisation when dining away from home.

SECTION
Market Sub-Channel Dynamics 2

SECTION
Traditional Fast Food Occasions, Trends and Market Drivers
Traditional Fast Food Restaurants
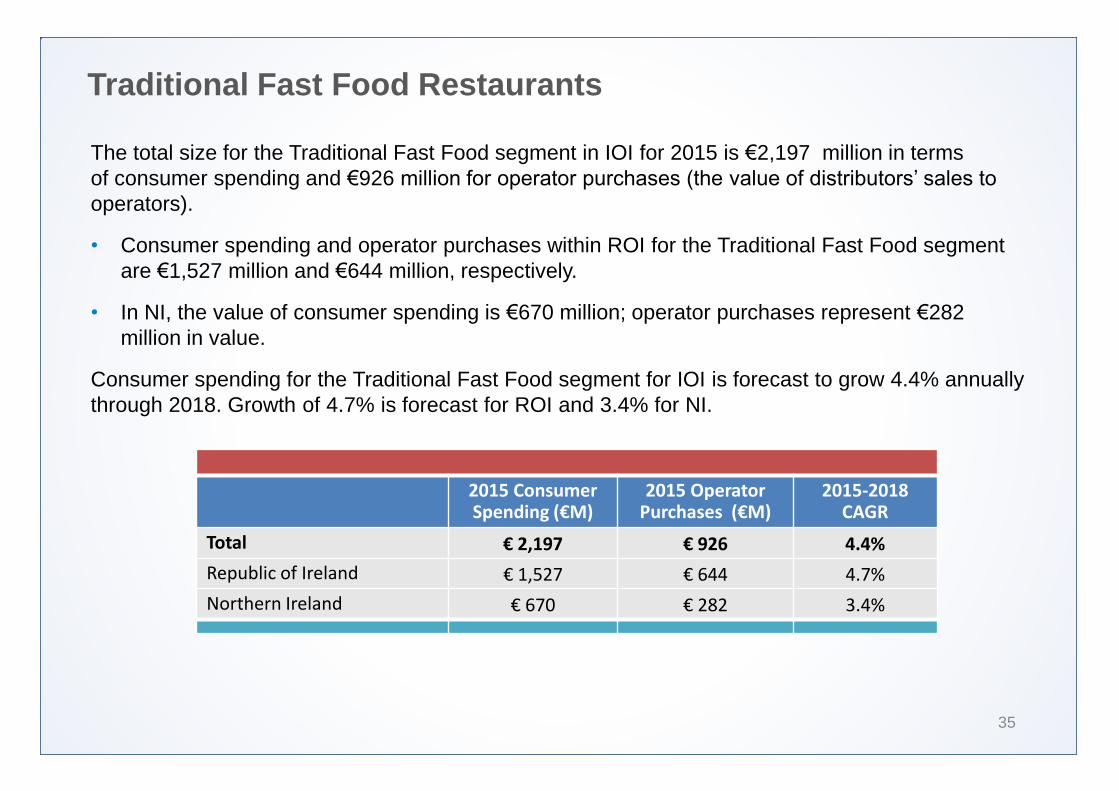
35
The total size for the Traditional Fast Food segment in IOI for 2015 is €2,197 million in terms of consumer spending and €926 million for operator purchases (the value of distributors’ sales to
operators).
• Consumer spending and operator purchases within ROI for the Traditional Fast Food segment are €1,527 million and €644 million, respectively.
• In NI, the value of consumer spending is €670 million; operator purchases represent €282 million in value.
Consumer spending for the Traditional Fast Food segment for IOI is forecast to grow 4.4% annually through 2018. Growth of 4.7% is forecast for ROI and 3.4% for NI.
2015 Consumer Spending (€M)
2015 Operator Purchases (€M)
2015-2018 CAGR
Total € 2,197 € 926 4.4%
Republic of Ireland € 1,527 € 644 4.7%
Northern Ireland € 670 € 282 3.4%
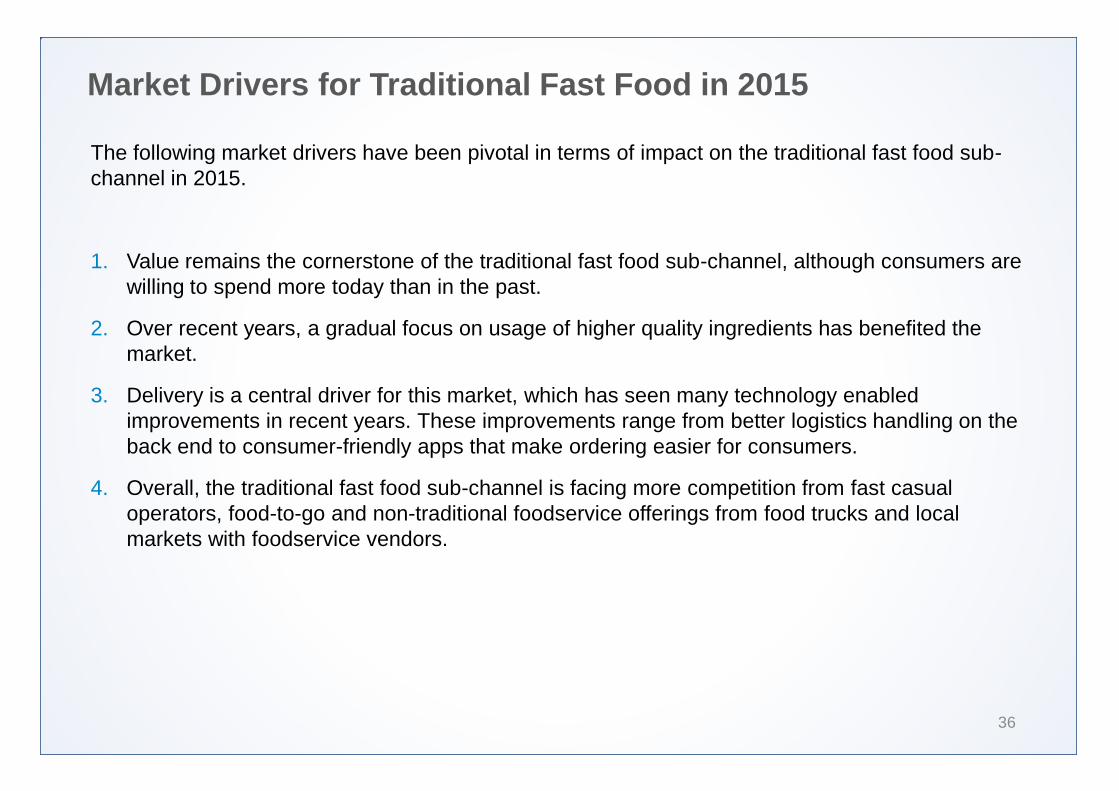
Market Drivers for Traditional Fast Food in 2015
36
The following market drivers have been pivotal in terms of impact on the traditional fast food sub-channel in 2015.
1. Value remains the cornerstone of the traditional fast food sub-channel, although consumers are willing to spend more today than in the past.
2. Over recent years, a gradual focus on usage of higher quality ingredients has benefited the market.
3. Delivery is a central driver for this market, which has seen many technology enabled improvements in recent years. These improvements range from better logistics handling on the back end to consumer-friendly apps that make ordering easier for consumers.
4. Overall, the traditional fast food sub-channel is facing more competition from fast casual operators, food-to-go and non-traditional foodservice offerings from food trucks and local markets with foodservice vendors.
Traditional Fast Food: Last Occasion Snapshot
37 Source: Technomic Irish Marketplace Consumer Survey
33%
25%
14%
14%
13%
11%
10%
10%
9%
9%
Burger
Chicken
Dessert
Sandwich
Appetizer
Beef/Steak
Pizza
Salad
Asian foods
Baked …
Top 10 Foods Consumed
41% 24% 19% 15% 14% 4%
Friend(s) Just me Significant other/spouse
Coworker(s) Children (under 18)
Other family
Accompanying Parties
26%
15%
36%
37%
22%
5%
Late night
Evening
Afternoon
Early afternoon
Mid-morning
Morning
Time of Day Visited Day of the Week
84%
33%
Weekend
Weekday
Median Amount Spent Per Person
€7
41%
21%
19%
15%
14%
14%
11%
6%
3%
1%
Fizzy Drinks
Juice
Bottled Water
Milk/Smoothies
Tap Water
Coffee
Tea
Still Drinks
Alcohol
Other
Beverages Consumed
48%
17%
34%
1%
Routine Meal Special Occasion
Impulse Other
Type of Visit
Traditional Fast Food: Last Occasion Snapshot
38
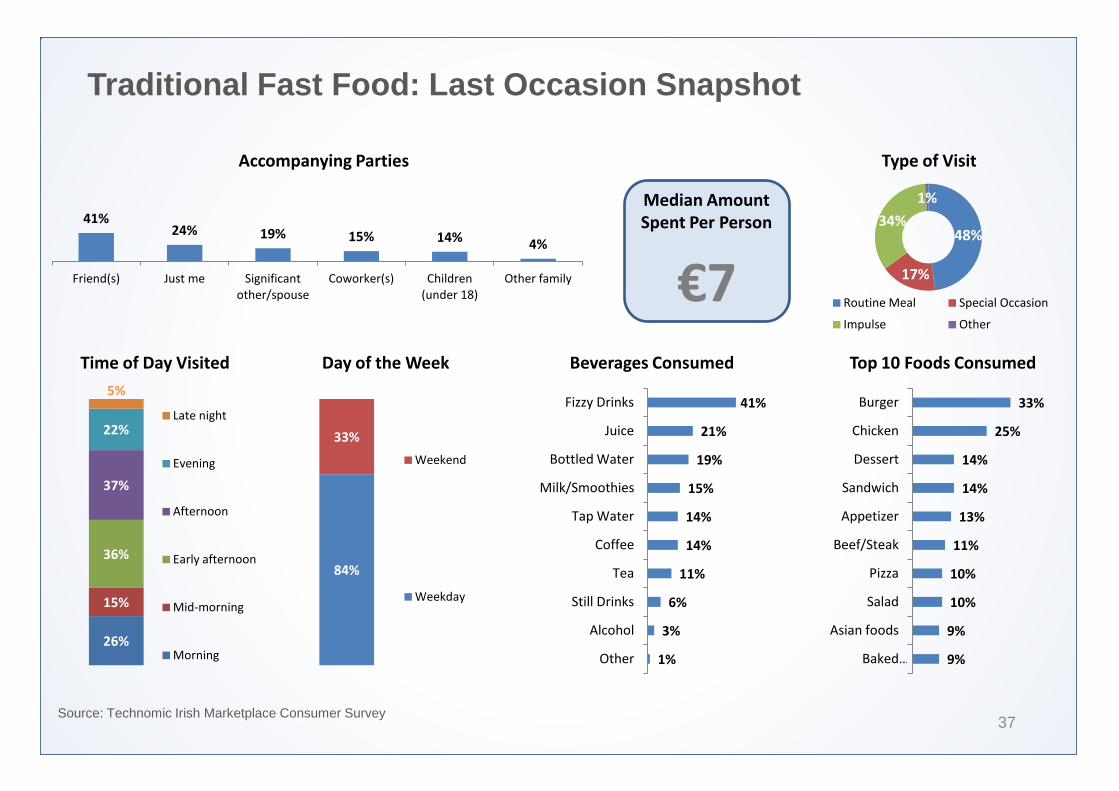
Convenience and relatively low prices make routine weekday visits to fast food restaurants easy for consumers. Portability is a key component to this segment, with handheld items such as burgers and chicken purchased most frequently.
• The afternoon daypart dominates the traditional fast food segment, with 73% of consumers purchasing their last fast food meal during this time.
• Fizzy drinks (41%) are the most common beverage ordered at fast food restaurants, followed by juices (21%) and bottled waters (19%).
• Nearly one-third of consumers purchased a burger during their last fast food meal, and slightly less opted for chicken.
• Fast food is seen as a routine meal and is typically enjoyed alone or with a group of friends.
• Median amount spent per person is €7.
• Consumers usually opt for fast food during weekdays.
Because fast food is on-the-go, it makes for a quick lunch solution during weekdays.
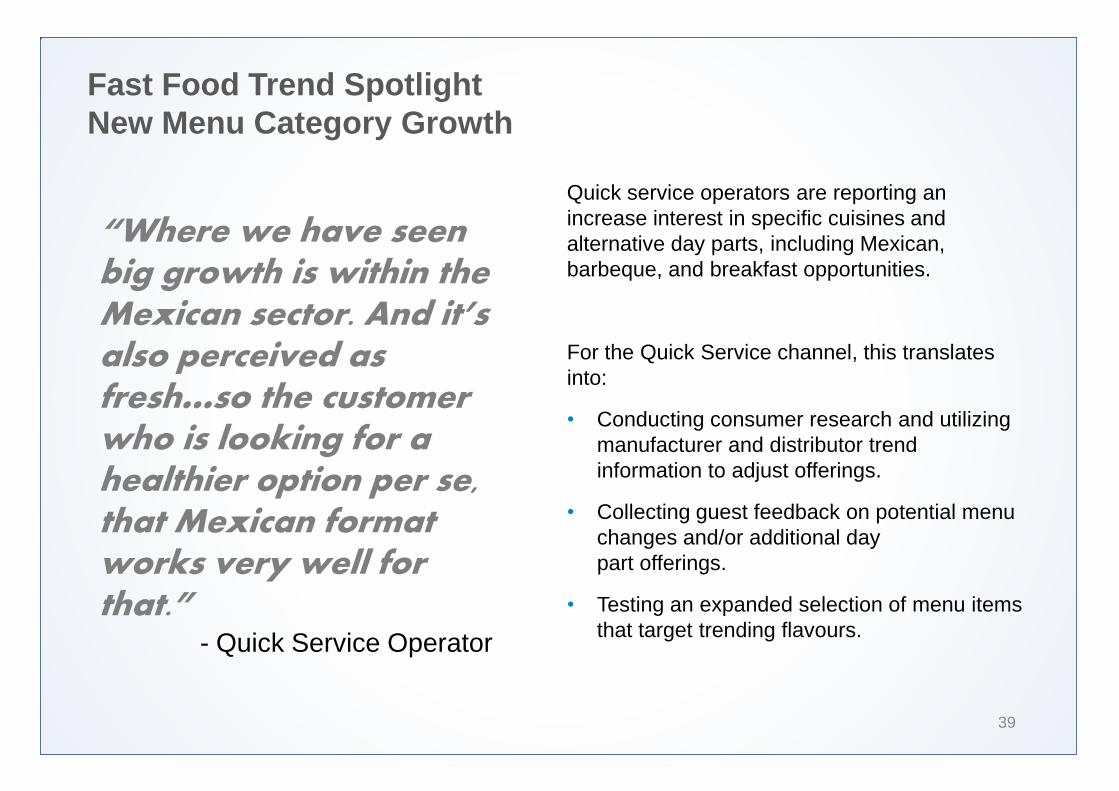
Fast Food Trend Spotlight New Menu Category Growth
39
Quick service operators are reporting an increase interest in specific cuisines and alternative day parts, including Mexican, barbeque, and breakfast opportunities.
For the Quick Service channel, this translates into:
• Conducting consumer research and utilizing manufacturer and distributor trend information to adjust offerings.
• Collecting guest feedback on potential menu changes and/or additional day part offerings.
• Testing an expanded selection of menu items that target trending flavours.
“Where we have seen big growth is within the Mexican sector. And it’s also perceived as fresh…so the customer who is looking for a healthier option per se, that Mexican format works very well for that.” - Quick Service Operator
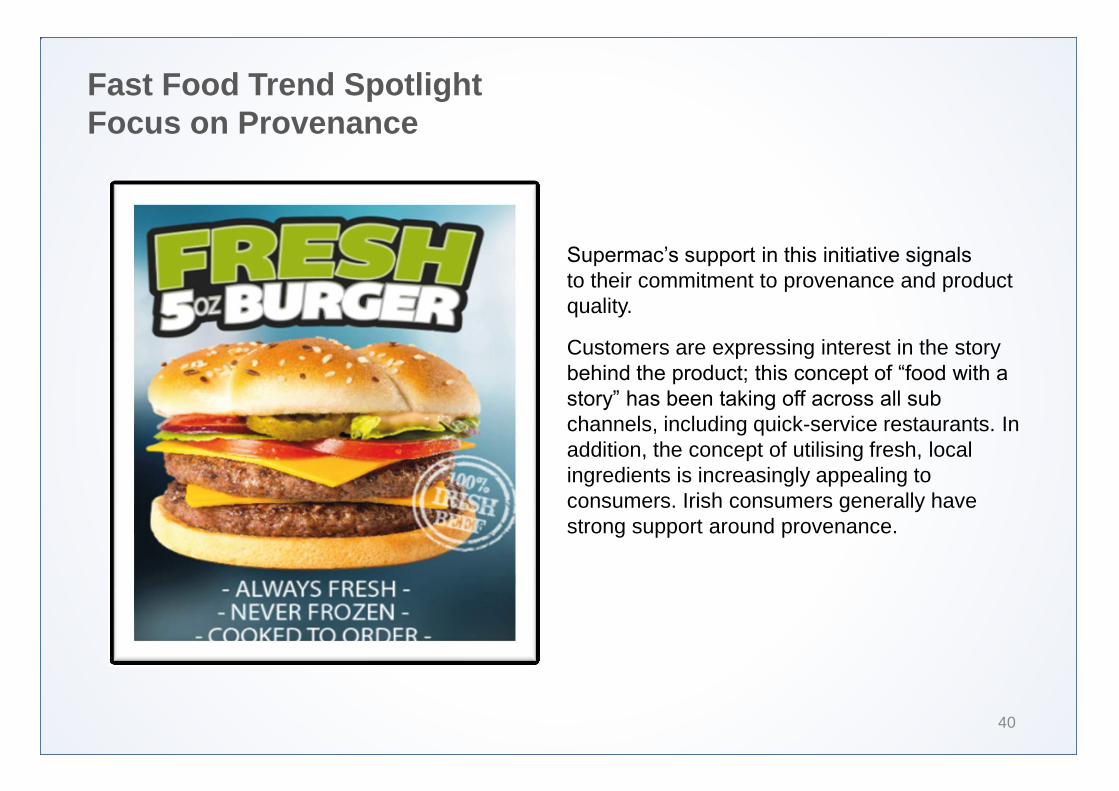
Fast Food Trend Spotlight Focus on Provenance
40
Supermac’s support in this initiative signals to their commitment to provenance and product quality.
Customers are expressing interest in the story behind the product; this concept of “food with a
story” has been taking off across all sub
channels, including quick-service restaurants. In addition, the concept of utilising fresh, local ingredients is increasingly appealing to consumers. Irish consumers generally have strong support around provenance.
Fast Food Trend Spotlight Strong Growth Continues, driven by new Technologies
41
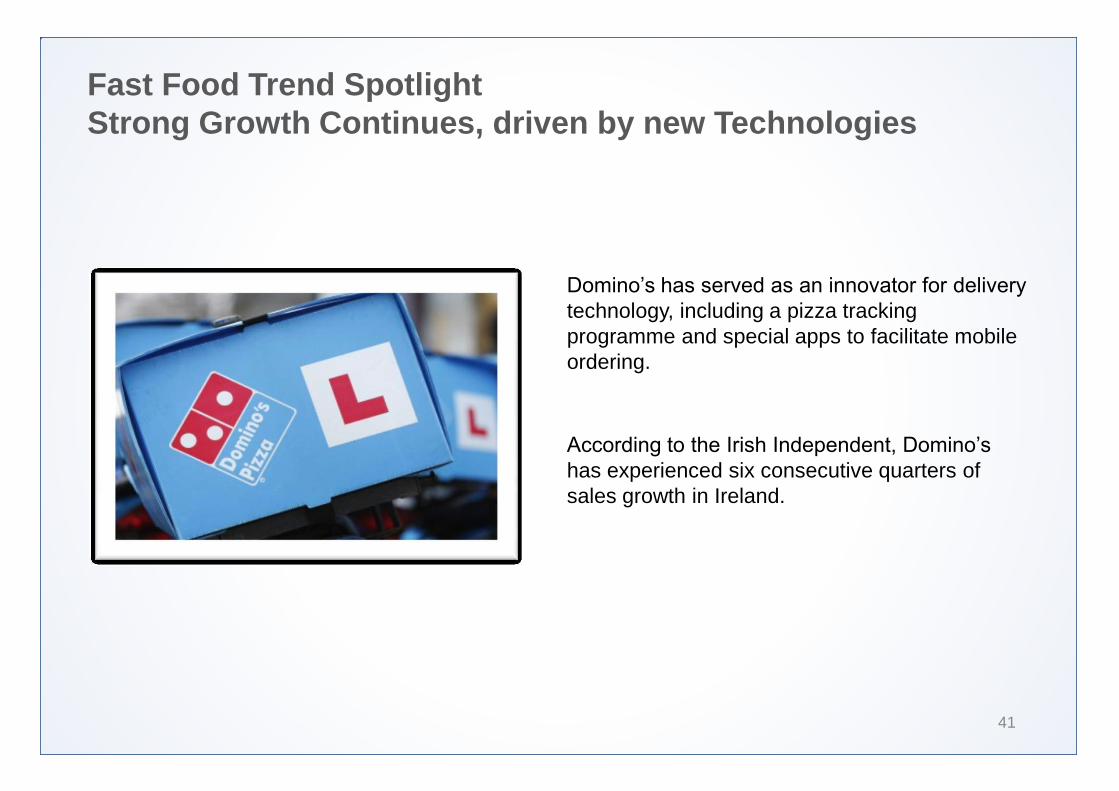
Domino’s has served as an innovator for delivery
technology, including a pizza tracking programme and special apps to facilitate mobile ordering.
According to the Irish Independent, Domino’s
has experienced six consecutive quarters of sales growth in Ireland.
Fast Food Trend Spotlight Leveraging New Technologies to deliver Customisation
42
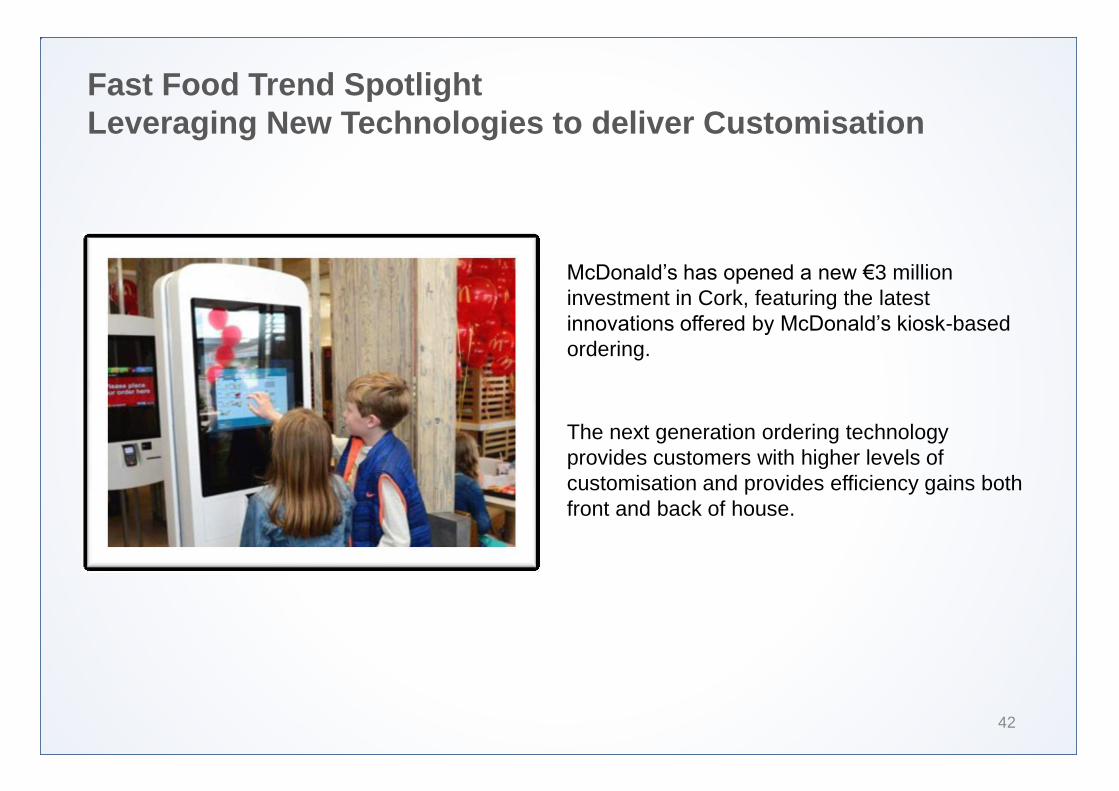
McDonald’s has opened a new €3 million investment in Cork, featuring the latest innovations offered by McDonald’s kiosk-based ordering.
The next generation ordering technology provides customers with higher levels of customisation and provides efficiency gains both front and back of house.

SECTION
Upscale/Fast Casual Occasions, Trends and Market Drivers
Upscale/Fast Casual Restaurants
45
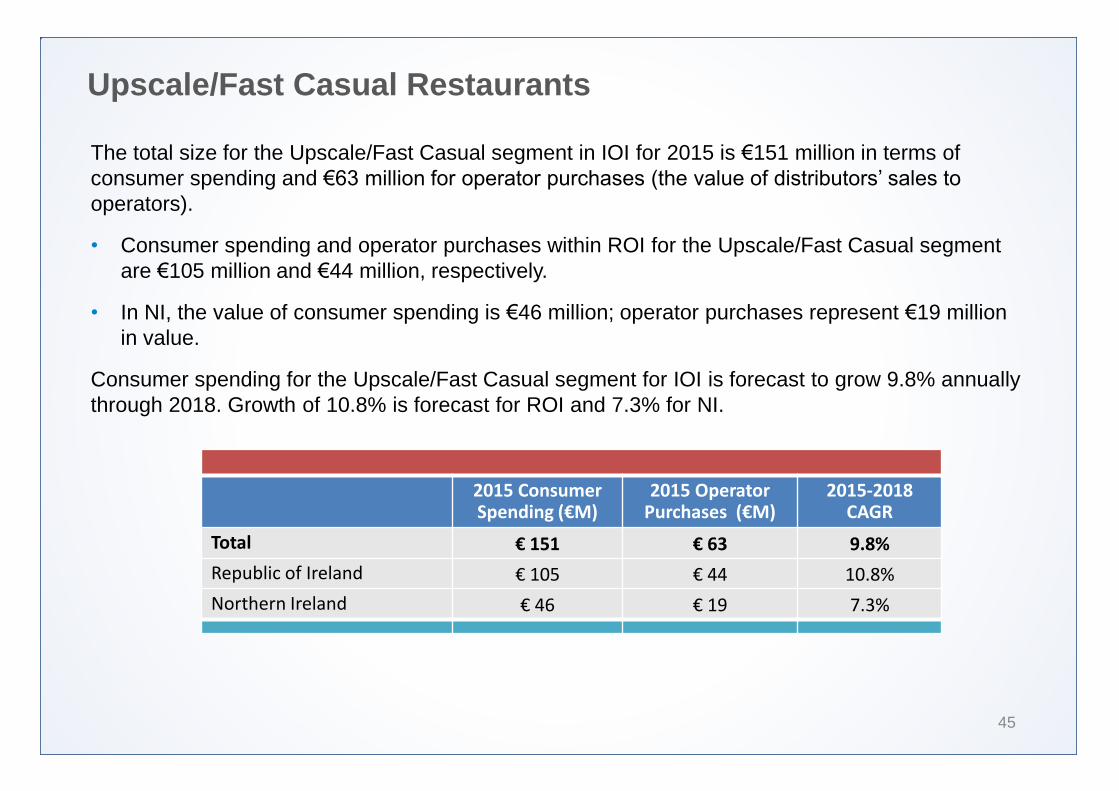
The total size for the Upscale/Fast Casual segment in IOI for 2015 is €151 million in terms of consumer spending and €63 million for operator purchases (the value of distributors’ sales to
operators).
• Consumer spending and operator purchases within ROI for the Upscale/Fast Casual segment are €105 million and €44 million, respectively.
• In NI, the value of consumer spending is €46 million; operator purchases represent €19 million in value.
Consumer spending for the Upscale/Fast Casual segment for IOI is forecast to grow 9.8% annually through 2018. Growth of 10.8% is forecast for ROI and 7.3% for NI.
2015 Consumer Spending (€M)
2015 Operator Purchases (€M)
2015-2018 CAGR
Total € 151 € 63 9.8%
Republic of Ireland € 105 € 44 10.8%
Northern Ireland € 46 € 19 7.3%
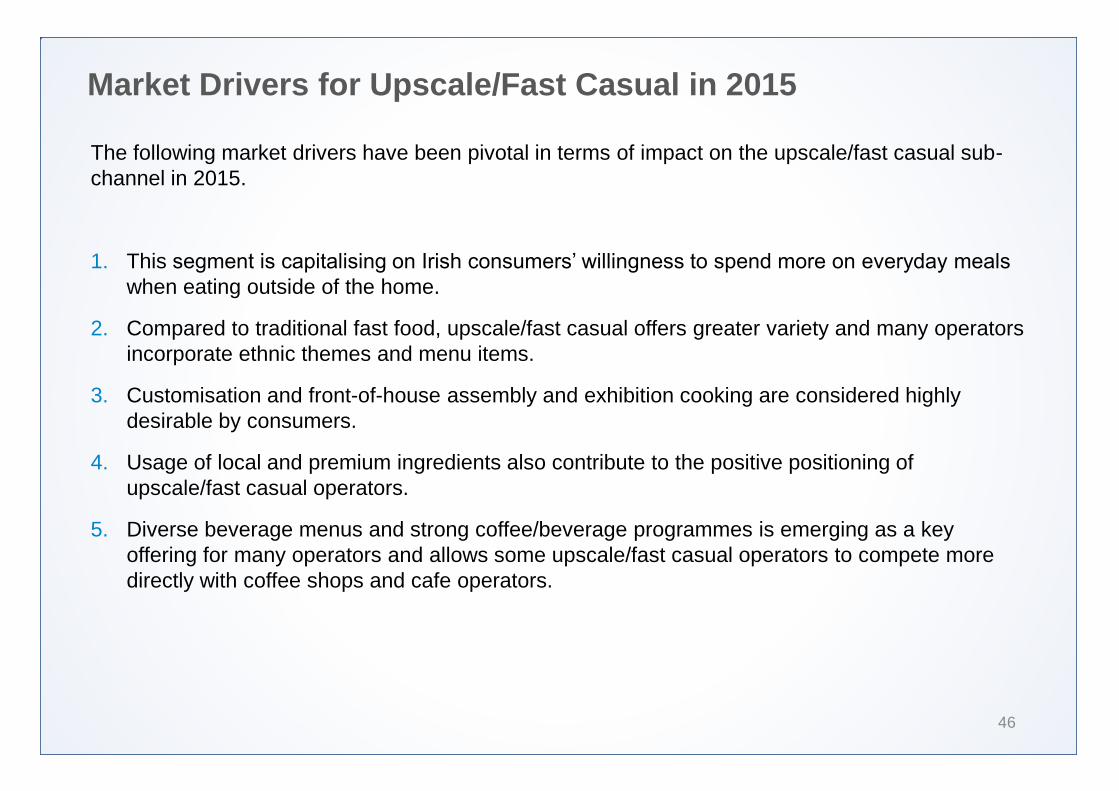
Market Drivers for Upscale/Fast Casual in 2015
46
The following market drivers have been pivotal in terms of impact on the upscale/fast casual sub-channel in 2015.
1. This segment is capitalising on Irish consumers’ willingness to spend more on everyday meals
when eating outside of the home.
2. Compared to traditional fast food, upscale/fast casual offers greater variety and many operators incorporate ethnic themes and menu items.
3. Customisation and front-of-house assembly and exhibition cooking are considered highly desirable by consumers.
4. Usage of local and premium ingredients also contribute to the positive positioning of upscale/fast casual operators.
5. Diverse beverage menus and strong coffee/beverage programmes is emerging as a key offering for many operators and allows some upscale/fast casual operators to compete more directly with coffee shops and cafe operators.
Upscale/Fast Casual: Last Occasion Snapshot
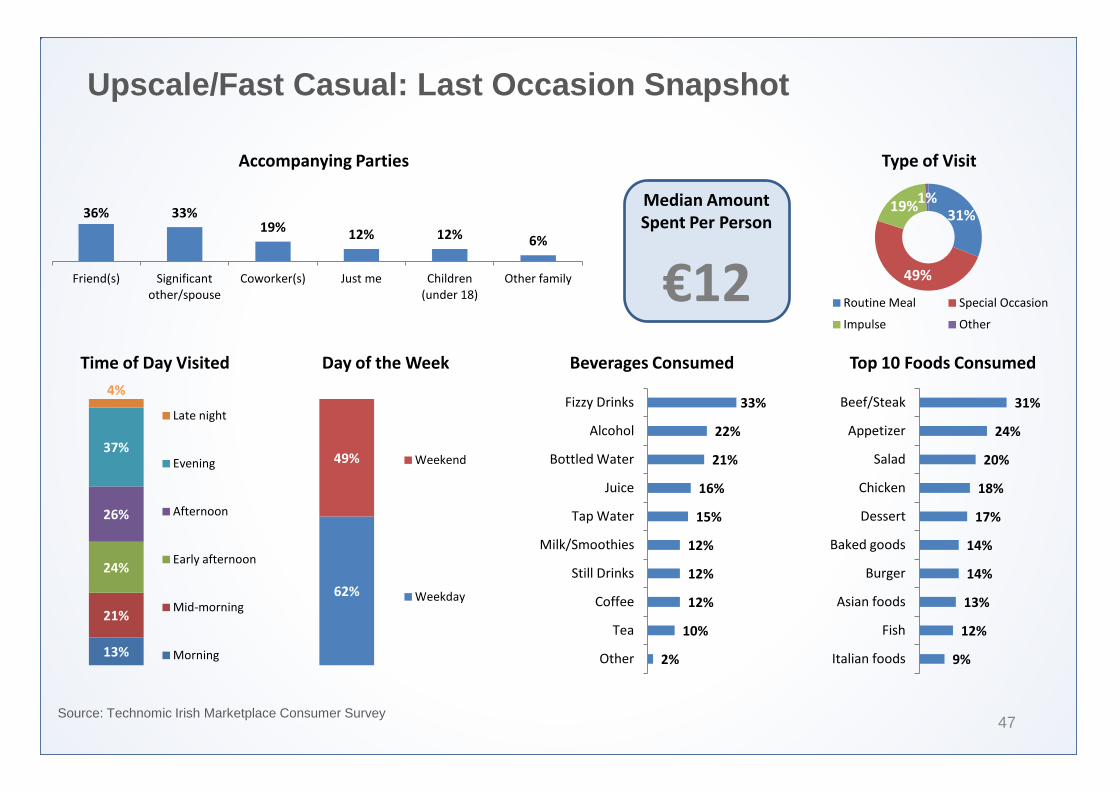
47 Source: Technomic Irish Marketplace Consumer Survey
31%
24%
20%
18%
17%
14%
14%
13%
12%
9%
Beef/Steak
Appetizer
Salad
Chicken
Dessert
Baked goods
Burger
Asian foods
Fish
Italian foods
Top 10 Foods Consumed
36% 33% 19% 12% 12% 6%
Friend(s) Significant other/spouse
Coworker(s) Just me Children (under 18)
Other family
Accompanying Parties
13%
21%
24%
26%
37%
4%
Late night
Evening
Afternoon
Early afternoon
Mid-morning
Morning
Time of Day Visited Day of the Week
62%
49% Weekend
Weekday
Median Amount Spent Per Person
€12
33%
22%
21%
16%
15%
12%
12%
12%
10%
2%
Fizzy Drinks
Alcohol
Bottled Water
Juice
Tap Water
Milk/Smoothies
Still Drinks
Coffee
Tea
Other
Beverages Consumed
31%
49%
19% 1%
Routine Meal Special Occasion
Impulse Other
Type of Visit
Upscale/Fast Casual: Last Occasion Snapshot
48
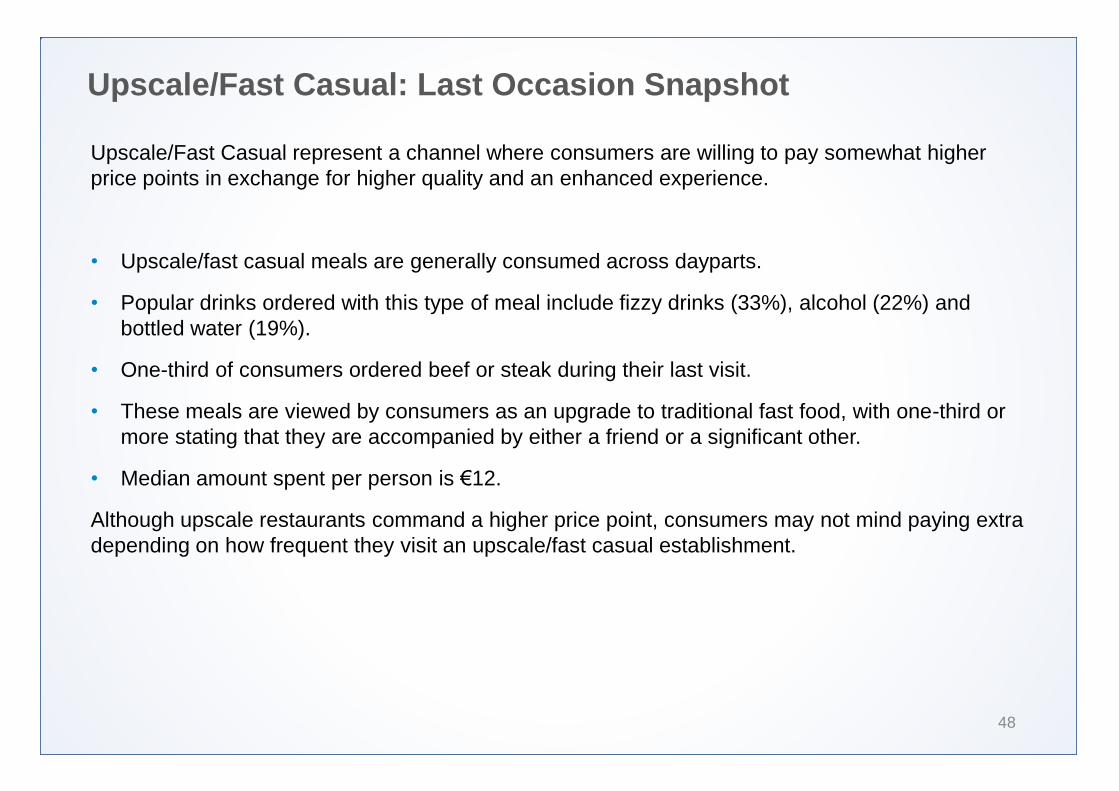
Upscale/Fast Casual represent a channel where consumers are willing to pay somewhat higher price points in exchange for higher quality and an enhanced experience.
• Upscale/fast casual meals are generally consumed across dayparts.
• Popular drinks ordered with this type of meal include fizzy drinks (33%), alcohol (22%) and bottled water (19%).
• One-third of consumers ordered beef or steak during their last visit.
• These meals are viewed by consumers as an upgrade to traditional fast food, with one-third or more stating that they are accompanied by either a friend or a significant other.
• Median amount spent per person is €12.
Although upscale restaurants command a higher price point, consumers may not mind paying extra depending on how frequent they visit an upscale/fast casual establishment.

Fast Casual Trend Spotlight Consumers Want Control
49
Customisation is a priority with Irish consumers, particularly with Millennials (those born in from 1977 through to 1992). Consumers prefer the ability to select the components that make up their meals in order to create a completely individualised order.
For the Fast Casual channel, this translates into:
• Recognition that consumers are very visual and want to see their specific order being made.
• Menus that highlight make-your-own items such as pizzas, salads, and sandwiches.
• Operations that have an element of “entertainment” for the guests.
“The consumer likes to see the food being cooked…they like the drama…and they like to be involved in the ordering process. They like to be in control, they like to edit things.” - Fast Casual Operator
Fast Casual Trend Spotlight Brand Expansion
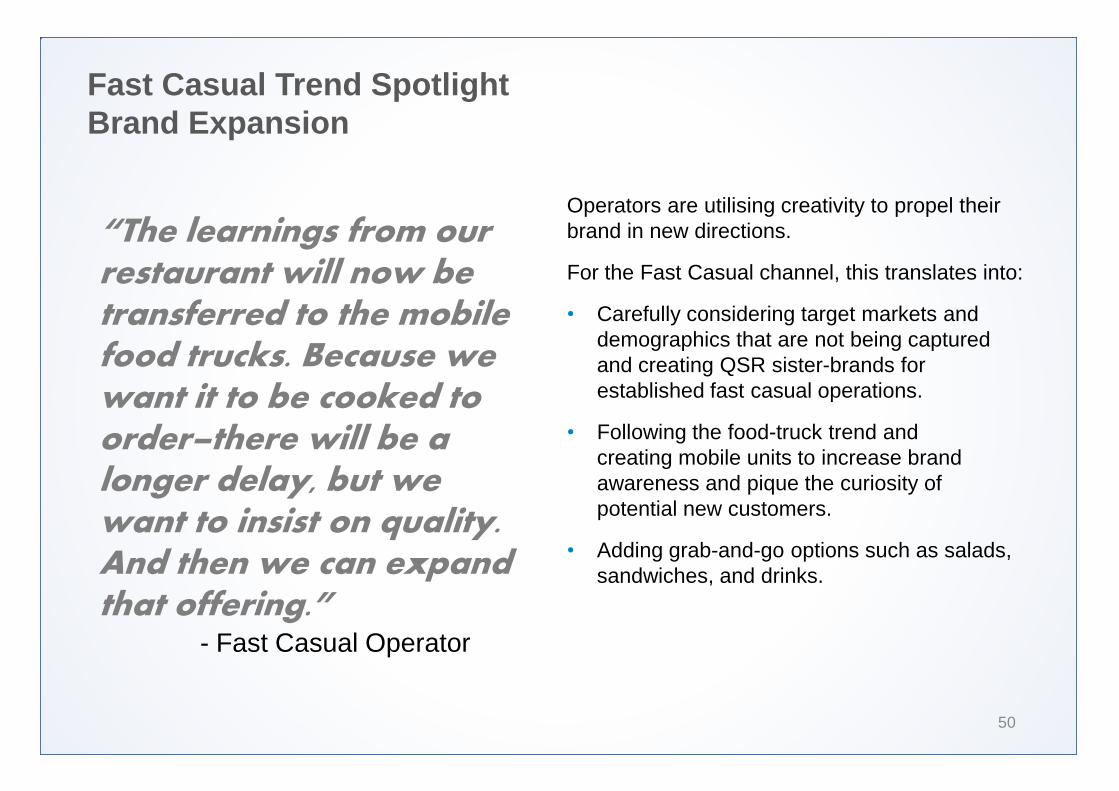
50
Operators are utilising creativity to propel their brand in new directions.
For the Fast Casual channel, this translates into:
• Carefully considering target markets and demographics that are not being captured and creating QSR sister-brands for established fast casual operations.
• Following the food-truck trend and creating mobile units to increase brand awareness and pique the curiosity of potential new customers.
• Adding grab-and-go options such as salads, sandwiches, and drinks.
“The learnings from our restaurant will now be transferred to the mobile food trucks. Because we want it to be cooked to order–there will be a longer delay, but we want to insist on quality. And then we can expand that offering.” - Fast Casual Operator
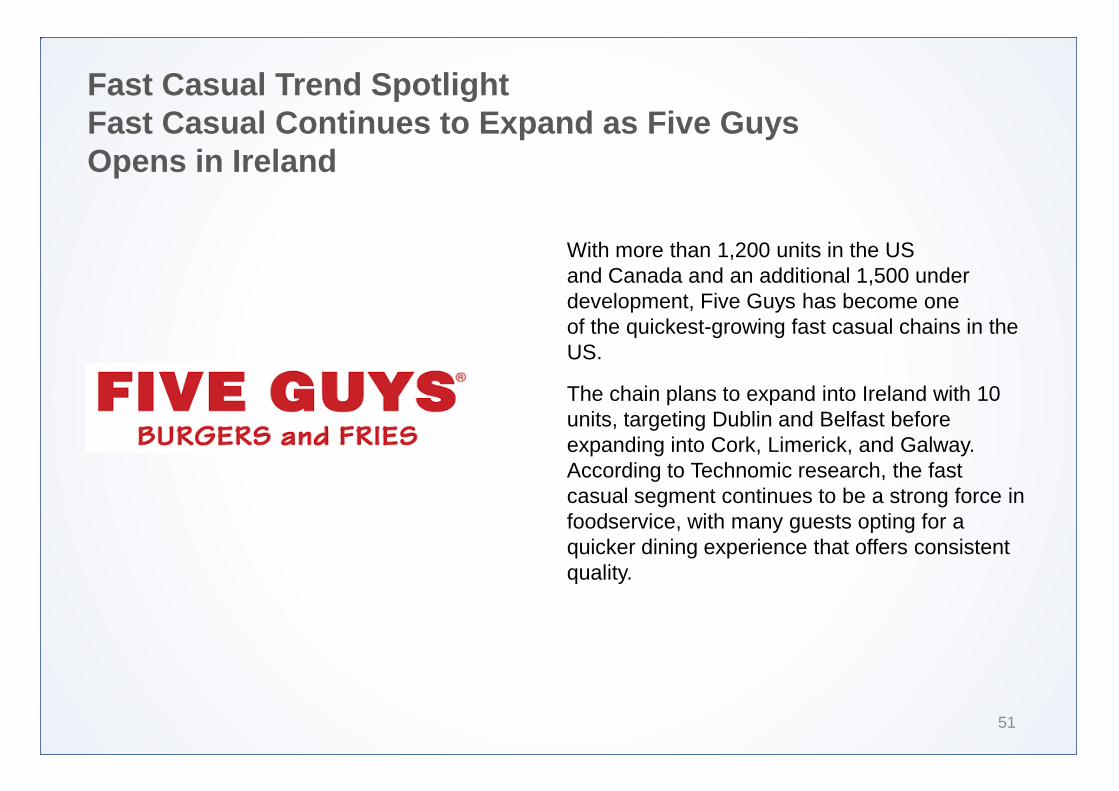
Fast Casual Trend Spotlight Fast Casual Continues to Expand as Five Guys Opens in Ireland
51
With more than 1,200 units in the US and Canada and an additional 1,500 under development, Five Guys has become one of the quickest-growing fast casual chains in the US.
The chain plans to expand into Ireland with 10 units, targeting Dublin and Belfast before expanding into Cork, Limerick, and Galway. According to Technomic research, the fast casual segment continues to be a strong force in foodservice, with many guests opting for a quicker dining experience that offers consistent quality.
SECTION
Coffee Shops and Cafes Occasions, Trends and Market Drivers
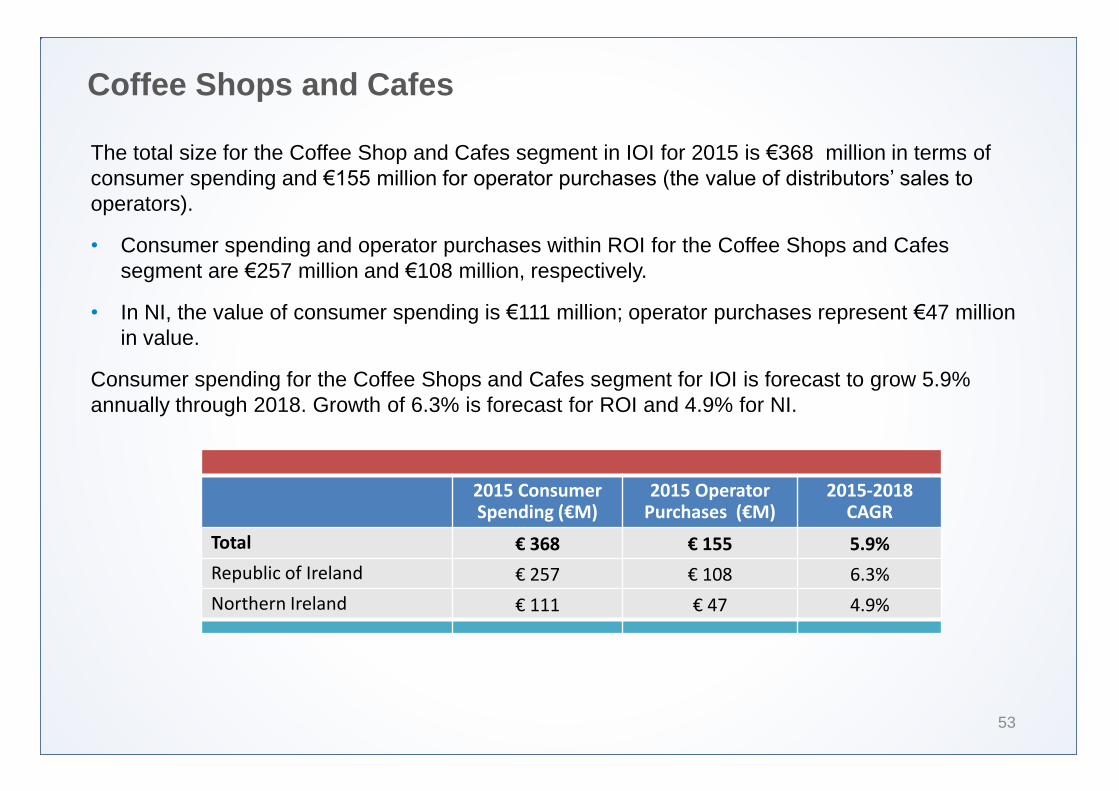
Coffee Shops and Cafes
53
The total size for the Coffee Shop and Cafes segment in IOI for 2015 is €368 million in terms of consumer spending and €155 million for operator purchases (the value of distributors’ sales to
operators).
• Consumer spending and operator purchases within ROI for the Coffee Shops and Cafes segment are €257 million and €108 million, respectively.
• In NI, the value of consumer spending is €111 million; operator purchases represent €47 million in value.
Consumer spending for the Coffee Shops and Cafes segment for IOI is forecast to grow 5.9% annually through 2018. Growth of 6.3% is forecast for ROI and 4.9% for NI.
2015 Consumer Spending (€M)
2015 Operator Purchases (€M)
2015-2018 CAGR
Total € 368 € 155 5.9%
Republic of Ireland € 257 € 108 6.3%
Northern Ireland € 111 € 47 4.9%
Market Drivers for Coffee Shops and Cafes in 2015
54
The following market drivers have been pivotal in terms of impact on the coffee shops and cafe sub-channel in 2015.
1. Operators in the coffee shops and cafes sub-channel are looking more closely at their food menus, which are often limited in nature and do not necessarily extend beyond breakfast occasions. Though still a relatively low share of revenues, operators are increasingly offering food choices to attract consumers during the lunch and dinner dayparts.
2. Beverage preparation and barista/counter staff training play an important role in creating a favorable atmosphere for consumers. As upscale/fast casual operators are similar positioned (in terms of ambiance), this is area where coffee shops and cafes are looking to differentiate even further.
3. Because ingredient information is frequently displayed on menu/chalk boards and via display cases front of house, usage of Irish sourced products is especially effective in the coffee café sub-channel.
4. Impulse purchases account for up to 10% or more of coffee shop and café revenue. Because of this, display cases, promotional prompts and recommendations from staff are important at driving incremental revenue within the coffee shops and cafes channel.
Coffee Shops and Cafes: Last Occasion Snapshot
55 Source: Technomic Irish Marketplace Consumer Survey
41%
13%
12%
11%
6%
5%
4%
4%
4%
4%
Baked goods
Sandwich
Dessert
Other
Appetizer
Beef/Steak
Asian foods
Burger
Chicken
Salad
Top 10 Foods Consumed
39% 33% 16% 14% 4% 3%
Friend(s) Just me Significant other/spouse
Coworker(s) Children (under 18)
Other family
Accompanying Parties
31%
36%
22%
22%
9%
1%
Late night
Evening
Afternoon
Early afternoon
Mid-morning
Morning
Time of Day Visited Day of the Week
83%
31%
Weekend
Weekday
Median Amount Spent Per Person
€5
70%
14%
11%
7%
7%
7%
6%
3%
1%
1%
Coffee
Tea
Bottled Water
Fizzy Drinks
Juice
Milk/Smoothies
Tap Water
Still Drinks
Alcohol
Other
Beverages Consumed
58% 17%
24% 1%
Routine Meal Special Occasion
Impulse Other
Type of Visit
Coffee Shops and Cafes: Last Occasion Snapshot
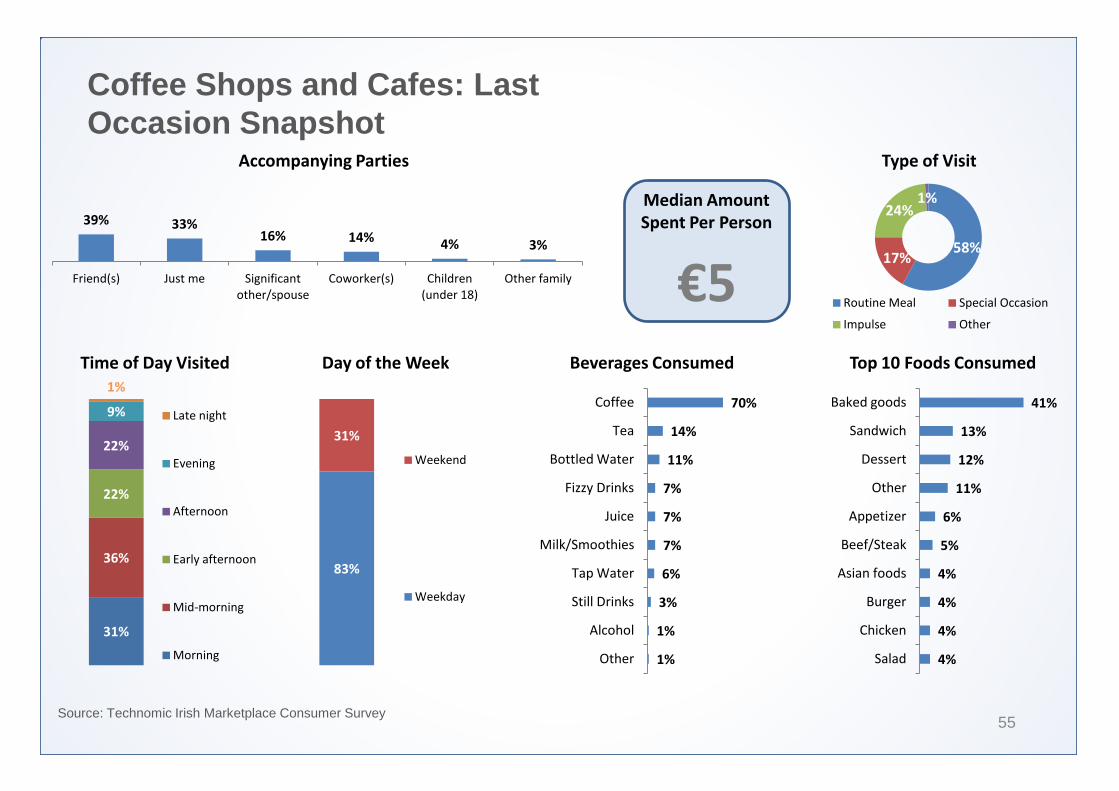
56
Visits to coffee shops and cafes offer consumers quick breakfast solutions on-the-go. Whether guests are looking for hot beverages, pastries, or breakfast sandwiches, coffee shops and cafes fit the bill perfectly.
• More than two-thirds of consumers frequent coffee cafes during the morning daypart. However, 44% visit these cafes in the afternoon also.
• Approximately 83% of consumers visit coffee cafes on a weekday.
• These visits are seen as a routine meal that can be enjoyed either alone or with friends.
• Baked goods (41%) and coffee (70%) by far take the lead as the most ordered items.
• Median amount spent per person is €5.
Trips to coffee shops and cafes are routine; guests typically go during weekday mornings prior to starting their work day.
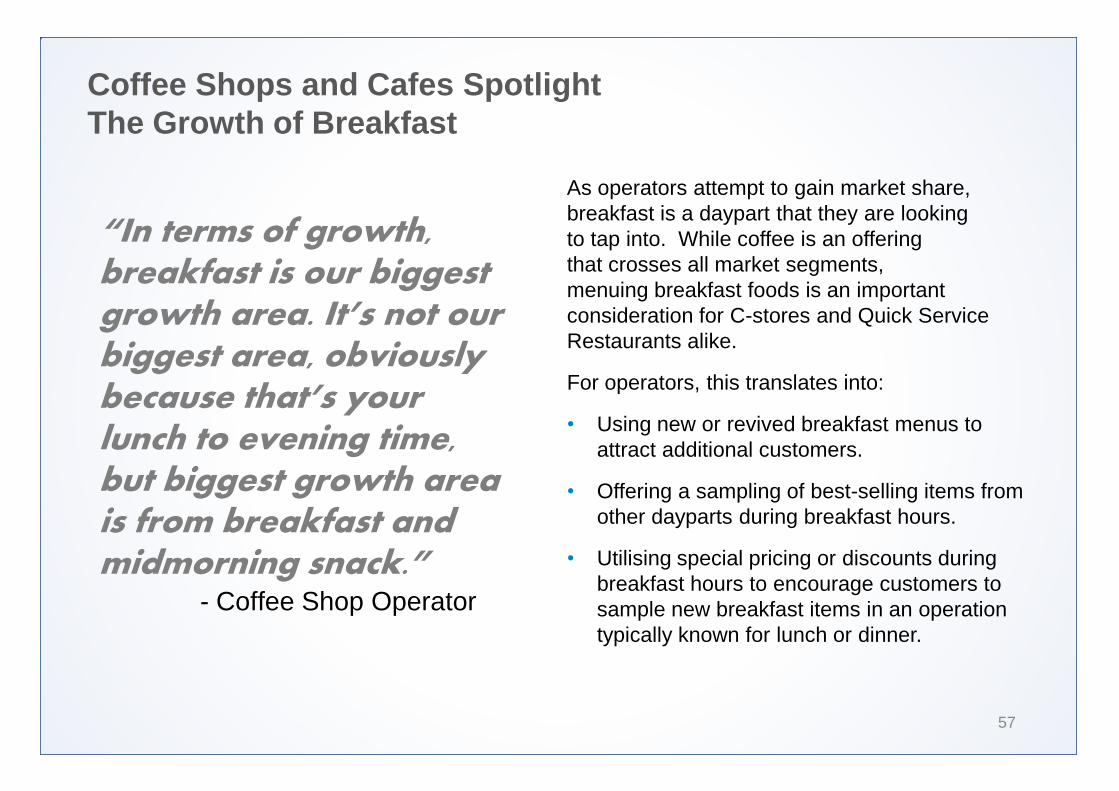
Coffee Shops and Cafes Spotlight The Growth of Breakfast
57
As operators attempt to gain market share, breakfast is a daypart that they are looking to tap into. While coffee is an offering that crosses all market segments, menuing breakfast foods is an important consideration for C-stores and Quick Service Restaurants alike.
For operators, this translates into:
• Using new or revived breakfast menus to attract additional customers.
• Offering a sampling of best-selling items from other dayparts during breakfast hours.
• Utilising special pricing or discounts during breakfast hours to encourage customers to sample new breakfast items in an operation typically known for lunch or dinner.
“In terms of growth, breakfast is our biggest growth area. It’s not our biggest area, obviously because that’s your lunch to evening time, but biggest growth area is from breakfast and midmorning snack.” - Coffee Shop Operator
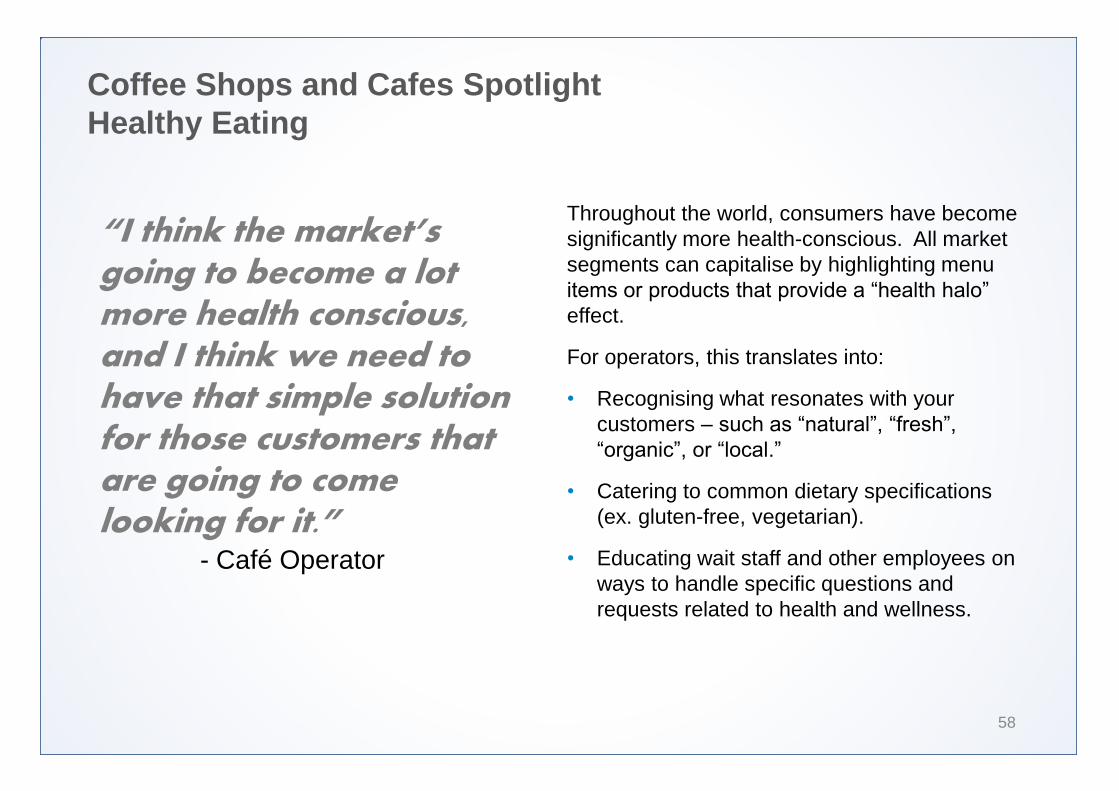
Coffee Shops and Cafes Spotlight Healthy Eating
58
Throughout the world, consumers have become significantly more health-conscious. All market segments can capitalise by highlighting menu items or products that provide a “health halo”
effect.
For operators, this translates into:
• Recognising what resonates with your customers – such as “natural”, “fresh”,
“organic”, or “local.”
• Catering to common dietary specifications (ex. gluten-free, vegetarian).
• Educating wait staff and other employees on ways to handle specific questions and requests related to health and wellness.
“I think the market’s going to become a lot more health conscious, and I think we need to have that simple solution for those customers that are going to come looking for it.” - Café Operator
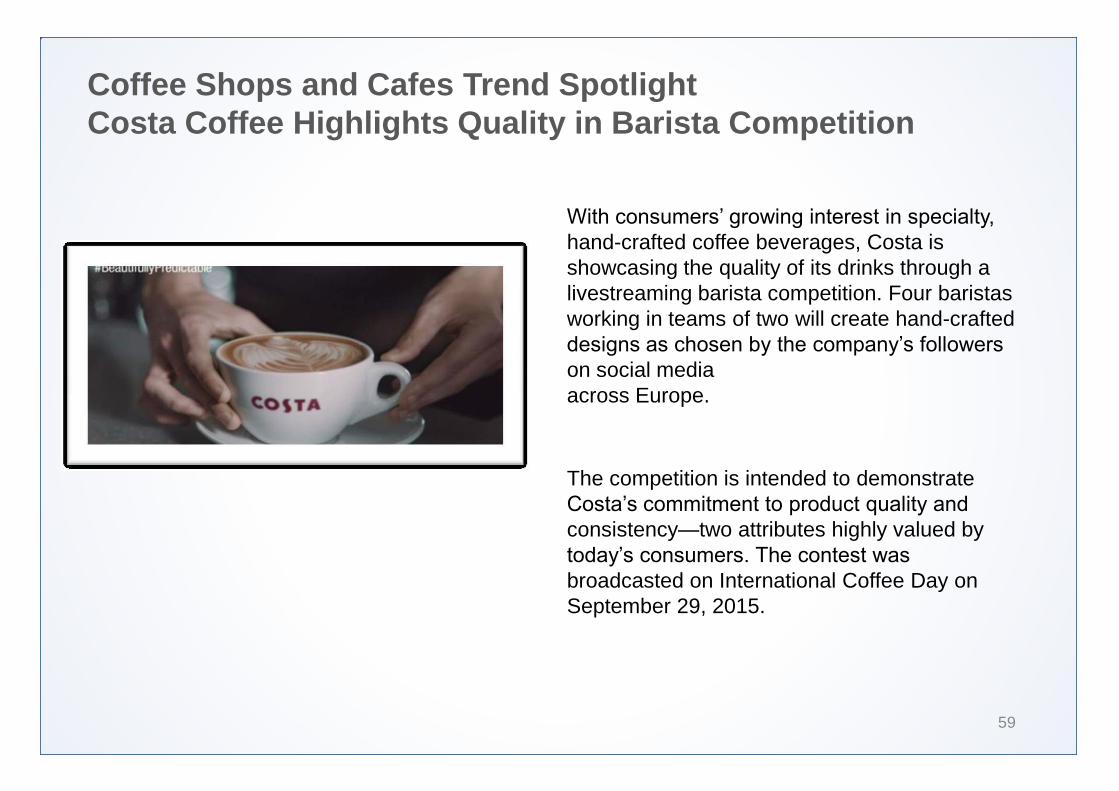
Coffee Shops and Cafes Trend Spotlight Costa Coffee Highlights Quality in Barista Competition
59
With consumers’ growing interest in specialty,
hand-crafted coffee beverages, Costa is showcasing the quality of its drinks through a livestreaming barista competition. Four baristas working in teams of two will create hand-crafted designs as chosen by the company’s followers
on social media across Europe.
The competition is intended to demonstrate Costa’s commitment to product quality and
consistency—two attributes highly valued by today’s consumers. The contest was
broadcasted on International Coffee Day on September 29, 2015.

SECTION
Food-to-Go Occasions Occasions, Trends and Market Drivers
Food-to-Go Occasions
61
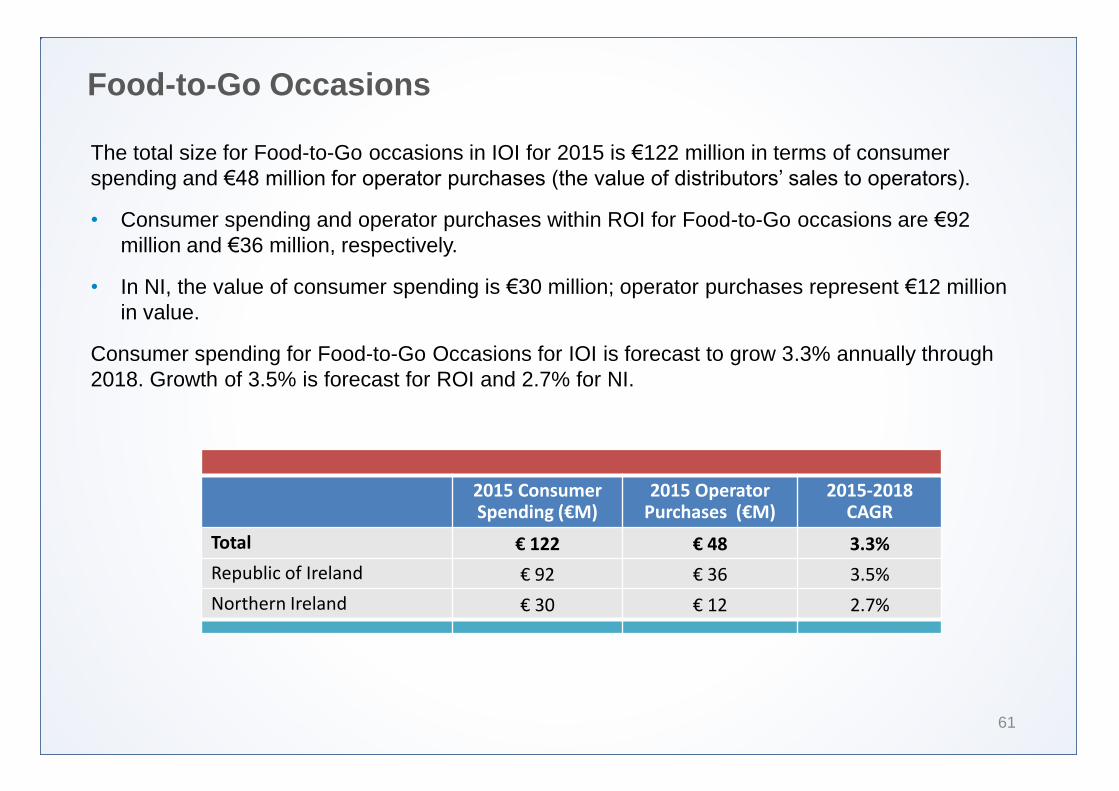
The total size for Food-to-Go occasions in IOI for 2015 is €122 million in terms of consumer spending and €48 million for operator purchases (the value of distributors’ sales to operators).
• Consumer spending and operator purchases within ROI for Food-to-Go occasions are €92 million and €36 million, respectively.
• In NI, the value of consumer spending is €30 million; operator purchases represent €12 million in value.
Consumer spending for Food-to-Go Occasions for IOI is forecast to grow 3.3% annually through 2018. Growth of 3.5% is forecast for ROI and 2.7% for NI.
2015 Consumer Spending (€M)
2015 Operator Purchases (€M)
2015-2018 CAGR
Total € 122 € 48 3.3%
Republic of Ireland € 92 € 36 3.5%
Northern Ireland € 30 € 12 2.7%
Market Drivers for Food-to-Go in 2015
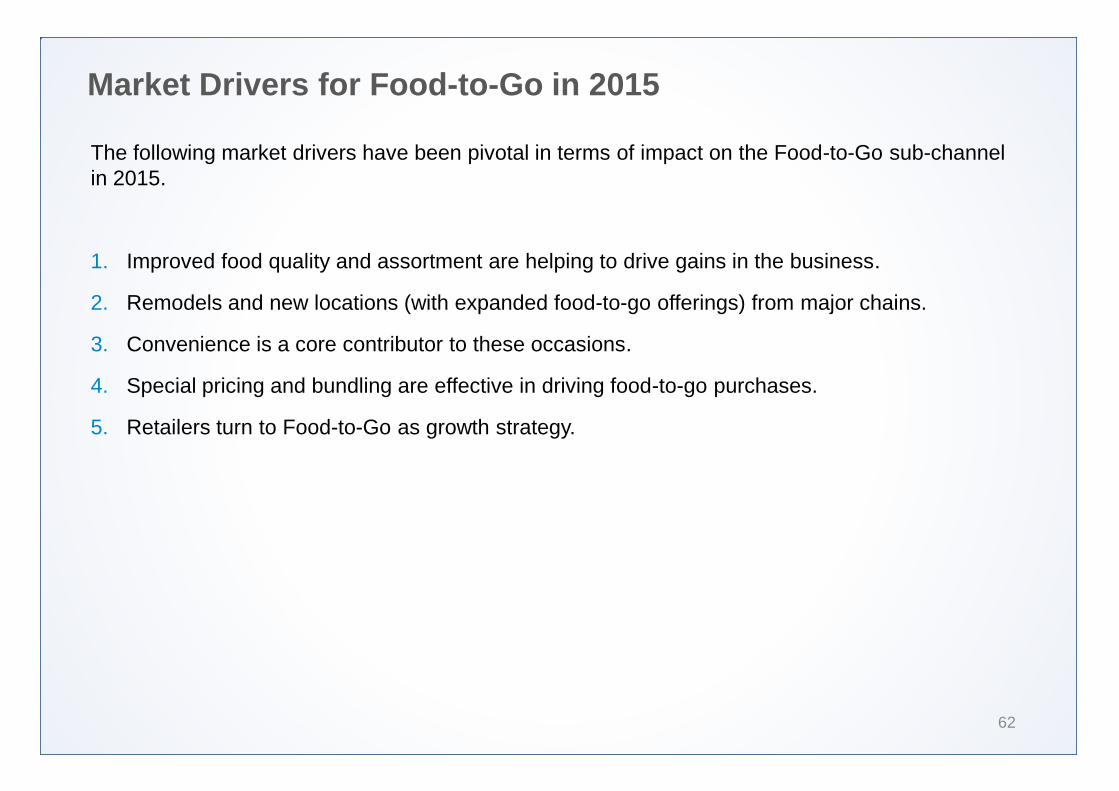
62
The following market drivers have been pivotal in terms of impact on the Food-to-Go sub-channel in 2015.
1. Improved food quality and assortment are helping to drive gains in the business.
2. Remodels and new locations (with expanded food-to-go offerings) from major chains.
3. Convenience is a core contributor to these occasions.
4. Special pricing and bundling are effective in driving food-to-go purchases.
5. Retailers turn to Food-to-Go as growth strategy.
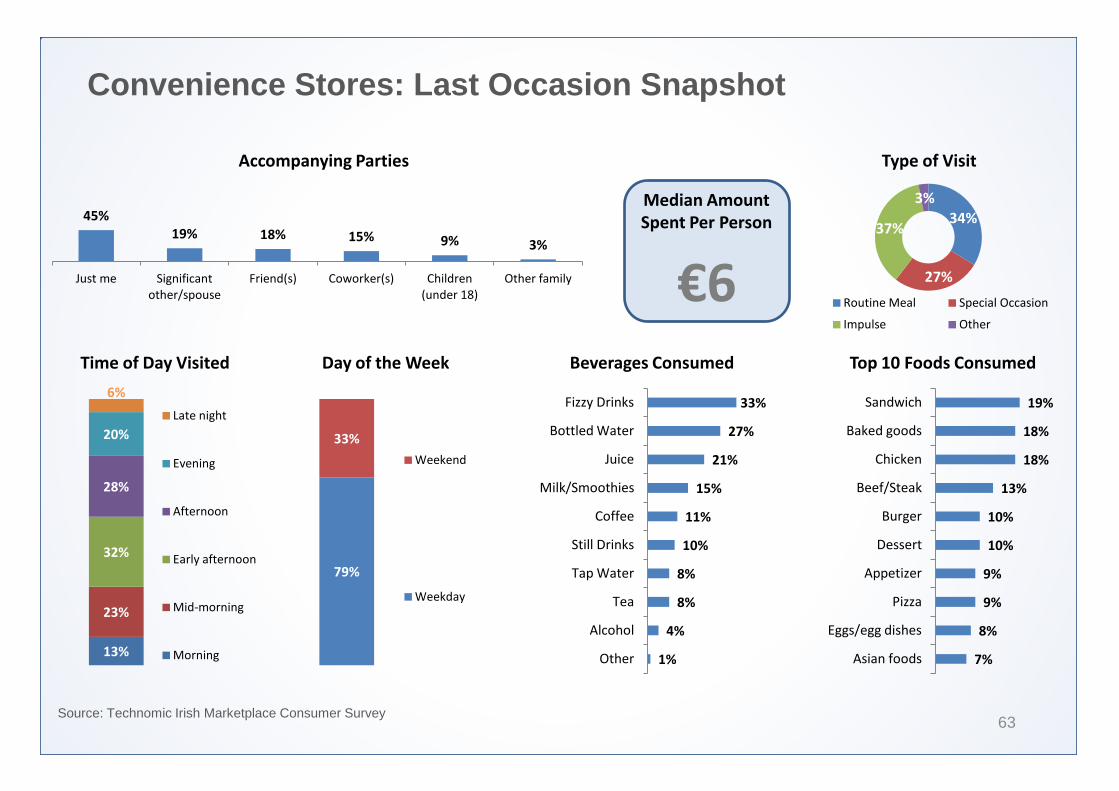
Convenience Stores: Last Occasion Snapshot
63 Source: Technomic Irish Marketplace Consumer Survey
19%
18%
18%
13%
10%
10%
9%
9%
8%
7%
Sandwich
Baked goods
Chicken
Beef/Steak
Burger
Dessert
Appetizer
Pizza
Eggs/egg dishes
Asian foods
Top 10 Foods Consumed
45% 19% 18% 15% 9% 3%
Just me Significant other/spouse
Friend(s) Coworker(s) Children (under 18)
Other family
Accompanying Parties
13%
23%
32%
28%
20%
6%
Late night
Evening
Afternoon
Early afternoon
Mid-morning
Morning
Time of Day Visited Day of the Week
79%
33%
Weekend
Weekday
Median Amount Spent Per Person
€6
33%
27%
21%
15%
11%
10%
8%
8%
4%
1%
Fizzy Drinks
Bottled Water
Juice
Milk/Smoothies
Coffee
Still Drinks
Tap Water
Tea
Alcohol
Other
Beverages Consumed
34%
27%
37%
3%
Routine Meal Special Occasion
Impulse Other
Type of Visit
Convenience Stores: Last Occasion Snapshot
64
Convenience stores fill the demand for easy and portable meal solutions, such as sandwiches or baked goods. Trips to convenient stores are either routine or impulse stops by consumers.
• Consumers tend to visit convenient stores alone, either as an impulse or routine meal.
• Nearly 80% of customers visit convenient stores on weekdays.
• Sandwiches, baked goods, and chicken are common meal items in this segment.
• Most shoppers opt for fizzy drinks (33%), bottled water (27%), or juices (21%) when selecting a beverage.
• Median amount spent per person is €6.
Convenient stores are well positioned to respond to the need for quick, grab-and-go items.
Petrol Stations/Forecourt Convenience Stores Last Occasion Snapshot
65 Source: Technomic Irish Marketplace Consumer Survey
18%
18%
15%
10%
10%
10%
8%
8%
7%
6%
Beef/Steak
Sandwich
Baked goods
Appetizer
Burger
Eggs/egg dishes
Chicken
Dessert
Asian foods
Pizza
Top 10 Foods Consumed
45% 20% 17% 16% 10% 3%
Just me Coworker(s) Significant other/spouse
Friend(s) Children (under 18)
Other family
Accompanying Parties
19%
28%
30%
21%
16%
8% Late night
Evening
Afternoon
Early afternoon
Mid-morning
Morning
Time of Day Visited Day of the Week
76%
34%
Weekend
Weekday
Median Amount Spent Per Person
€6
26%
22%
17%
15%
13%
12%
8%
6%
3%
3%
Fizzy Drinks
Bottled Water
Juice
Milk/Smoothies
Coffee
Still Drinks
Tea
Tap Water
Alcohol
Other
Beverages Consumed
34%
30%
33%
2%
Routine Meal Special Occasion
Impulse Other
Type of Visit
Petrol Stations/Forecourt Convenience Stores Last Occasion Snapshot
66
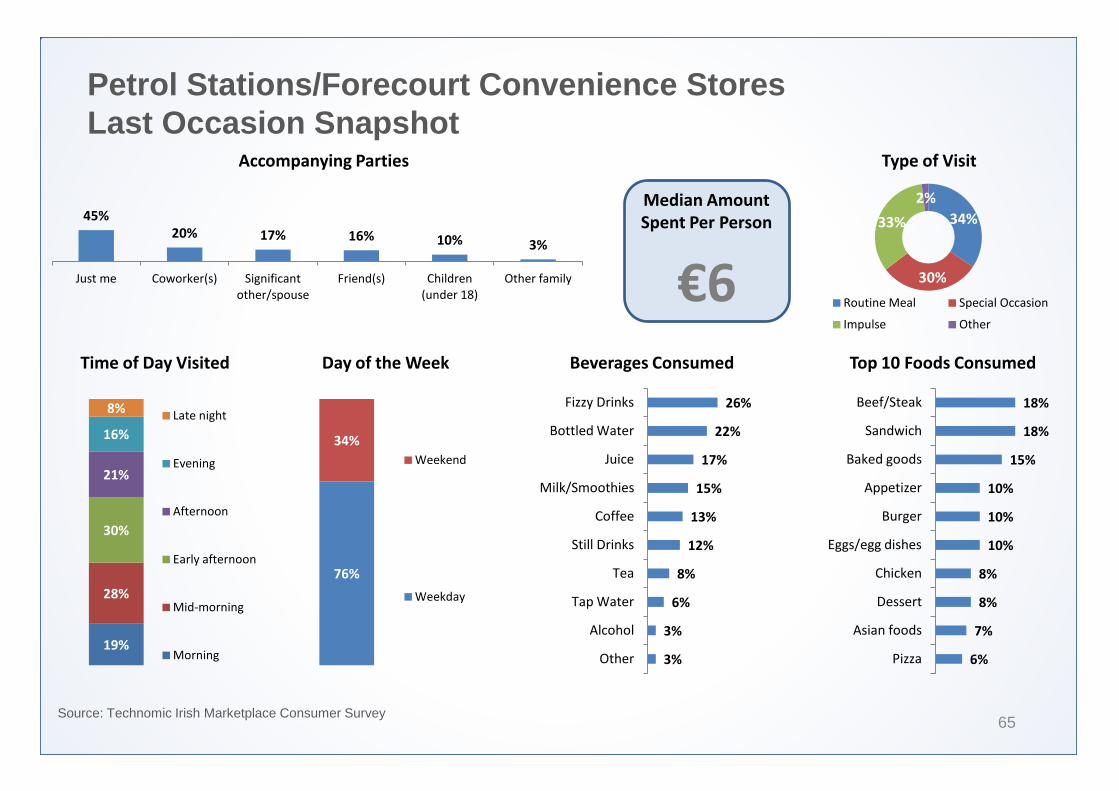
Petrol stations have historically not been seen as a food destination; however, guests today can usually grab a quick snack or beverage during routine visits.
• Consumers tend to visit convenient stores alone, either as an impulse or routine meal.
• Approximately three-quarters (76%) of shoppers visit petrol stations during weekdays.
• Fizzy drinks (26%) and bottled waters (22%) are popular beverage choices.
• Sandwiches, and baked goods make up the top three food items purchased at petrol stations.
• Median amount spent per person is €6.
• Consumers tend to visit petrol stations either in the morning or afternoon.
Petrol stations offer consumers convenient, low-price meal solutions.

Supermarket Prepared Foods (front of store) Last Occasion Snapshot
67 Source: Technomic Irish Marketplace Consumer Survey
25%
22%
19%
17%
17%
16%
16%
16%
14%
13%
Chicken
Baked goods
Salad
Pizza
Sandwich
Beef/Steak
Dessert
Pasta
Burger
Eggs/egg dishes
Top 10 Foods Consumed
43% 26%
13% 11% 10% 6%
Just me Significant other/spouse
Friend(s) Coworker(s) Children (under 18)
Other family
Accompanying Parties
10%
18%
30%
31%
24%
5%
Late night
Evening
Afternoon
Early afternoon
Mid-morning
Morning
Time of Day Visited Day of the Week
71%
36% Weekend
Weekday
Median Amount Spent Per Person
€10
29%
25%
25%
15%
14%
13%
12%
10%
6%
2%
Juice
Bottled Water
Fizzy Drinks
Milk/Smoothies
Tea
Still Drinks
Coffee
Tap Water
Alcohol
Other
Beverages Consumed
36%
24%
38%
3%
Routine Meal Special Occasion
Impulse Other
Type of Visit
Supermarket Prepared Foods (front of store) Last Occasion Snapshot
68
Supermarket prepared foods are becoming increasingly popular, especially for individuals seeking quick meal solutions during the afternoon and evening dayparts.
• The majority of customers (61%) purchase supermarket prepared foods during the lunch daypart. Slightly less than a quarter of guests visit in the evening.
• Most consumers view these foods as an impulse or routine meal.
• Popular beverage items include juices, bottled water, and fizzy drinks.
• Popular food items include chicken (25%), baked goods (22%), and salads (19%).
• Consumers mainly purchase supermarket prepared foods for individual meals as opposed to family meals.
• Median amount spent per person is €10.
There continues to be demand for on-the-go, convenient options and guests are beginning to view these meals as routine.
Food-to-Go Trend Spotlight Grab-and-Go Emphasis
69
Today’s consumer is on-the-go and C-stores must increasingly market their offerings with this in mind. In a C-store especially, speed is of the essence and consumers look for a quick shopping experience.
For the C-store channel, this translates into:
• Having a variety of self-serve options available - coffee, sandwiches, salads, pastries.
• Focusing on the portability of the food and drink options and recognising they will likely be eaten in transit.
• Streamlining ordering options onto meal deals that are easy for consumers to choose from (e.g. soup, roll, and a drink).
“You know, we still see ourselves driven towards that ‘Transumer ‘,,, the customer who’s on the go, dashboard dining.” - C-Store Operator
Food-to-Go Trend Spotlight Beverage Transitions
70
C-store operators are reporting significant increases in beverage sales and quality. The ever-changing marketplace has led to a emphasis on a strong beverage programme.
For the C-store channel, this translates into:
• Capitalising on better-for-you beverages such as coconut water, natural juices and packaged smoothies.
• Providing a robust coffee offering.
• Securing more locally-produced and craft beers to enhance a standard beer selection.
“I think the beverage business is really flipped on its head. I definitely see a trend where healthy beverages are definitely coming.” - C-Store Operator
Food-to-Go Trend Spotlight Channel Blurring
71
Operators recognise that competition not only comes from restaurants within their same channel. C-stores are in competition for QSRs and meals from grocery stores alike. Consumers are faced with options from many directions.
For operators, this translates into:
• Constantly evolving operations to keep up with the changing wants and needs of today’s
consumer.
• Having a differentiator that makes your operation stand out to consumers.
• Understanding that non-traditional meal solutions for consumers are now becoming commonplace; competition is everywhere.
“Where we're losing our customers is to a variety of competitors. There are more fresh food options from restaurants and with food to go.” - Food Retailer
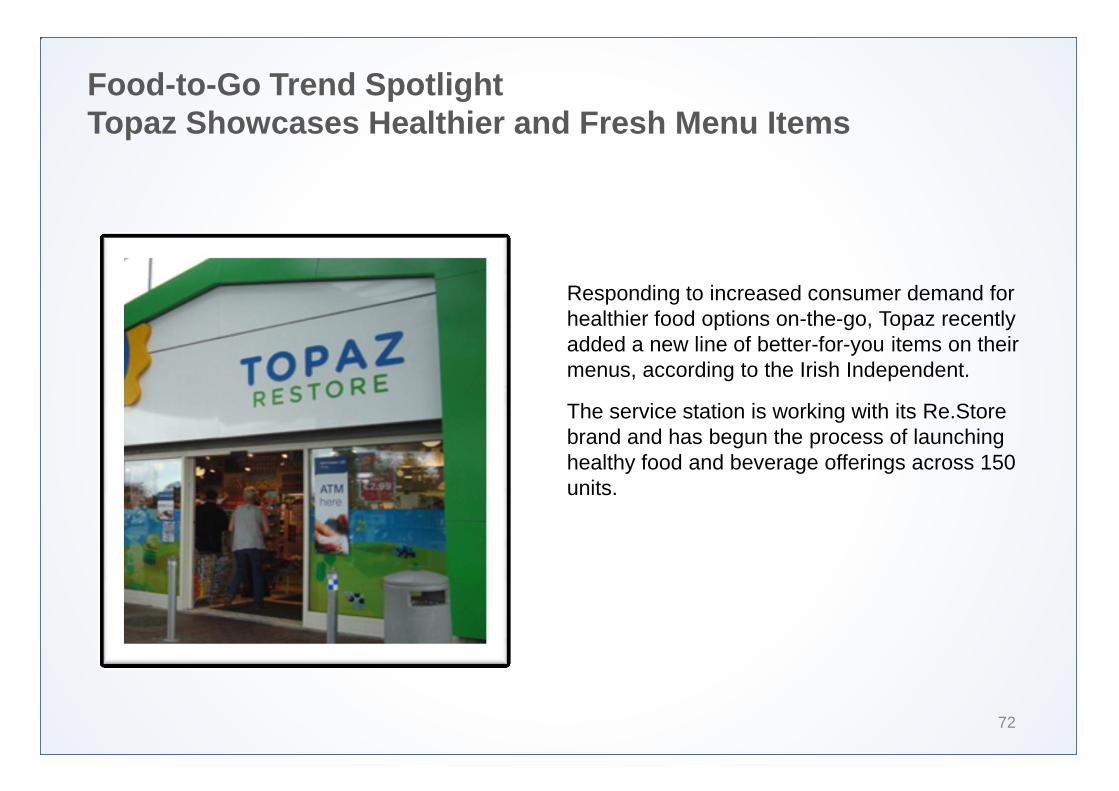
Food-to-Go Trend Spotlight Topaz Showcases Healthier and Fresh Menu Items
72
Responding to increased consumer demand for healthier food options on-the-go, Topaz recently added a new line of better-for-you items on their menus, according to the Irish Independent.
The service station is working with its Re.Store brand and has begun the process of launching healthy food and beverage offerings across 150 units.
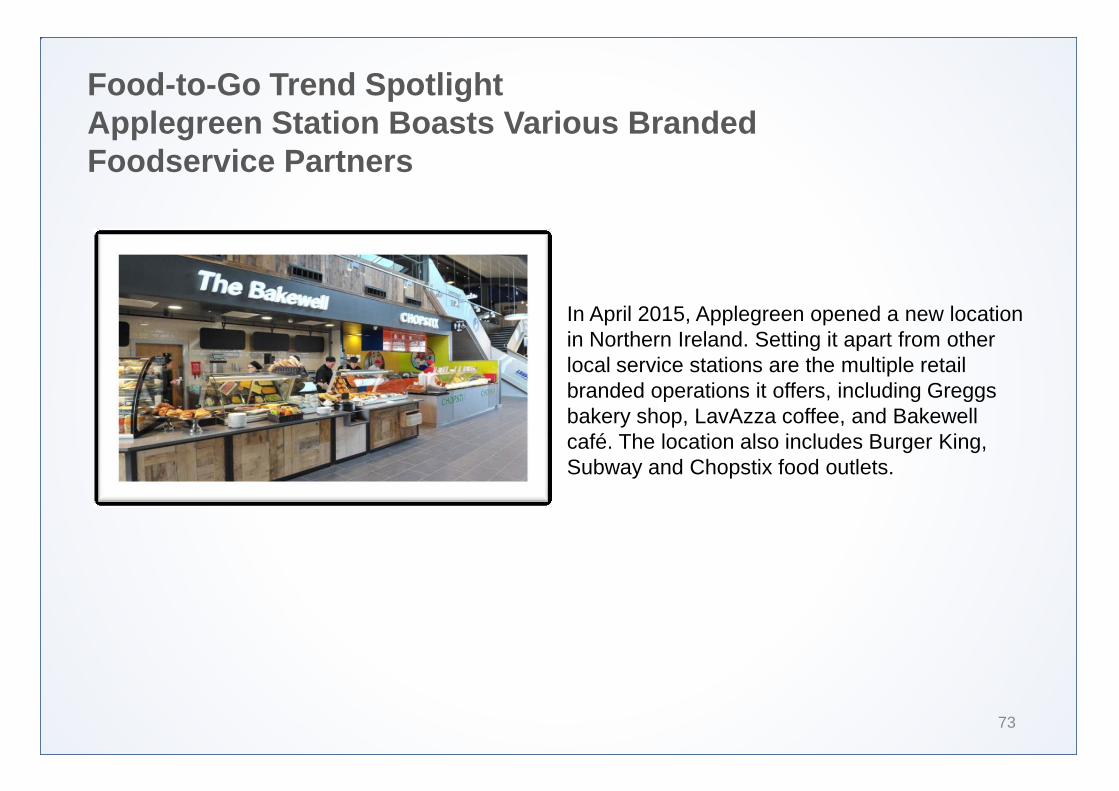
Food-to-Go Trend Spotlight Applegreen Station Boasts Various Branded Foodservice Partners
73
In April 2015, Applegreen opened a new location in Northern Ireland. Setting it apart from other local service stations are the multiple retail branded operations it offers, including Greggs bakery shop, LavAzza coffee, and Bakewell café. The location also includes Burger King, Subway and Chopstix food outlets.
SECTION
Additional Consumer Survey findings 3
About the Research
75
Technomic’s consumer research was conducted in September 2015 and included 1,000
respondents from IOI who were active in the quick service and/or food-to-go markets. The sample of 1,000 respondents breaks down as follows:
• Male (n=502) / female (n=498)
• Under age 35 (n=340) / age 35 to 54 (n=380) / 55 and older (n=280)
• Republic of Ireland (n=697) / Northern Ireland (n=303)
• Urban (n=700) / Rural (n=300)
The full respondent base composition is presented in Appendix 2.
Q1. Think about the last 7 days in which you visited a restaurant or foodservice operation. How many times did you visit each of the following venues?
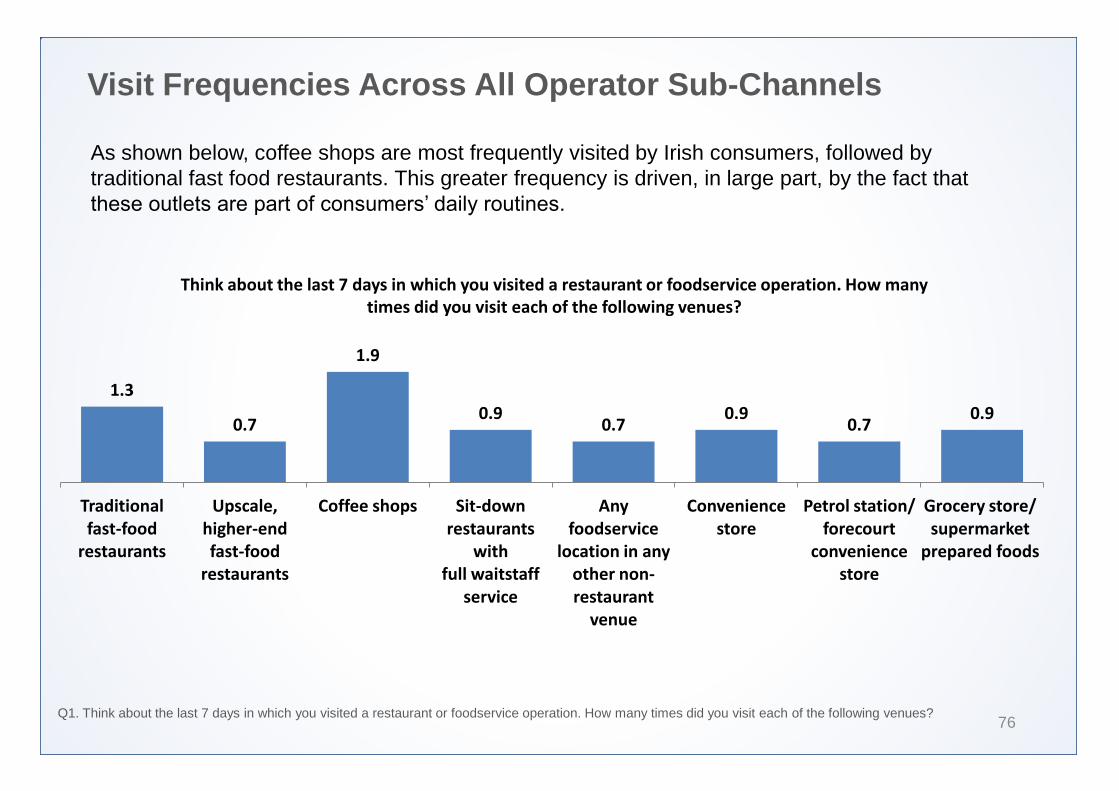
Visit Frequencies Across All Operator Sub-Channels
76
As shown below, coffee shops are most frequently visited by Irish consumers, followed by traditional fast food restaurants. This greater frequency is driven, in large part, by the fact that these outlets are part of consumers’ daily routines.
Q1. Think about the last 7 days in which you visited a restaurant or foodservice operation. How many times did you visit each of the following venues?
1.3
0.7
1.9
0.9 0.7
0.9 0.7
0.9
Traditional fast-food
restaurants
Upscale, higher-end fast-food
restaurants
Coffee shops Sit-down restaurants
with full waitstaff
service
Any foodservice
location in any other non-restaurant
venue
Convenience store
Petrol station/ forecourt
convenience store
Grocery store/ supermarket
prepared foods
Think about the last 7 days in which you visited a restaurant or foodservice operation. How many times did you visit each of the following venues?
Shifts in Patronage Across All Operator Sub-Channels
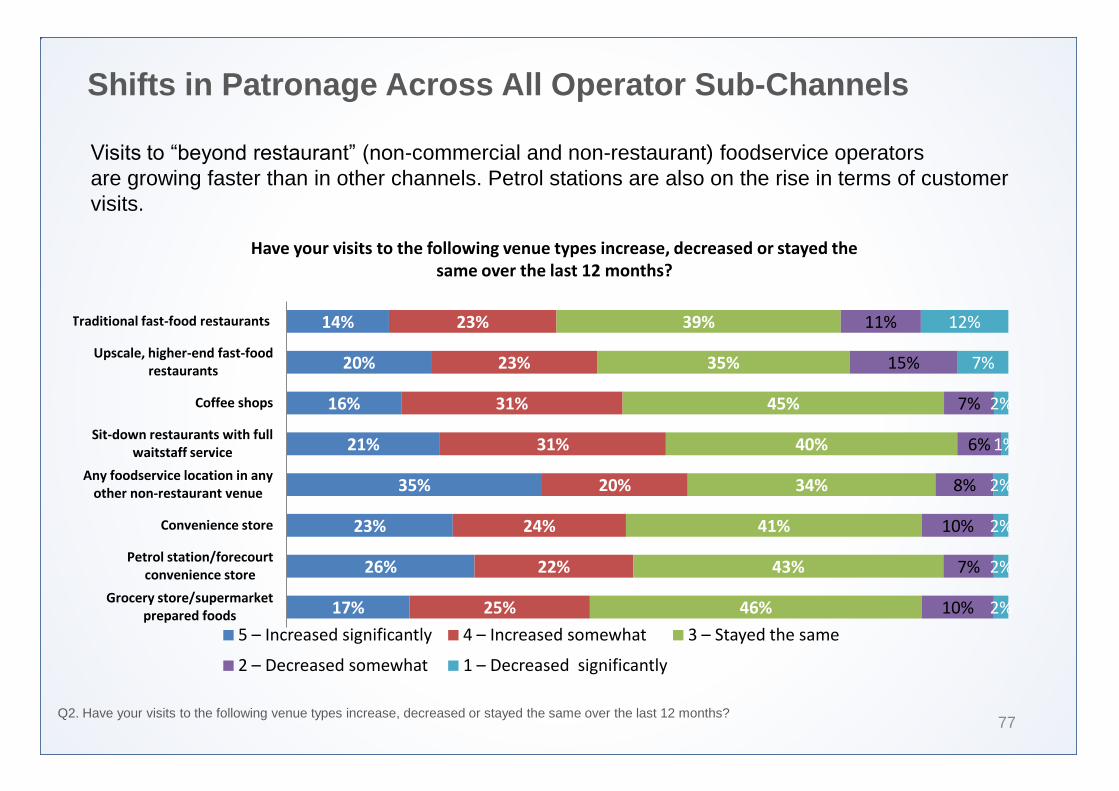
77
Visits to “beyond restaurant” (non-commercial and non-restaurant) foodservice operators are growing faster than in other channels. Petrol stations are also on the rise in terms of customer visits.
Q2. Have your visits to the following venue types increase, decreased or stayed the same over the last 12 months?
14%
20%
16%
21%
35%
23%
26%
17%
23%
23%
31%
31%
20%
24%
22%
25%
39%
35%
45%
40%
34%
41%
43%
46%
11%
15%
7%
6%
8%
10%
7%
10%
12%
7%
2%
1%
2%
2%
2%
2%
Traditional fast-food restaurants
Upscale, higher-end fast-food restaurants
Coffee shops
Sit-down restaurants with full waitstaff service
Any foodservice location in any other non-restaurant venue
Convenience store
Petrol station/forecourt convenience store
Grocery store/supermarket prepared foods
5 – Increased significantly 4 – Increased somewhat 3 – Stayed the same
2 – Decreased somewhat 1 – Decreased significantly
Have your visits to the following venue types increase, decreased or stayed the same over the last 12 months?
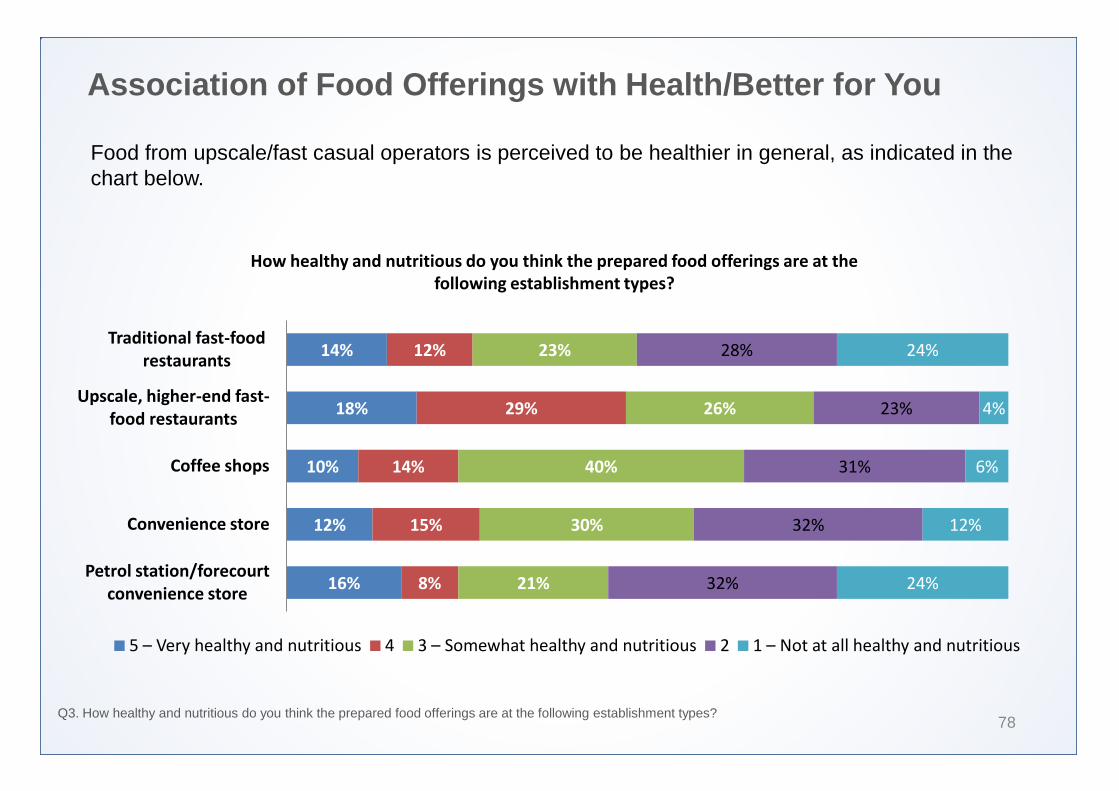
Association of Food Offerings with Health/Better for You
78
Food from upscale/fast casual operators is perceived to be healthier in general, as indicated in the chart below.
Q3. How healthy and nutritious do you think the prepared food offerings are at the following establishment types?
14%
18%
10%
12%
16%
12%
29%
14%
15%
8%
23%
26%
40%
30%
21%
28%
23%
31%
32%
32%
24%
4%
6%
12%
24%
Traditional fast-food restaurants
Upscale, higher-end fast-food restaurants
Coffee shops
Convenience store
Petrol station/forecourt convenience store
5 – Very healthy and nutritious 4 3 – Somewhat healthy and nutritious 2 1 – Not at all healthy and nutritious
How healthy and nutritious do you think the prepared food offerings are at the following establishment types?
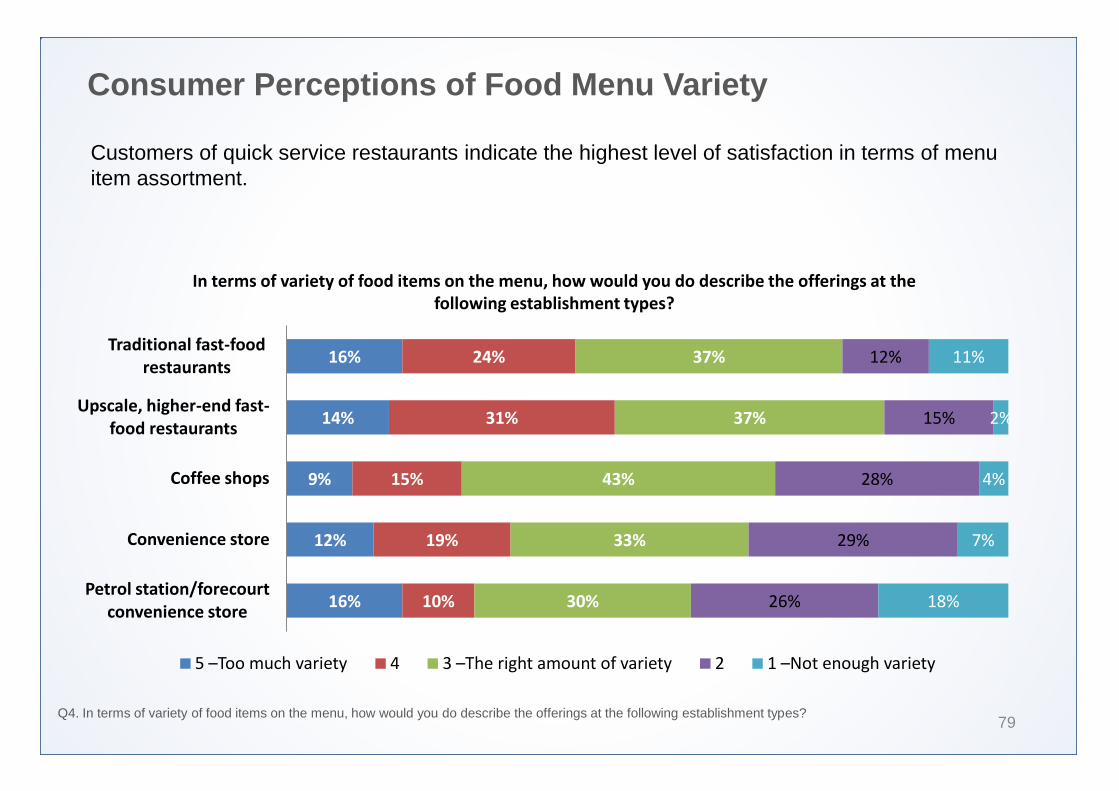
Consumer Perceptions of Food Menu Variety
79
Customers of quick service restaurants indicate the highest level of satisfaction in terms of menu item assortment.
Q4. In terms of variety of food items on the menu, how would you do describe the offerings at the following establishment types?
16%
14%
9%
12%
16%
24%
31%
15%
19%
10%
37%
37%
43%
33%
30%
12%
15%
28%
29%
26%
11%
2%
4%
7%
18%
Traditional fast-food restaurants
Upscale, higher-end fast-food restaurants
Coffee shops
Convenience store
Petrol station/forecourt convenience store
5 –Too much variety 4 3 –The right amount of variety 2 1 –Not enough variety
In terms of variety of food items on the menu, how would you do describe the offerings at the following establishment types?
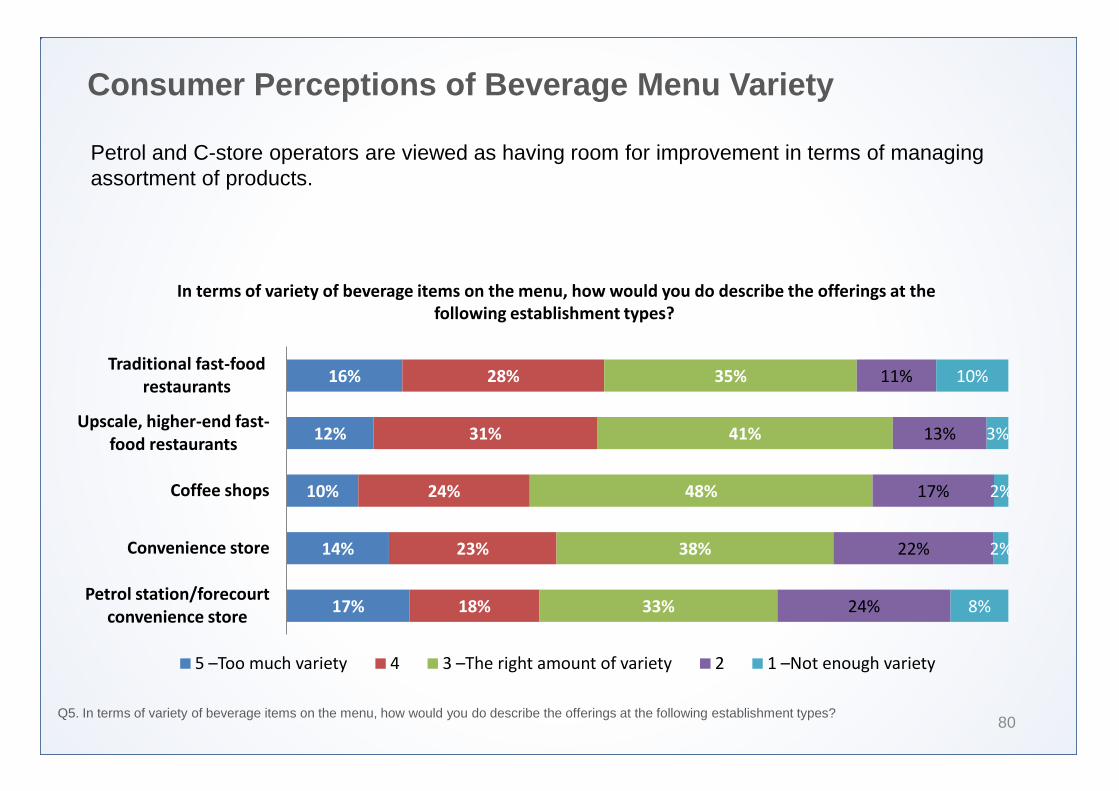
Consumer Perceptions of Beverage Menu Variety
80
Petrol and C-store operators are viewed as having room for improvement in terms of managing assortment of products.
Q5. In terms of variety of beverage items on the menu, how would you do describe the offerings at the following establishment types?
16%
12%
10%
14%
17%
28%
31%
24%
23%
18%
35%
41%
48%
38%
33%
11%
13%
17%
22%
24%
10%
3%
2%
2%
8%
Traditional fast-food restaurants
Upscale, higher-end fast-food restaurants
Coffee shops
Convenience store
Petrol station/forecourt convenience store
5 –Too much variety 4 3 –The right amount of variety 2 1 –Not enough variety
In terms of variety of beverage items on the menu, how would you do describe the offerings at the following establishment types?
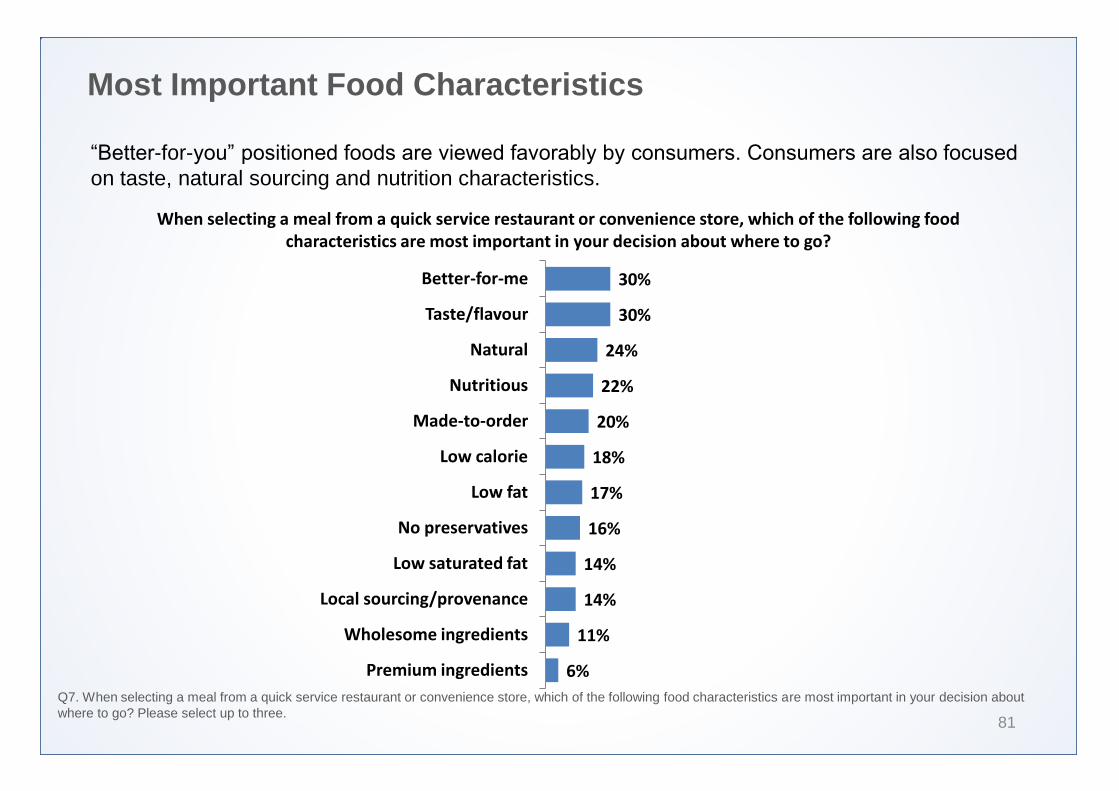
Most Important Food Characteristics
81
“Better-for-you” positioned foods are viewed favorably by consumers. Consumers are also focused
on taste, natural sourcing and nutrition characteristics.
Q7. When selecting a meal from a quick service restaurant or convenience store, which of the following food characteristics are most important in your decision about where to go? Please select up to three.
30%
30%
24%
22%
20%
18%
17%
16%
14%
14%
11%
6%
Better-for-me
Taste/flavour
Natural
Nutritious
Made-to-order
Low calorie
Low fat
No preservatives
Low saturated fat
Local sourcing/provenance
Wholesome ingredients
Premium ingredients
When selecting a meal from a quick service restaurant or convenience store, which of the following food characteristics are most important in your decision about where to go?
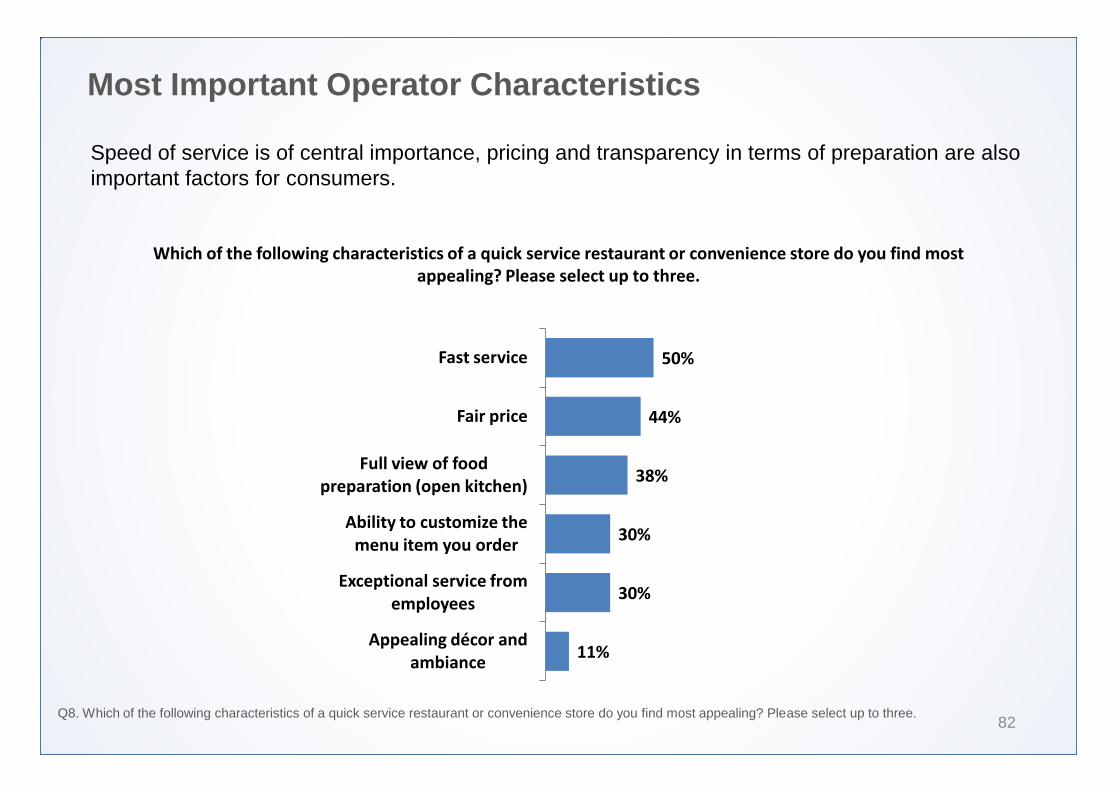
Most Important Operator Characteristics
82
Speed of service is of central importance, pricing and transparency in terms of preparation are also important factors for consumers.
Q8. Which of the following characteristics of a quick service restaurant or convenience store do you find most appealing? Please select up to three.
50%
44%
38%
30%
30%
11%
Fast service
Fair price
Full view of food preparation (open kitchen)
Ability to customize the menu item you order
Exceptional service from employees
Appealing décor and ambiance
Which of the following characteristics of a quick service restaurant or convenience store do you find most appealing? Please select up to three.
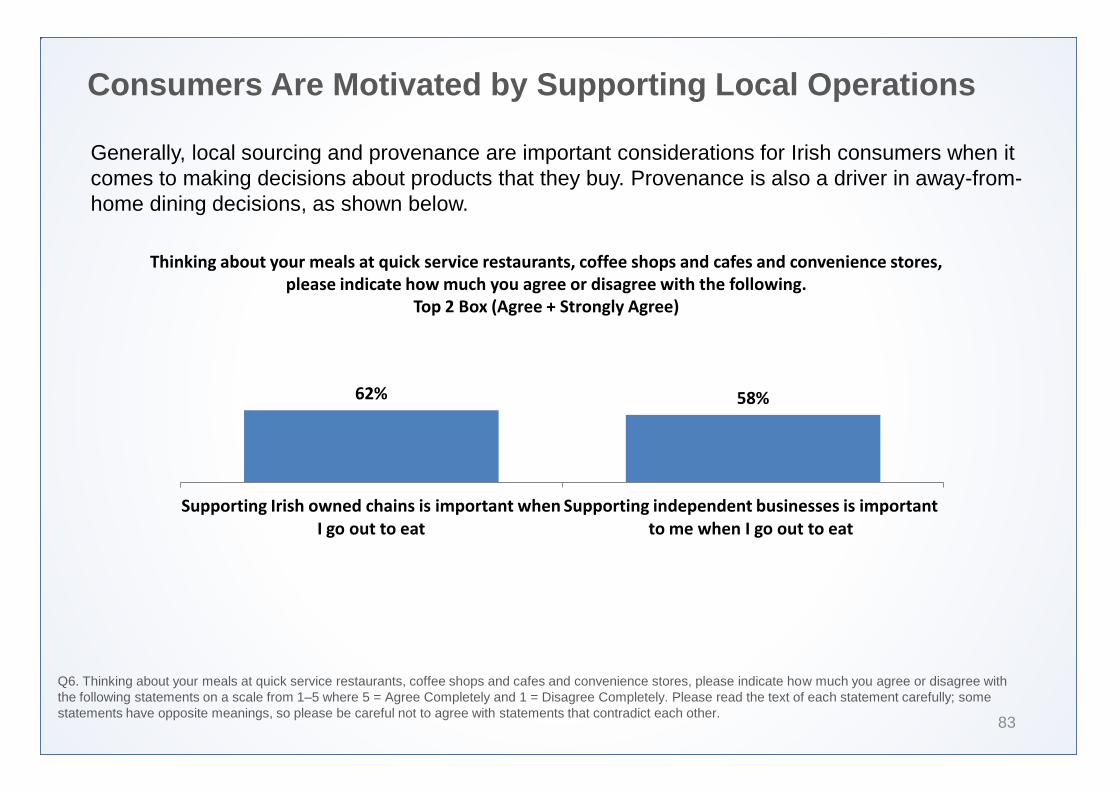
Consumers Are Motivated by Supporting Local Operations
83
Generally, local sourcing and provenance are important considerations for Irish consumers when it comes to making decisions about products that they buy. Provenance is also a driver in away-from-home dining decisions, as shown below.
Q6. Thinking about your meals at quick service restaurants, coffee shops and cafes and convenience stores, please indicate how much you agree or disagree with the following statements on a scale from 1–5 where 5 = Agree Completely and 1 = Disagree Completely. Please read the text of each statement carefully; some statements have opposite meanings, so please be careful not to agree with statements that contradict each other.
62% 58%
Supporting Irish owned chains is important when I go out to eat
Supporting independent businesses is important to me when I go out to eat
Thinking about your meals at quick service restaurants, coffee shops and cafes and convenience stores, please indicate how much you agree or disagree with the following.
Top 2 Box (Agree + Strongly Agree)
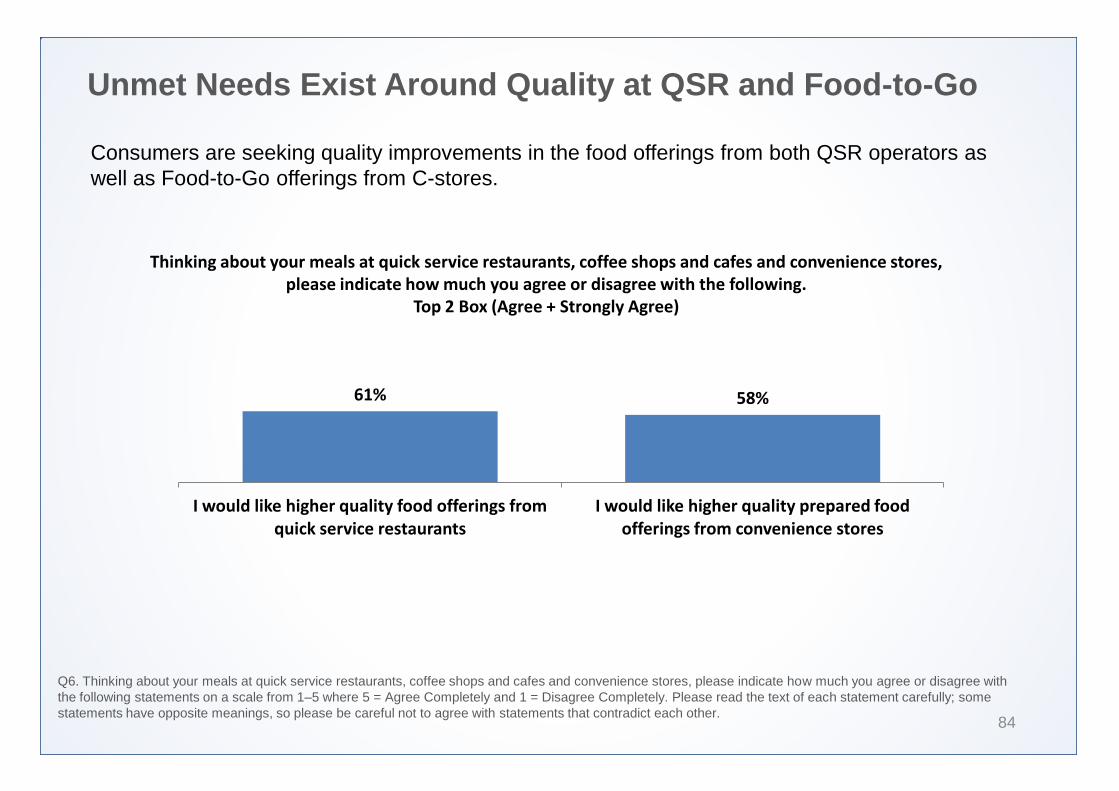
Unmet Needs Exist Around Quality at QSR and Food-to-Go
84
Consumers are seeking quality improvements in the food offerings from both QSR operators as well as Food-to-Go offerings from C-stores.
Q6. Thinking about your meals at quick service restaurants, coffee shops and cafes and convenience stores, please indicate how much you agree or disagree with the following statements on a scale from 1–5 where 5 = Agree Completely and 1 = Disagree Completely. Please read the text of each statement carefully; some statements have opposite meanings, so please be careful not to agree with statements that contradict each other.
61% 58%
I would like higher quality food offerings from quick service restaurants
I would like higher quality prepared food offerings from convenience stores
Thinking about your meals at quick service restaurants, coffee shops and cafes and convenience stores, please indicate how much you agree or disagree with the following.
Top 2 Box (Agree + Strongly Agree)
Consumers Shifting Toward Fresh, Ethnic and Handhelds
85
Consumers indicate that their away from home purchasing has shifted in recent years, with growth in the frequency of handheld and ethnic items. Consumers also indicate that they’ve increased the
number of meal occasions that incorporate fresh ingredients. This is important for QSR and food-to-go operators to be aware of and to take into consideration for menu and concept design work.
Q6. Thinking about your meals at quick service restaurants, coffee shops and cafes and convenience stores, please indicate how much you agree or disagree with the following statements on a scale from 1–5 where 5 = Agree Completely and 1 = Disagree Completely. Please read the text of each statement carefully; some statements have opposite meanings, so please be careful not to agree with statements that contradict each other.
56% 51% 52%
Compared to two years ago, I am eating more meals with fresh
ingredients when I go out to eat
Compared to two years ago, I am more interested in getting ethnic
foods when I go out to eat
Compared to two years ago, I am ordering more handheld items
when I go out to eat
Thinking about your meals at quick service restaurants, coffee shops and cafes and convenience stores, please indicate how much you agree or disagree with the following.
Top 2 Box (Agree + Strongly Agree)
Premium Coffee is a Key Consideration for Many Consumers
86
Respondents in NI are more likely to say that premium coffee is an important occasion driver—thought more than half of respondents from both NI and ROI indicate that premium coffee is an important factor for them.
Q6. Thinking about your meals at quick service restaurants, coffee/tea cafes and convenience stores, please indicate how much you agree or disagree with the following statements on a scale from 1–5 where 5 = Agree Completely and 1 = Disagree Completely. Please read the text of each statement carefully; some statements have opposite meanings, so please be careful not to agree with statements that contradict each other.
Thinking about your meals at quick service restaurants, coffee shops and cafes and convenience stores, please indicate how much you agree or disagree with the following.
Top 2 Box (Agree + Strongly Agree)
58%
Being able to find premium coffee is important to me
65% 55%
Northern Ireland Republic of Ireland
Transparency is Most Important to Consumers Aged 25 to 44
87
Those aged 25 to 44 are most concerned with transparency when going out to eat. This is a core consumer group for quick service operators, especially because many of these consumers have families with young children.
Q6. Thinking about your meals at quick service restaurants, coffee/tea cafes and convenience stores, please indicate how much you agree or disagree with the following statements on a scale from 1–5 where 5 = Agree Completely and 1 = Disagree Completely. Please read the text of each statement carefully; some statements have opposite meanings, so please be careful not to agree with statements that contradict each other.
Thinking about your meals at quick service restaurants, coffee shops and cafes and convenience stores, please indicate how much you agree or disagree with the following.
Top 2 Box (Agree + Strongly Agree)
55%
Transparency of food sourcing is important to me when I go
out to eat
48% 55% 59%
49% 60%
18 - 24 25 - 34 35 - 44 45 - 54 55+
Heavy Quick Service Users are Most Likely to Customise
88
Heavy quick service users are most likely to make special requests for menu item customisation when dining away from home.
Q6. Thinking about your meals at quick service restaurants, coffee/tea cafes and convenience stores, please indicate how much you agree or disagree with the following statements on a scale from 1–5 where 5 = Agree Completely and 1 = Disagree Completely. Please read the text of each statement carefully; some statements have opposite meanings, so please be careful not to agree with statements that contradict each other.
Thinking about your meals at quick service restaurants, coffee shops and cafes and convenience stores, please indicate how much you agree or disagree with the following.
Top 2 Box (Agree + Strongly Agree)
48%
I frequently make special requests to customise menu
items that I order
45% 51% 65%
Light QSR users Moderate QSR users Heavy QSR users

SECTION
International Insights on Fast Casual Market 4
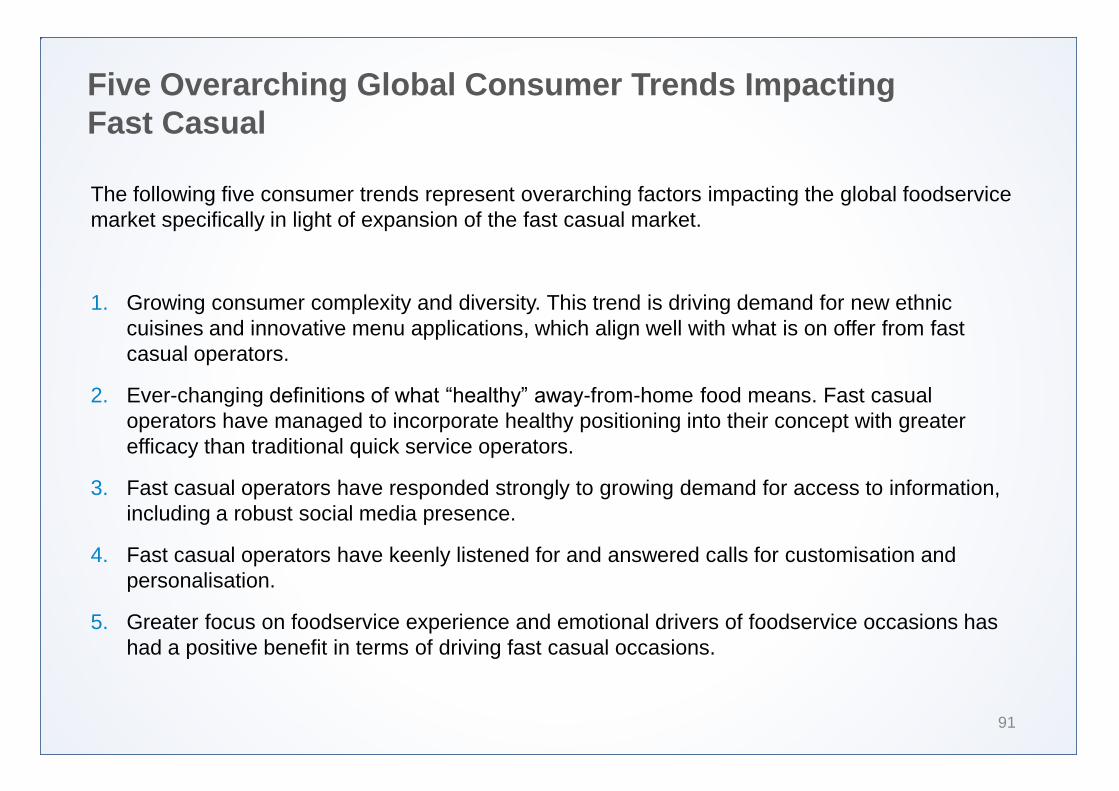
Five Overarching Global Consumer Trends Impacting Fast Casual
91
The following five consumer trends represent overarching factors impacting the global foodservice market specifically in light of expansion of the fast casual market.
1. Growing consumer complexity and diversity. This trend is driving demand for new ethnic cuisines and innovative menu applications, which align well with what is on offer from fast casual operators.
2. Ever-changing definitions of what “healthy” away-from-home food means. Fast casual operators have managed to incorporate healthy positioning into their concept with greater efficacy than traditional quick service operators.
3. Fast casual operators have responded strongly to growing demand for access to information, including a robust social media presence.
4. Fast casual operators have keenly listened for and answered calls for customisation and personalisation.
5. Greater focus on foodservice experience and emotional drivers of foodservice occasions has had a positive benefit in terms of driving fast casual occasions.
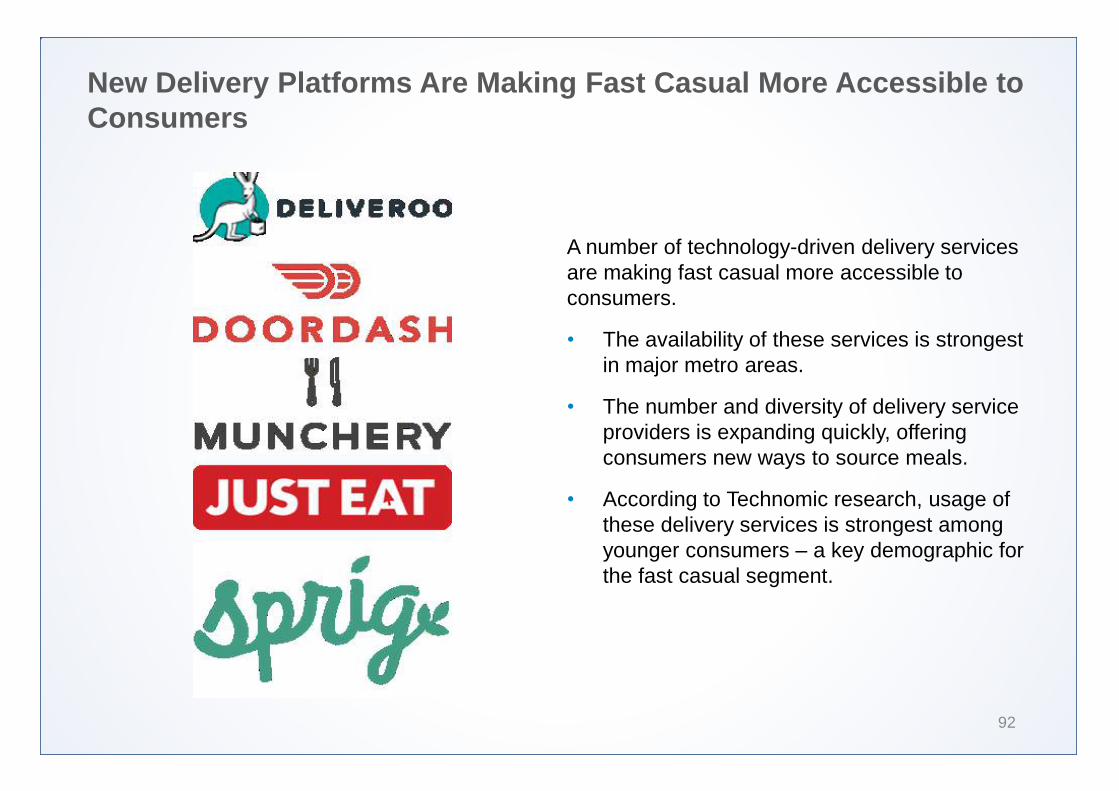
New Delivery Platforms Are Making Fast Casual More Accessible to Consumers
92
A number of technology-driven delivery services are making fast casual more accessible to consumers.
• The availability of these services is strongest in major metro areas.
• The number and diversity of delivery service providers is expanding quickly, offering consumers new ways to source meals.
• According to Technomic research, usage of these delivery services is strongest among younger consumers – a key demographic for the fast casual segment.
2015 Private Equity Investments in Fast Casual
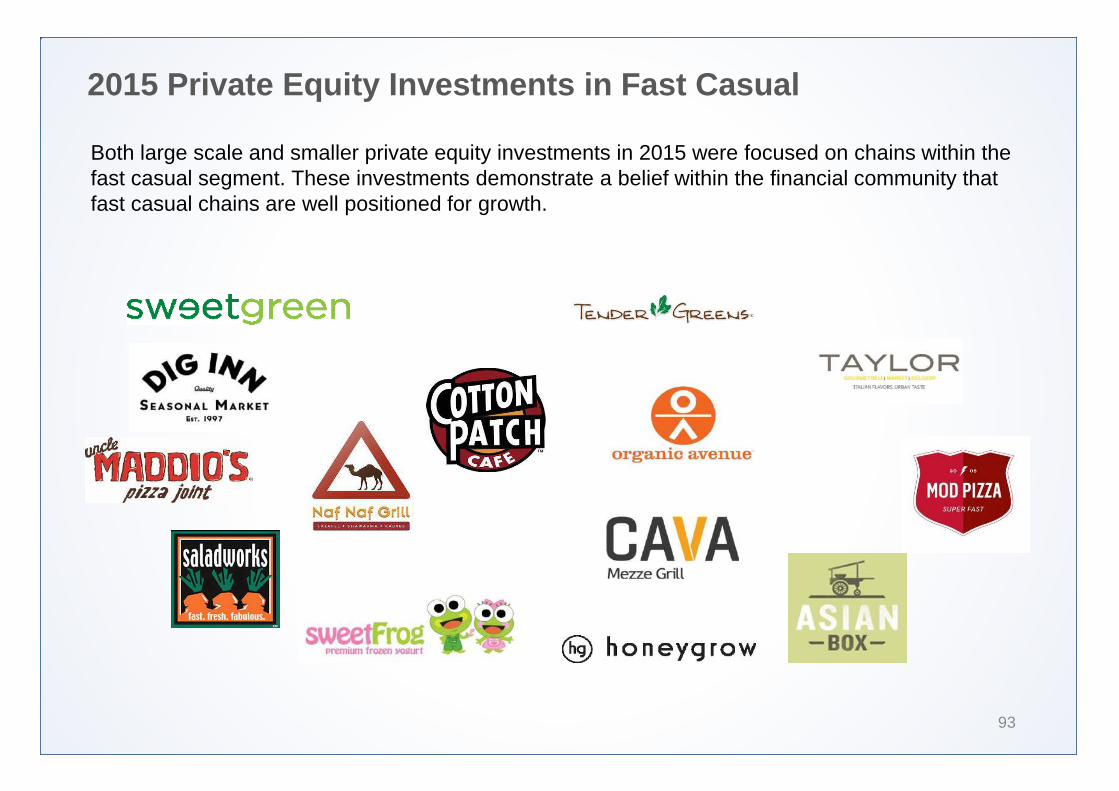
93
Both large scale and smaller private equity investments in 2015 were focused on chains within the fast casual segment. These investments demonstrate a belief within the financial community that fast casual chains are well positioned for growth.

Fast Casual Operators Align With Emerging Consumer Demands
94
Growth in the fast casual market has been the result of strong alignment with consumer needs for both high quality offerings and a broad range of experiential factors, as summarised below.
Fast Casual Drivers
Food quality
Better ingredients
Wholesome foods
Food integrity
Flexible offerings
Freshness
Appealing décor
Fair price
Fast service
Engaged employees
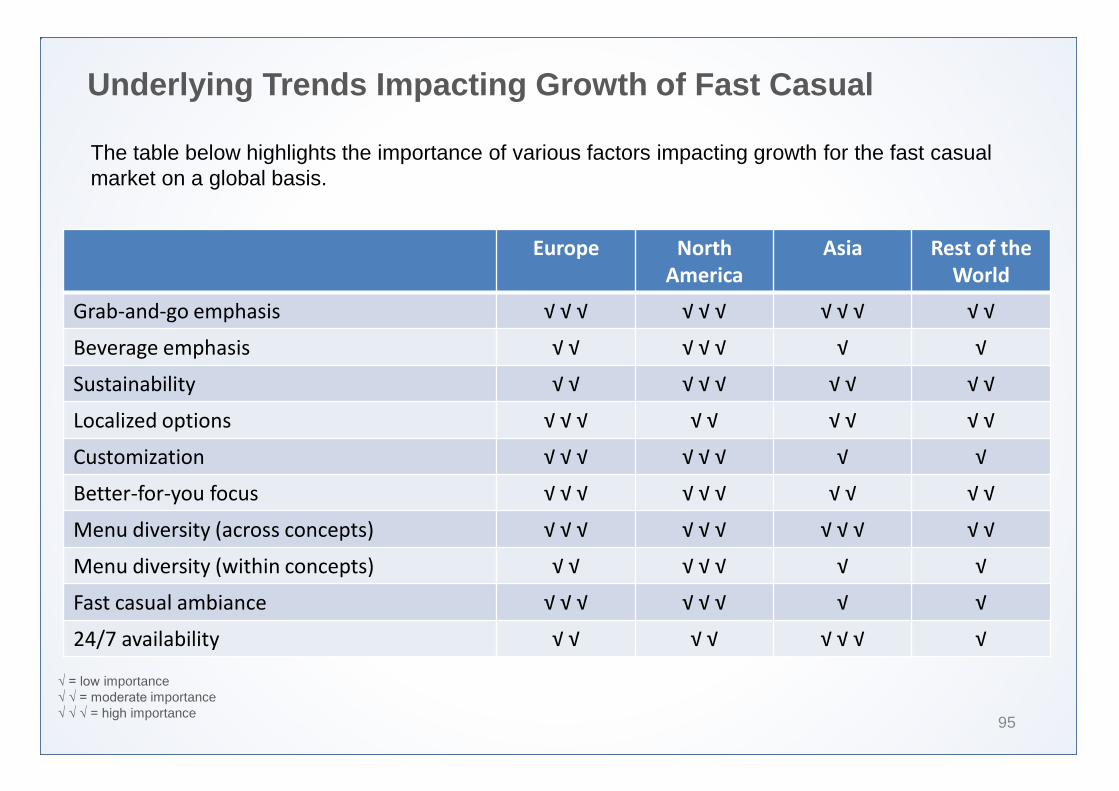
Underlying Trends Impacting Growth of Fast Casual
95
The table below highlights the importance of various factors impacting growth for the fast casual market on a global basis.
√ = low importance √ √ = moderate importance √ √ √ = high importance
Europe North America
Asia Rest of the World
Grab-and-go emphasis √ √ √ √ √ √ √ √ √ √ √
Beverage emphasis √ √ √ √ √ √ √
Sustainability √ √ √ √ √ √ √ √ √
Localized options √ √ √ √ √ √ √ √ √
Customization √ √ √ √ √ √ √ √
Better-for-you focus √ √ √ √ √ √ √ √ √ √
Menu diversity (across concepts) √ √ √ √ √ √ √ √ √ √ √
Menu diversity (within concepts) √ √ √ √ √ √ √
Fast casual ambiance √ √ √ √ √ √ √ √
24/7 availability √ √ √ √ √ √ √ √
Established QSR Operators View Fast Casual as a Competitive Threat
96
Some of the leading reasons why global fast casual operators are growing faster than traditional quick service operators (and, generally speaking, all other foodservice channels) include the following:
• Fast casual is emerging as a “QSR alternative” in major global markets where QSR operators
are already highly penetrated.
• The value proposition for traditional QSR is losing its appeal among consumers.
• Traditional QSR operators are struggling to adjust internally, particularly as traditional fast food is no longer the growth engine it formerly was.
• Consumers area seeking higher quality fare, and traditional QSR operators are struggling to adopt to meet their needs.

SECTION
Conclusions and Recommendations 5
Overarching Conclusions
99
The following conclusions draw from the entirety of the research programme:
• Consumer culture is evolving, with new demands being placed on operators in the realm of quality and convenience.
• Proactively addressing this shift in consumer behaviour is critical.
• With advances in technology, consumers have more options.
• There is a need for more focused QSR menus with fewer items (product rationalisation).
• Quality upgrading will continue and will be driven by consumer’s awareness around ingredients.
• Consumers will continue to gravitate toward the authentic operators and transparent menuing practices.
• Enhancements to speed will continue to result in a competitive advantage.
Recommendation #1 Focus on the Basics
100
Overall, there are four areas that are required for operating successfully in this space:
1. Freshness – incorporate freshness standards into sourcing practices; more importantly, communicate these practices to your customer/end user.
2. Quality – use quality attributes of products as a means of differentiation from the competition.
3. Variety – managing (and rationalising) variety of available offerings represent key activities that are important in the Quick Service and Food-to-go markets. This is a significant issue for many operators as they have extended their menus to inefficient levels in an effort to meet the demands of the customers.
4. Pricing – within the Quick Service and Food-to-Go channels, there is limited range for price variability. Because of this, managing costs throughout the supply chain is critical.
Recommendation #2 Understand Who is Shaping the Future
101
While usage of Quick Service and Food-to-Go is prominent across demographic and socio-economic groups, it is important to understand and leverage the important role that early adopters play.
Within the channels under review in this study, it is apparent that the following consumer groups are important in terms of establishing a basis for growth.
• Younger consumers (under age 35).
• Moderate/heavy foodservice users.
• Frequent delivery and convenience platform users.
• Time challenged individuals and families with older children at home.
These groups often represent an important part of many Quick Service and Food-to-Go operators’
business.
Recommendation #3 Be Prepared for Change
102
One certainty is that the Quick Service and Food-to-Go markets will continue to evolve and change. It is therefore imperative to monitor and prepare for future shifts in terms of the market and the direction it is growing in.
Some important areas to monitor for change include the following:
• Innovation from relevant manufacturers, which can translate into new ideas and opportunities for operators and manufactures to work closely to jointly grow their business.
• Macro changes in consumer behavior often time will signal a change in the way consumers define important factors like quality and convenience.
• Operators today are winning with freshness. New opportunities to bring freshness into the equation within the Quick Service and Food-to-Go channels can serve as a competitive advantage and drive growth.

SECTION
Appendix : Operator Profiles
Appendix 1
Operator Profiles
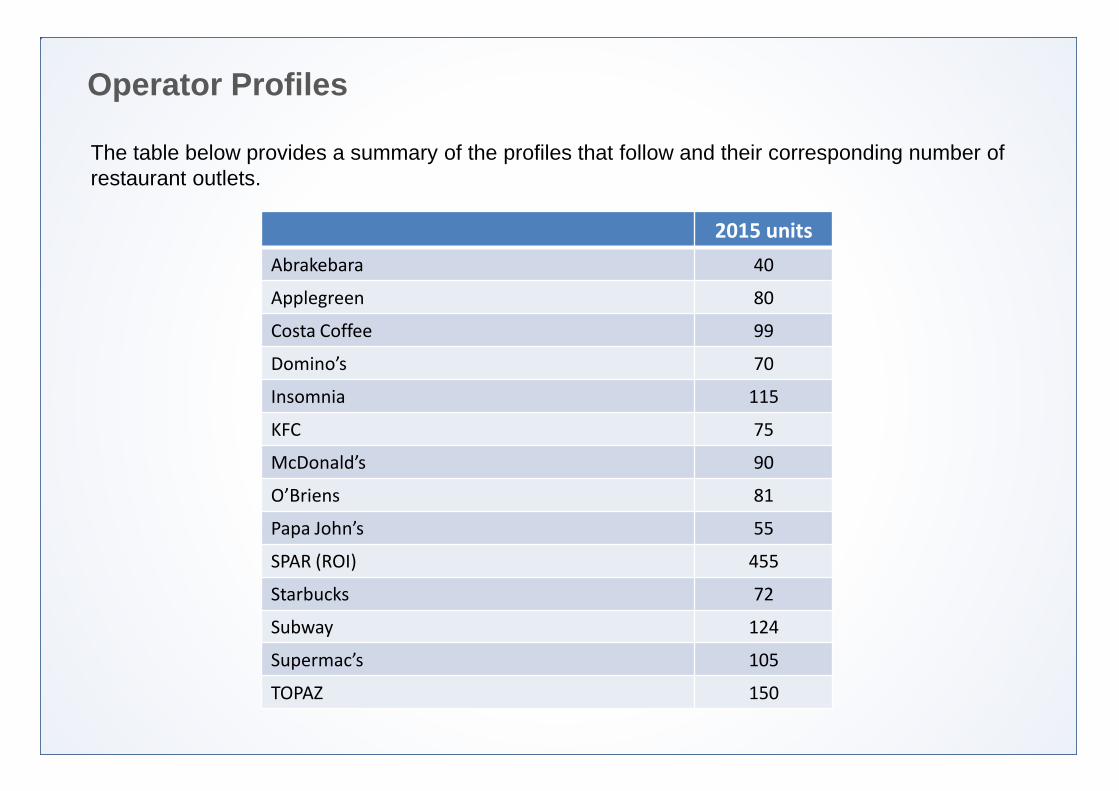
The table below provides a summary of the profiles that follow and their corresponding number of restaurant outlets.
2015 units
Abrakebara 40
Applegreen 80
Costa Coffee 99
Domino’s 70
Insomnia 115
KFC 75
McDonald’s 90
O’Briens 81
Papa John’s 55
SPAR (ROI) 455
Starbucks 72
Subway 124
Supermac’s 105
TOPAZ 150
Source:
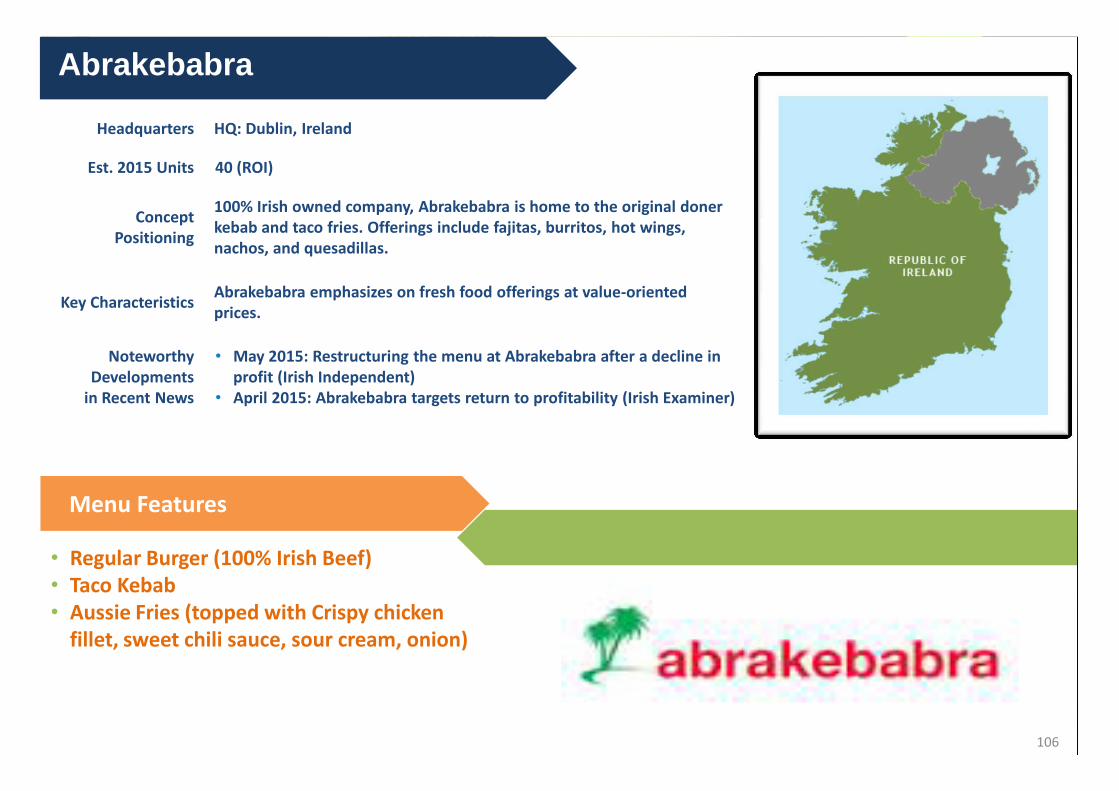
Headquarters HQ: Dublin, Ireland
Est. 2015 Units 40 (ROI)
Concept Positioning
100% Irish owned company, Abrakebabra is home to the original doner kebab and taco fries. Offerings include fajitas, burritos, hot wings, nachos, and quesadillas.
Key Characteristics Abrakebabra emphasizes on fresh food offerings at value-oriented prices.
Noteworthy Developments
in Recent News
• May 2015: Restructuring the menu at Abrakebabra after a decline in profit (Irish Independent)
• April 2015: Abrakebabra targets return to profitability (Irish Examiner)
Abrakebabra
Menu Features
• Regular Burger (100% Irish Beef) • Taco Kebab • Aussie Fries (topped with Crispy chicken
fillet, sweet chili sauce, sour cream, onion)
106
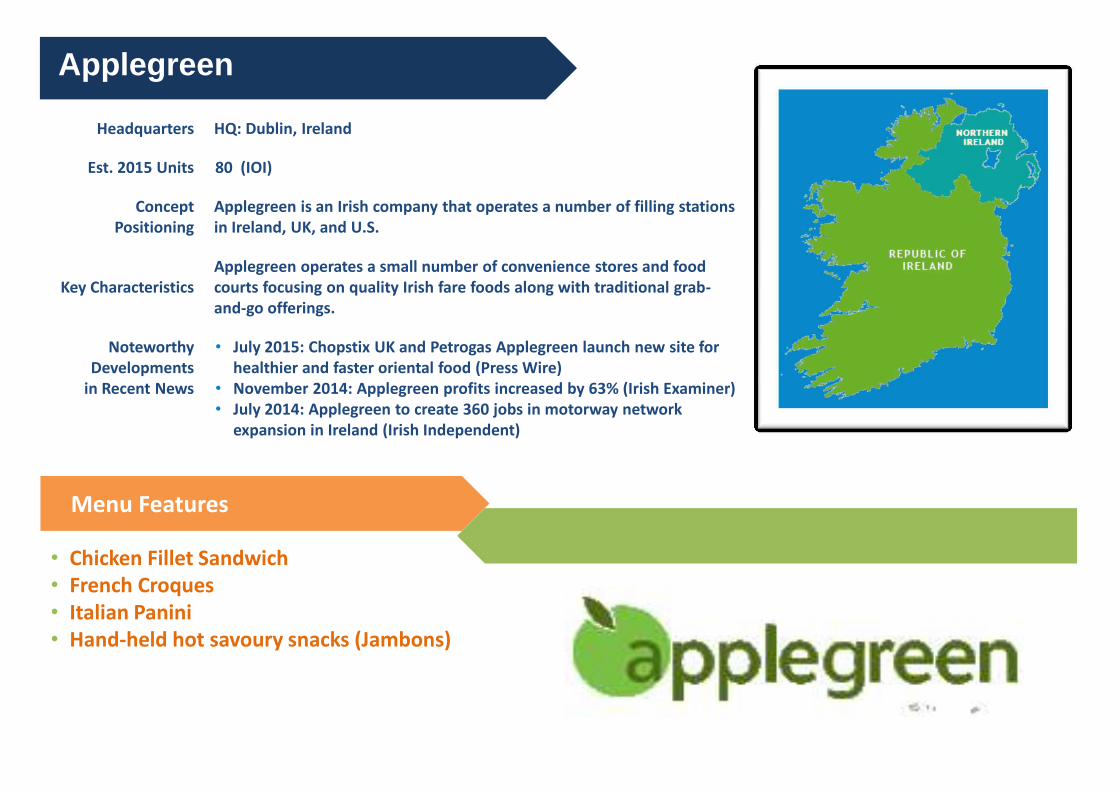
107 Source:
Headquarters HQ: Dublin, Ireland
Est. 2015 Units 80 (IOI)
Concept Positioning
Applegreen is an Irish company that operates a number of filling stations in Ireland, UK, and U.S.
Key Characteristics Applegreen operates a small number of convenience stores and food courts focusing on quality Irish fare foods along with traditional grab-and-go offerings.
Noteworthy Developments
in Recent News
• July 2015: Chopstix UK and Petrogas Applegreen launch new site for healthier and faster oriental food (Press Wire)
• November 2014: Applegreen profits increased by 63% (Irish Examiner) • July 2014: Applegreen to create 360 jobs in motorway network
expansion in Ireland (Irish Independent)
Applegreen
Menu Features
• Chicken Fillet Sandwich • French Croques • Italian Panini • Hand-held hot savoury snacks (Jambons)
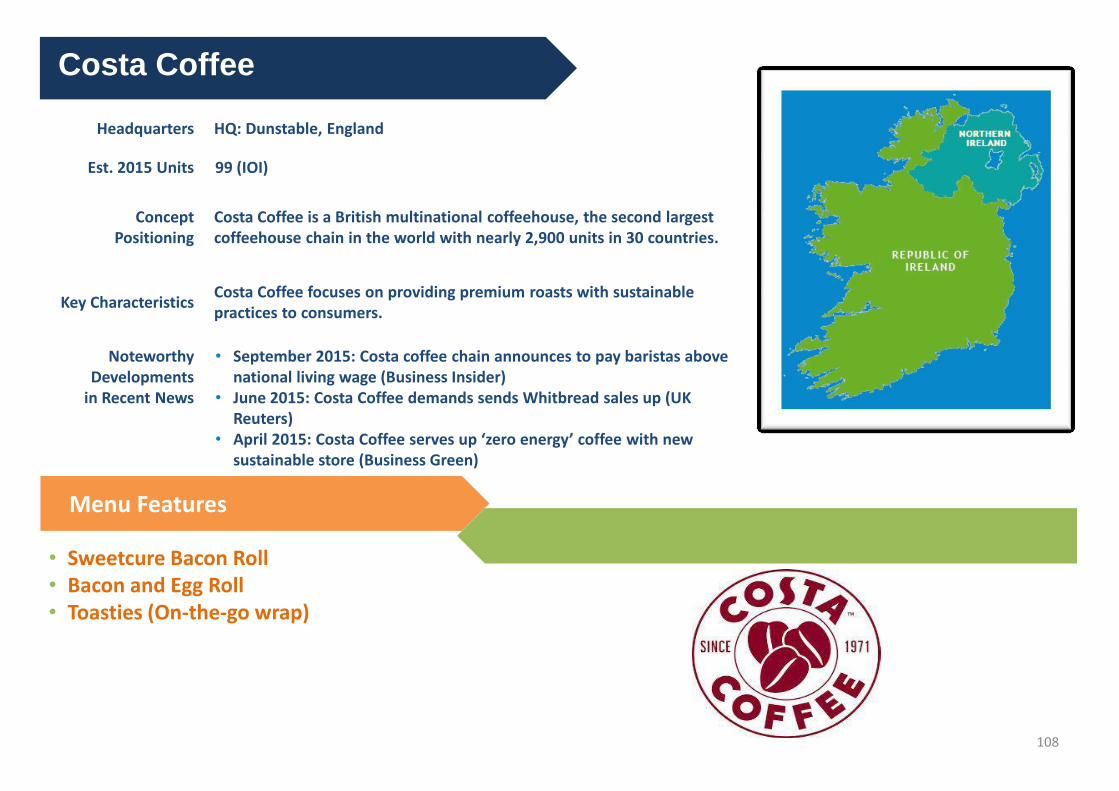
Source:
Headquarters HQ: Dunstable, England
Est. 2015 Units 99 (IOI)
Concept Positioning
Costa Coffee is a British multinational coffeehouse, the second largest coffeehouse chain in the world with nearly 2,900 units in 30 countries.
Key Characteristics Costa Coffee focuses on providing premium roasts with sustainable practices to consumers.
Noteworthy Developments
in Recent News
• September 2015: Costa coffee chain announces to pay baristas above national living wage (Business Insider)
• June 2015: Costa Coffee demands sends Whitbread sales up (UK Reuters)
• April 2015: Costa Coffee serves up ‘zero energy’ coffee with new sustainable store (Business Green)
Costa Coffee
Menu Features
• Sweetcure Bacon Roll • Bacon and Egg Roll • Toasties (On-the-go wrap)
108
Source:
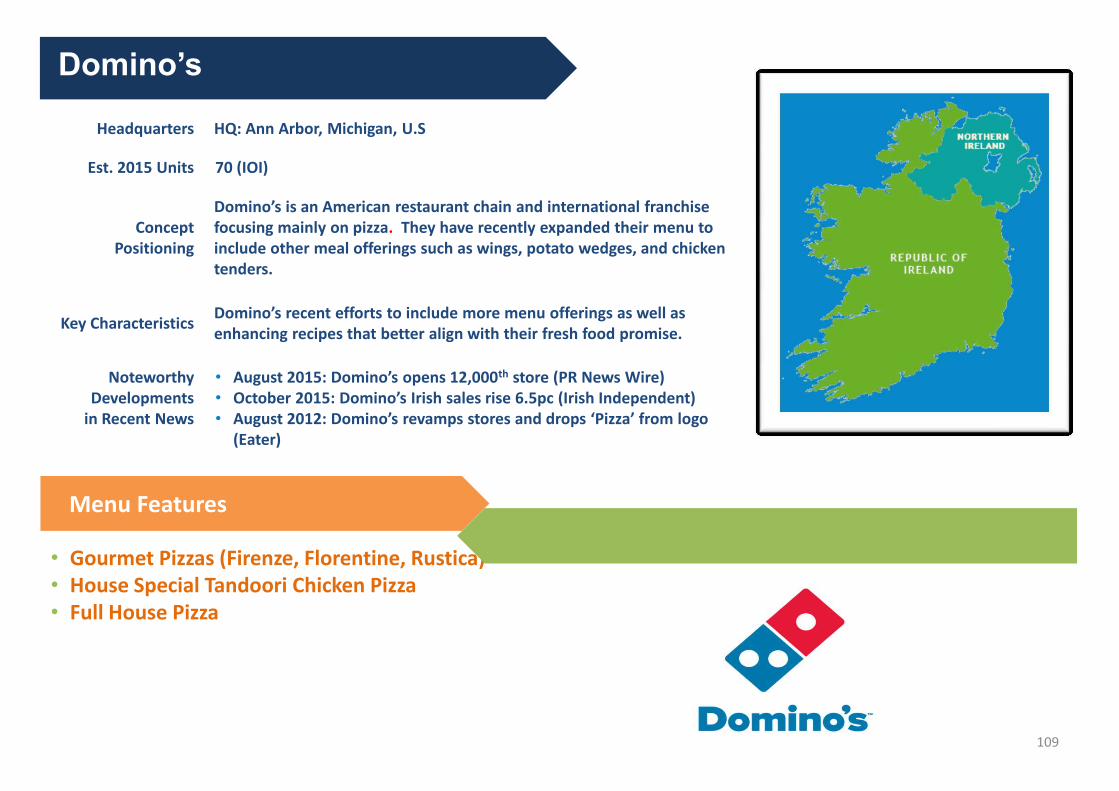
Headquarters HQ: Ann Arbor, Michigan, U.S
Est. 2015 Units 70 (IOI)
Concept Positioning
Domino’s is an American restaurant chain and international franchise focusing mainly on pizza. They have recently expanded their menu to include other meal offerings such as wings, potato wedges, and chicken tenders.
Key Characteristics Domino’s recent efforts to include more menu offerings as well as enhancing recipes that better align with their fresh food promise.
Noteworthy Developments
in Recent News
• August 2015: Domino’s opens 12,000th store (PR News Wire) • October 2015: Domino’s Irish sales rise 6.5pc (Irish Independent) • August 2012: Domino’s revamps stores and drops ‘Pizza’ from logo
(Eater)
Domino’s
Menu Features
• Gourmet Pizzas (Firenze, Florentine, Rustica) • House Special Tandoori Chicken Pizza • Full House Pizza
109
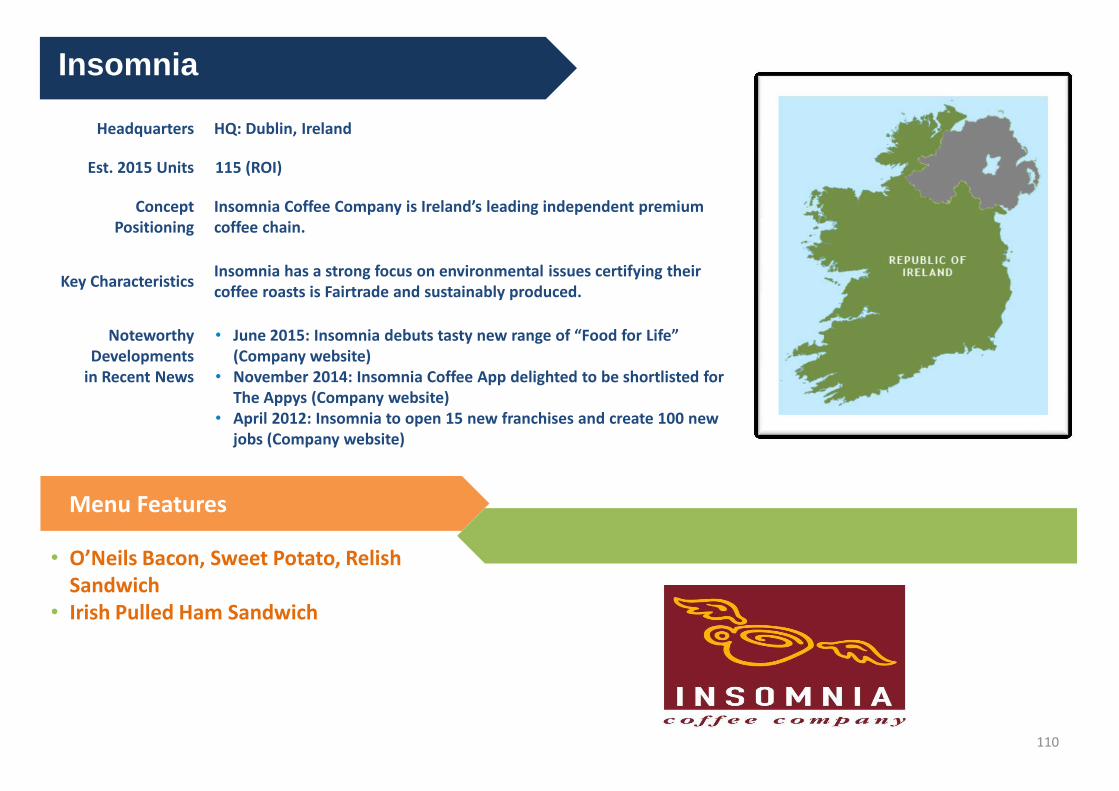
Source:
Headquarters HQ: Dublin, Ireland
Est. 2015 Units 115 (ROI)
Concept Positioning
Insomnia Coffee Company is Ireland’s leading independent premium coffee chain.
Key Characteristics Insomnia has a strong focus on environmental issues certifying their coffee roasts is Fairtrade and sustainably produced.
Noteworthy Developments
in Recent News
• June 2015: Insomnia debuts tasty new range of “Food for Life” (Company website)
• November 2014: Insomnia Coffee App delighted to be shortlisted for The Appys (Company website)
• April 2012: Insomnia to open 15 new franchises and create 100 new jobs (Company website)
Insomnia
Menu Features
• O’Neils Bacon, Sweet Potato, Relish Sandwich
• Irish Pulled Ham Sandwich
110
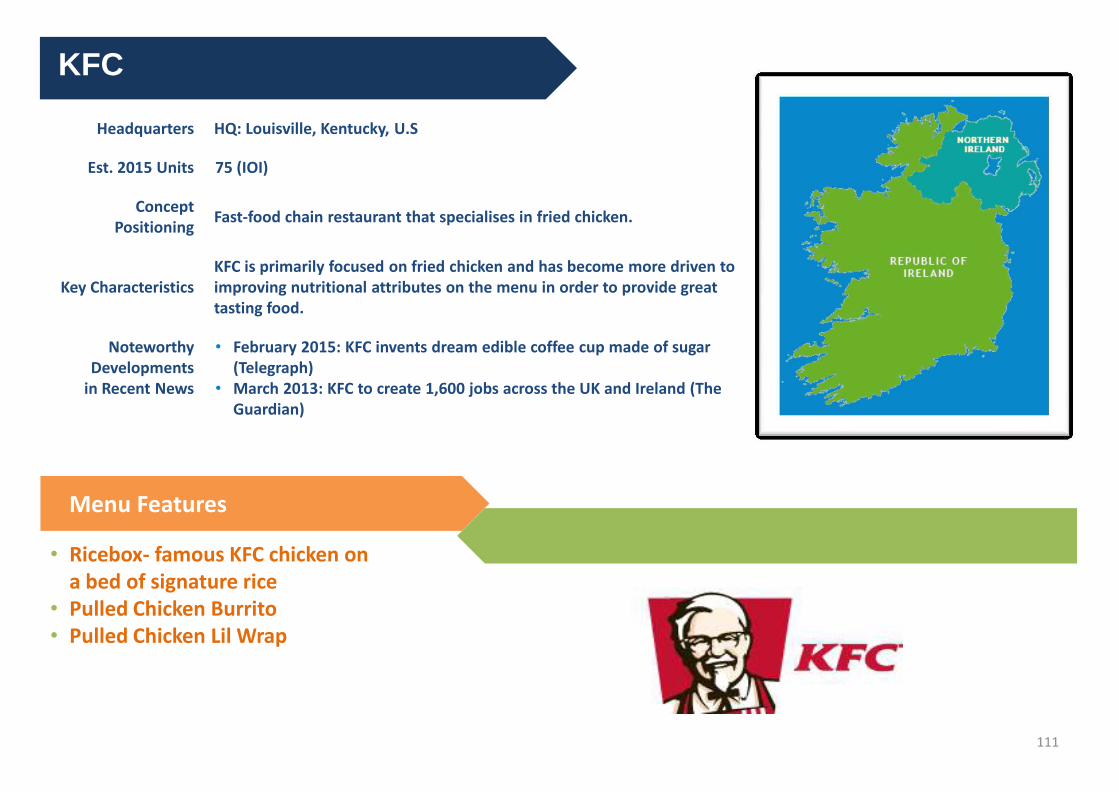
Source:
Headquarters HQ: Louisville, Kentucky, U.S
Est. 2015 Units 75 (IOI)
Concept Positioning
Fast-food chain restaurant that specialises in fried chicken.
Key Characteristics KFC is primarily focused on fried chicken and has become more driven to improving nutritional attributes on the menu in order to provide great tasting food.
Noteworthy Developments
in Recent News
• February 2015: KFC invents dream edible coffee cup made of sugar (Telegraph)
• March 2013: KFC to create 1,600 jobs across the UK and Ireland (The Guardian)
KFC
Menu Features
• Ricebox- famous KFC chicken on a bed of signature rice
• Pulled Chicken Burrito • Pulled Chicken Lil Wrap
111
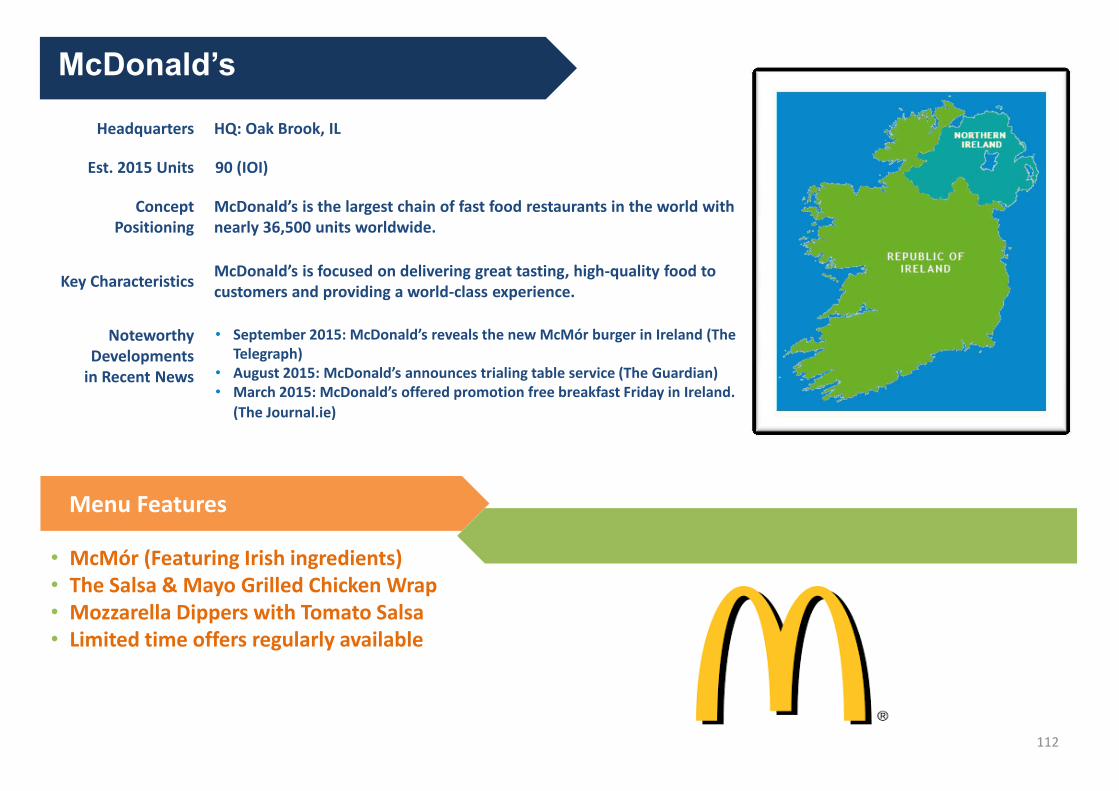
Source:
Headquarters HQ: Oak Brook, IL
Est. 2015 Units 90 (IOI)
Concept Positioning
McDonald’s is the largest chain of fast food restaurants in the world with nearly 36,500 units worldwide.
Key Characteristics McDonald’s is focused on delivering great tasting, high-quality food to customers and providing a world-class experience.
Noteworthy Developments
in Recent News
• September 2015: McDonald’s reveals the new McMór burger in Ireland (The Telegraph)
• August 2015: McDonald’s announces trialing table service (The Guardian) • March 2015: McDonald’s offered promotion free breakfast Friday in Ireland.
(The Journal.ie)
McDonald’s
Menu Features
• McMór (Featuring Irish ingredients) • The Salsa & Mayo Grilled Chicken Wrap • Mozzarella Dippers with Tomato Salsa • Limited time offers regularly available
112
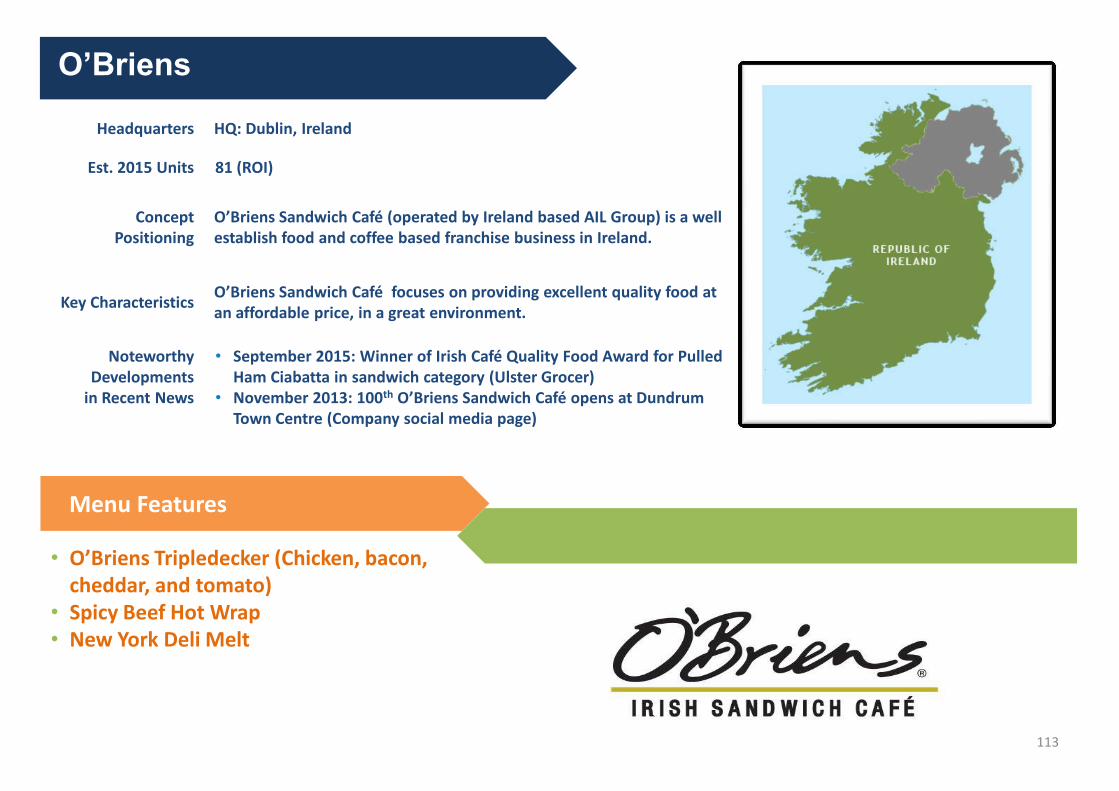
Source:
Headquarters HQ: Dublin, Ireland
Est. 2015 Units 81 (ROI)
Concept Positioning
O’Briens Sandwich Café (operated by Ireland based AIL Group) is a well establish food and coffee based franchise business in Ireland.
Key Characteristics O’Briens Sandwich Café focuses on providing excellent quality food at an affordable price, in a great environment.
Noteworthy Developments
in Recent News
• September 2015: Winner of Irish Café Quality Food Award for Pulled Ham Ciabatta in sandwich category (Ulster Grocer)
• November 2013: 100th O’Briens Sandwich Café opens at Dundrum Town Centre (Company social media page)
O’Briens
Menu Features
• O’Briens Tripledecker (Chicken, bacon, cheddar, and tomato)
• Spicy Beef Hot Wrap • New York Deli Melt
113
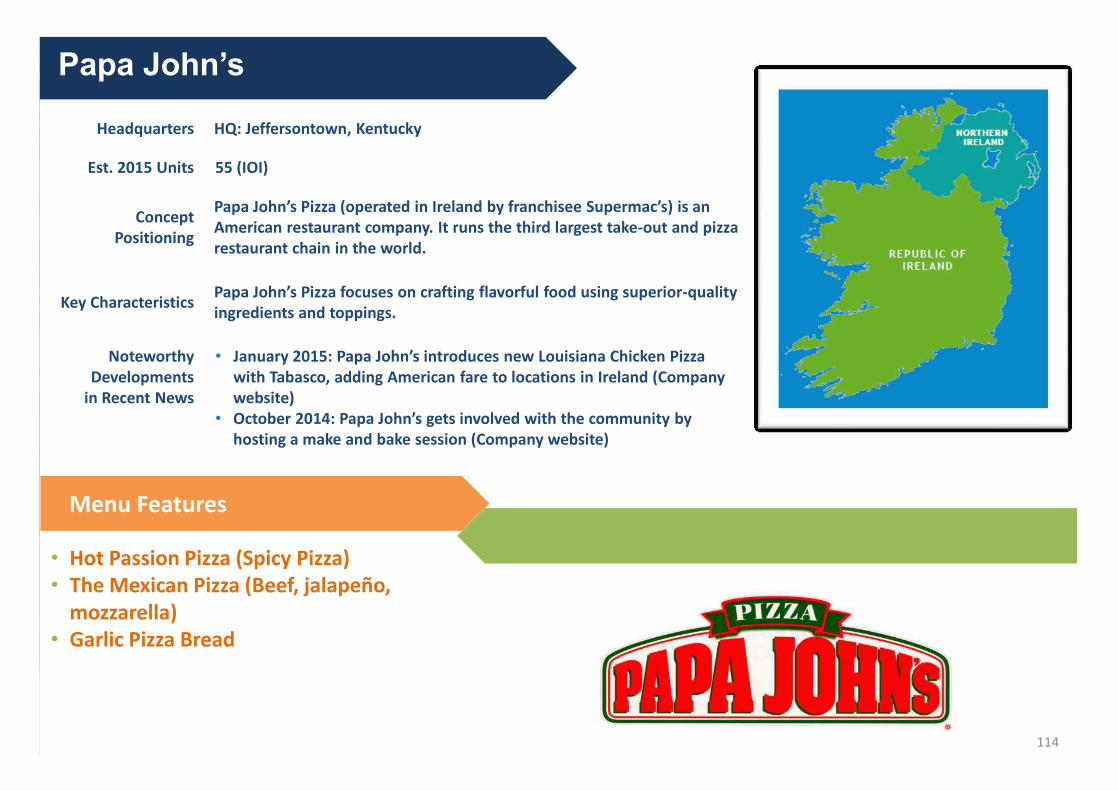
Source:
Headquarters HQ: Jeffersontown, Kentucky
Est. 2015 Units 55 (IOI)
Concept Positioning
Papa John’s Pizza (operated in Ireland by franchisee Supermac’s) is an American restaurant company. It runs the third largest take-out and pizza restaurant chain in the world.
Key Characteristics Papa John’s Pizza focuses on crafting flavorful food using superior-quality ingredients and toppings.
Noteworthy Developments
in Recent News
• January 2015: Papa John’s introduces new Louisiana Chicken Pizza with Tabasco, adding American fare to locations in Ireland (Company website)
• October 2014: Papa John’s gets involved with the community by hosting a make and bake session (Company website)
Papa John’s
Menu Features
• Hot Passion Pizza (Spicy Pizza) • The Mexican Pizza (Beef, jalapeño,
mozzarella) • Garlic Pizza Bread
114
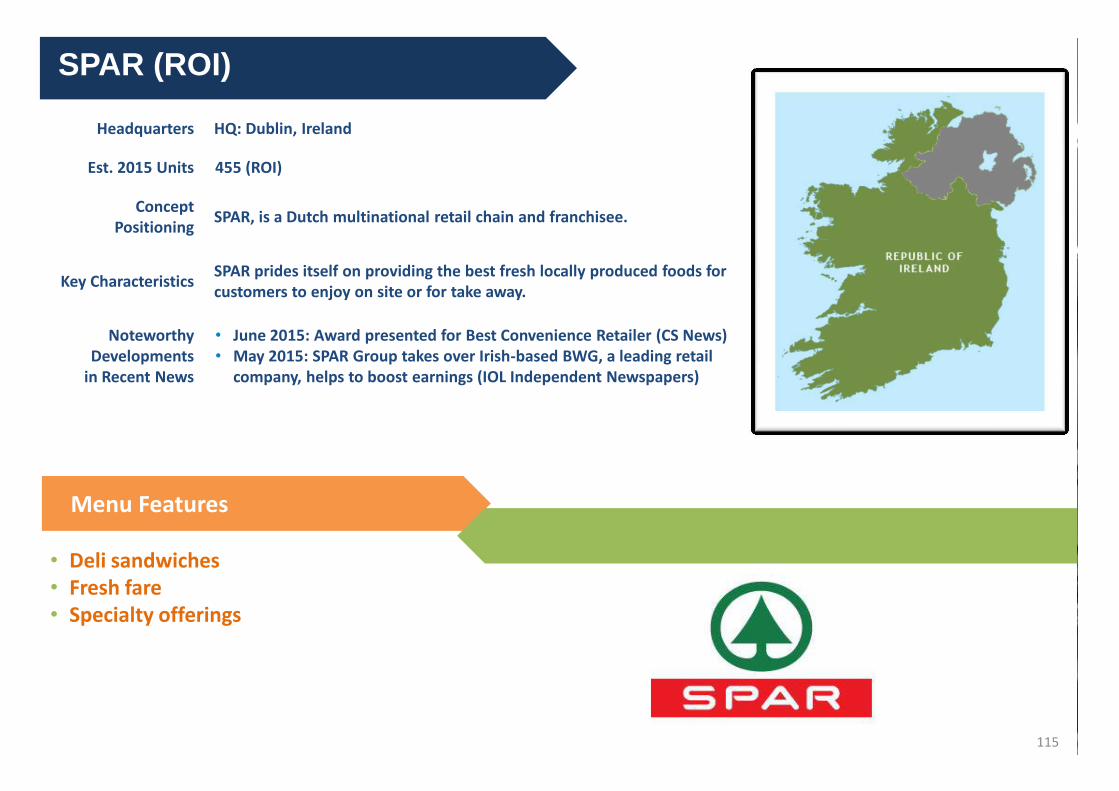
Source:
Headquarters HQ: Dublin, Ireland
Est. 2015 Units 455 (ROI)
Concept Positioning
SPAR, is a Dutch multinational retail chain and franchisee.
Key Characteristics SPAR prides itself on providing the best fresh locally produced foods for customers to enjoy on site or for take away.
Noteworthy Developments
in Recent News
• June 2015: Award presented for Best Convenience Retailer (CS News) • May 2015: SPAR Group takes over Irish-based BWG, a leading retail
company, helps to boost earnings (IOL Independent Newspapers)
SPAR (ROI)
Menu Features
• Deli sandwiches • Fresh fare • Specialty offerings
115
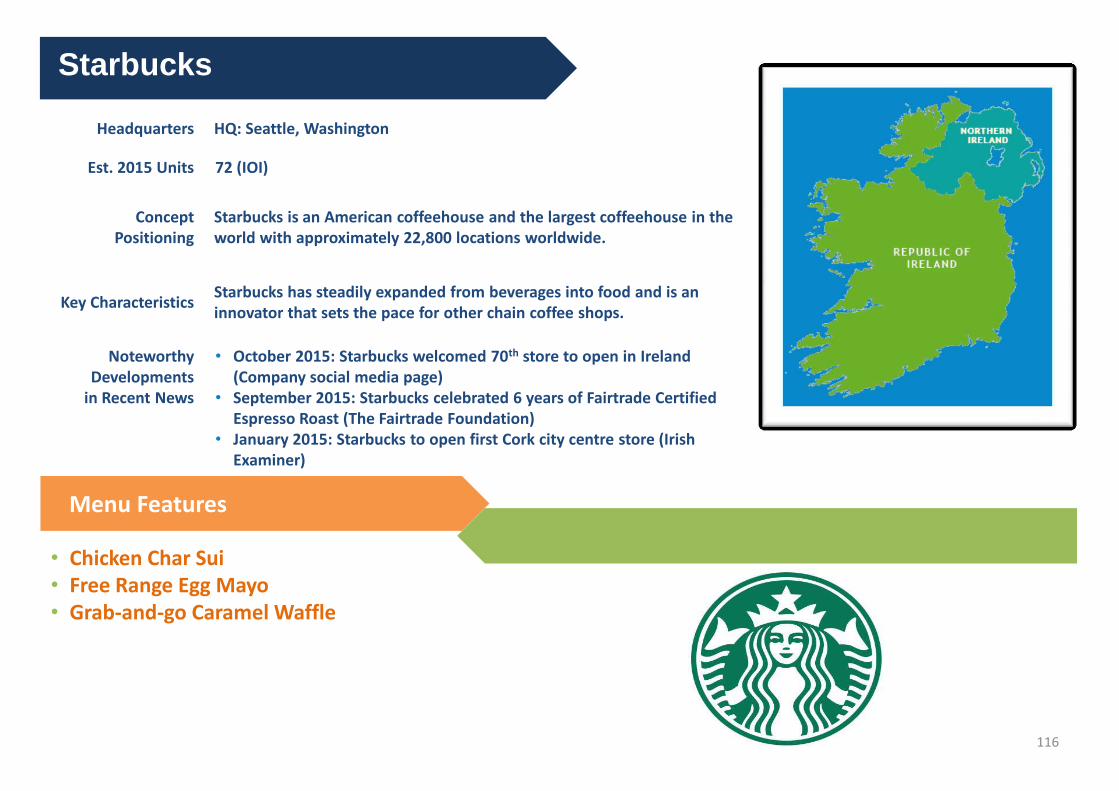
Source:
Headquarters HQ: Seattle, Washington
Est. 2015 Units 72 (IOI)
Concept Positioning
Starbucks is an American coffeehouse and the largest coffeehouse in the world with approximately 22,800 locations worldwide.
Key Characteristics Starbucks has steadily expanded from beverages into food and is an innovator that sets the pace for other chain coffee shops.
Noteworthy Developments
in Recent News
• October 2015: Starbucks welcomed 70th store to open in Ireland (Company social media page)
• September 2015: Starbucks celebrated 6 years of Fairtrade Certified Espresso Roast (The Fairtrade Foundation)
• January 2015: Starbucks to open first Cork city centre store (Irish Examiner)
Starbucks
Menu Features
• Chicken Char Sui • Free Range Egg Mayo • Grab-and-go Caramel Waffle
116
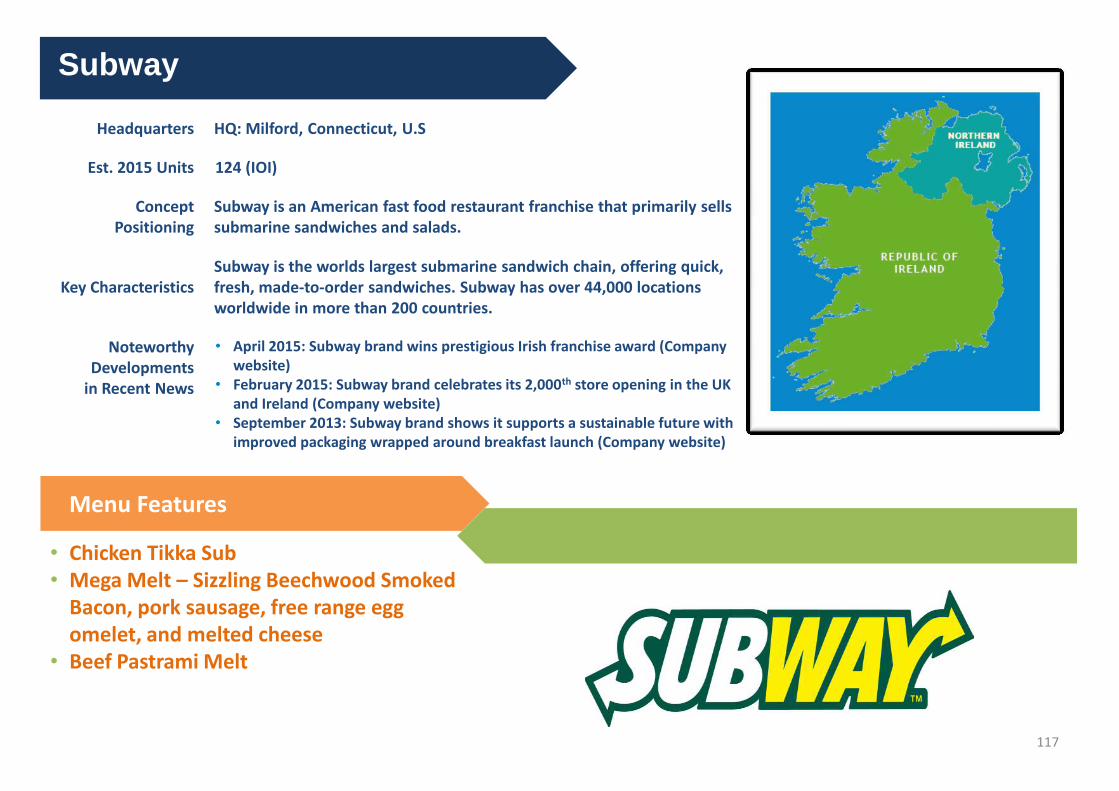
Source:
Headquarters HQ: Milford, Connecticut, U.S
Est. 2015 Units 124 (IOI)
Concept Positioning
Subway is an American fast food restaurant franchise that primarily sells submarine sandwiches and salads.
Key Characteristics Subway is the worlds largest submarine sandwich chain, offering quick, fresh, made-to-order sandwiches. Subway has over 44,000 locations worldwide in more than 200 countries.
Noteworthy Developments
in Recent News
• April 2015: Subway brand wins prestigious Irish franchise award (Company website)
• February 2015: Subway brand celebrates its 2,000th store opening in the UK and Ireland (Company website)
• September 2013: Subway brand shows it supports a sustainable future with improved packaging wrapped around breakfast launch (Company website)
Subway
Menu Features
• Chicken Tikka Sub • Mega Melt – Sizzling Beechwood Smoked
Bacon, pork sausage, free range egg omelet, and melted cheese
• Beef Pastrami Melt
117
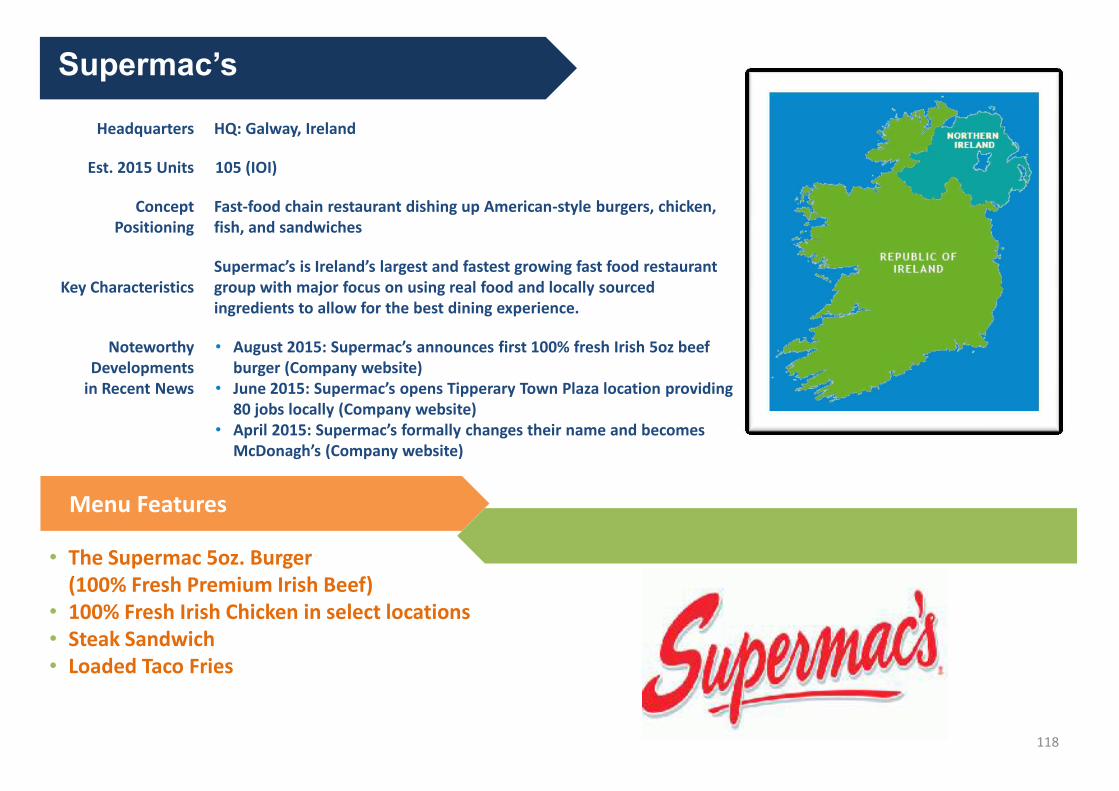
Source:
Headquarters HQ: Galway, Ireland
Est. 2015 Units 105 (IOI)
Concept Positioning
Fast-food chain restaurant dishing up American-style burgers, chicken, fish, and sandwiches
Key Characteristics Supermac’s is Ireland’s largest and fastest growing fast food restaurant group with major focus on using real food and locally sourced ingredients to allow for the best dining experience.
Noteworthy Developments
in Recent News
• August 2015: Supermac’s announces first 100% fresh Irish 5oz beef burger (Company website)
• June 2015: Supermac’s opens Tipperary Town Plaza location providing 80 jobs locally (Company website)
• April 2015: Supermac’s formally changes their name and becomes McDonagh’s (Company website)
Supermac’s
Menu Features
• The Supermac 5oz. Burger (100% Fresh Premium Irish Beef)
• 100% Fresh Irish Chicken in select locations • Steak Sandwich • Loaded Taco Fries
118
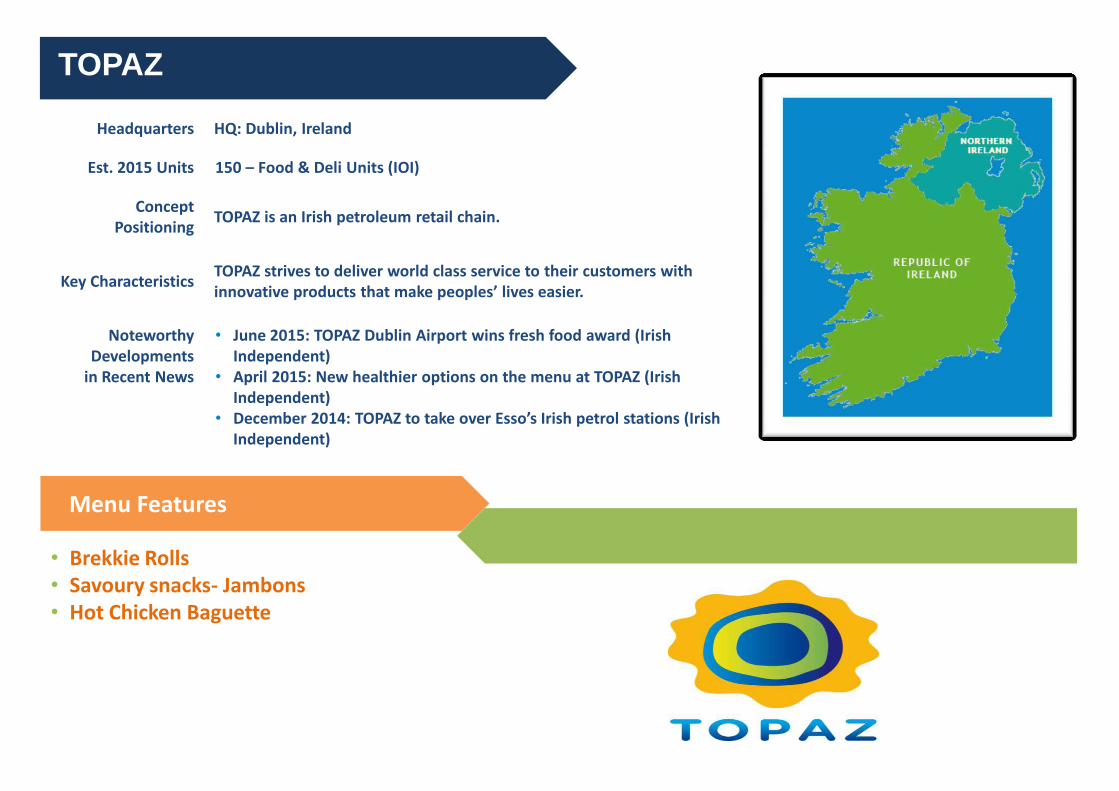
119 Source:
Headquarters HQ: Dublin, Ireland
Est. 2015 Units 150 – Food & Deli Units (IOI)
Concept Positioning
TOPAZ is an Irish petroleum retail chain.
Key Characteristics TOPAZ strives to deliver world class service to their customers with innovative products that make peoples’ lives easier.
Noteworthy Developments
in Recent News
• June 2015: TOPAZ Dublin Airport wins fresh food award (Irish Independent)
• April 2015: New healthier options on the menu at TOPAZ (Irish Independent)
• December 2014: TOPAZ to take over Esso’s Irish petrol stations (Irish Independent)
TOPAZ
Menu Features
• Brekkie Rolls • Savoury snacks- Jambons • Hot Chicken Baguette
SECTION
Appendix: Consumer Survey Demographics
Appendix 2
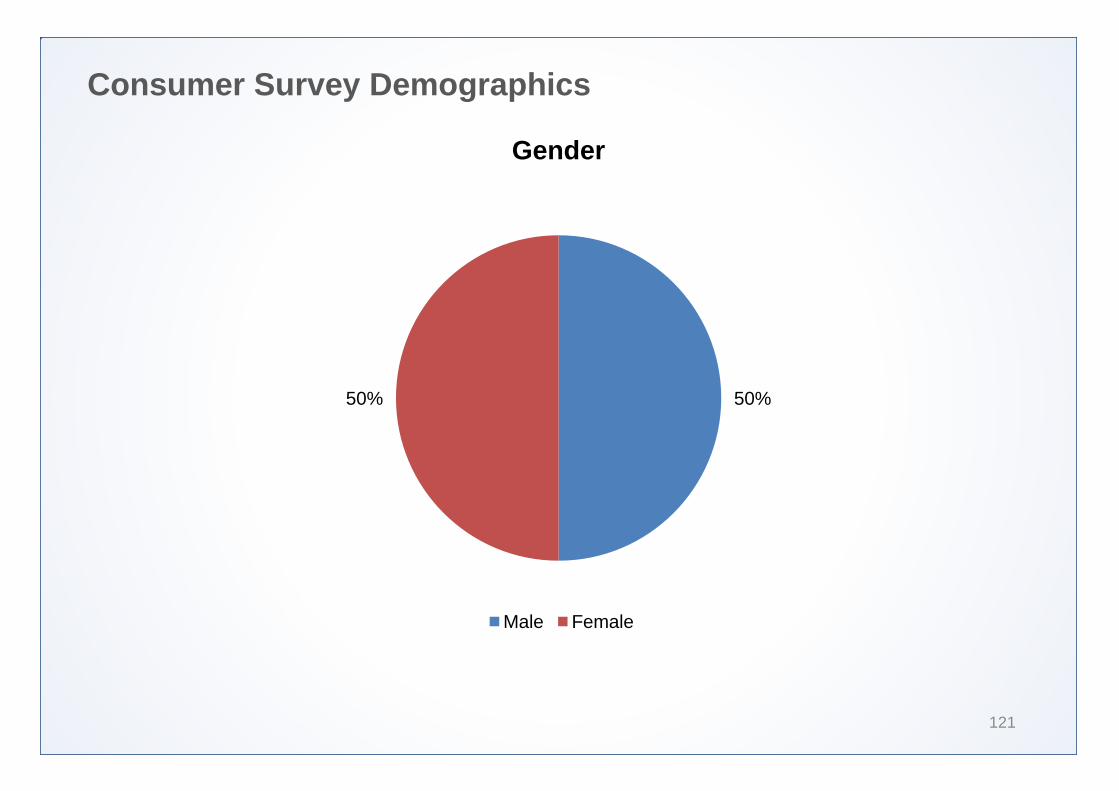
Consumer Survey Demographics
121
50% 50%
Male Female
Gender
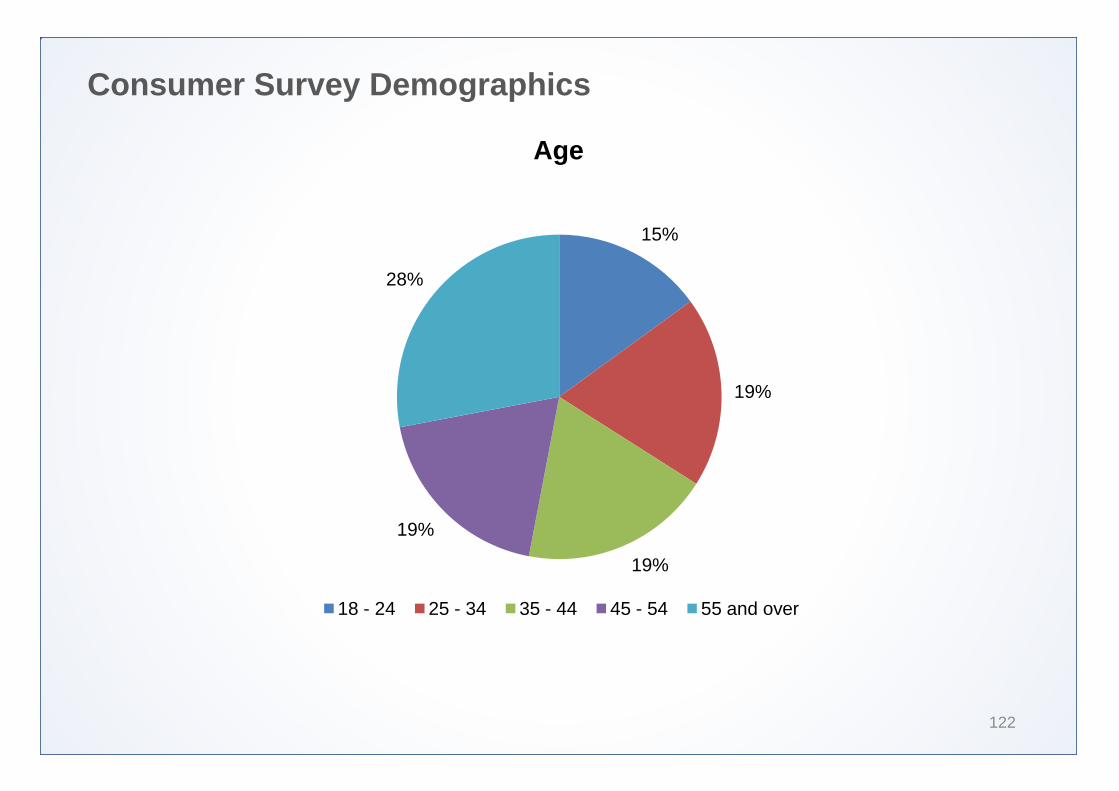
Consumer Survey Demographics
122
15%
19%
19%
19%
28%
18 - 24 25 - 34 35 - 44 45 - 54 55 and over
Age
Consumer Survey Demographics
123
11%
33%
23%
31%
2%
Gen Z (1993 - 1997) Millennials (1977 - 1992) Generation X (1966 - 1976) Baby Boomers (1946 - 1965) Matures (Before 1946)
Generation
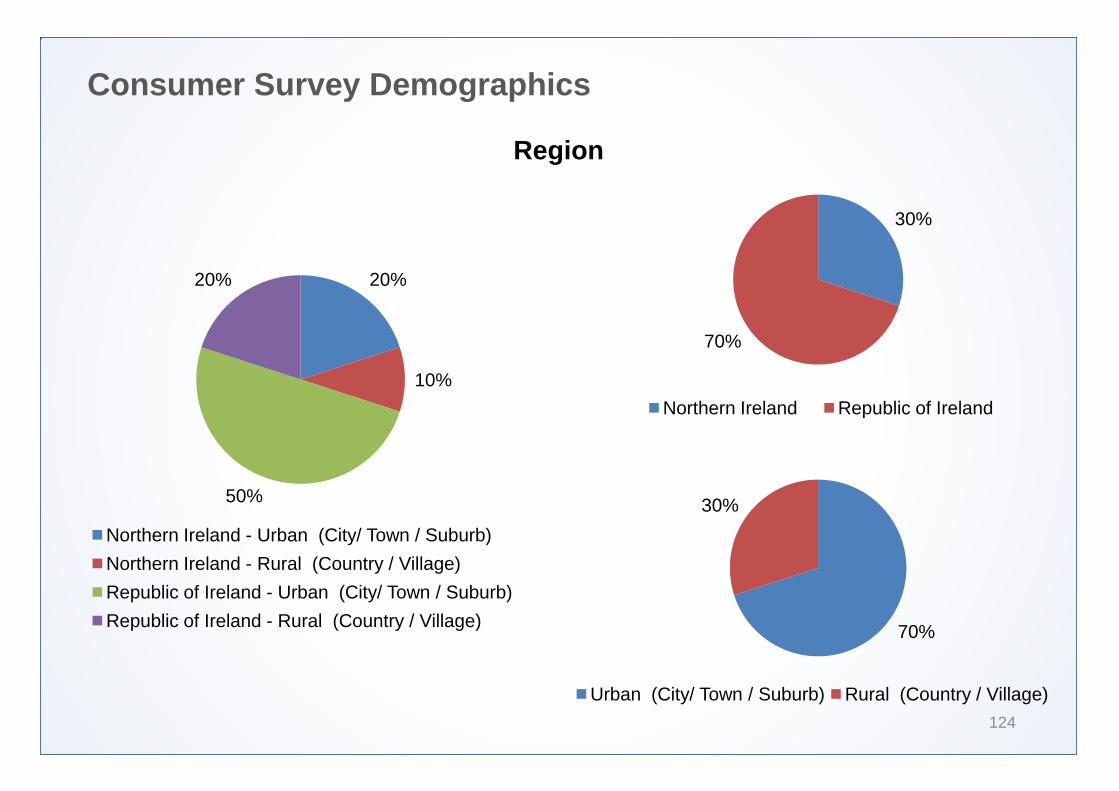
Consumer Survey Demographics
124
20%
10%
50%
20%
Northern Ireland - Urban (City/ Town / Suburb)
Northern Ireland - Rural (Country / Village)
Republic of Ireland - Urban (City/ Town / Suburb)
Republic of Ireland - Rural (Country / Village)
30%
70%
Northern Ireland Republic of Ireland
70%
30%
Urban (City/ Town / Suburb) Rural (Country / Village)
Region
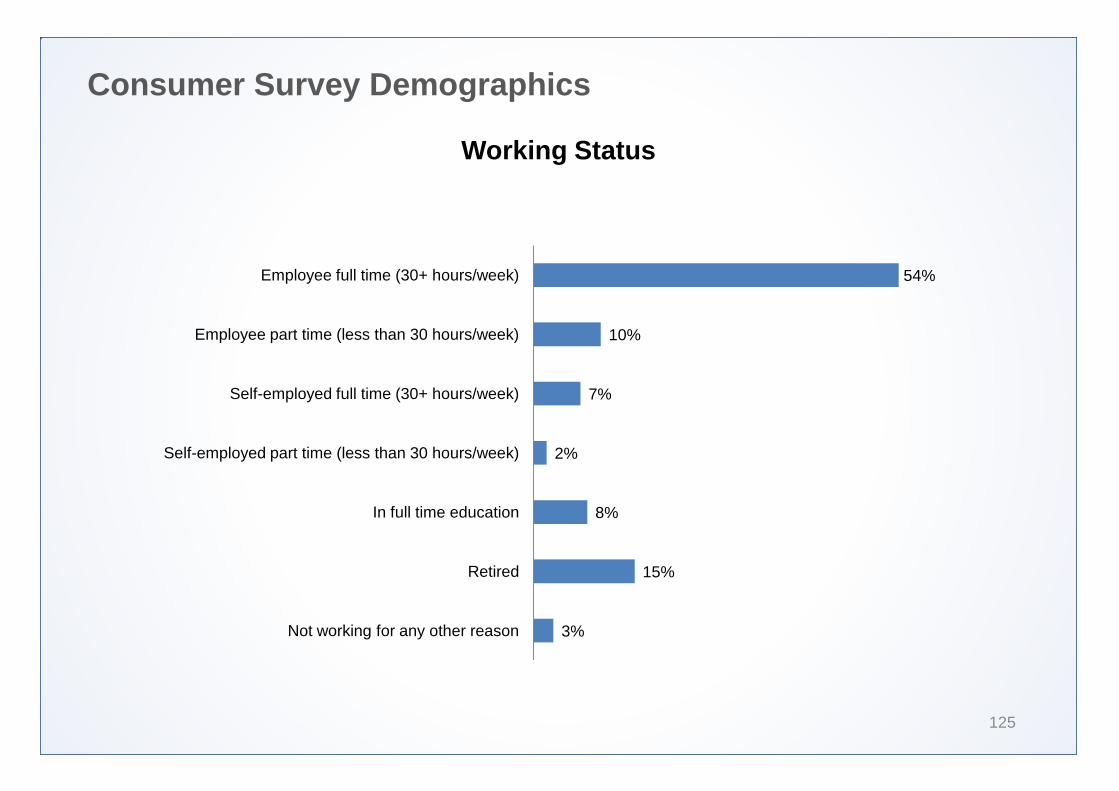
Consumer Survey Demographics
125
3%
15%
8%
2%
7%
10%
54%
Not working for any other reason
Retired
In full time education
Self-employed part time (less than 30 hours/week)
Self-employed full time (30+ hours/week)
Employee part time (less than 30 hours/week)
Employee full time (30+ hours/week)
Working Status
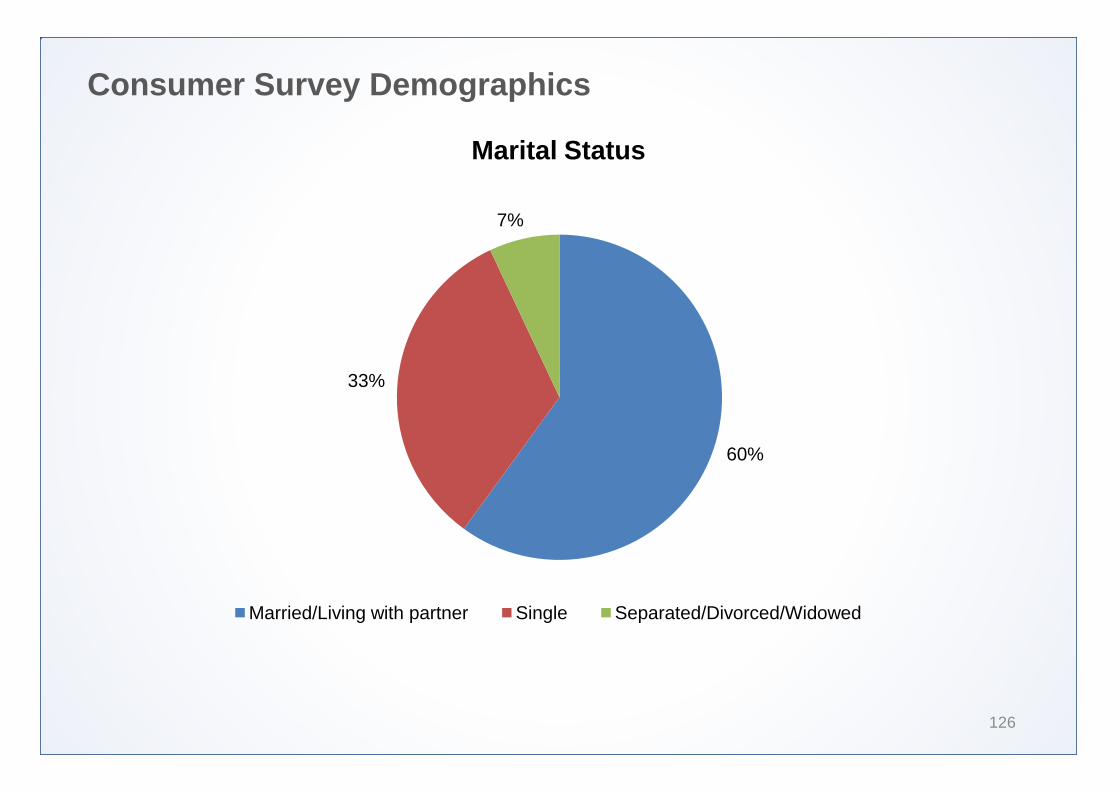
Consumer Survey Demographics
126
60%
33%
7%
Married/Living with partner Single Separated/Divorced/Widowed
Marital Status

Consumer Survey Demographics
127
1%
1%
7%
7%
12%
14%
15%
20%
21%
Unemployed
Farmer
Student
Semi or unskilled manual worker without qualifications (traffic warden, checkout operator, dustman, trainee hairdresser, etc.)
Junior managerial, administrative or professional; office workers, supervisors
Skilled manual worker with industry qualifications (e.g. carpenter, bricklayer, plumber, bus/tram driver, fitness instructor, etc.)
Retired (state pension)
Intermediate managerial, administrative or professional
Senior managerial, administrative or professional
Employment Status of Main Income Earner in Household
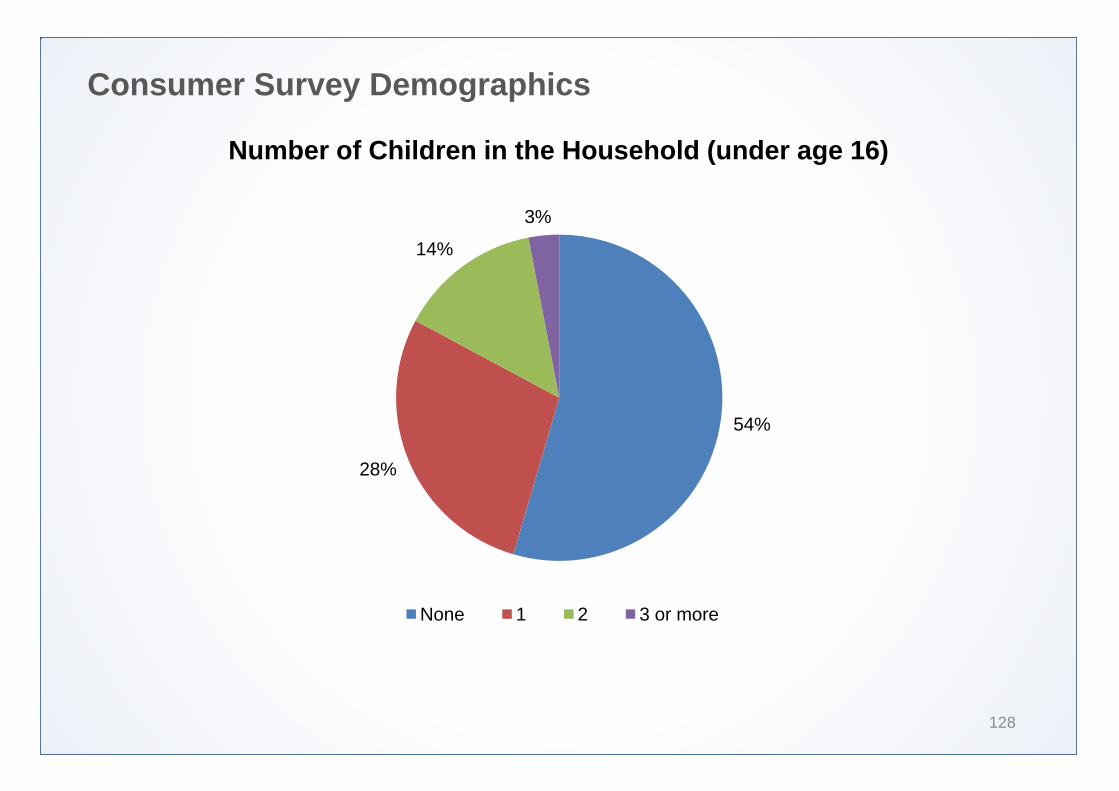
Consumer Survey Demographics
128
54%
28%
14%
3%
None 1 2 3 or more
Number of Children in the Household (under age 16)


SECTION
Appendix: Economic Indicators
Appendix 3
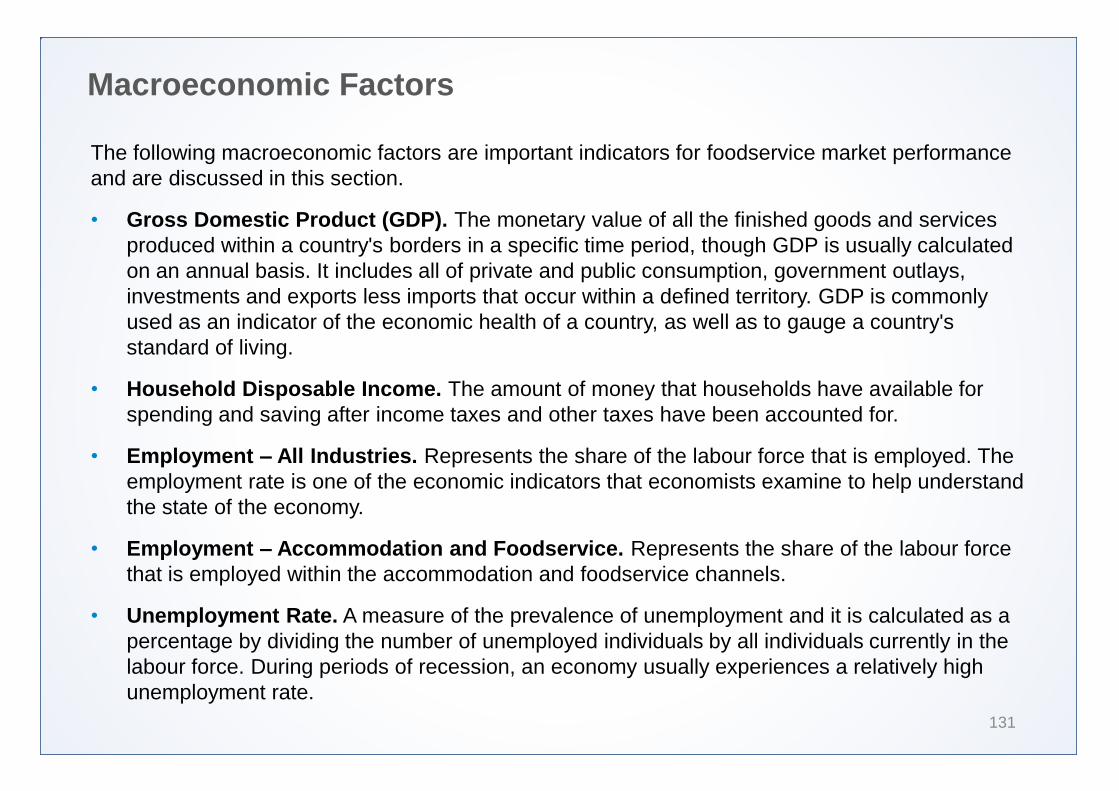
Macroeconomic Factors
131
The following macroeconomic factors are important indicators for foodservice market performance and are discussed in this section.
• Gross Domestic Product (GDP). The monetary value of all the finished goods and services produced within a country's borders in a specific time period, though GDP is usually calculated on an annual basis. It includes all of private and public consumption, government outlays, investments and exports less imports that occur within a defined territory. GDP is commonly used as an indicator of the economic health of a country, as well as to gauge a country's standard of living.
• Household Disposable Income. The amount of money that households have available for spending and saving after income taxes and other taxes have been accounted for.
• Employment – All Industries. Represents the share of the labour force that is employed. The employment rate is one of the economic indicators that economists examine to help understand the state of the economy.
• Employment – Accommodation and Foodservice. Represents the share of the labour force that is employed within the accommodation and foodservice channels.
• Unemployment Rate. A measure of the prevalence of unemployment and it is calculated as a percentage by dividing the number of unemployed individuals by all individuals currently in the labour force. During periods of recession, an economy usually experiences a relatively high unemployment rate.
Macroeconomic Factors (continued)
132
• Consumer Price Index (CPI) – All Items. An index of the variation in prices paid by typical consumers for retail goods and other items.
• Consumer Price Index (CPI) – Food and Non-alcoholic Beverages. An index of the variation in prices paid by typical consumers for food and non-alcoholic beverages.
• Consumer Price Index (CPI) – Restaurants and Hotels. An index of the variation in prices paid by typical consumers for foodservice items purchased at restaurants and hotels. .
• Industrial Price Index – Food. An indicator that measures the variation in prices paid by food manufacturers for inputs and resources.
• Retail Sales Index – Food & Beverage Stores. A measurement of all goods sold by food and beverage retailers based on a sampling of retail stores of different types and sizes. The retail sales index is often taken as an indicator of consumer confidence.
• Retail Sales Index – Bars. A measurement of bar sales based on a sampling of bars, pubs and drinking establishments.
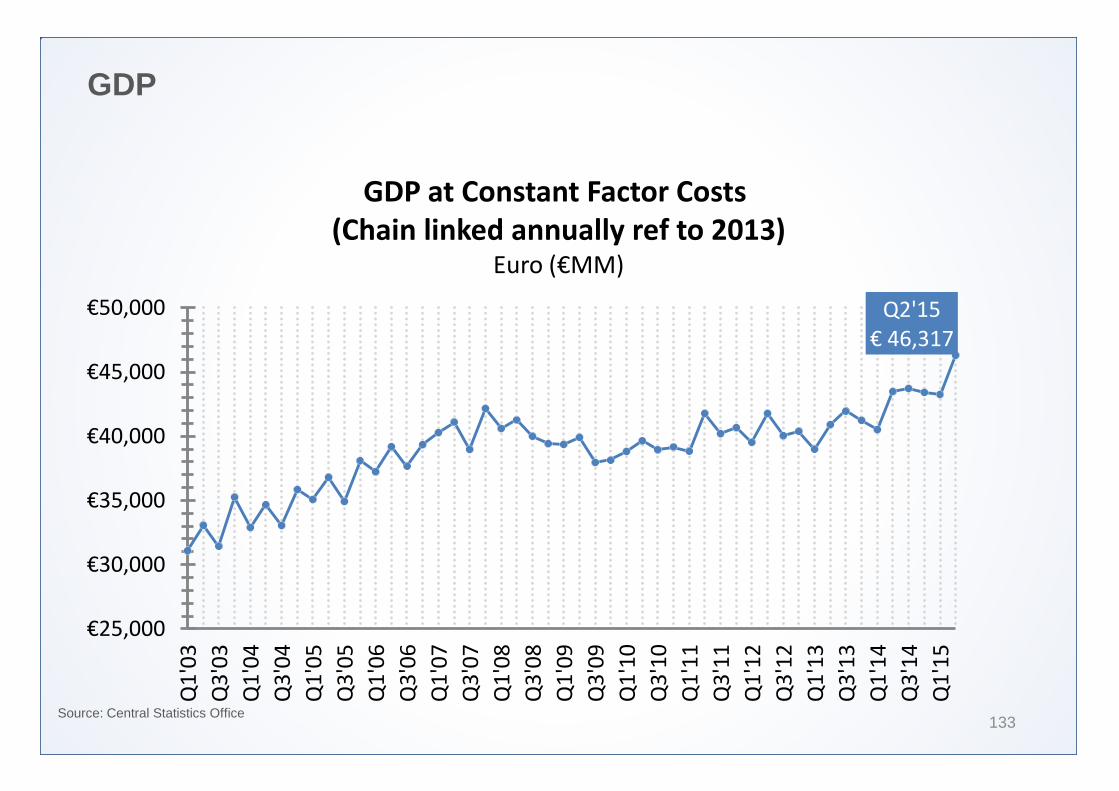
GDP
133 Source: Central Statistics Office
GDP at Constant Factor Costs (Chain linked annually ref to 2013)
Euro (€MM)
Q2'15 € 46,317
€25,000
€30,000
€35,000
€40,000
€45,000
€50,000
Q1
'03
Q3
'03
Q1
'04
Q3
'04
Q1
'05
Q3
'05
Q1
'06
Q3
'06
Q1
'07
Q3
'07
Q1
'08
Q3
'08
Q1
'09
Q3
'09
Q1
'10
Q3
'10
Q1
'11
Q3
'11
Q1
'12
Q3
'12
Q1
'13
Q3
'13
Q1
'14
Q3
'14
Q1
'15
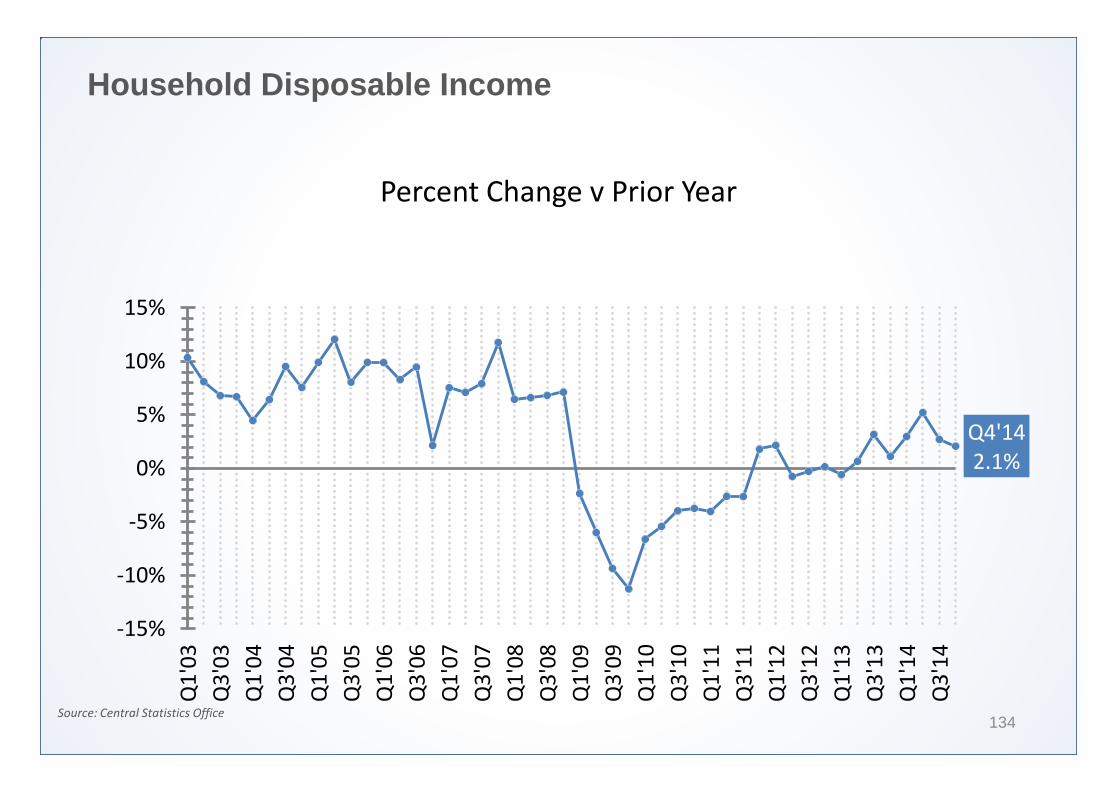
Household Disposable Income
134 Source: Central Statistics Office
Percent Change v Prior Year
Q4'14 2.1%
-15%
-10%
-5%
0%
5%
10%
15%
Q1
'03
Q3
'03
Q1
'04
Q3
'04
Q1
'05
Q3
'05
Q1
'06
Q3
'06
Q1
'07
Q3
'07
Q1
'08
Q3
'08
Q1
'09
Q3
'09
Q1
'10
Q3
'10
Q1
'11
Q3
'11
Q1
'12
Q3
'12
Q1
'13
Q3
'13
Q1
'14
Q3
'14
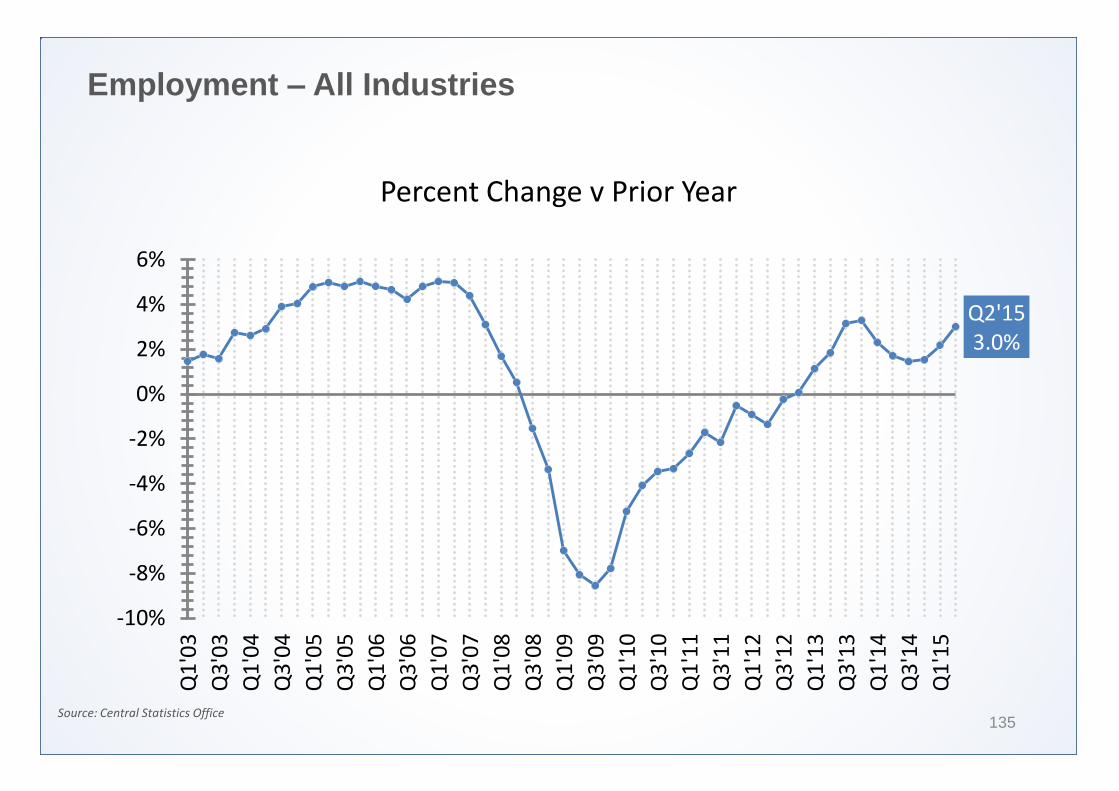
Employment – All Industries
135 Source: Central Statistics Office
Percent Change v Prior Year
Q2'15 3.0%
-10%
-8%
-6%
-4%
-2%
0%
2%
4%
6%
Q1
'03
Q3
'03
Q1
'04
Q3
'04
Q1
'05
Q3
'05
Q1
'06
Q3
'06
Q1
'07
Q3
'07
Q1
'08
Q3
'08
Q1
'09
Q3
'09
Q1
'10
Q3
'10
Q1
'11
Q3
'11
Q1
'12
Q3
'12
Q1
'13
Q3
'13
Q1
'14
Q3
'14
Q1
'15
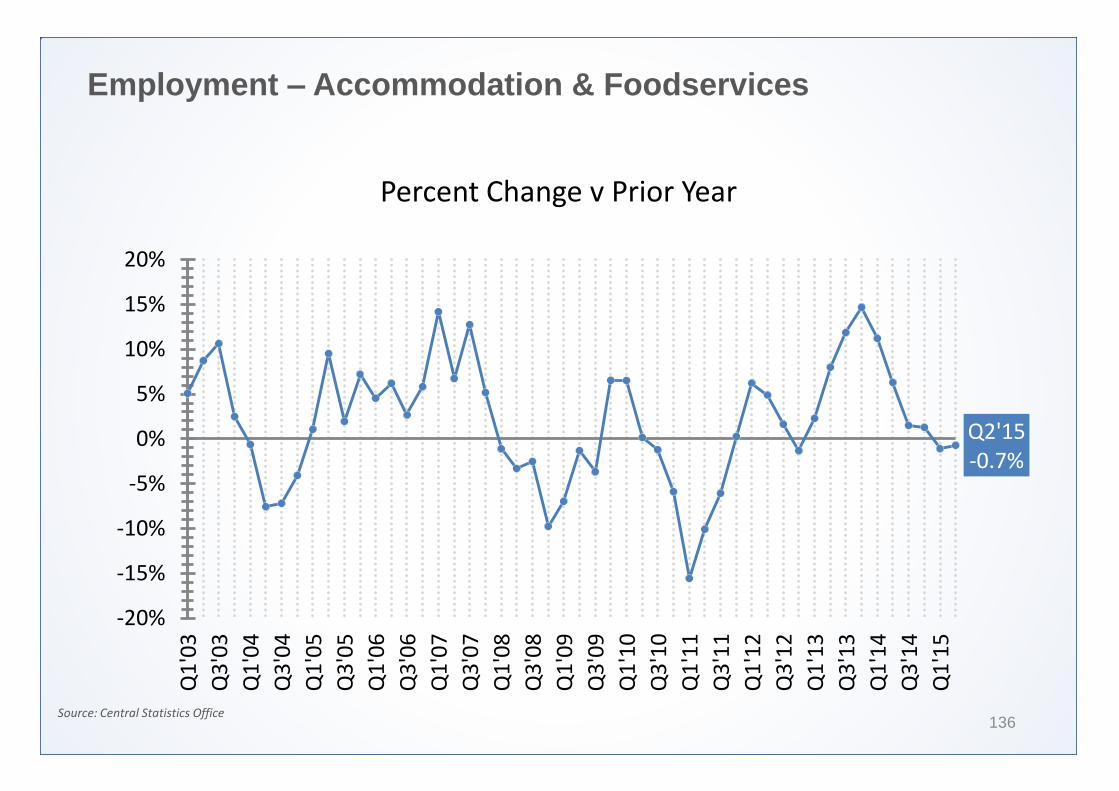
Employment – Accommodation & Foodservices
136 Source: Central Statistics Office
Percent Change v Prior Year
Q2'15 -0.7%
-20%
-15%
-10%
-5%
0%
5%
10%
15%
20%
Q1
'03
Q3
'03
Q1
'04
Q3
'04
Q1
'05
Q3
'05
Q1
'06
Q3
'06
Q1
'07
Q3
'07
Q1
'08
Q3
'08
Q1
'09
Q3
'09
Q1
'10
Q3
'10
Q1
'11
Q3
'11
Q1
'12
Q3
'12
Q1
'13
Q3
'13
Q1
'14
Q3
'14
Q1
'15
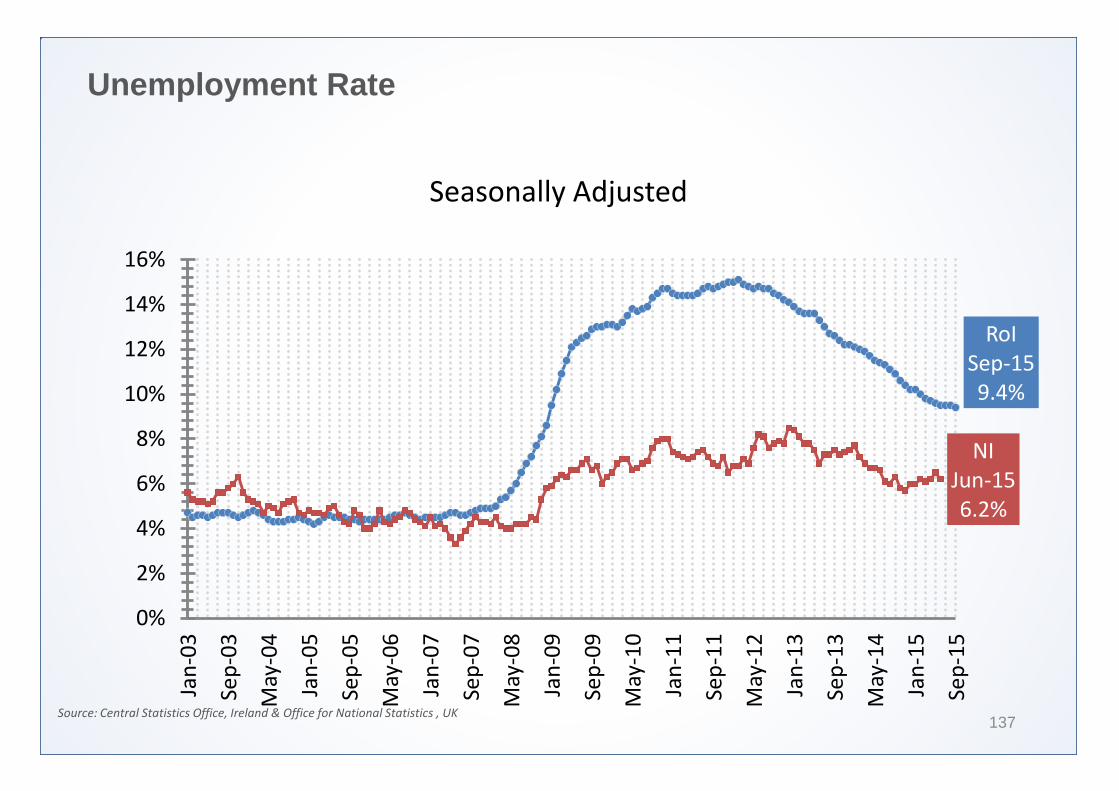
Unemployment Rate
137 Source: Central Statistics Office, Ireland & Office for National Statistics , UK
Seasonally Adjusted
RoI Sep-15 9.4%
NI Jun-15 6.2%
0%
2%
4%
6%
8%
10%
12%
14%
16%
Jan
-03
Sep
-03
May
-04
Jan
-05
Sep
-05
May
-06
Jan
-07
Sep
-07
May
-08
Jan
-09
Sep
-09
May
-10
Jan
-11
Sep
-11
May
-12
Jan
-13
Sep
-13
May
-14
Jan
-15
Sep
-15
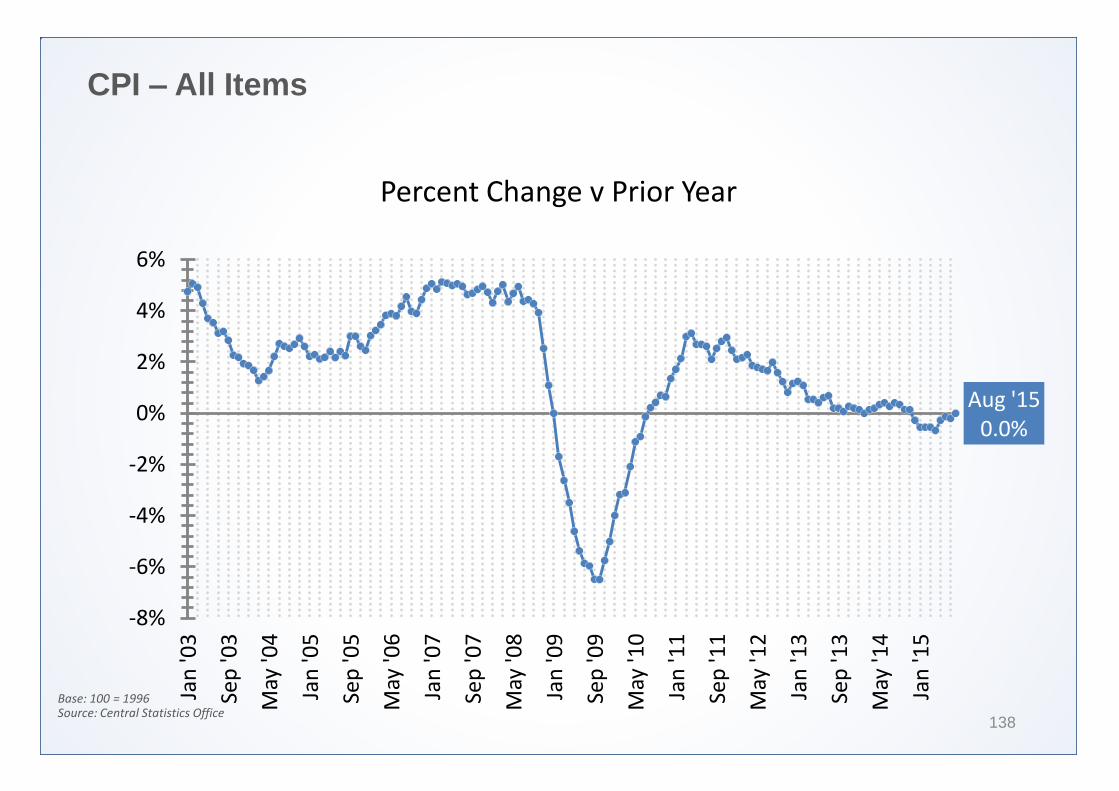
CPI – All Items
138
Base: 100 = 1996 Source: Central Statistics Office
Percent Change v Prior Year
Aug '15 0.0%
-8%
-6%
-4%
-2%
0%
2%
4%
6%
Jan
'03
Sep
'03
May
'04
Jan
'05
Sep
'05
May
'06
Jan
'07
Sep
'07
May
'08
Jan
'09
Sep
'09
May
'10
Jan
'11
Sep
'11
May
'12
Jan
'13
Sep
'13
May
'14
Jan
'15
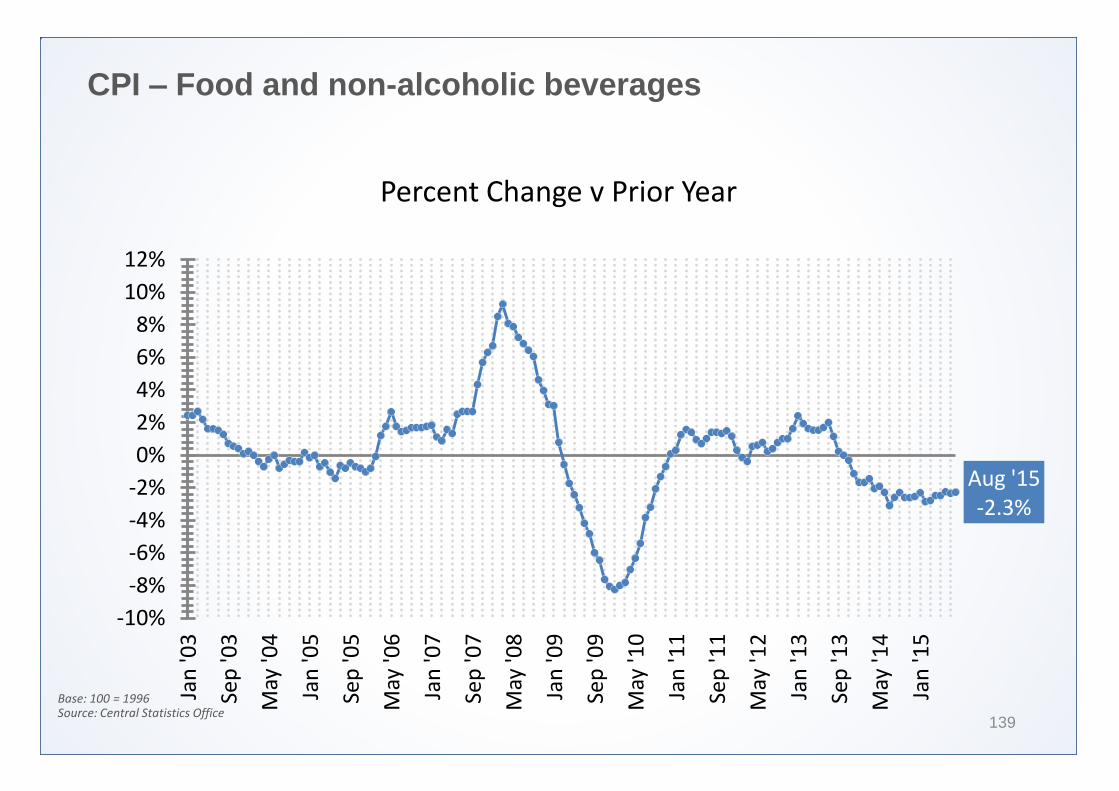
CPI – Food and non-alcoholic beverages
139
Base: 100 = 1996 Source: Central Statistics Office
Percent Change v Prior Year
Aug '15 -2.3%
-10%
-8%
-6%
-4%
-2%
0%
2%
4%
6%
8%
10%
12%
Jan
'03
Sep
'03
May
'04
Jan
'05
Sep
'05
May
'06
Jan
'07
Sep
'07
May
'08
Jan
'09
Sep
'09
May
'10
Jan
'11
Sep
'11
May
'12
Jan
'13
Sep
'13
May
'14
Jan
'15
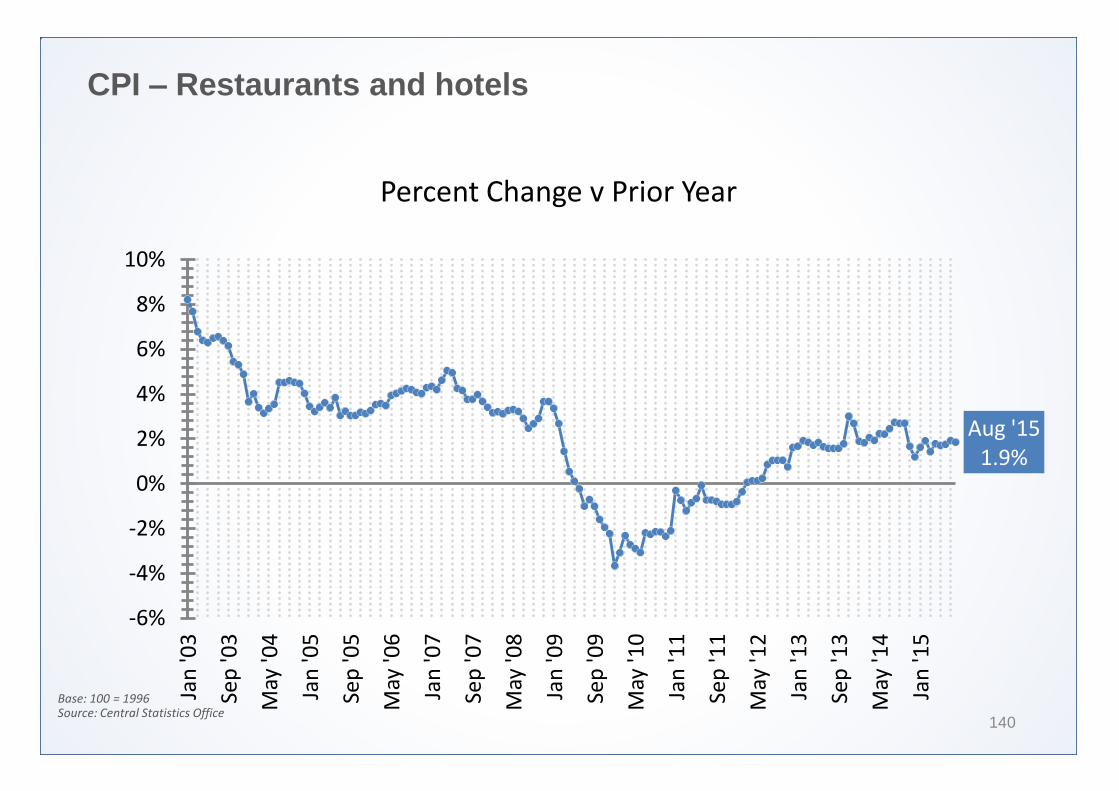
CPI – Restaurants and hotels
140
Base: 100 = 1996 Source: Central Statistics Office
Percent Change v Prior Year
Aug '15 1.9%
-6%
-4%
-2%
0%
2%
4%
6%
8%
10%
Jan
'03
Sep
'03
May
'04
Jan
'05
Sep
'05
May
'06
Jan
'07
Sep
'07
May
'08
Jan
'09
Sep
'09
May
'10
Jan
'11
Sep
'11
May
'12
Jan
'13
Sep
'13
May
'14
Jan
'15
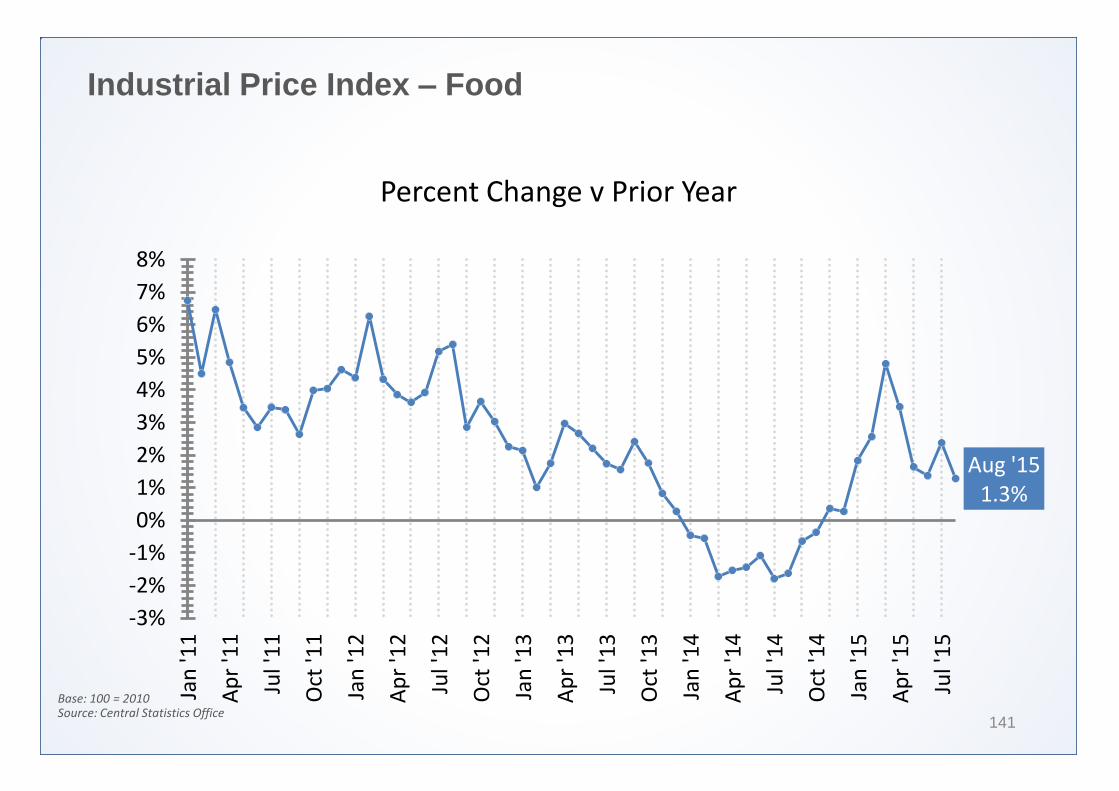
Industrial Price Index – Food
141
Base: 100 = 2010 Source: Central Statistics Office
Percent Change v Prior Year
Aug '15 1.3%
-3%
-2%
-1%
0%
1%
2%
3%
4%
5%
6%
7%
8%
Jan
'11
Ap
r '1
1
Jul '
11
Oct
'11
Jan
'12
Ap
r '1
2
Jul '
12
Oct
'12
Jan
'13
Ap
r '1
3
Jul '
13
Oct
'13
Jan
'14
Ap
r '1
4
Jul '
14
Oct
'14
Jan
'15
Ap
r '1
5
Jul '
15
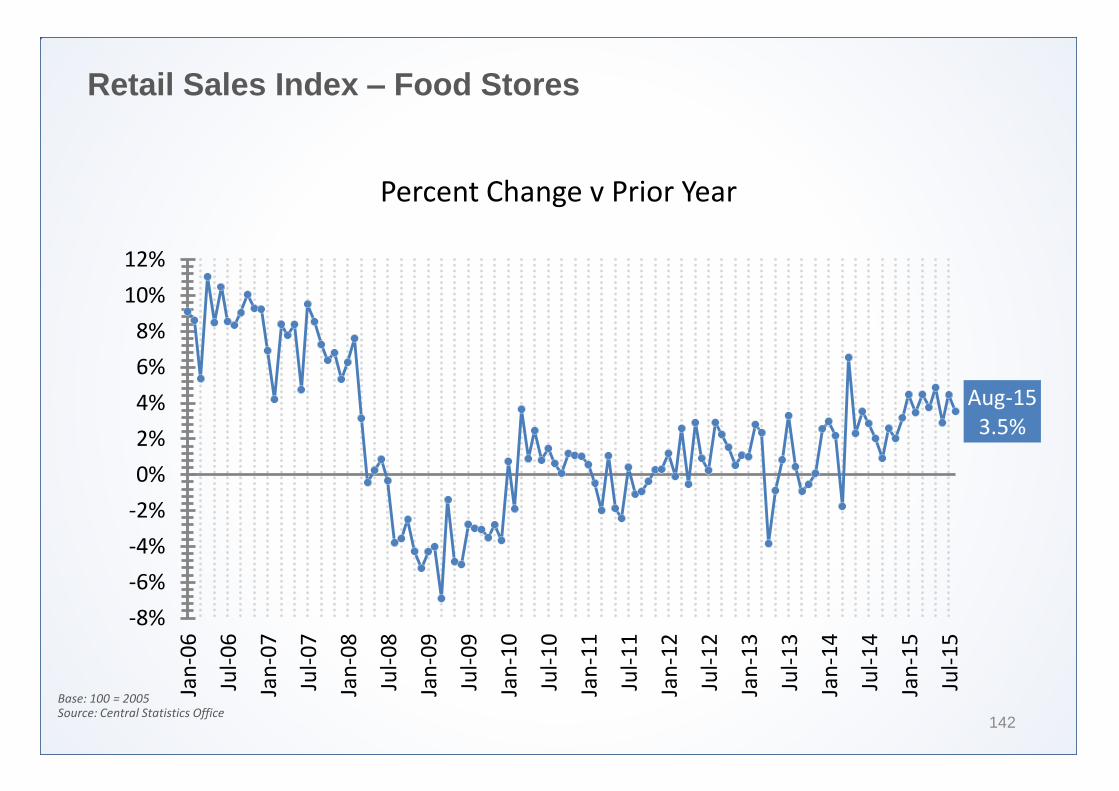
Retail Sales Index – Food Stores
142
Base: 100 = 2005 Source: Central Statistics Office
Percent Change v Prior Year
Aug-15 3.5%
-8%
-6%
-4%
-2%
0%
2%
4%
6%
8%
10%
12%
Jan
-06
Jul-
06
Jan
-07
Jul-
07
Jan
-08
Jul-
08
Jan
-09
Jul-
09
Jan
-10
Jul-
10
Jan
-11
Jul-
11
Jan
-12
Jul-
12
Jan
-13
Jul-
13
Jan
-14
Jul-
14
Jan
-15
Jul-
15
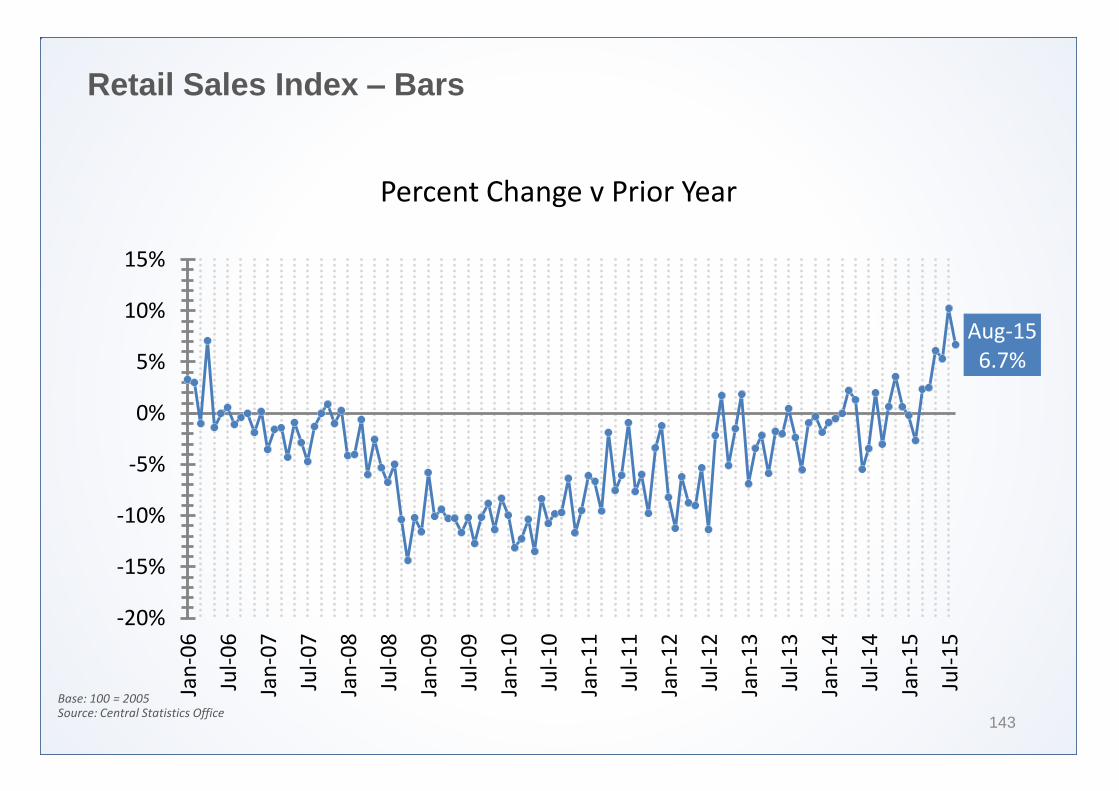
Retail Sales Index – Bars
143
Base: 100 = 2005 Source: Central Statistics Office
Percent Change v Prior Year
Aug-15 6.7%
-20%
-15%
-10%
-5%
0%
5%
10%
15%
Jan
-06
Jul-
06
Jan
-07
Jul-
07
Jan
-08
Jul-
08
Jan
-09
Jul-
09
Jan
-10
Jul-
10
Jan
-11
Jul-
11
Jan
-12
Jul-
12
Jan
-13
Jul-
13
Jan
-14
Jul-
14
Jan
-15
Jul-
15
Contact Information for Technomic
David Henkes Vice President [email protected]
Erik Thoresen Principal [email protected]