queensland ipo study - pitcher partners partners... · queensland ipo study 1 welcome &...
TRANSCRIPT
QUEENSLAND IPO STUDY
NOVEMBER 2013

2
QUEENSLAND IPO STUDY
1 WELCOME & OVERVIEW3 TEN YEARS TO 2012 & 2013 YTD5 INDUSTRY6 CAPITAL & LISTING SIZE9 DEBT, EQUITY & ENTERPRISE VALUES10 IPO FORECAST ACHIEVEMENT11 OFFER PRICE PERFORMANCE12 PRICE PERFORMANCE BY YEAR13 STAR PERFORMERS13 DELISTINGS13 BROKER INVOLVEMENT14 BROKER PERSPECTIVE15 PITCHER PARTNERS’ IPO PERSPECTIVE
CONTENTS
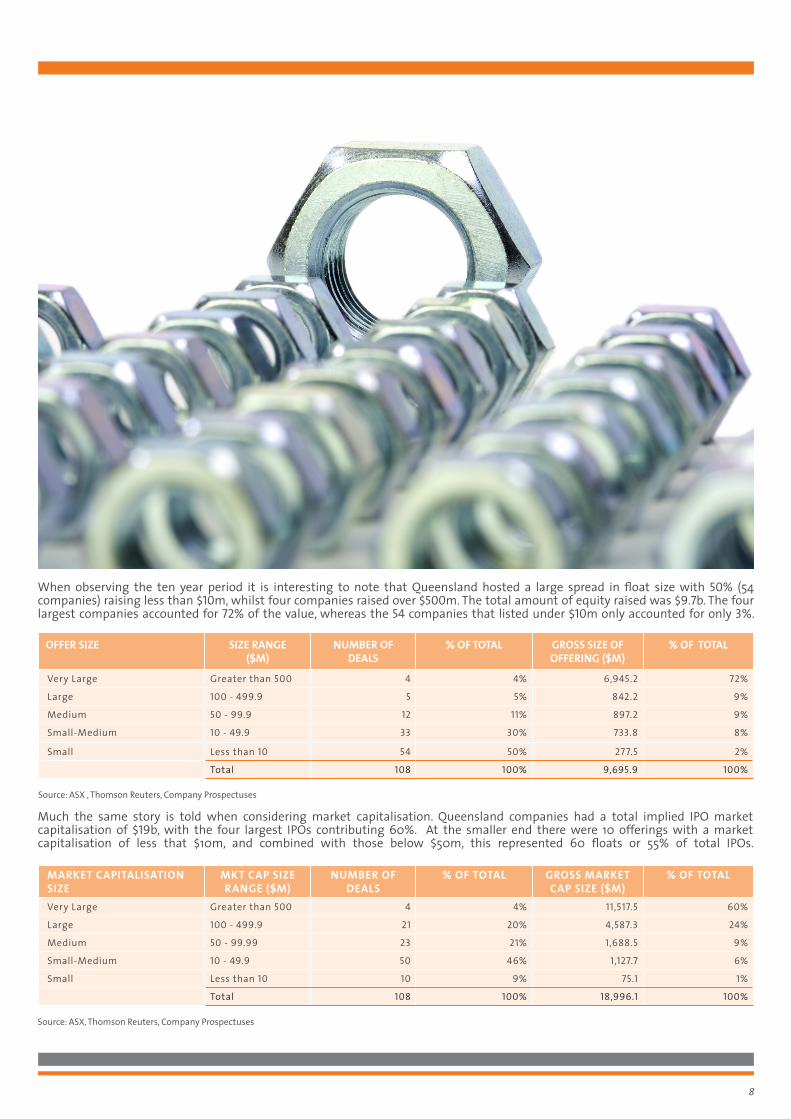
Cover Photo
Wooden lobster fishing floats traditionally painted in colours unique to each boat.
Pitcher Partners are pleased to present the findings of our research on Queensland company Australian Securities Exchange (“ASX”) Initial Public Offerings (“IPOs”) over the calendar years 2003 to 2012, together with a snap shot of the 2013 year to date.IPOs are a key event in a company’s life cycle, they are a great way to finance growth, extract shareholder value and also set the platform for future success. IPO activity is typically dependent on the general state of capital markets, which gives rise to the term “the IPO window is open.” These windows are largely driven by investor sentiment, and are often ‘opened up’ by strong listings like NSW-based Promina in 2006, which was seen as a trigger for a number of subsequent offerings. This report focuses attention on the Queensland IPO market activity over the past 10 years (2003–2012) to illustrate shifts in market sentiment by identifying key trends and also highlighting various examples of success and failure. IPO ACTIVITYThe 10 year period 2003-12 was one of marked contrast. The early years were characterised by strong economic growth (and ASX market growth) brought to a sudden end by the financial crisis of 2008. Whilst annual average IPOs across the 10 year period were 11, the first five years averaged 15 IPOs, and the subsequent five years averaged six IPOs.
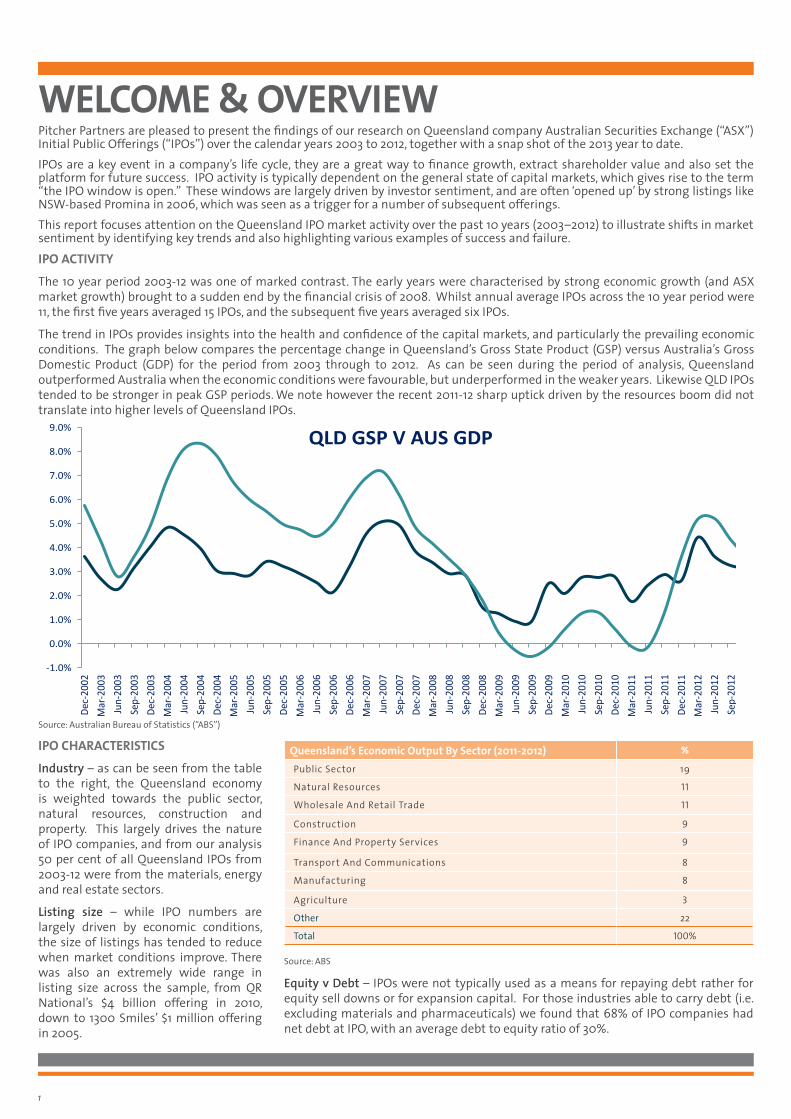
The trend in IPOs provides insights into the health and confidence of the capital markets, and particularly the prevailing economic conditions. The graph below compares the percentage change in Queensland’s Gross State Product (GSP) versus Australia’s Gross Domestic Product (GDP) for the period from 2003 through to 2012. As can be seen during the period of analysis, Queensland outperformed Australia when the economic conditions were favourable, but underperformed in the weaker years. Likewise QLD IPOs tended to be stronger in peak GSP periods. We note however the recent 2011-12 sharp uptick driven by the resources boom did not translate into higher levels of Queensland IPOs.
-1.0%
0.0%
1.0%
2.0%
3.0%
4.0%
5.0%
6.0%
7.0%
8.0%
9.0%
Dec-
2002
M
ar-2
003
Jun-
2003
Se
p-20
03
Dec-
2003
M
ar-2
004
Jun-
2004
Se
p-20
04
Dec-
2004
M
ar-2
005
Jun-
2005
Se
p-20
05
Dec-
2005
M
ar-2
006
Jun-
2006
Se
p-20
06
Dec-
2006
M
ar-2
007
Jun-
2007
Se
p-20
07
Dec-
2007
M
ar-2
008
Jun-
2008
Se
p-20
08
Dec-
2008
M
ar-2
009
Jun-
2009
Se
p-20
09
Dec-
2009
M
ar-2
010
Jun-
2010
Se
p-20
10
Dec-
2010
M
ar-2
011
Jun-
2011
Se
p-20
11
Dec-
2011
M
ar-2
012
Jun-
2012
Se
p-20
12
Dec-
2012
QLD GSP V AUS GDP
Aus GDP Qld GSP
Queensland’s Economic Output By Sector (2011-2012) %
Public Sector 19
Natural Resources 11
Wholesale And Retail Trade 11
Construction 9
Finance And Property Services 9
Transport And Communications 8
Manufacturing 8
Agriculture 3
Other 22
Total 100%
WELCOME & OVERVIEW
Source: ABS
1
IPO CHARACTERISTICSIndustry – as can be seen from the table to the right, the Queensland economy is weighted towards the public sector, natural resources, construction and property. This largely drives the nature of IPO companies, and from our analysis 50 per cent of all Queensland IPOs from 2003-12 were from the materials, energy and real estate sectors.
Listing size – while IPO numbers are largely driven by economic conditions, the size of listings has tended to reduce when market conditions improve. There was also an extremely wide range in listing size across the sample, from QR National’s $4 billion offering in 2010, down to 1300 Smiles’ $1 million offering in 2005.
Source: Australian Bureau of Statistics (“ABS”)
Equity v Debt – IPOs were not typically used as a means for repaying debt rather for equity sell downs or for expansion capital. For those industries able to carry debt (i.e. excluding materials and pharmaceuticals) we found that 68% of IPO companies had net debt at IPO, with an average debt to equity ratio of 30%.
POST IPO PERFORMANCEForecast achievement – IPO forecasts are for many companies key to investors gaining confidence on the business and its prospects. Our analysis of those companies that included forecasts revealed that pleasingly 73% either met or exceeded their EBIT benchmark averaging 15.2%. We note however for those that did miss forecasts it was generally material averaging 7.1%.
Share price performance – annualised IRRs from the date of IPO until 30 June 2013 (or date of delisting) across the sample was 9.0% (excluding dividends or the franking impact thereon). We note again the industry composition revealed the interesting fact that energy, materials and real estate offerings average 1.6% whilst the balance of industries returned 14.2%.
IPO BROKERSWe also extended our analysis to examining broker involvement, both from an IRR perspective and from a deal participation perspective. Not surprisingly those IPOs with brokers returned an average IRR of 10.5% as opposed to those without with a negative 3.3%. Morgans was clearly the leading broker in the Queensland market with mandates on 38% of broker sponsored IPOs. We are pleased they have also provided their perspectives in this report.
We hope you find this report valuable.
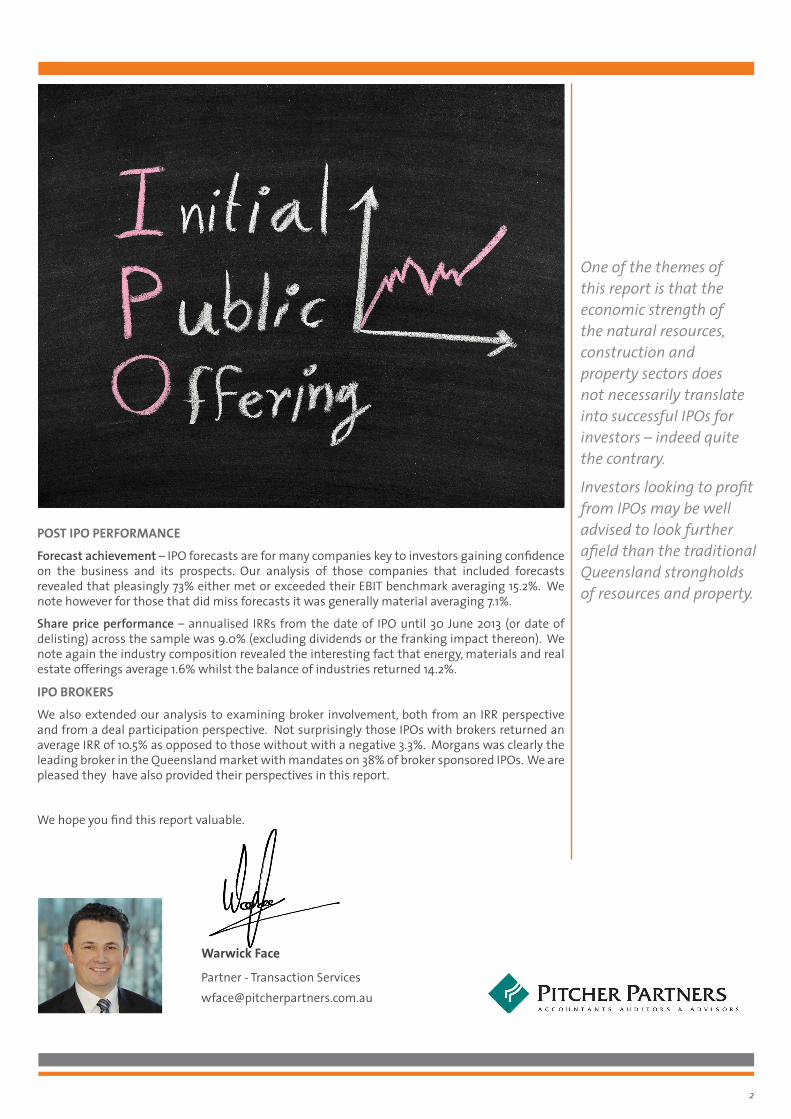
One of the themes of this report is that the economic strength of the natural resources, construction and property sectors does not necessarily translate into successful IPOs for investors – indeed quite the contrary.
Investors looking to profit from IPOs may be well advised to look further afield than the traditional Queensland strongholds of resources and property.
Warwick Face
Partner - Transaction [email protected]
2

� Alchemia � D’Aguilar Gold � Fig Tree
Developments (Village Life)
� Frontier Resources (TasGold)
� Hill End Gold � Innamincka
Petroleum � Landmark White � Lodestone
Exploration � New Hope
Corporation � Virgin Australia
� Allied Brands � Asset Loans � Austin
Engineering � Cardno � CEC Group � CH4 Gas � Diamonex � Hutchinson’s
Childcare � Indigo Pacific � Medigard � Metallica
Minerals � Super Retail � SunnyCove
Management � Tissue Therapies � Trinity
� 1300 Smiles � Auzex Resources � Bow Energy � Diatreme
Resources � Domino’s Pizza
Enterprise � GBST � Norton Goldfields � Pipe Networks � QM Technologies � Reverse Corp � Silver Chef � Transpacific
Industries � Trojan Equity � Vita Group
(Fone Zone)
� ActivEX � Ausenco � Pryme Energy
(Pryme Oil and Gas)
� Linc Energy � North
Queensland Metals
� Oaks Hotels & Resorts
� Pacific Turbine � Retail Food � RiverCity
Motorway � RP Data � Sedgman � Whitesands
Petroleum � Wotif.com
� Aussie Q Resources
� Chinalco Yunnan (China Yunnan Copper Australia)
� Cloncurry Metals � Drummond Gold � G8 Education
(Early Learning)
� Greencross � Gulf Mines � Hedley Leisure
and Gaming (Redcape)
� Hot Rock � Fox Invest � Impedimed � Intrapower � Krucible Metals � Mercury Mobility � Metals Finance
Corporation � Orocobre � Queensland Gold
and Minerals � Tasman
Goldfields � Superior
Resources � Texon � Westside
Corporation � Whitehaven Coal � Wilson HTM
� Brisconnections � Caledon � China Steel � Coppermoly � Orbis Gold
(Mt Isa Metals)
� Pacific Environment
� Queensland Mining
� Runge
TEN YEARS TO 2012 AND 2013 YTD
Source: Capital IQ, Company Prospectuses, ASX
3
2
9 9 9 8 5
1
5 3 2
6
8
6 5 4
15
3
2
7
5 1
10 15 14 13 23 8 3 12 8 2 7
-
1,000
2,000
3,000
4,000
5,000
6,000
7,000
8,000
-
5
10
15
20
25
2003 2004 2005 2006 2007 2008 2009 2010 2011 2012 2013
2nd Half
1st Half
Average listings per year
All Ordinaries
Total Listings >
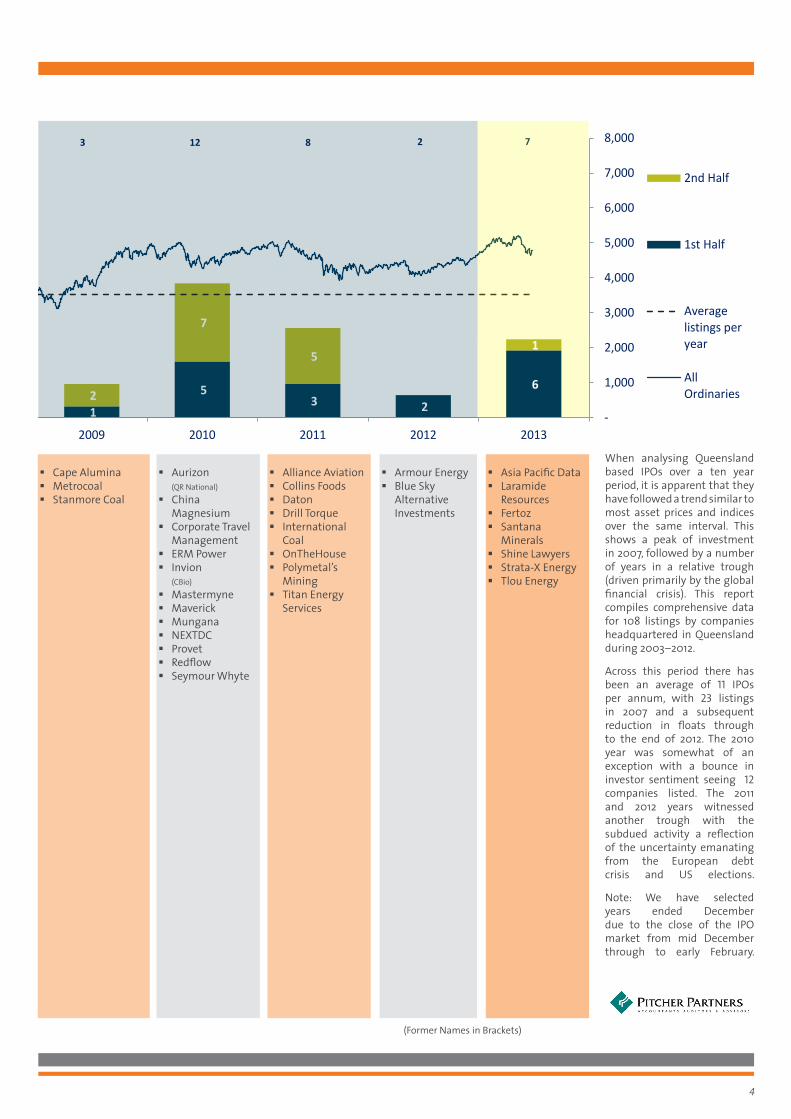
When analysing Queensland based IPOs over a ten year period, it is apparent that they have followed a trend similar to most asset prices and indices over the same interval. This shows a peak of investment in 2007, followed by a number of years in a relative trough (driven primarily by the global financial crisis). This report compiles comprehensive data for 108 listings by companies headquartered in Queensland during 2003–2012.
Across this period there has been an average of 11 IPOs per annum, with 23 listings in 2007 and a subsequent reduction in floats through to the end of 2012. The 2010 year was somewhat of an exception with a bounce in investor sentiment seeing 12 companies listed. The 2011 and 2012 years witnessed another trough with the subdued activity a reflection of the uncertainty emanating from the European debt crisis and US elections.
Note: We have selected years ended December due to the close of the IPO market from mid December through to early February.
� Cape Alumina � Metrocoal � Stanmore Coal
� Aurizon (QR National)
� China Magnesium
� Corporate Travel Management
� ERM Power � Invion
(CBio)
� Mastermyne � Maverick � Mungana � NEXTDC � Provet � Redflow � Seymour Whyte
� Alliance Aviation � Collins Foods � Daton � Drill Torque � International
Coal � OnTheHouse � Polymetal’s
Mining � Titan Energy
Services
� Armour Energy � Blue Sky
Alternative Investments
� Asia Pacific Data � Laramide
Resources � Fertoz � Santana
Minerals � Shine Lawyers � Strata-X Energy � Tlou Energy
(Former Names in Brackets)
4
2
9 9 9 8 5
1
5 3 2
6
8
6 5 4
15
3
2
7
5 1
10 15 14 13 23 8 3 12 8 2 7
-
1,000
2,000
3,000
4,000
5,000
6,000
7,000
8,000
-
5
10
15
20
25
2003 2004 2005 2006 2007 2008 2009 2010 2011 2012 2013
2nd Half
1st Half
Average listings per year
All Ordinaries
Total Listings >
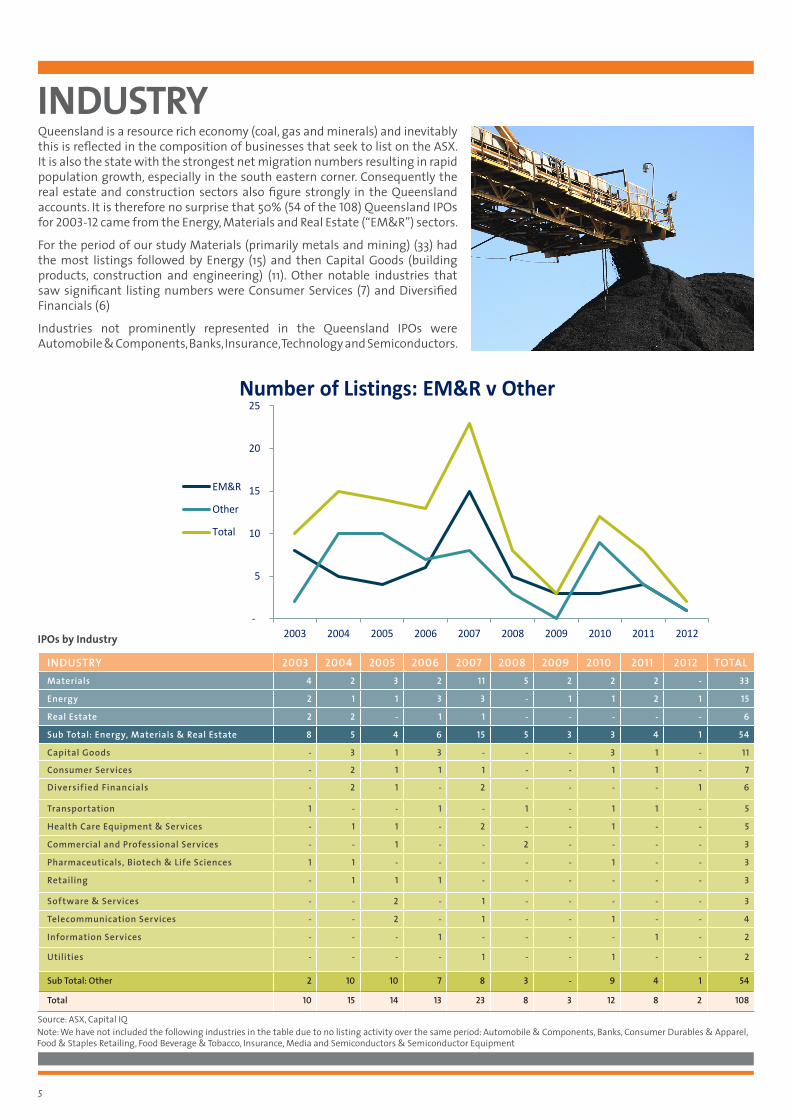
INDUSTRYQueensland is a resource rich economy (coal, gas and minerals) and inevitably this is reflected in the composition of businesses that seek to list on the ASX. It is also the state with the strongest net migration numbers resulting in rapid population growth, especially in the south eastern corner. Consequently the real estate and construction sectors also figure strongly in the Queensland accounts. It is therefore no surprise that 50% (54 of the 108) Queensland IPOs for 2003-12 came from the Energy, Materials and Real Estate (“EM&R”) sectors.
For the period of our study Materials (primarily metals and mining) (33) had the most listings followed by Energy (15) and then Capital Goods (building products, construction and engineering) (11). Other notable industries that saw significant listing numbers were Consumer Services (7) and Diversified Financials (6)
Industries not prominently represented in the Queensland IPOs were Automobile & Components, Banks, Insurance, Technology and Semiconductors.
-
5
10
15
20
25
2003 2004 2005 2006 2007 2008 2009 2010 2011 2012
Number of Listings: EM&R v Other
EM&R
Other
Total
INDUSTRY 2003 2004 2005 2006 2007 2008 2009 2010 2011 2012 TOTALMaterials 4 2 3 2 11 5 2 2 2 - 33
Energy 2 1 1 3 3 - 1 1 2 1 15
Real Estate 2 2 - 1 1 - - - - - 6
Sub Total: Energy, Materials & Real Estate 8 5 4 6 15 5 3 3 4 1 54
Capital Goods - 3 1 3 - - - 3 1 - 11
Consumer Services - 2 1 1 1 - - 1 1 - 7
Diversif ied Financials - 2 1 - 2 - - - - 1 6
Transportation 1 - - 1 - 1 - 1 1 - 5
Health Care Equipment & Services - 1 1 - 2 - - 1 - - 5
Commercial and Professional Services - - 1 - - 2 - - - - 3
Pharmaceuticals, Biotech & Life Sciences 1 1 - - - - - 1 - - 3
Retailing - 1 1 1 - - - - - - 3
Software & Services - - 2 - 1 - - - - - 3
Telecommunication Services - - 2 - 1 - - 1 - - 4
Information Services - - - 1 - - - - 1 - 2
Utilities - - - - 1 - - 1 - - 2
Sub Total: Other 2 10 10 7 8 3 - 9 4 1 54
Total 10 15 14 13 23 8 3 12 8 2 108
Note: We have not included the following industries in the table due to no listing activity over the same period: Automobile & Components, Banks, Consumer Durables & Apparel, Food & Staples Retailing, Food Beverage & Tobacco, Insurance, Media and Semiconductors & Semiconductor Equipment
IPOs by Industry
Source: ASX, Capital IQ
5
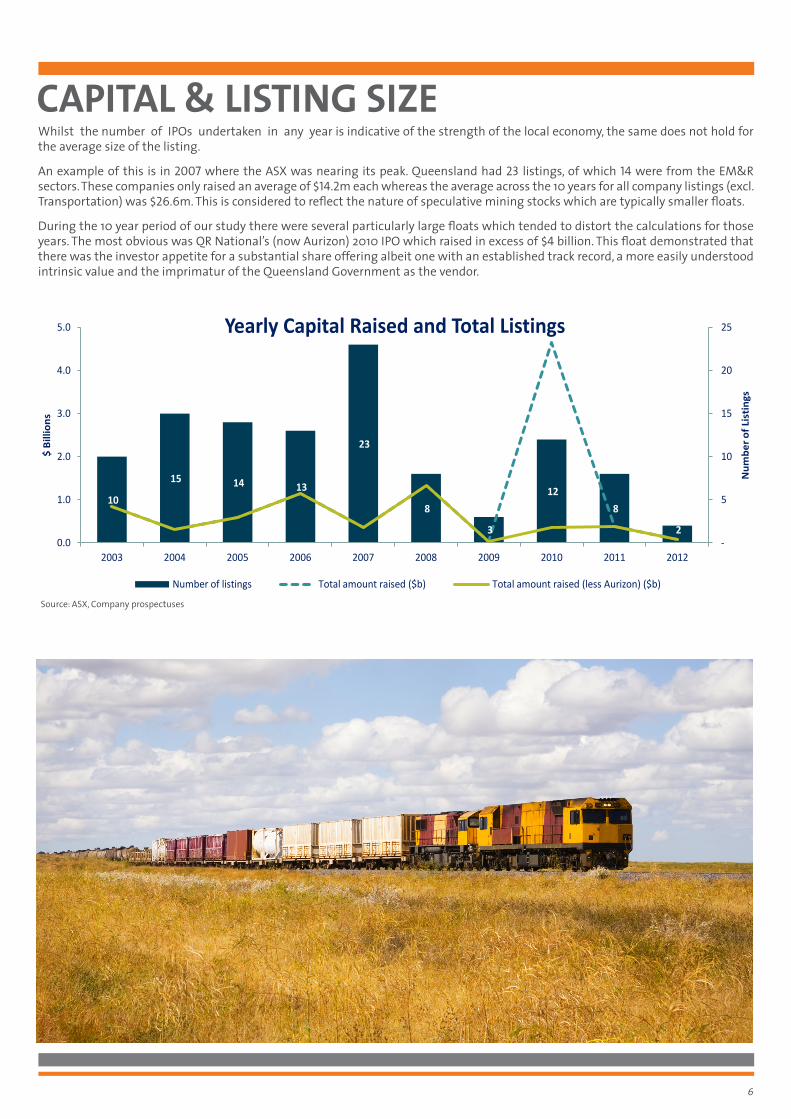
Whilst the number of IPOs undertaken in any year is indicative of the strength of the local economy, the same does not hold for the average size of the listing.
An example of this is in 2007 where the ASX was nearing its peak. Queensland had 23 listings, of which 14 were from the EM&R sectors. These companies only raised an average of $14.2m each whereas the average across the 10 years for all company listings (excl. Transportation) was $26.6m. This is considered to reflect the nature of speculative mining stocks which are typically smaller floats.
During the 10 year period of our study there were several particularly large floats which tended to distort the calculations for those years. The most obvious was QR National’s (now Aurizon) 2010 IPO which raised in excess of $4 billion. This float demonstrated that there was the investor appetite for a substantial share offering albeit one with an established track record, a more easily understood intrinsic value and the imprimatur of the Queensland Government as the vendor.
CAPITAL & LISTING SIZE
10
15 14 13
23
8
3
12 8
2 -
5
10
15
20
25
0.0
1.0
2.0
3.0
4.0
5.0
2003 2004 2005 2006 2007 2008 2009 2010 2011 2012
Num
ber o
f Lis
tings
$ Bi
llion
s
Yearly Capital Raised and Total Listings
Number of listings Total amount raised ($b) Total amount raised (less Aurizon) ($b)
Source: ASX, Company prospectuses
6
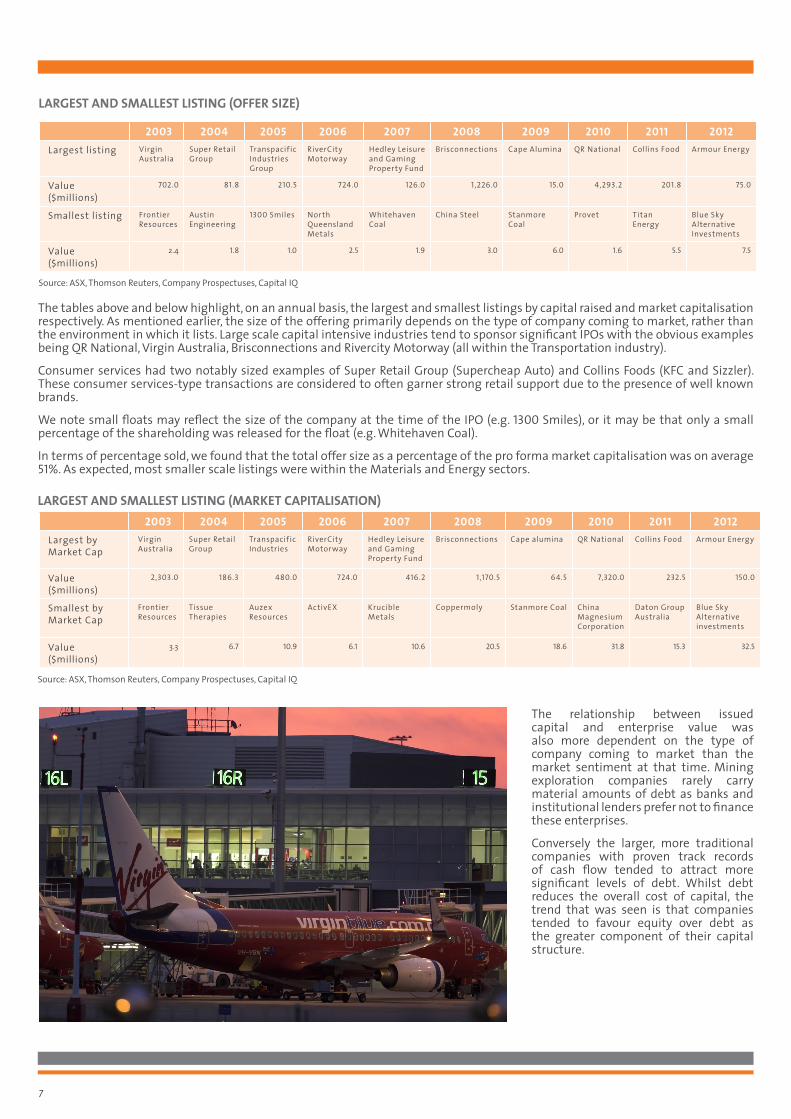
The tables above and below highlight, on an annual basis, the largest and smallest listings by capital raised and market capitalisation respectively. As mentioned earlier, the size of the offering primarily depends on the type of company coming to market, rather than the environment in which it lists. Large scale capital intensive industries tend to sponsor significant IPOs with the obvious examples being QR National, Virgin Australia, Brisconnections and Rivercity Motorway (all within the Transportation industry).
Consumer services had two notably sized examples of Super Retail Group (Supercheap Auto) and Collins Foods (KFC and Sizzler). These consumer services-type transactions are considered to often garner strong retail support due to the presence of well known brands.
We note small floats may reflect the size of the company at the time of the IPO (e.g. 1300 Smiles), or it may be that only a small percentage of the shareholding was released for the float (e.g. Whitehaven Coal).
In terms of percentage sold, we found that the total offer size as a percentage of the pro forma market capitalisation was on average 51%. As expected, most smaller scale listings were within the Materials and Energy sectors.
The relationship between issued capital and enterprise value was also more dependent on the type of company coming to market than the market sentiment at that time. Mining exploration companies rarely carry material amounts of debt as banks and institutional lenders prefer not to finance these enterprises.
Conversely the larger, more traditional companies with proven track records of cash flow tended to attract more significant levels of debt. Whilst debt reduces the overall cost of capital, the trend that was seen is that companies tended to favour equity over debt as the greater component of their capital structure.
2003 2004 2005 2006 2007 2008 2009 2010 2011 2012Largest by Market Cap
Virgin Australia
Super Retail Group
Transpacific Industries
RiverCity Motorway
Hedley Leisure and Gaming Property Fund
Brisconnections Cape alumina QR National Collins Food Armour Energy
Value ($millions)
2,303.0 186.3 480.0 724.0 416.2 1,170.5 64.5 7,320.0 232.5 150.0
Smallest by Market Cap
Frontier Resources
Tissue Therapies
Auzex Resources
ActivEX Krucible Metals
Coppermoly Stanmore Coal China Magnesium Corporation
Daton Group Australia
Blue Sky Alternative investments
Value ($millions)
3.3 6.7 10.9 6.1 10.6 20.5 18.6 31.8 15.3 32.5
2003 2004 2005 2006 2007 2008 2009 2010 2011 2012Largest listing Virgin
AustraliaSuper Retail Group
Transpacific Industries Group
RiverCity Motorway
Hedley Leisure and Gaming Property Fund
Brisconnections Cape Alumina QR National Collins Food Armour Energy
Value ($millions)
702.0 81.8 210.5 724.0 126.0 1,226.0 15.0 4,293.2 201.8 75.0
Smallest listing Frontier Resources
Austin Engineering
1300 Smiles North Queensland Metals
Whitehaven Coal
China Steel Stanmore Coal
Provet Titan Energy
Blue Sky Alternative Investments
Value ($millions)
2.4 1.8 1.0 2.5 1.9 3.0 6.0 1.6 5.5 7.5
LARGEST AND SMALLEST LISTING (OFFER SIZE)
LARGEST AND SMALLEST LISTING (MARKET CAPITALISATION)
Source: ASX, Thomson Reuters, Company Prospectuses, Capital IQ
Source: ASX, Thomson Reuters, Company Prospectuses, Capital IQ
7
When observing the ten year period it is interesting to note that Queensland hosted a large spread in float size with 50% (54 companies) raising less than $10m, whilst four companies raised over $500m. The total amount of equity raised was $9.7b. The four largest companies accounted for 72% of the value, whereas the 54 companies that listed under $10m only accounted for only 3%.
OFFER SIZE SIZE RANGE ($M)
NUMBER OF DEALS
% OF TOTAL GROSS SIZE OF OFFERING ($M)
% OF TOTAL
Very Large Greater than 500 4 4% 6,945.2 72%
Large 100 - 499.9 5 5% 842.2 9%
Medium 50 - 99.9 12 11% 897.2 9%
Small-Medium 10 - 49.9 33 30% 733.8 8%
Small Less than 10 54 50% 277.5 2%
Total 108 100% 9,695.9 100%
MARKET CAPITALISATION SIZE
MKT CAP SIZE RANGE ($M)
NUMBER OF DEALS
% OF TOTAL GROSS MARKET CAP SIZE ($M)
% OF TOTAL
Very Large Greater than 500 4 4% 11,517.5 60%
Large 100 - 499.9 21 20% 4,587.3 24%
Medium 50 - 99.99 23 21% 1,688.5 9%
Small-Medium 10 - 49.9 50 46% 1,127.7 6%
Small Less than 10 10 9% 75.1 1%
Total 108 100% 18,996.1 100%
Much the same story is told when considering market capitalisation. Queensland companies had a total implied IPO market capitalisation of $19b, with the four largest IPOs contributing 60%. At the smaller end there were 10 offerings with a market capitalisation of less that $10m, and combined with those below $50m, this represented 60 floats or 55% of total IPOs.
Source: ASX , Thomson Reuters, Company Prospectuses
Source: ASX, Thomson Reuters, Company Prospectuses
8
50%
28%
24%
20%
15%
2%
1%
1%
50%
72%
76%
80%
85%
98%
99%
99%
104%
104%
105%
114%
131%
135%
152%
(4%)
(4%)
(5%)
(14%)
(31%)
(35%)
(52%)
0% 10% 20% 30% 40% 50% 60% 70% 80% 90% 100%
Real Estate
Transportation
Utilities
Commercial & Professional Services
Consumer Services
Retailing
Information Services
Energy
Software & Services
Health Care Equipment & Services
Capital Goods
Telecommunication Services
Materials
Diversified Financials
Pharmaceuticals, Biotech & Life Sciences
Enterprise Value Components
Net Debt % Implied Mkt Cap % Net Cash %
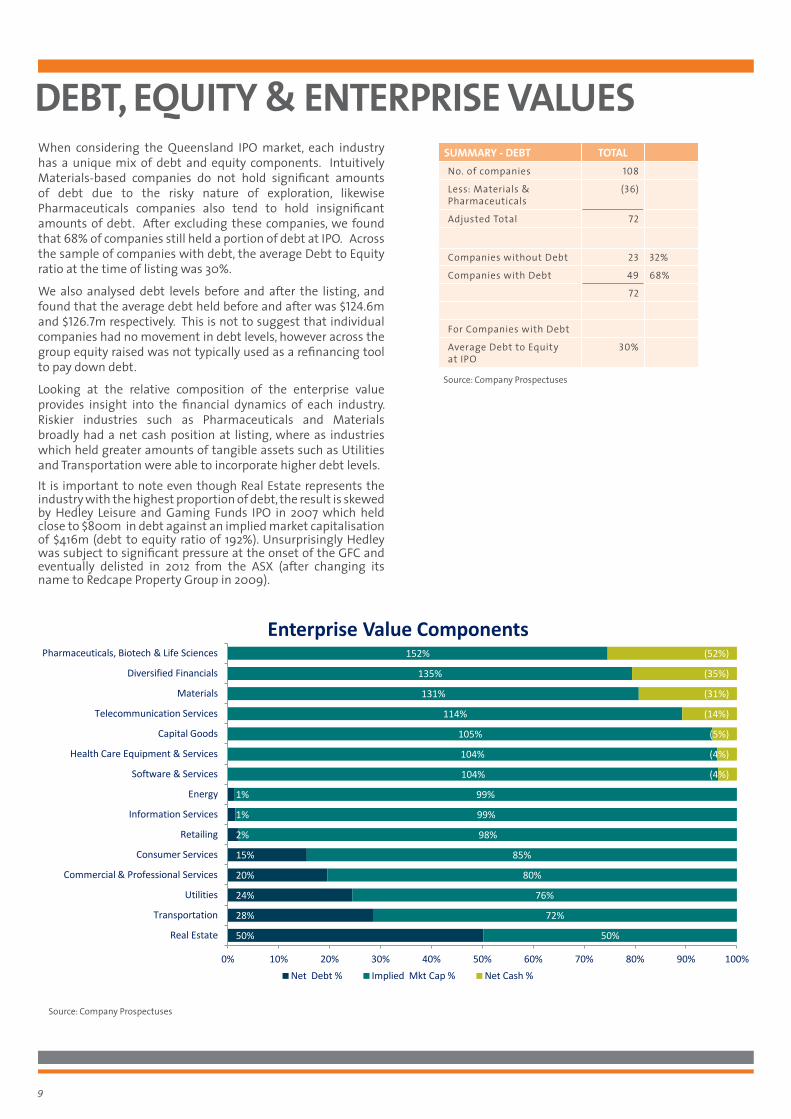
When considering the Queensland IPO market, each industry has a unique mix of debt and equity components. Intuitively Materials-based companies do not hold significant amounts of debt due to the risky nature of exploration, likewise Pharmaceuticals companies also tend to hold insignificant amounts of debt. After excluding these companies, we found that 68% of companies still held a portion of debt at IPO. Across the sample of companies with debt, the average Debt to Equity ratio at the time of listing was 30%.
We also analysed debt levels before and after the listing, and found that the average debt held before and after was $124.6m and $126.7m respectively. This is not to suggest that individual companies had no movement in debt levels, however across the group equity raised was not typically used as a refinancing tool to pay down debt.
Looking at the relative composition of the enterprise value provides insight into the financial dynamics of each industry. Riskier industries such as Pharmaceuticals and Materials broadly had a net cash position at listing, where as industries which held greater amounts of tangible assets such as Utilities and Transportation were able to incorporate higher debt levels.It is important to note even though Real Estate represents the industry with the highest proportion of debt, the result is skewed by Hedley Leisure and Gaming Funds IPO in 2007 which held close to $800m in debt against an implied market capitalisation of $416m (debt to equity ratio of 192%). Unsurprisingly Hedley was subject to significant pressure at the onset of the GFC and eventually delisted in 2012 from the ASX (after changing its name to Redcape Property Group in 2009).
SUMMARY - DEBT TOTALNo. of companies 108
Less: Materials & Pharmaceuticals
(36)
Adjusted Total 72
Companies without Debt 23 32%
Companies with Debt 49 68%
72
For Companies with Debt
Average Debt to Equity at IPO
30%
DEBT, EQUITY & ENTERPRISE VALUES
Source: Company Prospectuses
Source: Company Prospectuses
9
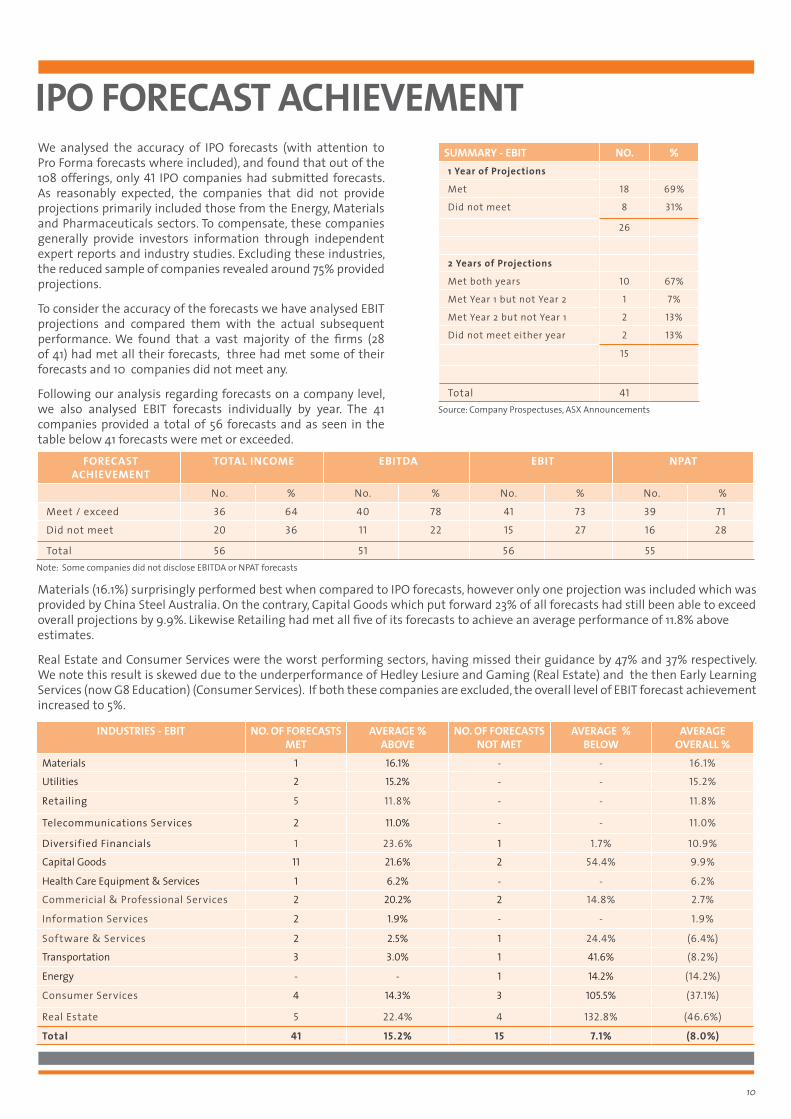
IPO FORECAST ACHIEVEMENT We analysed the accuracy of IPO forecasts (with attention to Pro Forma forecasts where included), and found that out of the 108 offerings, only 41 IPO companies had submitted forecasts. As reasonably expected, the companies that did not provide projections primarily included those from the Energy, Materials and Pharmaceuticals sectors. To compensate, these companies generally provide investors information through independent expert reports and industry studies. Excluding these industries, the reduced sample of companies revealed around 75% provided projections.
To consider the accuracy of the forecasts we have analysed EBIT projections and compared them with the actual subsequent performance. We found that a vast majority of the firms (28 of 41) had met all their forecasts, three had met some of their forecasts and 10 companies did not meet any.
Following our analysis regarding forecasts on a company level, we also analysed EBIT forecasts individually by year. The 41 companies provided a total of 56 forecasts and as seen in the table below 41 forecasts were met or exceeded.
FORECAST ACHIEVEMENT
TOTAL INCOME EBITDA EBIT NPAT
No. % No. % No. % No. %
Meet / exceed 36 64 40 78 41 73 39 71
Did not meet 20 36 11 22 15 27 16 28
Total 56 51 56 55
SUMMARY - EBIT NO. %1 Year of Projections
Met 18 69%
Did not meet 8 31%
26
2 Years of Projections
Met both years 10 67%
Met Year 1 but not Year 2 1 7%
Met Year 2 but not Year 1 2 13%
Did not meet either year 2 13%
15
Total 41Source: Company Prospectuses, ASX Announcements
INDUSTRIES - EBIT NO. OF FORECASTS MET
AVERAGE % ABOVE
NO. OF FORECASTS NOT MET
AVERAGE % BELOW
AVERAGE OVERALL %
Materials 1 16.1% - - 16.1%
Utilities 2 15.2% - - 15.2%
Retailing 5 11.8% - - 11.8%
Telecommunications Services 2 11.0% - - 11.0%
Diversified Financials 1 23.6% 1 1.7% 10.9%
Capital Goods 11 21.6% 2 54.4% 9.9%
Health Care Equipment & Services 1 6.2% - - 6.2%
Commericial & Professional Services 2 20.2% 2 14.8% 2.7%
Information Services 2 1.9% - - 1.9%
Software & Services 2 2.5% 1 24.4% (6.4%)
Transportation 3 3.0% 1 41.6% (8.2%)
Energy - - 1 14.2% (14.2%)
Consumer Services 4 14.3% 3 105.5% (37.1%)
Real Estate 5 22.4% 4 132.8% (46.6%)
Total 41 15.2% 15 7.1% (8.0%)
Materials (16.1%) surprisingly performed best when compared to IPO forecasts, however only one projection was included which was provided by China Steel Australia. On the contrary, Capital Goods which put forward 23% of all forecasts had still been able to exceed overall projections by 9.9%. Likewise Retailing had met all five of its forecasts to achieve an average performance of 11.8% above estimates.
Real Estate and Consumer Services were the worst performing sectors, having missed their guidance by 47% and 37% respectively. We note this result is skewed due to the underperformance of Hedley Lesiure and Gaming (Real Estate) and the then Early Learning Services (now G8 Education) (Consumer Services). If both these companies are excluded, the overall level of EBIT forecast achievement increased to 5%.
Note: Some companies did not disclose EBITDA or NPAT forecasts
10

OFFER PRICE PERFORMANCE We also analysed the performance of IPOs by calculating the internal rate of return (“IRR”) on an annualised basis expressed as a % per annum. This allows for a comparison of a range of company offerings over different time periods. We have calculated the IRRs from the time of float to 30 June 2013 for each stock.
Overall the IPOs in our study delivered an IRR of 9.0% pa. One way of viewing this is to consider having invested $1,000 in each of the 108 offerings and determining the market value of that portfolio at 30 June 2013. The result would have been $190,028. By comparison, if an investor were to allocate capital on the ASX All Ordinaries Index like-for-like with IPOs each year, the investor would have realised a 1.5% p.a. IRR and would have $115,262. Note that this does not allow for dividend payments (nor the franking impact thereon) made over that period (i.e. this measure of IRR is restricted to the capital appreciation of the portfolio).
It is interesting to track the contrasting fortunes of different sectors within the Queensland market. As has been noted earlier, the prominent industries in this state are energy, materials and real estate (EM&R) and 50% of all the floats in the 2003-12 period were from these sectors. Notwithstanding their prominence, floats from this group of industries have substantially underperformed those from the other sectors such as capital goods, consumer services, retailing and health care.
As expected, the performance of the various companies within the EM&R sectors has been particularly volatile. What is noteworthy is that these sectors returned only 1.6% p.a. over the measured period.
There were several notable positive IPOs such as Orocobre, Bow Energy and New Hope Corporation, however their performance has been dramatically offset by the failures of many others.
In all, 42 of the 54 companies floated in the EM&R sectors produced negative returns for the period ended 30 June 2013 with 11 companies producing losses in excess of 90% of their issue price.
By contrast, the companies comprising the “Other” sectors have fared much better. The overall performance of this portfolio of stocks was an IRR of 14.2% p.a. The stand out performers were Pipe Networks, Provet and Corporate Travel Management. Whilst there were some notable failures (infrastructure and hotels being among them), on average this group of sectors clearly outperformed the EM&R floats.
SECTOR NO. OF OFFERINGS IRR (%)Energy, Materials & Real Estate 54 1.6%
All other 54 14.2%
Combined 108 9.0%
Source:ASX, Company prospectuses
11
0%
20%
40%
60%
80%
100%
120%
0 5 10 15 20 25 30 35 40
IRR
%
Months
Return
PRICE PERFORMANCE BY YEAR
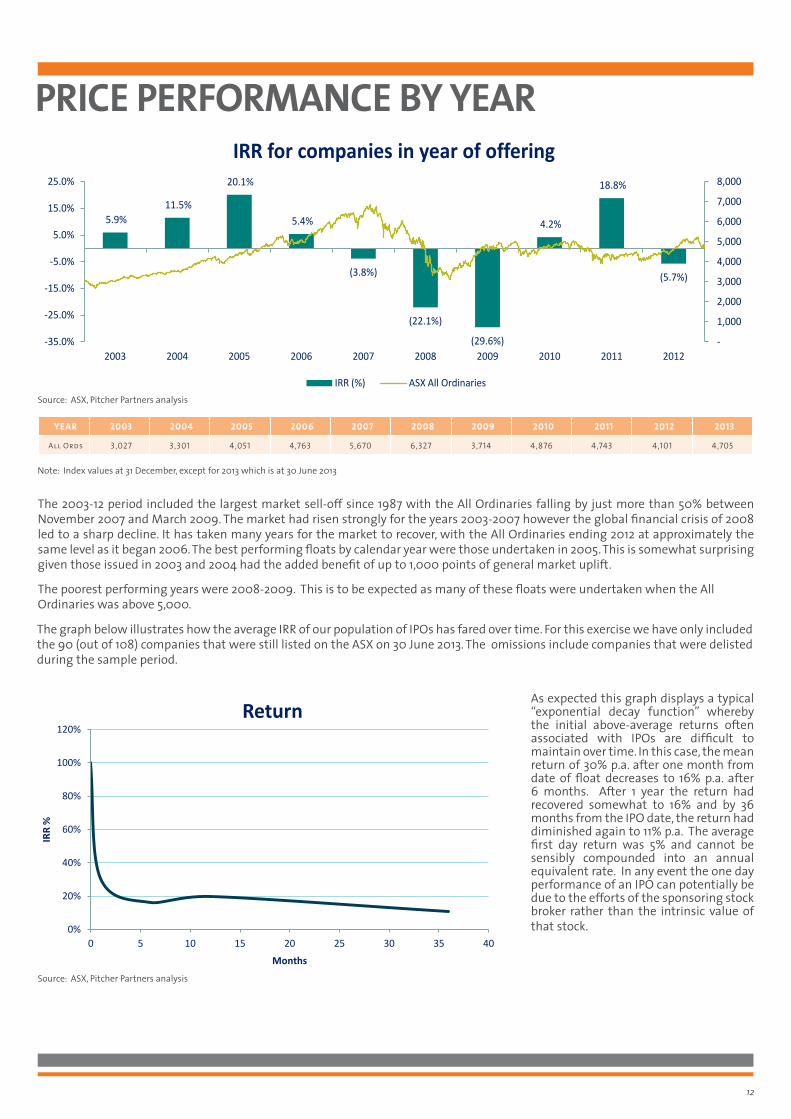
The 2003-12 period included the largest market sell-off since 1987 with the All Ordinaries falling by just more than 50% between November 2007 and March 2009. The market had risen strongly for the years 2003-2007 however the global financial crisis of 2008 led to a sharp decline. It has taken many years for the market to recover, with the All Ordinaries ending 2012 at approximately the same level as it began 2006. The best performing floats by calendar year were those undertaken in 2005. This is somewhat surprising given those issued in 2003 and 2004 had the added benefit of up to 1,000 points of general market uplift.
The poorest performing years were 2008-2009. This is to be expected as many of these floats were undertaken when the All Ordinaries was above 5,000.
5.9% 11.5%
20.1%
5.4%
(3.8%)
(22.1%)
(29.6%)
4.2%
18.8%
(5.7%)
-
1,000
2,000
3,000
4,000
5,000
6,000
7,000
8,000
-35.0%
-25.0%
-15.0%
-5.0%
5.0%
15.0%
25.0%
2003 2004 2005 2006 2007 2008 2009 2010 2011 2012
IRR for companies in year of offering
IRR (%) ASX All Ordinaries
YEAR 2003 2004 2005 2006 2007 2008 2009 2010 2011 2012 2013
All Ords 3,027 3,301 4,051 4,763 5,670 6,327 3,714 4,876 4,743 4,101 4,705
The graph below illustrates how the average IRR of our population of IPOs has fared over time. For this exercise we have only included the 90 (out of 108) companies that were still listed on the ASX on 30 June 2013. The omissions include companies that were delisted during the sample period.
Note: Index values at 31 December, except for 2013 which is at 30 June 2013
Source: ASX, Pitcher Partners analysis
Source: ASX, Pitcher Partners analysis
12
As expected this graph displays a typical “exponential decay function” whereby the initial above-average returns often associated with IPOs are difficult to maintain over time. In this case, the mean return of 30% p.a. after one month from date of float decreases to 16% p.a. after 6 months. After 1 year the return had recovered somewhat to 16% and by 36 months from the IPO date, the return had diminished again to 11% p.a. The average first day return was 5% and cannot be sensibly compounded into an annual equivalent rate. In any event the one day performance of an IPO can potentially be due to the efforts of the sponsoring stock broker rather than the intrinsic value of that stock.
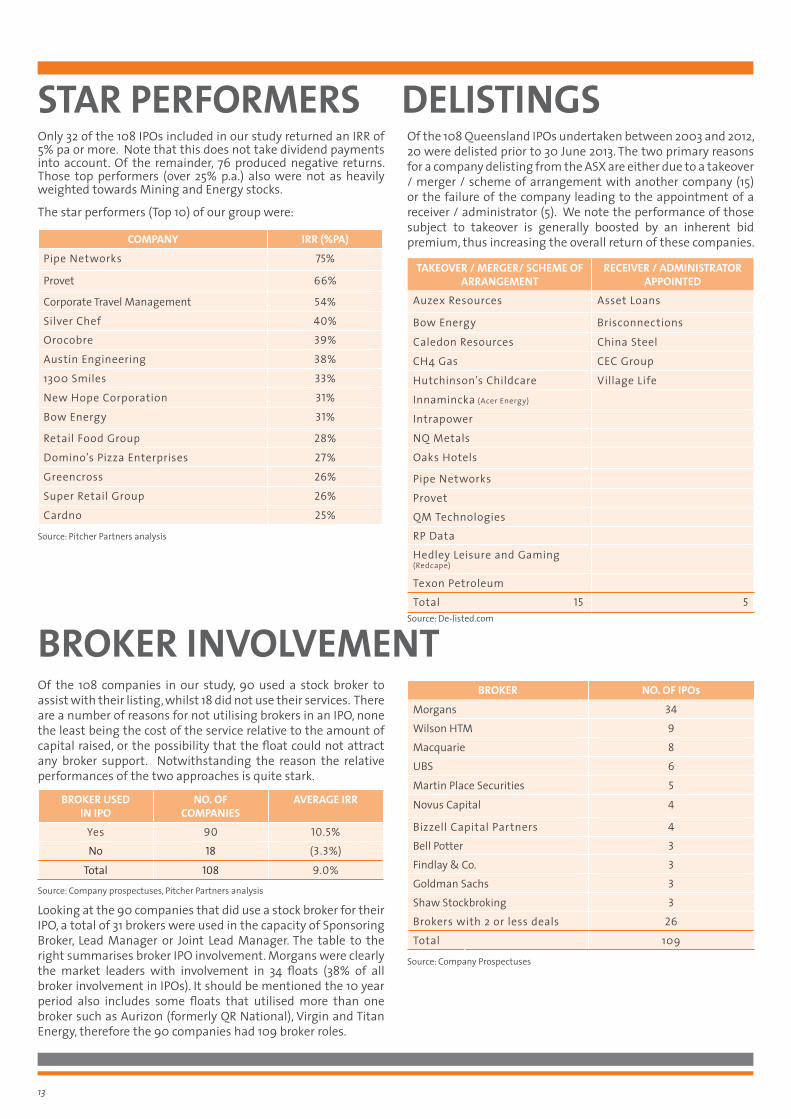
BROKER INVOLVEMENTOf the 108 companies in our study, 90 used a stock broker to assist with their listing, whilst 18 did not use their services. There are a number of reasons for not utilising brokers in an IPO, none the least being the cost of the service relative to the amount of capital raised, or the possibility that the float could not attract any broker support. Notwithstanding the reason the relative performances of the two approaches is quite stark.
Looking at the 90 companies that did use a stock broker for their IPO, a total of 31 brokers were used in the capacity of Sponsoring Broker, Lead Manager or Joint Lead Manager. The table to the right summarises broker IPO involvement. Morgans were clearly the market leaders with involvement in 34 floats (38% of all broker involvement in IPOs). It should be mentioned the 10 year period also includes some floats that utilised more than one broker such as Aurizon (formerly QR National), Virgin and Titan Energy, therefore the 90 companies had 109 broker roles.
Only 32 of the 108 IPOs included in our study returned an IRR of 5% pa or more. Note that this does not take dividend payments into account. Of the remainder, 76 produced negative returns. Those top performers (over 25% p.a.) also were not as heavily weighted towards Mining and Energy stocks.
The star performers (Top 10) of our group were:
DELISTINGSOf the 108 Queensland IPOs undertaken between 2003 and 2012, 20 were delisted prior to 30 June 2013. The two primary reasons for a company delisting from the ASX are either due to a takeover / merger / scheme of arrangement with another company (15) or the failure of the company leading to the appointment of a receiver / administrator (5). We note the performance of those subject to takeover is generally boosted by an inherent bid premium, thus increasing the overall return of these companies.
BROKER NO. OF IPOs
Morgans 34Wilson HTM 9Macquarie 8UBS 6
Martin Place Securities 5
Novus Capital 4
Bizzell Capital Partners 4Bell Potter 3Findlay & Co. 3Goldman Sachs 3Shaw Stockbroking 3Brokers with 2 or less deals 26Total 109
COMPANY IRR (%PA)
Pipe Networks 75%
Provet 66%
Corporate Travel Management 54%
Silver Chef 40%Orocobre 39%
Austin Engineering 38%
1300 Smiles 33%
New Hope Corporation 31%
Bow Energy 31%
Retail Food Group 28%
Domino’s Pizza Enterprises 27%
Greencross 26%
Super Retail Group 26%
Cardno 25%
BROKER USED IN IPO
NO. OF COMPANIES
AVERAGE IRR
Yes 90 10.5%No 18 (3.3%)
Total 108 9.0%
TAKEOVER / MERGER/ SCHEME OF ARRANGEMENT
RECEIVER / ADMINISTRATOR APPOINTED
Auzex Resources Asset Loans
Bow Energy Brisconnections
Caledon Resources China Steel
CH4 Gas CEC Group
Hutchinson’s Childcare Village Life
Innamincka (Acer Energy)
Intrapower
NQ Metals
Oaks Hotels
Pipe Networks
ProvetQM TechnologiesRP DataHedley Leisure and Gaming (Redcape)
Texon PetroleumTotal 15 5
STAR PERFORMERS
Source: De-listed.com
Source: Pitcher Partners analysis
Source: Company prospectuses, Pitcher Partners analysis
Source: Company Prospectuses
13
BROKER PERSPECTIVEMorgans is delighted to have been invited by Pitcher Partners to contribute to their Queensland IPO Study.
The decision to IPO is a major decision for any company. It is with studies and reports like this that company owners, directors and management can access “current” information on this specialist topic to guide and assist their decision making process.
Morgans has been associated with many IPOs over many years working with businesses across a wide spectrum of industries and company sizes.
Market dynamics and regulatory environment constantly change. The key lesson our team has learnt is that a well thought out, structured and planned IPO can create a fantastic platform for successful growth and wealth creation for all stakeholders.
Over the years there have been high profile IPO successes and some notable failures. A key attribute of the failures has been a rushed, poorly structured process, targeting short term objectives rather than putting in place a process that will deliver an aligned, appropriate shareholder base that understands and supports the company’s strategy going forward.
On a positive note, we see the steps to success as reasonably simple.
• Guidance: Employ an experienced IPO team and listen to them. Experience is key in understanding the vagaries of the market and investor sentiment and there have been many examples of how a well-structured and marketed offer can turn potential investors from short term cynics to longer term supporters.
• Understanding: Understand the reasons for wanting to list and communicate them to your advisory team. IPOs are suitable for most businesses but some businesses may not be ready or may never suit the listed environment.
From a broker’s perspective we would like to dispel several myths.
• Timing: Firstly markets do not need to be “on” for an IPO to succeed. Good businesses can access capital markets at any time and in fact many successful businesses have benefitted by floating in tougher markets and rising with economic and market recovery. In this way their share prices increase and become an attractive currency to be used in growing via future acquisitions.
• Pricing: Pricing success in an IPO is not about maximising price but hitting the right level to get the right investors. We have seen some IPO processes based on auction pricing which have led to poor aftermarket activity and a hangover period for the share price. Investors like winners not losers and getting off to a great start will set the company to be re-rated in the market and creating real wealth for shareholders over an extended period
The listed company market in Queensland has seen significant change over the last 30 years. In 1983, the largest company in Queensland by far was MIM Holdings Limited capitalised at $1.3bn (it was also one of the biggest companies in Australia at the time). Today, 13 of Queensland’s largest listed companies are larger than MIM and 40 of Queensland’s top 50 listed companies either did not exist or were not listed companies 30 years ago. Many of these are now familiar household names.
For many companies, the IPO is just a part of the journey. Today’s IPOs have the potential to be tomorrow’s leading companies.
On 4 November 2013, RBS Morgans will be changing its name to Morgans. This follows the announcement in May 2013 of our strategic alliance with CIMB Group, who are the biggest Asia Pacific (ex-Japan) based investment bank and fifth largest universal banking group in the ASEAN region. While our name is changing, there will be no change to the principles and culture that have guided our firm for over 30 years since Morgans was founded in Brisbane.
Morgans is very proud to be associated with the large number of companies we have supported through the IPO stage are beyond as growing and successful listed companies.
14
Anthony Kirk
Executive Director, Head of Corporate Advisory
anthony [email protected]
Brian Sheahan
Managing Director
Philip Lee
Executive Director, Corporate Advisory
PITCHER PARTNERS’ IPO PERSPECTIVE
ADVANTAGES DISADVANTAGES• Access to capital to sustain growth • Potential loss of control• Improved access to debt • Escrow and other share sale restrictions• Increased publicity / profile / enhanced coporate image • Publicity / loss of privacy / investor / media / broker scrutiny• Shareholders realising a portion of their investments (diversification
of wealth)• Periodic reporting / continuous disclosure / increased
administration• Enhanced staff participation / staff retention • Costly and time consuming IPO process• Ability to offer shares as consideration for acquisitions • Ongoing cost associated with being a listed company
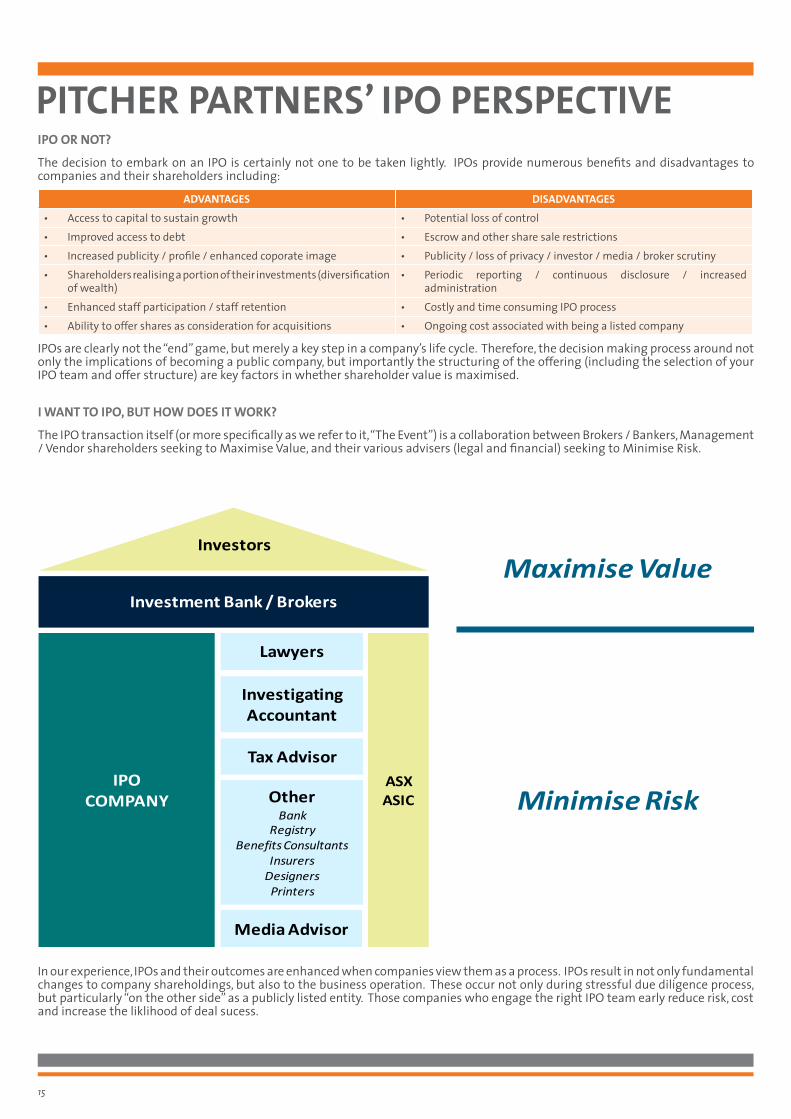
I WANT TO IPO, BUT HOW DOES IT WORK?
The IPO transaction itself (or more specifically as we refer to it, “The Event”) is a collaboration between Brokers / Bankers, Management / Vendor shareholders seeking to Maximise Value, and their various advisers (legal and financial) seeking to Minimise Risk.
15
Investment Bank / Brokers
IPO COMPANY
Lawyers
Investigating Accountant
OtherBank
RegistryBenefits Consultants
InsurersDesigners Printers
Investors
ASX ASIC
Maximise Value
Minimise Risk
Tax Advisor
Media Advisor
In our experience, IPOs and their outcomes are enhanced when companies view them as a process. IPOs result in not only fundamental changes to company shareholdings, but also to the business operation. These occur not only during stressful due diligence process, but particularly “on the other side” as a publicly listed entity. Those companies who engage the right IPO team early reduce risk, cost and increase the liklihood of deal sucess.
IPO OR NOT?
The decision to embark on an IPO is certainly not one to be taken lightly. IPOs provide numerous benefits and disadvantages to companies and their shareholders including:
IPOs are clearly not the “end” game, but merely a key step in a company’s life cycle. Therefore, the decision making process around not only the implications of becoming a public company, but importantly the structuring of the offering (including the selection of your IPO team and offer structure) are key factors in whether shareholder value is maximised.
WHAT MAKES THE DIFFERENCE ON AN IPO?
Company valuations are driven by many factors not least profitability, growth and market positioning. Whist robust financial information is the cornerstone to any IPO process, non-financial factors such as the strength of the management team are also critical.
The depth of the IPO due diligence process reflects the risk of transition from private to public status, and the way management performs in this process is a major test. It should be noted the ability of IPO advisers to ensure the IPO “gets away” is largely reliant on management delivering quality information, whilst at the same time ensuring the business is not going off track.
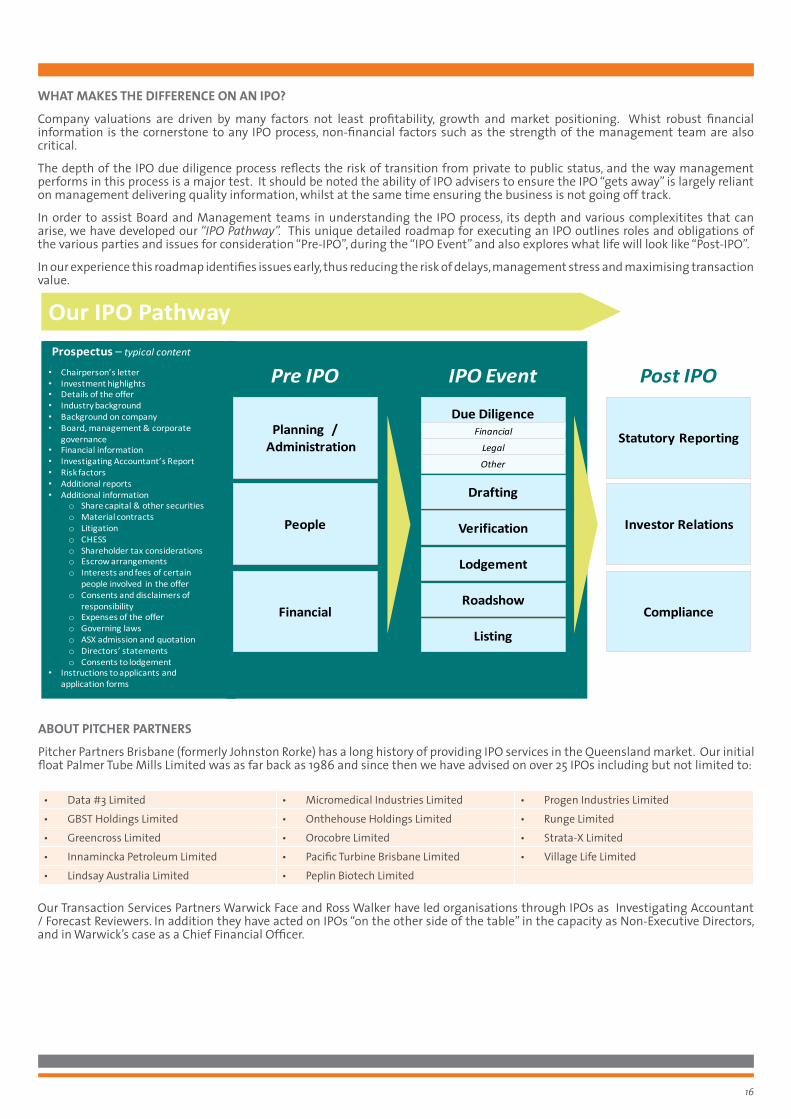
In order to assist Board and Management teams in understanding the IPO process, its depth and various complexitites that can arise, we have developed our “IPO Pathway”. This unique detailed roadmap for executing an IPO outlines roles and obligations of the various parties and issues for consideration “Pre-IPO”, during the “IPO Event” and also explores what life will look like “Post-IPO”.
In our experience this roadmap identifies issues early, thus reducing the risk of delays, management stress and maximising transaction value.
ABOUT PITCHER PARTNERS
Pitcher Partners Brisbane (formerly Johnston Rorke) has a long history of providing IPO services in the Queensland market. Our initial float Palmer Tube Mills Limited was as far back as 1986 and since then we have advised on over 25 IPOs including but not limited to:
Our Transaction Services Partners Warwick Face and Ross Walker have led organisations through IPOs as Investigating Accountant / Forecast Reviewers. In addition they have acted on IPOs “on the other side of the table” in the capacity as Non-Executive Directors, and in Warwick’s case as a Chief Financial Officer.
16
• Chairperson’s letter• Investment highlights• Details of the offer• Industry background• Background on company• Board, management & corporate
governance• Financial information• Investigating Accountant’s Report• Risk factors• Additional reports• Additional information
o Share capital & other securitieso Material contractso Litigationo CHESSo Shareholder tax considerationso Escrow arrangementso Interests and fees of certain
people involved in the offero Consents and disclaimers of
responsibilityo Expenses of the offero Governing lawso ASX admission and quotationo Directors’ statementso Consents to lodgement
• Instructions to applicants and application forms
Prospectus – typical content
Planning / Administration
Pre IPO IPO Event Post IPO
People
Financial
Statutory Reporting
Investor Relations
Compliance
Due DiligenceFinancial
Legal
Other
Drafting
Verification
Roadshow
Listing
Lodgement
Our IPO PathwayOur IPO Pathway
• Data #3 Limited • Micromedical Industries Limited • Progen Industries Limited• GBST Holdings Limited • Onthehouse Holdings Limited • Runge Limited• Greencross Limited • Orocobre Limited • Strata-X Limited• Innamincka Petroleum Limited • Pacific Turbine Brisbane Limited • Village Life Limited• Lindsay Australia Limited • Peplin Biotech Limited
Warwick Face Partner - Transaction Services Telephone +61 7 3222 8302 [email protected]
MELBOURNE Telephone +61 3 8610 5000 [email protected]
SYDNEY Telephone +61 2 9221 2099 [email protected]
PERTH Telephone +61 8 9322 2022 [email protected]
ADELAIDE Telephone +61 8 8179 2800 [email protected]
BRISBANE Telephone +61 7 3222 8444 [email protected]
The material contained in this publication is general commentary only. None of the material is, or should be regarded as advice. Accordingly, no person should rely on any of the contents of this publication without first obtaining specific advice from one of the Partners of Pitcher Partners. Pitcher Partners, its Principals & agents accept no responsibility to any person who acts or relies in any way on any of the material without first obtaining such specific advice. © Pitcher Partners 2013
Pitcher Partners is an association of independent firms.
Ross Walker Partner - Transaction Services Telephone +61 7 3222 8406 [email protected]
NEWCASTLE Telephone +61 2 4931 6000 [email protected]