quarterly statement as of september 30, 2021
TRANSCRIPT

QUARTERLY STATEMENT
AS OF SEPTEMBER 30, 2021
WERDOHL, OCTOBER 28, 2021

DISCLAIMER
This presentation contains statements concerning the future business performance of the Vossloh Group that are based on assumptions and
estimates from the Company management. If the assumptions that the projections are based on fail to occur, the actual results of the projected
statements may differ substantially. Uncertainties include changes in the political, commercial and economic climate, the actions of competitors,
natural catastrophes, epidemics, legislative reforms, the effects of future case law and fluctuations in exchange rates and interest rates. Vossloh
and its Group companies, consultants and representatives assume no responsibility for possible losses associated with the use of this
presentation or its contents. Vossloh assumes no obligation to update the forecast statements in this presentation.
The information contained in this presentation does not constitute an offer or an invitation to sell or buy Vossloh shares or the shares of other
companies.
NOTE
2 Quarterly Statement Q3/2021

VOSSLOH GROUPSTRONG THIRD QUARTER DESPITE SIGNIFICANT BURDENS FROM SUBSTANTIALLY HIGHER MATERIAL PRICES
Quarterly Statement Q3/20213
CONTINUING STRONG
OPERATIONAL BUSINESS
DEVELOPMENT
GOOD ORDER SITUATION
THANKS TO IMPORTANT
SALES SUCCESSES
Orders received in Q3 slightly below previous year
(€223.0 million) at €207.9 million; book-to-bill after
9M 2021 at 0.96; high orders received expected in Q4
Order volume for published framework agreements
in 2021 with ARTC (Australia), ProRail (the
Netherlands), STIB (Belgium) and Bane NOR (Norway)
totaling well over €200 million; of this, only around
€18 million included in orders received 9M 2021
New framework agreement with Queensland Rail for
the supply of concrete ties in Australia and
strategically important contract for a major project in
Turkey for the supply of rail infrastructure
components signed in October
Sales in Q3 2021 up 5.0 percent to €235.8 million,
9M 2021 up 13.1 percent to €698.4 million
Increase compared to previous year mainly due to
Core Components (Vossloh Fastening Systems);
Customized Modules slightly above previous year,
Lifecycle Solutions stable
EBIT of €19.8 million in Q3 2021 very encouraging in
light of the burdens from higher material prices
(previous year: €24.5 million)
EBIT after 9M 2021 increased to €62.2 million
(previous year: €54.5 million, boosted by a positive
book effect of €15.6 million); main driver of the
improvement is the China business from Vossloh
Fastening Systems
Net income in Q3 2021 of €13.2 million (previous
year’s quarter: €18.7 million); after 9M 2021 improved
by €24.7 million to €33.8 million
Earnings per share almost tripled to €1.30 after
9M 2021 (previous year: €0.45)
Free cash flow in Q3 2021 at €25.5 million;
after 9M 2021 at €9.8 million significantly improved
compared to previous year (€(51.9) million, including
€(54.1) million from discontinued operations)
Equity ratio at a very high level of 45.5 percent also
thanks to hybrid note (September 30, 2020:
32.8 percent); substantially strengthened balance
sheet significantly increases financial flexibility

VOSSLOH GROUPINNOVATIVE VOSSLOH SERVICE PORTFOLIO MAKES IMPORTANT CONTRIBUTION TO SUSTAINABLE MOBILITY
Quarterly Statement Q3/20214
FURTHER PROGRESS IN
SUSTAINABILITY
INVESTMENT PROGRAMS TO
PROMOTE RAIL
SUCCESSES IN THE SERVICE
BUSINESS
Sustainability has been a high priority at Vossloh for
many years; selected successes:
− CO2 intensity reduced by 10 percent between 2017
and 2019 (compared to 2020 by just under
20 percent)
− All German production sites switched to green
power
− Top ratings from renowned agencies (including
Prime Status with ISS ESG, AA with MSCI ESG
Research, Silver with Ecovadis)
Group-wide sustainability program adopted by the
Executive Board in September 2021; Group-wide
framework created for central alignment of global
sustainability activities; reprioritization of key issues
and translation into Group-wide targets ongoing
Sustainability commitment of the Executive Board
underscores even greater focus on sustainability
(Sustainability commitment of the Executive
Board)
First use of milling technology at a Class I operator in
the USA, 30 shifts successfully completed; strong
interest from other Class I operators and transit
customers
Market leadership in milling extended by winning
framework agreement with Trafikverket in Sweden
Deployment of the smart HSG-city in Italy, diagnostic
and grinding services for tailored maintenance for
the customer Milan Metro
Operation of high-performance milling machine in
Europe starting in November; innovative milling
technology enables more material removal and
higher speed
Numerous investment programs to promote rail
mobility have been set up around the world, but in
many cases long planning periods are expected
before implementation:
− USA: USD 66 billion for Amtrak and USD 90 billion
for total transit infrastructure (final passage in
House of Representatives pending)
− Germany: €86 billion for rail infrastructure
maintenance and modernization until 2030 plus
€5.5 billion for “Digital Rail”
− Italy: €23 billion, a significant portion for massive
expansion of the high-speed network
− Australia: over €15 billion earmarked for various
rail infrastructure projects
− Eastern Europe: well over €10 billion in rail
investments announced, including Rail Baltica
− EU Green Deal: aiming to double high-speed traffic
by 2030 and freight transport by 2050 in Europe

Capital expenditure in all divisions below high level from previous year,
significant increase in capital expenditure expected in Q4 2021
EBIT and EBIT margin significantly higher on operational basis, especially due
to Core Components and Customized Modules, in contrast Lifecycle Solutions
still noticeably lower year on year; significant burdens from increase in material
prices in 2nd half particularly at Core Components
Free cash flow in Q3 2021 at €25.5 million, back in positive territory after nine
months; clear improvement on previous year’s figure, which was significantly
impacted by discontinued operations
VOSSLOH GROUPSALES REVENUES AND OPERATIONAL PROFITABILITY SIGNIFICANTLY ABOVE PREVIOUS YEAR
Quarterly Statement Q3/20215
NOTES
Sales revenues significantly higher than in previous year (+13.1 percent), increase
largely attributable to Core Components, Customized Modules also slightly above
previous year, Lifecycle Solutions at previous year’s level
Net income substantially improved year on year; previous year’s figure impacted
by losses from discontinued operations; in contrast, significantly higher tax expense
year on year due to higher operating result and impairment of deferred taxes in
Germany; earnings per share almost tripled
1 Previous year’s figure negatively affected by €(54.1) million from discontinued operations.
Value added greatly improved compared to previous year
Sales revenues € mill. 617.7 698.4
EBITDA/EBITDA margin € mill./% 91.7 / 14.8 100.8 / 14.4
EBIT/EBIT margin € mill./% 54.5 / 8.8 62.2 / 8.9
Net income € mill. 9.1 33.8
Earnings per share € 0.45 1.30
Free cash flow1
€ mill. (51.9) 9.8
Capital expenditure € mill. 42.1 28.5
Value added € mill. 9.1 15.2
1–9/2020 1–9/2021KEY GROUP INDICATORS

VOSSLOH GROUPEQUITY RATIO INCREASED TO OVER 45 PERCENT, NET FINANCIAL DEBT SIGNIFICANTLY REDUCED
6
NOTES
Equity up significantly compared to the end of 2020, in particular due to the
hybrid note (around €150 million) and positive business performance
Average working capital intensity noticeably reduced compared to previous
year, all divisions contributing to improvement; working capital as of
September 30, 2021, also below previous year thanks to Customized Modules
and Core Components
Capital employed as of September 30, 2021, higher compared with previous
year’s reporting date, due to acquisition of ETS
Net financial debt excluding lease liabilities down by €169.7 million compared
to the end of Q3 2020, mainly due to cash inflows from the hybrid note of
around €150 million and positive FCF of around €66 million in the last twelve
months; this was offset by dividend, lease and interest payments as well as the
payment for the acquisition of ETS in Q3 2021
Quarterly Statement Q3/2021
Equity € mill. 401.8 412.4 579.2
Equity ratio % 32.8 34.0 45.5
Average working capital € mill. 188.2 186.4 198.3
Average working capital
intensity% 22.9 21.4 21.3
Closing working capital € mill. 206.5 155.3 191.9
Average capital employed € mill. 864.9 865.8 896.1
Closing capital employed € mill. 887.2 849.4 897.6
Net financial debt € mill. 362.1 307.4 192.4
Net financial debt (including
lease liabilities)€ mill. 406.6 351.3 231.7
KEY GROUP INDICATORS1–9/2020
9/30/20
2020
12/31/201–9/2021
9/30/21

297.4 276.7
342.6309.0
84.0
96.5
717.8
667.3
1-9/2020 1-9/2021
311.7
177.5
327.9
354.6
15.5
26.7
654.5
554.9
09/30/20 09/30/21
VOSSLOH GROUPORDERS RECEIVED STILL BELOW HIGH LEVEL FROM PREVIOUS YEAR, HIGH ORDERS RECEIVED EXPECTED IN FINAL QUARTER OF 2021
7
NOTES
Orders received after nine months still below high level from previous year as
expected; in particular lower orders received at Vossloh Tie Technologies in the
USA, at Customized Modules in France and Eastern Europe (especially in Poland)
and at Lifecycle Solutions in Northern Europe; in contrast, significantly higher
orders received achieved especially in Mexico, Australia (especially Customized
Modules and Vossloh Fastening Systems), India (especially Vossloh Fastening
Systems) and Germany (Lifecycle Solutions and Vossloh Fastening Systems);
book-to-bill at 0.96; high orders received expected in Q4 2021, including from
China
Order backlog of the Vossloh Group significantly below previous year as
expected due to the planned processing of the high order backlog at Core
Components, especially at Vossloh Fastening Systems in China and Vossloh Tie
Technologies in the USA and Australia; in contrast, Customized Modules
noticeably above previous year (including significant increase at the companies
in Luxembourg and Australia), Lifecycle Solutions significantly above previous
year (mainly due to sales of several maintenance machines); noticeable increase
in order backlog expected at the end of the year
ORDERS RECEIVED (in € mill.) ORDER BACKLOG (in € mill.)
Core Components Customized Modules Lifecycle Solutions
Quarterly Statement Q3/2021

1Previous year’s figures, with the exception of sales, include a positive book effect on EBIT (€15.6 million) related to the transitional consolidation of a Chinese joint venture.
ROCE(in %)
VALUE ADDED(in € mill.)
1–9/2020
1–9/2021
1–9/2020
1–9/2021
17.3
15.3
19.7
27.0
CORE COMPONENTS DIVISIONSALES REVENUES AND OPERATIONAL PROFITABILITY SIGNIFICANTLY ABOVE PREVIOUS YEAR1
8
SALES (in € mill.) EBIT1(in € mill.)EBITDA1
(in € mill.)
Sales increase (+31.3 percent) is due to Vossloh Fastening Systems, sales revenues at
Vossloh Tie Technologies below previous year as expected
EBIT significantly higher year on year (+24.4 percent) despite high positive book effect in
previous year in the Fastening Systems business unit and first significant burdens from
substantially higher material prices
EBITDA MARGIN1(in %) EBIT MARGIN1
(in %)
Quarterly Statement Q3/2021
258.4
339.3
1-9/2020 1-9/2021
52.7
63.5
1-9/2020 1-9/2021
20.4 18.7
1-9/2020 1-9/2021
36.5
45.4
1-9/2020 1-9/2021
14.1 13.4
1-9/2020 1-9/2021
Value added exceeds high figure from previous year, which was significantly boosted by
a positive book effect; both business units contribute to the increase

Significant increase in value added on an operational basis due to exceptionally strong
sales and earnings performance in China
FASTENING SYSTEMS BUSINESS UNITSALES REVENUES SIGNIFICANTLY ABOVE PREVIOUS YEAR, VALUE ADDED CLEARLY HIGHER DESPITE POSITIVE BOOK EFFECT IN PREVIOUS YEAR
9
SALES (in € mill.) VALUE ADDED1(in € mill.)
Extraordinarily strong sales growth (+66.4 percent); increase mainly due to higher sales
in China (partly due to deliveries being delayed until 2021 because of the pandemic),
also higher sales revenues in Italy and Germany
Higher orders received than in the previous year, especially in India, Australia and
Germany; order backlog lower than in the previous year, mainly due to processing of the
high order backlog in China; order backlog at the end of the year expected to be roughly
at the previous year’s level
ORDERS
RECEIVED
(in € mill.)
ORDER
BACKLOG
(in € mill.)
1–9/2020
1–9/2021
9/30/2020
9/30/2021
167.0
181.8
209.7
120.3
Quarterly Statement Q3/2021
1Previous year’s figure includes a positive book effect on EBIT (€15.6 million) related to the transitional consolidation of a Chinese joint venture.
139.8
232.7
1-9/2020 1-9/2021
21.8
26.3
1-9/2020 1-9/2021

Orders received in the USA significantly down year on year, but higher in Mexico and
Canada; order backlog down as expected, in particular due to the completion of major
projects in the USA and Australia
Sales revenues down year on year, in particular due to lower demand from Class I
operators in the USA, but slightly up year on year in Mexico and Canada
TIE TECHNOLOGIES BUSINESS UNITVALUE ADDED POSITIVE AND NOTICEABLY IMPROVED
10
SALES (in € mill.) VALUE ADDED (in € mill.)
Value added improved compared to previous year, noticeable increase in Australia in
particular; previous year’s figure impacted by ramp-up costs for concrete tie factories in
Canada and Australia
ORDERS
RECEIVED
(in € mill.)
ORDER
BACKLOG
(in € mill.)
1–9/2020
1–9/2021
9/30/2020
9/30/2021
142.9
98.7
109.1
61.8
Quarterly Statement Q3/2021
126.7
111.4
1-9/2020 1-9/2021
(2.0)
0.7
1-9/2020 1-9/2021

Earnings and profitability noticeably higher year on year, in particular due to operational
efficiency gains; slight negative impact from higher material prices in Q3/2021; previous
year’s earnings also boosted by sale of land at a discontinued site in Germany
CUSTOMIZED MODULES DIVISIONSALES REVENUES SLIGHTLY ABOVE PREVIOUS YEAR WITH NOTICEABLY HIGHER PROFITABILITY
11
Higher sales revenues, particularly in Egypt, Australia and India, more than offset
noticeably lower sales in France; the previous year’s figure included sales revenues from
activities in the Americas that have since been sold (€9.5 million) ROCE(in %)
VALUE ADDED(in € mill.)
1–9/2020
1–9/2021
1–9/2020
1–9/2021
7.7
8.7
2.0
4.6Book-to-bill at 1.06, higher orders for instance in Australia and Israel; in contrast, orders
particularly in France and Poland noticeably down year on year
SALES (in € mill.) EBIT (in € mill.)EBITDA (in € mill.) EBITDA MARGIN (in %) EBIT MARGIN (in %)
Quarterly Statement Q3/2021
287.8 292.6
1-9/2020 1-9/2021
32.9 33.6
1-9/2020 1-9/2021
11.4 11.5
1-9/2020 1-9/2021
21.323.7
1-9/2020 1-9/2021
7.48.1
1-9/2020 1-9/2021
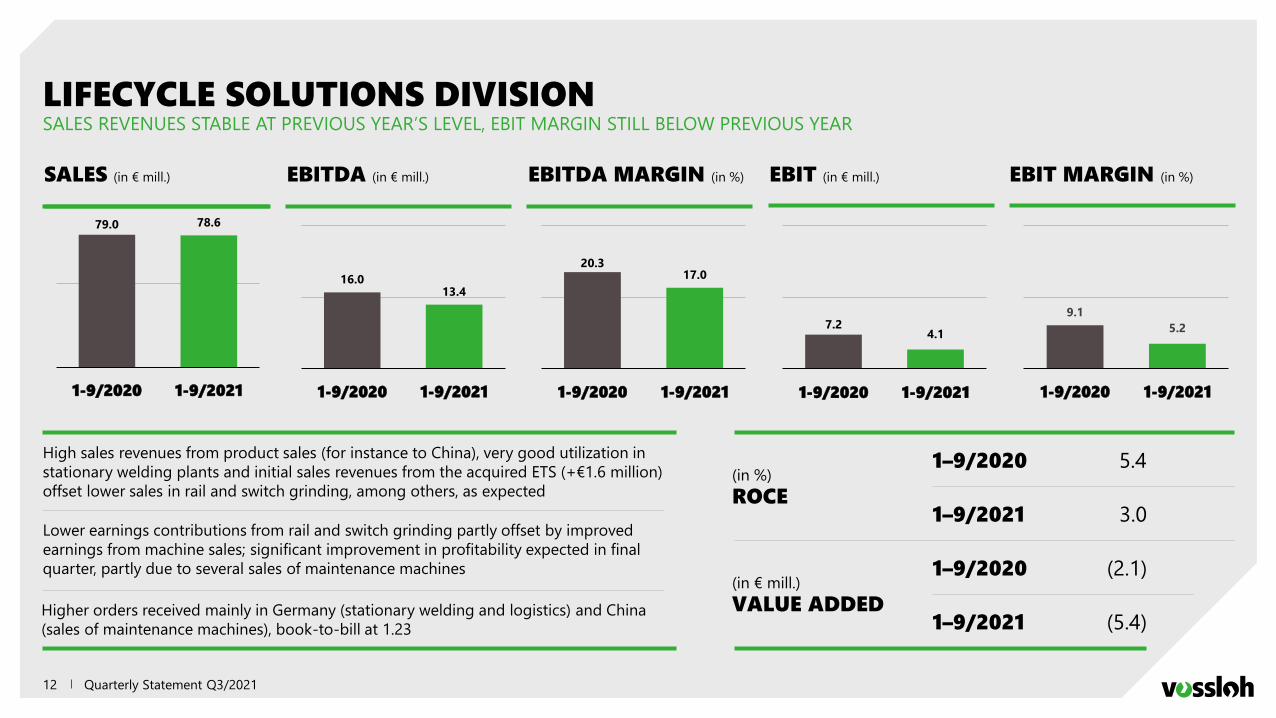
LIFECYCLE SOLUTIONS DIVISIONSALES REVENUES STABLE AT PREVIOUS YEAR’S LEVEL, EBIT MARGIN STILL BELOW PREVIOUS YEAR
12
ROCE(in %)
VALUE ADDED(in € mill.)
1–9/2020
1–9/2021
1–9/2020
1–9/2021
5.4
3.0
(2.1)
(5.4)
High sales revenues from product sales (for instance to China), very good utilization in
stationary welding plants and initial sales revenues from the acquired ETS (+€1.6 million)
offset lower sales in rail and switch grinding, among others, as expected
Lower earnings contributions from rail and switch grinding partly offset by improved
earnings from machine sales; significant improvement in profitability expected in final
quarter, partly due to several sales of maintenance machines
Higher orders received mainly in Germany (stationary welding and logistics) and China
(sales of maintenance machines), book-to-bill at 1.23
SALES (in € mill.) EBIT (in € mill.)EBITDA (in € mill.) EBITDA MARGIN (in %) EBIT MARGIN (in %)
Quarterly Statement Q3/2021
79.0 78.6
1-9/2020 1-9/2021
16.013.4
1-9/2020 1-9/2021
20.317.0
1-9/2020 1-9/2021
7.24.1
1-9/2020 1-9/2021
9.1
5.2
1-9/2020 1-9/2021
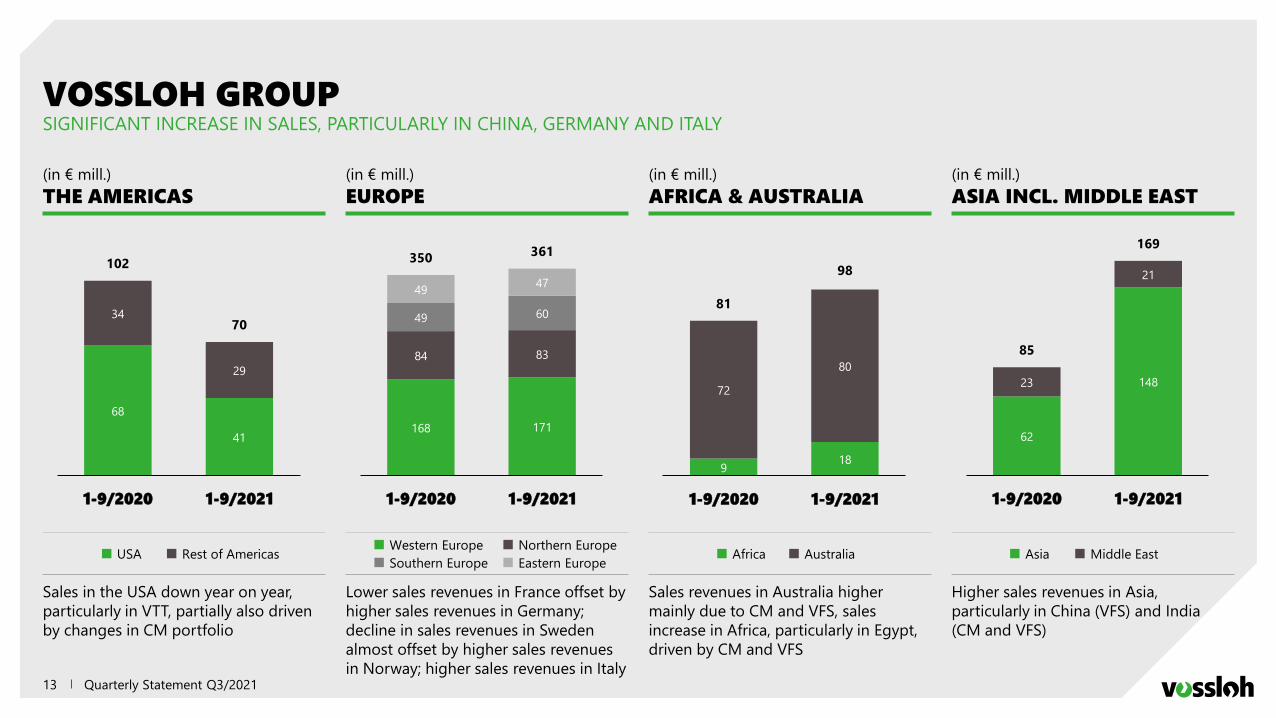
VOSSLOH GROUPSIGNIFICANT INCREASE IN SALES, PARTICULARLY IN CHINA, GERMANY AND ITALY
13
THE AMERICAS EUROPE AFRICA & AUSTRALIA ASIA INCL. MIDDLE EAST(in € mill.) (in € mill.) (in € mill.) (in € mill.)
USA Rest of Americas Africa Australia Asia Middle EastWestern Europe Northern Europe
Southern Europe Eastern Europe
Sales in the USA down year on year,
particularly in VTT, partially also driven
by changes in CM portfolio
Lower sales revenues in France offset by
higher sales revenues in Germany;
decline in sales revenues in Sweden
almost offset by higher sales revenues
in Norway; higher sales revenues in Italy
Sales revenues in Australia higher
mainly due to CM and VFS, sales
increase in Africa, particularly in Egypt,
driven by CM and VFS
Higher sales revenues in Asia,
particularly in China (VFS) and India
(CM and VFS)
Quarterly Statement Q3/2021
68
41
34
29
102
70
1-9/2020 1-9/2021
168 171
84 83
49 60
4947
350361
1-9/2020 1-9/2021
918
72
80
81
98
1-9/2020 1-9/2021
62
14823
21
85
169
1-9/2020 1-9/2021

VOSSLOH GROUP: OUTLOOKOUTLOOK CONFIRMED OVERALL BASED ON BUSINESS PERFORMANCE IN Q3/2021
Quarterly Statement Q3/202114
Sales
2020: €869.7 million 2021 forecast: €900 million to €950 million
/ Forecast changed on July 19, 2021
/ Original expectation of €850 million to €925 million for 2021 revised upwards,
particularly for Core Components (significant improvement for Vossloh Fastening
Systems, Vossloh Tie Technologies down year on year); sales growth now also forecast
for Customized Modules and Lifecycle Solutions (following the acquisition of ETS)
Value added
2020: €12.4 million 2021 forecast: €0 million to €15 million
/ Value added in the 2021 fiscal year largely on a par with previous year’s
level due to higher expected operational profitability and therefore
positive once again; noticeable improvement in operational terms
compared to the positively impacted figure from the transitional
consolidation of a company in the previous year
EBITDA margin
2020: 12.4 percent1 2021 forecast: 13 to 14 percent
EBIT margin
2020: 6.6 percent1 2021 forecast: 7 to 8 percent
/ Major improvement in operational profitability expected despite significant
negative impact due to substantially higher material prices; operating EBIT margin
expected to increase at Core Components and Customized Modules, Lifecycle
Solutions at previous year’s level due to the integration of ETS
1 Without the book effect of the transitional consolidation of a Chinese company in the amount of €15.6 million; corresponds to an EBIT and EBITDA margin of approximately 1.8 percent.

FINANCIAL CALENDAR AND CONTACT INFORMATIONHOW YOU CAN REACH US
15
Financial calendar 2022
/ March 17, 2022 Annual Report 2021
/ April 28, 2022 Quarterly statement as of March 31, 2022
/ May 18, 2022 Annual General Meeting (expected)
Contact information for investors:
Dr. Daniel Gavranovic
Email: [email protected]
Phone: +49 (0) 23 92 / 52-609
Fax: +49 (0) 23 92 / 52-219
Contact information for the media:
Andreas Friedemann (Kirchhoff Consult AG)
Email: [email protected]
Phone: +49 (0) 23 92 / 52-608
Fax: +49 (0) 23 92 / 52-219
Quarterly Statement Q3/2021

THANK YOU FOR
YOUR TIME.
Q&AEnabling green mobility

NOTES
17 Quarterly Statement Q3/2021

VOSSLOH GROUPINCOME STATEMENT
18 Quarterly Statement Q3/2021
€ mill. 1–9/2020 1–9/2021
Sales revenues 617.7 698.4
Cost of sales (476.4) (527.0)
General administrative and selling expenses (104.3) (112.8)
Allowances and write-ups of financial assets 0.1 1.0
Research and development costs (6.9) (6.8)
Other operating income 15.4 8.6
Other operating expense (9.5) (4.2)
Operating result 36.1 57.2
Result from investments in companies accounted for using the equity method 2.7 2.8
Other financial income 15.7 2.2
Other financial expense 0.0 0.0
Earnings before interest and taxes (EBIT) 54.5 62.2
Interest income 2.5 1.2
Interest and similar expense (13.2) (6.9)
Earnings before taxes (EBT) 43.8 56.5
Income taxes (8.8) (22.4)
Result from continuing operations 35.0 34.1
Result from discontinued operations (25.9) (0.3)
Net income 9.1 33.8
thereof attributable to shareholders of Vossloh AG 7.9 22.8
thereof attributable to hybrid capital investors - 3.6
thereof attributable to noncontrolling interests 1.2 7.4
Earnings per share
Basic/diluted earnings per share (€) 0.45 1.30
thereof attributable to continuing operations 1.92 1.32
thereof attributable to discontinued operations (1.47) (0.02)

VOSSLOH GROUPBALANCE SHEET
19 Quarterly Statement Q3/2021
Assets in € mill. 9/30/2020 12/31/2020 9/30/2021
Intangible assets 312.4 314.4 328.8
Property, plant and equipment 301.3 313.6 316.0
Investment properties 4.5 4.4 4.4
Investments in companies accounted for using the equity
method56.6 55.9 52.4
Other noncurrent financial instruments 6.0 6.0 4.4
Other noncurrent assets 3.1 3.9 3.1
Deferred tax assets 19.2 20.4 12.7
Noncurrent assets 703.1 718.6 721.8
Inventories 179.2 163.4 192.3
Trade receivables 212.8 209.5 215.8
Contract assets 8.0 4.3 7.1
Income tax assets 5.8 3.3 6.7
Other current financial instruments 27.3 21.8 18.1
Other current assets 25.9 24.1 31.7
Short-term securities 0.0 0.3 1.3
Cash and cash equivalents 54.2 67.8 77.6
Current assets 513.2 494.5 550.6
Assets held for sale 8.5 1.3 0.0
Assets 1,224.8 1,214.4 1,272.4
Equity and liabilities in € mill. 9/30/2020 12/31/2020 9/30/2021
Capital stock 49.9 49.9 49.9
Additional paid-in capital 190.4 190.4 190.4
Retained earnings and net income 160.6 170.2 173.6
Hybrid capital - - 148.4
Accumulated other comprehensive income (12.1) (14.0) (7.6)
Equity excluding noncontrolling interests 388.8 396.5 554.7
Noncontrolling interests 13.0 15.9 24.5
Equity 401.8 412.4 579.2
Pension provisions/provisions for other post-employment
benefits35.5 35.5 36.4
Other noncurrent provisions 9.7 12.4 13.4
Noncurrent financial liabilities 176.2 244.5 212.7
Other noncurrent liabilities 3.1 2.8 2.9
Deferred tax liabilities 9.8 7.7 8.4
Noncurrent liabilities 234.3 302.9 273.8
Other current provisions 55.5 56.4 53.6
Current financial liabilities 284.7 175.0 97.8
Current trade payables 130.4 152.3 144.0
Current contract liabilities 0.0 0.0 0.0
Current income tax liabilities 5.4 6.8 8.4
Other current liabilities 106.3 105.6 115.6
Current liabilities 582.3 496.1 419.4
Liabilities related to assets held for sale 6.4 3.0 0.0
Equity and liabilities 1,224.8 1,214.4 1,272.4

VOSSLOH GROUPKEY PERFORMANCE INDICATORS
20 Quarterly Statement Q3/2021
1Previous year’s figures for Core Components include a positive book effect on EBIT (€15.6 million) related to the transitional consolidation of a Chinese joint venture
Core Components Fastening Systems Tie Technologies Customized Modules Lifecycle Solutions
1–9/2020 1–9/2021 1–9/2020 1–9/2021 1–9/2020 1–9/2021 1–9/2020 1–9/2021 1–9/2020 1–9/2021
Sales revenues € mill. 258.4 339.3 139.8 232.7 126.7 111.4 287.8 292.6 79.0 78.6
EBITDA1
€ mill. 52.7 63.5 32.9 33.6 16.0 13.4
EBITDA margin1
% 20.4 18.7 11.4 11.5 20.3 17.0
EBIT1
€ mill. 36.5 45.4 21.3 23.7 7.2 4.1
EBIT margin1
% 14.1 13.4 7.4 8.1 9.1 5.2
Average working capital € mill. 99.2 122.4 77.6 68.7 13.5 12.4
Average working capital intensity % 28.8 27.0 20.2 17.6 12.8 11.9
Average capital employed € mill. 318.6 350.3 367.7 364.8 177.4 181.2
ROCE1
% 15.3 17.3 7.7 8.7 5.4 3.0
Value added1
€ mill. 19.7 27.0 21.8 26.3 (2.0) 0.7 2.0 4.6 (2.1) (5.4)
Orders received € mill. 297.4 276.7 167.0 181.8 142.9 98.7 342.6 309.0 84.0 96.5
Order backlog (9/30) € mill. 311.7 177.5 209.7 120.3 109.1 61.8 327.9 354.6 15.5 26.7
Capital expenditure € mill. 17.5 13.9 13.9 10.9 3.6 3.0 13.6 6.9 10.5 6.6
Depreciation/amortization € mill. (16.2) (18.1) (6.4) (6.4) (9.8) (11.7) (11.6) (9.8) (8.8) (9.3)

VOSSLOH GROUPCASH FLOW STATEMENT
21 Quarterly Statement Q3/2021
€ mill. 1–9/2020 1–9/2021
Earnings before interest and taxes (EBIT) 54.5 62.2
EBIT from discontinued operations (22.4) (0.3)
Amortization/depreciation/impairment losses/reversal of impairment losses of noncurrent assets 46.7 38.3
Change in noncurrent provisions (1.1) 2.7
Gross cash flow 77.7 102.9
Income taxes paid (10.4) (16.5)
Change in working capital (71.7) (21.3)
Other changes (15.9) (21.3)
Cash flow from operating activities (20.3) 43.8
Investments in intangible assets and property, plant and equipment (31.6) (34.8)
Investments in companies accounted for using the equity method (0.1) 0.0
Cash-effective dividends from companies accounted for using the equity method 0.1 0.8
Free cash flow (51.9) 9.8

VOSSLOH GROUPEMPLOYEES
22 Quarterly Statement Q3/2021
Reporting date Average
Employees 9/30/2020 9/30/2021 1–9/2020 1–9/2021
Core Components 943 863 938 877
Customized Modules 1,999 2,122 1,991 2,132
Lifecycle Solutions 490 531 499 516
Vossloh AG 59 65 58 62
Group 3,491 3,581 3,486 3,587

VOSSLOH GROUPPRICE PERFORMANCE, SHARE INFORMATION AND SHAREHOLDER STRUCTURE
23
Information on the Vossloh share
ISIN DE0007667107
Trading locationsXetra, Düsseldorf, Frankfurt, Berlin, Hamburg,
Hanover, Stuttgart, Munich
Number of shares outstanding on 9/30/2021 17,564,180
Share price (9/30/2021) €45.95
High price/low price January to September 2021 €49.45/€39.35
Market capitalization (9/30/2021) €807.1 million
Reuters code VOSG.DE
Bloomberg code VOS:GR
50.09
4.99
44.92
Nadia Thiele; Robin Brühmüller (executor of the estate of the
deceased Heinz Hermann Thiele)
Franklin Mutual Advisers
Others
Shareholder structure in %
Quarterly Statement Q3/2021
Vossloh share price developments, 12/31/2020 to 9/30/2021
Vossloh share
SDAX (rebased)
DAX (rebased)
9/30/20216/30/20213/31/202112/31/2020
50
45
40
35
€
MDAX (rebased)