2021 second quarterly report
TRANSCRIPT

2021 second quarterly report

Intertape Polymer Group Inc.Management’s Discussion and Analysis
This Management’s Discussion and Analysis (“MD&A”) is intended to provide the reader with a better understanding of the business, strategy and performance of Intertape Polymer Group Inc. (the “Company”), as well as how it manages certain risks and capital resources. This MD&A, which has been prepared as of August 10, 2021, should be read in conjunction with the Company’s unaudited interim condensed consolidated financial statements and notes thereto as of and for the three and six months ended June 30, 2021 and 2020 ("financial statements") and “Item 5 Operating and Financial Review and Prospects (Management’s Discussion & Analysis)” located in the Company’s annual report on Form 20-F for the year ended December 31, 2020 and the other statements contained in the Company’s filings with the Canadian securities regulators and the US Securities and Exchange Commission. It should also be read together with the text on forward-looking statements in the “Forward-Looking Statements” section below.
For the purposes of preparing this MD&A, the Company considers the materiality of information. Information is considered material if the Company believes at the time of preparing this MD&A that: (i) such information results in, or would reasonably be expected to result in, a significant change in the market price or value of the common shares of the Company; (ii) there is a substantial likelihood that a reasonable investor would consider it important in making an investment decision; and/or (iii) it would significantly alter the total mix of information available to investors. The Company evaluates materiality with reference to all relevant circumstances, including potential market sensitivity.
Except where otherwise indicated, all financial information presented in this MD&A, including tabular amounts, is prepared in accordance with International Financial Reporting Standards as issued by the International Accounting Standards Board (“IFRS” or “GAAP”) and is expressed in US dollars ("USD") unless otherwise stated to be in Canadian dollar ("CDN") or Indian Rupee ("INR"). Variance, ratio and percentage changes in this MD&A are based on unrounded numbers.
This MD&A contains certain non-GAAP financial measures and key performance indicators as defined under applicable securities legislation, including adjusted net earnings (loss), adjusted earnings (loss) per share, EBITDA, adjusted EBITDA, and free cash flows (please see the "Adjusted Net Earnings (Loss)" section below for a description and reconciliation of adjusted net earnings (loss) and adjusted earnings (loss) per share, the “EBITDA and Adjusted EBITDA” section below for a description and reconciliation of EBITDA and adjusted EBITDA, and the “Cash Flows” section below for a description and reconciliation of free cash flows). In determining these measures, the Company excludes certain items which are otherwise included in determining the comparable GAAP financial measures. The Company believes such non-GAAP financial measures are key performance indicators that improve the period-to-period comparability of the Company’s results and provide investors with more insight into, and an additional tool to understand and assess, the performance of the Company's ongoing core business operations. As required by applicable securities legislation, the Company has provided definitions of those measures and reconciliations of those measures to the most directly comparable GAAP financial measures. Investors and other readers are encouraged to review the related GAAP financial measures and the reconciliation of non-GAAP financial measures to their most directly comparable GAAP financial measures set forth in the "Non-GAAP Financial Measures and Key Performance Indicators" section below and should consider non-GAAP financial measures and key performance indicators only as a supplement to, and not as a substitute for or as a superior measure to, measures of financial performance prepared in accordance with GAAP.
1

Consolidated Quarterly Statements of EarningsThree month periods ended(In thousands of US dollars, except per share amounts)(Unaudited)
June 30, 2021
March 31, 2021
December 31, 2020
September 30, 2020
$ $ $ $
Revenue 376,686 345,566 344,079 323,027 Cost of sales 287,402 263,016 255,599 238,917 Gross profit 89,284 82,550 88,480 84,110 Gross margin 23.7 % 23.9 % 25.7 % 26.0 %Selling, general and administrative expenses 44,075 46,743 53,424 38,621 Research expenses 2,910 3,048 2,763 2,554
46,985 49,791 56,187 41,175 Operating profit before manufacturing facility closures, restructuring and other related charges 42,299 32,759 32,293 42,935
Manufacturing facility closures, restructuring and other related charges — — — 466 Operating profit 42,299 32,759 32,293 42,469 Finance costs
Interest 10,070 5,368 6,757 7,368 Other finance expense, net 11,951 1,342 3,188 1,296
22,021 6,710 9,945 8,664 Earnings before income tax expense 20,278 26,049 22,348 33,805 Income tax expense (benefit)
Current 6,039 2,184 9,871 9,373 Deferred (484) 4,076 (4,910) (2,741)
5,555 6,260 4,961 6,632 Net earnings 14,723 19,789 17,387 27,173 Net earnings attributable to:
Company shareholders 14,338 19,052 17,089 26,726 Non-controlling interests 385 737 298 447
14,723 19,789 17,387 27,173 Earnings per share attributable to Company shareholders
Basic 0.24 0.32 0.29 0.45 Diluted 0.24 0.32 0.28 0.45
Weighted average number of common shares outstandingBasic 59,027,230 59,027,047 59,012,869 59,009,685 Diluted 60,519,144 60,358,431 60,083,664 59,745,118
2

Consolidated Quarterly Statements of EarningsThree month periods ended(In thousands of US dollars, except per share amounts)(Unaudited)
June 30, 2020
March 31, 2020
December 31, 2019
September 30, 2019
$ $ $ $
Revenue 267,710 278,212 291,489 293,598 Cost of sales 210,623 219,105 231,167 229,535 Gross profit 57,087 59,107 60,322 64,063 Gross margin 21.3 % 21.2 % 20.7 % 21.8 %Selling, general and administrative expenses 34,534 30,907 32,533 35,025 Research expenses 2,546 3,333 3,010 3,326
37,080 34,240 35,543 38,351 Operating profit before manufacturing facility closures, restructuring and other related charges (recoveries) 20,007 24,867 24,779 25,712
Manufacturing facility closures, restructuring and other related charges (recoveries) 3,211 651 (657) 1,614 Operating profit 16,796 24,216 25,436 24,098 Finance (income) costs
Interest 7,513 7,798 7,668 7,764 Other finance (income) expense, net (9,590) (1,132) 3,630 (459)
(2,077) 6,666 11,298 7,305 Earnings before income tax expense 18,873 17,550 14,138 16,793 Income tax expense (benefit)
Current 3,996 2,355 3,459 6,584 Deferred 296 881 (1,010) (2,332)
4,292 3,236 2,449 4,252 Net earnings 14,581 14,314 11,689 12,541 Net earnings (loss) attributable to:
Company shareholders 14,479 14,376 11,631 12,528 Non-controlling interests 102 (62) 58 13
14,581 14,314 11,689 12,541 Earnings per share attributable to Company shareholders
Basic 0.25 0.24 0.20 0.21 Diluted 0.25 0.24 0.20 0.21
Weighted average number of common shares outstandingBasic 59,009,685 59,009,685 58,900,337 58,877,185 Diluted 59,467,336 59,075,593 59,027,917 59,058,758
3

Overview
The Company develops, manufactures and sells a variety of paper-and-film based pressure sensitive and water-activated tapes, shrink and stretch films, protective packaging, woven and non-woven products and packaging machinery for industrial and retail use. The Company provides packaging and protective solutions for industrial markets in North America, Europe and other geographies.
The Company’s products primarily consist of carton sealing tapes, including pressure-sensitive and water-activated tapes; packaging equipment; industrial and performance specialty tapes, including masking, duct, electrical, foil, process indicator, sheathing, sports and reinforced filament tapes; protective packaging solutions, including inflatable systems, mailer products, bubble cushioning, paper void fill, thermal solutions and protective foam roll stock; stencil products; shrink film; stretch wrap; lumber wrap, structure fabrics, geomembrane fabrics; and non-manufactured flexible intermediate bulk containers. Most of the Company’s products are made from similar processes. A vast majority of the Company’s products, while brought to market through various distribution channels, generally have similar economic characteristics.
The Company has assembled a broad range of products by leveraging its manufacturing technologies, research and development capabilities, global sourcing expertise and strategic acquisitions. Over the years, the Company has made a number of strategic acquisitions intended to offer a broader range of products to better serve its markets. The Company’s extensive product line permits the Company to offer tailored solutions to a wide range of end markets. The Company's largest end markets as of December 31, 2020 were: general manufacturing, fulfillment/e-commerce, food and beverage, building and construction, retail and transportation(1).
The Company's unique bundle of products positions it to serve the market with a broad and comprehensive range of packaging, protective and industrial product solutions. The Company believes that its broad and unique product bundle is a key competitive advantage. The portfolio of products is valuable to the Company’s customers as it contributes to the flexibility of its distributor partners by allowing them to offer a solutions-oriented approach to address specific end user needs, creates operating efficiencies and lowers operating costs. Management believes this flexibility is unique to the Company and differentiates the Company from its competitors.
(1) Represents management estimates as the Company does not have access to exact point of sale data.
COVID-19
In response to the coronavirus ("COVID-19") pandemic that began in December 2019, the Company has implemented measures to prioritize the health and safety of its employees while protecting its assets, customers, suppliers, shareholders and other stakeholders. The following is an overview of the status of the Company's efforts as of the time of this filing as well as a discussion of certain risks to its business associated with COVID-19:
• The Company's facilities are open and operating, having qualified as essential under the applicable government orders and guidelines. Alternative capacity exists across all major product lines that would enable the continuation of operations if certain facilities were required to close; however, in most cases, this alternative capacity would produce less than current run rates. Management has adjusted, and will continue to adjust, production plans to align with changes in demand in order to manage working capital and associated cost levels. Management has successfully mitigated minor supply chain challenges experienced to date attributable to COVID-19 and continues to work closely with suppliers as supply chain risk mitigation plans are refined.
• Management has put measures in place to enable employees to work safely according to the United States Centers for Disease Control and Prevention and World Health Organization guidelines and other applicable local guidelines. The Company has significantly increased the frequency of cleaning and sanitizing equipment and facilities in the context of COVID-19 and the Company continues to support remote work arrangements for approximately 20% of its workforce in North America. The remote work arrangements have not had any significant effect on the Company's ability to conduct its day-to-day operations.
While the Company has delivered positive financial results to date, the pandemic could yet materially impact the Company’s ability to manufacture, source (including the delivery of raw materials to its facilities) or distribute its products both domestically and internationally and reduce demand for its products, any of which could have a significant negative impact on
4

the Company’s financial results in 2021 and beyond. Given the dynamic nature of the pandemic (including its duration and the severity of its impact on the global economy and the applicable governmental responses), the extent to which the COVID-19 pandemic impacts the Company’s future results will depend on unknown future developments and any further impact on the global economy and the markets in which the Company operates and sells its products, all of which remain highly uncertain and cannot be accurately predicted at this time.
Financial Highlights
The Company reported a 40.7% increase in revenue for the second quarter of 2021 compared to the second quarter of 2020 and a 32.3% increase in revenue for the first six months of 2021 compared to the same period in 2020. In both periods, the increase in revenue was primarily due to organic growth in certain film, woven, and tape products, including continued strength in products with significant e-commerce end-market exposure such as water-activated tape and dispensing machines.
Gross margin increased to 23.7% in the second quarter of 2021 compared to 21.3% in the second quarter of 2020. Gross margin also increased to 23.8% in the first six months of 2021 compared to 21.3% for the same period in 2020. In both periods, the increase was primarily due to a favourable product mix and an increase in the spread between selling prices and combined raw material and freight costs.
Net earnings attributable to the Company's shareholders ("IPG Net Earnings") decreased to $14.3 million ($0.24 basic and diluted earnings per share) for the second quarter of 2021 from $14.5 million ($0.25 basic and diluted earnings per share) for the second quarter of 2020, primarily due to (i) an increase in finance costs mainly due to the 2018 Senior Unsecured Notes Redemption Charges (1) and the non-recurrence of a gain in the second quarter of 2020 resulting from a fair value adjustment to the Company's contingent consideration related to the Nortech Acquisition (2) and (ii) an increase in selling, general and administrative expenses ("SG&A") mainly due to increases in both variable and share-based compensation. The unfavourable impacts were largely offset by an increase in gross profit.
IPG Net Earnings increased to $33.4 million ($0.57 basic and $0.55 diluted earnings per share) for the first six months of 2021 from $28.9 million ($0.49 basic and diluted earnings per share) for the same period in 2020, primarily due to an increase in gross profit and the non-recurrence of termination benefits related to employee restructuring initiatives in the second quarter of 2020 in manufacturing facility closures, restructuring and other related charges. These favourable impacts were partially offset by increases in SG&A, finance costs and income tax expense.
Adjusted net earnings (3) increased to $33.7 million ($0.57 basic adjusted earnings per share and $0.56 diluted adjusted earnings per share (3)) for the second quarter of 2021 from $12.9 million ($0.22 basic and diluted adjusted earnings per share) for the second quarter of 2020. Adjusted net earnings increased to $62.5 million ($1.06 basic and $1.03 diluted adjusted earnings per share) for the first six months of 2021 from $25.9 million ($0.44 basic and diluted adjusted earnings per share) for the same period in 2020. The increase in both periods was primarily due to an increase in gross profit, partially offset by an increase in income tax expense and an increase in SG&A mainly due to an increase in variable compensation and professional consulting services.
Adjusted EBITDA(3) increased to $65.7 million for the second quarter of 2021 from $41.0 million for the second quarter of 2020 and increased to $125.9 million for the first six months of 2021 from $79.0 million for the same period in 2020. The increase in both periods was primarily due to an increase in gross profit. (1) The "2018 Senior Unsecured Notes Redemption Charges" refers to debt issuance costs of $3.6 million that were
written off, as well as an early redemption premium and other costs of $14.4 million recorded in connection with the redemption of the $250 million 7.00% senior unsecured notes that were scheduled to mature on October 15, 2026 (the “2018 Senior Unsecured Notes”). For additional information, see the "Liquidity and Borrowings" section below.
(2) The "Nortech Acquisition" refers to the acquisition by the Company of substantially all of the operating assets of Nortech Packaging LLC and Custom Assembly Solutions, Inc. (together "Nortech") on February 11, 2020..
(3) Non-GAAP financial measure. For definitions and reconciliations of non-GAAP financial measures to their most directly comparable GAAP financial measures, see the "Non-GAAP Financial Measures and Key Performance Indicators" section below.
5

Other Highlights
Capital Structure
During the second quarter of 2021, the Company amended its capital structure as follows to support its current and future growth plans with a flexible framework and more attractive terms:
• issued $400 million of 4.375% senior unsecured notes due June 15, 2029 ("2021 Senior Unsecured Notes"),• re-financed the main credit facility, which now consists of a $600 million revolving credit facility and an incremental
accordion feature of $300 million due to mature in June 2026 ("2021 Credit Facility"), and provides a more favourable covenant structure and increased flexibility to the Company as compared to the previous credit facility, and
• redeemed the higher interest bearing 7.00% 2018 Senior Unsecured Notes.
These additional funds are expected to finance capital expenditures, business acquisitions, working capital, share repurchases and other general corporate activities. For additional information, see the "Liquidity and Borrowings" section below.
Dividend Declaration
On August 10, 2021, the Board of Directors amended the Company's quarterly policy to increase the annualized dividend by 7.9% from $0.63 to $0.68 per common share. The Board's decision to increase the dividend was based on the Company's strong financial position and positive outlook. Accordingly, on August 10, 2021, the Company declared a quarterly cash dividend of $0.17 per common share payable on September 30, 2021 to shareholders of record at the close of business on September 16, 2021.
Normal Course Issuer Bid Renewal
The Company renewed its normal course issuer bid ("NCIB") under which the Company will be entitled to repurchase for cancellation up to 4,000,000 common shares over a twelve-month period starting on July 23, 2021 and ending on July 22, 2022.
Sustainability
The Company continues to embrace sustainability as a key strategy of doing business to drive operational excellence. In June 2021, the Company published its 2020 annual sustainability report, titled “Our Circular Economy”. The report provides an overview of the Company’s sustainability progress in 2020 and highlights future opportunities. The Company's achievements in 2021 to date include:
• Achieved Cradle to Cradle Certified™ Bronze level for Intertape® Acrylic Carton Sealing Tape and Intertape® Hot Melt Carton Sealing Tape.
• Awarded the U.S. Environmental Protection Agency's 2021 ENERGY STAR® Partner of the Year - Sustained Excellence designation for the sixth consecutive year.
• Achieved the U.S. Environmental Protection Agency's ENERGY STAR® Challenge for Industry Award for the 5th time at the Carbondale, Illinois manufacturing facility.
• Earned the U.S. Environmental Protection Agency's 2021 ENERGY STAR® Award for superior energy performance at the Danville, Virginia regional distribution center.
• Achieved ISO 50001 certification for the energy management system in place at the Danville, Virginia manufacturing facility and regional distribution center.
• Partnered with the U.S. Department of Energy Better Buildings® Low Carbon Pilot, a two year program designed to demonstrate real world successes in achieving low carbon emissions from building and manufacturing operations.
• Partnered with the Sustainable Packaging Coalition and How2Recycle® program in an effort to ensure recycling instructions are communicated to customers in the most effective manner. As a result of this collaboration, StretchFLEX® and SuperFLEX® stretch films are store drop-off recyclable per the How2Recycle® guidelines.
Read the full report at https://www.itape.com/sustainability.
6

Nuevopak Acquisition
On July 30, 2021, the Company completed the acquisition of Nuevopak Global Limited (“Nuevopak”) for $43.8 million in total cash consideration, consisting of $34.7 million paid at closing (net of cash received) and the remaining amount, subject to certain post-closing adjustments and potential contingent consideration, to be paid within three years from the date of closing. The Company financed the acquisition with funds available under its 2021 Credit Facility.
Nuevopak designs and develops a range of machines that provide void-fill and cushioning protective packaging solutions. Prior to the acquisition, Nuevopak supplied the Company with paper dispensing machines and converted paper for protective packaging distribution in North America. Nuevopak is headquartered in Hong Kong with subsidiaries in Jiangmen, China and Scheden, Germany that serve customers around the world, providing protective packaging solutions using a combination of world-class innovation and specialized industry experience.
This acquisition is expected to further enhance the Company’s protective packaging business and strengthen its product bundle, thereby supporting the Company’s vision to be a global leader in packaging and protective solutions. The acquisition is also expected to enable the Company to secure dispensing machine supply, vertically integrate its paper converting operation, and expand market share in this growing, sustainability-focused market.
The Company expects to achieve a post-synergy adjusted EBITDA acquisition multiple on the Nuevopak transaction that is approximately 5x by 2023. In management’s view, the post-synergy multiple disclosure is more representative of the contribution Nuevopak can offer within the Company, compared to Nuevopak’s relatively modest contribution on a stand-alone basis given its early stage growth profile. Expected cost synergies are considered to be low-risk by the Company’s management, and include margin expansion through the vertical integration of the Company’s paper converting, as well as savings on future capital expenditures by leveraging Nuevopak’s strategic parts sourcing and assembly capabilities. The Company also believes additional revenue synergies will materialize as it continues to scale its protective packaging business across multiple market verticals, led by the continued demand growth in the e-commerce fulfillment vertical and customer preferences for sustainable packaging solutions. In total, deal and integration costs are expected to be approximately $2-3 million, with the majority of these costs expected to be recognized by the end of 2022.
Outlook
The Company has revised its expectations for fiscal 2021 due to strong demand and order backlog experienced to date, as well as its current ability and expectation to continue to protect the dollar spread by implementing price increases required to offset higher raw material and freight costs. In addition, various disruptions in the market have created challenges for the supply of many raw materials thereby requiring the Company to invest more heavily in its working capital through the building of inventories. As the pricing environment and supply constraints ease, the working capital levels are expected to unwind and generate higher free cash flows in later periods. Based on these revised assumptions, the Company is providing updated guidance as outlined below:
As stated in the 2021 First Quarterly Report Current RevisionRevenue $1.375 to $1.45 billion $1.425 to $1.5 billionAdjusted EBITDA $235 to $250 million $245 to $255 millionFree cash flows (1) $80 to $100 million $70 to $80 millionCapital expenditures ~ $100 million No changeEffective tax rate (2) 25% to 30% No changeCash taxes paid (3) ~ 10% greater than income tax expense No change
The Company recognizes that the potential effects and duration of COVID-19, as well as the impact that multiple global economic events, including ten-year highs in many commodities, Texas Winter Storm Uri and the Suez Canal blockage, have had and likely will have on the availability and price of raw materials remains uncertain and could have an effect on the expected level of revenue, adjusted EBITDA and free cash flows. The Company continues to monitor these situations and is confident in its ability to navigate any further supply chain disruptions as discussed above.
The capital expenditures expectation noted above includes $70 million to expand production capacity in the Company's highest growth product categories, specifically water-activated tape, wovens, protective packaging and films, as well as $10 million for
7
digital transformation and cost savings initiatives, and $20 million for regular maintenance. By installing new capacity within its existing footprint, the Company expects the expansion projects will provide shorter-term investment horizons and return profiles that more than exceed the 15% after-tax internal rate of return threshold that the Company has traditionally applied to its strategic investments. The Company is investing directly into categories where it expects demand to exceed production in the near term. The Company views these as low risk, margin accretive projects. Based on its capital plan, the Company anticipates generating more than $100 million in incremental revenue on an annualized run-rate basis by the end of 2022, as well as additional growth into 2023 and beyond.
The above description of the Company's 2021 financial outlook in this MD&A is based on management's current views, strategies, assumptions and expectations concerning growth opportunities, expansion and investment projects, the potential impact of COVID-19, as well as management's assessment of the opportunities for the Company and its industry. The purpose of disclosing this outlook is to provide investors with more information concerning the fiscal impact of the Company's business initiatives and growth strategies. The above description of the Company's 2021 outlook is forward-looking information for the purposes of applicable securities laws in Canada and the United States and readers are therefore cautioned that actual results may vary materially from those described above. Refer to the "Forward-Looking Statements" section below as well as "Item 3. Key Information - Risk Factors," located in the Company’s annual report on Form 20-F for the year ended December 31, 2020 for a reference to the risks and uncertainties impacting the Company that could cause actual results to vary.
(1) Non-GAAP financial measure. For definitions and reconciliations of non-GAAP financial measures to their most directly comparable GAAP financial measures, see the "Non-GAAP Financial Measures and Key Performance Indicators" section below. As in previous years, the Company expects the majority of free cash flows to be generated in the second half of the year due to the normal seasonality of working capital requirements.
(2) The Company's effective tax rate expectation excludes the potential impact of additional changes in the mix of earnings between jurisdictions and the impact of changes resulting from potential US tax legislation that increases rates (particularly, if such increased rates are retroactive to January 1, 2021).
(3) The Company's 2021 cash taxes paid expectation is based on less availability of tax attributes and loss carryforwards than were available for 2020, as well as the impacts of bonus depreciation previously taken.
Results of Operations
Revenue
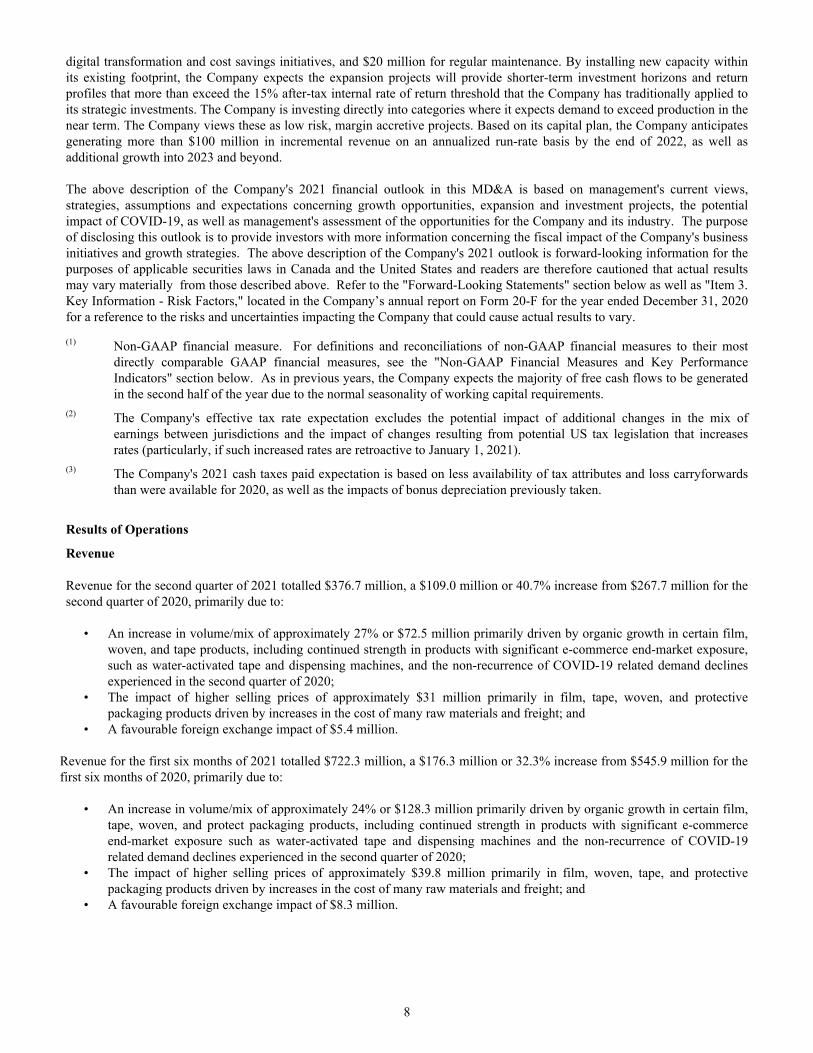
Revenue for the second quarter of 2021 totalled $376.7 million, a $109.0 million or 40.7% increase from $267.7 million for the second quarter of 2020, primarily due to:
• An increase in volume/mix of approximately 27% or $72.5 million primarily driven by organic growth in certain film, woven, and tape products, including continued strength in products with significant e-commerce end-market exposure, such as water-activated tape and dispensing machines, and the non-recurrence of COVID-19 related demand declines experienced in the second quarter of 2020;
• The impact of higher selling prices of approximately $31 million primarily in film, tape, woven, and protective packaging products driven by increases in the cost of many raw materials and freight; and
• A favourable foreign exchange impact of $5.4 million.
Revenue for the first six months of 2021 totalled $722.3 million, a $176.3 million or 32.3% increase from $545.9 million for the first six months of 2020, primarily due to:
• An increase in volume/mix of approximately 24% or $128.3 million primarily driven by organic growth in certain film, tape, woven, and protect packaging products, including continued strength in products with significant e-commerce end-market exposure such as water-activated tape and dispensing machines and the non-recurrence of COVID-19 related demand declines experienced in the second quarter of 2020;
• The impact of higher selling prices of approximately $39.8 million primarily in film, woven, tape, and protective packaging products driven by increases in the cost of many raw materials and freight; and
• A favourable foreign exchange impact of $8.3 million.
8

Gross Profit and Gross Margin
Gross profit totalled $89.3 million for the second quarter of 2021, a $32.2 million or 56.4% increase from $57.1 million for the second quarter of 2020 and totalled $171.8 million for the first six months of 2021, a $55.6 million or 47.9% increase from $116.2 million for the first six months of 2020. The increase in both periods was primarily due to a favourable product volume/mix and an increase in the spread between selling prices and combined raw material and freight costs.
Gross margin increased to 23.7% in the second quarter of 2021 from 21.3% in the second quarter of 2020. Gross margin also increased to 23.8% in the first six months of 2021 from 21.3% in the first six months of 2020. The increase in both periods was primarily due to a favourable product mix and an increase in the spread between selling prices and combined raw material and freight costs.
Selling, General and Administrative Expenses
SG&A for the second quarter of 2021 totalled $44.1 million, a $9.5 million or 27.6% increase from $34.5 million for the second quarter of 2020. The increase was primarily due to increases in (i) variable compensation due to the improved performance of the business in the current quarter, (ii) share-based compensation mainly due to an increase in the fair value of cash-settled awards and (iii) professional consulting services.
SG&A for the first six months of 2021 totalled $90.8 million, a $25.4 million or 38.8% increase from $65.4 million for the first six months of 2020. The increase was primarily due to an increase in share-based compensation mainly due to an increase in the fair value of cash-settled awards, as well as an increase in variable compensation due to the improved performance of the business in the first six months of 2021.
Finance Costs (Income)
Finance costs totalled $22.0 million for the second quarter of 2021, a $24.1 million increase from finance income of $2.1 million in the second quarter of 2020, and totalled $28.7 million for the first six months of 2021, a $24.1 million increase from $4.6 million in the first six months of 2020. The increase in both periods was primarily due to (i) the 2018 Senior Unsecured Notes Redemption Charges and (ii) the non-recurrence of a gain in the second quarter of 2020 resulting from a fair value adjustment to the Company's contingent consideration related to the Nortech Acquisition, partially offset by favourable foreign exchange impacts.
Income Taxes
The Company is subject to income taxation in multiple tax jurisdictions around the world. Accordingly, the Company’s effective tax rate fluctuates depending on the geographic source of its earnings. The Company’s effective tax rate is also impacted by tax planning strategies that the Company implements. Income tax expense is recognized in each interim period based on the best estimate of the weighted average annual income tax rate expected for the full financial year.
The table below reflects the calculation of the Company’s effective tax rate (in millions of USD):
Three months ended
June 30,Six months ended
June 30, 2021 2020 2021 2020 $ $ $ $
Income tax expense 5.6 4.3 11.8 7.5 Earnings before income tax expense 20.3 18.9 46.3 36.4 Effective tax rate 27.4 % 22.7 % 25.5 % 20.7 %
The increase in the effective tax rate in the three months ended June 30, 2021 as compared to the same period in 2020 was primarily due to the net unfavourable impacts related to the redemption of the 2018 Senior Unsecured Notes and the timing of tax credit recognition.
9

The increase in the effective tax rate in the six months ended June 30, 2021 as compared to the same period in 2020 was primarily due to the net unfavourable impacts related to the redemption of the 2018 Senior Unsecured Notes and Canadian deferred tax assets not recorded.
IPG Net Earnings
IPG Net Earnings totalled $14.3 million for the second quarter of 2021, a $0.1 million or 1.0% decrease from $14.5 million for the second quarter of 2020, primarily due to (i) an increase in finance costs mainly due to the 2018 Senior Unsecured Notes Redemption Charges and the non-recurrence of a gain in the second quarter of 2020 resulting from a fair value adjustment to the Company's contingent consideration related to the Nortech Acquisition and (ii) an increase in SG&A mainly due to increases in both variable and share-based compensation. These unfavourable impacts were largely offset by an increase in gross profit.
IPG Net Earnings totalled $33.4 million the first six months of 2021, a $4.5 million or 15.7% increase from $28.9 million the first six months of 2020, primarily due to an increase in gross profit and the non-recurrence of termination benefits related to employee restructuring initiatives in the second quarter of 2020 in manufacturing facility closures, restructuring and other related charges. These favourable impacts were partially offset by increases in SG&A, finance costs and income tax expense.
Non-GAAP Financial Measures and Key Performance Indicators
The Company measures the success of the business using a number of key performance indicators, many of which are in accordance with GAAP as described throughout this MD&A. This MD&A also contains certain non-GAAP financial measures and key performance metrics as defined under applicable securities legislation, including adjusted net earnings (loss), adjusted earnings (loss) per share, EBITDA, adjusted EBITDA, and free cash flows (please see the "Adjusted Net Earnings (Loss) and Adjusted Net Earnings (Loss) Per Share" section below for a description and reconciliation of adjusted net earnings (loss) and adjusted earnings (loss) per share, the “EBITDA and Adjusted EBITDA” section below for a description and reconciliation of EBITDA and adjusted EBITDA, and the “Cash Flows” section below for a description and reconciliation of free cash flows). In determining these measures, the Company excludes certain items which are otherwise included in determining the comparable GAAP financial measures. The Company believes such non-GAAP financial measures are key performance indicators that improve the period-to-period comparability of the Company’s results and provide investors with more insight into, and an additional tool to understand and assess, the performance of the Company's ongoing core business operations. As required by applicable securities legislation, the Company has provided definitions of those measures and reconciliations of those measures to the most directly comparable GAAP financial measures. Investors and other readers are encouraged to review the related GAAP financial measures and the reconciliation of non-GAAP financial measures to their most directly comparable GAAP financial measures set forth below and should consider non-GAAP financial measures and key performance indicators only as a supplement to, and not as a substitute for or as a superior measure to, measures of financial performance prepared in accordance with GAAP.
10

Adjusted Net Earnings (Loss) and Adjusted Earnings (Loss) Per Share
A reconciliation of the Company’s adjusted net earnings (loss), a non-GAAP financial measure, to IPG Net Earnings, the most directly comparable GAAP financial measure, is set out in the adjusted net earnings (loss) reconciliation table below. Adjusted net earnings (loss) should not be construed as IPG Net Earnings as determined by GAAP. The Company defines adjusted net earnings (loss) as IPG Net Earnings before (i) manufacturing facility closures, restructuring and other related charges (recoveries); (ii) advisory fees and other costs associated with mergers and acquisitions activity, including due diligence, integration and certain non-cash purchase price accounting adjustments ("M&A Costs"); (iii) share-based compensation expense (benefit); (iv) impairment of goodwill; (v) impairment (reversal of impairment) of long-lived assets and other assets; (vi) write-down on assets classified as held-for-sale; (vii) (gain) loss on disposal of property, plant, and equipment; (viii) other discrete items as shown in the table below; and (ix) the income tax expense (benefit) effected by these items. The term “adjusted net earnings (loss)” does not have any standardized meaning prescribed by GAAP and is therefore unlikely to be comparable to similar measures presented by other issuers. Adjusted net earnings (loss) is not a measurement of financial performance under GAAP and should not be considered as an alternative to IPG Net Earnings as an indicator of the Company’s operating performance or any other measures of performance derived in accordance with GAAP. The Company has included this non-GAAP financial measure because it believes that it allows investors to make a more meaningful comparison of the Company’s performance between periods presented by excluding certain non-operating expenses, non-cash expenses and, where indicated, non-recurring expenses. In addition, adjusted net earnings (loss) is used by management in evaluating the Company’s performance because it believes it provides an indicator of the Company’s performance that is often more meaningful than GAAP financial measures for the reasons stated in the previous sentence.
Adjusted earnings (loss) per share is also presented in the following table and is a non-GAAP financial measure. Adjusted earnings (loss) per share should not be construed as IPG Net Earnings per share as determined by GAAP. The Company defines adjusted earnings (loss) per share as adjusted net earnings (loss) divided by the weighted average number of common shares outstanding, both basic and diluted. The term “adjusted earnings (loss) per share” does not have any standardized meaning prescribed by GAAP and is therefore unlikely to be comparable to similar measures presented by other issuers. Adjusted earnings (loss) per share is not a measurement of financial performance under GAAP and should not be considered as an alternative to IPG Net Earnings per share as an indicator of the Company’s operating performance or any other measures of performance derived in accordance with GAAP. The Company has included this non-GAAP financial measure because it believes that it allows investors to make a more meaningful comparison of the Company’s performance between periods presented by excluding certain non-operating expenses, non-cash expenses and, where indicated, non-recurring expenses. In addition, adjusted earnings (loss) per share is used by management in evaluating the Company’s performance because it believes it provides an indicator of the Company’s performance that is often more meaningful than GAAP financial measures for the reasons stated in the previous sentence.
11

Adjusted Net Earnings Reconciliation to IPG Net Earnings(In millions of USD, except per share amounts and share numbers) (Unaudited)
Three months endedJune 30,
Six months endedJune 30,
2021 2020 2021 2020$ $ $ $
IPG Net Earnings 14.3 14.5 33.4 28.9 Manufacturing facility closures, restructuring and other related charges — 3.2 — 3.9 M&A Costs 1.5 1.0 1.5 2.6 Share-based compensation expense (benefit) 5.8 3.7 16.9 (0.2) Impairment of long-lived assets and other assets 0.3 0.1 0.4 0.1 (Gain) loss on disposal of property, plant and equipment (0.0) 0.1 — 0.2 Other item: change in fair value of contingent consideration liability (1) — (11.0) 0.0 (11.0) Other item: Nortech incremental tax costs incurred (reversed) (2) (0.5) — 0.8 — Other item: 2018 Senior Unsecured Notes Redemption
Charges 18.1 — 18.1 — Income tax (benefit) expense, net (5.7) 1.3 (8.4) 1.5 Adjusted net earnings 33.7 12.9 62.5 25.9
IPG Net Earnings per shareBasic 0.24 0.25 0.57 0.49 Diluted 0.24 0.25 0.55 0.49
Adjusted earnings per shareBasic 0.57 0.22 1.06 0.44 Diluted 0.56 0.22 1.03 0.44
Weighted average number of common shares outstandingBasic 59,027,230 59,009,685 59,027,139 59,009,685 Diluted 60,519,144 59,467,336 60,447,948 59,270,918
(1) Refers to the potential earn-out consideration obligation associated with the Nortech Acquisition.(2) Refers to charges incurred (reversed) related to an amount payable to the former shareholders of Nortech for tax-
related costs associated with the Nortech Acquisition that was subsequently paid in July 2021.
Adjusted net earnings totalled $33.7 million for the second quarter of 2021, a $20.9 million or 162% increase from $12.9 million for the second quarter of 2020, and totalled $62.5 million for the first six months of 2021, a $36.6 million or 141% increase from $25.9 million for the first six months of 2020. The increase in both periods was primarily due to an increase in gross profit, partially offset by an increase in income tax expense and an increase in SG&A mainly due to an increase in variable compensation and professional consulting services.
12

EBITDA and Adjusted EBITDA
A reconciliation of the Company’s EBITDA, a non-GAAP financial measure, to net earnings (loss), the most directly comparable GAAP financial measure, is set out in the EBITDA reconciliation table below. EBITDA should not be construed as earnings (loss) before income taxes, net earnings (loss) or cash flows from operating activities as determined by GAAP. The Company defines EBITDA as net earnings (loss) before (i) interest and other finance costs (income); (ii) income tax expense (benefit); (iii) amortization of intangible assets; and (iv) depreciation of property, plant and equipment. The Company defines adjusted EBITDA as EBITDA before (i) manufacturing facility closures, restructuring and other related charges (recoveries); (ii) advisory fees and other costs associated with mergers and acquisitions activity, including due diligence, integration and certain non-cash purchase price accounting adjustments ("M&A Costs"); (iii) share-based compensation expense (benefit); (iv) impairment of goodwill; (v) impairment (reversal of impairment) of long-lived assets and other assets; (vi) write-down on assets classified as held-for-sale; (vii) (gain) loss on disposal of property, plant and equipment; and (viii) other discrete items as shown in the table below. The terms "EBITDA" and "adjusted EBITDA" do not have any standardized meanings prescribed by GAAP and are therefore unlikely to be comparable to similar measures presented by other issuers. EBITDA and adjusted EBITDA are not measurements of financial performance under GAAP and should not be considered as alternatives to cash flows from operating activities or as alternatives to net earnings (loss) as indicators of the Company’s operating performance or any other measures of performance derived in accordance with GAAP. The Company has included these non-GAAP financial measures because it believes that they allow investors to make a more meaningful comparison between periods of the Company’s performance, underlying business trends and the Company’s ongoing operations. The Company further believes these measures may be useful in comparing its operating performance with the performance of other companies that may have different financing and capital structures, and tax rates. Adjusted EBITDA excludes costs that are not considered by management to be representative of the Company’s underlying core operating performance, including certain non-operating expenses, non-cash expenses and, where indicated, non-recurring expenses. In addition, EBITDA and adjusted EBITDA are used by management to set targets and are metrics that, among others, can be used by the Company’s Human Resources and Compensation Committee to establish performance bonus metrics and payout, and by the Company’s lenders and investors to evaluate the Company’s performance and ability to service its debt, finance capital expenditures and acquisitions, and provide for the payment of dividends to shareholders. The Company experiences normal business seasonality that typically results in adjusted EBITDA that is proportionately higher in the second half of the year relative to the first half.
EBITDA and Adjusted EBITDA Reconciliation to Net Earnings(In millions of USD)(Unaudited)
Three months endedJune 30,
Six months endedJune 30,
2021 2020 2021 2020$ $ $ $
Net earnings 14.7 14.6 34.5 28.9 Interest and other finance costs (income) 22.0 (2.1) 28.7 4.6 Income tax expense 5.6 4.3 11.8 7.5 Depreciation and amortization 15.9 16.1 32.2 31.4 EBITDA 58.2 32.9 107.2 72.5 Manufacturing facility closures, restructuring and other related charges — 3.2 — 3.9 M&A Costs 1.5 1.0 1.5 2.6 Share-based compensation expense (benefit) 5.8 3.7 16.9 (0.2) Impairment of long-lived assets and other assets 0.3 0.1 0.4 0.1 (Gain) loss on disposal of property, plant and equipment (0.0) 0.1 — 0.2 Adjusted EBITDA 65.7 41.0 125.9 79.0
Adjusted EBITDA totalled $65.7 million for the second quarter of 2021, a $24.6 million or 60.0% increase from $41.0 million for the second quarter of 2020 and totalled $125.9 million for the first six months of 2021, a $46.9 million or 59.4% increase from $79.0 million for the first six months of 2020. The increase in both periods was primarily due to an increase in gross profit.
13

Off-Balance Sheet Arrangements
There have been no material changes with respect to off-balance sheet arrangements since December 31, 2020 outside of the Company’s ordinary course of business. Reference is made to the “Off-Balance Sheet Arrangements” section in the Company's MD&A as of and for the year ended December 31, 2020 ("2020 MD&A").
Working Capital
The Company experiences some business seasonality that results in the Company’s efforts to effectively manage its working capital resources. Typically, a larger investment in working capital is required in quarters during which accounts receivable increases due to a higher level of sales invoiced toward the end of the quarter and inventory builds in anticipation of higher future sales. This working capital build normally unwinds later in the fiscal year. Furthermore, certain liabilities are accrued for throughout the year and are paid only during the first quarter of the following year.
The Company uses Days Inventory to measure inventory performance. Days Inventory decreased to 68 for the second quarter of 2021 from 76 for the second quarter of 2020. Days Inventory decreased to 66 for the six months ended June 30, 2021 from 72 for the same period in 2020. Inventories increased $55.9 million to $250.4 million as of June 30, 2021 from $194.5 million as of December 31, 2020, primarily due to inventory builds as a result of organic growth and increases in raw material prices.
The calculations are shown in the following table (in millions of USD, except days):
Three months ended
June 30,Six months ended
June 30,2021 2020 2021 2020
Cost of sales $ 287.4 $ 210.6 $ 550.4 $ 429.7 Days in period 91 91 181 182 Cost of sales per day $ 3.2 $ 2.3 $ 3.0 $ 2.4 Average inventory $ 214.2 $ 176.3 $ 200.1 $ 170.0 Days inventory 68 76 66 72 Days inventory is calculated as follows:Cost of sales ÷ Days in period = Cost of sales per day(Beginning inventory + Ending inventory) ÷ 2 = Average inventoryAverage inventory ÷ Cost of goods sold per day = Days inventoryFor purposes of this calculation inventory excludes items considered parts and supplies
14

The Company uses Days Sales Outstanding (“DSO”) to measure the performance of its trade receivables. DSO was 47 for the second quarter of both 2021 and 2020. DSO increased to 49 for the six months ended June 30, 2021 from 46 for the same period in 2020. Trade receivables increased $31.8 million to $194.0 million as of June 30, 2021 from $162.2 million as of December 31, 2020, primarily due to organic growth, the impact of higher selling prices and the timing of revenue invoiced later in the second quarter of 2021 compared to the fourth quarter of 2020.
The calculations are shown in the following table (in millions of USD, except days):
Three months ended
June 30,Six months ended
June 30,2021 2020 2021 2020
Revenue $ 376.7 $ 267.7 $ 722.3 $ 545.9 Days in period 91 91 181 182 Revenue per day $ 4.1 $ 2.9 $ 4.0 $ 3.0 Trade receivables $ 194.0 $ 137.9 $ 194.0 $ 137.9 DSO 47 47 49 46 DSO is calculated as follows:Revenue ÷ Days in period = Revenue per dayEnding trade receivables ÷ Revenue per day = DSO
Accounts payable and accrued liabilities decreased $8.2 million to $172.3 million as of June 30, 2021 from $180.4 million as of December 31, 2020, primarily due to the timing of payments made for inventory as well as SG&A, including annual payments made in 2021 for 2020 liabilities mainly related to variable compensation.
Liquidity and Borrowings
Liquidity
The Company relies upon cash flows from operations and funds available under its credit facilities to meet working capital requirements, as well as to fund capital expenditures, business acquisitions, dividends, share repurchases, obligations under its other debt instruments, and other general corporate activities.
The Company's liquidity risk management process serves to maintain a sufficient amount of cash and to ensure that the Company has financing sources for a sufficient authorized amount. The Company establishes budgets, cash estimates, cash management policies and long-term capital structure strategies to ensure it has the necessary funds to fulfill its obligations for the foreseeable future and ensure adequate liquidity on a long-term basis.
The Company believes it has sufficient cash on hand, and that it will generate sufficient funds from cash flows from operating activities, to meet its ongoing expected capital expenditures, working capital and discretionary dividend payment funding needs for at least the next twelve months. In addition, funds available from borrowings may be used, as needed, to fund more significant strategic initiatives.
As of June 30, 2021, the Company had $15.2 million of cash and $471.9 million of loan availability (comprised of committed funding of $465.5 million and uncommitted funding of $6.4 million), yielding total cash and loan availability of $487.1 million compared to total cash and loan availability of $408.7 million as of December 31, 2020.
The Company's total outstanding borrowings and lease liabilities increased $94.4 million to $589.5 million ($580.4 million net of unamortized debt issuance costs of $9.1 million) as of June 30, 2021 from $495.1 million ($490.0 million net of unamortized debt issuance costs of $5.1 million) as of December 31, 2020. The incremental borrowings were primarily due to seasonal increases in working capital needs, debt refinancing, and to fund strategic initiatives as discussed in the "Capital Resources" section below.
15

Senior Unsecured Notes
On June 8, 2021, the Company completed the private placement of the 2021 Senior Unsecured Notes, which consisted of $400.0 million aggregate principal amount of senior unsecured notes due June 15, 2029. These 2021 Senior Unsecured Notes bear interest at a fixed rate of 4.375% per annum, payable semi-annually in cash in arrears on June 15 and December 15 of each year, beginning on December 15, 2021. As of June 30, 2021, the 2021 Senior Unsecured Notes outstanding balance amounted to $400.0 million ($395.2 million net of $4.8 million in unamortized debt issuance costs). The 2021 Senior Unsecured Notes include optional redemptions on or after June 15, 2024. The Company may redeem the 2021 Senior Unsecured Notes in 2024 at a redemption price of 102.188%, in 2025 at a redemption price of 101.094%, and in 2026 and thereafter at a redemption price of 100%.
The Company used the net proceeds from the 2021 Senior Unsecured Notes (i) to redeem its previously outstanding $250 million of 2018 Senior Unsecured Notes which bear interest at a fixed rate of 7.00% per annum and were scheduled to mature on October 15, 2026, (ii) to repay a portion of the borrowings outstanding under its 2018 Credit Facility (defined below) and (iii) to pay related fees and expenses, as well as (iv) for general corporate purposes. In connection with the redemption of its 2018 Senior Unsecured Notes, the Company wrote-off debt issuance costs of $3.6 million which are recorded as interest under the caption finance costs (income) in earnings, as well as recognized an early redemption premium and other costs of $14.4 million recorded as other finance expense (income), net under the caption finance costs (income) in earnings.
2021 Credit Facility
On June 14, 2021, the Company entered into the 2021 Credit Facility, which was a new five-year $600 million credit facility with a syndicated lending group, amending and extending the Company's previous $600 million credit facility that was due to mature in June 2023 ("2018 Credit Facility"), to June 2026.
The 2018 Credit Facility's outstanding balance of $112.8 million was transferred to the 2021 Credit Facility, and corresponding unamortized debt issuance costs of $1.1 million are being amortized using the straight-line method over the five-year term of the 2021 Credit Facility. In securing the 2021 Credit Facility, the Company incurred debt issuance costs amounting to $3.2 million which were capitalized and are being amortized using the straight-line method over the five-year term.
The 2021 Credit Facility consists of a $600.0 million revolving credit facility, as well as an incremental accordion feature of $300.0 million, which would enable the Company to increase the limit of this facility (subject to the credit agreement's terms and lender approval) to $900.0 million if needed. The 2021 Credit Facility bears an interest rate based, at the Company’s option, on the London Inter-bank Offered Rate ("LIBOR") (or a lender-approved comparable or successor rate), the Federal Funds Rate, or Bank of America’s prime rate, plus a spread varying between 10 and 235 basis points (110 and 150 basis points as of June 30, 2021 and December 31, 2020, respectively) depending on the debt instrument's benchmark interest rate and the consolidated secured net leverage ratio.
The 2021 Credit Facility has two financial covenants, a consolidated secured net leverage ratio and a consolidated interest coverage ratio. The consolidated secured net leverage ratio must not be more than 4.00 to 1.00, with an allowable temporary increase to 4.50 to 1.00 for the quarter in which the Company consummates an acquisition with a price not less than $50 million and the following three quarters. The consolidated interest coverage ratio must not be less than 2.25 to 1.00. The Company was in compliance with the consolidated secured net leverage ratio and consolidated interest coverage ratio, which were 0.67 and 9.89, respectively, as of June 30, 2021. In addition, the 2021 Credit Facility has certain non-financial covenants, such as covenants regarding indebtedness, investments, and asset dispositions. The Company was in compliance with all covenants as of and for the three months ended June 30, 2021.
As of June 30, 2021, the 2021 Credit Facility’s outstanding principal balance amounted to $132.8 million (outstanding principal balance of $128.5 million, net of unamortized debt issuance costs of $4.3 million). Standby letters of credit totalled $1.7 million resulting in total utilization under the 2021 Credit Facility of $134.5 million. Accordingly, unused availability under the 2021 Credit Facility as of June 30, 2021 amounted to $465.5 million. The Company's capacity to borrow available funds under the 2021 Credit Facility may be limited because of the secured net leverage ratio covenant and other restrictions as defined in the Company's credit agreement.
Other Borrowings
As of June 30, 2021, the Company's credit facilities denominated in INR had an outstanding balance of INR 871.2 million ($11.7 million). Including INR 206.5 million ($2.8 million) in outstanding letters of credit, total utilization under these credit facilities amounted to INR 1,077.7 million ($14.5 million). Any repayment of term loan borrowings under the credit facilities
16

denominated in INR are not available to be borrowed again in the future. Unused availability under these facilities as of June 30, 2021 amounted to INR 251.4 million ($3.4 million). All unused availability was uncommitted.
In addition, one of the Company’s wholly-owned subsidiaries has a short-term credit line for up to €2.5 million (approximately $3.0 million), which was fully available as of June 30, 2021. All unused availability was uncommitted.
Cash Flows
Cash flows from operating activities decreased in the second quarter of 2021 by $18.3 million to $22.2 million from $40.5 million in the same period in 2020 primarily due to an increase in cash used for working capital items and an increase in federal income taxes paid, partially offset by an increase in gross profit. Changes in working capital items consisted primarily of an increase in inventories and an increase in accounts receivable, partially offset by a greater increase in accounts payable.
Cash flows from operating activities decreased in the first six months of 2021 by $30.2 million to an outflow of $6.7 million from an inflow of $23.5 million in the same period in 2020 primarily due to an increase in cash used for working capital items and an increase in federal income taxes paid, partially offset by an increase in gross profit. Changes in working capital items consisted primarily of (i) a greater increase in inventories, (ii) a greater increase in accounts receivable and (iii) share-based compensation settlements in the first quarter of 2021 related to cash-settled awards as discussed in the "Capital Stock" section below, partially offset by less of a decrease in accounts payable.
In both the second quarter and first six months of 2021, a larger investment in working capital was required to support the organic growth and reflects the impacts of both higher selling and raw material prices, as well as the timing of payments and receipts. This investment compares to COVID-19 related declines in demand and conservative working capital management strategies implemented in the second quarter and first six months of 2020 in response to uncertainty, including inventory management and cost saving initiatives.
Cash flows used for investing activities increased in the second quarter of 2021 by $10.9 million to $16.3 million from $5.4 million in the same period in 2020, primarily due to an increase in capital expenditures mainly for capacity expansion initiatives in the Company's highest growth product categories as compared to minimal capital expenditures in 2020 as a precautionary measure given market uncertainty caused by COVID-19.
Cash flows used for investing activities decreased in the first six months of 2021 by $19.9 million to $28.4 million from $48.4 million in the same period in 2020, primarily due to the non-recurrence of the Nortech Acquisition in the first quarter of 2020, partially offset by an increase in capital expenditures mainly for capacity expansion initiatives in the Company's highest growth product categories as compared to minimal capital expenditures in 2020 as a precautionary measure given market uncertainty caused by COVID-19.
Cash flows from financing activities increased in the second quarter of 2021 by $43.4 million to an inflow of $2.4 million from an outflow of $41.0 million in the same period in 2020, primarily due to net borrowings in 2021 as compared to net debt repayments in 2020 both of which were mainly driven by working capital requirements. This inflow was partially offset by the early redemption premium and other costs related to the 2018 Senior Unsecured Notes and an increase in debt issuance costs primarily associated with the 2021 Senior Unsecured Notes and the 2021 Credit Facility.
Cash flows from financing activities increased in the first six months of 2021 by $5.5 million to an inflow of $38.9 million from an inflow of $33.4 million in the same period in 2020, primarily due to greater net borrowings in 2021, partially offset by the early redemption premium and other costs related to the 2018 Senior Unsecured Notes and an increase in debt issuance costs primarily associated with the 2021 Senior Unsecured Notes and the 2021 Credit Facility. For more information, see the "Liquidity and Borrowings" section above.
The Company has included free cash flows, a non-GAAP financial measure, because it is used by management and investors in evaluating the Company’s performance and liquidity. Free cash flows does not have any standardized meaning prescribed by GAAP and is therefore unlikely to be comparable to similar measures presented by other issuers. Free cash flows should not be interpreted to represent the total cash movement for the period as described in the Company's financial statements, or to represent residual cash flow available for discretionary purposes, as it excludes other mandatory expenditures such as debt service. The Company experiences business seasonality that typically results in the majority of cash flows from operating activities and free cash flows being generated in the second half of the year.
The Company defines free cash flows as cash flows from operating activities less purchases of property, plant and equipment.
17

A reconciliation of free cash flows to cash flows from operating activities, the most directly comparable GAAP financial measure, is set forth below.
Free Cash Flows Reconciliation to Cash Flows from Operating Activities(In millions of USD)(Unaudited)
Three months ended
June 30,Six months ended
June 30, 2021 2020 2021 2020 $ $ $ $
Cash flows from (used) in operating activities 22.2 40.5 (6.7) 23.5
Less purchases of property, plant and equipment (15.8) (5.3) (25.1) (12.7) Free cash flows 6.4 35.3 (31.8) 10.8
Free cash flows decreased by $28.8 million in the second quarter of 2021 to $6.4 million from $35.3 million in the same period in 2020 and decreased by $42.6 million in the first six months of 2021 to negative $31.8 million from $10.8 million in the same period in 2020. The decrease in both periods was primarily due to a decrease in cash flows from operating activities and an increase in capital expenditures.
Capital Resources
Capital expenditures totalled $15.8 million and $25.1 million in the three and six months ended June 30, 2021 and were funded primarily by borrowings and cash flows from operating activities. The Company had commitments to suppliers to purchase machinery and equipment totalling approximately $26.7 million as of June 30, 2021 that are expected to be paid out in the next twelve months and will be funded by borrowings and cash flows from operating activities. These capital expenditures and commitments to suppliers were primarily to support the Company's capacity expansion initiatives in its highest growth product categories, specifically films, water-activated tape, protective packaging and wovens, as discussed in the "Outlook" section above.
Contractual Obligations
There have been no material changes with respect to contractual obligations since December 31, 2020 outside of the Company’s ordinary course of business and the 2021 Senior Unsecured Notes and 2021 Credit Facility discussed in the "Liquidity and Borrowings" section above. Reference is also made to the “Contractual Obligations” section in the Company’s 2020 MD&A.
Capital Stock and Dividends
As of June 30, 2021, there were 59,043,687 common shares of the Company outstanding.
The Company's share-based compensation plans include: stock options, Performance Share Units ("PSU"), Restricted Share Units ("RSU") and Deferred Share Units ("DSU").
18

The table below summarizes share-based compensation activity that occurred during the following periods:
Three months ended June 30, Six months ended June 30, 2021 2020 2021 2020Equity-settled
Stock options granted — — 243,152 1,533,183 Stock options exercised 16,640 — 16,640 — Stock options cancelled/forfeited — 40,000 — 77,500
Cash-settledDSUs granted 9,591 90,569 52,369 96,843 PSUs granted — — 200,982 694,777 PSUs forfeited 6,174 2,516 6,174 5,032 PSUs added (cancelled) by performance factor (1) — — 143,512 (346,887) PSUs settled (1) — — 409,670 — RSUs granted — — 81,981 281,326 RSUs forfeited 2,058 839 2,058 1,678 RSUs settled — — 106,906 — Cash settlements (in millions of USD) (2) — — $ 13.2 —
(1) The following table provides further information regarding the PSUs settled and adjusted by performance factor included in the table above. The number of "Target Shares" reflects 100% of the PSUs granted and the number of PSUs settled reflects the performance adjustments to the Target Shares.
Grant Date Date Settled Target Shares Performance PSUs settledMarch 20, 2017 March 20, 2020 346,887 — % — March 21, 2018 March 23, 2021 266,158 153.9 % 409,670
(2) Includes a cash payment of dividend equivalents on PSUs and RSUs equaling the product that results from multiplying the number of settled awards by the amount of cash dividends per common share declared and paid by the Company from the date of grant of the awards to the settlement date.
As of June 30, 2021, $19.3 million was recorded in share-based compensation liabilities, current, and $15.6 million was recorded in share-based compensation liabilities, non-current.
The table below presents the share-based compensation expense (benefit) recorded in earnings in SG&A by award type (in millions of USD):
Three months ended June 30, Six months ended June 30, 2021 2020 2021 2020 $ $ $ $
Equity-settled 0.3 0.2 0.5 0.4 Cash-settled 5.5 3.5 16.4 (0.6) Total 5.8 3.7 16.9 (0.2)
On June 30, 2021 the Company paid cash dividends of $0.1575 per common share to shareholders of record at the close of business June 16, 2021 for an aggregate amount of $9.2 million.
19

On August 10, 2021, the Board of Directors amended the Company's quarterly policy to increase the annualized dividend by 7.9% from $0.63 to $0.68 per common share. The Board's decision to increase the dividend was based on the Company's strong financial position and positive outlook. Accordingly, on August 10, 2021, the Company declared a quarterly cash dividend of $0.17 per common share payable on September 30, 2021 to shareholders of record at the close of business on September 16, 2021.
The dividends paid and payable in 2021 by the Company are “eligible dividends” as defined in subsection 89(1) of the Income Tax Act (Canada).
The Company renewed its NCIB under which the Company will be entitled to repurchase for cancellation up to 4,000,000 common shares over a twelve-month period starting on July 23, 2021 and ending on July 22, 2022. As of August 10, 2021, no shares had been repurchased under the current or prior NCIB.
Financial Risk, Objectives and Policies
Interest Rate Risk
The Company is exposed to a risk of changes in cash flows due to the fluctuations in interest rates on its variable rate borrowings. To minimize the potential long-term cost of floating rate borrowings, the Company entered into interest rate swap agreements.
The Company was party to the following interest rate swap agreements, which are qualifying cash flow hedges designated as hedging instruments as of June 30, 2021 (in millions of USD):
Effective Date Maturity Notional Amount Settlement Fixed interest rate paid$ %
June 8, 2017 June 20, 2022 40.0 Monthly 1.7900August 20, 2018 August 18, 2023 60.0 Monthly 2.0450
Hedge of net investment in foreign operations
A foreign currency exposure arises from Intertape Polymer Group Inc.'s net investment in its USD functional currency subsidiary, IPG (US) Holdings Inc. The risk arises from the fluctuations in the USD and CDN current exchange rate, which causes the amount of the net investment in IPG (US) Holdings Inc. to vary. The Company's Senior Unsecured Notes are being used to hedge the Company’s exposure to the USD foreign exchange risk on this investment.
The changes in value related to the net investment in IPG (US) Holdings, Inc., designated as the hedged item, and the Senior Unsecured Notes, designated as a hedging instrument, in the hedge of a net investment, are as follows (in millions of USD):
Three months ended
June 30,Six months ended
June 30, 2021 2020 2021 2020
$ $ $ $(Loss) gain from change in value of IPG (US) Holdings, Inc. used for calculating hedge ineffectiveness (0.2) (8.6) (2.8) 11.4 (Loss) gain from change in value of the Senior Unsecured Notes used for calculating hedge ineffectiveness (1.2) 8.6 1.5 (11.4) Gain (loss) from Senior Unsecured Notes recognized in other comprehensive income 0.2 8.6 2.8 (11.4) Loss from hedge ineffectiveness recognized in earnings in finance costs (income), in other finance expense (income), net (1.4) — (1.4) — Deferred tax (expense) benefit on change in value of the Senior Unsecured Notes recognized in other comprehensive income (1.2) — (1.6) 0.0
20

The cumulative amounts included in the foreign currency translation reserve recognized in other comprehensive income related to the hedge of net investment in foreign operations are a gain of $10.2 million and $7.3 million as of June 30, 2021 and December 31, 2020, respectively.
Legal Matters
The Company is engaged from time-to-time in various legal proceedings and claims that have arisen in the ordinary course of business. The outcome of all of the proceedings and claims against the Company is subject to future resolution, including the uncertainties of litigation. Based on information currently known to the Company and after consultation with external legal counsel, management believes that the probable ultimate resolution of any such proceedings and claims, individually or in the aggregate, will not have a material adverse effect on the financial condition of the Company, taken as a whole, and accordingly, no material amounts have been recorded as of June 30, 2021.
Critical Accounting Judgments, Estimates and Assumptions
The preparation of the financial statements requires management to make judgments, estimates and assumptions that affect the application of accounting policies and the reported amounts of assets, liabilities, income and expenses. Significant changes in the underlying assumptions could result in significant changes to these estimates. Consequently, management reviews these estimates on a regular basis. Revisions to accounting estimates are recognized in the period in which the estimates are revised and in any future periods affected. The judgments, estimates and assumptions applied in the financial statements were the same as those applied in the Company’s most recent annual audited consolidated financial statements, except for the estimate of the provision for income taxes, which is determined in the financial statements using the estimated weighted average annual effective income tax rate applied to the earnings before income tax expense of the interim period, which may have to be adjusted in a subsequent interim period of the financial year if the estimate of the annual income tax rate changes. The financial statements should be read in conjunction with the Company’s 2020 annual audited consolidated financial statements.
The Company is closely monitoring the impacts of the COVID-19 pandemic as a trigger for changes in critical accounting judgments, estimates and assumptions.
New Standards adopted as of January 1, 2021
In the current period, the Company has applied a number of amendments to IFRS Standards and Interpretations issued by the International Accounting Standards Board (“IASB”) that are effective for an annual period that begins on or after January 1, 2021. Their adoption has not had any material impact on the disclosures or on the amounts reported in the Company's financial statements.
New Standards and Interpretations Issued but Not Yet Effective
Certain new standards, amendments and interpretations, and improvements to existing standards have been published by the IASB but are not yet effective and have not been adopted early by the Company. Management anticipates that all the relevant pronouncements will be adopted in the first reporting period following the date of application. Information on new standards, amendments and interpretations, and improvements to existing standards, which could potentially impact the Company’s financial statements, are detailed as follows:
On January 23, 2020, the IASB published Classification of Liabilities as Current or Non-current (Amendments to IAS 1), which includes narrow-scope amendments to IAS 1 Presentation of Financial Statements. The objective of the amendments is to clarify how to classify debt and other liabilities as current or non-current depending on the rights that exist at the end of the reporting period. The amendments include clarifying the classification requirements for debt a company might settle by converting it into equity. The amendments are effective on January 1, 2023 and will be applied retrospectively. Management is currently assessing, but has not yet determined, the impact on the Company’s financial statements.
On May 14, 2020, the IASB published Property, Plant and Equipment: Proceeds Before Intended Use (Amendments to IAS 16), which prohibits deducting amounts received from selling items produced while preparing the asset for its intended use from the cost of property, plant and equipment. Instead, such sales proceeds and related costs will be recognized in earnings. The amendments are effective on January 1, 2022. Management is currently assessing, but has not yet determined, the impact on the Company’s financial statements.
21

On May 7, 2021, the IASB published Deferred Tax Related to Assets and Liabilities Arising From a Single Transaction (Amendments to IAS 12), which clarifies that the initial recognition exemption does not apply to transactions in which both deductible and taxable temporary differences will result in the recognition of equal deferred tax assets and liabilities, and that the Company is required to recognize deferred tax on such transactions. The amendments are effective on January 1, 2023. Management is currently assessing, but has not yet determined, the impact on the Company’s financial statements.
Certain other new standards and interpretations have been issued but are not expected to have a material impact on the Company’s financial statements.
Internal Control Over Financial Reporting
In accordance with the Canadian Securities Administrators’ National Instrument 52-109, “Certification of Disclosure in Issuers’ Annual and Interim Filings” (“NI 52-109”), the Company has filed interim certificates signed by the Chief Executive Officer (“CEO”) and the Chief Financial Officer ("CFO") that, among other things, report on the design of disclosure controls and procedures and design of internal control over financial reporting. With regards to the annual certification requirements of NI 52-109, the Company relies on the statutory exemption contained in section 8.1 of NI 52-109, which allows it to file with the Canadian securities regulatory authorities the certificates required under the Sarbanes-Oxley Act of 2002 at the same time such certificates are required to be filed in the United States of America.
The Company maintains disclosure controls and procedures that are designed to ensure that information required to be disclosed in its annual filings, interim filings or other reports filed or submitted by the Company under securities legislation is recorded, processed, summarized and reported within the time periods specified in securities legislation and that such information is accumulated and communicated to the Company's management including the CEO and CFO as appropriate to allow timely decision regarding required disclosure. The Company has also established internal control over financial reporting which is designed to provide reasonable assurance regarding the reliability of the Company’s financial reporting and its compliance with GAAP (as derived in accordance with IFRS) in its consolidated financial statements.
Management, under the supervision of the Company's CEO and CFO, evaluated the effectiveness of the Company's disclosure controls and procedures as well as the effectiveness of the Company's internal control over financial reporting as of December 31, 2020. The CEO and CFO concluded that the Company’s disclosure controls and procedures and internal control over financial reporting as of December 31, 2020 were effective.
There have been no changes to the Company’s internal control over financial reporting during the Company’s most recent interim period that have materially affected, or are reasonably likely to materially affect, the Company’s internal control over financial reporting.
All internal control systems, no matter how well designed, have inherent limitations. Therefore, even those systems determined to be effective can provide only reasonable assurance with respect to financial statement preparation and presentation. Because of its inherent limitation, internal control over financial reporting may not prevent or detect misstatements. Also, projections of any evaluation of effectiveness to future periods are subject to risk that controls may become inadequate because of changes in conditions, or that the degree of compliance with the policies or procedures may deteriorate.
Additional Information
Additional information relating to the Company, including its Form 20-F filed in lieu of an Annual Information Form for 2020, is available on the Company’s website (www.itape.com) as well as under the Company’s profile on SEDAR at www.sedar.com and on EDGAR at www.sec.gov.
Forward-Looking Statements
Certain statements and information included in this MD&A constitute “forward-looking information” within the meaning of applicable Canadian securities legislation and “forward-looking statements” within the meaning of Section 27A of the Securities Act of 1933, as amended, and Section 21E of the Securities Exchange Act of 1934, as amended (collectively, “forward-looking statements”), which are made in reliance upon the protections provided by such legislation for forward-looking statements. All statements other than statements of historical facts included in this MD&A, including statements regarding the COVID-19 pandemic (including the impact of the Company’s key end markets, the operations of the Company’s facilities, the Company’s priorities as it moves through the pandemic, the uncertainty for the duration of the impacts resulting from the pandemic, the exposure of the Company’s business to the pandemic, and the Company’s alternative capacity and
22

production plan adjustments), the Company's future dividend payments, anticipated demand, including in e-commerce, sustainability-focused markets and other high-growth product categories, the Company’s industry and the Company’s outlook, prospects, plans, financial position, future transactions, acquisitions and partnerships, capital expenditures, sales and financial results, inventory, income tax and effective tax rate, availability of funds and credit, expected credit spread, level of indebtedness, payment of dividends, capital and other significant expenditures, working capital requirements, liquidity, selling prices, fluctuations in costs, the Company’s integration of Nuevopak and the expected costs, savings, capabilities, contributions, synergies, earnings and contingent consideration related to the acquisition of Nuevopak, the Company's use of savings from the redemption of the 2018 Senior Unsecured Notes and issuance of the 2021 Senior Unsecured Notes, the impacts of new accounting standards, judgments, estimates, assumptions, litigation and business strategy, may constitute forward-looking statements. These forward-looking statements are based on current beliefs, assumptions, expectations, estimates, forecasts and projections made by the Company’s management. Words such as “may,” “will,” “should,” “expect,” “continue,” “intend,” “estimate,” “anticipate,” “plan,” “foresee,” “believe” or “seek” or the negatives of these terms or variations of them or similar terminology are intended to identify such forward-looking statements. Although the Company believes that the expectations reflected in these forward-looking statements are reasonable, these statements, by their nature, involve risks and uncertainties and are not guarantees of future performance. Such statements are also subject to assumptions concerning, among other things: business conditions and growth or declines in the Company’s industry, the Company’s customers’ industries and the general economy, including as a result of the impact of COVID-19; the impact of changes to tariffs and other international trade developments; the anticipated benefits from the Company’s greenfield projects and manufacturing facility expansions; the impact of fluctuations in selling prices; the impact of fluctuations in raw material prices and freight costs; costs associated with the impact of climate change, including weather related events and environmental matters; the anticipated benefits from the Company’s acquisitions and partnerships; the expected financial performance and benefits of the Nuevopak acquisition; the Company’s growth strategy and the strength of the Company’s competitive position moving forward; the anticipated benefits from the Company’s capital expenditures; the quality, and market reception, of the Company’s products; the Company’s anticipated business strategies; risks and costs inherent in litigation; legal and regulatory requirements, including as related to COVID-19; the Company’s ability to maintain and improve quality and customer service; anticipated trends in the Company’s business, including the Company's growing e-commerce business; anticipated cash flows from the Company’s operations; anticipated changes in the tax treatment of intercompany debt; availability of funds under the Company’s 2021 Credit Facility; the Company’s flexibility to allocate capital as a result of the 2021 Senior Unsecured Notes offering; changes to accounting rules and standards; and the Company’s ability to continue to control costs. The Company can give no assurance that these statements and expectations will prove to have been correct. Actual outcomes and results may, and often do, differ from what is expressed, implied or projected in such forward-looking statements, and such differences may be material. Readers are cautioned not to place undue reliance on any forward-looking statement. For additional information regarding some important factors that could cause actual results to differ materially from those expressed in these forward-looking statements and other risks and uncertainties, and the assumptions underlying the forward-looking statements, you are encouraged to read “Item 3. Key Information - Risk Factors,” “Item 5 Operating and Financial Review and Prospects (Management’s Discussion & Analysis)” and statements located elsewhere in the Company’s annual report on Form 20-F for the year ended December 31, 2020 and the other statements and factors contained in the Company’s filings with the Canadian securities regulators and the US Securities and Exchange Commission. Each of the forward-looking statements speaks only as of the date of this MD&A. The Company will not update these statements unless applicable securities laws require it to do so.
23

Intertape Polymer Group Inc.
Unaudited Interim Condensed Consolidated Financial StatementsJune 30, 2021
Unaudited Interim Condensed Consolidated Financial Statements
Consolidated Earnings 2
Consolidated Comprehensive Income 3
Consolidated Changes in Equity 4 to 5
Consolidated Cash Flows 6 to 7
Consolidated Balance Sheets 8
Notes to Unaudited Interim Condensed Consolidated Financial Statements 9 to 25

Intertape Polymer Group Inc.Consolidated EarningsPeriods ended June 30,(In thousands of US dollars, except per share amounts)(Unaudited)
Three months ended
June 30,Six months ended
June 30, 2021 2020 2021 2020 $ $ $ $
Revenue 376,686 267,710 722,252 545,922 Cost of sales 287,402 210,623 550,418 429,728 Gross profit 89,284 57,087 171,834 116,194 Selling, general and administrative expenses 44,075 34,534 90,818 65,441 Research expenses 2,910 2,546 5,958 5,879
46,985 37,080 96,776 71,320 Operating profit before manufacturing facility closures, restructuring and other related charges 42,299 20,007 75,058 44,874 Manufacturing facility closures, restructuring and other related charges — 3,211 — 3,862 Operating profit 42,299 16,796 75,058 41,012 Finance costs (income) (Note 3)
Interest 10,070 7,513 15,438 15,311 Other finance expense (income), net 11,951 (9,590) 13,293 (10,722)
22,021 (2,077) 28,731 4,589 Earnings before income tax expense 20,278 18,873 46,327 36,423 Income tax expense (benefit) (Note 4)
Current 6,039 3,996 8,223 6,351 Deferred (484) 296 3,592 1,177
5,555 4,292 11,815 7,528 Net earnings 14,723 14,581 34,512 28,895
Net earnings attributable to:Company shareholders 14,338 14,479 33,390 28,855 Non-controlling interests 385 102 1,122 40
14,723 14,581 34,512 28,895
Earnings per share attributable to Company shareholders (Note 5)
Basic 0.24 0.25 0.57 0.49 Diluted 0.24 0.25 0.55 0.49
The accompanying notes are an integral part of the interim condensed consolidated financial statements. Note 3 presents additional information on consolidated earnings.
2

Intertape Polymer Group Inc.Consolidated Comprehensive IncomePeriods ended June 30,(In thousands of US dollars)(Unaudited)
Three months ended
June 30,Six months ended
June 30, 2021 2020 2021 2020 $ $ $ $Net earnings 14,723 14,581 34,512 28,895 Other comprehensive income (loss)
Change in fair value of interest rate swap agreements designated as cash flow hedges (1) (Note 9) 334 (30) 811 (3,002) Change in cumulative translation adjustments (458) (3,198) (3,968) 637 Net (loss) gain arising from hedge of a net investment in foreign operations (2) (Note 9) (1,055) 8,619 1,243 (11,320)
Items that will be reclassified subsequently to net earnings (1,179) 5,391 (1,914) (13,685) Remeasurement of defined benefit liability (3) (117) (1,765) 2,572 (1,765)
Item that will not be reclassified subsequently to net earnings (117) (1,765) 2,572 (1,765) Total other comprehensive (loss) income (1,296) 3,626 658 (15,450) Comprehensive income for the period 13,427 18,207 35,170 13,445
Comprehensive income (loss) for the period attributable to:Company shareholders 13,143 18,118 34,176 13,683 Non-controlling interests 284 89 994 (238)
13,427 18,207 35,170 13,445
(1) Presented net of deferred income tax expense of $110 and $264 for the three and six months ended June 30, 2021,
respectively, and deferred income tax benefit of $19 and $633 for the three and six months ended June 30, 2020, respectively.
(2) Presented net of deferred income tax expense of $1,237 and $1,589 for the three and six months ended June 30, 2021, respectively, and deferred income tax benefit of nil and $45 for the three and six months ended June 30, 2020, respectively.
(3) Presented net of deferred income tax (benefit) expense of ($85) and $806 for the three and six months ended June 30, 2021, respectively, and deferred income tax benefit of $636 for the three and six months ended June 30, 2020.
The accompanying notes are an integral part of the interim condensed consolidated financial statements.
3

Intertape Polymer Group Inc.Consolidated Changes in EquitySix months ended June 30, 2020 (In thousands of US dollars, except for number of common shares)(Unaudited)
Accumulated other comprehensive loss
Cumulative translation adjustment
account
Reserve for cash flow
hedges
Total equity attributable to
Company shareholders
Non-controlling
interests Capital stock Contributed
surplus
Total equity Number Amount Total Deficit $ $ $ $ $ $ $ $ $Balance as of December 31, 2019 59,009,685 354,559 16,782 (21,632) (1,070) (22,702) (87,899) 260,740 11,488 272,228 Transactions with owners
Change in excess tax benefit on outstanding share-based awards 998 998 998 Share-based compensation (Note 8) 386 386 386 Dividends on common shares (Note 8) (17,409) (17,409) (17,409)
— — 1,384 (17,409) (16,025) (16,025) Net earnings 28,855 28,855 40 28,895
Other comprehensive (loss) incomeChange in fair value of interest rate swap agreements designated as cash flow hedges (1) (Note 9) (3,002) (3,002) (3,002) (3,002) Change in cumulative translation adjustments 915 915 915 (278) 637 Net loss arising from hedge of a net investment in foreign operations (2) (Note 9) (11,320) (11,320) (11,320) (11,320) Remeasurement of defined benefit liability (3) (1,765) (1,765) (1,765)
(10,405) (3,002) (13,407) (1,765) (15,172) (278) (15,450) Comprehensive (loss) income for the period (10,405) (3,002) (13,407) 27,090 13,683 (238) 13,445
Balance as of June 30, 2020 59,009,685 354,559 18,166 (32,037) (4,072) (36,109) (78,218) 258,398 11,250 269,648
(1) Presented net of deferred income tax benefit of $633.(2) Presented net of deferred income tax benefit of $45.(3) Presented net of deferred income tax benefit of $636.
The accompanying notes are an integral part of the interim condensed consolidated financial statements.
4

Intertape Polymer Group Inc.Consolidated Changes in EquitySix months ended June 30, 2021 (In thousands of US dollars, except for number of common shares)(Unaudited)
Accumulated other comprehensive loss
Cumulative translation adjustment
account
Reserve for cash flow
hedges
Total equity attributable to
Company shareholders
Non-controlling
interests
Capital stockContributed
surplus
Total equity Number Amount Total Deficit $ $ $ $ $ $ $ $ $Balance as of December 31, 2020 59,027,047 354,880 22,776 (18,789) (3,097) (21,886) (51,114) 304,656 12,026 316,682 Transactions with owners
Exercise of stock options (Note 8) 16,640 294 294 294 Change in excess tax benefit on exercised share-based awards 30 (30) — — Change in excess tax benefit on outstanding share-based awards 1,976 1,976 1,976 Share-based compensation (Note 8) 454 454 454 Share-based compensation expense credited to capital on options exercised (Note 8) 58 (58) — — Dividends on common shares (Note 8) (18,592) (18,592) (18,592)
16,640 382 2,342 (18,592) (15,868) (15,868) Net earnings 33,390 33,390 1,122 34,512 Other comprehensive (loss) income
Change in fair value of interest rate swap agreements designated as cash flow hedges (1) (Note 9) 811 811 811 811 Change in cumulative translation adjustments (3,840) (3,840) (3,840) (128) (3,968) Net gain arising from hedge of a net investment in foreign operations (2) (Note 9) 1,243 1,243 1,243 1,243 Remeasurement of defined benefit liability (3) 2,572 2,572 2,572
(2,597) 811 (1,786) 2,572 786 (128) 658 Comprehensive (loss) income for the period (2,597) 811 (1,786) 35,962 34,176 994 35,170
Balance as of June 30, 2021 59,043,687 355,262 25,118 (21,386) (2,286) (23,672) (33,744) 322,964 13,020 335,984
(1) Presented net of deferred income tax expense of $264. (2) Presented net of deferred income tax expense of $1,589. (3) Presented net of deferred income tax expense of $806.
The accompanying notes are an integral part of the interim condensed consolidated financial statements.
5

Intertape Polymer Group Inc.Consolidated Cash FlowsPeriods ended June 30, (In thousands of US dollars)(Unaudited)
OPERATING ACTIVITIESNet earnings 14,723 14,581 34,512 28,895 Adjustments to net earnings
Depreciation and amortization 15,867 16,127 32,176 31,441 Income tax expense 5,555 4,292 11,815 7,528 Interest expense 10,070 7,513 15,438 15,311 Early redemption premium and other costs (Note 7) 14,412 — 14,412 — Impairment of inventories 179 558 1,143 884 Share-based compensation expense (benefit) 5,756 3,720 16,893 (232) (Gain) loss on foreign exchange (2,412) 760 (2,924) (908) Pension and other post-retirement expense related to defined benefit plans 471 438 996 979 Contingent consideration liability fair value adjustments (Note 9) — (11,005) — (11,005) Other adjustments for non-cash items (53) (391) (233) 1,334 Income taxes paid, net (11,498) (3,285) (18,801) (7,518) Contributions to defined benefit plans (284) (377) (497) (736)
Cash flows from operating activities before changes in working capital items 52,786 32,931 104,930 65,973
Changes in working capital itemsTrade receivables (20,343) 3,232 (28,904) (2,807) Inventories (26,543) 1,766 (56,137) (10,367) Other current assets (3,170) (2,123) (3,671) (2,551) Accounts payable and accrued liabilities 21,170 1,930 (7,478) (29,207) Share-based compensation settlements — — (13,205) — Provisions (1,710) 2,774 (2,244) 2,419
(30,596) 7,579 (111,639) (42,513) Cash flows from operating activities 22,190 40,510 (6,709) 23,460
INVESTING ACTIVITIESAcquisition of subsidiary, net of cash acquired — — — (35,704) Purchases of property, plant and equipment (15,762) (5,252) (25,107) (12,701) Purchases of intangible assets (592) (160) (3,425) (383) Other investing activities 55 44 101 424 Cash flows from investing activities (16,299) (5,368) (28,431) (48,364)
Three months ended
June 30,Six months ended
June 30, 2021 2020 2021 2020 $ $ $ $
6

FINANCING ACTIVITIESProceeds from borrowings 517,602 29,619 665,366 189,535 Repayment of borrowings (471,457) (49,937) (572,236) (123,700) Payments of debt issuance costs (7,294) — (7,294) — Payments of early redemption premium and other costs (Note 7) (14,444) — (14,444) — Interest paid (13,447) (11,981) (15,308) (14,972) Proceeds from exercise of stock options 294 — 294 — Dividends paid (9,214) (8,651) (18,451) (17,458) Other financing activities 371 — 1,001 — Cash flows from financing activities 2,411 (40,950) 38,928 33,405
Net increase (decrease) in cash 8,302 (5,808) 3,788 8,501 Effect of foreign exchange differences on cash (4,007) 752 (5,009) (1,165) Cash, beginning of period 10,951 19,439 16,467 7,047 Cash, end of period 15,246 14,383 15,246 14,383
Three months ended
June 30,Six months ended
June 30, 2021 2020 2021 2020 $ $ $ $
The accompanying notes are an integral part of the interim condensed consolidated financial statements.
7

Intertape Polymer Group Inc.Consolidated Balance SheetsAs of(In thousands of US dollars)
June 30, 2021
December 31, 2020
(Unaudited) (Audited) $ $
ASSETSCurrent assets
Cash 15,246 16,467 Trade receivables 194,037 162,235 Inventories 250,394 194,516 Other current assets 35,093 21,048
494,770 394,266 Property, plant and equipment 419,829 415,214 Goodwill 132,863 132,894 Intangible assets 122,510 124,274 Deferred tax assets 25,864 29,677 Other assets 15,402 13,310
Total assets 1,211,238 1,109,635
LIABILITIESCurrent liabilities
Accounts payable and accrued liabilities 172,258 180,446 Share-based compensation liabilities, current (Note 8) 19,347 17,769 Provisions, current 1,869 4,222 Borrowings and lease liabilities, current (Note 7) 14,847 26,219
208,321 228,656 Borrowings and lease liabilities, non-current (Note 7) 565,575 463,745 Pension, post-retirement and other long-term employee benefits 17,080 19,826 Share-based compensation liabilities, non-current (Note 8) 15,611 13,664 Non-controlling interest put options (Note 9) 15,520 15,758 Deferred tax liabilities 34,712 34,108 Provisions, non-current 2,597 2,430 Other liabilities 15,838 14,766
Total liabilities 875,254 792,953
EQUITYCapital stock (Note 8) 355,262 354,880 Contributed surplus 25,118 22,776 Deficit (33,744) (51,114) Accumulated other comprehensive loss (23,672) (21,886) Total equity attributable to Company shareholders 322,964 304,656 Non-controlling interests 13,020 12,026
Total equity 335,984 316,682 Total liabilities and equity 1,211,238 1,109,635
The accompanying notes are an integral part of the interim condensed consolidated financial statements.
8

Intertape Polymer Group Inc.Notes to Unaudited Interim Condensed Consolidated Financial StatementsJune 30, 2021 (In US dollars, tabular amounts in thousands, except per share data and as otherwise noted)(Unaudited)
1 - GENERAL BUSINESS DESCRIPTION
Intertape Polymer Group Inc. (the “Parent Company”), incorporated under the Canada Business Corporations Act, has its principal administrative offices in Montreal, Québec, Canada and in Sarasota, Florida, U.S.A. The address of the Parent Company’s registered office is 800 Place Victoria, Suite 3700, Montreal, Québec H4Z 1E9, c/o Fasken Martineau DuMoulin LLP. The Parent Company’s common shares are listed on the Toronto Stock Exchange (“TSX”) in Canada.
The Parent Company and its subsidiaries (together referred to as the “Company”) develop, manufacture and sell a variety of paper-and-film based pressure sensitive and water-activated tapes, stretch and shrink films, protective packaging, woven and non-woven products and packaging machinery for industrial and retail use.
Intertape Polymer Group Inc. is the Company’s ultimate parent.
2 - ACCOUNTING POLICIES
Basis of Presentation and Statement of Compliance
The unaudited interim condensed consolidated financial statements (“financial statements”) present the Company’s consolidated balance sheets as of June 30, 2021 and December 31, 2020, as well as its consolidated earnings, comprehensive income, and cash flows for the three and six months ended June 30, 2021 and 2020 and the changes in equity for the six months ended June 30, 2021 and 2020.
These financial statements have been prepared in accordance with International Accounting Standard (“IAS”) 34 – Interim Financial Reporting and are expressed in United States (“US”) dollars. Accordingly, certain information and footnote disclosures normally included in annual audited consolidated financial statements prepared in accordance with International Financial Reporting Standards (“IFRS”), as issued by the International Accounting Standards Board (“IASB”), have been omitted or condensed. These financial statements use the same accounting policies, except for the adoption of the new standards described below, and use the same methods of computation as compared with the Company’s most recent annual audited consolidated financial statements, except for the estimate of the provision for income taxes, which is determined in these financial statements using the estimated weighted average annual effective income tax rate applied to the earnings before income tax expense of the interim period, which may have to be adjusted in a subsequent interim period of the financial year if the estimate of the annual income tax rate changes.
These financial statements reflect all adjustments which are, in the opinion of management, necessary to present a fair statement of the results for these interim periods. These adjustments are of a normal recurring nature.
These financial statements were authorized for issuance by the Company’s Board of Directors on August 10, 2021.
Critical Accounting Judgments, Estimates and Assumptions
The preparation of these financial statements requires management to make judgments, estimates and assumptions that affect the application of accounting policies and the reported amounts of assets, liabilities, income and expenses. Significant changes in the underlying assumptions could result in significant changes to these estimates. Consequently, management reviews these estimates on a regular basis. Revisions to accounting estimates are recognized in the period in which the estimates are revised and in any future periods affected. The judgments, estimates and assumptions applied in these financial statements were the same as those applied in the Company’s most recent annual audited consolidated financial statements other than (as noted above) the accounting policies and methods of computation for the estimate of the provision for income taxes.
The Company is closely monitoring the impacts of the coronavirus ("COVID-19") pandemic as a trigger for changes in critical accounting judgments, estimates and assumptions. Given the dynamic nature of the pandemic (including its duration and the severity of its impact on the global economy and the applicable governmental responses), the extent to which the COVID-19 pandemic impacts the Company’s future results will depend on unknown future developments and any further impact on the
9

global economy and the markets in which the Company operates and sells its products, all of which remain highly uncertain and cannot be accurately predicted at this time.
New Standards Adopted as of January 1, 2021
In the current period, the Company has applied a number of amendments to IFRS Standards and Interpretations issued by the IASB that are effective for an annual period that begins on or after January 1, 2021. Their adoption has not had any material impact on the disclosures or on the amounts reported in these financial statements.
New Standards and Interpretations Issued but Not Yet Effective
Certain new standards, amendments and interpretations, and improvements to existing standards have been published by the IASB but are not yet effective and have not been adopted early by the Company. Management anticipates that all the relevant pronouncements will be adopted in the first reporting period following the date of application. Information on new standards, amendments and interpretations, and improvements to existing standards, which could potentially impact the Company’s financial statements, are detailed as follows:
On January 23, 2020, the IASB published Classification of Liabilities as Current or Non-current (Amendments to IAS 1), which includes narrow-scope amendments to IAS 1 Presentation of Financial Statements. The objective of the amendments is to clarify how to classify debt and other liabilities as current or non-current depending on the rights that exist at the end of the reporting period. The amendments include clarifying the classification requirements for debt a company might settle by converting it into equity. The amendments are effective on January 1, 2023 and will be applied retrospectively. Management is currently assessing, but has not yet determined, the impact on the Company’s financial statements.
On May 14, 2020, the IASB published Property, Plant and Equipment: Proceeds Before Intended Use (Amendments to IAS 16), which prohibits deducting amounts received from selling items produced while preparing the asset for its intended use from the cost of property, plant and equipment. Instead, such sales proceeds and related costs will be recognized in earnings. The amendments are effective on January 1, 2022. Management is currently assessing, but has not yet determined, the impact on the Company’s financial statements.
On May 7, 2021, the IASB published Deferred Tax Related to Assets and Liabilities Arising From a Single Transaction (Amendments to IAS 12), which clarifies that the initial recognition exemption does not apply to transactions in which both deductible and taxable temporary differences will result in the recognition of equal deferred tax assets and liabilities, and that the Company is required to recognize deferred tax on such transactions. The amendments are effective on January 1, 2023. Management is currently assessing, but has not yet determined, the impact on the Company’s financial statements.
Certain other new standards and interpretations have been issued but are not expected to have a material impact on the Company’s financial statements.
10

3 - INFORMATION INCLUDED IN CONSOLIDATED EARNINGS
The following table describes the charges incurred by the Company which are included in the Company’s consolidated earnings:
Three months ended
June 30,Six months ended
June 30, 2021 2020 2021 2020 $ $ $ $Employee benefit expense
Wages, salaries and other short-term benefits 69,095 59,608 136,346 119,254 Share-based compensation expense (benefit) (Note 8) 5,756 3,720 16,893 (232) Pension, post-retirement and other long-term employee benefit plans:
Defined benefit plans 471 468 996 1,009 Defined contribution plans 1,847 1,898 4,627 2,215
77,169 65,694 158,862 122,246
Finance costs (income) - InterestInterest on borrowings and lease liabilities (1) 6,388 7,400 11,776 14,906 Amortization and write-off of debt issuance costs on borrowings 3,995 293 4,299 593 Interest capitalized to property, plant and equipment (313) (180) (637) (188)
10,070 7,513 15,438 15,311
Finance costs (income) - Other finance expense (income), net
Early redemption premium and other costs (Note 7) 14,412 — 14.412 — Foreign exchange (gain) loss (2,412) 760 (2,924) (908) Change in fair value of contingent considerationliability (Note 9) — (11,005) — (11,005) Other costs, net (49) 655 1,805 1,191
11,951 (9,590) 13,293 (10,722)
Additional informationDepreciation of property, plant and equipment 12,673 12,619 25,565 25,001 Amortization of intangible assets 3,194 3,508 6,611 6,440 Impairment of assets, net 471 749 1,523 1,561
(1) Presented net of $0.1 million and $1.0 million in interest reimbursements as a result of interest subsidy programs for the three and six months ended June 30, 2021, respectively (nil for the three and six months ended June 30, 2020).
4 - INCOME TAXES
The calculation of the Company’s effective tax rate is as follows:
Three months endedJune 30,
Six months endedJune 30,
2021 2020 2021 2020Income tax expense $ 5,555 $ 4,292 $ 11,815 $ 7,528 Earnings before income tax expense $ 20,278 $ 18,873 $ 46,327 $ 36,423 Effective tax rate 27.4 % 22.7 % 25.5 % 20.7 %
11

The increase in the effective tax rate in the three months ended June 30, 2021 as compared to the same period in 2020 was primarily due to the net unfavourable impacts related to the redemption of the 2018 Senior Unsecured Notes and the timing of tax credit recognition.
The increase in the effective tax rate in the six months ended June 30, 2021 as compared to the same period in 2020 was primarily due to the net unfavourable impacts related to the redemption of the 2018 Senior Unsecured Notes and Canadian deferred tax assets not recorded.
5 - EARNINGS PER SHARE
The weighted average number of common shares outstanding is as follows:
Three months ended
June 30,Six months ended
June 30, 2021 2020 2021 2020Basic 59,027,230 59,009,685 59,027,139 59,009,685 Effect of stock options 1,491,914 457,651 1,420,809 261,233 Diluted 60,519,144 59,467,336 60,447,948 59,270,918
Stock options that were anti-dilutive and excluded from the calculation of weighted average diluted common shares were as follows:
Three months ended
June 30,Six months ended
June 30, 2021 2020 2021 2020Anti-dilutive stock options 243,152 773,401 243,152 613,401
6 - COMMITMENTS
The following table summarizes information related to commitments to purchase machinery and equipment:
June 30, 2021
December 31, 2020
Commitments to purchase machinery and equipment $ 26,688 $ 17,000
12

7 - BORROWINGS
Borrowings are comprised of the following:
June 30, 2021
December 31, 2020
$ $2021 Senior Unsecured Notes (a) 395,178 — 2018 Senior Unsecured Notes (a) — 246,236 2021 Credit Facility (b) 128,498 — 2018 Credit Facility (b) — 185,162 2018 Powerband Credit Facility 1,601 629 2018 Capstone Credit Facility 10,125 10,505 Partially forgivable government loans 5,194 5,265 Lease liabilities 39,793 42,122 Term and other loans 33 45 Total borrowings 580,422 489,964 Less: borrowings and lease liabilities, current 14,847 26,219 Total borrowings and lease liabilities, non-current 565,575 463,745
The aggregate principal amounts of the related borrowings and lease liabilities in the table above are presented net of debt issuance costs of $9.1 million and $5.1 million as of June 30, 2021 and December 31, 2020, respectively, and imputed interest of $0.2 million and $0.3 million as of June 30, 2021 and December 31, 2020, respectively, netting to $8.9 million and $4.8 million as of June 30, 2021 and December 31, 2020, respectively.
(a) 2021 Senior Unsecured Notes
On June 8, 2021, the Company completed the private placement of $400 million aggregate principal amount of senior unsecured notes due June 15, 2029 ("2021 Senior Unsecured Notes") with certain guarantors and Regions Bank, as Trustee. The Company incurred debt issuance costs of $5.0 million which were capitalized and are being amortized using the straight-line method over the eight-year term. The 2021 Senior Unsecured Notes bear interest at a rate of 4.375% per annum, payable semi-annually, in cash, in arrears on June 15 and December 15 of each year, beginning on December 15, 2021.
The Company used the net proceeds from the 2021 Senior Unsecured Notes to redeem its previously outstanding $250 million 7.00% Senior Unsecured Notes which were scheduled to mature on October 15, 2026 (the “2018 Senior Unsecured Notes”), to repay a portion of the borrowings outstanding under its 2018 Credit Facility (defined below) and to pay related fees and expenses, as well as for general corporate purposes. In connection with the redemption of its 2018 Senior Unsecured Notes, the Company wrote-off debt issuance costs of $3.6 million, which are recorded as interest under the caption finance costs (income) in earnings, and recognized an early redemption premium and other costs of $14.4 million recorded as other finance expense (income), net under the caption finance costs (income) in earnings.
As of June 30, 2021, the 2021 Senior Unsecured Notes outstanding balance amounted to $400.0 million ($395.2 million, net of $4.8 million in unamortized debt issuance costs).
On or after June 15, 2024, the Company may redeem the 2021 Senior Unsecured Notes at its option, in whole or in part, on certain redemption dates and at certain redemption prices specified in the indenture, plus any accrued and unpaid interest. In addition, prior to June 15, 2024, the Company may redeem the 2021 Senior Unsecured Notes at its option, in whole or in part, from time to time, at a redemption price equal to 100% of the principal amount of the notes redeemed, plus an applicable premium specified in the indenture, plus any accrued and unpaid interest. If the Company experiences a change of control, it may be required to offer to repurchase the 2021 Senior Unsecured Notes at a purchase price equal to 101% of their aggregate principal amount plus any accrued and unpaid interest up to, but excluding, the date of such repurchase.
The 2021 Senior Unsecured Notes indenture contains usual and customary incurrence based covenants that are generally less restrictive than covenants under the 2021 Credit Facility (defined below) and, among other things, limit the Company's ability to incur additional debt; pay dividends, redeem stock or make other distributions; enter into certain types of transactions with affiliates; incur liens on assets; make certain restricted payments and investments; engage in certain asset sales, including sale
13

and leaseback transactions; agree to certain restrictions on the ability of restricted subsidiaries to make payments to the Company; and merge, consolidate, transfer or dispose of substantially all assets. Certain of these covenants will be suspended if the 2021 Senior Unsecured Notes are assigned an investment grade rating by Standard & Poor's Rating Services and Moody's Investors Services, Inc. None of these covenants are considered restrictive to the Company’s operations and, as of June 30, 2021, the Company was in compliance with all of these debt covenants. The 2021 Senior Unsecured Notes are guaranteed by all direct and indirect subsidiaries of the Parent Company that are borrowers or guarantors under the 2021 Credit Facility (defined below). Under the terms of the indenture, any direct or indirect subsidiaries that in the future become borrowers or guarantors under the 2021 Credit Facility (defined below) shall also be guarantors of the 2021 Senior Unsecured Notes.
(b) 2021 Credit Facility
On June 14, 2021, the Company entered into a new five-year, $600 million credit facility (“2021 Credit Facility”) with a syndicated lending group, amending and extending the Company's previous $600 million credit facility that was due to mature in June 2023 ("2018 Credit Facility").
The 2018 Credit Facility's outstanding balance of $112.8 million was transferred to the 2021 Credit Facility. Unamortized debt issuance costs of $1.1 million for the 2018 Credit Facility are now being amortized using the straight-line method over the five-year term of the 2021 Credit Facility. In securing the 2021 Credit Facility, the Company incurred additional debt issuance costs amounting to $3.2 million, which were capitalized and are also being amortized using the straight-line method over the five-year term.
The 2021 Credit Facility consists of a $600.0 million revolving credit facility, as well as an incremental accordion feature of $300.0 million, which would enable the Company to increase the limit of this facility (subject to the credit agreement's terms and lender approval) to $900.0 million, if needed.
The 2021 Credit Facility matures on June 12, 2026 and bears an interest rate based, at the Company’s option, on the London Inter-bank Offered Rate (or applicable replacement rate), the Federal Funds Rate, or Bank of America’s prime rate, plus a spread varying between 10 and 235 basis points (110 basis points as of June 30, 2021) depending on the debt instrument's benchmark interest rate and the consolidated secured net leverage ratio.
As of June 30, 2021, the 2021 Credit Facility's outstanding principal balance amounted to $132.8 million ($128.5 million, net of $4.3 million in unamortized debt issuance costs). Including $1.7 million in standby letters of credit, total utilization under the 2021 Credit Facility amounted to $134.5 million. Accordingly, the Company’s unused availability as of June 30, 2021 amounted to $465.5 million.
The 2021 Credit Facility has two financial covenants, a consolidated secured net leverage ratio not to be more than 4.00 to 1.00, with an allowable temporary increase to 4.50 to 1.00 for the quarter in which the Company consummates an acquisition with a price not less than $50 million and the following three quarters, and a consolidated interest coverage ratio not to be less than 2.25 to 1.00. The Company was in compliance with the consolidated secured net leverage ratio and consolidated interest coverage ratio, which were 0.67 and 9.89 respectively, as of June 30, 2021. In addition, the 2021 Credit Facility has certain non-financial covenants, such as covenants regarding indebtedness, investments, and asset dispositions. The Company was in compliance with all covenants as of June 30, 2021.
The 2021 Credit Facility is secured by a first priority lien on all personal property of the Company and all current and future material subsidiaries who are borrowers or guarantors under the facility.
14
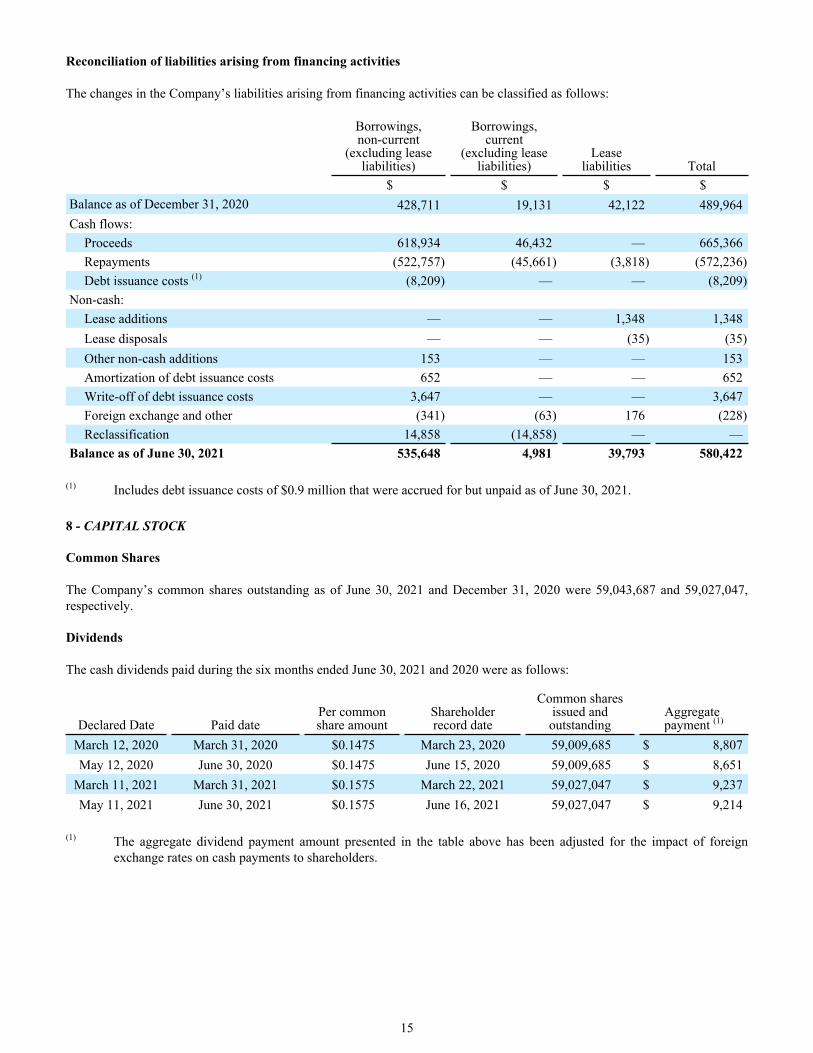
Reconciliation of liabilities arising from financing activities
The changes in the Company’s liabilities arising from financing activities can be classified as follows:
Borrowings, non-current
(excluding lease liabilities)
Borrowings, current
(excluding lease liabilities)
Lease liabilities Total
$ $ $ $Balance as of December 31, 2020 428,711 19,131 42,122 489,964 Cash flows:
Proceeds 618,934 46,432 — 665,366 Repayments (522,757) (45,661) (3,818) (572,236) Debt issuance costs (1) (8,209) — — (8,209)
Non-cash:Lease additions — — 1,348 1,348 Lease disposals — — (35) (35) Other non-cash additions 153 — — 153 Amortization of debt issuance costs 652 — — 652 Write-off of debt issuance costs 3,647 — — 3,647 Foreign exchange and other (341) (63) 176 (228) Reclassification 14,858 (14,858) — —
Balance as of June 30, 2021 535,648 4,981 39,793 580,422
(1) Includes debt issuance costs of $0.9 million that were accrued for but unpaid as of June 30, 2021.
8 - CAPITAL STOCK
Common Shares
The Company’s common shares outstanding as of June 30, 2021 and December 31, 2020 were 59,043,687 and 59,027,047, respectively.
Dividends
The cash dividends paid during the six months ended June 30, 2021 and 2020 were as follows:
Declared Date Paid datePer commonshare amount
Shareholderrecord date
Common sharesissued andoutstanding
Aggregate payment (1)
March 12, 2020 March 31, 2020 $0.1475 March 23, 2020 59,009,685 $ 8,807 May 12, 2020 June 30, 2020 $0.1475 June 15, 2020 59,009,685 $ 8,651
March 11, 2021 March 31, 2021 $0.1575 March 22, 2021 59,027,047 $ 9,237 May 11, 2021 June 30, 2021 $0.1575 June 16, 2021 59,027,047 $ 9,214
(1) The aggregate dividend payment amount presented in the table above has been adjusted for the impact of foreign exchange rates on cash payments to shareholders.
15

Share Repurchases
The Company’s current normal course issuer bid (“NCIB”) was renewed on July 23, 2021 and ends on July 22, 2022. The previous NCIB was in effect from July 23, 2020 through July 22, 2021. The NCIB allows the Company the ability to repurchase for cancellation up to 4,000,000 common shares of the Company at prevailing market prices.
There were no shares repurchased during the three and six months ended June 30, 2021 and 2020. As of June 30, 2021 and 2020, there were 4,000,000 common shares available for repurchase under the NCIB.
There were no shares repurchased under the current NCIB as of August 10, 2021.
Stock Options
The following tables summarize information related to stock options (in Canadian dollars ("CDN") where indicated):
Three months ended
June 30,Six months ended
June 30, 2021 2020 2021 2020Stock options granted — — 243,152 1,533,183 Weighted average exercise price per stock option granted — — CDN$29.34 CDN$7.94Stock options exercised 16,640 — 16,640 — Weighted average exercise price per stock option exercised CDN$21.76 — CDN$21.76 — Stock options cancelled/forfeited — 40,000 — 77,500 Weighted average exercise price per stock option cancelled/forfeited — CDN$12.14 — CDN$12.34
June 30, 2021Stock options outstanding 2,675,734 Weighted average exercise price per stock option outstanding CDN$12.83
The weighted average fair value of stock options granted was estimated using the Black-Scholes option pricing model, taking into account the following weighted average assumptions:
Six months endedJune 30,
2021 2020Expected life 5.5 years 5.5 yearsExpected volatility (1) 27.63% 34.18%Risk-free interest rate 1.09% 0.75%Expected dividends 3.07% 10.79%Stock price at grant date CDN$29.34 CDN$7.94Exercise price of awards CDN$29.34 CDN$7.94Foreign exchange rate USD to CDN 1.2482 1.4526
(1) Expected volatility was calculated by applying a weighted average of the daily closing price change on the TSX for a term commensurate with the expected life of each grant.
16
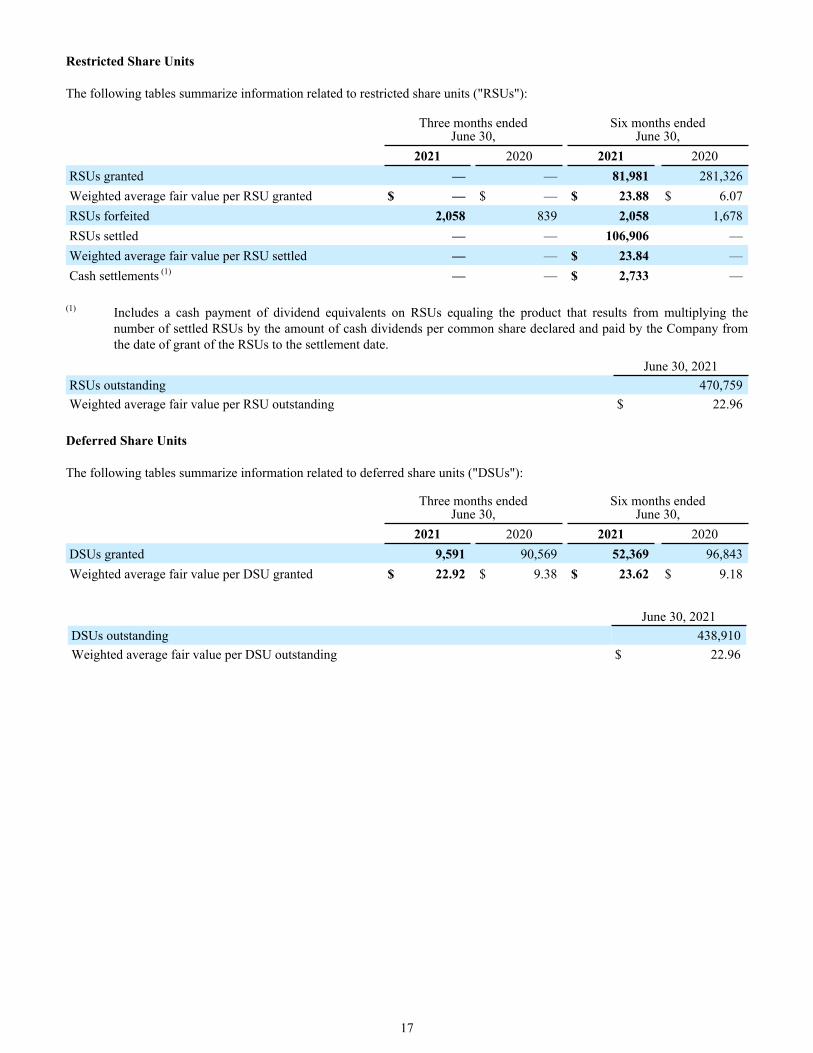
Restricted Share Units
The following tables summarize information related to restricted share units ("RSUs"):
Three months endedJune 30,
Six months endedJune 30,
2021 2020 2021 2020RSUs granted — — 81,981 281,326 Weighted average fair value per RSU granted $ — $ — $ 23.88 $ 6.07 RSUs forfeited 2,058 839 2,058 1,678 RSUs settled — — 106,906 — Weighted average fair value per RSU settled — — $ 23.84 — Cash settlements (1) — — $ 2,733 —
(1) Includes a cash payment of dividend equivalents on RSUs equaling the product that results from multiplying the number of settled RSUs by the amount of cash dividends per common share declared and paid by the Company from the date of grant of the RSUs to the settlement date.
June 30, 2021RSUs outstanding 470,759 Weighted average fair value per RSU outstanding $ 22.96
Deferred Share Units
The following tables summarize information related to deferred share units ("DSUs"):
Three months endedJune 30,
Six months endedJune 30,
2021 2020 2021 2020DSUs granted 9,591 90,569 52,369 96,843 Weighted average fair value per DSU granted $ 22.92 $ 9.38 $ 23.62 $ 9.18
June 30, 2021DSUs outstanding 438,910 Weighted average fair value per DSU outstanding $ 22.96
17

Performance Share Units
The following table summarizes information about performance share units ("PSUs"):Three months ended
June 30,Six months ended
June 30, 2021 2020 2021 2020
PSUs granted — — 200,982 694,777 Weighted average fair value per PSU granted $ — $ — $ 29.02 $ 5.59 PSUs forfeited 6,174 2,516 6,174 5,032 PSUs added (cancelled) by performance factor (1) — — 143,512 (346,887) PSUs settled (1) — — 409,670 — Weighted average fair value per PSU settled — — $ 23.84 — Cash settlements (2) — — $ 10,472 —
(1) The following table provides further information regarding the PSUs settled and adjusted by performance factor included in the table above. The number of "Target Shares" reflects 100% of the PSUs granted and the number of PSUs settled reflects the performance adjustments to the Target Shares.
Grant Date Date Settled Target Shares Performance PSUs settledMarch 20, 2017 March 20, 2020 346,887 — % — March 21, 2018 March 23, 2021 266,158 153.9 % 409,670
(2) Includes a cash payment of dividend equivalents on PSUs equaling the product that results from multiplying the number of settled PSUs by the amount of cash dividends per common share declared and paid by the Company from the date of grant of the PSUs to the settlement date.
Grant details for PSUs granted subsequent to December 31, 2019:
The number of PSUs granted subsequent to December 31, 2019 which will be eligible to vest can range from 0% to 175% of the Target Shares as determined by multiplying the number of PSUs awarded by the adjustment factors as follows:
• 25% based on the Company's total shareholder return ("TSR") ranking relative to the S&P North America SmallCap Materials (Industry Group) Index (the "Index Group") over the measurement period as set out in the table below;
• 25% based on the Company's TSR ranking relative to a specified peer group of companies ("Peer Group") over the measurement period as set out in the table below; and
• 50% based on the Company's average return on invested capital over the measurement period as compared to internally developed thresholds (the “ROIC Performance”) as set out in the table below.
Grant details for PSUs granted subsequent to December 31, 2017 and prior to December 31, 2019:
The number of PSUs granted subsequent to December 31, 2017 and prior to December 31, 2019 which will be eligible to vest can range from 0% to 175% of the Target Shares as determined by multiplying the number of PSUs awarded by the adjustment factors as follows:
• 50% based on the Company's TSR ranking relative to the Peer Group over the measurement period as set out in the table below; and
• 50% based on the Company's ROIC Performance as set out in the table below.
18

The relative TSR performance adjustment factor is determined as follows:
TSR Ranking Relative to the Index Group/Peer Group Percent of Target Shares Vested90th percentile or higher 200 %75th percentile 150 %50th percentile 100 %25th percentile 50 %Less than the 25th percentile 0 %
The ROIC Performance adjustment factor is determined as follows:
ROIC Performance Percent of Target Shares Vested1st Tier 0 %2nd Tier 50 %3rd Tier 100 %4th Tier 150 %
The TSR performance and ROIC Performance adjustment factors between the numbers set out in the two tables above are interpolated on a straight-line basis.
The performance period is the period from January 1st in the year of grant through December 31st of the third calendar year following the date of grant. The PSUs are expensed over the vesting period beginning from the date of grant through February 15th of the fourth calendar year following the date of grant.
The weighted average fair value of PSUs granted was based 50% on the five-day volume weighted average price ("VWAP") of the Company's shares on the TSX for the five trading days immediately preceding the grant date and 50% based on a Monte Carlo simulation model implemented in a risk-neutral framework considering the assumptions presented in the following table:
Six months endedJune 30,
2021 20205 day VWAP at grant date CDN$ 29.78 CDN$ 8.63Monte Carlo simulation model assumptions:
Expected life 3 years 3 yearsExpected volatility(1) 45 % 36 %US risk-free interest rate 0.28 % 0.30 %Canadian risk-free interest rate 0.46 % 0.59 %Expected dividends(2) CDN$ 0.00 CDN$ 0.00Performance period starting price(3) CDN$ 24.20 CDN$ 16.25Closing stock price on TSX as of the estimation date CDN$ 29.27 CDN$ 7.24
(1) Expected volatility was calculated based on the daily dividend adjusted closing price change on the TSX for a term
commensurate with the expected life of the grant.(2) A participant receives a cash payment from the Company upon PSU settlement that is equivalent to the number of
settled PSUs multiplied by the amount of cash dividends per share declared by the Company between the date of grant and the settlement date. As such, there is no impact from expected future dividends in the Monte Carlo simulation model.
(3) The performance period starting price is measured as the volume weighted average price for the common shares of the Company on the TSX on the grant date.
The following table summarizes information about PSUs outstanding as of:June 30, 2021
PSUs outstanding 1,153,068 Weighted average fair value per PSU outstanding $ 34.99
19

Based on the Company’s current performance adjustment factors, the number of PSUs earned if all of the outstanding PSUs were to be settled at June 30, 2021 would be as follows:
Grant Date PerformanceMarch 21, 2019 159.4 %March 23, 2020 167.7 %March 22, 2021 125.1 %
Summary of Share-based Compensation Expense (Benefit) and Share-based Compensation Liabilities
The following table summarizes share-based compensation expense (benefit) recorded in earnings in selling, general and administrative expense:
Three months endedJune 30,
Six months endedJune 30,
2021 2020 2021 2020$ $ $ $
Stock options 285 219 454 386 PSUs 4,304 1,587 11,946 (552) RSUs 968 646 2,908 82 DSUs 199 1,268 1,585 (148)
5,756 3,720 16,893 (232)
The following table summarizes share-based compensation liabilities recorded in the consolidated balance sheets as of:
June 30,
2021December 31,
2020$ $
Share-based compensation liabilities, currentPSUs(1) 8,044 8,446RSUs(1) 2,120 1,969DSUs(1) 9,183 7,354Total share-based compensation liabilities, current 19,347 17,769
Share-based compensation liabilities, non-currentPSUs(1) 12,471 10,743RSUs(1) 3,140 2,921Total share-based compensation liabilities, non-current 15,611 13,664
(1) Includes dividend equivalents accrued.
20

9 - FINANCIAL INSTRUMENTS
Classification and Fair Value of Financial Instruments
The carrying amounts of the following financial assets and liabilities are considered a reasonable approximation of fair value given their short maturity periods:
• cash• trade receivables• supplier rebates and other receivables (excluding interest subsidies receivable)• accounts payable and accrued liabilities (excluding employee benefits and taxes payable)
Borrowings (Excluding Lease Liabilities)
In June 2021, the Company redeemed its 2018 Senior Unsecured Notes and issued its 2021 Senior Unsecured Notes (refer to Note 7 for more information on borrowings). The fair value of both the 2021 Senior Unsecured Notes and 2018 Senior Unsecured Notes is based on the trading levels and bid/offer prices observed by a market participant.
As of June 30, 2021, the 2021 Senior Unsecured Notes had a carrying value, including unamortized debt issuance costs, of $395.2 million, and a fair value of $405.7 million. As of December 31, 2020, the 2018 Senior Unsecured Notes had a carrying value, including unamortized debt issuance costs, of $246.2 million, and a fair value of $265.4 million.
The Company's borrowings, other than its 2021 Senior Unsecured Notes and 2018 Senior Unsecured Notes, consist primarily of variable rate debt. The corresponding fair values are estimated using observable market interest rates of similar variable rate loans with similar risk and credit standing. Accordingly, the carrying amounts are considered to be a reasonable approximation of the fair values.
As of June 30, 2021 and December 31, 2020, the Company categorizes its borrowings as Level 2 on the three-level fair value hierarchy.
Interest Rate Swap Agreements
The Company measures the fair value of its interest rate swap agreements using discounted cash flows. Future cash flows are estimated based on forward interest rates (from observable yield curves at the end of a reporting period) and contract interest rates, discounted at a rate that reflects the credit risk of various counterparties.
As of June 30, 2021 and December 31, 2020, the Company categorizes its interest rate swaps as Level 2 on the three-level fair value hierarchy, meaning that the fair value is estimated using a valuation technique based on observable market data, either directly or indirectly.
Non-Controlling Interest Put Options
In connection with the acquisition of Airtrax Polymers Private Limited on May 11, 2018, the Company, through its partially-owned subsidiary, Capstone Polyweave Private Limited ("Capstone"), is party to a shareholders’ agreement that contains put options, which provide each of the non-controlling interest shareholders of Capstone with the right to require the Company to purchase their retained interest at a variable purchase price following a five-year lock-in period following the date of acquisition. The agreed-upon purchase price is equal to the fair market valuation as determined through a future negotiation or, as needed, a valuation to be performed by an independent and qualified expert at the time of exercise. During the six months ended June 30, 2021 and 2020, the non-controlling interest put options obligation was remeasured due to changes in exchange rates resulting in a $0.2 million and $0.8 million reduction, respectively, in the liability and a corresponding gain recorded in finance costs (income) in other finance expense (income), net. As of June 30, 2021 and December 31, 2020, the amount recorded on the consolidated balance sheet for this obligation is $15.5 million and $15.8 million, respectively.
The Company categorizes its non-controlling interest put options as Level 3 of the fair value hierarchy, meaning that the fair value is estimated using a valuation technique based on unobservable market data. Details of inputs used in this valuation technique are discussed in the Company's audited consolidated financial statements and notes thereto as of December 31, 2020.
21

A reconciliation of the carrying amount of the Company's non-controlling interest put options classified within Level 3 follows for the period ended June 30, 2021:
Non-controlling interest put options
$
Balance as of December 31, 2020 15,758 Net foreign exchange differences (238) Balance as of June 30, 2021 15,520
Contingent Consideration
In connection with the acquisition of Nortech Packaging LLC and Custom Assembly Solutions, Inc. (together "Nortech") on February 11, 2020 ("Nortech Acquisition"), the Company may be required to pay additional consideration to the former owners of Nortech contingent upon the achievement of certain designated financial metrics following a measurement period as specified in the asset purchase agreement.
The Company categorizes this contingent consideration as Level 3 of the fair value hierarchy, meaning that the fair value is estimated using a valuation technique based on unobservable market data. The Company measures the fair value of its contingent consideration by estimating the present value of probable future net cash outflows from the settlement of the earn-out related provisions contained within the asset purchase agreement. These provisions require the Company to pay up to $12.0 million to the former owners of Nortech should the acquired assets generate an excess of certain profit thresholds as defined in the asset purchase agreement, measured over the two-year period following the date of acquisition. Details of inputs used in this valuation technique are discussed in the Company's audited consolidated financial statements and notes thereto as of December 31, 2020.
As of the date of the Nortech Acquisition, management determined it probable that the entire amount of contingent consideration would be paid after the two-year anniversary of the acquisition date, and therefore recorded a $10.8 million financial liability in the opening balance sheet for Nortech, representing the discounted net present value of the $12.0 million potential obligation.
During the second quarter of 2020, however, management concluded that any payment toward this obligation was no longer probable due to the impact of, and macroeconomic events resulting from, COVID-19 and the continued uncertainty surrounding the pandemic. As a result, the Company estimated the fair value of the obligation to be nil and recorded an adjustment to the related liability in the amount of $11.0 million, with an off-setting gain (net of accretion expense) recorded in finance costs (income) in other expense (income), net.
As of June 30, 2021 and December 31, 2020, management continues to believe that any amount of payment toward this obligation is not probable based on its fair value estimations of the undiscounted future net cash flows (as measured according to the asset purchase agreement) to be generated by Nortech and, therefore, the Company estimates the fair value of the obligation to be nil. The fair value of the contingent consideration will continue to be reassessed at each reporting date with any changes to be recognized in earnings in finance costs (income) in other finance expense (income), net.
Interest Rate Swap Agreements
The Company is exposed to a risk of changes in cash flows due to the fluctuations in interest rates on its variable rate borrowings. To minimize the potential long-term cost of floating rate borrowings, the Company entered into interest rate swap agreements.
The Company was party to the following interest rate swap agreements, which are qualifying cash flow hedges designated as hedging instruments, as of June 30, 2021:
Effective Date MaturityNotional Amount
$ SettlementFixed interest rate paid
%June 8, 2017 June 20, 2022 40,000 Monthly 1.7900
August 20, 2018 August 18, 2023 60,000 Monthly 2.0450
22

The following table summarizes activity related to interest rate swap agreements designated as hedging instruments:
Three months ended
June 30,Six months ended
June 30, 2021 2020 2021 2020
$ $ $ $Gain (loss) from change in fair value of the interest rate swap agreements designated as hedging instruments recognized in OCI (1) 444 (49) 1,075 (3,635) Deferred tax (expense) benefit on change in fair value of the interest rate swap agreements designated as hedging instruments recognized in OCI (110) 19 (264) 633
(1) The hedging gain/loss recognized in other comprehensive income ("OCI") before tax is equal to the change in fair value used for measuring effectiveness. There is no ineffectiveness recognized in earnings.
The following table summarizes balances related to interest rate swap agreements designated as hedging instruments as of:
June 30, 2021December 31,
2020$ $
Carrying amount included in other liabilities 2,950 4,025
Cumulative loss in cash flow hedge reserve, included in OCI, for continuing hedges (2,286) (3,097)
Hedge of net investment in foreign operations
A foreign currency exposure arises from the Parent Company's net investment in its USD functional currency subsidiary, IPG (US) Holdings Inc. The risk arises from the fluctuations in the USD and CDN current exchange rate, which causes the amount of the net investment in IPG (US) Holdings Inc. to vary.
In 2018, the Parent Company completed the private placement of its USD denominated 2018 Senior Unsecured Notes which resulted in additional equity investments in IPG (US) Holdings Inc. In June 2021 the Parent Company redeemed its 2018 Senior Unsecured Notes and issued its 2021 Senior Unsecured Notes. In conjunction with the issuance of the 2021 Senior Unsecured Notes, the Parent Company repaid external borrowings held by IPG (US) Holdings Inc., which resulted in an even greater net investment in IPG (US) Holdings Inc., from a hedging perspective. Both the 2018 Senior Unsecured Notes and the 2021 Senior Unsecured Notes (collectively "Senior Unsecured Notes") are used to hedge the Company’s exposure to the USD foreign exchange risk on this investment. Gains or losses on the retranslation of these borrowing are transferred to OCI to offset any gains or losses on translation of the net investment in the subsidiary. The Senior Unsecured Notes are included as a liability in the borrowings line on the consolidated balance sheets. Refer to Note 7 for more information on the Company's 2018 Senior Unsecured Notes and 2021 Senior Unsecured Notes.
There is an economic relationship between the hedged item and the hedging instrument as the net investment creates a translation risk that will match the foreign exchange risk on the USD borrowing designated as the hedging instrument. The Company has established a hedge ratio of 1:1 as the underlying risk of the hedging instrument is identical to the hedge risk component. Hedge ineffectiveness will arise when the amount of the investment in the foreign subsidiary becomes lower than the outstanding amount of the Senior Unsecured Notes. Hedge ineffectiveness is recorded in finance costs (income) in other finance expense (income), net. To assess hedge effectiveness, the Parent Company determines the economic relationship between the hedging instrument and the hedged item by comparing changes in the carrying amount of the Senior Unsecured Notes that is attributable to a change in the current exchange rate, with changes in the investment in the foreign operation that are attributable to a change in the current exchange rate.
23

The changes in value related to the Senior Unsecured Notes designated as a hedging instrument, in the hedge of a net investment, are as follows:
Three months ended
June 30,Six months ended
June 30, 2021 2020 2021 2020
$ $ $ $(Loss) gain from change in value of the Senior Unsecured Notes used for calculating hedge ineffectiveness (1,184) 8,619 1,466 (11,365) Gain (loss) from Senior Unsecured Notes recognized in OCI 182 8,619 2,832 (11,365) Loss from hedge ineffectiveness recognized in earnings in finance costs (income), in other finance expense (income), net (1,385) — (1,385) — Foreign exchange gains recognized in cumulative translation adjustments in the statement of changes in equity 19 — 19 — Deferred tax (expense) benefit on change in value of the Senior Unsecured Notes recognized in OCI (1,237) — (1,589) 45
The notional and carrying amounts of the Senior Unsecured Notes are as follows:June 30,
2021December 31,
2020$ $
Notional amount 400,000 250,000 Carrying amount 395,178 246,236
The amounts related to the net investment in IPG (US) Holdings, Inc., designated as the hedged item in the hedge of a net investment, are as follows:
Three months ended
June 30,Six months ended
June 30, 2021 2020 2021 2020
$ $(Loss) gain from change in value of IPG (US) Holdings, Inc. used for calculating hedge ineffectiveness (182) (8,619) (2,832) 11,365
The cumulative amounts included in the foreign currency translation reserve related to the net investment in IPG (US) Holdings, Inc., designated as the hedged item in the hedge of a net investment, is as follows:
June 30, 2021
December 31, 2020
$ $Cumulative gain included in foreign currency translation reserve in OCI 10,179 7,347
24

10 - POST REPORTING EVENTS
Non-Adjusting Events
• On August 10, 2021, the Board of Directors amended the Company's quarterly policy to increase the annualized dividend by 7.9% from $0.63 to $0.68 per common share. The Board's decision to increase the dividend was based on the Company's strong financial position and positive outlook. Accordingly, on August 10, 2021, the Company declared a quarterly cash dividend of $0.17 per common share payable on September 30, 2021 to shareholders of record at the close of business on September 16, 2021. The estimated amount of this dividend payment is $10.0 million based on 59,060,327 of the Company’s common shares issued and outstanding as of August 10, 2021.
• On July 30, 2021, the Company completed the acquisition of Nuevopak Global Limited (“Nuevopak”) for $43.8 million in total cash consideration, consisting of $34.7 million paid at closing (net of cash received) and the remaining amount, subject to certain post-closing adjustments and potential contingent consideration, to be paid within three years from the date of closing.
No other significant adjusting or non-adjusting events have occurred between the reporting date of these financial statements and the date of authorization.
25

Scan the QR Code with your mobile device’s QR Reader to be linked directly to our Investor Relations Website.