quarterly report for the period ending 30 june 2019 ... · silver sold oz 58,874 2,705 38,910...
TRANSCRIPT

QUARTERLY REPORT – For the period ending 30 June 2019
HIGHLIGHTS
Evolution Mining Limited Quarterly Report June 2019 1
June 2019 quarter highlights
▪ Gold production of 194,886 ounces at an All-in Sustaining Cost1 (AISC) of A$915 per ounce (US$640/oz)2
▪ Mine operating cash flow of A$215.2 million and net mine cash flow of A$152.2 million
▪ Net cash position increased by A$109.5 million to A$35.2 million
▪ Continued drilling success at Cowal GRE46 and Dalwhinnie with significant intersections including 20m (16m etw) grading 8.36g/t Au and 22m (17.6m etw) grading 5.49g/t Au
▪ Drilling at Mungari’s Boomer prospect 400m west of Frog’s Leg returned significant intercept of 0.9m grading 102.85g/t Au
FY19 summary
Continued delivery from operations
▪ Gold production of 753,001 ounces (Guidance: 720,000 – 770,000oz)
▪ AISC of A$924 per ounce (US$661/oz)2 (Guidance: A$850 – A$900/oz)
▪ All-in Cost (AIC)3 of A$1,215 per ounce (US$869/oz)2
▪ Three highest margin operations beat top end of production guidance: Cowal, Mt Carlton, Ernest Henry
Sector leading cash generation
▪ Mine operating cash flow of A$771.4 million and net mine cash flow of A$497.8 million
▪ Record net mine cash flow from Ernest Henry of A$222.2 million
▪ Total cash acquisitions of A$57.6 million during FY19 including A$41.3 million for 19.9% interest in Tribune
▪ Fully franked cash dividends of A$127.0 million and income tax of A$91.2 million paid in FY19
Sustainable long-life portfolio
▪ Group average reserve life extended to approximately 10 years
▪ Mineral Resources increased by 480,000 ounces to 14.73 million ounces
▪ Ore Reserves increased by 410,000 ounces to 7.46 million ounces
▪ Significant investment in Cowal to extend mine life and increase production to above 300kozpa
FY20 Guidance
▪ Forecast FY20 Group gold production of 725,000 – 775,000 ounces with AISC in the range of A$890 – A$940 per ounce
Consolidated production and sales summary4
Units Sep 2018
qtr Dec 2018
qtr Mar 2019
qtr Jun 2019
qtr FY19 Total
Gold produced oz 200,218 181,996 175,901 194,886 753,001
Silver produced oz 189,553 193,630 141,621 184,693 709,497
Copper produced t 5,866 5,582 4,750 5,648 21,846
C1 Cash Cost A$/oz 594 661 681 579 627
All-in Sustaining Cost A$/oz 885 973 925 915 924
All-in Cost A$/oz 1,121 1,284 1,250 1,213 1,215
Gold sold oz 196,021 188,534 167,598 190,810 742,964
Achieved gold price A$/oz 1,662 1,730 1,798 1,858 1,760
Silver sold oz 190,536 192,484 140,327 180,039 703,386
Achieved silver price A$/oz 20 22 21 22 21
Copper sold t 5,912 5,566 4,627 5,776 21,881
Achieved copper price A$/t 8,378 8,473 9,286 8,350 8,587
1. Includes C1 cash cost, plus royalties, sustaining capital, general corporate and administration expense. Calculated per ounce sold 2. Using the average AUD:USD exchange rate of 0.6999 for the June 2019 quarter and 0.7156 for FY19 3. Includes AISC plus growth (major project) capital and discovery expenditure. Calculated per ounce sold 4. Production relates to payable production
For
per
sona
l use
onl
y

OVERVIEW
Evolution Mining Limited Quarterly Report June 2019 2
Group Total Recordable Injury Frequency (TRIF) at 30 June 2019 was 8.3 (31 March 2019: 7.8). Evolution acknowledges that the Group safety performance has declined from the high standards the Company is committed to. Following a number of recent tragedies in Queensland’s mining industry, Evolution will be conducting safety stops across all its operations this month to refocus the Company’s efforts on improving safety performance.
Group gold production for the June 2019 quarter was 194,886 ounces (Mar qtr: 175,901oz) at an AISC of A$915/oz (Mar qtr: A$925/oz). Using the average AUD:USD exchange rate for the quarter of 0.6999, Group AISC equated to US$640/oz – ranking Evolution among the lowest cost gold producers in the world.
Evolution delivered operating mine cash flow of A$215.2 million (Mar qtr: A$168.3M) and net mine cash flow of A$152.2 million (Mar qtr: A$107.8M). Reported cash flow is A$2.2 million lower than outlined in the FY19 Preliminary Operating Results and FY20 Guidance released to the ASX on 10 July 2019 due to quotational period pricing adjustments for outstanding Mt Carlton concentrate shipments.
Mine capital expenditure was A$63.0 million (Mar qtr: A$60.5M). FY19 sustaining capital of A$94.7 million was below the bottom end of the A$105 – A$135M guidance range while major capital of A$180.4 million was in the middle of the A$165 – A$200M guidance range.
Standout operational performances for the quarter:
▪ Cowal produced 67,878oz at an AISC of A$1,002/oz generating net mine cash flow of A$34.9 million
▪ Mt Carlton produced 28,232oz at an AISC of A$744/oz generating net mine cash flow of A$30.8 million
▪ Ernest Henry produced 25,820oz at an AISC of A$(644)/oz generating net mine cash flow of A$54.6 million
Group gold production in FY19 totalled 753,001 ounces. Three of Evolution’s six operations exceeded the top end of production guidance – Cowal, Mt Carlton and Ernest Henry.
Group FY19 AISC of A$924 per ounce (US$661/oz) was above the top of the A$850 – A$900 per ounce guidance range. The operational and non-operational factors driving the cost increase were outlined in the FY19 Preliminary Operating Results and FY20 Guidance released to the ASX on 10 July 2019.
Drilling continued at Cowal GRE46 and Dalwhinnie to define and extend mineralisation with significant
intersections including: 20m (16m etw) grading 8.36g/t Au and 22m (17.6m etw) grading 5.49g/t Au. Drilling completed at the Boomer prospect 400m west of Frog’s Leg intercepted a laminated vein with visible gold and base metal sulphides grading 102.85g/t Au over 0.9m.
As at 30 June 2019, gross debt under the Senior Secured Term Facility D was A$300.0 million. The group cash balance was A$335.2 million. During the June 2019 quarter Evolution’s cash generation of A$109.5 million moved the Company to a net cash position of A$35.2 million (31 Mar 2019: net bank debt of A$74.2M).
FY20 guidance was provided in the 10 July 2019 ASX release. Evolution is forecasting FY20 gold production of between 725,000 – 775,000 at and AISC of between A$890 – A$940 per ounce. Sustaining capital, which is included in AISC, is forecast to be A$90.0 – A$130.0 million. Major capital is expected to be in the range of A$195.0 – A$235.0 million. Further details of FY20 Guidance is provided in Appendix 1 of this release.
5.97.3 7.8 8.3
FY19 Q1 FY19 Q2 FY19 Q3 FY19 Q4
Group safety performance (TRIF)
885973
925 915
700
750
800
850
900
950
1,000
FY19 Q1 FY19 Q2 FY19 Q3 FY19 Q4
Group AISC (A$ per ounce)
200.2 182.0 175.9
194.9
0
50
100
150
200
250
FY19 Q1 FY19 Q2 FY19 Q3 FY19 Q4
Group production (koz)
196.9 191.1168.3
215.2
0
50
100
150
200
250
FY19 Q1 FY19 Q2 FY19 Q3 FY19Q4
Group mine operating cash flow (A$M)
TRIF: Total recordable injury frequency. The frequency of total recordable injuries per million hours worked. Results above are based on a 12-month moving average
For
per
sona
l use
onl
y
OVERVIEW
Evolution Mining Limited Quarterly Report June 2019 3
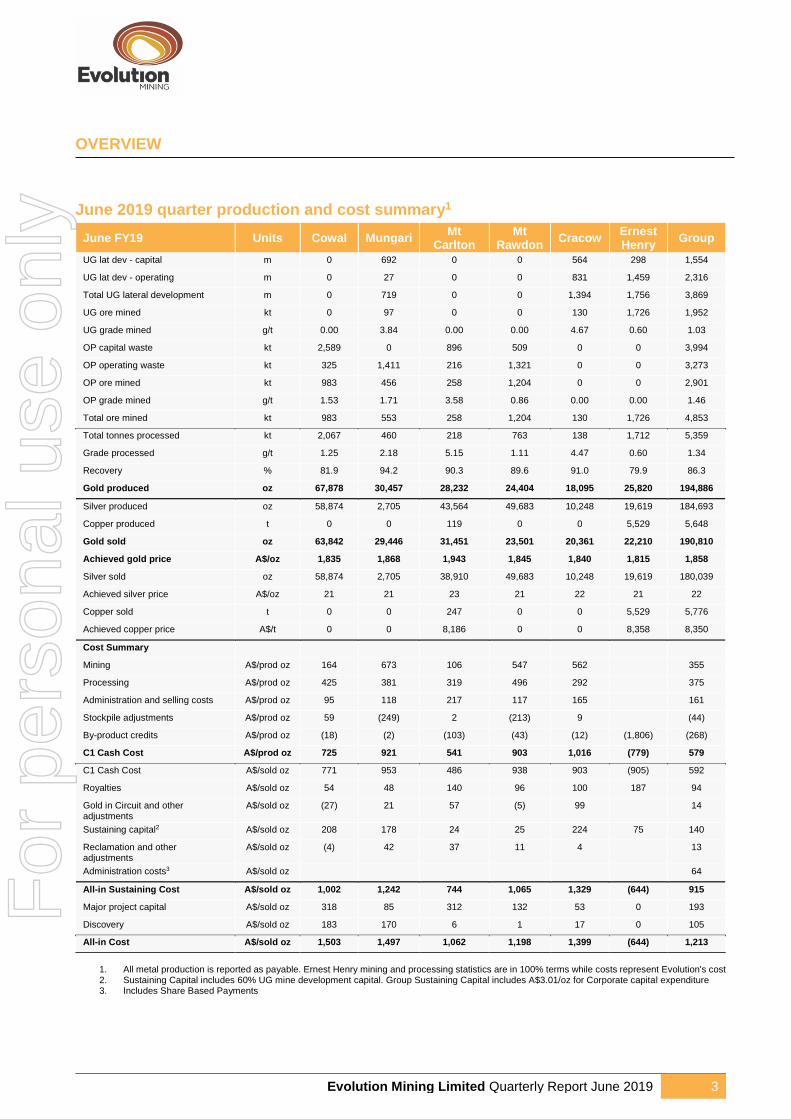
June 2019 quarter production and cost summary1
June FY19 Units Cowal Mungari Mt
Carlton Mt
Rawdon Cracow
Ernest Henry
Group
UG lat dev - capital m 0 692 0 0 564 298 1,554
UG lat dev - operating m 0 27 0 0 831 1,459 2,316
Total UG lateral development m 0 719 0 0 1,394 1,756 3,869
UG ore mined kt 0 97 0 0 130 1,726 1,952
UG grade mined g/t 0.00 3.84 0.00 0.00 4.67 0.60 1.03
OP capital waste kt 2,589 0 896 509 0 0 3,994
OP operating waste kt 325 1,411 216 1,321 0 0 3,273
OP ore mined kt 983 456 258 1,204 0 0 2,901
OP grade mined g/t 1.53 1.71 3.58 0.86 0.00 0.00 1.46
Total ore mined kt 983 553 258 1,204 130 1,726 4,853
Total tonnes processed kt 2,067 460 218 763 138 1,712 5,359
Grade processed g/t 1.25 2.18 5.15 1.11 4.47 0.60 1.34
Recovery % 81.9 94.2 90.3 89.6 91.0 79.9 86.3
Gold produced oz 67,878 30,457 28,232 24,404 18,095 25,820 194,886
Silver produced oz 58,874 2,705 43,564 49,683 10,248 19,619 184,693
Copper produced t 0 0 119 0 0 5,529 5,648
Gold sold oz 63,842 29,446 31,451 23,501 20,361 22,210 190,810
Achieved gold price A$/oz 1,835 1,868 1,943 1,845 1,840 1,815 1,858
Silver sold oz 58,874 2,705 38,910 49,683 10,248 19,619 180,039
Achieved silver price A$/oz 21 21 23 21 22 21 22
Copper sold t 0 0 247 0 0 5,529 5,776
Achieved copper price A$/t 0 0 8,186 0 0 8,358 8,350
Cost Summary
Mining A$/prod oz 164 673 106 547 562 355
Processing A$/prod oz 425 381 319 496 292 375
Administration and selling costs A$/prod oz 95 118 217 117 165 161
Stockpile adjustments A$/prod oz 59 (249) 2 (213) 9 (44)
By-product credits A$/prod oz (18) (2) (103) (43) (12) (1,806) (268)
C1 Cash Cost A$/prod oz 725 921 541 903 1,016 (779) 579
C1 Cash Cost A$/sold oz 771 953 486 938 903 (905) 592
Royalties A$/sold oz 54 48 140 96 100 187 94
Gold in Circuit and other adjustments
A$/sold oz (27) 21 57 (5) 99
14
Sustaining capital2 A$/sold oz 208 178 24 25 224 75 140
Reclamation and other adjustments
A$/sold oz (4) 42 37 11 4
13
Administration costs3 A$/sold oz
64
All-in Sustaining Cost A$/sold oz 1,002 1,242 744 1,065 1,329 (644) 915
Major project capital A$/sold oz 318 85 312 132 53 0 193
Discovery A$/sold oz 183 170 6 1 17 0 105
All-in Cost A$/sold oz 1,503 1,497 1,062 1,198 1,399 (644) 1,213
1. All metal production is reported as payable. Ernest Henry mining and processing statistics are in 100% terms while costs represent Evolution's cost 2. Sustaining Capital includes 60% UG mine development capital. Group Sustaining Capital includes A$3.01/oz for Corporate capital expenditure 3. Includes Share Based Payments
For
per
sona
l use
onl
y

OVERVIEW
Evolution Mining Limited Quarterly Report June 2019 4
FY19 production and cost summary1
FY19 YTD Units Cowal Mungari Mt
Carlton Mt
Rawdon Cracow
Ernest Henry
Group
UG lat dev - capital m 0 1,559 0 0 2,329 856 4,744
UG lat dev - operating m 0 369 0 0 3,816 5,609 9,794
Total UG lateral development m 0 1,928 0 0 6,146 6,465 14,538
UG ore mined kt 0 391 0 0 560 6,728 7,680
UG grade mined g/t 0.00 4.54 0.00 0.00 4.88 0.58 1.09
OP capital waste kt 18,518 191 3,742 3,931 0 0 26,383
OP operating waste kt 1,436 5,436 841 3,404 0 0 11,118
OP ore mined kt 6,114 1,640 746 3,202 0 0 11,703
OP grade mined g/t 1.24 1.61 5.33 0.87 0.00 0.00 1.45
Total ore mined kt 6,114 2,032 746 3,202 560 6,728 19,383
Total tonnes processed kt 7,936 1,660 807 3,245 573 6,829 21,050
Grade processed g/t 1.21 2.40 5.30 1.02 4.80 0.58 1.32
Recovery % 81.7 93.8 89.5 89.1 91.5 80.7 86.3
Gold produced oz 251,500 120,535 106,646 94,647 80,983 98,689 753,001
Silver produced oz 250,602 15,590 199,146 135,794 38,043 70,321 709,497
Copper produced t 0 0 839 0 0 21,008 21,846
Gold sold oz 245,786 121,582 102,744 93,865 82,137 96,850 742,964
Achieved gold price A$/oz 1,751 1,748 1,819 1,748 1,749 1,756 1,760
Silver sold oz 250,602 15,590 193,035 135,794 38,043 70,321 703,386
Achieved silver price A$/oz 21 21 21 21 21 21 21
Copper sold t 0 0 874 0 0 21,008 21,881
Achieved copper price A$/t 0 0 8,589 0 0 8,587 8,587
Cost Summary 0
Mining A$/prod oz 180 713 85 441 495 352
Processing A$/prod oz 463 353 295 475 256 373
Administration and selling costs A$/prod oz 119 124 222 124 154 173
Stockpile adjustments A$/prod oz 24 (110) (1) 63 5 (1)
By-product credits A$/prod oz (21) (3) (109) (30) (10) (1,843) (269)
C1 Cash Cost A$/prod oz 765 1,078 492 1,073 900 (783) 627
C1 Cash Cost A$/sold oz 782 1,068 511 1,082 888 (798) 635
Royalties A$/sold oz 48 46 136 90 95 160 85
Gold in Circuit and other adjustments A$/sold oz (19) 12 (25) (6) 7 (8)
Sustaining capital2 A$/sold oz 175 173 78 47 272 99 148
Reclamation and other adjustments A$/sold oz 9 21 37 19 11 15
Administration costs3 A$/sold oz 49
All-in Sustaining Cost A$/sold oz 995 1,320 737 1,233 1,272 (539) 924
Major project capital A$/sold oz 410 58 268 255 59 0 221
Discovery A$/sold oz 95 158 9 2 24 0 70
All-in Cost A$/sold oz 1,500 1,536 1,014 1,490 1,355 (539) 1,215
Depreciation & Amortisation4 A$/prod oz 352 421 458 579 296 1,316 529
1. All metal production is reported as payable. Ernest Henry mining and processing statistics are in 100% terms while costs represent Evolution's cost
and not solely the cost of Ernest Henry's operation 2. Sustaining Capital includes 60% UG mine development capital. Group Sustaining Capital includes A$1.92/oz for Corporate capital expenditure 3. Includes Share Based Payments 4. Group Depreciation and Amortisation includes non-cash Fair Value Unwind Amortisation of A$31/oz in relation to Cowal (A$53/oz) and Mungari
(A$85/oz) and Corporate Depreciation and Amortisation of A$1.90/oz
For
per
sona
l use
onl
y

OPERATIONS
Evolution Mining Limited Quarterly Report June 2019 5
Cowal, New South Wales (100%)
Cowal produced 67,878oz of gold at an AISC of A$1,002/oz (Mar qtr: 64,117oz, AISC A$1,000/oz).
Mine operating cash flow for the quarter was A$68.5 million (Mar qtr: A$51.8M). Net mine cash flow increased to A$34.9 million (Mar qtr: A$15.9M) post sustaining capital of A$13.3 million and major capital of A$20.3 million. Major projects included the processing plant expansion and pre-works construction of the Integrated Waste Landform (IWL) tailings facility.
An improvement to processing capability by rejecting the lower grade re-circulating scats feed resulted in increased throughput rates during the quarter. Total throughput was a record 2,067kt despite a planned ten-day shutdown for the mill upgrade project.
The increased throughput rates achieved from rejecting the scats, which have been stockpiled for processing at a later date, resulted in a planned reduction in recoveries. The float tails leach circuit continues to ramp up with average recoveries for the June 2019 quarter of 5.1%.
The Warraga underground exploration decline had reached 550 metres of lateral development as of 30 June 2019 and is progressing ahead of schedule. The underground drilling program commenced during the quarter and will continue for the next 12-18 months.
Total FY19 gold production of 251,500 ounces was above guidance of 240,000 – 250,000oz. AISC of A$995/oz was at the bottom end of the A$975 – A$1,075/oz guidance range.
Full year mine operating cash flow was A$232.1 million. Net mine cashflow was $87.5 million.
FY20 guidance: 255,000 – 265,000oz at an AISC of A$930 – A$980/oz.
Mungari, Western Australia (100%)
Mungari produced 30,457oz of gold at an AISC of A$1,242/oz (Mar qtr: 24,966oz, AISC A$1,521/oz).
Mine operating cash flow for the quarter was A$17.9 million (Mar qtr: A$10.4M). Net mine cash flow was A$10.2 million (Mar qtr: A$2.5M) post sustaining and major capital investment of A$7.8 million.
Production and costs improved with increased availability of high-grade ore from the Frog’s Leg underground mine which produced 97kt of ore at a grade of 3.84g/t gold (Mar qtr: 55kt at 3.82g/t gold). Total development was 719 metres with the focus on Mist and rehabilitation of the North Portal to access ore in the mine’s upper levels.
White Foil open pit total material movement was 2,126kt. Open pit ore mined was 456kt at a grade of 1.71g/t gold. Stripping of stage 3a is nearing completion while the stage 3b cut back commenced during the June 2019 quarter.
A total of 460kt of ore was processed at an average grade of 2.18g/t gold. Plant throughput was excellent in June with a monthly record achieved of 159kt as an outcome of the operational and maintenance improvement project to optimise the crushing process.
Total FY19 gold production of 120,535oz was below the bottom end of the 125,000 – 135,000oz guidance range. AISC of A$1,233/oz was above guidance of A$1,050 – A$1,100/oz guidance.
Full year mine operating cash flow was A$63.9 million. Net mine cash flow was A$35.8 million.
FY20 guidance: 115,000 – 125,000oz at an AISC of A$1,230 – A$1,280/oz.
61.3
koz
58.2
koz
64.1
koz
67.9
koz
958
1,019 1,000 1,002
FY19 Q1 FY19 Q2 FY19 Q3 FY19 Q4
Production gold (oz) AISC (A$/oz)
35.1
koz
30.0
koz
25.0
koz
30.5
koz
1,120
1,474 1,521
1,242
FY19 Q1 FY19 Q2 FY19 Q3 FY19 Q4
Production gold (oz) AISC (A$/oz)
For
per
sona
l use
onl
y

OPERATIONS
Evolution Mining Limited Quarterly Report June 2019 6
Mt Carlton, Queensland (100%)
Mt Carlton produced 28,232oz of payable gold during the quarter comprised of 21,334oz contained in 14,505 dry metric tonnes (dmt) of gold concentrate and 6,898oz in gold doré (Mar qtr: 26,116oz production comprised of 19,258oz in concentrate and 6,859oz gold doré).
AISC increased to A$744/oz (Mar qtr: A$643/oz) as a result of mine sequencing with lower capital development in Stage 4 as access was regained to Stage 3 (operating expense) after the significant rain event in the March quarter. Mine operating cash flow of A$41.4 million and net mine cash flow of A$30.8 million (Mar qtr: A$16.3 million) was generated post sustaining and major capital of A$10.6 million.
A total of 218kt of ore at 5.15g/t gold was treated. Processing plant recoveries improved to 90.3% (Mar qtr: 89.2%) as a result of improved process water quality.
Mining activities focused on progressing Stage 3 for the underground access portal, following completion of pit dewatering during the March quarter. Work on the underground project focused on mobilisation of the mining contactor and establishment of services (electricity, water and compressed air) to the portal location in anticipation of commencing underground development early in the September 2019 quarter.
Total FY19 gold production of 106,646oz was above the top end of the 95,000 – 105,000oz guidance range. AISC of A$737/oz was slightly above the top end A$620 – A$720/oz guidance.
Full year mine operating cash flow was A$120.2 million. Net mine cash flow was A$84.6 million.
FY20 guidance: 95,000 – 105,000oz at an AISC of A$800 – A$850/oz.
Mt Rawdon, Queensland (100%)
Mt Rawdon produced 24,404oz of gold during the quarter. AISC decreased to A$1,065/oz (Mar qtr: 20,124oz, A$1,316/oz).
Mine operating cash flow of A$13.9 million and net mine cash flow of A$10.2 million (Mar qtr: A$6.2M) was generated post sustaining and major capital spend of A$3.7 million. The majority of capital spend was on open pit stripping and work on the Tailings Storage Facility buttress.
Ore mined was 1,204kt at an average grade of 0.86g/t gold. An excavator optimisation tool is being used to improve cycle time of truck loadings.
A total of 763kt of ore was processed at an average grade of 1.11g/t gold. Plant recovery improved to 89.6% (Mar qtr: 88.6%). Plant utilisation was 93.5%.
Throughput was impacted by a major shut down for a ball mill gear box refurbishment, ball mill re-line and SAG mill reline which was brought forward into the June 2019 quarter.
Total FY19 gold production of 94,647oz was just below the bottom end of the 95,000 – 105,000oz guidance range. AISC of A$1,233/oz was above the top end of the A$1,000 – A$1,050/oz guidance. The poor FY19 production and costs was predominantly driven by reduced access to higher grade ore in the open pit.
Full year mine operating cash flow was A$60.0 million. Net mine cash flow was A$31.6 million.
FY20 guidance: 90,000 – 100,000oz at an AISC of A$1,210 – A$1,260/oz.
26.2
koz
26.1
koz
26.1
koz
28.2
koz
831 715
643 744
FY19 Q1 FY19 Q2 FY19 Q3 FY19 Q4
Production gold (oz) AISC (A$/oz)
29.7
koz
20.4
koz
20.1
koz
24.4
koz
1,168 1,421 1,316
1,065
FY19 Q1 FY19 Q2 FY19 Q3 FY19 Q4
Production gold (oz) AISC (A$/oz)
For
per
sona
l use
onl
y

OPERATIONS
Evolution Mining Limited Quarterly Report June 2019 7
Cracow, Queensland (100%)
Cracow produced 18,095oz of gold at an AISC of
A$1,329/oz (Mar qtr: 18,158oz, AISC A$1,310/oz).
Mine operating cash flow for the quarter was A$17.2
million. Net mine cash flow was A$11.5 million (Mar
qtr: A$7.5M), post sustaining capital of A$3.0 million
and major capital of A$2.7 million.
Sustaining capital comprised mainly of resource
definition drilling and capital equipment
replacement.
A total of 138kt of ore was mined at an average
grade of 4.47g/t gold. Primary ore sources were the
Kilkenny, Coronation and Imperial ore bodies. In the
June quarter focus shifted to stoping tonnes and
backfill whereas the March quarter focus was on ore
development. This shift resulted in a greater
proportion of ore from stoping which will continue in
the September 2019 quarter.
Continued improvement was seen with recent
changes to stoping parameters to address dilution
issues experienced in the previous quarter. Shorter
stope length as well as the installation of additional
ground support made a positive impact in the
quarter.
Total FY19 gold production of 80,983oz was within guidance of 80,000 – 85,000oz. AISC of A$1,272/oz was also within guidance of A$1,250 – A$1,300/oz.
Full year mine operating cash flow was A$63.3 million. Net mine cash flow was A$36.1 million.
FY20 guidance: 82,500 – 87,500ozat an AISC of A$1,200 – A$1,250/oz.
Ernest Henry, Queensland (Economic interest; 100% gold and 30% copper production)1
Evolution’s interest in Ernest Henry delivered 25,820oz of gold and 5,529t of copper at an AISC of negative A$(644)/oz (Mar qtr: 22,419oz Au and 4,597t Cu at A$(510)/oz).
Ore mined was 1,726kt at an average grade of 0.60g/t gold and 1.14% copper. Underground lateral development was 1,756m. Ore processed was 1,712t at an average grade of 0.60g/t gold and 1.14% copper. Gold recovery of 79.9% and copper recovery of 96.3% was achieved with mill utilisation at 86.5%.
Operating cash costs (C1) was negative A$(779)/oz after accounting for copper and silver by-product credits (Mar qtr: A$(794)/oz). Cash operating costs (C1) included by-product credits of A$(1,806)/oz.
Copper sales in the quarter were 5,529t at an average copper price of A$8,358/t.
Operating mine cash flow for the quarter was A$56.2 million representing gold (A$40.3 million) and by-product sales of copper (A$46.2 million) and silver (A$0.4 million), net of Evolution’s contribution to operating costs of A$30.7 million. Ernest Henry generated net mine cash flow for Evolution of A$54.6 million, post sustaining capital of A$1.7 million.
Total FY19 gold production of 98,689oz was well above guidance of 85,000 – 90,000oz. AISC of A$(539)/oz was within guidance of A$(575) – A$(525)/oz.
Full year mine operating cash flow was A$231.8 million. Net mine cash flow was A$222.2 million.
FY20 guidance: 87,500 – 92,500oz at an AISC of A$(590) – A$(540)/oz.
1. All metal production is reported as payable. Ernest Henry mining and processing statistics are in 100% terms while costs represent Evolution’s costs and not solely the cost of Ernest Henry’s operation
22.3
koz
22.4
koz
18.2
koz
18.1
koz
1,286
1,181
1,310 1,329
FY19 Q1 FY19 Q2 FY19 Q3 FY19 Q4
Production gold (oz) AISC (A$/oz)
25.7
koz
24.8
koz
22.4
koz
25.8
koz
(617)
(403)(510)
(644)
FY19 Q1 FY19 Q2 FY19 Q3 FY19 Q4
Production gold (oz) AISC (A$/oz)
For
per
sona
l use
onl
y
FINANCIALS
Evolution Mining Limited Quarterly Report June 2019 8
The strong cash flow generation of the business was reflected by the move to a net cash position of A$35.2 million during the June 2019 quarter. This was on the back of a quarterly operating mine cash flow of A$215.2 million, which was a 28% increase from the March quarter of A$168.3 million. During FY19 Evolution achieved operating mine cash flow of A$771.4 million. Reported cash flow is A$2.2 million lower than outlined in the FY19 Preliminary Operating Results and FY20 Guidance released to the ASX on 10 July 2019 due to quotational period pricing adjustments for outstanding Mt Carlton concentrate shipments. All operations were cash flow positive for the quarter and financial year after meeting their operating and capital needs.
Evolution sold 190,810oz of gold at an average gold price of A$1,858/oz during the June quarter (March 2019 qtr: 167,598oz at A$1,798/oz). Deliveries into the hedge book totalled 31,600oz at an average price of A$1,697/oz with the remaining 159,210oz of gold delivered on spot markets at an average price of A$1,890/oz.
Capital investment for the June quarter was A$63.0 million, comprising A$42.2 million on major projects and A$20.8 million on sustaining capital.
Evolution generated a 41% higher net mine cash flow at A$152.2 million relative to the March quarter (A$107.8 million) due to higher gold and copper sales and a higher realised gold price. Net mine cash flow for the financial year was A$497.8 million.
Cowal and Mt Carlton both achieved significantly improved financial performances in the June quarter with A$34.9 million and A$30.8 million net mine cash flows respectively (Mar qtr: of A$15.9 million and A$16.3 million respectively). Ernest Henry delivered lower net mine cash flow of A$54.6 million (Mar qtr: A$59.5M) due to lower copper prices during the quarter but still generated an exceptional A$222.2 million for the financial year.
Cash flow (A$ Million) Operating Mine Cash
flow
Sustaining Capital1
Major Projects Capital2
Net Mine Cash flow
Net Mine Cash Flow
YTD
Cowal 68.5 (13.3) (20.3) 34.9 87.5
Mungari 17.9 (1.5) (6.2) 10.2 35.8
Mt Carlton 41.4 (0.8) (9.8) 30.8 84.6
Mt Rawdon 13.9 (0.6) (3.1) 10.2 31.6
Cracow 17.2 (3.0) (2.7) 11.5 36.1
Ernest Henry 56.2 (1.7) 0.0 54.6 222.2
June 2019 Quarter 215.2 (20.8) (42.2) 152.2 497.8
March 2019 Quarter 168.3 (13.5) (47.0) 107.8
December 2018 Quarter 191.1 (31.6) (51.0) 108.5
September 2018 Quarter 196.9 (27.3) (40.3) 129.3
FY19 Total 771.4 (93.2) (180.5) 497.8
1. Sustaining Capital excludes A$1.5 million of corporate capital 2. Major Projects Capital includes 100% of the Underground mine development capital for FY19 and A$0.6 million for the June quarter
Major capital expenditure items included; Cowal Stage H development, Plant Expansion and IWL projects (A$22.4 million); Mt Carlton underground construction (A$4.1 million); open pit capital waste stripping at Mt Carlton (A$5.3 million) and Mt Rawdon (A$2.1 million); and underground mine development at Cracow (A$2.7 million) and Mungari (A$6.2 million).
FY19 sustaining capital of A$94.7 million, including A$1.5 million corporate capital, was below the bottom end of the A$105.0 – A$135.0M guidance range. Major capital of A$180.4 million was in the middle of the A$165.0 – A$200.0M guidance range.
Discovery expenditure in the quarter increased to A$19.0 million (Mar qtr: A$13.5 million) driven by continued drilling and underground decline development at Cowal, and increased drilling at the Drummond project.
Corporate administration costs were A$8.8 million (Mar qtr: A$5.5 million). The main driver to the increase was higher share-based payment expenses associated with expected higher vesting of performance rights.
For
per
sona
l use
onl
y

FINANCIALS
Evolution Mining Limited Quarterly Report June 2019 9
The Group cash balance at 30 June 2019 was A$335.2 million (31 March 2019: A$255.8 million). The table
below highlights the cash movement during the quarter and for the financial year to June 2019.
Group cash flow before returns to shareholders, debt servicing and acquisition costs was A$109.5 million in the June quarter and A$291.6 million for the financial year. Net group cash flow of A$79.3 million was achieved in the June quarter, which brought the full year net group cash flow to a positive cash position at A$11.9 million. A scheduled debt repayment ($A30.0 million) was made during the quarter, bringing the debt repayments for FY19 to A$95.0 million and reducing the total bank debt to A$300.0 million.
Cash flow (A$M) June 2019 Qtr FY19 Total
Operating Mine Cash flow 215.2 771.4
Total Capital (63.0) (273.7)
Net Mine Cash flow 152.2 497.8
Corporate and discovery (27.8) (78.6)
Net Interest expense (4.5) (15.1)
Working Capital Movement 6.2 (21.3)
Income Tax (16.6) (91.2)
Group Cash flow 109.5 291.6
Dividend payment 0.0 (127.0)
Debt repayment (30.0) (95.0)
Acquisitions (0.2) (57.6)
Net Group Cash flow 79.3 11.9
Opening Cash Balance 1 July 2018 323.2
Opening Cash Balance 1 April 2019 255.8
Closing Group Cash Balance as at 30 June 2019 335.2 335.2
Evolution ended the financial year with a net cash position of A$35.2 million comprising of total bank debt of A$300.0 million and cash of A$335.2 million.
Evolution’s hedge book as at 30 June 2019 was 400,000oz at an average price of A$1,838/oz for quarterly deliveries to June 2023.
Full year financial results
Evolution’s financial results for full year ended 30 June 2019 will be released on 15 August 2019. The following preliminary information is provided in relation to non-cash accounting items which will be included in the results. These items remain subject to audit.
▪ Depreciation and Amortisation (D&A) non-cash expense: Group D&A for the year is expected to be between $525-535/oz produced. Lower D&A in the June quarter predominantly reflects the benefit of higher reserves as per the 2018 Mineral Resource and Ore Reserve Summaries issued in April 2019 over which assets are to be depreciated and fair value at Cowal and Mungari are to be amortised.
▪ Discovery expense: Exploration costs of A$7.0 – A$10.0 million are expected to be expensed for the financial year.
Interactive Analyst CentreTM
Evolution’s financial and operational information is available to view via the Interactive Analyst CentreTM provided on our website at www.evolutionmining.com.au under the Investors tab. This useful interactive platform allows users to chart and export Evolution’s historical results for further analysis.
For
per
sona
l use
onl
y

EXPLORATION
Evolution Mining Limited Quarterly Report June 2019 10
Exploration highlights
▪ Cowal
▪ Excellent drilling results continue at GRE46 and Dalwhinnie with significant intersections including: 20m (16m etw) grading 8.36g/t Au and 22m (17.6m etw) grading 5.49g/t Au
▪ Drilling to the south of GRE46 encountered anomalous intersections including 2m grading 16.9g/t Au
▪ Mungari
▪ Drilling completed at the Boomer prospect 400m west of Frog’s Leg intercepted a laminated vein with visible gold and base metal sulphides grading 102.85g/t Au over 0.9m
Total drilling of 31,104m (resource definition) and 35,079m (discovery) was completed during the quarter. Evolution’s exploration tenement holding interests in Australia stand at 9,003 km2 around its operating sites and at four major greenfield exploration sites.
Cowal, New South Wales (100%)
During the June quarter work was conducted across three prospects; GRE46, East Girral, and Reflector. A total of 12,728m diamond drilling and 6,740m air core (AC) drilling were completed.
In addition, ground gravity and 3D MIM Distributed Acquisition System (MIMDAS) induced polarisation (IP) surveys were completed as part of the broader regional targeting program.
Galway Regal – E46 (GRE46)
Three surface diamond drills continued testing GRE46 and Dalwhinne. Drilling intersected mineralisation in the Dalwhinnie position.
Assays from the drilling adjacent to resource blocks:
▪ 6m (4.8m etw) grading 24.03g/t Au from 687m (1535DD359A) – at the Dalwhinnie position ▪ 6m (4.8m etw) grading 11.77g/t Au from 639m (1535DD359E) – in sediments ▪ 20m (16m etw) grading 8.36g/t Au from 707m (1535DD359E) – at the Dalwhinnie position ▪ 22m (17.6m etw) grading 5.49g/t Au from 765m (1535DD359F) – at the Dalwhinnie position
Mineralised intercepts are demonstrating continuity of mineralisation in and adjacent to the Dalwhinnie sill. It is likely the new drilling will grow the resource. The September quarter will see the surface drill program target the down plunge positions of the Dalwhinnie sill to the south, and the lower lava and diorite in the north.
One underground diamond drill rig commenced in June which was ahead of schedule. Drilling has focused on infill adjacent to resource blocks in the south and on geotechnical holes. Infill drilling will continue in the September quarter to improve the resource classification. A second underground drill rig is planned to mobilise to site in the current quarter.
In addition, results from discovery drill testing to the south of the GRE46 were received including:
▪ 8m (6.9 etw) grading 4.81g/t Au from 55m includes 2m of core loss (hole 1535DD442) ▪ 5m grading 1.68g/t Au from 100m (1535DD442) ▪ 2m grading 4.03g/t Au from 141m (1535DD442) ▪ 2m grading 16.85g/t Au from 171m (1535DD444) ▪ 6m grading 1.57g/t Au from 271m (1535DD444)
These results are all outside the current GRE46 area and further drilling will be conducted to determine economic significance.
Note: Reported intervals provided in this report are downhole widths as true widths are not currently known. An estimated true width (etw) is provided where available
For
per
sona
l use
onl
y

EXPLORATION
Evolution Mining Limited Quarterly Report June 2019 11
Figure 1: Long projection of the GRE46 structure looking west showing the location of drilling completed during the June quarter
East Girral
Three diamond drill holes were completed at East Girral during the quarter for a total of 900m drilling. Holes tested below higher tenor AC hits within the largest defined target. Holes intersected a sequence of folded volcanoclastic sediments with minor veining with arsenopyrite, pyrite mineralisation. Assays are pending.
Reflector
During the quarter 62 AC holes for a total of 6,740m of drilling was completed across the Reflector target area, up to 1 kilometre to the east of GRE46, which continued the program from the previous quarter. A total of 122 drill holes (inclusive of March quarter drilling) were completed on the Reflector target during FY19. Results for 108 drill holes have been received to date with numerous significant results (>0.5g/t Au).
For
per
sona
l use
onl
y
EXPLORATION
Evolution Mining Limited Quarterly Report June 2019 12
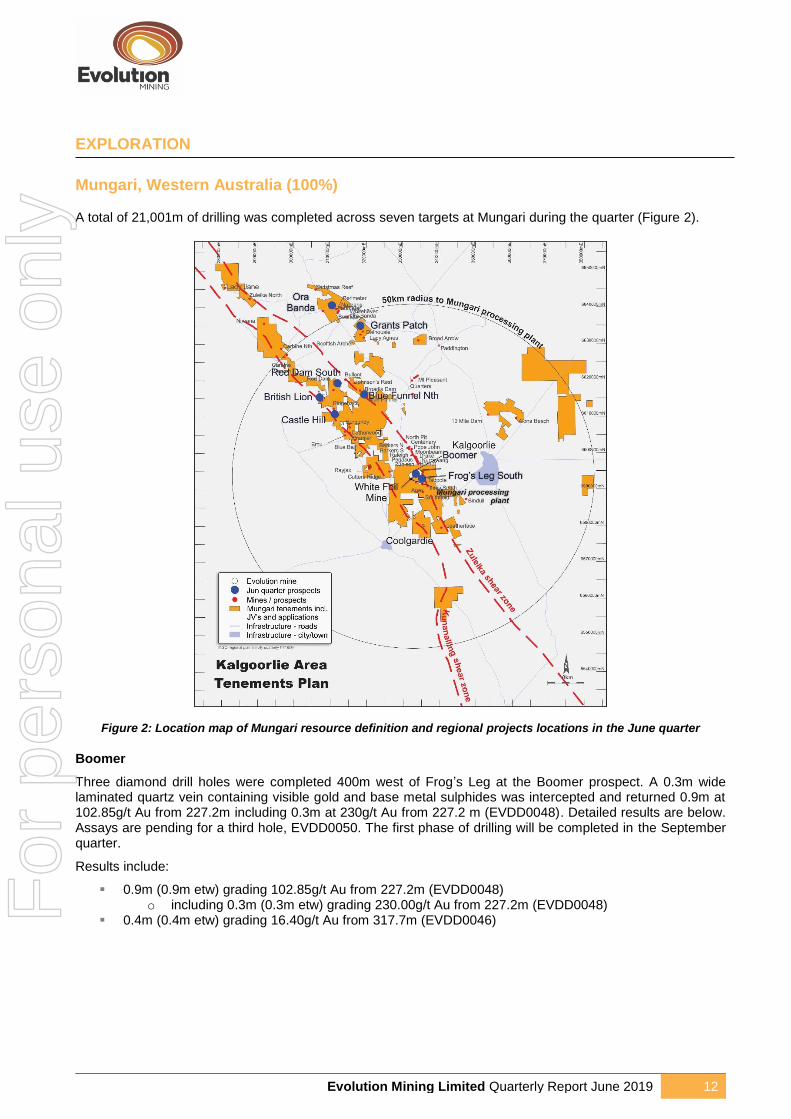
Mungari, Western Australia (100%)
A total of 21,001m of drilling was completed across seven targets at Mungari during the quarter (Figure 2).
Figure 2: Location map of Mungari resource definition and regional projects locations in the June quarter
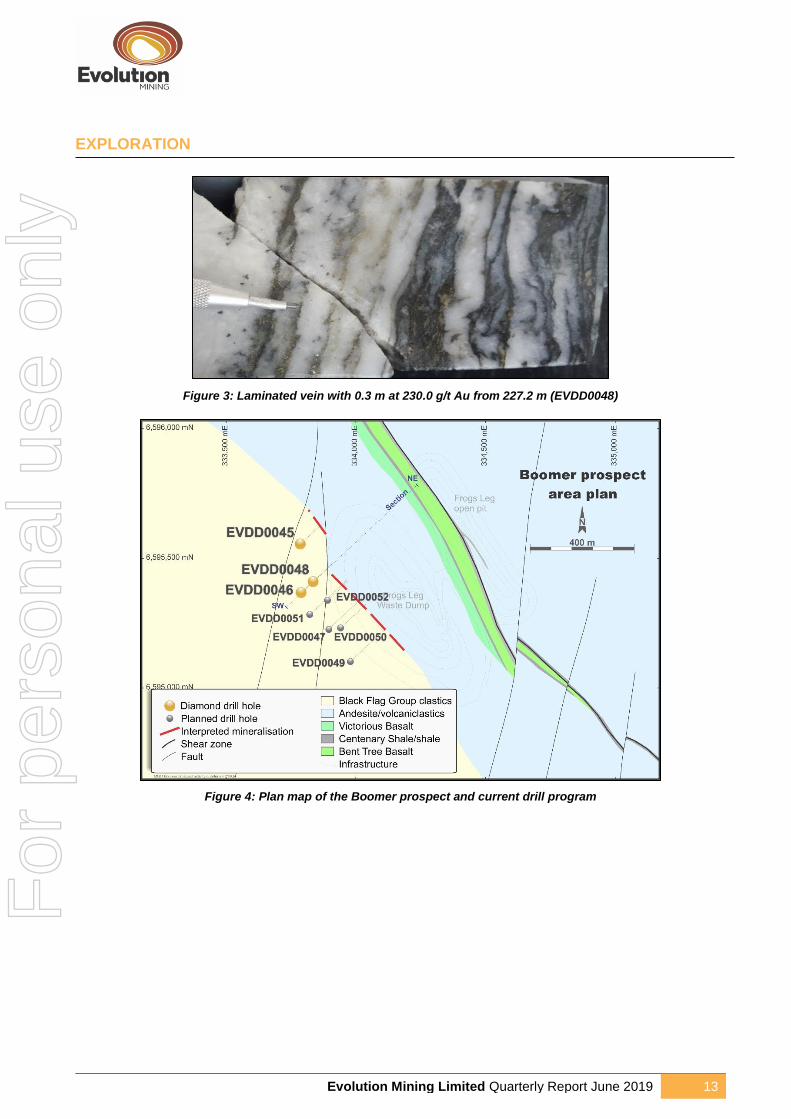
Boomer
Three diamond drill holes were completed 400m west of Frog’s Leg at the Boomer prospect. A 0.3m wide laminated quartz vein containing visible gold and base metal sulphides was intercepted and returned 0.9m at 102.85g/t Au from 227.2m including 0.3m at 230g/t Au from 227.2 m (EVDD0048). Detailed results are below. Assays are pending for a third hole, EVDD0050. The first phase of drilling will be completed in the September quarter.
Results include:
▪ 0.9m (0.9m etw) grading 102.85g/t Au from 227.2m (EVDD0048) o including 0.3m (0.3m etw) grading 230.00g/t Au from 227.2m (EVDD0048)
▪ 0.4m (0.4m etw) grading 16.40g/t Au from 317.7m (EVDD0046)
For
per
sona
l use
onl
y
EXPLORATION
Evolution Mining Limited Quarterly Report June 2019 13
Figure 3: Laminated vein with 0.3 m at 230.0 g/t Au from 227.2 m (EVDD0048)
Figure 4: Plan map of the Boomer prospect and current drill program
For
per
sona
l use
onl
y

EXPLORATION
Evolution Mining Limited Quarterly Report June 2019 14
Figure 5: Section through EVDD0048 and EVDD0046 at the Boomer prospect
Scottish Archer
The preliminary model for Scottish Archer was completed in June. The prospect has been retired for future consideration should more deposits be identified in the Grants Patch area.
Ora Banda
Drilling has commenced on seven high priority targets at Ora Banda and is expected to be completed in the next quarter.
Frog’s Leg South
Drilling at Frog’s Leg South did not identify economic mineralisation.
Banjo
A 1,722m sub-horizontal stratigraphic diamond hole collared in the Banjo Decline and drilling westward was completed between Frog’s Leg and White Foil. This hole provided a framework for developing new targets west of Frog’s Leg. Phase 3 drilling for the Banjo (Frog’s Leg) deeper targets commenced in early July and is expected to be completed by the next quarter.
Drummond Project Joint Venture, Queensland (earning 80%)
A diamond drilling program, totalling 2,159m over five holes, has been completed at Drummond on the Bunyip Hill epithermal Au-Ag prospect.
Drilling targeted a NNW-trending structural corridor defined by geological mapping, surface geochemistry and interpreted geophysical data.
For
per
sona
l use
onl
y
EXPLORATION
Evolution Mining Limited Quarterly Report June 2019 15
Best intercepts received to date include:
▪ 3.0m (2.7m etw) grading 3.42g/t Au and 6.7g/t Ag from 7m (BHDD_003)
o including 1.0m (0.8m etw) at 9.16g/t Au and 18.1g/t Ag from 9m
This intercept is from an epithermal-style quartz vein hosted within a dacite volcaniclastic unit and supports the occurrence of epithermal mineralisation at the top of Bunyip Hill. Further drilling is dependent on pending results.
Further information on all reported exploration results included in this report is provided in the Drill Hole Information Summary and JORC Code 2012 Table 1 presented in Appendix 1 of this report.
Competent person statement
Exploration results
The information in this report that relates to exploration results listed in the table below is based on work compiled by the person whose name appears in the same row, who is employed on a full-time basis by Evolution Mining Limited and is a member of the Australasian Institute of Mining and Metallurgy. Each person named in the table below has sufficient experience which is relevant to the style of mineralisation and types of deposits under consideration and to the activity which he has undertaken to qualify as a Competent Person as defined in the JORC Code 2012. Each person named in the table consents to the inclusion in this report of the matters based on his information in the form and context in which it appears.
Activity Competent person
Mungari resource definition and exploration results Andrew Engelbrecht
Cowal resource definition and exploration results James Biggam
Drummond JV exploration results Rex Brommecker
Forward looking statements
This report prepared by Evolution Mining Limited (or “the Company”) include forward looking statements. Often, but not always, forward looking statements can generally be identified by the use of forward looking words such as “may”, “will”, “expect”, “intend”, “plan”, “estimate”, “anticipate”, “continue”, and “guidance”, or other similar words and may include, without limitation, statements regarding plans, strategies and objectives of management, anticipated production or construction commencement dates and expected costs or production outputs.
Forward looking statements inherently involve known and unknown risks, uncertainties and other factors that may cause the Company’s actual results, performance and achievements to differ materially from any future results, performance or achievements. Relevant factors may include, but are not limited to, changes in commodity prices, foreign exchange fluctuations and general economic conditions, increased costs and demand for production inputs, the speculative nature of exploration and project development, including the risks of obtaining necessary licenses and permits and diminishing quantities or grades of reserves, political and social risks, changes to the regulatory framework within which the Company operates or may in the future operate, environmental conditions including extreme weather conditions, recruitment and retention of personnel, industrial relations issues and litigation.
Forward looking statements are based on the Company and its management’s good faith assumptions relating to the financial, market, regulatory and other relevant environments that will exist and affect the Company’s business and operations in the future. The Company does not give any assurance that the assumptions on which forward looking statements are based will prove to be correct, or that the Company’s business or operations will not be affected in any material manner by these or other factors not foreseen or foreseeable by the Company or management or beyond the Company’s control.
Although the Company attempts and has attempted to identify factors that would cause actual actions, events or results to differ materially from those disclosed in forward looking statements, there may be other factors that could cause actual results, performance, achievements or events not to be as anticipated, estimated or intended, and many events are beyond the reasonable control of the Company. Accordingly, readers are cautioned not to place undue reliance on forward looking statements. Forward looking statements in these materials speak only at the date of issue. Subject to any continuing obligations under applicable law or any relevant stock exchange listing rules, in providing this information the Company does not undertake any obligation to publicly update or revise any of the forward-looking statements or to advise of any change in events, conditions or circumstances on which any such statement is based.
For
per
sona
l use
onl
y

CORPORATE INFORMATION
Evolution Mining Limited Quarterly Report June 2019 16
ABN 74 084 669 036
Board of Directors
Jake Klein Executive Chairman
Lawrie Conway Finance Director and CFO
Jim Askew Non-executive Director
Graham Freestone Non-executive Director
Andrea Hall Non-executive Director
Colin (Cobb) Johnstone Non-executive Director
Tommy McKeith Lead Independent Director
Company Secretary
Evan Elstein
Investor enquiries
Bryan O’Hara General Manager Investor Relations Evolution Mining Limited Tel: +61 (0)2 9696 2900
Media enquiries
Michael Vaughan Fivemark Partners Tel: +61 (0)422 602 720
Internet address
www.evolutionmining.com.au
Registered and principal office
Level 24, 175 Liverpool Street Sydney NSW 2000 Tel: +61 (0)2 9696 2900 Fax: +61 (0)2 9696 2901
Share register
Link Market Services Limited Locked Bag A14 Sydney South NSW 1235 Tel: 1300 554 474 (within Australia) Tel: +61 (0)2 8280 7111 Fax: +61 (0)2 9287 0303 Email: [email protected]
Stock exchange listing
Evolution Mining Limited shares are listed on the Australian Securities Exchange under code EVN.
Issued share capital
At 30 June 2019 issued share capital was 1,697,069,720 ordinary shares.
Conference call
Jake Klein (Executive Chairman), Lawrie Conway (Finance Director and Chief Financial Officer), Bob Fulker (Chief Operating Officer), Glen Masterman (VP Discovery and Business Development) and Bryan O’Hara (General Manager Investor Relations) will host a conference call to discuss the quarterly results at 11.00am Sydney time on Wednesday 24 July 2019.
Shareholder – live audio stream
A live audio stream of the conference call will be available on Evolution’s website www.evolutionmining.com.au. The audio stream is ‘listen only’. The audio stream will also be uploaded to Evolution’s website shortly after the conclusion of the call and can be accessed at any time.
Analysts and media – conference call details
Conference call details for analysts and media includes Q & A participation. Please dial in five minutes before the conference starts and provide your name and the participant PIN code.
Participant PIN code: 57119928#
Dial-in numbers:
▪ Australia: 1800 093 431
▪ International Toll: +61 (0)2 8047 9393
Interactive Analyst CentreTM
Evolution’s financial, operational, resources and reserves information is available to view via the Interactive Analyst CentreTM provided on our website www.evolutionmining.com.au under the Investors tab. This useful interactive platform allows users to chart and export Evolution’s historical results for further analysis.
1,700
1,800
1,900
2,000
2,100
1-Apr-2019 1-May-2019 1-Jun-2019 1-Jul-2019
A$/oz June 2019 quarter gold price
Gold price (A$/oz) Qtrly average gold price (A$/oz)
A$1,872/oz average
For
per
sona
l use
onl
y

APPENDIX 1 – FY20 GUIDANCE
Evolution Mining Limited Quarterly Report June 2019 17
FY20 Guidance
Evolution is forecasting FY20 Group gold production of 725,000 – 775,000 ounces of gold with AISC expected
to be in the range of A$890 – A$940 per ounce.
Using the average AUD:USD exchange rate of 0.7156 for the 12 months to 30 June 2019, Evolution’s forecast
FY20 costs are among the lowest of global gold producers and equate to AISC of US$635 – US$670 per ounce.
A breakdown of production, costs and capital guidance is provided in the table below:
FY20 guidance
Gold production
(oz)
C1 cash costs1
(A$/oz)
All-in sustaining
cost1
(A$/oz)
Sustaining capital (A$M)
Major capital (A$M)
Cowal 255,000 – 265,000 810 – 860 930 – 980 25 – 35 115 – 135 Mungari 115,000 – 125,000 1,030 – 1,080 1,230 – 1,280 10 – 15 10 – 15
Mt Carlton 95,000 – 105,000 400 – 450 800 – 850 20 – 25 50 – 60 Mt Rawdon 90,000 – 100,000 960 – 1,010 1,210 – 1,260 10 – 15 10 – 12.5 Cracow 82,500 – 87,500 800 – 850 1,200 – 1,250 15 – 20 10 – 12.5 Ernest Henry
87,500 – 92,500 (925) – (880) (590) – (540) 10 – 15 0
Corporate 45 – 50 0 – 5
Group 725,000 – 775,000 610 – 660 890 – 940 90 – 130 195 – 235 Copper (t)
Ernest Henry 19,000 – 21,000
Mt Carlton 2,000 – 3,000
1. A copper price assumption of A$8,800/t has been used for by-product credits
Investment in sustaining capital in FY20 is forecast to be between A$90.0 – A$130.0 million. This is
approximately in line with FY19 sustaining capital. Investment in tails facilities is the main capital item taking
place at Mungari, Mt Carlton, Mt Rawdon and Cracow. Resource definition drilling, which is included in
sustaining capital, is expected to be A$13.0 – A$20.0 million.
Investment in major project capital and exploration is additional to the costs included in AISC. Major capital in
FY20 is expected to be in the range of A$195.0 – A$235.0 million. The bulk of the major project capital
investment is associated with expansion projects at Cowal as the operation delivers on its objective of increasing
production from 250,000 per annum to over 300,000 ounces per annum. Major capital at Cowal includes
continuation of the Stage H mine development of A$75.0 – A$85.0 million, a ramp up of the Integrated Waste
Landform (Life of Mine tails solution) of A$35.0 – A$40.0 million and the plant expansion project and other
projects of A$5.0 – A$10.0 million. Major project capital investment at Mt Carlton predominantly relates to the
development of the new underground mine of A$30.0 – A$35.0 million; plant optimisation of A$5.0 – A$10.0
million; and Stage 4 open pit mine development of A$15.0 – A$20.0 million.
FY20 exploration investment is expected to be A$80.0 – A$105.0 million. This is a substantial increase on the
FY19 group exploration spend of approximately A$50.0 million and is largely driven by the success at Cowal as
the GRE46 and Dalwhinnie underground mineralisation continues to be defined and extended. Cowal (A$50.0
– A$60.0 million), Mungari (A$15.0 – A$20.0 million) and greenfields exploration projects (A$10.0 – A$15.0
million) will receive the largest allocation of the discovery investment in FY20.
FY20 production guidance of 725,000 – 775,000 ounces is unchanged from the three-year outlook issued at
Evolution’s Annual General Meeting on 22 November 2018. AISC guidance of A$890 – A$940 per ounce is in
line with the cost results achieved in FY19 and is approximately 5% higher than the previous outlook.
For
per
sona
l use
onl
y
APPENDIX 1 – FY20 GUIDANCE
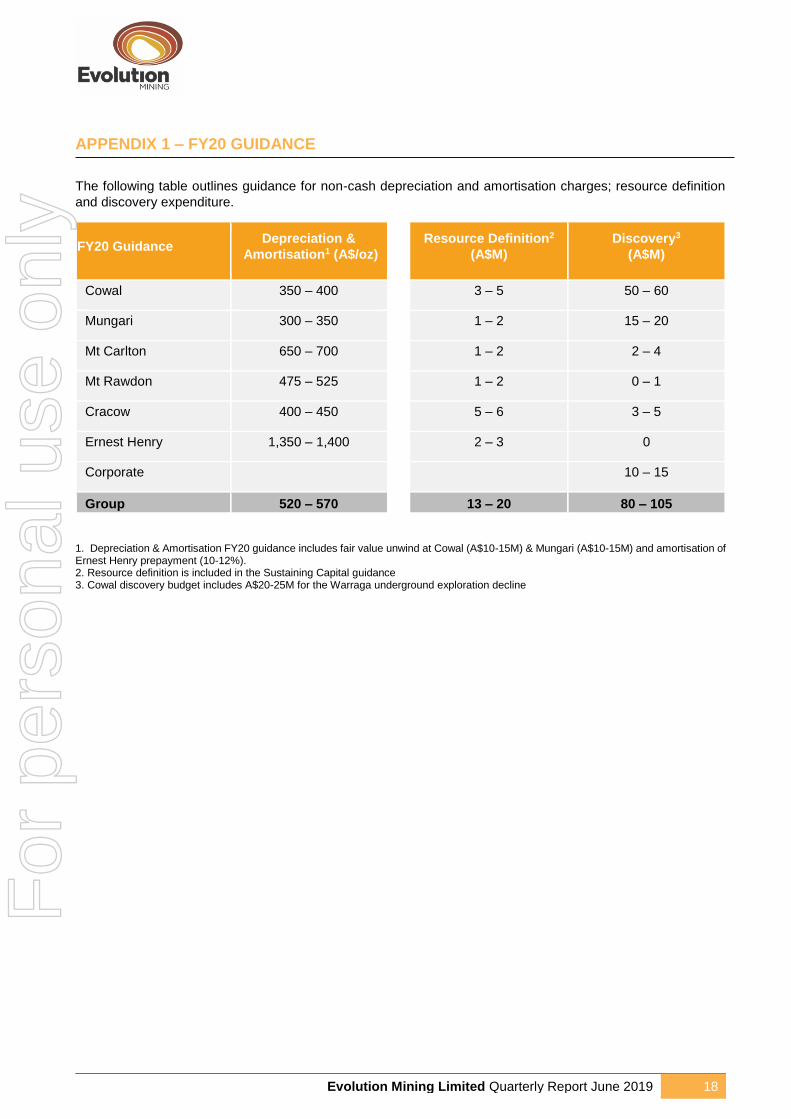
Evolution Mining Limited Quarterly Report June 2019 18
The following table outlines guidance for non-cash depreciation and amortisation charges; resource definition
and discovery expenditure.
FY20 Guidance Depreciation &
Amortisation1 (A$/oz)
Resource Definition2
(A$M)
Discovery3
(A$M)
Cowal 350 – 400 3 – 5 50 – 60
Mungari 300 – 350 1 – 2 15 – 20
Mt Carlton 650 – 700 1 – 2 2 – 4
Mt Rawdon 475 – 525 1 – 2 0 – 1
Cracow 400 – 450 5 – 6 3 – 5
Ernest Henry 1,350 – 1,400 2 – 3 0
Corporate 10 – 15
Group 520 – 570 13 – 20 80 – 105
1. Depreciation & Amortisation FY20 guidance includes fair value unwind at Cowal (A$10-15M) & Mungari (A$10-15M) and amortisation of Ernest Henry prepayment (10-12%). 2. Resource definition is included in the Sustaining Capital guidance 3. Cowal discovery budget includes A$20-25M for the Warraga underground exploration decline
For
per
sona
l use
onl
y

APPENDIX 2 – JORC CODE 2012 ASSESSMENT AND REPORTING CRITERIA
Evolution Mining Limited Quarterly Report June 2019 19
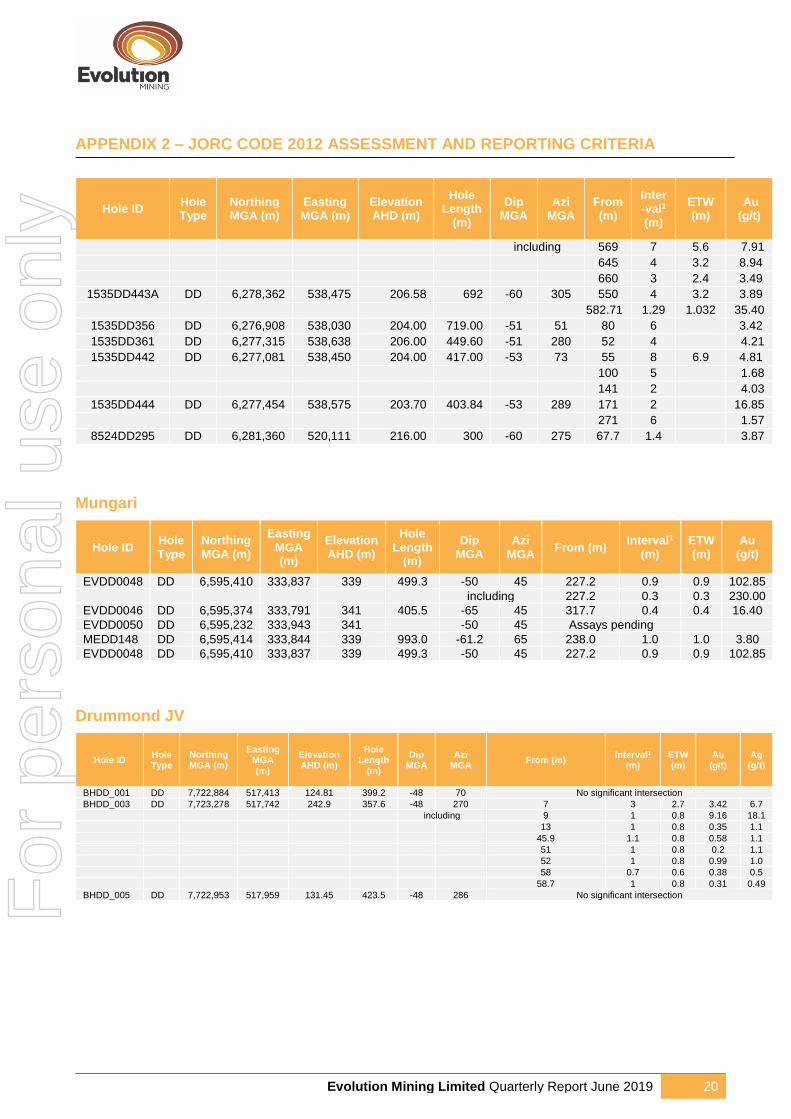
Drill Hole Information Summary
Cowal
Hole ID Hole Type
Northing MGA (m)
Easting MGA (m)
Elevation AHD (m)
Hole Length
(m)
Dip MGA
Azi MGA
From (m)
Inter-val1 (m)
ETW (m)
Au (g/t)
1535DD359 DD 6,278,180 538,563 209 723.19 -58 301 516 8 6 3.89
including 520 1 0.75 16.35
534 16 12 4.45
including 542 5 3.75 6.90
588 6 4.5 3.08
including 589 1 0.75 12.30
625 6 4.5 2.39
including 628 3 2.25 3.43
1535DD359C DD 6,278,180 538,563 208.69 751.66 -58 301 589 5.2 3.9 13.12
619 12 9 8.36
634 10 7.5 6.21
672 5 3.75 5.08
1535DD360 DD 6,278,369 538,472 207.00 534.10 -52 305 390.2 13.8 10.35 3.33
including 392 3 2.25 5.41
and 399 4 3 5.45
493 1 0.75 18.50
1535DD359A DD 6,278,180 538,563 208.00 752.29 -58 301 571 1 0.8 39.00
595 6 4.8 8.83
612 6.88 5.50 3.98
687 6 4.8 24.03
711 8 6.4 3.38
1535DD359B DD 6,278,180 538,563 208.00 794 .00 -58 301 541 6 4.8 3.67
556 12 9.6 8.11
579 13 10.4 3.56
595 22 17.6 3.42
including 596 7 5.6 5.59
626 6 4.8 3.1
780 2 1.6 9.58
1535DD359D DD 6,278,180 538,563 208.00 794 -58 301 638 5 4 4.77
669 4 3.2 3.49
707 16 12.8 3.17
including 707 9 7.2 4.43
772 5 4 2.89
1535DD359E DD 6,278,180 538,563 208.00 782.42 -58 301 592 5 4 2.95
614 4 3.2 5.50
621 8 6.4 4.13
639 6 4.8 11.77
652 4 3.2 4.32
684.85 7.15 5.72 4.17
707 20 16 8.36
including 723 4 3.2 27.38
745 3 2.4 9.08
E46D3210 DD 6,279,132 537,936 204.00 585 -61 91.5 173 2 1.83 273.24
1535DD359F DD 6,278,180 538,563 208.00 858 -58 301 620 3 2.4 5.24
718.85 2.15 1.72 6.66
765 22 17.6 5.49
including 766 17 13.6 6.67
1535DD443 DD 6,278,362 538,475 206.58 675 -60 305 566 13 10.4 4.70
For
per
sona
l use
onl
y
APPENDIX 2 – JORC CODE 2012 ASSESSMENT AND REPORTING CRITERIA
Evolution Mining Limited Quarterly Report June 2019 20
Hole ID Hole Type
Northing MGA (m)
Easting MGA (m)
Elevation AHD (m)
Hole Length
(m)
Dip MGA
Azi MGA
From (m)
Inter-val1 (m)
ETW (m)
Au (g/t)
including 569 7 5.6 7.91
645 4 3.2 8.94
660 3 2.4 3.49
1535DD443A DD 6,278,362 538,475 206.58 692 -60 305 550 4 3.2 3.89
582.71 1.29 1.032 35.40
1535DD356 DD 6,276,908 538,030 204.00 719.00 -51 51 80 6 3.42
1535DD361 DD 6,277,315 538,638 206.00 449.60 -51 280 52 4 4.21
1535DD442 DD 6,277,081 538,450 204.00 417.00 -53 73 55 8 6.9 4.81
100 5 1.68
141 2 4.03
1535DD444 DD 6,277,454 538,575 203.70 403.84 -53 289 171 2 16.85
271 6 1.57
8524DD295 DD 6,281,360 520,111 216.00 300 -60 275 67.7 1.4 3.87
Mungari
Hole ID Hole Type
Northing MGA (m)
Easting MGA (m)
Elevation AHD (m)
Hole Length
(m)
Dip MGA
Azi MGA
From (m) Interval1
(m) ETW (m)
Au (g/t)
EVDD0048 DD 6,595,410 333,837 339 499.3 -50 45 227.2 0.9 0.9 102.85
including 227.2 0.3 0.3 230.00
EVDD0046 DD 6,595,374 333,791 341 405.5 -65 45 317.7 0.4 0.4 16.40
EVDD0050 DD 6,595,232 333,943 341 -50 45 Assays pending
MEDD148 DD 6,595,414 333,844 339 993.0 -61.2 65 238.0 1.0 1.0 3.80
EVDD0048 DD 6,595,410 333,837 339 499.3 -50 45 227.2 0.9 0.9 102.85
Drummond JV
Hole ID Hole Type
Northing MGA (m)
Easting MGA (m)
Elevation AHD (m)
Hole Length
(m)
Dip MGA
Azi MGA
From (m) Interval1
(m) ETW (m)
Au (g/t)
Ag (g/t)
BHDD_001 DD 7,722,884 517,413 124.81 399.2 -48 70 No significant intersection
BHDD_003 DD 7,723,278 517,742 242.9 357.6 -48 270 7 3 2.7 3.42 6.7
including 9 1 0.8 9.16 18.1
13 1 0.8 0.35 1.1
45.9 1.1 0.8 0.58 1.1
51 1 0.8 0.2 1.1
52 1 0.8 0.99 1.0
58 0.7 0.6 0.38 0.5
58.7 1 0.8 0.31 0.49
BHDD_005 DD 7,722,953 517,959 131.45 423.5 -48 286 No significant intersection
For
per
sona
l use
onl
y

APPENDIX 2 – JORC CODE 2012 ASSESSMENT AND REPORTING CRITERIA
Evolution Mining Limited Quarterly Report June 2019 21
Cowal
Cowal Section 1 Sampling Techniques and Data
Cowal Section 1 Sampling Techniques and Data
Criteria Explanation Commentary
Sampling techniques • Nature and quality of sampling (e.g. cut channels, random chips, or specific specialised industry standard measurement tools appropriate to the minerals under investigation, such as downhole gamma sondes, handheld XRF instruments, etc.). These examples should not be taken as limiting the broad meaning of sampling.
• Include reference to measures taken to ensure sample representation and the appropriate calibration of any measurement tools or systems used.
• Aspects of the determination of mineralisation that are material to the Public Report.
• In cases where ‘industry standard’ work has been completed this would be relatively simple (e.g. ‘reverse circulation drilling was used to obtain 1 m samples from which 3 kg was pulverised to produce a 30 g charge for fire assay’). In other cases, more explanation may be required, such as where there is coarse gold that has inherent sampling problems, or unusual commodities/mineralisation types (e.g. submarine nodules).
• Holes in this report consist of conventional diamond core drilling.
• Drill holes were positioned strategically to infill gaps in the existing drill data set and test continuity of known lodes/mineralised structures. Collar and down hole surveys were utilised to accurately record final locations. Industry standard sampling, assaying and QA/QC practices were applied to all holes.
• Prior to 2018 drill core was halved with a diamond saw in 1m intervals, irrespective of geological contacts. Since 2018 Sampling to lithological contacts has been implemented. Oxide material that was too soft and friable to be cut with a diamond saw was split with a chisel. Core was cut to preserve the bottom of hole orientation mark and the top half of core sent for analysis to ensure no bias is introduced. RC samples were collected directly from a splitter at the drill rig.
• Sample preparation was conducted by SGS West Wyalong and ALS Orange. Sample preparation consisted of:
• Drying in the oven at 105ºC; crushing in a jaw crusher; fine crushing in a Boyd crusher to 2-3mm; rotary splitting a 3kg assay sub-sample if the sample is too large for the LM5 mill; pulverising in the LM5 mill to nominal; 90% passing 75 µm; and a 50g fire assay charge was taken with an atomic absorption (AA) finish. The detection limit was 0.01 g/t Au.
Drilling technique • Drill type (e.g. core, reverse circulation, open-hole hammer, rotary air blast, auger, Bangka, sonic, etc.) and details (e.g. core diameter, triple or standard tube, depth of diamond tails, face-sampling bit or other type, whether core is oriented and if so, by what method, etc.).
• Diamond drill holes were drilled HQ diameter through the clay/oxide and NQ diameter through the primary rock to end of hole.
• All core in this report has been drilled since 2009 and has been oriented using accepted industry techniques at the time.
Drill sample recovery • Method of recording and assessing core and chip sample recoveries and results assessed.
• Measures taken to maximise sample recovery and ensure representative nature of the samples.
• Whether a relationship exists between sample recovery and grade and whether sample bias may have occurred due to preferential loss/gain of fine/coarse material.
• Provisions are made in the drilling contract to ensure that hole deviation is minimised, and core sample recovery is maximised. Core recovery is recorded in the database. There are no significant core loss or sample recovery issues. Core is reoriented and marked up at 1m intervals. Measurements of recovered core are made and reconciled to the driller’s depth blocks, and if necessary, to the driller’s rod counts.
• There is very no apparent relationship between core-loss and grade. F
or p
erso
nal u
se o
nly

APPENDIX 2 – JORC CODE 2012 ASSESSMENT AND REPORTING CRITERIA
Evolution Mining Limited Quarterly Report June 2019 22
Cowal Section 1 Sampling Techniques and Data
Criteria Explanation Commentary
• Logging • Whether core and chip samples have been geologically and geotechnically logged to a level of detail to support appropriate Mineral Resource estimation, mining studies and metallurgical studies.
• Whether logging is qualitative or quantitative in nature. Core (or costean, channel etc.) photography.
The total length and percentage of the relevant intersections logged.
• Geologists log core for lithology, alteration, structure, and veining. Logging was done directly onto laptop computers via LogChief software which is validated and uploaded directly into the Datashed database.
• The Cowal logging system allows recording of both a primary and a secondary lithology and alteration. Geologists also record the colour, texture, grain size, sorting, rounding, fabric, and fabric intensity characterising each lithological interval.
• The logged structures include faults, shears, breccias, major veins, lithological contacts, and intrusive contacts. Structures are also recorded as point data to accommodate orientation measurements.
• Structural measurements are obtained using a core orientation device. Core is rotated into its original orientation, using the Gyro survey data as a guide. Freiberg compasses and Kenometer Core Orientation tools are used for structural measurements.
• Geologists log vein data including vein frequency, vein percentage of interval, vein type, composition, sulphide percentage per metre, visible gold, sulphide type, and comments relative to each metre logged.
• Geotechnical logging is done by field technicians and geologists. Logging is on a per metre basis and includes percentage core recovery, percentage RQD, fracture count, and an estimate of hardness. The geotechnical data is entered into the database.
• All drill core, once logged, is digitally photographed on a core tray-by-tray basis. The digital image captures all metre marks, the orientation line (BOH) and geologist’s lithology, alteration, mineralogy, and other pertinent demarcations. The geologists highlight geologically significant features such that they can be clearly referenced in the digital images.
Sub-sampling techniques and sample preparation
• If core, whether cut or sawn and whether quarter, half or all core taken.
• If non-core, whether riffled, tube sampled, rotary split, etc. and whether sampled wet or dry.
• For all sample types, the nature, quality and appropriateness of the sample preparation technique.
• Quality control procedures adopted for all sub-sampling stages to maximise representivity of samples.
• Measures taken to ensure that the sampling is representative of the in-situ material collected, including for instance results for field duplicate/second-half sampling.
• Whether sample sizes are appropriate to the grain size of the material being sampled.
• Diamond Core is cut with a diamond saw or chisel. Core is cut to preserve the bottom of hole orientation mark and the top half of core is always sent for analysis to ensure no bias is introduced.
• In 2003 Analytical Solutions Ltd conducted a Review of Sample Preparation, Assay and Quality Control Procedures for Cowal Gold Project. This study, combined with respective operating company policy and standards (North Ltd, Homestake, Barrick and Evolution) formed the framework for the sampling, assaying and QAQC protocols used at Cowal to ensure appropriate and representative sampling.
• Results per interval are reviewed for half core samples and if unexpected or anomalous assays are returned an additional quarter core may be submitted for assay.
Quality of assay data and laboratory tests
• The nature, quality and appropriateness of the assaying and laboratory procedures used and whether the technique is considered partial or total.
• For geophysical tools, spectrometers, handheld XRF instruments etc. the parameters used in determining the analysis including instrument make and model, reading times, calibrations factors applied and their derivation, etc.
• Nature of quality control procedures adopted (e.g. standards, blanks, duplicates, external laboratory checks)
• SGS West Wyalong and ALS Orange are utilised as primary sources of analytical information. Round robin checks are completed regularly between the two laboratories. Both labs operate to international standards and procedures and take part in the Geostatistical Round Robin inter-laboratory test survey. The Cowal QA/QC program comprises blanks, Certified Reference Material (CRM), inter-laboratory duplicate checks, and grind checks.
• 1 in 30 fine crush residue samples has an assay duplicate. 1 in 20 pulp residue samples has an assay duplicate.
• Wet screen grind checks are performed on 1 in 20 pulp residue samples. A blank is submitted 1 in every 38 samples, CRM’s are submitted 1 in every 20 samples. The frequency of repeat assays is set at 1 in 30 samples.
• All sample numbers, including standards and duplicates, are
For
per
sona
l use
onl
y

APPENDIX 2 – JORC CODE 2012 ASSESSMENT AND REPORTING CRITERIA
Evolution Mining Limited Quarterly Report June 2019 23
Cowal Section 1 Sampling Techniques and Data
Criteria Explanation Commentary
and whether acceptable levels of accuracy (i.e. lack of bias) and precision have been established.
pre-assigned by a QA/QC Administrator and given to the sampler on a sample sheet. The QA/QC Administrator monitors the assay results for non-compliance and requests action when necessary. Batches with CRM’s that are outside the ±2SD acceptance criteria are reviewed and re-assayed if definitive bias is determined or if re-assay will make a material difference.
• Material used for blanks is uncertified, sourced locally, comprising fine river gravel which has been determined to be below detection limit. A single blank is submitted every 38 samples. Results are reviewed by the QA/QC Administrator upon receipt for non-compliances. Any assay value greater than 0.1 g/t Au will result in a notice to the laboratory. Blank assays above 0.20 g/t Au result in re-assay of the entire batch. The duplicate assays (Au2) are taken by the laboratory during the subsampling at the crushing and pulverisation stages. The results were analysed using scatter plots and relative percentage difference (RPD) plots. Repeat assays represent approx. 10% of total samples assayed. Typically, there is a large variance at the lower grades which is common for low grade gold deposits, however, the variance decreases to less than 10% for grades above 0.40 g/t Au, which is the cut-off grade used at Cowal.
• Approximately 5% of the pulps, representing a range of expected grades, are submitted to an umpire assay laboratory (ALS Orange) to check for repeatability and precision. Analysis of the data shows that the Principal Laboratory is performing to an acceptable level.
Verification of sampling and assaying
• The verification of significant intersections by either independent or alternative company personnel.
• The use of twinned holes.
• Documentation of primary data, data entry procedures, data verification and data storage (physical and electronic) protocols.
• Discuss any adjustment to assay data
• No dedicated twinning drilling has been conducted for this drill program.
• Cowal uses DataShed software system to maintain the database. Digital assay results are loaded directly into the database. The software performs verification checks including checking for missing sample numbers, matching sample numbers, changes in sampling codes, inconsistent “from-to” entries, and missing fields. Results are not entered into the database until the QA/QC Administrator approves of the results. A QA/QC report is completed for each drill hole and filed with the log, assay sheet, and other appropriate data. Only the Senior Project Geologist and Database Manager have administrator rights to the database. Others can use and sort the database but not save or delete data.
Location of data points
• Accuracy and quality of surveys used to locate drillholes (collar and downhole surveys), trenches, mine workings and other locations used in Mineral Resource estimation.
• Specification of the grid system used.
• Quality and adequacy of topographic control.
• All drill hole collars were surveyed using high definition DGPS. All drill holes were surveyed using a downhole survey camera. The first survey reading was taken near the collar to determine accurate set up and then at regular intervals downhole.
• On completion of each angled drill hole, a down hole gyroscopic (Gyro) survey was conducted. The Gyro tool was referenced to the accurate surface surveyed position of each hole collar.
• The Gyro results were entered into the drill hole database without conversion or smoothing.
• An aerial survey was flown during 2003 by AAM Hatch. This digital data has been combined with surveyed drill hole collar positions and other features (tracks, lake shoreline) to create a digital terrain model (DTM). The survey was last updated in late 2014.
• In 2004, Cowal implemented a new mine grid system with the assistance of AAM Hatch. The current mine grid system covers all areas within the ML and ELs at Cowal with six digits.
Data spacing and distribution
• Data spacing for reporting of Exploration Results.
• Whether the data spacing and distribution is sufficient to establish the degree of geological and grade continuity appropriate for the Mineral Resource and Ore Reserve estimation procedure(s) and classifications applied.
• The exploration drillholes reported in this report are targeted to test for continuity of mineralisation as interpreted from previous drilling. It is not yet known whether this drilling is testing the full extent of the mineralised geological zones. All drilling prior to 2018 is sampled at 1 m intervals down hole. Lithological based sampling was implemented in 2018 with a maximum sample length of 1m and a minimum sample length of 0.3m to avoid sampling across geological boundaries.
For
per
sona
l use
onl
y

APPENDIX 2 – JORC CODE 2012 ASSESSMENT AND REPORTING CRITERIA
Evolution Mining Limited Quarterly Report June 2019 24
Cowal Section 1 Sampling Techniques and Data
Criteria Explanation Commentary
• Whether sample compositing has been applied.
Orientation of data in relation to geological structure
• Whether the orientation of sampling achieves unbiased sampling of possible structures and the extent to which this is known, considering the deposit type.
• If the relationship between the drilling orientation and the orientation of key mineralised structures is considered to have introduced a sampling bias, this should be assessed and reported if material.
• Diamond holes were positioned to optimise intersection angles of the target area. In respect of the drilling at E41W drilling is targeted to drill at right angles to the dominant vein direction however the extent of the vein package is currently unknown.
• The Drilling at Galway Regal is oriented perpendicular to the known mineralised package.
Sample security • The measures taken to ensure sample security.
• Drill contractors are issued with drill instructions by an Evolution geologist. The sheet provides drill hole names, details, sample requirements, and depths for each drill hole. Drill hole sample bags are pre-numbered. The drill holes are sampled by Evolution personnel who prepare sample submission sheets. The submission sheet is then emailed to the laboratory with a unique submission number assigned. This then allows individual drill holes to be tracked.
• An SGS West Wyalong (SGS) representative collects the samples from site twice daily, however, if samples are being sent to another laboratory a local freight company is used to collect the samples from site and deliver them to the laboratory. Upon arrival, the laboratory sorts each crate and compares the received samples with the supplied submission sheet. The laboratory assigns a unique batch number and dispatches a reconciliation sheet for each submission via email. The reconciliation sheet is checked, and any issues addressed. The new batch name and dispatch information is entered into the tracking sheet. The laboratory processes each batch separately and tracks all samples through the laboratory utilising the LIMS system. Upon completion, the laboratory emails Standard Industry Format (SIF) files with the results for each batch to Evolution personnel.
• The assay batch files are checked against the tracking spreadsheet and processed. The drill plan is marked off showing completed drill holes. Any sample or QA/QC issues with the results are tracked and resolved with the laboratory.
• Audits or reviews • The results of any audits or reviews of sampling techniques and data.
• QA/QC Audits of the Primary SGS West Wyalong Laboratory are carried out on an approximately quarterly basis and for the Umpire ASL Orange Laboratory approximately on a six-monthly basis. Any issues are noted and agreed remedial actions assigned and dated for completion.
• Numerous internal audits of the database and systems have been undertaken by site geologists and company technical groups from North Ltd, Homestake, Barrick and Evolution. External audits were conducted in 2003 by RMI and QCS Ltd. and in 2011 and 2014 review and validation was conducted by RPA. MiningOne conducted a review of the Cowal Database in 2016 as part of the peer review process for the Stage H Feasibility Study. Recent audits have found no significant issues with data management systems or data quality.
Cowal Section 2 Reporting of Exploration Results
Cowal Section 2 Reporting of Exploration Results
Criteria Explanation Commentary
Mineral tenement and land tenure status
• Type, reference name/number, location and ownership including agreements or material issues with third parties such as
• The Cowal Mine is located on the western side of Lake Cowal in central New South Wales, approximately 38 km north of West Wyalong and 350 km west of Sydney. Drilling
For
per
sona
l use
onl
y

APPENDIX 2 – JORC CODE 2012 ASSESSMENT AND REPORTING CRITERIA
Evolution Mining Limited Quarterly Report June 2019 25
Cowal Section 2 Reporting of Exploration Results
Criteria Explanation Commentary
joint ventures, partnerships, overriding royalties, native title interests, historical sites, wilderness or national park and environmental settings.
• The security of the tenure held at the time of reporting along with any known impediments to obtaining a licence to operate in the area.
documented in this report was undertaken on ML1535. This Lease is wholly owned by Evolution Mining Ltd. and CGO has all required operational, environmental and heritage permits and approvals for the work conducted on the Lease. There are not any other known significant factors or risks that may affect access, title, or the right or ability to perform further work programs on the Lease.
Exploration done by other parties
• Acknowledgment and appraisal of exploration by other parties.
• The Cowal region has been subject to various exploration and drilling programs by GeoPeko, North Ltd., Rio Tinto Ltd., Homestake and Barrick.
Geology • Deposit type, geological setting and style of mineralisation.
• The Cowal gold deposits (E41, E42, E46, Galway and Regal) occur within the 40 km long by 15 km wide Ordovician Lake Cowal Volcanic Complex, east of the Gilmore Fault Zone within the eastern portion of the Lachlan Fold Belt. There is sparse outcrop across the Lake Cowal Volcanic Complex and, as a consequence, the regional geology has largely been defined by interpretation of regional aeromagnetic and exploration drilling programs.
• The Lake Cowal Volcanic Complex contains potassium rich calc-alkaline to shoshonitic high level intrusive complexes, thick trachyandesitic volcanics, and volcaniclastic sediment piles.
• The gold deposits at Cowal are structurally hosted, epithermal to mesothermal gold deposits occurring within and marginal to a 230 m thick dioritic to gabbroic sill intruding trachy-andesitic volcaniclastic rocks and lavas.
• The overall structure of the gold deposits is complex but in general consists of a faulted antiform that plunges shallowly to the north-northeast. The deposits are aligned along a north-south orientated corridor with bounding faults, the Booberoi Fault on the western side and the Reflector Fault on the eastern side (the Gold Corridor).
Drill hole Information • A summary of all information material to the understanding of the exploration results including a tabulation of the following information for all Material drillholes:
• easting and northing of the drillhole collar
• elevation or RL of the drillhole collar
• dip and azimuth of the hole
• downhole length and interception depth
• hole length.
• Drill hole information is provided in the Drill Hole Information Summary presented in the Appendix 2 of this report.
Data aggregation methods
• In reporting Exploration Results, weighting averaging techniques, maximum and/or minimum grade truncations (e.g. cutting of high grades) and cut-off grades are usually material and should be stated.
• Where aggregate intercepts incorporate short lengths of high grade results and longer lengths of low grade results, the procedure used for such aggregation should be stated and some typical examples of such aggregations should be shown in detail.
• The assumptions used for any reporting of metal equivalent values should be clearly stated.
• Significant intercepts have nominally been calculated based on a minimum interval length of 3m, max internal dilution of 5m and a minimum grade of 0.4g/t Au. However, some intervals with sizable Au grades may be reported individually if appropriate. Au Grades are reported un-cut.
Relationship between mineralisation widths and intercept lengths
• These relationships are particularly important in the reporting of Exploration Results.
• Mineralisation within the drilling area is bounded by large north-south trending structures, however it has strong internally oblique structural controls. Drill holes are typically oriented to optimise the angle of intercept at the target location. All significant intercepts are reported as down hole
For
per
sona
l use
onl
y
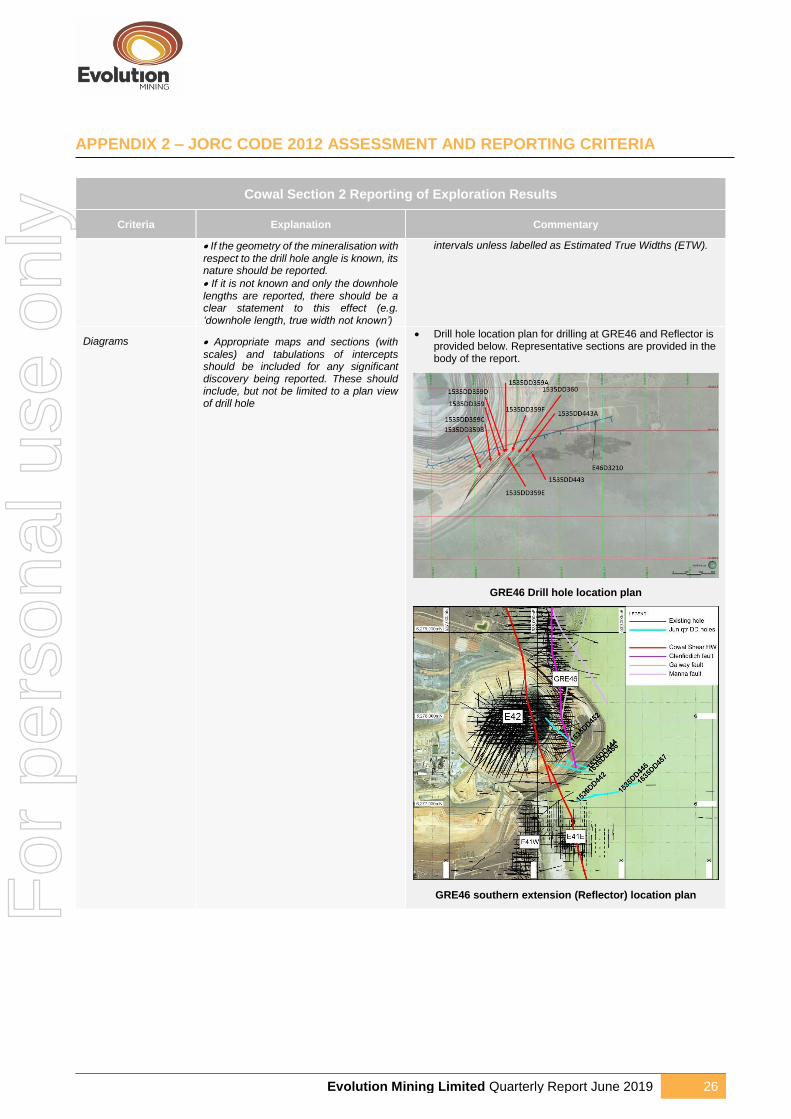
APPENDIX 2 – JORC CODE 2012 ASSESSMENT AND REPORTING CRITERIA
Evolution Mining Limited Quarterly Report June 2019 26
Cowal Section 2 Reporting of Exploration Results
Criteria Explanation Commentary
• If the geometry of the mineralisation with respect to the drill hole angle is known, its nature should be reported.
• If it is not known and only the downhole lengths are reported, there should be a clear statement to this effect (e.g. ‘downhole length, true width not known’)
intervals unless labelled as Estimated True Widths (ETW).
Diagrams • Appropriate maps and sections (with scales) and tabulations of intercepts should be included for any significant discovery being reported. These should include, but not be limited to a plan view of drill hole
• Drill hole location plan for drilling at GRE46 and Reflector is provided below. Representative sections are provided in the body of the report.
GRE46 Drill hole location plan
GRE46 southern extension (Reflector) location plan For
per
sona
l use
onl
y

APPENDIX 2 – JORC CODE 2012 ASSESSMENT AND REPORTING CRITERIA
Evolution Mining Limited Quarterly Report June 2019 27
Cowal Section 2 Reporting of Exploration Results
Criteria Explanation Commentary
Reflector 1535DD442 and 445 cross section
Reflector 1535DD444 cross section
Balanced reporting • Where comprehensive reporting of all Exploration Results is not practicable, representative reporting of both low and high grades and/or widths should be practiced to avoid misleading reporting of Exploration Results
• Significant intercepts reported are only those areas where mineralisation was identified.
• These assay results have not been previously reported.
• All earlier significant assay results have been reported in previous ASX announcements.
• The intercepts reported for this period form part of a larger drill program that was still in progress at the time of writing. Remaining holes are awaiting logging, processing and assays and future significant results will be published as appropriate.
Other substantive exploration data
• Other exploration data, if meaningful and material, should be reported including (but not limited to): geological
• No other substantive data was collected during the report period.
For
per
sona
l use
onl
y

APPENDIX 2 – JORC CODE 2012 ASSESSMENT AND REPORTING CRITERIA
Evolution Mining Limited Quarterly Report June 2019 28
Cowal Section 2 Reporting of Exploration Results
Criteria Explanation Commentary
observations; geophysical survey results; geochemical survey results; bulk samples – size and method of treatment; metallurgical test results; bulk density, groundwater, geotechnical and rock characteristics; potential deleterious or contaminating substances.
Further work • The nature and scale of planned further work (e.g. tests for lateral extensions or depth extensions or largescale step-out drilling).
• Diagrams clearly highlighting the areas of possible extensions, including the main geological interpretations and future drilling areas, provided this information is not commercially sensitive.
• Results from these programs will be incorporated into current models and interpretations and further work will be determined based on the outcomes.
Mungari
Mungari Section 1 Sampling Techniques and Data
Mungari Section 1 Sampling Techniques and Data
Criteria Explanation Commentary
Sampling techniques • Nature and quality of sampling (e.g. cut channels, random chips, or specific specialised industry standard measurement tools appropriate to the minerals under investigation, such as downhole gamma sondes, handheld XRF instruments, etc). These examples should not be taken as limiting the broad meaning of sampling.
• Include reference to measures taken to ensure sample representation and the appropriate calibration of any measurement tools or systems used.
• Aspects of the determination of mineralisation that are material to the Public Report.
• In cases where ‘industry standard’ work has been completed this would be relatively simple (e.g. ‘reverse circulation drilling was used to obtain 1 m samples from which 3 kg was pulverised to produce a 30 g charge for fire assay’). In other cases, more explanation may be required, such as where there is coarse gold that has inherent sampling problems, or unusual commodities/mineralisation types (e.g. submarine nodules).
• Sampling of gold mineralisation at Mungari was undertaken using diamond core (surface) and reverse circulation (RC) drill chips.
• All drill samples were logged prior to sampling. Diamond drill core was sampled to lithological, alteration and mineralisation related contacts, whilst RC samples were collected at 1m downhole intervals. Sampling was carried out according to Evolution protocols and QAQC procedures which comply with industry best practice. All drill-hole collars were surveyed using a total station theodolite or total GPS.
• The sampling and assaying methods are appropriate for the orogenic mineralised system and are representative for the mineralisation style. The sampling and assaying suitability was validated using Evolution’s QAQC protocol and no instruments or tools requiring calibration were used as part of the sampling process.
• RC drilling was sampled to obtain 1m samples using a static cone splitter from which 3 to 5 kg was crushed and pulverised to produce a 30g to 50g subsample for fire assay. Diamond drillcore sample intervals were based on geology to ensure a representative sample, with lengths ranging from 0.2 to 1.2m. Surface diamond drilling was half core sampled. All diamond core samples were dried, crushed and pulverised (total preparation) to produce a 30g to 50g charge for fire assay of Au. A suite of multi elements are determined using four-acid digest with ICP/MS and/or an ICP/AES finish for some sample intervals.
Drilling techniques • Drill type (e.g. core, reverse circulation, open-hole hammer, rotary air blast, auger, Bangka, sonic, etc.) and details (e.g. core diameter, triple or standard tube, depth of diamond tails, face-sampling bit or other type, whether core is oriented and if so, by what method, etc.).
• RC sampling was completed using a 4.5” to 5.5” diameter face sampling hammer. Diamond holes from surface were predominantly wireline NQ2 (50.5mm) or HQ (63.5mm) holes.
• All diamond core from surface core was orientated using the reflex (act II or ezi-ori) tool.
For
per
sona
l use
onl
y

APPENDIX 2 – JORC CODE 2012 ASSESSMENT AND REPORTING CRITERIA
Evolution Mining Limited Quarterly Report June 2019 29
Mungari Section 1 Sampling Techniques and Data
Criteria Explanation Commentary
Drill sample recovery • Method of recording and assessing core and chip sample recoveries and results assessed.
• Measures taken to maximise sample recovery and ensure representative nature of the samples.
• Whether a relationship exists between sample recovery and grade and whether sample bias may have occurred due to preferential loss/gain of fine/coarse material.
• RC drilling sample weights were recorded for selected sample intervals and monitored for fluctuations against the expected sample weight. If samples were below the expected weight, feedback was given promptly to the RC driller to modify drilling practices to achieve the expected weights.
• All diamond core was orientated and measured during processing and the recovery recorded into the drill-hole database. The core was reconstructed into continuous runs on a cradle for orientation marking. Hole depths were checked against the driller’s core blocks.
• Inconsistencies between the logging and the driller’s core depth measurement blocks are investigated. Core recovery has been acceptable. Surface drilling recoveries were generally excellent with the exception of oxide zones however these rarely fell below 90%.
• Measures taken to maximise sample recovery include instructions to drillers to slow down drilling rates or reduce the coring run length in less competent ground.
• Analysis of drill sample bias and loss/gain was undertaken with the Overall Mine Reconciliation performance where available.
Logging • Whether core and chip samples have been geologically and geotechnically logged to a level of detail to support appropriate Mineral Resource estimation, mining studies and metallurgical studies.
• Whether logging is qualitative or quantitative in nature. Core (or costean, channel etc.) photography. The total length and percentage of the relevant intersections logged.
• RC drill chips and diamond core have been geologically logged to the level of detail required for the Mineral Resource estimation, mining studies and metallurgical studies.
• All logging is both qualitative and quantitative in nature recording features such as structural data, RQD, sample recovery, lithology, mineralogy, alteration, mineralisation types, vein density, oxidation state, weathering, colour etc. All holes are photographed wet.
• All RC and diamond holes were logged in entirety from collar to end of hole.
Sub-sampling techniques and sample preparation
• If core, whether cut or sawn and whether quarter, half or all core taken.
• If non-core, whether riffled, tube sampled, rotary split, etc and whether sampled wet or dry.
• For all sample types, the nature, quality and appropriateness of the sample preparation technique.
• Quality control procedures adopted for all sub-sampling stages to maximise representivity of samples.
• Measures taken to ensure that the sampling is representative of the in-situ material collected, including for instance results for field duplicate/second-half sampling.
• Whether sample sizes are appropriate to the grain size of the material being sampled.
• Most diamond core drilled from surface was half core sampled and the remaining half was retained. In the oxide zone, where cutting can wash away samples, some surface holes were full core sampled.
• All RC samples were split by a cone or a riffle splitter and collected into a sequenced calico bag. Any wet samples that could not be riffle split were dried then riffle split.
• Sample preparation of RC and diamond samples was undertaken by external laboratories according to the sample preparation and assaying protocol established to maximise the representation of the Mungari mineralisation. Laboratories performance was monitored as part of Evolution’s QAQC procedure. Laboratory inspections were undertaken to monitor the laboratories compliance to the Mungari sampling and sample preparation protocol.
• The sample and size (2.5kg to 4kg) relative to the particle size (>85% passing 75um) of the material sampled is a commonly utilised practice for effective sample representation for gold deposits within the Eastern Goldfields of Western Australia.
• Quality control procedures adopted to maximise sample representation for all sub-sampling stages include the collection of field and laboratory duplicates and the insertion of certified reference material as assay standards (1 in 20) and the insertion of blank samples (1 in 20) or at the geologist’s discretion. Coarse blank material is routinely submitted for assay and is inserted into each mineralised zone where possible. The quality control performance was monitored as part of Evolution’s QAQC procedure.
• The sample preparation has been conducted by commercial laboratories. All samples are oven dried (between 85°C and 105°C), jaw crushed to nominal <3mm and if required split by a rotary splitter device to a maximum sample weight of 3.5kg as required. The primary sample is then pulverised in a one stage process, using a LM5 pulveriser, to a particle size of >85% passing 75um. Approximately 200g of the primary sample is
For
per
sona
l use
onl
y
APPENDIX 2 – JORC CODE 2012 ASSESSMENT AND REPORTING CRITERIA
Evolution Mining Limited Quarterly Report June 2019 30
Mungari Section 1 Sampling Techniques and Data
Criteria Explanation Commentary
extracted by spatula to a numbered paper pulp bag that is used for a 50g fire assay charge. The pulp is retained and the bulk residue is disposed of after two months.
• Measures taken to ensure sample representation include the collection of field duplicates during RC drilling at a frequency rate of 5%. Duplicate samples for both RC chips and diamond core are collected during the sample preparation pulverisation stage. A comparison of the duplicate sample vs. the primary sample assay result was undertaken as part of Evolution’s QAQC protocol. It is considered that all sub-sampling and lab preparations are consistent with other laboratories in Australia and are satisfactory for the intended purpose.
• The sample sizes are considered appropriate and in line with industry standards.
Quality of assay data and laboratory tests
• The nature, quality and appropriateness of the assaying and laboratory procedures used and whether the technique is considered partial or total.
• For geophysical tools, spectrometers, handheld XRF instruments etc. the parameters used in determining the analysis including instrument make and model, reading times, calibrations factors applied and their derivation, etc.
• Nature of quality control procedures adopted (eg standards, blanks, duplicates, external laboratory checks) and whether acceptable levels of accuracy (i.e. lack of bias) and precision have been established.
• The sampling preparation and assaying protocol used at Mungari was developed to ensure the quality and suitability of the assaying and laboratory procedures relative to the mineralisation types.
• Fire assay is designed to measure the total gold within a sample. Fire assay has been confirmed as a suitable technique for orogenic type mineralisation. It has been extensively used throughout the Goldfields region. Screen fire assay and LeachWELL / bottle roll analysis techniques have also been used to validate the fire assay techniques.
• The technique utilised a 30g, 40g or 50g sample charge with a lead flux, which is decomposed in a furnace with the prill being totally digested by 2 acids (HCI and HN03) before the gold content is determined by an AAS machine.
• No geophysical tools or other remote sensing instruments were utilised for reporting or interpretation of gold mineralisation.
• Quality control samples were routinely inserted into the sampling sequence and were also inserted either inside or around the expected zones of mineralisation. The intent of the procedure for reviewing the performance of certified standard reference material is to examine for any erroneous results (a result outside of the expected statistically derived tolerance limits) and to validate if required; the acceptable levels of accuracy and precision for all stages of the sampling and analytical process. Typically, batches which fail quality control checks are re-analysed.
Verification of sampling and assaying
• The verification of significant intersections by either independent or alternative company personnel.
• The use of twinned holes.
• Documentation of primary data, data entry procedures, data verification and data storage (physical and electronic) protocols.
• Discuss any adjustment to assay data
• Independent internal or external verification of significant intercepts is not routinely completed. The quality control / quality assurance (QAQC) process ensures the intercepts are representative for the orogenic gold systems. Half core and sample pulps are retained at Mungari if further verification is required.
• The twinning of holes is not a common practice undertaken at Mungari. The face sample and drill hole data with the mill reconciliation data is of sufficient density to validate neighbouring samples. Data which is inconsistent with the known geology undergoes further verification to ensure its quality.
• All sample and assay information is stored utilising the acQuire database software system. Data undergoes QAQC validation prior to being accepted and loaded into the database. Assay results are merged when received electronically from the laboratory. The geologist reviews the database checking for the correct merging of results and that all data has been received and entered. Any adjustments to this data are recorded permanently in the database. Historical paper records (where available) are retained in the exploration and mining offices.
• No adjustments or calibrations have been made to the final assay data reported by the laboratory.
Location of data points
• Accuracy and quality of surveys used to locate drillholes (collar and downhole surveys), trenches, mine workings and
• All surface drill holes at Mungari have been surveyed for easting, northing and reduced level. Recent data is collected and stored in MGA 94 Zone 51 and AHD.
For
per
sona
l use
onl
y

APPENDIX 2 – JORC CODE 2012 ASSESSMENT AND REPORTING CRITERIA
Evolution Mining Limited Quarterly Report June 2019 31
Mungari Section 1 Sampling Techniques and Data
Criteria Explanation Commentary
other locations used in Mineral Resource estimation.
• Specification of the grid system used.
• Quality and adequacy of topographic control.
• Resource drill hole collar positions are surveyed by the site-based survey department or contract surveyors (utilising a differential GPS or conventional surveying techniques, with reference to a known base station) with a precision of less than 0.2m variability.
• Topographic control was generated from aerial surveys and detailed Lidar surveys to 0.2m accuracy.
Data spacing and distribution
• Data spacing for reporting of Exploration Results.
• Whether the data spacing and distribution is sufficient to establish the degree of geological and grade continuity appropriate for the Mineral Resource and Ore Reserve estimation procedure(s) and classifications applied.
• Whether sample compositing has been applied.
• The nominal drill spacing for Exploration drilling is 80m x 80m or wider and for Resource Definition is 40m x 40m or in some areas 20m x 20m. This spacing includes data that has been verified from previous exploration activities on the project.
• Data spacing and distribution is considered sufficient for establishing geological continuity and grade variability appropriate for classifying a Mineral Resource.
• Sample compositing was not applied due to the often-narrow mineralised zones.
Orientation of data in relation to geological structure
• Whether the orientation of sampling achieves unbiased sampling of possible structures and the extent to which this is known, considering the deposit type.
• If the relationship between the drilling orientation and the orientation of key mineralised structures is considered to have introduced a sampling bias, this should be assessed and reported if material.
• Mineralisation at Boomer is hosted within a steeply dipping NNW-SSE structure that is vertical or dipping steeply (~70 degrees) to the west. Surface drilling intersect the mineralisation at an angle to minimise bias.
• Drilling is planned at Castle Hill to intersect ore domains in an orientation that does not introduce sample bias. Several orientations were drilled to target different zones of mineralisation and to assess the effect on sampling variably oriented vein sets. It has been noted that the westerly dipping vein set has not been effectively tested in some parts of the model. Evolution Mining drilled several holes in 2016 to the east which provided more favourable intersection angles and tested additional vein sets in some areas. Structural information gained from this program in conjunction with pit mapping has informed the search orientation and Resource classification in the estimate and will contribute to planning future drilling. Some local bias exists but in the context of a global estimate is not considered material.
• Surface holes typically intersect at an angle to the mineralisation and there is no observed bias associated with drilling orientation.
• The relationship between the drilling orientation and the orientation of key mineralised structures at Mungari is not considered to have introduced a sampling bias and is not considered to be material.
• Resource Definition and Exploration drilling is typically planned to intersect ore domains in an orientation that does not introduce sample bias. A small number of holes are drilled at sub-optimal orientations to test for alternate geological interpretations.
Sample security • The measures taken to ensure sample security.
• Chain of custody protocols to ensure the security of samples are followed. Prior to submission samples are retained on site and access to the samples is restricted. Collected samples are dropped off at the respective commercial laboratories in Kalgoorlie. The laboratories are contained within a secured/fenced compound. Access into the laboratory is restricted and movements of personnel and the samples are tracked under supervision of the laboratory staff. During some drill campaigns some samples are collected directly from site by the commercial laboratory. While various laboratories have been used, the chain of custody and sample security protocols have remained similar.
Audits or reviews • The results of any audits or reviews of sampling techniques and data.
• The Mungari geology and drilling database was reviewed by acQuire in December 2015 and no material issues were identified.
• Oscillating cone splitters has been in use in the White Foil Pit for grade control and has returned more consistent duplicate sample weights than a standard static cone splitter. Trials in the exploration environment are ongoing.
For
per
sona
l use
onl
y

APPENDIX 2 – JORC CODE 2012 ASSESSMENT AND REPORTING CRITERIA
Evolution Mining Limited Quarterly Report June 2019 32
Mungari Section 2 Reporting of Exploration Results
Mungari Section 2 Reporting of Exploration Results
Criteria Explanation Commentary
Mineral tenement and land tenure status
• Type, reference name/number, location and ownership including agreements or material issues with third parties such as joint ventures, partnerships, overriding royalties, native title interests, historical sites, wilderness or national park and environmental settings.
• The security of the tenure held at the time of reporting along with any known impediments to obtaining a licence to operate in the area.
• Resource Definition drilling was undertaken on the following tenements: M15/0688, M16/0024, M16/0033, M16/0040, M16/0139, M16/0183, M16/0344.
• Exploration drilling was undertaken on the following tenements: M15/0688, M16/0019, M16/0538, M24/0195, M24/0196, M24/0274, M24/0274, M24/0388, P16/2683, P24/4124, P24/4125, P24/4885.
• All tenements are in good standing and no known impediments exist. Prospecting leases with imminent expiries will have mining lease applications submitted in due course.
Exploration done by other parties
• Acknowledgment and appraisal of exploration by other parties.
• Exploration has been carried out by a number of parties including Electrum Resources NL (1985-1989), Castle Hill Resources NL (1989-1996), Goldfields Exploration Ltd (2001) and Cazaly Resources Ltd (2004-2008). The historical data and database have been reviewed by Cube and is deemed to be of acceptable quality for Mineral Resource estimation.
• The initial discovery of Frog’s Leg was made by Mines and Resources Australia Ltd who was a precursor company to La Mancha Resources Australia Pty Ltd. The deposit was discovered in 2000 as a result of following up on regional anomalism identified through rotary air blast (RAB) and aircore drilling. La Mancha was acquired by Evolution in August 2015.
• Significant historical work has been performed across the Regional Tenement package by numerous parties since the original discovery of gold in the region c.1890. Recent exploration commenced during the 1970’s onwards and has included exploration for base metal and gold mineralisation.
Geology • Deposit type, geological setting and style of mineralisation.
• The Boomer prospect is located in the southern portion of the Kundana mining area, within the Achaean Norseman-Wiluna greenstone belt of the Eastern Goldfields Province. The Kundana gold deposits are structurally related to the Zuleika Shear Zone, a regional NNW-trending shear zone that juxtaposes the Ora Banda domain to the east and the Coolgardie domain to the west. The Boomer prospect is located on the sheared contact between the Black Flag Group turbidites and andesites and andesitic volcaniclastic rocks of Black Flag Group.
Drill hole Information • A summary of all information material to the understanding of the exploration results including a tabulation of the following information for all Material drillholes: o easting and northing of the drillhole collar o elevation or RL of the drillhole collar o dip and azimuth of the hole o downhole length and interception depth o hole length.
• Refer to the drill hole information table in the Appendix 2 of this report.
Data aggregation methods
• In reporting Exploration Results, weighting averaging techniques, maximum and/or minimum grade truncations (e.g. cutting of high grades) and cut-off grades are usually material and should be stated.
• Where aggregate intercepts incorporate short lengths of high-grade results and longer lengths of low-grade results, the procedure used for such aggregation should be stated and some
• Intercept length weighted average techniques, minimum grade truncations and cut-off grades have been used in this report.
• At Boomer composite grades of > 1 g/t have been reported.
• Composite lengths and grade as well as internal significant values are reported in Appendix.
• No metal equivalent values are used.
For
per
sona
l use
onl
y

APPENDIX 2 – JORC CODE 2012 ASSESSMENT AND REPORTING CRITERIA
Evolution Mining Limited Quarterly Report June 2019 33
Mungari Section 2 Reporting of Exploration Results
Criteria Explanation Commentary
typical examples of such aggregations should be shown in detail.
• The assumptions used for any reporting of metal equivalent values should be clearly stated.
Relationship between mineralisation widths and intercept lengths
• These relationships are particularly important in the reporting of Exploration Results.
• If the geometry of the mineralisation with respect to the drill hole angle is known, its nature should be reported.
• If it is not known and only the downhole lengths are reported, there should be a clear statement to this effect (e.g. ‘downhole length, true width not known’)
• There is a direct relationship between the mineralisation widths and intercept widths at Mungari.
• The assay results are reported as down hole intervals however an estimate of true width is provided in Appendix.
Diagrams • Appropriate maps and sections (with scales) and tabulations of intercepts should be included for any significant discovery being reported. These should include, but not be limited to a plan view of drill hole.
• Drill hole location diagrams and representative sections of reported exploration results are provided either below or in the body of this report.
Balanced reporting • Where comprehensive reporting of all Exploration Results is not practicable, representative reporting of both low and high grades and/or widths should be practiced to avoid misleading reporting of Exploration Results.
• All Exploration and Resource Definition results have been reported in the Drill Hole Information Summary in the Appendix 2 of this report.
Other substantive exploration data
• Other exploration data, if meaningful and material, should be reported including (but not limited to): geological observations; geophysical survey results; geochemical survey results; bulk samples – size and method of treatment; metallurgical test results; bulk density, groundwater, geotechnical and rock characteristics; potential deleterious or contaminating substances.
• A substantial Exploration and Resource Definition program is on-going at the Mungari site. Other works include field mapping and geophysical surveys.
Further work • The nature and scale of planned further work (e.g. tests for lateral extensions or depth extensions or largescale step-out drilling).
• Diagrams clearly highlighting the areas of possible extensions, including the main geological interpretations and future drilling areas, provided this information is not commercially sensitive.
• Further Exploration, Near Mine Exploration and Resource Definition work on the Mungari tenements are planned for FY20
Drummond JV
Drummond JV Section 1 Sampling Techniques and Data
Drummond JV Section 1 Sampling Techniques and Data
Criteria Explanation Commentary
Sampling techniques • Nature and quality of sampling (e.g. cut channels, random chips, or specific specialised industry standard
• Sampling of Au-Ag mineralisation at the Drummond JV was undertaken using diamond core (surface).
• All drill samples were logged prior to sampling. Diamond drill
For
per
sona
l use
onl
y

APPENDIX 2 – JORC CODE 2012 ASSESSMENT AND REPORTING CRITERIA
Evolution Mining Limited Quarterly Report June 2019 34
Drummond JV Section 1 Sampling Techniques and Data
Criteria Explanation Commentary
measurement tools appropriate to the minerals under investigation, such as downhole gamma sondes, handheld XRF instruments, etc). These examples should not be taken as limiting the broad meaning of sampling.
• Include reference to measures taken to ensure sample representation and the appropriate calibration of any measurement tools or systems used.
• Aspects of the determination of mineralisation that are material to the Public Report.
• In cases where ‘industry standard’ work has been completed this would be relatively simple (e.g. ‘reverse circulation drilling was used to obtain 1 m samples from which 3 kg was pulverised to produce a 30 g charge for fire assay’). In other cases more explanation may be required, such as where there is coarse gold that has inherent sampling problems, or unusual commodities/mineralisation types (e.g. submarine nodules).
core was sampled to lithological, alteration and mineralisation related contacts. Sampling was carried out according to Evolution protocols and QAQC procedures which comply with industry best practice. All drill-hole collars were surveyed using a handheld GPS.
• The sampling and assaying methods are appropriate for the epithermal style mineralised system targeted and are representative for the mineralisation style. The sampling and assaying suitability was validated using Evolution’s QAQC protocol and no instruments or tools requiring calibration were used as part of the sampling process.
• Diamond drillcore sample intervals were based on geology to ensure a representative sample, with lengths ranging from 0.4m to 1.2m. Surface diamond drilling was half core sampled. All diamond core samples were dried, crushed and pulverised (total preparation) to produce a 50g charge for fire assay of Au. Ag and As were also assayed for in addition to Au assays using four-acid digest with ICP/AES finish. A suite of additional multi elements are determined using four-acid digest with ICP/MS and/or an ICP/AES finish for some sample intervals.
Drilling techniques • Drill type (eg core, reverse circulation, open-hole hammer, rotary air blast, auger, Bangka, sonic, etc.) and details (e.g. core diameter, triple or standard tube, depth of diamond tails, face-sampling bit or other type, whether core is oriented and if so, by what method, etc.).
• Diamond holes from surface were wireline NQ2 (50.5mm) or HQ (63.5mm) holes.
• All diamond core from surface core was orientated using the Reflex (act II or ezi-ori) tool.
Drill sample recovery • Method of recording and assessing core and chip sample recoveries and results assessed.
• Measures taken to maximise sample recovery and ensure representative nature of the samples.
• Whether a relationship exists between sample recovery and grade and whether sample bias may have occurred due to preferential loss/gain of fine/coarse material.
• All diamond core was orientated and measured during processing and the recovery recorded into the drill-hole database. The core was reconstructed into continuous runs on a cradle for orientation marking. Hole depths were checked against the driller’s core blocks.
• Inconsistencies between the logging and the driller’s core depth measurement blocks are investigated. Core recovery has been acceptable. Surface drilling recoveries were generally excellent.
• Measures taken to maximise sample recovery include instructions to drillers to slow down drilling rates or reduce the coring run length in less competent ground such as veining.
Logging • Whether core and chip samples have been geologically and geotechnically logged to a level of detail to support appropriate Mineral Resource estimation, mining studies and metallurgical studies.
• Whether logging is qualitative or quantitative in nature. Core (or costean, channel etc.) photography. The total length and percentage of the relevant intersections logged.
• Diamond core have been geologically logged to the level of detail required for Mineral Resource estimation.
• All logging is both qualitative and quantitative in nature recording features such as structural data, sample recovery, lithology, mineralogy, alteration, mineralisation types, vein density, oxidation state, weathering, colour etc. All holes are photographed wet.
• All diamond holes were logged in entirety from collar to end of hole.
Sub-sampling techniques and sample preparation
• If core, whether cut or sawn and whether quarter, half or all core taken.
• If non-core, whether riffled, tube sampled, rotary split, etc and whether sampled wet or dry.
• Diamond core drilled from surface was half core sampled and the remaining half was retained.
• Sample preparation of diamond samples was undertaken by external laboratories according to the sample preparation and assaying protocol established to maximise the representation of low-sulfidation epithermal style Au-Ag mineralisation. Laboratories performance was monitored as part of Evolution’s QAQC procedure. Laboratory inspections are routinely
For
per
sona
l use
onl
y

APPENDIX 2 – JORC CODE 2012 ASSESSMENT AND REPORTING CRITERIA
Evolution Mining Limited Quarterly Report June 2019 35
Drummond JV Section 1 Sampling Techniques and Data
Criteria Explanation Commentary
• For all sample types, the nature, quality and appropriateness of the sample preparation technique.
• Quality control procedures adopted for all sub-sampling stages to maximise representivity of samples.
• Measures taken to ensure that the sampling is representative of the in situ material collected, including for instance results for field duplicate/second-half sampling.
• Whether sample sizes are appropriate to the grain size of the material being sampled.
undertaken to monitor the laboratories compliance sampling and sample preparation protocol.
• The sample and size (2.5kg to 4kg) relative to the particle size (>85% passing 75um) of the material sampled is a commonly utilised practice for effective sample representation for epithermal gold deposits.
• Quality control procedures adopted to maximise sample representation for all sub-sampling stages include the collection of field and laboratory duplicates and the insertion of certified reference material as assay standards (1 in 20) and the insertion of blank samples (1 in 20) or at the geologist’s discretion. Certified blank material is routinely submitted for assay and is inserted into each mineralised zone where possible. The quality control performance was monitored as part of Evolution’s QAQC procedure.
• The sample preparation has been conducted by commercial laboratories. All samples are oven dried (between 85°C and 105°C), jaw crushed to nominal <3mm and if required split by a riffle splitter device to a maximum sample weight of 3kg as required. The primary sample is then pulverised in a one stage process, using a LM5 pulveriser, to a particle size of >85% passing 75um. Approximately 200g of the primary sample is extracted by spatula to a numbered paper pulp bag that is used for a 50g fire assay charge. The pulp is retained and the bulk residue is disposed of after two months.
• Duplicate samples for diamond core are collected during the sample preparation pulverisation stage. A comparison of the duplicate sample vs. the primary sample assay result was undertaken as part of Evolution’s QAQC protocol. It is considered that all sub-sampling and lab preparations are consistent with other laboratories in Australia and are satisfactory for the intended purpose.
• The sample sizes are considered appropriate and in line with industry standards.
Quality of assay data and laboratory tests
• The nature, quality and appropriateness of the assaying and laboratory procedures used and whether the technique is considered partial or total.
• For geophysical tools, spectrometers, handheld XRF instruments etc. the parameters used in determining the analysis including instrument make and model, reading times, calibrations factors applied and their derivation, etc.
• Nature of quality control procedures adopted (eg standards, blanks, duplicates, external laboratory checks) and whether acceptable levels of accuracy (i.e. lack of bias) and precision have been established.
• The sampling preparation and assaying protocol used at the Drummond JV was developed to ensure the quality and suitability of the assaying and laboratory procedures relative to the mineralisation types targeted.
• Fire assay is designed to measure the total gold within a sample. Fire assay has been confirmed as a suitable technique for epithermal type Au - Ag mineralisation. It has been extensively used throughout the Drummond region.
• The technique utilised a 50g sample charge with a lead flux, which is decomposed in a furnace with the prill being totally digested by 2 acids (HCI and HN03) before the gold content is determined by an AAS machine.
• No geophysical tools or other remote sensing instruments were utilised for reporting or interpretation of gold mineralisation.
• Quality control samples were routinely inserted into the sampling sequence and were also inserted either inside or around the expected zones of mineralisation. The intent of the procedure for reviewing the performance of certified standard reference material is to examine for any erroneous results (a result outside of the expected statistically derived tolerance limits) and to validate if required; the acceptable levels of accuracy and precision for all stages of the sampling and analytical process. Typically, batches which fail quality control checks are re-analysed.
Verification of sampling and assaying
• The verification of significant intersections by either independent or alternative company personnel.
• The use of twinned holes.
• Documentation of primary data, data entry procedures, data verification and
• Independent internal or external verification of significant intercepts is not routinely completed. The quality control / quality assurance (QAQC) process ensures the intercepts are representative for epithermal gold systems. Half core and sample pulps are retained at Drummond if further verification is required.
• All sample and assay information is stored utilising the acQuire database software system. Data undergoes QAQC validation prior to being accepted and loaded into the database. Assay
For
per
sona
l use
onl
y

APPENDIX 2 – JORC CODE 2012 ASSESSMENT AND REPORTING CRITERIA
Evolution Mining Limited Quarterly Report June 2019 36
Drummond JV Section 1 Sampling Techniques and Data
Criteria Explanation Commentary
data storage (physical and electronic) protocols.
• Discuss any adjustment to assay data
results are merged when received electronically from the laboratory. The geologist reviews the database checking for the correct merging of results and that all data has been received and entered. Any adjustments to this data are recorded permanently in the database. Historical paper records (where available) are retained in the exploration offices.
• No adjustments or calibrations have been made to the final assay data reported by the laboratory.
Location of data points
• Accuracy and quality of surveys used to locate drillholes (collar and downhole surveys), trenches, mine workings and other locations used in Mineral Resource estimation.
• Specification of the grid system used.
• Quality and adequacy of topographic control.
• All surface drill holes at Drummond have been surveyed for easting, northing and reduced level. Recent data is collected and stored in MGA 94 Zone 55.
• Topographic control was generated from aerial surveys and from previous drilling data sets.
Data spacing and distribution
• Data spacing for reporting of Exploration Results.
• Whether the data spacing and distribution is sufficient to establish the degree of geological and grade continuity appropriate for the Mineral Resource and Ore Reserve estimation procedure(s) and classifications applied.
• Whether sample compositing has been applied.
• The nominal drill spacing for Exploration drilling is 100m x 100m or wider. This spacing includes data that has been verified from previous exploration activities on the project.
• Data spacing and distribution is not considered sufficient for establishing geological continuity and grade variability appropriate for classifying a Mineral Resource.
• Sample compositing was not applied due to the often-narrow mineralised zones.
Orientation of data in relation to geological structure
• Whether the orientation of sampling achieves unbiased sampling of possible structures and the extent to which this is known, considering the deposit type.
• If the relationship between the drilling orientation and the orientation of key mineralised structures is considered to have introduced a sampling bias, this should be assessed and reported if material.
• Mineralisation drilled previously in the Bunyip area is interpreted to be hosted within a number of NNW-SSE striking veins that are vertical or dipping steeply (~80 degrees) to the east. Surface drilling has been designed to intersect the mineralisation at an angle to minimise bias. Some drilling has been designed to test for multiple orientations in the veins that could occur given the early stage of exploration and understanding of the geology at depth.
• Surface holes typically intersect at an angle to the mineralisation and there is no observed bias associated with drilling orientation.
• The relationship between the drilling orientation and the orientation of the mineralised structures at Bunyip is not considered to have introduced a sampling bias and is not considered to be material.
Sample security • The measures taken to ensure sample security.
• Chain of custody protocols to ensure the security of samples are followed. Prior to submission samples are retained on site and access to the samples is restricted. Collected samples are dropped off at the respective commercial laboratories in Townsville. The laboratories are contained within a secured/fenced compound. Access into the laboratory is restricted and movements of personnel and the samples are tracked under supervision of the laboratory staff.
Audits or reviews • The results of any audits or reviews of sampling techniques and data.
Drummond JV Section 2 Reporting of Exploration Results
For
per
sona
l use
onl
y

APPENDIX 2 – JORC CODE 2012 ASSESSMENT AND REPORTING CRITERIA
Evolution Mining Limited Quarterly Report June 2019 37
Drummond JV Section 2 Reporting of Exploration Results
Criteria Explanation Commentary
Mineral tenement and land tenure status
• Type, reference name/number, location and ownership including agreements or material issues with third parties such as joint ventures, partnerships, overriding royalties, native title interests, historical sites, wilderness or national park and environmental settings.
• The security of the tenure held at the time of reporting along with any known impediments to obtaining a licence to operate in the area.
• EPM25560 (the Exploration Permit) hosts the Bunyip prospect where the drilling in this report has taken place. EPM25560 is located on the northern side of the Burdekin Falls Dam townsite, approximately 58 km south of Ravenswood and 144 km south of Townsville. This Lease is wholly owned by Adelaide Exploration Proprietary Ltd. (a wholly owned subsidiary of Andromeda Metals Ltd.) but operated by Evolution Mining Ltd. under an earn-in joint-venture agreement signed in in September 2018. Evolution Mining Ltd. has all the required operational, environmental and heritage permits and approvals for the work conducted on the Exploration Permit under the joint-venture. There are not any other known significant factors or risks that may affect access, title, or the right or ability to perform further work programs on the Exploration Permit.
Exploration done by other parties
• Acknowledgment and appraisal of exploration by other parties.
• Exploration has been carried out by a number of parties for gold and base metals over EPM25560 areas including Hydro Mineral Development (1968-1970), Laskan Minerals Pty Ltd. (1969 – 1972), Cormepar Minerals Pty Lrd. (1973 – 1974), Carpentaria Exploration Company (1976 – 1978), CRA Exploration Pty Ltd. (1985), Hunter Resources (1986 – 1992), Millaroo Mines Pty Ltd. (1987-1988), ACM Gold Limited (1989-1990), Austmin Gold NL (1991-1992), Poseidon Gold Limited (1990-1995), China Yunnan Ltd (2006-2010) and Andromeda Metals Ltd. (2018).
• Previous exploration activities include stream sediment sampling, soil sampling, geological mapping and RC drilling.
Geology • Deposit type, geological setting and style of mineralisation.
• Bunyip mineralisation is located within the Drummond Basin stratigraphy which is host to other low-sulfidation epithermal Au-Ag mineralisation such as the Pajingo vein field located ~60km west of the Drummond JV tenements.
• The local geology at Bunyip comprises the Stones Creek Volcanics, overlain by the Scartwater Formation. Mineralisation is associated with low-sulfidation epithermal quartz veins developed within the Stones Creek Volcanics in coherent and fragmental dacite. Quartz veins are interpreted to occur on extensional structures within the dacite.
Drill hole Information • A summary of all information material to the understanding of the exploration results including a tabulation of the following information for all Material drillholes: o easting and northing of the drillhole collar o elevation or RL of the drillhole collar o dip and azimuth of the hole o downhole length and interception depth o hole length.
• Refer to the drill hole information table in the Appendix of this report.
Data aggregation methods
• In reporting Exploration Results, weighting averaging techniques, maximum and/or minimum grade truncations (e.g. cutting of high grades) and cut-off grades are usually material and should be stated.
• Where aggregate intercepts incorporate short lengths of high grade results and longer lengths of low grade results, the procedure used for such aggregation should be stated and some typical examples of such aggregations should be shown in detail.
• The assumptions used for any reporting of metal equivalent values should be clearly stated.
• Intercept length weighted average techniques, minimum grade truncations and cut-off grades have been used in this report.
• Composite lengths and grade as well as internal significant values are reported in Appendix.
• At Bunyip, composite grades > 0.2 g/t Au have been reported.
• No metal equivalent values are used.
For
per
sona
l use
onl
y

APPENDIX 2 – JORC CODE 2012 ASSESSMENT AND REPORTING CRITERIA
Evolution Mining Limited Quarterly Report June 2019 38
Drummond JV Section 2 Reporting of Exploration Results
Criteria Explanation Commentary
Relationship between mineralisation widths and intercept lengths
• These relationships are particularly important in the reporting of Exploration Results.
• If the geometry of the mineralisation with respect to the drill hole angle is known, its nature should be reported.
• If it is not known and only the downhole lengths are reported, there should be a clear statement to this effect (eg ‘downhole length, true width not known’)
• There is a direct relationship between the mineralisation widths and intercept widths at Bunyip.
• The assay results are reported as down hole intervals however an estimate of true width is provided in Appendix.
Diagrams • Appropriate maps and sections (with scales) and tabulations of intercepts should be included for any significant discovery being reported. These should include, but not be limited to a plan view of drill hole
• Drill hole location diagrams and representative sections of reported Bunyip exploration results are provided below.
Location plan of Drill holes for June quarter
Section of Drill holes for June quarter
For
per
sona
l use
onl
y

APPENDIX 2 – JORC CODE 2012 ASSESSMENT AND REPORTING CRITERIA
Evolution Mining Limited Quarterly Report June 2019 39
Drummond JV Section 2 Reporting of Exploration Results
Criteria Explanation Commentary
Balanced reporting • Where comprehensive reporting of all Exploration Results is not practicable, representative reporting of both low and high grades and/or widths should be practiced to avoid misleading reporting of Exploration Results
• All Exploration results have been reported in the Drill Hole Information Summary in the Appendix 2 of this report.
Other substantive exploration data
• Other exploration data, if meaningful and material, should be reported including (but not limited to): geological observations; geophysical survey results; geochemical survey results; bulk samples – size and method of treatment; metallurgical test results; bulk density, groundwater, geotechnical and rock characteristics; potential deleterious or contaminating substances.
• Exploration is on-going at the Drummond JV. Other works include field mapping, soil sampling and geophysical surveys in the region.
Further work • The nature and scale of planned further work (eg tests for lateral extensions or depth extensions or largescale step-out drilling).
• Diagrams clearly highlighting the areas of possible extensions, including the main geological interpretations and future drilling areas, provided this information is not commercially sensitive.
• Further Exploration work on the Drummond JV tenements are planned for FY20. This work includes geological mapping, soil sampling and geophysical surveys.
• There is no further drilling directly planned at the Bunyip prospect pending receipt of all drill results and final geological interpretations.
For
per
sona
l use
onl
y