the fangs of protectionism - arthayantra.com fangs of protectionism the us begins a trade war that...
TRANSCRIPT

Monetary Policy
Equity
Bullion
Investment Strategy
Global Economy
Inside Story
Commodities
The Fangs of ProtectionismThe US begins a trade war that could threaten economic growth across the world.
NewsletterMarch 2018 EDITION

1
Inflation is picking up, growth has picked up, but protectionism tends to reverse these gains
The GDP numbers of most of the countries were released in the previous month. Most of the economies had recorded a growth in GDP. While it would seem that the world economies are recovering from a decade long slump, there are multiple factors that could sustain or hamper this growth. Among the key factors include the inflation in various economies, future of global trade with rising protectionism and political conditions.
The GDP of the European Union grew by 0.6% in the quarter that ended in December 2017 . The GDP of United Kingdom which is in the process of exiting the European Union, grew by 0.4% for the same period. The Unemploy-ment rate of United KIngdom and European Union is at a steady rate and much lower than what it was a decade ago before the financial crisis. The European Central Bank is currently purchasing about €30 billion worth of bonds in the financial markets to keep the borrowing costs low and these purchases are expected to continue until the end of September 2018 or beyond depending on whether the inflation crosses the 2% mark. The inflation of European Union which stood at 1.3% in the month of
January, further slowed to 1.1% in February 2018. The primary reason for this declining inflation being the weakening of oil prices. A key factor that will determine the inflation is the global trade.
In the last couple of weeks comments were made by key members of United States admin-istration suggesting trade wars. US Treasury Secretary Steven Mnuchin claimed weak dollar as good for the economy. This implies that the American economy is trying to weaken its dollar so that it can become much more com-petitive in terms of exports. US President Donald Trump also imposed taxes on alumi-num and steel imports except from those of Canada and Mexico.
The European Union and east Asian econo-mies including China, Japan and South Korea has manufacturing competencies against the United States in these metals. With the imposi-tion of this tax the cost of importing these metals to the USA goes up, and consequently there is additional availability of these metals in the global markets.
Monetary Policy

Monetary Policy 03
The higher price of these metals in the US could aid in raising the inflation in the US, while the global inflation might weaken unless there is a buyer for these metals to compensate for the reduced buying from USA.
The core inflation of the USA stood at 1.8% in the month of January as well as February 2018. The headline inflation however stood at 2.2% for the same month. The US’s GDP grew by 2.5% in the quarter ending Dec 2017. Indica-tors suggest that the GDP growth may not sus-tain in the US considering the fact that the GDP growth for the quarter ending September stood at 3.2%. Although 313,000 jobs were added in the month of February 2018 with a wage growth of 2.6%, other indicators such as retail sale, home sales, durable goods and other industrial production declined in January 2018.
In addition to this goods trade deficit widened last month as exports fell despite few coun-tries lowering duties for US goods. With the US president stating that they will be indulging in trade wars, further decline in US exports can be expected as reciprocation from some of the other economies can also be expected. For example the President of the European Coun-cil Jean-Claude Juncker stated that he will also raise tariffs on some of the goods that will be imported from United States he also state that this is a necessity to bring back uniformity in trade rather than having disadvantage.
The East Asian economies are export depen-dent. The increased trade barriers will affect the growth of the region. For example, South Korea’s GDP contracted in the previous quar-ter. Japan, the third largest economy in the world, is also dependent on exports. The GDP growth of Japan for previous quarter stood at about 0.5%. Japan’s economy grew at slower rate than expected in the previous quarter. The exports were not strong enough to com-pensate for weak domestic demand. Japan managed eight straight quarters of growth, and this is the longest expansion in GDP since the Japanese financial bubble burst in 1980s, and this has been possible due to the financial aggressive measures taken by the Prime Minis-
ter and Bank of Japan. The Bank of Japan has been infusing billions of dollars of cash into the economy through asset purchases of govern-ment bonds to counter deflation. This has encouraged inflation by keeping the costs of borrowing low and weaken the yen. With Yen weakening globally, exports will pick up. How-ever, with US imposing tariffs on imports of goods, Japanese economy might be affected.
The Asia-Pacific region is primarily been domi-nated by the Chinese economy, the world’s second largest economy. The Chinese econo-my’s GDP grew by 6.8% for the quarter that ended in December 2017, same as the previ-ous quarter. The Chinese economy has been undergoing a process of shifting from a manu-facturing and investment driven economy to a more consumption driven economy, which has been a major reason for the growth in the economy. The service sector has accounted for almost half of the GDP in the quarter by value, and agriculture contributed around 10%. But this growth is primarily fuelled by increased debt taking in the economy with about 300% debt-to-GDP ratio.
The Asia Pacific region is primarily manufactur-ing dependant and one of the biggest supplier of commodities to the region is the Latin Amer-ican economy. So, when the Asia Pacific econo-my expands, Latin American economy also expands. The GDP of Brazil grew by 2.1% on annualized basis from the previous quarter, which is a bit weak. However, considering the factor that Brazil was in recession until the beginning of 2017, this is quite a good improvement. The inflation in Brazil is at a multi year low owing to the efforts of the Cen-tral Bank raising the interest rates to historic highs until 2016 to counter hyperinflation. With the inflation reducing, the Brazil’s Central Bank also lowered interest rates in consecutive policy reviews throughout 2017, often by as much as 100 bps. The rapid lowering of inter-est rates aided in the expansion of the Brazil-ian economy. But what could be the detrimen-tal to the sustenance of the growth is the out-come of Brazilian elections.

Monetary Policy 04
India’s GDP grew by 7.2% in the previous quar-ter that ended in December 17. This was the reflection of the Indian economy adapting to the Changes of GST and overcoming the shock of demonetisation. However, there are worry-ing signs for sustenance of this growth. The Service sector is India’s biggest economic driver. In the month of February the services PMI declined to 47. 8 which is below the 50 mark. Private consumption activity has declined. The GDP grew in the previous quar-ter primarily due to the pickup in Government spending.
Inflation as measured by the CPI stood at 5.2% and 5.07% in the months of December 2017 and January 2018 respectively. The inflation further cooled to 4.44% in February 2018. The Reserve Bank of India likes to maintain Infla-tion rate at 4% ± 2%. While 4% is the expected mark, an inflation reading below 2% will prompt the RBI to lower interest rates. Lower-ing of Interest rates will prompt further invest-ment. But with increased Government spend-ing, along with high crude oil prices inflation may not lower for quite some time. Therefore, in the next couple of policy reviews, the RBI will be expected to maintain status quo.
Commodities
05
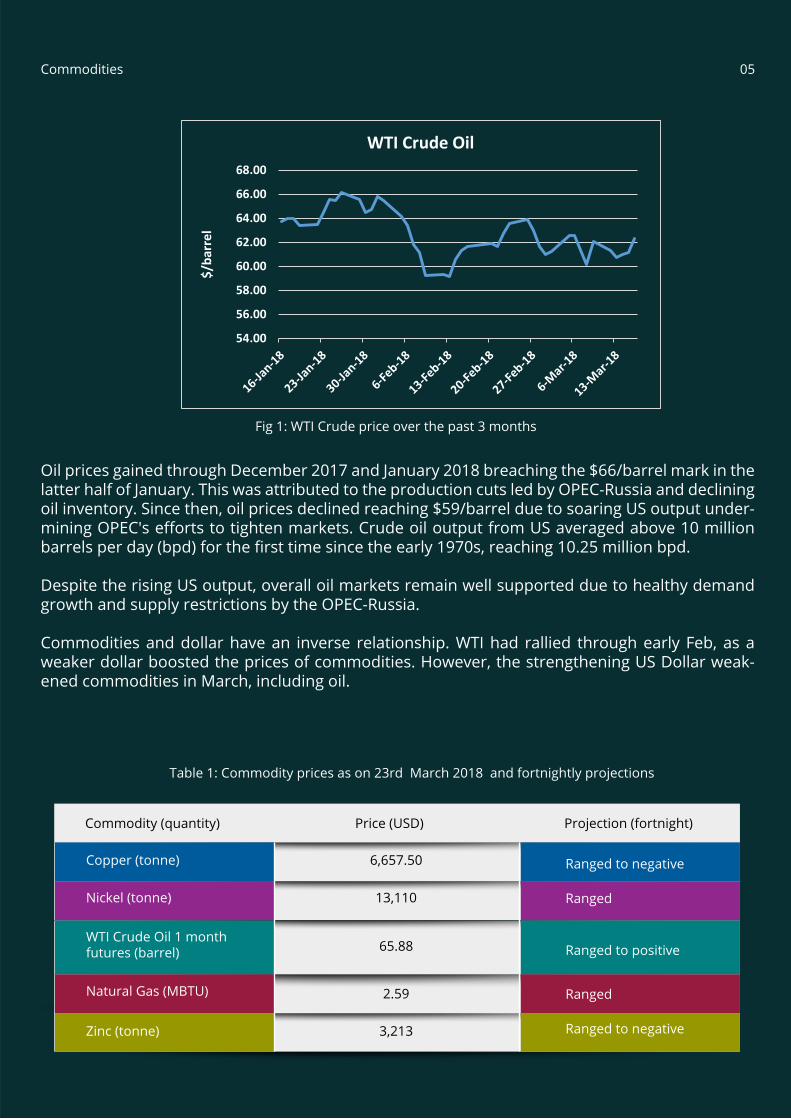
Oil prices gained through December 2017 and January 2018 breaching the $66/barrel mark in the latter half of January. This was attributed to the production cuts led by OPEC-Russia and declining oil inventory. Since then, oil prices declined reaching $59/barrel due to soaring US output under-mining OPEC's efforts to tighten markets. Crude oil output from US averaged above 10 million barrels per day (bpd) for the first time since the early 1970s, reaching 10.25 million bpd.
Despite the rising US output, overall oil markets remain well supported due to healthy demand growth and supply restrictions by the OPEC-Russia.
Commodities and dollar have an inverse relationship. WTI had rallied through early Feb, as a weaker dollar boosted the prices of commodities. However, the strengthening US Dollar weak-ened commodities in March, including oil.
Commodities 05
Fig 1: WTI Crude price over the past 3 months
54.00
56.00
58.00
60.00
62.00
64.00
66.00
68.00
$/ba
rrel
WTI Crude Oil
Copper (tonne)
Nickel (tonne)
WTI Crude Oil 1 month futures (barrel)
Natural Gas (MBTU)
Zinc (tonne)
Commodity (quantity) Projection (fortnight)
6,657.50
13,110
65.88
2.59
3,213
Price (USD)
Ranged to positive
Ranged
Ranged to negative
Ranged to negative
Ranged
Table 1: Commodity prices as on 23rd March 2018 and fortnightly projections

Fig 2: Gold price over the past 3 months
Gold prices were volatile in the month of February. In the beginning of February, the world stock markets corrected. This in turn led to strengthening of gold due to investing in gold as a safe haven. The reports of improving inflation in mid February in the US led to an increase in the US Treasury yields. This in turn led to a strengthening of the Dollar thereby weakening gold to $1311.05/tr. Oz. on 8th Feb 2018.
Shortly after the correction, Gold prices increased owing to the continued global volatility and the weakening of the dollar.
Gold prices declined as the US Dollar strengthened owing to reports of improving global econom-ic growth with the release of the Q4 GDP of most economies, increased job addition in the USA and the improved wage growth as well.
Bullion
1280129013001310132013301340135013601370
$/tr
.oz
Gold Price
Bullion 07
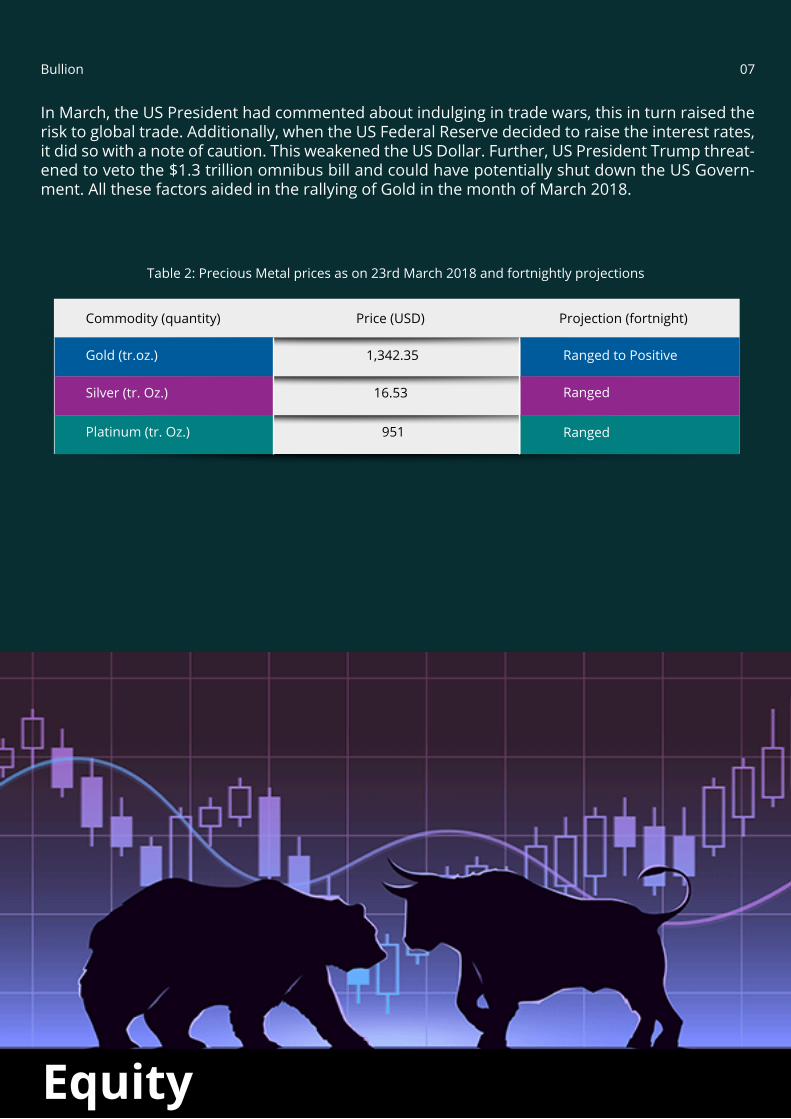
In March, the US President had commented about indulging in trade wars, this in turn raised the risk to global trade. Additionally, when the US Federal Reserve decided to raise the interest rates, it did so with a note of caution. This weakened the US Dollar. Further, US President Trump threat-ened to veto the $1.3 trillion omnibus bill and could have potentially shut down the US Govern-ment. All these factors aided in the rallying of Gold in the month of March 2018.
Commodity (quantity)
Gold (tr.oz.)
Silver (tr. Oz.)
Platinum (tr. Oz.)
Price (USD) Projection (fortnight)
1,342.35
16.53
951
Ranged to Positive
Ranged
Ranged
Table 2: Precious Metal prices as on 23rd March 2018 and fortnightly projections
Equity

Equity markets globally have been following a very similar trend over the past year (Fig. 3). The equity markets across the world rallied through 2017. The rally turned steeper in the beginning of January 2018 and reaching a peak on 26th Jan 2018. Since then the markets have been in correction mode. Equity markets remained volatile for the month of February. Sentiments regarding US interest rate hikes, and Donald trump’s statement for tariffs on imports on steel and aluminium affected the markets through March.
In the beginning of March, stock markets fell across due after chair of the US Federal Reserve, Jerome Powell, revived worries about a sharp increase in interest rates. A weaker than expected economic data from China and Japan also dampened market sentiment. Markets further correct-ed after US President Donald Trump said that he would impose tariffs on imports of steel and aluminium products.
While the world markets have been range bound in February and March, the Indian markets how-ever have been in correction mode. One of the factors that contributed to this correction was the unraveling of the NPA problems in the Public Sector Banks, namely Punjab National Bank.
Equity 08
Fig 3: Major world Indices over the past year
20000.00
22000.00
24000.00
26000.00
28000.00
30000.00
32000.00
34000.00
Hang Seng
2200
2300
2400
2500
2600
2700
2800
2900
3000
S&P 500
8500
9000
9500
10000
10500
11000
11500
Nifty 50

Trump’s comments on weakening of US Dollar and imposition of tariffs on imports keep global markets volatile. This volatility will be reflected in the Indian equity markets as well. With the gov-ernment spending picking up, the GDP of the Indian economy can be expected to pick-up. There-fore the Indian equity markets can be expected to rally in the long term. It is best to stay invested in equity for the long term. Investing in SIP will help tide over the immediate term volatility.
Long Term government securities have been weakening owing to increased debt taking by the government. As the inflation is within the 4% ± 2%, the RBI may keep interest rates as is for a while. The interest rates in turn will make long term bonds less attractive. However, the high inter-est rates of Long term bonds will make them more attractive in the bond market. Therefore, Bonds of medium to long duration will be good to keep in the portfolio
Although the US Federal Reserve raised interest rates in its last policy meet, the US Dollar weak-ened due to the chair’s observation that the US economy wasn’t as strong as expected. The upcoming Italian elections will determine the future of EU. The outcome of North Korea- US talks and protectionist measures will determine future of foreign relations and trade. With uncertainty and weakness in the world economy, gold becomes a safe bet for investments. It is therefore best to keep 5-10% of portfolio in gold as hedge.
Investment Strategy

A quick look at the economic events that are taking place across the world and the likely outcome.
US
EU
Asia Pacific
India
Country/Region Impact(Projected)Event
US President Trump threatens trade wars
Right wing populists form Govern-ment in Italy
China retaliates to Trump’s trade wars with tariffs of $3 billion on US goods
RBI to keep policy stance as-is
Dollar weakens
Rupee Strengthens
•
•
Euro weakens•
Gold Strengthens•
Asian stocks crash•
Gold Strengthens•
Stock indices crash•
Gold strengthens•
Global Economy

ArthaYantra was founded with the mission to make high quality financial advice available to everyone irrespective of their wealth status. Our award winning platform, Arthos, uses artificial intelligence based system and complex neural networks to generate advice across Investments, Expense management, Insurance, Loans, Estate planning, and Taxes. The advice itself is explained by a certified personal advisor. We are the only fintech startup globally to have been recognised by Gartner for digital innovation. Winner of Red Herring Global Top 100 startup award; Among the top 35 Fintech company in Asia as per Finovate, and NASSCOM emerge 50 Award. Since our launch, we have helped more than 1,80,000 customers across 650+ cities and 30+ countries.
Visit corporate.arthayantra.com to see how ArthaYantra can help employers with financial well-ness program as employee benefit.
© 2018 ArthaYantra Corporation Pvt. LimitedAll Rights Reserved.www.arthayantra.com
This material has been prepared for general informational purposes only and is not intended to be relied upon as investment advice. Please refer to your advisors for specific advice.
About ArthaYantra

TALK TO US
TODAY
ArthaYantraCorporate and Registered Office: 3rd Floor, Sai Galleria, Plot No. 472, Road No. 36, Jubilee Hills, Hyderabad, India 500 033. CIN: U74900TG2007PTC053246 Tel.: +91-9100123693 | e-mail: [email protected]
Reports, analysis and views in this newsletter (Finzine) seek to present an unbiased picture of developments in the markets & economy. Actual developments can turn out to be different owing to circumstances beyond Arthayantra’s control and knowledge. Arthayantra does not take any responsibility for investment or business decisions taken by readers on the basis of reports and articles published in the newsletter.Readers are expected to form their own judgments. Unless explicitly stated otherwise, all rights reserved by M/s Arthayantra Corporation Pvt. Ltd. Any printing, publication, reproduction, transmission or redissemination of the contents, in any form or by any means, is prohibited without the prior written consent of M/s. Arthayantra Corporation Pvt. Ltd. Any such prohibited and unauthorized act by any person/legal entity shall invite civil and criminal liabilities. All disputes are subject to the courts of Hyderabad Jurisdiction only.All information provided is on "as is" basis and for information purposes only. Kindly consult your financial advisor to verify the accuracy and recen-cy of all the information prior to taking any investment decision. While due diligence is done and care taken neither Arthayantra Corporation Pvt. Ltd nor www.arthayantra.com are liable for any information errors, incompleteness, or delays, or for any actions taken in reliance on information contained herein.This newsletter is purely intended for internal circulation of our users only
Disclaimer