quarterly economic review of the food and beverages
TRANSCRIPT
Quarterly Economic Review of the Food
and Beverages Industry in South Africa
April to June 2018
Volume 5, number 1
DIRECTORATE: AGRO-PROCESSING SUPPORT
agriculture,forestry & fisheries

i
PREFACE
The agro-processing industry is among the sectors identified by the Industrial Policy Action Plan
(IPAP) and the National Development Plan for its potential to spur growth, development and
job creation via its strong backward and forward linkages with the other sectors of the
economy. DAFF established the Directorate: Agro-processing Support in 2011 to facilitate the
processing of raw primary agriculture, forestry and fisheries commodities into value added
products.
One of the functions of the directorate is to provide timely and updated economic information
regarding the agro-processing industry as part of monitoring and evaluating the performance
of the industry. Additionally, economic indicators provide an insight into the effects of
economic policies and other exogenous factors. To achieve this purpose, the directorate
publishes regular quarterly economic reviews of the agro-processing industry.
The main economic indicators reviewed are the changes in prices, production, capacity
utilisation, value of sales, formal employment and trade. An outlook of the industry for the next
quarter is also presented. In addition, some indicators of the food and beverages service
industry, wholesale and retail sectors are reviewed to evaluate the forward linkages of the
food and beverages industry.
Any comments and suggestions on the content of the publication are most welcome.
Mahlogedi Victor Thindisa
Director: Agro-processing Support
Pretoria
Disclaimer: The Department of Agriculture, Forestry and Fisheries did everything to ensure the
accuracy of the information reported in this publication. The department will, however, not be
liable for the results of action based on this publication.
ii
CONTENTS
PREFACE ................................................................................................................................................ i
1. INTRODUCTION ........................................................................................................................... 1
2. FOOD PRODUCTS ....................................................................................................................... 1
2.1 PRICE ..................................................................................................................................... 1
2.2 PRODUCTION ...................................................................................................................... 4
2.3 VALUE OF SALES .................................................................................................................. 5
2.4 INCOME FROM FOOD SALES IN THE SERVICE INDUSTRY .......................................... 7
2.5 TRADE .................................................................................................................................... 8
2.6 EMPLOYMENT .................................................................................................................... 17
2.7 OUTLOOK ............................................................................................................................ 18
3. BEVERAGES ................................................................................................................................ 19
3.1 PRICE ................................................................................................................................... 19
3.2 PRODUCTION .................................................................................................................... 20
3.3 VALUE OF SALES ................................................................................................................ 21
3.4 INCOME FROM BAR SALES IN THE SERVICE INDUSTRY ............................................ 22
3.5 TRADE .................................................................................................................................. 23
3.6 EMPLOYMENT .................................................................................................................... 32
3.7 OUTLOOK ............................................................................................................................ 32
4. CONCLUSION ............................................................................................................................ 33
5. REFERENCES ............................................................................................................................... 34
NOTES: ................................................................................................................................................. 35
Compiled by Directorate: Agro-processing Support
Department of Agriculture, Forestry and Fisheries
Sefala Building
503 Belvedere Street, Arcadia, South Africa
All correspondence can be addressed to:
Director: Agro-processing Support
Private Bag X416, Pretoria 0001, South Africa
Tel.: +27 (12) 319 8457
Fax: +27 (12) 319 8093
E-mail: [email protected]
This publication is also available on the internet at: http://www.daff.gov.za
1
1. INTRODUCTION
The South African real gross domestic product (GDP) continued to contract at an annualized
rate of 0,7% in the second quarter of 2018. This followed a revised decline of 2,6% in the first
quarter of 2018, which consequently led the economy entering into a technical recession. The
real output of the primary sector contracted further in the second quarter of 2018 as
agricultural output again decreased sharply, owing to the lower production of horticultural
products and in particular field crops, in part due to a delay in the harvesting of maize. Similarly,
the manufacturing sector contracted marginally in the second quarter of 2018, mainly
impacted by higher input costs and weak domestic demand (SA Reserve Bank 2018).
This quarterly review provides an analysis of the economic performance of the food and
beverages industry. The variables that are analysed are exports and imports of food and
beverages, employment, net balance survey, price index, volume of production, sales,
utilisation capacity, and wholesale and retail performances.
2. FOOD PRODUCTS
According to the Standard Industrial Classification, the food industry incorporates groups of
products that are categorised into the following four codes:
Code 301: refers to manufacturing, processing and preservation of meat, fish,
vegetables, fruits, oils and fats
Code 302: refers to manufacturing, processing and preservation of dairy products
Code 303: refers to manufacture of grain mill products, starch products and prepared
animal feeds
Code 304: refers to manufacture of other food products like bread, sugar, chocolate,
pasta, coffee, nuts and spices.
Hereafter, food products refer to those primary agricultural and fisheries products that have
undergone some form of change through manufacturing and processing or performed some
value addition activities such as preservation.
2.1 PRICE
Consumer Price Index (CPI)1
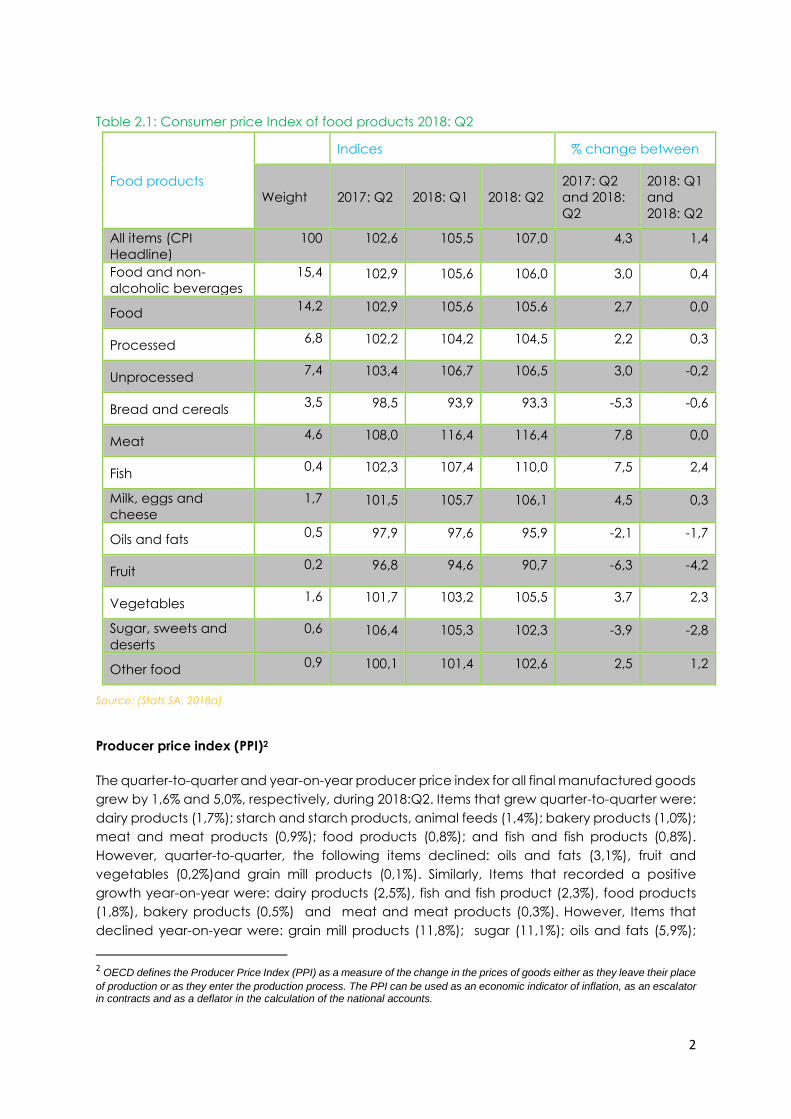
The quarter-to-quarter consumer price index of all items grew by 1,4% in 2018: Q2. Some of the
items that grew in the period under review were: fish (2,4%), vegetables (2,3%), other foods
(1,2%), milk, eggs and cheese (0,3%). However, fruit (4,2%), sugar, sweets and deserts (2,8%),
oils and fats (1,7%), and bread and cereals (0,6%) declined during the period under review.
Similarly, the year-on-year consumer price index increased for meat (7,8%), fish (7,5%), milk,
eggs and cheese(4,5%), vegetables (3,7%). However, fruit (6,3%), bread and cereals (5,3%) ,
sugar, sweets and deserts (3,9%) and oils and fats (2,5%) declined, year-on-year during the
period under review.
1 Stats SA defines CPI as a current social and economic indicator that is constructed to measure changes over time in
the general level of prices of consumer goods and services that households acquire, use, or pay for.
2
Table 2.1: Consumer price Index of food products 2018: Q2
Indices % change between
Food products
Weight 2017: Q2 2018: Q1 2018: Q2
2017: Q2
and 2018:
Q2
2018: Q1
and
2018: Q2
All items (CPI
Headline)
100 102,6 105,5 107,0 4,3 1,4
Food and non-
alcoholic beverages
15,4 102,9 105,6 106,0 3,0 0,4
Food 14,2 102,9 105,6 105.6 2,7 0,0
Processed 6,8 102,2 104,2 104,5 2,2 0,3
Unprocessed 7,4 103,4 106,7 106,5 3,0 -0,2
Bread and cereals 3,5 98,5 93,9 93,3 -5,3 -0,6
Meat 4,6 108,0 116,4 116,4 7,8 0,0
Fish 0,4 102,3 107,4 110,0 7,5 2,4
Milk, eggs and
cheese
1,7 101,5 105,7 106,1 4,5 0,3
Oils and fats 0,5 97,9 97,6 95,9 -2,1 -1,7
Fruit 0,2 96,8 94,6 90,7 -6,3 -4,2
Vegetables 1,6 101,7 103,2 105,5 3,7 2,3
Sugar, sweets and
deserts
0,6 106,4 105,3 102,3 -3,9 -2,8
Other food 0,9 100,1 101,4 102,6 2,5 1,2
Source: (Stats SA, 2018a)
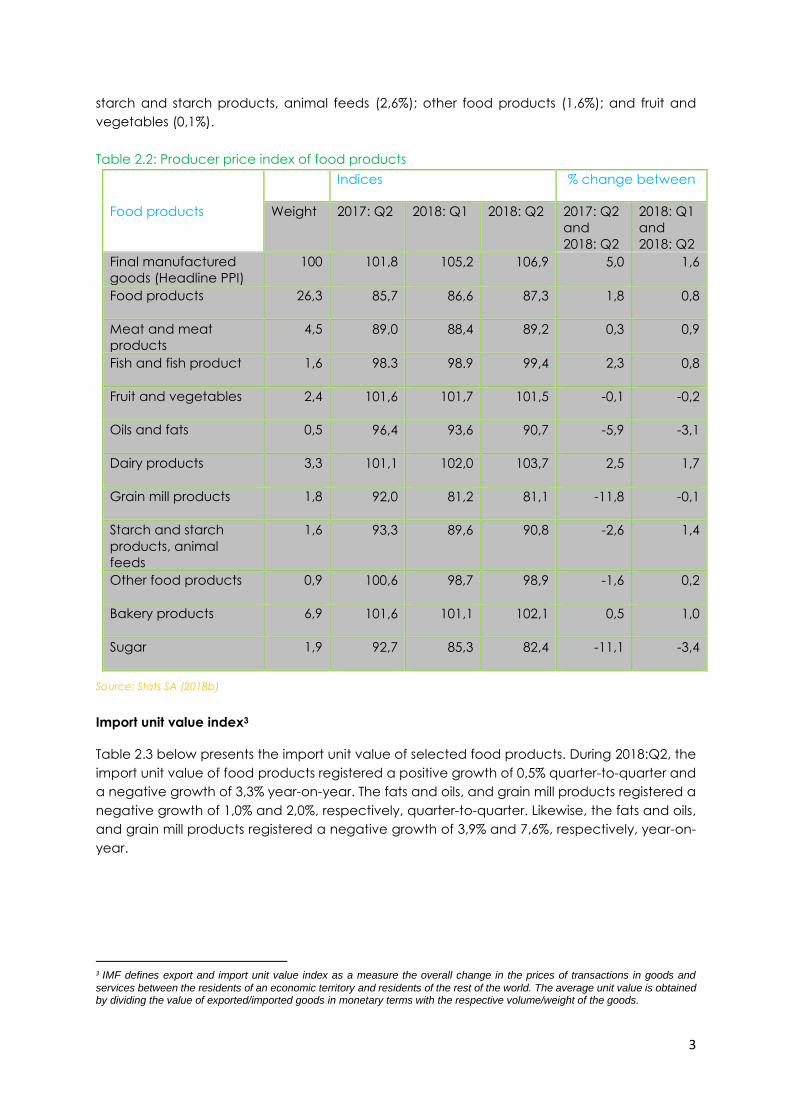
Producer price index (PPI)2
The quarter-to-quarter and year-on-year producer price index for all final manufactured goods
grew by 1,6% and 5,0%, respectively, during 2018:Q2. Items that grew quarter-to-quarter were:
dairy products (1,7%); starch and starch products, animal feeds (1,4%); bakery products (1,0%);
meat and meat products (0,9%); food products (0,8%); and fish and fish products (0,8%).
However, quarter-to-quarter, the following items declined: oils and fats (3,1%), fruit and
vegetables (0,2%)and grain mill products (0,1%). Similarly, Items that recorded a positive
growth year-on-year were: dairy products (2,5%), fish and fish product (2,3%), food products
(1,8%), bakery products (0,5%) and meat and meat products (0,3%). However, Items that
declined year-on-year were: grain mill products (11,8%); sugar (11,1%); oils and fats (5,9%);
2 OECD defines the Producer Price Index (PPI) as a measure of the change in the prices of goods either as they leave their place
of production or as they enter the production process. The PPI can be used as an economic indicator of inflation, as an escalator in contracts and as a deflator in the calculation of the national accounts.
3
starch and starch products, animal feeds (2,6%); other food products (1,6%); and fruit and
vegetables (0,1%).
Table 2.2: Producer price index of food products
Indices % change between
Food products Weight 2017: Q2 2018: Q1 2018: Q2 2017: Q2
and
2018: Q2
2018: Q1
and
2018: Q2
Final manufactured
goods (Headline PPI)
100 101,8 105,2 106,9 5,0 1,6
Food products 26,3 85,7 86,6 87,3 1,8 0,8
Meat and meat
products
4,5 89,0 88,4 89,2 0,3 0,9
Fish and fish product 1,6 98.3 98.9 99,4 2,3 0,8
Fruit and vegetables 2,4 101,6 101,7 101,5 -0,1 -0,2
Oils and fats 0,5 96,4 93,6 90,7 -5,9 -3,1
Dairy products 3,3 101,1 102,0 103,7 2,5 1,7
Grain mill products 1,8 92,0 81,2 81,1 -11,8 -0,1
Starch and starch
products, animal
feeds
1,6 93,3 89,6 90,8 -2,6 1,4
Other food products 0,9 100,6 98,7 98,9 -1,6 0,2
Bakery products 6,9 101,6 101,1 102,1 0,5 1,0
Sugar 1,9 92,7 85,3 82,4 -11,1 -3,4
Source: Stats SA (2018b)
Import unit value index3
Table 2.3 below presents the import unit value of selected food products. During 2018:Q2, the
import unit value of food products registered a positive growth of 0,5% quarter-to-quarter and
a negative growth of 3,3% year-on-year. The fats and oils, and grain mill products registered a
negative growth of 1,0% and 2,0%, respectively, quarter-to-quarter. Likewise, the fats and oils,
and grain mill products registered a negative growth of 3,9% and 7,6%, respectively, year-on-
year.
3 IMF defines export and import unit value index as a measure the overall change in the prices of transactions in goods and
services between the residents of an economic territory and residents of the rest of the world. The average unit value is obtained by dividing the value of exported/imported goods in monetary terms with the respective volume/weight of the goods.

4
Table 2.3: import unit value index of food products
Source: Stats SA (2018c)
2.2 PRODUCTION
Source: Statistics SA (2018d)
Figure 2.1: presents a physical volume of production for the food products division. The quarter-
to-quarter physical volume of production for meat, fish, fruit; dairy products; and grain mill
products contracted by 1,5, 0,9%, and 2,1% in 2018: Q2 as compared to a growth of 2,5%,
3,2% and 2,9%, respectively, in the preceding quarter. However, other food products grew
marginally by 2,6% from a 1,8 growth in the last quarter. The year-on-year physical volume of
production for meat, fish, fruit; dairy; grain mill products; and other food products moderated
by 2,6%, 2,8%, 2,9% and 9,1% from a growth of 3,4%, 7,3%, 6,1% and 11,0% respectively, in the
preceding quarter.
50
60
70
80
90
100
110
120
201
3: Q
2
201
3: Q
3
201
3: Q
4
201
4: Q
1
20
14
: Q
2
201
4: Q
3
201
4: Q
4
201
5: Q
1
201
5: Q
2
201
5: Q
3
201
5: Q
4
201
6: Q
1
201
6: Q
2
201
6: Q
3
201
6: Q
4
20
17
: Q
1
201
7: Q
2
201
7: Q
3
201
7: Q
4
201
8: Q
1
201
8: Q
2
(R m
illio
n)
Figure 2.1: Seasonally adjusted physical volume of production: food
products
Meat, fish, fruit etc Dairy products Grain mill products Other food products
Food products
Indices % change between
2017: Q2 2018: Q1 2018: Q2
2017: Q2
and 2018:
Q2
2018: Q1
and 2017:
Q2
Food (total) 91,9 88,5 88,9 -3,3 0,5
Fats and oils 99,6 96,7 95,7 -3,9 -1,0
Grain mill products 100,0 94,2 92,4 -7,6 -2,0
5
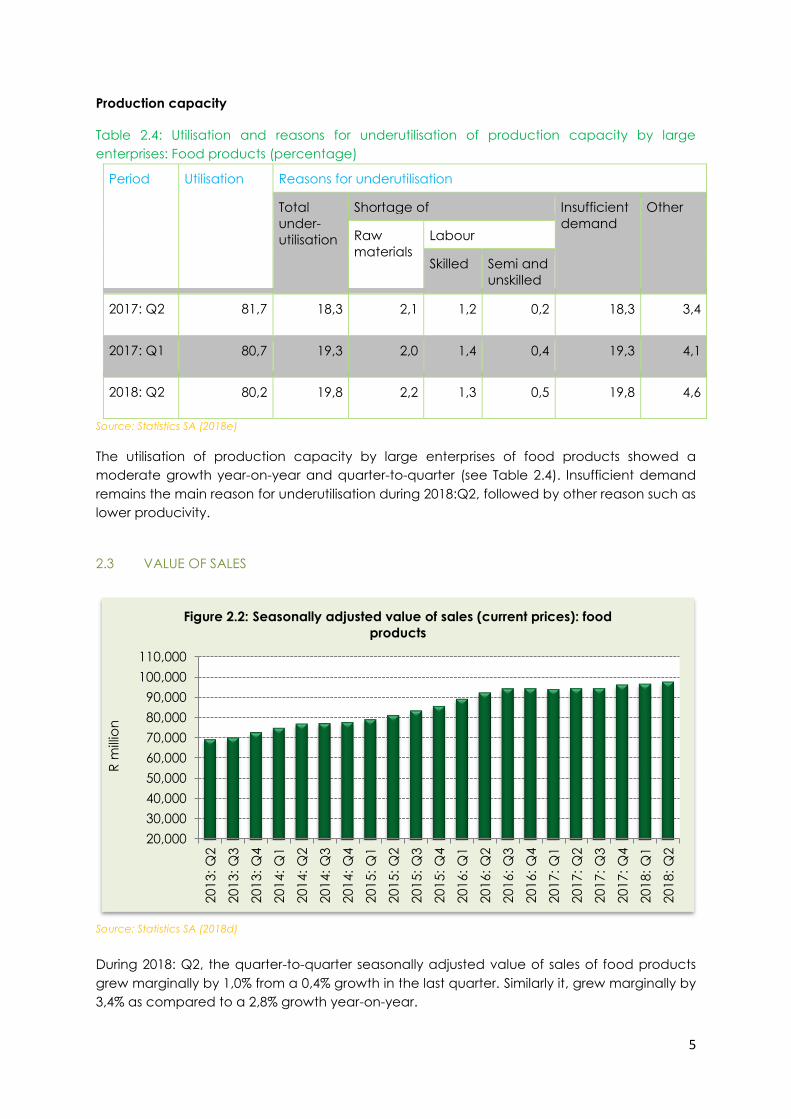
Production capacity
Table 2.4: Utilisation and reasons for underutilisation of production capacity by large
enterprises: Food products (percentage)
Period Utilisation Reasons for underutilisation
Total
under-
utilisation
Shortage of Insufficient
demand
Other
Raw
materials
Labour
Skilled Semi and
unskilled
2017: Q2 81,7 18,3 2,1 1,2 0,2 18,3 3,4
2017: Q1 80,7 19,3 2,0 1,4 0,4 19,3 4,1
2018: Q2 80,2 19,8 2,2 1,3 0,5 19,8 4,6
Source: Statistics SA (2018e)
The utilisation of production capacity by large enterprises of food products showed a
moderate growth year-on-year and quarter-to-quarter (see Table 2.4). Insufficient demand
remains the main reason for underutilisation during 2018:Q2, followed by other reason such as
lower producivity.
2.3 VALUE OF SALES
Source: Statistics SA (2018d)
During 2018: Q2, the quarter-to-quarter seasonally adjusted value of sales of food products
grew marginally by 1,0% from a 0,4% growth in the last quarter. Similarly it, grew marginally by
3,4% as compared to a 2,8% growth year-on-year.
20,000
30,000
40,000
50,000
60,000
70,000
80,000
90,000
100,000
110,000
201
3: Q
2
201
3: Q
3
201
3: Q
4
201
4: Q
1
201
4: Q
2
201
4: Q
3
201
4: Q
4
201
5: Q
1
201
5: Q
2
201
5: Q
3
201
5: Q
4
20
16
: Q
1
201
6: Q
2
20
16
: Q
3
201
6: Q
4
201
7: Q
1
201
7: Q
2
201
7: Q
3
201
7: Q
4
201
8: Q
1
201
8: Q
2
R m
illio
n
Figure 2.2: Seasonally adjusted value of sales (current prices): food
products
6
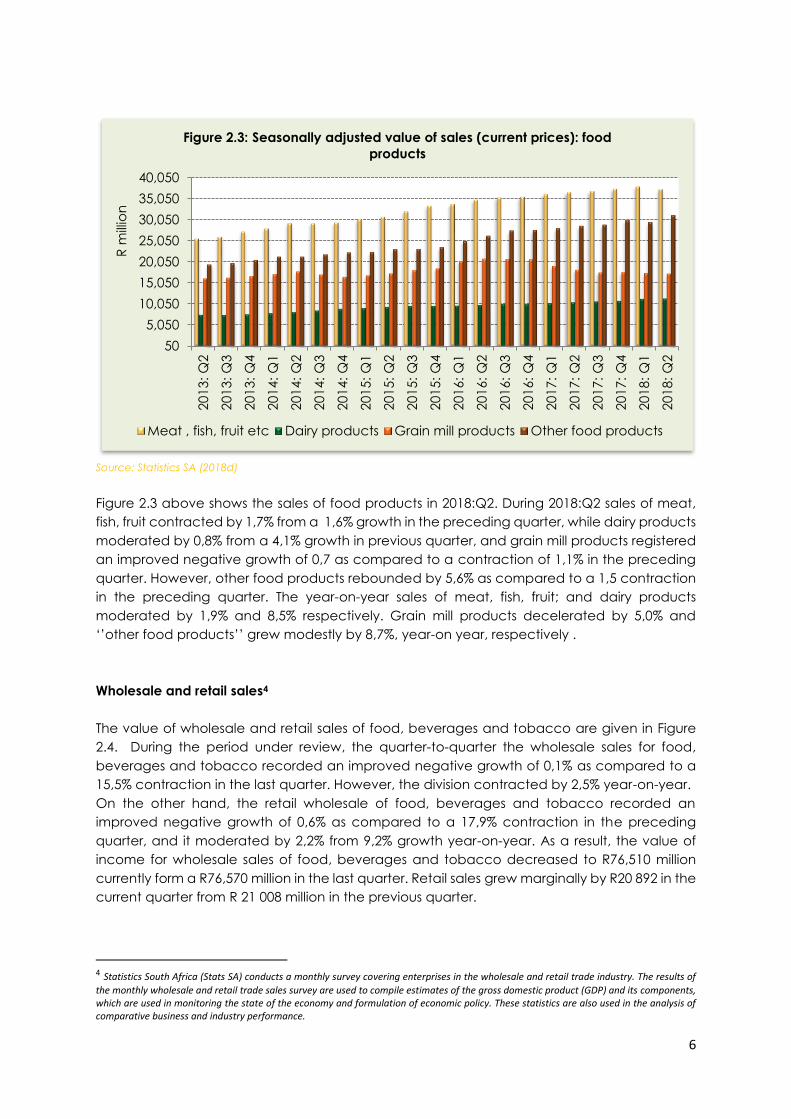
Source: Statistics SA (2018d)
Figure 2.3 above shows the sales of food products in 2018:Q2. During 2018:Q2 sales of meat,
fish, fruit contracted by 1,7% from a 1,6% growth in the preceding quarter, while dairy products
moderated by 0,8% from a 4,1% growth in previous quarter, and grain mill products registered
an improved negative growth of 0,7 as compared to a contraction of 1,1% in the preceding
quarter. However, other food products rebounded by 5,6% as compared to a 1,5 contraction
in the preceding quarter. The year-on-year sales of meat, fish, fruit; and dairy products
moderated by 1,9% and 8,5% respectively. Grain mill products decelerated by 5,0% and
‘’other food products’’ grew modestly by 8,7%, year-on year, respectively .
Wholesale and retail sales4
The value of wholesale and retail sales of food, beverages and tobacco are given in Figure
2.4. During the period under review, the quarter-to-quarter the wholesale sales for food,
beverages and tobacco recorded an improved negative growth of 0,1% as compared to a
15,5% contraction in the last quarter. However, the division contracted by 2,5% year-on-year.
On the other hand, the retail wholesale of food, beverages and tobacco recorded an
improved negative growth of 0,6% as compared to a 17,9% contraction in the preceding
quarter, and it moderated by 2,2% from 9,2% growth year-on-year. As a result, the value of
income for wholesale sales of food, beverages and tobacco decreased to R76,510 million
currently form a R76,570 million in the last quarter. Retail sales grew marginally by R20 892 in the
current quarter from R 21 008 million in the previous quarter.
4 Statistics South Africa (Stats SA) conducts a monthly survey covering enterprises in the wholesale and retail trade industry. The results of
the monthly wholesale and retail trade sales survey are used to compile estimates of the gross domestic product (GDP) and its components, which are used in monitoring the state of the economy and formulation of economic policy. These statistics are also used in the analysis of comparative business and industry performance.
50
5,050
10,050
15,050
20,050
25,050
30,050
35,050
40,050
201
3: Q
2
201
3: Q
3
201
3: Q
4
201
4: Q
1
201
4: Q
2
201
4: Q
3
201
4: Q
4
201
5: Q
1
201
5: Q
2
201
5: Q
3
201
5: Q
4
201
6: Q
1
201
6: Q
2
201
6: Q
3
201
6: Q
4
201
7: Q
1
201
7: Q
2
201
7: Q
3
201
7: Q
4
201
8: Q
1
201
8: Q
2
R m
illio
n
Figure 2.3: Seasonally adjusted value of sales (current prices): food
products
Meat , fish, fruit etc Dairy products Grain mill products Other food products

7
Source: Statistics SA (2018f, 2018g)
2.4 INCOME FROM FOOD SALES IN THE SERVICE INDUSTRY5
Table 2,5 below, shows, the income from food sales5 in the service industry includes food sales
in restaurants and coffee shops6, take-away and fast food outlet7 and catering services8.
5 Income from food sales in the service industry refers to income from the sale of meals and non-alcoholic drinks.
6 Restaurants and coffee shops refers to enterprises involved in the sale and provision of meals and drinks, ordered from a menu, prepared on the premises for immediate consumption and with provided seating. 7 Take-away and fast food outlet refers to eenterprises involved in the sale and provision of meals and drinks, ordered from a menu, prepared on the premises for takeaway purposes in a packaged format, at a stand or in a location, with or without provided seating. 8 Catering services refers to eenterprises involved in the sale and supply of meals and drinks prepared on the premises on a contract basis and brought to other premises chosen by the person ordering them, to be served for immediate consumption to guests or customers. Catering services also include bars, taverns, other drinking places, ice-cream parlours, etc.
0
10,000
20,000
30,000
40,000
50,000
60,000
70,000
80,000
90,000
100,000
201
3: Q
2
201
3: Q
3
201
3: Q
4
201
4: Q
1
201
4: Q
2
20
14
: Q
3
201
4: Q
4
201
5: Q
1
201
5: Q
2
201
5: Q
3
201
5: Q
4
201
6: Q
1
201
6: Q
2
201
6: Q
3
201
6: Q
4
201
7: Q
1
201
7: Q
2
201
7: Q
3
201
7: Q
4
201
8: Q
1
201
8: Q
2
R m
illio
nFigure 2.4: Wholesale and retail trade sales of food, beverages and
tobacco (current prices)
Wholesale Retail Trade Sales
5001,0001,5002,0002,5003,0003,5004,0004,5005,0005,5006,0006,5007,0007,5008,0008,5009,0009,500
201
3: Q
2
201
3: Q
3
201
3: Q
4
201
4: Q
1
201
4: Q
2
201
4: Q
3
201
4: Q
4
201
5: Q
1
201
5: Q
2
201
5: Q
3
20
15
: Q
4
201
6: Q
1
201
6: Q
2
201
6: Q
3
201
6: Q
4
201
7: Q
1
201
7: Q
2
201
7: Q
3
201
7: Q
4
201
8: Q
1
201
8: Q
2
R m
illio
n
Figure 2.5: Income from food sales in the service industry
8
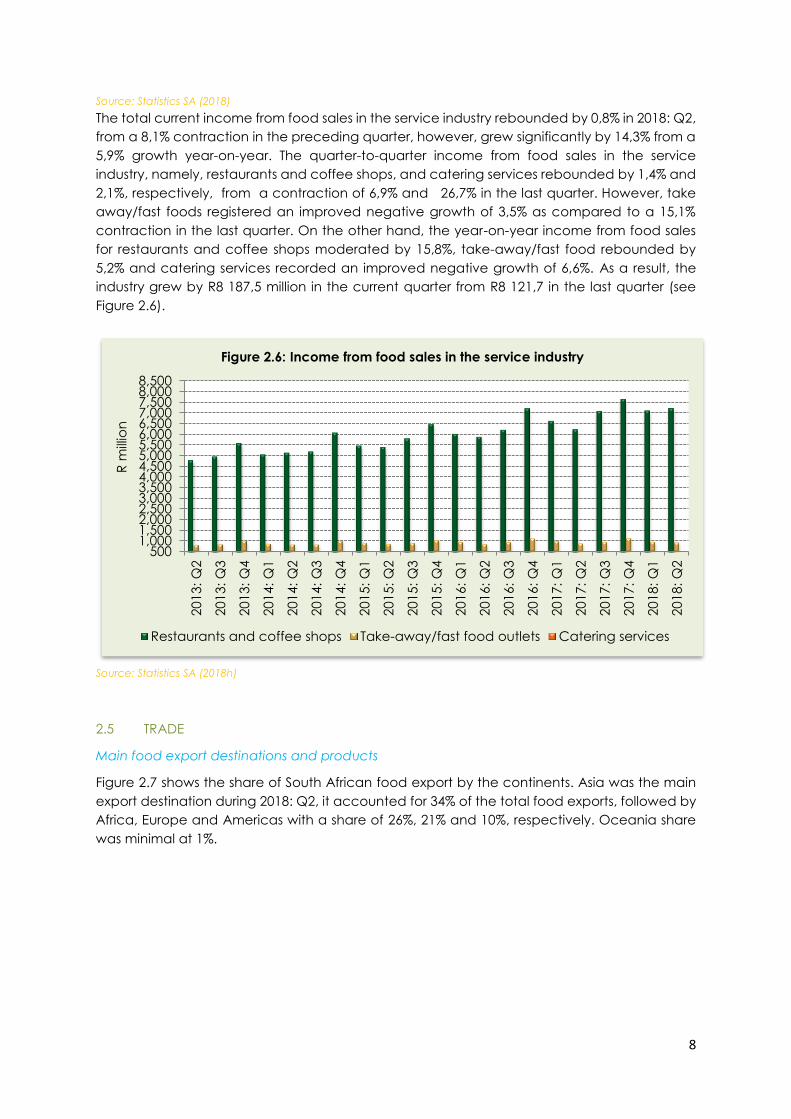
Source: Statistics SA (2018)
The total current income from food sales in the service industry rebounded by 0,8% in 2018: Q2,
from a 8,1% contraction in the preceding quarter, however, grew significantly by 14,3% from a
5,9% growth year-on-year. The quarter-to-quarter income from food sales in the service
industry, namely, restaurants and coffee shops, and catering services rebounded by 1,4% and
2,1%, respectively, from a contraction of 6,9% and 26,7% in the last quarter. However, take
away/fast foods registered an improved negative growth of 3,5% as compared to a 15,1%
contraction in the last quarter. On the other hand, the year-on-year income from food sales
for restaurants and coffee shops moderated by 15,8%, take-away/fast food rebounded by
5,2% and catering services recorded an improved negative growth of 6,6%. As a result, the
industry grew by R8 187,5 million in the current quarter from R8 121,7 in the last quarter (see
Figure 2.6).
Source: Statistics SA (2018h)
2.5 TRADE
Main food export destinations and products
Figure 2.7 shows the share of South African food export by the continents. Asia was the main
export destination during 2018: Q2, it accounted for 34% of the total food exports, followed by
Africa, Europe and Americas with a share of 26%, 21% and 10%, respectively. Oceania share
was minimal at 1%.
5001,0001,5002,0002,5003,0003,5004,0004,5005,0005,5006,0006,5007,0007,5008,0008,500
201
3: Q
2
201
3: Q
3
201
3: Q
4
201
4: Q
1
201
4: Q
2
20
14
: Q
3
201
4: Q
4
201
5: Q
1
201
5: Q
2
201
5: Q
3
201
5: Q
4
201
6: Q
1
201
6: Q
2
201
6: Q
3
201
6: Q
4
201
7: Q
1
201
7: Q
2
201
7: Q
3
201
7: Q
4
201
8: Q
1
201
8: Q
2
R m
illio
n
Figure 2.6: Income from food sales in the service industry
Restaurants and coffee shops Take-away/fast food outlets Catering services

9
Source: Quantec EasyData (2018)
Source: Quantec EasyData (2018)
Figure 2.9 shows the South African food export destinations’ share of the main regions9 in 2018:
Q2. Among the main regions, Eastern Asia accounted for a largest share of around 21%,
9 The main regions which are included in the analysis are the top eight regions: SADC, Western Africa, EU; NAFTA (North Atlantic
Free Trade Area consists of USA, Canada and Mexico); Eastern Asia (includes China, Japan, North Korea, South Korea); Western Asia (mostly middle east countries); South Central Asia (include India, Pakistan and Bangladesh) and Australia and New Zealand.
Africa
26%
Americas
10%
Asia
34%
Europe
21%
Oceania
1%
Others
8%
Figure 2.7: The Food export destinations'share of continents in 2018: Q2
0
5
10
15
20
25
30
35
40
201
3: Q
2
201
3: Q
3
201
3: Q
4
201
4: Q
1
201
4: Q
2
201
4: Q
3
201
4: Q
4
201
5: Q
1
201
5: Q
2
201
5: Q
3
201
5: Q
4
201
6: Q
1
201
6: Q
2
201
6: Q
3
20
16
: Q
4
201
7: Q
1
20
17
: Q
2
201
7: Q
3
20
17
: Q
4
201
8: Q
1
201
8: Q
2
% s
ha
re
Figure 2.8: The food export destination's share of the continents
(2013:Q2-2018:Q2)
Africa Americas Asia Europe

10
followed by the European Union (20%), then SADC (excluding SACU) and SACU (Excluding
RSA) with 11% share each. NAFTA, South central Asia, Western Asia and Southern Eastern Asia
accounted for a share of 8%, 7%, 4% and 3%, respectively, in 2018:Q2.
Source: Quantec EasyData (2018)
Source: Quantec EasyData (2018)
Figure 2.10 shows the share of top the food export destination by countries in 2018: Q2. The
leading countries as South African food export destinations in 2018: Q2 were: China (8,9%), The
United States (6,7%), India (5,0%), Japan (4,5%), Uganda (3,6%), Mozambique (3,5%), the
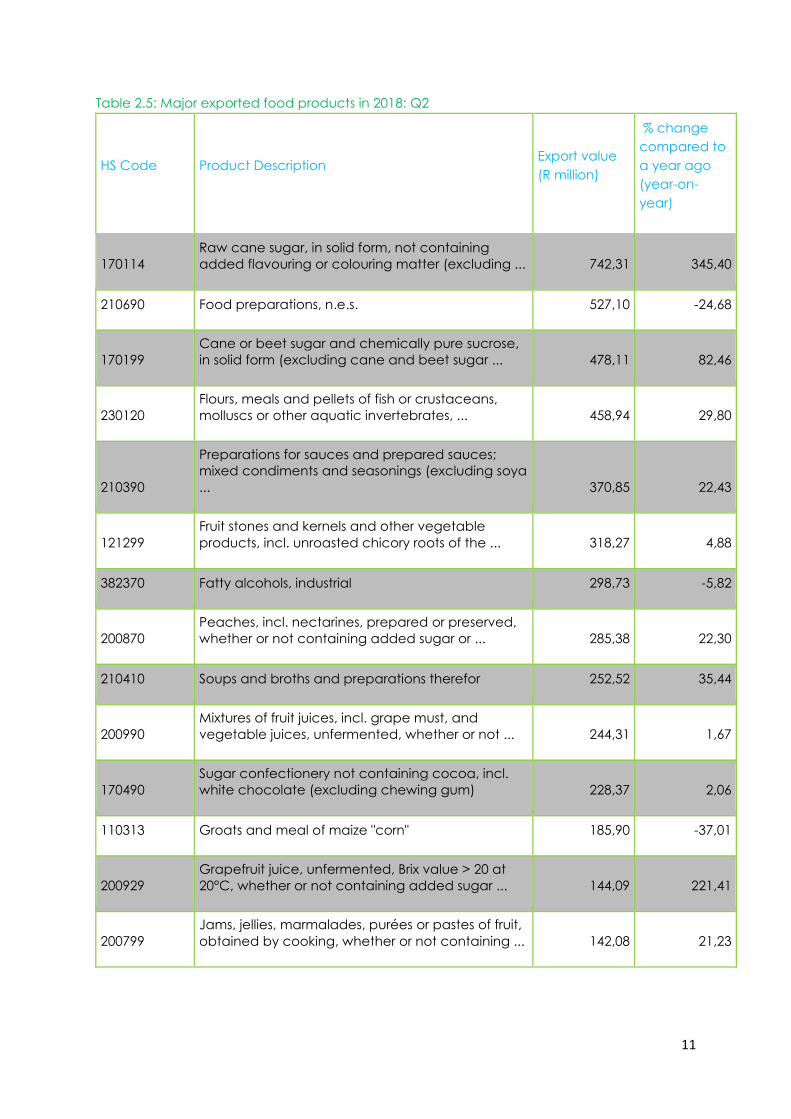
Netherlands (3,2%), Belgium (2,9%), Zambia (2,6%) and Zimbabwe (2,6%). Table 2.5 presents
the major exported food products during 2018: Q2. It shows the current quarter performance
values and their percentage change as compared to a year ago (year-on-year).
SADC (excluding
SACU)
11%
SACU (Excluding
RSA)
11%
NAFTA
8%
South-central
Asia
7%South-eastern
Asia
3%European Union
20%
Eastern Asia
21%
Western Asia
4%
Others
15%
Figure 2.9: The Food export destinations'share of main regions in 2018:
Q2
0
1
2
3
4
5
6
7
8
9
10
Ch
ina
Un
ite
d S
tate
s
Ind
ia
Ja
pa
n
Ug
an
da
Mo
zam
biq
ue
Ne
the
rla
nd
s
Be
lgiu
m
Za
mb
ia
Zim
ba
bw
e
% s
ha
re
Figure 2.10: The share of top ten food export destination countries in
2018: Q2
11
Table 2.5: Major exported food products in 2018: Q2
HS Code Product Description Export value
(R million)
% change
compared to
a year ago
(year-on-
year)
170114
Raw cane sugar, in solid form, not containing
added flavouring or colouring matter (excluding ... 742,31 345,40
210690 Food preparations, n.e.s. 527,10 -24,68
170199
Cane or beet sugar and chemically pure sucrose,
in solid form (excluding cane and beet sugar ... 478,11 82,46
230120
Flours, meals and pellets of fish or crustaceans,
molluscs or other aquatic invertebrates, ... 458,94 29,80
210390
Preparations for sauces and prepared sauces;
mixed condiments and seasonings (excluding soya
... 370,85 22,43
121299
Fruit stones and kernels and other vegetable
products, incl. unroasted chicory roots of the ... 318,27 4,88
382370 Fatty alcohols, industrial 298,73 -5,82
200870
Peaches, incl. nectarines, prepared or preserved,
whether or not containing added sugar or ... 285,38 22,30
210410 Soups and broths and preparations therefor 252,52 35,44
200990
Mixtures of fruit juices, incl. grape must, and
vegetable juices, unfermented, whether or not ... 244,31 1,67
170490
Sugar confectionery not containing cocoa, incl.
white chocolate (excluding chewing gum) 228,37 2,06
110313 Groats and meal of maize "corn" 185,90 -37,01
200929
Grapefruit juice, unfermented, Brix value > 20 at
20°C, whether or not containing added sugar ... 144,09 221,41
200799
Jams, jellies, marmalades, purées or pastes of fruit,
obtained by cooking, whether or not containing ... 142,08 21,23

12
040210
Milk and cream in solid forms, of a fat content by
weight of <= 1,5% 138,41 30,02
190531 Sweet biscuits 138,01 1,79
200989
Juice of fruit or vegetables, unfermented, whether
or not containing added sugar or other
sweetening ... 137,14 21,69
190190
Malt extract; food preparations of flour, groats,
meal, starch or malt extract, not containing ... 127,94 35,66
020130 Fresh or chilled bovine meat, boneless 127,35 -21,74
190590
Bread, pastry, cakes, biscuits and other bakers'
wares, whether or not containing cocoa;
communion ... 124,17 26,86
020120 Fresh or chilled bovine cuts, with bone in
(excluding carcasses and 1/2 carcasses) 121,13 29,10
Source: Trade map (2018)
Main source of food imports and imported food products
South Africa’s main source of food imports during 2018: Q2 is presented in Figure 2.11. Asia
accounted for a large share of food imports of approximately 44%, followed by Europe with
31%, then Africa and Americas with 12% and 10%, respectively. Oceania accounted for a
share of around 1%.
Source: Quantec EasyData (2018)
Africa
12%
Americas
10%
Asia
44%
Europe
31%
Oceania
2%Others
1%
Figure 2.11: The share of continents as a source of food import
(2018:Q2)
13
Source: Quantec EasyData (2018)
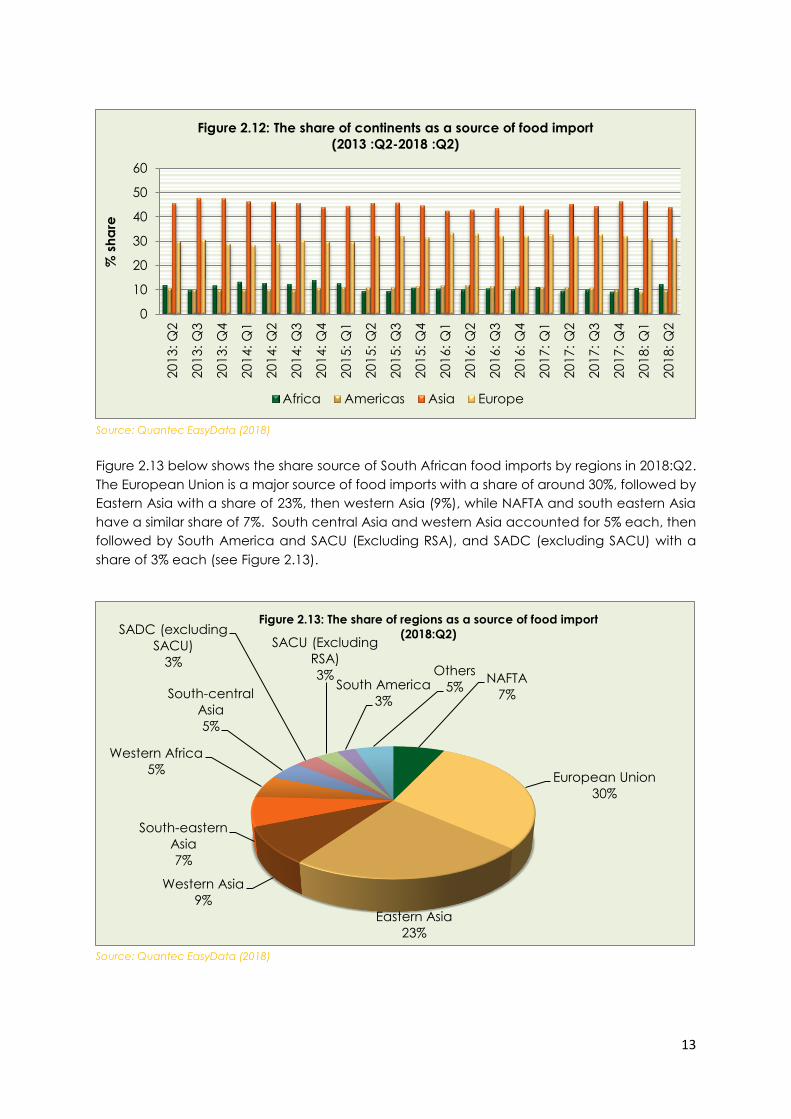
Figure 2.13 below shows the share source of South African food imports by regions in 2018:Q2.
The European Union is a major source of food imports with a share of around 30%, followed by
Eastern Asia with a share of 23%, then western Asia (9%), while NAFTA and south eastern Asia
have a similar share of 7%. South central Asia and western Asia accounted for 5% each, then
followed by South America and SACU (Excluding RSA), and SADC (excluding SACU) with a
share of 3% each (see Figure 2.13).
Source: Quantec EasyData (2018)
0
10
20
30
40
50
60201
3: Q
2
201
3: Q
3
201
3: Q
4
201
4: Q
1
201
4: Q
2
201
4: Q
3
201
4: Q
4
201
5: Q
1
201
5: Q
2
201
5: Q
3
201
5: Q
4
201
6: Q
1
201
6: Q
2
201
6: Q
3
201
6: Q
4
201
7: Q
1
201
7: Q
2
201
7: Q
3
201
7: Q
4
201
8: Q
1
201
8: Q
2
% s
ha
re
Figure 2.12: The share of continents as a source of food import
(2013 :Q2-2018 :Q2)
Africa Americas Asia Europe
NAFTA
7%
European Union
30%
Eastern Asia
23%
Western Asia
9%
South-eastern
Asia
7%
Western Africa
5%
South-central
Asia
5%
SADC (excluding
SACU)
3%
SACU (Excluding
RSA)
3%South America
3%
Others
5%
Figure 2.13: The share of regions as a source of food import
(2018:Q2)

14
Source: Quantec EasyData (2018)
Among the top ten countries that accounted for a large share of food imports in the 2018:Q2
were: China (17,7%), Germany (10,1%), the United States (6,0%), Saudi Arabia (5,2%), Nigeria
(4,4%), India (4,3%), United Kingdom (3,7%), Thailand (3,2%), Japan(3,2%) and Italy (2,8%).
Table 2.6: Major imported food products in 2018: Q2
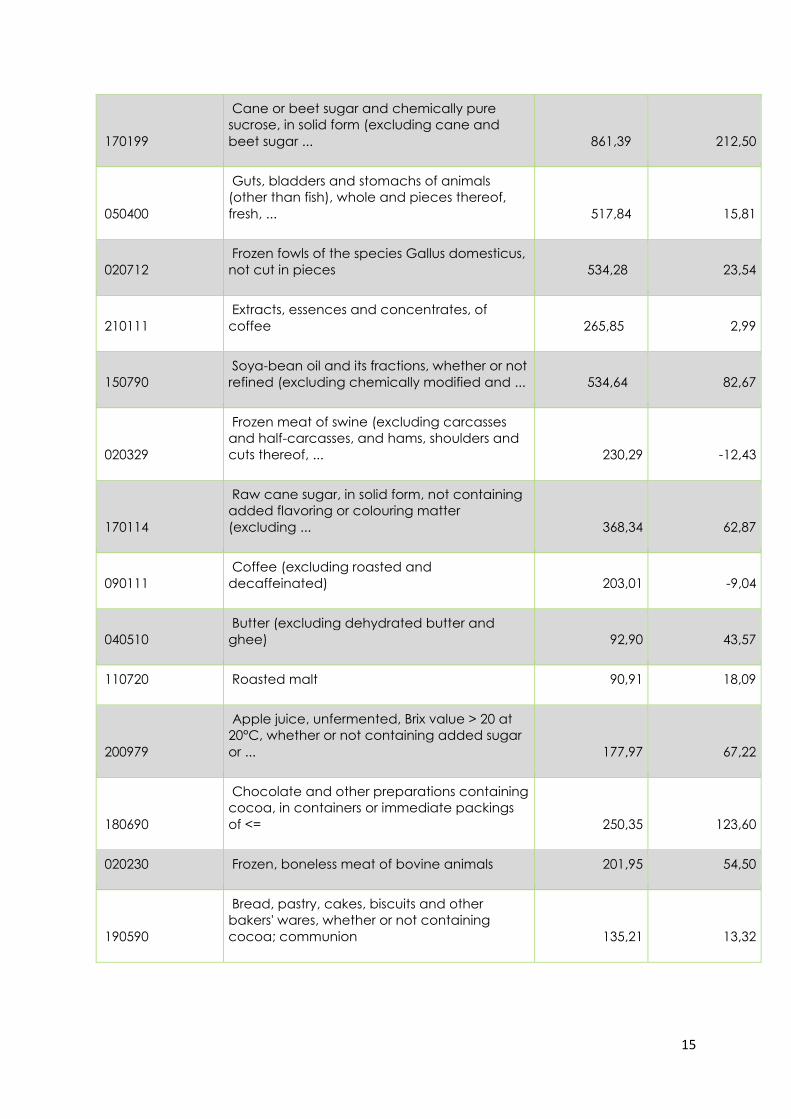
Table 2.6 presents the major imported food products during 2018: Q2, their current quarter
performance values and the year-on-year percentage changes.
HS Code Product description Import value
(R million)
% change
compared to a
year ago (year-
on-year)
020714
Frozen cuts and edible offal of fowls of the
species Gallus domesticus 961,80 -11,69
230400
Oilcake and other solid residues, whether or
not ground or in the form of pellets, resulting ... 543,01 -7,62
210690 Food preparations, n.e.s. 573,66 11,71
170113
Raw cane sugar, in solid form, not containing
added flavouring or colouring matter,
obtained ... 450,53 -46,77
0.0
2.0
4.0
6.0
8.0
10.0
12.0
14.0
16.0
18.0
20.0
Ch
ina
Ge
rma
ny
Un
ite
d S
tate
s
Sa
ud
i A
rab
ia
Nig
eria
Ind
ia
Un
ite
d K
ing
do
m
Tha
ilan
d
Ja
pa
n
Ita
ly
% s
ha
re
Figure 2.14: The share of top ten countries as a source of food import in
2018: Q2
15
170199
Cane or beet sugar and chemically pure
sucrose, in solid form (excluding cane and
beet sugar ... 861,39 212,50
050400
Guts, bladders and stomachs of animals
(other than fish), whole and pieces thereof,
fresh, ... 517,84 15,81
020712
Frozen fowls of the species Gallus domesticus,
not cut in pieces 534,28 23,54
210111
Extracts, essences and concentrates, of
coffee 265,85 2,99
150790
Soya-bean oil and its fractions, whether or not
refined (excluding chemically modified and ... 534,64 82,67
020329
Frozen meat of swine (excluding carcasses
and half-carcasses, and hams, shoulders and
cuts thereof, ... 230,29 -12,43
170114
Raw cane sugar, in solid form, not containing
added flavoring or colouring matter
(excluding ... 368,34 62,87
090111
Coffee (excluding roasted and
decaffeinated) 203,01 -9,04
040510
Butter (excluding dehydrated butter and
ghee) 92,90 43,57
110720 Roasted malt 90,91 18,09
200979
Apple juice, unfermented, Brix value > 20 at
20°C, whether or not containing added sugar
or ... 177,97 67,22
180690
Chocolate and other preparations containing
cocoa, in containers or immediate packings
of <= 250,35 123,60
020230 Frozen, boneless meat of bovine animals 201,95 54,50
190590
Bread, pastry, cakes, biscuits and other
bakers' wares, whether or not containing
cocoa; communion 135,21 13,32

16
170490
Sugar confectionery not containing cocoa,
incl. white chocolate (excluding chewing
gum) 132,93 18,64
020629
Frozen edible bovine offal (excluding tongues
and livers) 77,34 -0,87
350510
Dextrins and other modified starches, e.g.
pregelatinised or esterified starches 122,15 13,56
Source: Trade map (2018)
Source: Quantec EasyData (2018)
Figure 2.15 shows the quarterly trade balance of food products. The quarter-to-quarter exports
of food rebounded by 10,1% from a 17,0% contraction in the last quarter, however, registered
an improved negative growth of 1,1% year-on-year. Imports on the other hand, stagnated at
5,9% quarter-to-quarter, while they contracted by 1,0% year-on-year from a 11,0% growth in
the last quarter. As a result, the trade balance rebounded from R435,5 million deficit in the last
quarter to a R729,6 million surplus in the current quarter.
0
1,000
2,000
3,000
4,000
5,000
6,000
7,000
8,000
9,000
10,000
201
3: Q
2
201
3: Q
3
201
3: Q
4
201
4: Q
1
201
4: Q
2
201
4: Q
3
201
4: Q
4
201
5: Q
1
201
5: Q
2
201
5: Q
3
201
5: Q
4
20
16
: Q
1
201
6: Q
2
201
6: Q
3
201
6: Q
4
201
7: Q
1
201
7: Q
2
201
7: Q
3
20
17
: Q
4
201
8: Q
1
201
8: Q
2
R m
illio
n
Figure 2.15: Quarterly trade balance of food products
Export Import
17
2.6 EMPLOYMENT
Source: Statistics SA (2018i)
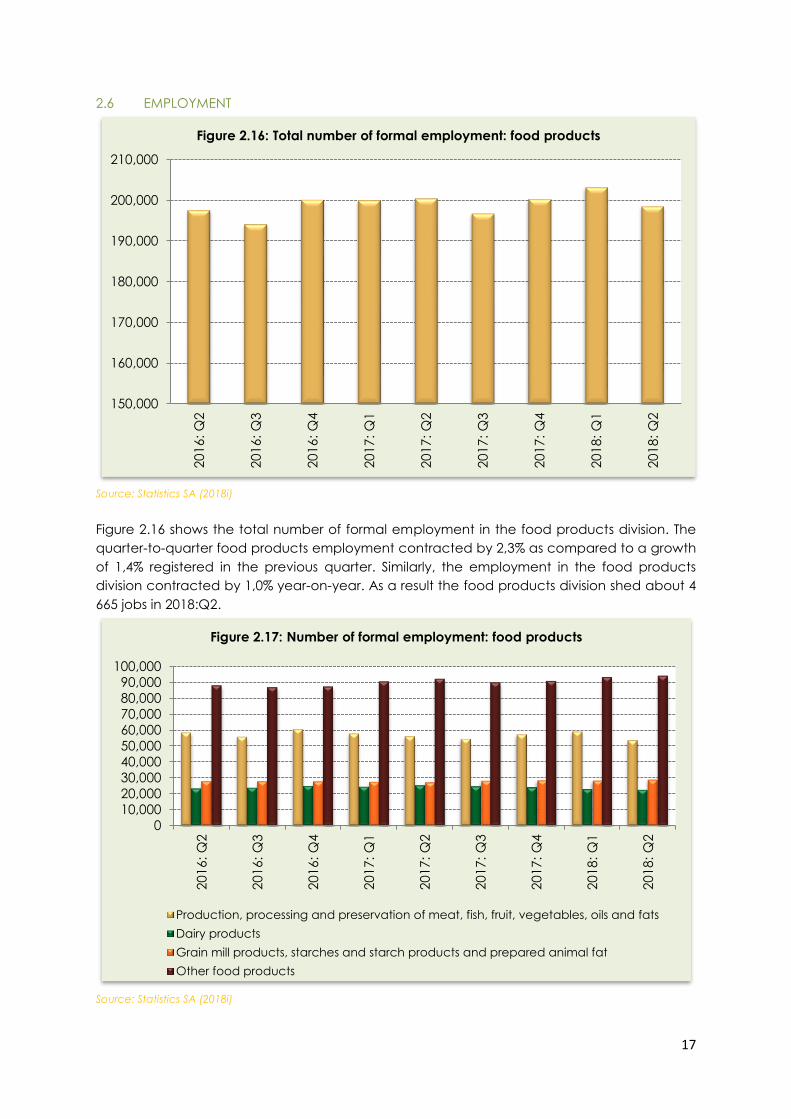
Figure 2.16 shows the total number of formal employment in the food products division. The
quarter-to-quarter food products employment contracted by 2,3% as compared to a growth
of 1,4% registered in the previous quarter. Similarly, the employment in the food products
division contracted by 1,0% year-on-year. As a result the food products division shed about 4
665 jobs in 2018:Q2.
Source: Statistics SA (2018i)
150,000
160,000
170,000
180,000
190,000
200,000
210,000
201
6: Q
2
201
6: Q
3
201
6: Q
4
201
7: Q
1
201
7: Q
2
201
7: Q
3
201
7: Q
4
201
8: Q
1
201
8: Q
2
Figure 2.16: Total number of formal employment: food products
0
10,000
20,000
30,000
40,000
50,000
60,000
70,000
80,000
90,000
100,000
201
6: Q
2
20
16
: Q
3
201
6: Q
4
201
7: Q
1
201
7: Q
2
201
7: Q
3
201
7: Q
4
201
8: Q
1
201
8: Q
2Figure 2.17: Number of formal employment: food products
Production, processing and preservation of meat, fish, fruit, vegetables, oils and fats
Dairy products
Grain mill products, starches and starch products and prepared animal fat
Other food products

18
Figure 2.17 shows the number of formal employment in the food products division items. The
quarter-to-quarter formal employment of meat, fish, fruit contracted by 9,4%, dairy products
registered an improved negative growth of 1,7%, grain mill products rebounded by 1,8%,
‘’other food’’ products moderated by 0,8%. In terms of the year-on-year employment
performance, meat fish fruit contracted by 4,5%, dairy decelerated by 11,2%, grain mill
products grew modestly by 6,1% and ‘’other food products’’ moderated by 2,0%.
2.7 OUTLOOK
Table 2.7: Net balance10 of BER manufacturing survey: food products
2017: Q4 2017: Q1 2018: Q2 2018: Q3*
Domestic sales volumes 9 9 -14 32
Export sales volumes 20 12 -30 15
Production volumes 30 19 -15 32
Domestic order volumes received 42 16 -17 32
Export order volumes received 37 12 -33 12
General business conditions 0 3 -36 23
Number of factory workers -24 -29 0 3
Fixed investment 43 -24 70 67
Business confidence11 53 49 33
Expected volume of goods imported in
12 months’ time -6 19 -35
Expected volume of goods exported in
12 months’ time 29 54 18
10 BER calculates the net balance statistics by subtracting the percentage of the respondents replying “down” from
the percentage replying “up” to a particular question. Respondents are asked to compare the current quarter’s
experience to that of a year ago. A positive net balance implies an improvement (i.e. positive year-on-year growth)
and vice versa. Therefore, the net balance varies from -100 to 100 where -100 is the most negative response; zero is a
situation of no change and 100 is the most positive response.
11 BER calculates the business confidence index by asking respondents to rate current business conditions as “satisfactory” or
“unsatisfactory”. Then the index is derived as a gross percentage of the respondents replying “satisfactory.” A value of 50 is
indicative of neutrality, 100 indicative of extreme confidence and 0 of extreme lack of confidence. An index greater than 50 shows
the majority of respondents are satisfied with the prevailing economic conditions.

19
2017: Q4 2017: Q1 2018: Q2 2018: Q3*
Expected real investment in machinery
and equipment in 12 months’ time -37 40 -17
Expected business conditions in 12
months’ time -14 54 18
*Expected Source: BER (2018)
A survey of food manufacturing by the Bureau for Economic Research (BER) is presented in
Table 2.7. The survey shows that the year-on-year outlook for 2018: Q3 is positive for all the
variables.
3. BEVERAGES
Beverages according to SIC classification is code 305 and comprises of the following beverage
products:
Distilling, rectifying and blending of spirits; ethyl alcohol production from fermented
materials;
Manufacture of wine
Manufacture of beer and other malt liquors and malt
Breweries, except sorghum beer breweries
Sorghum beer breweries
Manufacture of malt
Manufacture of soft drinks; production of mineral waters.
3.1 PRICE
Table 3.1 below shows the consumer price indices, producer price indices and export unit
value of beverages. The year-on-year and quarter-to-quarter consumer price inflation for
alcoholic beverages grew by 4,3% and 1,4% respectively. The beverages products that grew
during the period under review were: beer, spirits, wine, cold beverages and hot beverages
by 8,7%, 7,6%, 7,5%, 6,5% and 4,9%, respectively.
Table 3.1: Price indices of beverages
Indices % change between
Beverages products
Weight 2017:
Q2
2018:
Q1 2018: Q2
2017: Q2
and 2018:
Q2
2018: Q1
and 2017:
Q2
Consumer price indices
All items (CPI
Headline)
100 102,6 105,5 107,0 4,3 1,4
Alcoholic beverages 3,9 101,4 106,4 109,7 8,2 3,0
Spirits 0,8 101,5 105,1 109,1 7,6 3,8

20
Wine 0,7 104,4 108,5 112,3 7,5 3,5
Beer 2,5 100,0 106,0 108,7 8,7 2,5
Non-alcoholic
beverages
1,2 103,1 105,4 109,2 5,9 3,5
Hot beverages 0,3 104,9 107,7 110,1 4,9 2,2
Cold beverages 0,9 102,1 104,2 108,7 6,5 4,3
Source: Stats SA (2018a, 2018b, 2018
Producer price index and export unit value
Producer price index
Weight 2017:
Q2
2018:
Q1 2018: Q2
2017: Q2
and 2018:
Q2
2018: Q1
and 2017:
Q2
Beverages 8,5 100,6 105,6 108,2 7,6 2,5
Export Unit value
Beverages 135,2 91,9 88,5 88,9 -3,3 0,5
Source: Quantec, 2018
The producer price index for beverages was 7,6% year-on-year and 2,5% quarter-to-quarter.
The exports unit value for beverages was negative at 3,3% year-on-year, however, grew by
0,5% quarter-to-quarter
3.2 PRODUCTION
Source: Statistics SA (2018d)
50
60
70
80
90
100
110
201
2: Q
4
201
3: Q
1
201
3: Q
2
201
3: Q
3
201
3: Q
4
201
4: Q
1
201
4: Q
2
201
4: Q
3
201
4: Q
4
201
5: Q
1
20
15
: Q
2
201
5: Q
3
201
5: Q
4
201
6: Q
1
201
6: Q
2
201
6: Q
3
201
6: Q
4
201
7: Q
1
201
7: Q
2
201
7: Q
3
201
7: Q
4
Ind
ex (
2015=
100)
Figure 3.1: Seasonally adjusted physical volume of production:
beverages

21
Figure 3.1 presents the seasonally adjusted physical volume of production for beverages.
During 2018: Q2, the quarter-to-quarter seasonally adjusted physical volume of production for
beverages moderated by 0,8% from a 1,2% growth recorded in the last quarter, however
contracted by 1,4% year-on-year.
Production capacity
Table 3.2: Utilisation and reasons for underutilisation of production capacity by large
enterprises: Beverages division (percentage)
Period Utilisation Reasons for underutilisation
Total
under-
utilisation
Shortage of Insufficient
demand
Other
Raw
materials
Labour
Skilled Semi and
unskilled
2017: Q2 84,5 15,5 3,6 0,9 0,3 8,2 2,6
2017: Q1 83,4 16,6 4,4 0,9 0,3 8,5 2,5
2018: Q2 83,8 16,2 3,7 0,9 0,3 8,3 3,0
Source: Statistics SA (2018e)
Table 3.2 shows that the year-on-year utilisation capacity by large enterprises for beverages
division moderated year-on-year, however, grew marginally quarter-to-quarter. Insufficient
demand, remains the main reason for underutilisation, followed by shortage of raw materials.
3.3 VALUE OF SALES
Source: Statistics SA (2018d)
0
5,000
10,000
15,000
20,000
25,000
30,000
35,000
40,000
201
3: Q
2
201
3: Q
3
201
3: Q
4
20
14
: Q
1
201
4: Q
2
201
4: Q
3
201
4: Q
4
201
5: Q
1
201
5: Q
2
201
5: Q
3
201
5: Q
4
201
6: Q
1
201
6: Q
2
201
6: Q
3
201
6: Q
4
201
7: Q
1
201
7: Q
2
201
7: Q
3
201
7: Q
4
201
8: Q
1
201
8: Q
2
R m
illio
n
Figure 3.2: Seasonally adjusted value of sales (current prices): beverages

22
During 2018: Q2. The quarter-to-quarter seasonally adjusted value of sales for beverages grew
marginally by 2,0% in 2018: Q2, from 0,7% growth in the last quarter. However, the year-on-year
seasonally adjusted value of sales for beverages moderated by 4,5% from 4,6% growth in the
preceding quarter (see Figure 3.2).
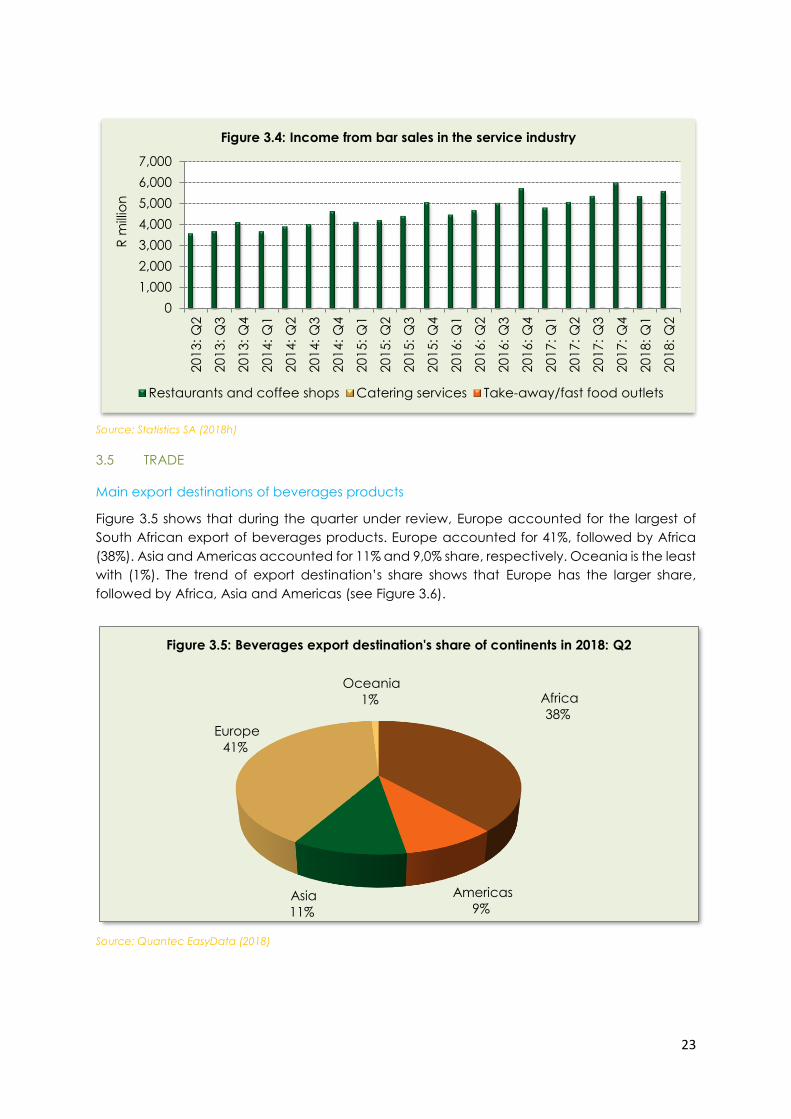
3.4 INCOME FROM BAR SALES IN THE SERVICE INDUSTRY12
Figure 3.3 below shows the total income for bar sales in the food and beverages service
industry in 2018: Q2. The income from bar sales in the food and beverages service industry
rebounded by 4,7% as compared to a 10,8% contraction in the previous quarter. However, it
moderated by 10,4% year-on-year. The total income stood at R1,8 billion under the period from
R1,7 billion in the previous quarter.
Source: Statistics SA (2018h)
Figure 3.4 below shows the performance of the bar sales in the service industry, which include
restaurant and coffee shops, take-away/fast food outlets and catering services. During 2018:
Q2, restaurant and coffee shops moderated by 4,7% from 10,8% growth in the last quarter,
However, take-away/fast food remained unchanged as compared to last quarter
performance of a negative 7,9% growth. Catering services remained unchanged also for two
last consecutive quarters. On the other hand, the year-on-year income for restaurants and
coffee shops and Take away/fast food outlets moderated by 10,4% and 14,7% from a 11,5%
and 27,9% growth respectively in the last quarter. However catering services stagnated at
3,8%.
12 Income from bar sales refers to income from liquor sales.
0
1,000
2,000
3,000
4,000
5,000
6,000
7,000
201
3: Q
2
201
3: Q
3
201
3: Q
4
201
4: Q
1
201
4: Q
2
201
4: Q
3
201
4: Q
4
201
5: Q
1
201
5: Q
2
201
5: Q
3
201
5: Q
4
201
6: Q
1
20
16
: Q
2
201
6: Q
3
201
6: Q
4
201
7: Q
1
201
7: Q
2
201
7: Q
3
201
7: Q
4
201
8: Q
1
201
8: Q
2
R m
illio
n
Figure 3.3: Total income from bar sales in the service industry
23
Source: Statistics SA (2018h)
3.5 TRADE
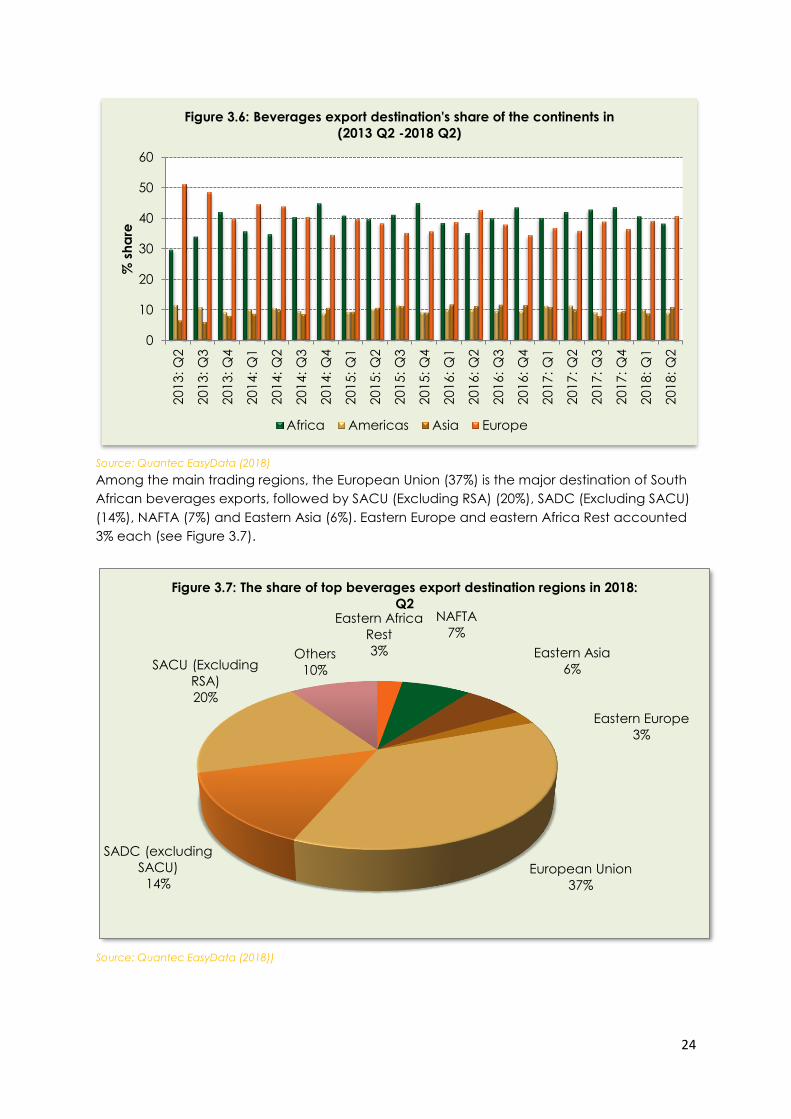
Main export destinations of beverages products
Figure 3.5 shows that during the quarter under review, Europe accounted for the largest of
South African export of beverages products. Europe accounted for 41%, followed by Africa
(38%). Asia and Americas accounted for 11% and 9,0% share, respectively. Oceania is the least
with (1%). The trend of export destination’s share shows that Europe has the larger share,
followed by Africa, Asia and Americas (see Figure 3.6).
Source: Quantec EasyData (2018)
0
1,000
2,000
3,000
4,000
5,000
6,000
7,000
201
3: Q
2
201
3: Q
3
201
3: Q
4
201
4: Q
1
201
4: Q
2
201
4: Q
3
201
4: Q
4
201
5: Q
1
201
5: Q
2
201
5: Q
3
201
5: Q
4
201
6: Q
1
201
6: Q
2
201
6: Q
3
201
6: Q
4
201
7: Q
1
201
7: Q
2
20
17
: Q
3
201
7: Q
4
201
8: Q
1
201
8: Q
2
R m
illio
n
Figure 3.4: Income from bar sales in the service industry
Restaurants and coffee shops Catering services Take-away/fast food outlets
Africa
38%
Americas
9%Asia
11%
Europe
41%
Oceania
1%
Figure 3.5: Beverages export destination's share of continents in 2018: Q2
24
Source: Quantec EasyData (2018)
Among the main trading regions, the European Union (37%) is the major destination of South
African beverages exports, followed by SACU (Excluding RSA) (20%), SADC (Excluding SACU)
(14%), NAFTA (7%) and Eastern Asia (6%). Eastern Europe and eastern Africa Rest accounted
3% each (see Figure 3.7).
Source: Quantec EasyData (2018))
0
10
20
30
40
50
60
201
3: Q
2
201
3: Q
3
201
3: Q
4
20
14
: Q
1
201
4: Q
2
201
4: Q
3
201
4: Q
4
201
5: Q
1
201
5: Q
2
201
5: Q
3
201
5: Q
4
201
6: Q
1
201
6: Q
2
201
6: Q
3
201
6: Q
4
201
7: Q
1
201
7: Q
2
201
7: Q
3
201
7: Q
4
201
8: Q
1
201
8: Q
2
% s
ha
reFigure 3.6: Beverages export destination's share of the continents in
(2013 Q2 -2018 Q2)
Africa Americas Asia Europe
Eastern Africa
Rest
3%
NAFTA
7%
Eastern Asia
6%
Eastern Europe
3%
European Union
37%
SADC (excluding
SACU)
14%
SACU (Excluding
RSA)
20%
Others
10%
Figure 3.7: The share of top beverages export destination regions in 2018:
Q2

25
Source: Quantec EasyData (2018)
Figure 3.8 above shows the share of top ten beverages export destinations during 2018: Q2.
The following are the main countries that accounted for a significant share of beverages
exported by South Africa during the quarter under review: Namibia (8,8%), Germany (7,9%),
the United States of America (4,5%), the Netherlands (4,5%), Zambia (4,1%), France (3,8%),
Mozambique (3,6%), China (3,1%), Denmark (2,9%) and Canada (2,8%). Table 3.3 below
presents the major exported beverages during the current quarter of review and the year-on-
year performance.
Table 3.3: Major exported beverages products in 2018: Q2 and year-on-year percentage
change
0
1
2
3
4
5
6
7
8
9
10
Na
mib
ia
Ge
rma
ny
Un
ite
d S
tate
s
Ne
the
rla
nd
s
Za
mb
ia
Fra
nc
e
Mo
zam
biq
ue
Ch
ina
De
nm
ark
Ca
na
da
% s
ha
re
Figure 3.8: The share of top ten beverages export destination countries in
2018: Q2
Hs code Product description Export
value
(R million)
% change
compared to
a year ago
(year-on-year)
220421
Wine of fresh grapes, incl. fortified wines,
and grape must whose fermentation has
been arrested 1678,1 6,2
220429
Wine of fresh grapes, incl. fortified wines,
and grape must whose fermentation has
been arrested 587,2 21,8
220710
Undenatured ethyl alcohol, of actual
alcoholic strength of >= 80% 340,9 -64,1

26
220210
Waters, incl. mineral and aerated, with
added sugar, sweetener or flavour, for
direct consumption 320,8 22,7
220422
Wine of fresh grapes, incl. fortified wines,
and grape must whose fermentation has
been arrested 226,4 13,1
220300 Beer made from malt 219,9 5,1
220600
Cider, perry, mead and other fermented
beverages and mixtures of fermented
beverages and non-alcoholic 213,4 2,4
220870 Liqueurs and cordials 184,0 -18,6
220299
Non-alcoholic beverages (excl. water, fruit
or vegetable juices, milk and beer) 126,3 -13,6
220820
Spirits obtained by distilling grape wine or
grape marc 121,6 -3,6
220410 Sparkling wine of fresh grapes 103,3 43,1
220830 Whiskies 76,3 -26,2
220720
Denatured ethyl alcohol and other spirits of
any strength 69,6 -34,5
220860 Vodka 64,5 -34,7
220850 Gin and Geneva 43,3 19,6
220890
Ethyl alcohol of an alcoholic strength of <
80% vol, not denatured; spirits and other
spirituous 36,3 -7,5
220110
Mineral waters and aerated waters, not
containing added sugar, other sweetening
matter or flavoured 15,4 6,6
220840
Rum and other spirits obtained by distilling
fermented sugar-cane products 15,3 -21,2
220900
Vinegar, fermented vinegar and substitutes
for vinegar obtained from acetic acid 12,9 20,9
27
Source: trade map 2018
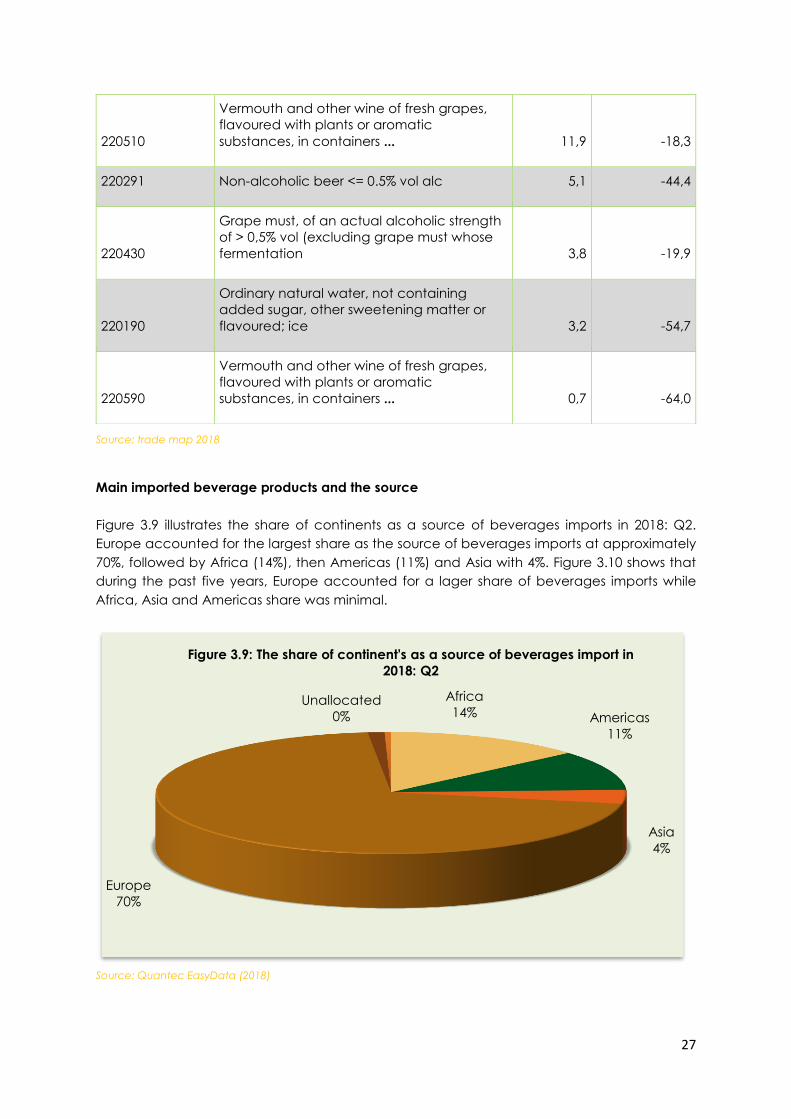
Main imported beverage products and the source
Figure 3.9 illustrates the share of continents as a source of beverages imports in 2018: Q2.
Europe accounted for the largest share as the source of beverages imports at approximately
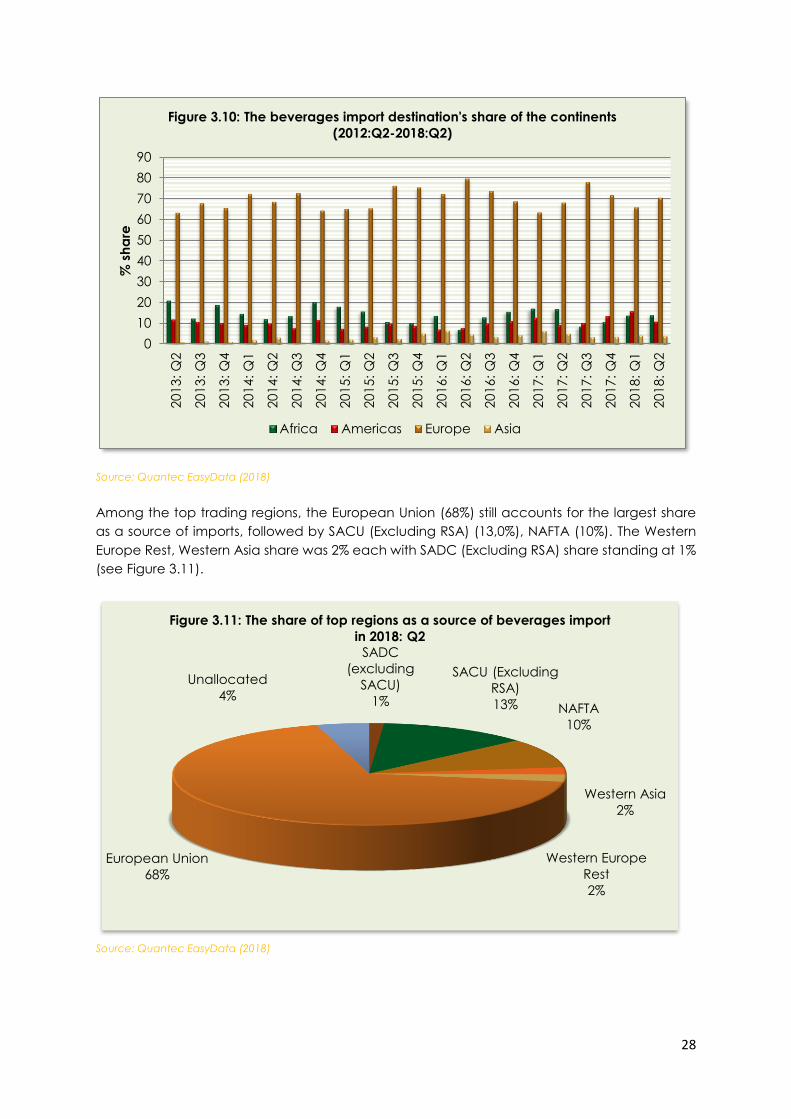
70%, followed by Africa (14%), then Americas (11%) and Asia with 4%. Figure 3.10 shows that
during the past five years, Europe accounted for a lager share of beverages imports while
Africa, Asia and Americas share was minimal.
Source: Quantec EasyData (2018)
Africa
14% Americas
11%
Asia
4%
Europe
70%
Unallocated
0%
Figure 3.9: The share of continent's as a source of beverages import in
2018: Q2
220510
Vermouth and other wine of fresh grapes,
flavoured with plants or aromatic
substances, in containers ... 11,9 -18,3
220291 Non-alcoholic beer <= 0.5% vol alc 5,1 -44,4
220430
Grape must, of an actual alcoholic strength
of > 0,5% vol (excluding grape must whose
fermentation 3,8 -19,9
220190
Ordinary natural water, not containing
added sugar, other sweetening matter or
flavoured; ice 3,2 -54,7
220590
Vermouth and other wine of fresh grapes,
flavoured with plants or aromatic
substances, in containers ... 0,7 -64,0
28
Source: Quantec EasyData (2018)
Among the top trading regions, the European Union (68%) still accounts for the largest share
as a source of imports, followed by SACU (Excluding RSA) (13,0%), NAFTA (10%). The Western
Europe Rest, Western Asia share was 2% each with SADC (Excluding RSA) share standing at 1%
(see Figure 3.11).
Source: Quantec EasyData (2018)
0
10
20
30
40
50
60
70
80
90
201
3: Q
2
201
3: Q
3
201
3: Q
4
201
4: Q
1
201
4: Q
2
201
4: Q
3
20
14
: Q
4
201
5: Q
1
201
5: Q
2
201
5: Q
3
201
5: Q
4
201
6: Q
1
201
6: Q
2
201
6: Q
3
201
6: Q
4
201
7: Q
1
201
7: Q
2
201
7: Q
3
201
7: Q
4
20
18
: Q
1
201
8: Q
2
% s
ha
re
Figure 3.10: The beverages import destination's share of the continents
(2012:Q2-2018:Q2)
Africa Americas Europe Asia
SADC
(excluding
SACU)
1%
SACU (Excluding
RSA)
13% NAFTA
10%
Western Asia
2%
Western Europe
Rest
2%
European Union
68%
Unallocated
4%
Figure 3.11: The share of top regions as a source of beverages import
in 2018: Q2

29
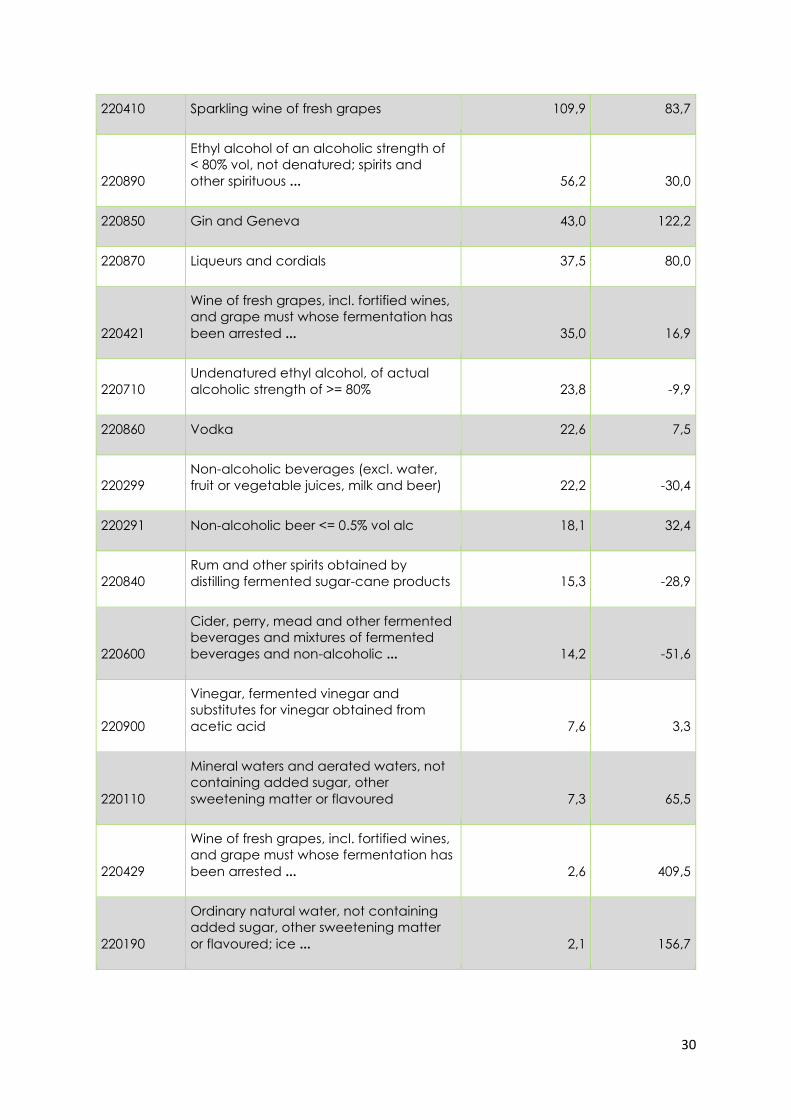
Source: Quantec EasyData (2018)
Figure 3.12 above shows the share of the top ten countries as a source of beverages imports.
During 2018: Q2, the United Kingdom accounted for 23,1% share of beverages imports,
followed by France (17,6%), Namibia (12,1%), Netherlands (7,2%), Belgium (5,5%), the United
States (4,6%), Mexico (4,4%), Spain (3,6%), Germany (3,3%) and Austria (3,2%). Table 3.5
presents major imported beverages products during the current quarter of review, and the
year-on-year performance.
Table 3.5: Imported beverages in 2018: Q2 and year-on-year percentage change
HS CODE Product description Import value
(R million)
% change
compared to
a year ago
(year-on-year)
220300 Beer made from malt 512,5 112,0
220830 Whiskies 479,7 2,2
220820
Spirits obtained by distilling grape wine or
grape marc 219,2 183,0
220210
Waters, incl. mineral and aerated, with
added sugar, sweetener or flavour, for
direct consumption ... 198,4 13,3
0
5
10
15
20
25
30
35
40
Un
ite
d K
ing
do
m
Fra
nc
e
Na
mib
ia
Ne
the
rla
nd
s
Be
lgiu
m
Un
ite
d S
tate
s
Me
xic
o
Sp
ain
Ge
rma
ny
Au
stria
% s
ah
re
Figure 3.12: The share of top ten countries as a source of beverages
import in 2018: Q2
30
220410 Sparkling wine of fresh grapes 109,9 83,7
220890
Ethyl alcohol of an alcoholic strength of
< 80% vol, not denatured; spirits and
other spirituous ... 56,2 30,0
220850 Gin and Geneva 43,0 122,2
220870 Liqueurs and cordials 37,5 80,0
220421
Wine of fresh grapes, incl. fortified wines,
and grape must whose fermentation has
been arrested ... 35,0 16,9
220710
Undenatured ethyl alcohol, of actual
alcoholic strength of >= 80% 23,8 -9,9
220860 Vodka 22,6 7,5
220299
Non-alcoholic beverages (excl. water,
fruit or vegetable juices, milk and beer) 22,2 -30,4
220291 Non-alcoholic beer <= 0.5% vol alc 18,1 32,4
220840
Rum and other spirits obtained by
distilling fermented sugar-cane products 15,3 -28,9
220600
Cider, perry, mead and other fermented
beverages and mixtures of fermented
beverages and non-alcoholic ... 14,2 -51,6
220900
Vinegar, fermented vinegar and
substitutes for vinegar obtained from
acetic acid 7,6 3,3
220110
Mineral waters and aerated waters, not
containing added sugar, other
sweetening matter or flavoured 7,3 65,5
220429
Wine of fresh grapes, incl. fortified wines,
and grape must whose fermentation has
been arrested ... 2,6 409,5
220190
Ordinary natural water, not containing
added sugar, other sweetening matter
or flavoured; ice ... 2,1 156,7

31
220422
Wine of fresh grapes, incl. fortified wines,
and grape must whose fermentation has
been arrested ... 0,7 989,4
220510
Vermouth and other wine of fresh
grapes, flavoured with plants or aromatic
substances, in containers ... 0,3 -74,2
220720
Denatured ethyl alcohol and other spirits
of any strength 0,1 120,0
Source: Source: trade map 2018
Source: Quantec EasyData (2018)
During 2018: Q2: the quarter-to-quarter exports of beverages rebounded by 15,9%, following
a 24,5% contraction recorded in the last quarter. However, the year-on-year exports
moderated by 4,5% from a 7,2% growth in the preceding quarter. Imports on the other hand,
rebounded by 17,4% from 0,6% contraction quarter-to-quarter, but grew by 46,8% year-on-
year. As a result, the trade surplus widened from R2 032.4 million in the previous quarter to R2
327.8 million in the current quarter.
0
1,000
2,000
3,000
4,000
5,000
6,000
20
13
: Q
2
20
13:
Q3
20
13
: Q
4
20
14:
Q1
20
14:
Q2
20
14:
Q3
20
14:
Q4
20
15:
Q1
20
15:
Q2
20
15:
Q3
20
15:
Q4
20
16:
Q1
20
16:
Q2
20
16:
Q3
20
16:
Q4
20
17:
Q1
20
17:
Q2
20
17:
Q3
20
17:
Q4
20
18:
Q1
20
18:
Q2
R m
illio
n
Figure 3.13: Quarterly trade balance of beverages
Export Import

32
3.6 EMPLOYMENT
Source: Quantec EasyData (2018i)
Figure 3.14 shows the number of formal employment in the beverages and tobacco products
industry. The quarter-to-quarter formal employment in the beverages and tobacco division
contracted by 8,1% from a 6,1% growth in the last quarter. However, it decelerated by 6,7%
year-on-year from 6,0% contraction in the preceding quarter. As a result, 3 362 jobs were shed.
3.7 OUTLOOK
Table 3.6: Net balance of BER manufacturing survey: Beverages
2017: Q4 2018: Q1 2018: Q2 2018: Q3*
Domestic sales volumes -44 30 76 96
Export sales volumes -67 9 54 61
Production volumes 2 30 71 81
Domestic order volumes received 7 43 88 87
Export order volumes received -67 16 52 61
General business conditions -75 6 65 56
Number of factory workers -27 14 -37 -37
34,000
35,000
36,000
37,000
38,000
39,000
40,000
41,000
42,000
43,000
44,000
45,000201
6: Q
2
201
6: Q
3
201
6: Q
4
201
7: Q
1
201
7: Q
2
201
7: Q
3
201
7: Q
4
201
8: Q
1
201
8: Q
2
Figure 3.14: Number of formal employment: beverage and tobacco
products
33
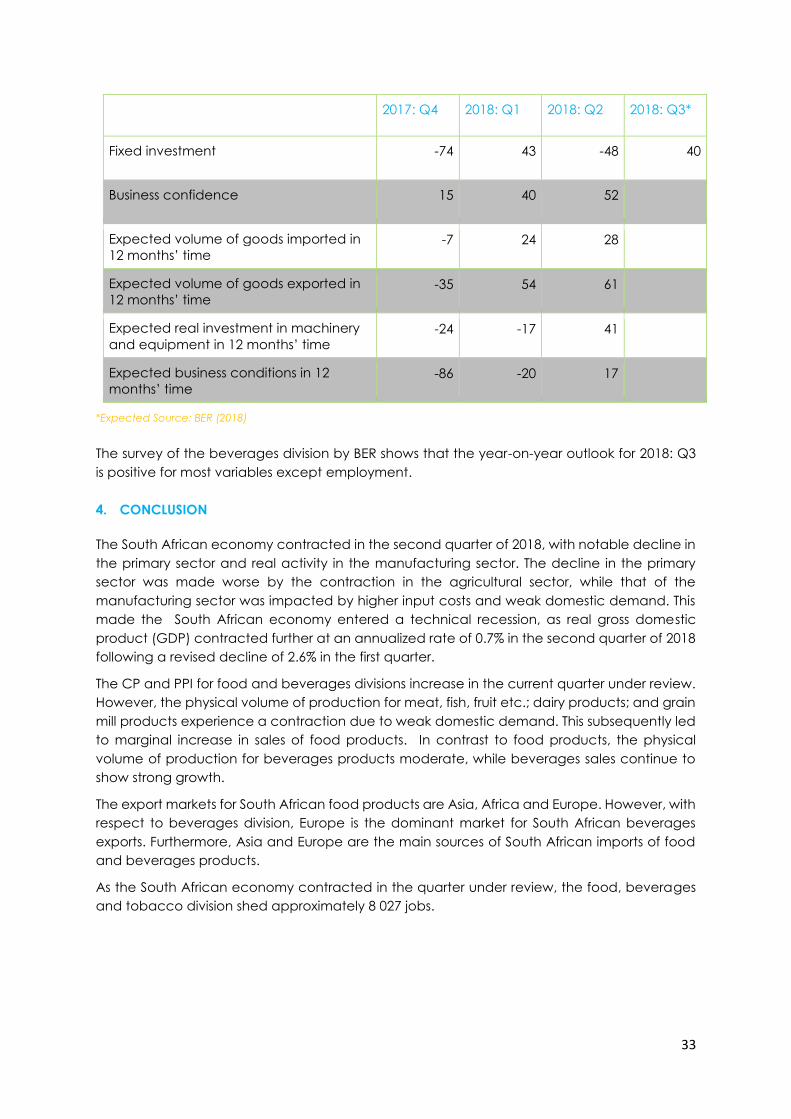
2017: Q4 2018: Q1 2018: Q2 2018: Q3*
Fixed investment -74 43 -48 40
Business confidence 15 40 52
Expected volume of goods imported in
12 months’ time -7 24 28
Expected volume of goods exported in
12 months’ time -35 54 61
Expected real investment in machinery
and equipment in 12 months’ time -24 -17 41
Expected business conditions in 12
months’ time -86 -20 17
*Expected Source: BER (2018)
The survey of the beverages division by BER shows that the year-on-year outlook for 2018: Q3
is positive for most variables except employment.
4. CONCLUSION
The South African economy contracted in the second quarter of 2018, with notable decline in
the primary sector and real activity in the manufacturing sector. The decline in the primary
sector was made worse by the contraction in the agricultural sector, while that of the
manufacturing sector was impacted by higher input costs and weak domestic demand. This
made the South African economy entered a technical recession, as real gross domestic
product (GDP) contracted further at an annualized rate of 0.7% in the second quarter of 2018
following a revised decline of 2.6% in the first quarter.
The CP and PPI for food and beverages divisions increase in the current quarter under review.
However, the physical volume of production for meat, fish, fruit etc.; dairy products; and grain
mill products experience a contraction due to weak domestic demand. This subsequently led
to marginal increase in sales of food products. In contrast to food products, the physical
volume of production for beverages products moderate, while beverages sales continue to
show strong growth.
The export markets for South African food products are Asia, Africa and Europe. However, with
respect to beverages division, Europe is the dominant market for South African beverages
exports. Furthermore, Asia and Europe are the main sources of South African imports of food
and beverages products.
As the South African economy contracted in the quarter under review, the food, beverages
and tobacco division shed approximately 8 027 jobs.
34
5. REFERENCES
BER (2018), Manufacturing Survey. Bureau for Economic Research, University of Stellenbosch.
Quantec EasyData (2018), RSA International Trade. Accessed in December 2018.
SA Reserve Bank (2018), Quarterly Bulletin, September 2018, South African Reserve Bank.
Statistics SA (2018a), Consumer Price Index, various issues. Statistics South Africa.
Statistics SA (2018b), Producer Price Index, various issues. Statistics South Africa.
Statistics SA (2018c), Export and Import Unit Value Indices, various issues. Statistics South Africa.
Statistics SA (2018d), Manufacturing: Production and Sales, various issues. Statistics South
Africa.
Statistics SA (2018e), Manufacturing: Utilisation of Production Capacity by Large Enterprises.
Statistics South Africa.
Statistics SA (2018f), Wholesale Trade Sales, various issues, Statistics South Africa.
Statistics SA (2018g), Retail Trade Sales, various issues, Statistics South Africa.
Statistics SA (2018h), Food and Beverages, various issues, Statistics South Africa.
Statistics SA (2018i), Quarterly Employment Statistics, various issues. Statistics South Africa.
35
NOTES:
----------------------------------------------------------------------------------------------------------------------------- ----------
------------------------------------------------------------------------------------------------------------------- --------------------
----------------------------------------------------------------------------------------------------------------------------- ----------
----------------------------------------------------------------------------------------------------- ----------------------------------
----------------------------------------------------------------------------------------------------------------------------- ----------
---------------------------------------------------------------------------------------------------------------------------------------
----------------------------------------------------------------------------------------------------------------------------- ----------
---------------------------------------------------------------------------------------------------------------------------------------
----------------------------------------------------------------------------------------------------------------------------- ----------
---------------------------------------------------------------------------------------------------------------------------------------
----------------------------------------------------------------------------------------------------------------------------- ----------
---------------------------------------------------------------------------------------------------------------------------------------
----------------------------------------------------------------------------------------------------------------------------- ----------
---------------------------------------------------------------------------------------------------------------------------------------
----------------------------------------------------------------------------------------------------------------------------- ----------
---------------------------------------------------------------------------------------------------------------------------------------
----------------------------------------------------------------------------------------------------------------------------- ----------
-------------------------------------------------------------------------------------------------------------------------------- -------
---------------------------------------------------------------------------------------------------------------------------- -----------
----------------------------------------------------------------------------------------------------------------------------- ----------
-------------------------------------------------------------------------------------------------------------- -------------------------
----------------------------------------------------------------------------------------------------------------------------- ----------
------------------------------------------------------------------------------------------------ ---------------------------------------
----------------------------------------------------------------------------------------------------------------------------- ----------
---------------------------------------------------------------------------------------------------------------------------------------
----------------------------------------------------------------------------------------------------------------------------- ----------
---------------------------------------------------------------------------------------------------------------------------------------
----------------------------------------------------------------------------------------------------------------------------- ----------
---------------------------------------------------------------------------------------------------------------------------------------
----------------------------------------------------------------------------------------------------------------------------- ----------
---------------------------------------------------------------------------------------------------------------------------------------
----------------------------------------------------------------------------------------------------------------------------- ----------
---------------------------------------------------------------------------------------------------------------------------------------
----------------------------------------------------------------------------------------------------------------------------- ----------
---------------------------------------------------------------------------------------------------------------------------------------
----------------------------------------------------------------------------------------------------------------------------- ----------
----------------------------------------------------------------------------------------------------------------------------- ----------
----------------------------------------------------------------------------------------------------------------------- ----------------
----------------------------------------------------------------------------------------------------------------------------- ----------
--------------------------------------------------------------------------------------------------------- ------------------------------
----------------------------------------------------------------------------------------------------------------------------- ----------
---------------------------------------------------------------------------------------------------------------------------------------
----------------------------------------------------------------------------------------------------------------------------- ----------
---------------------------------------------------------------------------------------------------------------------------------------
----------------------------------------------------------------------------------------------------------------------------- ----------
---------------------------------------------------------------------------------------------------------------------------------------
----------------------------------------------------------------------------------------------------------------------------- ----------
36
---------------------------------------------------------------------------------------------------------------------------------------
----------------------------------------------------------------------------------------------------------------------------- ----------
---------------------------------------------------------------------------------------------------------------------------------------
----------------------------------------------------------------------------------------------------------------------------- ----------
---------------------------------------------------------------------------------------------------------------------------------------
----------------------------------------------------------------------------------------------------------------------------- ----------
------------------------------------------------------------------------------------------------------------------------------------ ---
----------------------------------------------------------------------------------------------------------------------------- ----------
----------------------------------------------------------------------------------------------------------------------------- ----------
------------------------------------------------------------------------------------------------------------------ ---------------------
----------------------------------------------------------------------------------------------------------------------------- ----------
---------------------------------------------------------------------------------------------------------------------------------------
----------------------------------------------------------------------------------------------------------------------------- ----------
---------------------------------------------------------------------------------------------------------------------------------------
----------------------------------------------------------------------------------------------------------------------------- ----------
---------------------------------------------------------------------------------------------------------------------------------------
----------------------------------------------------------------------------------------------------------------------------- ----------
---------------------------------------------------------------------------------------------------------------------------------------
----------------------------------------------------------------------------------------------------------------------------- ----------
---------------------------------------------------------------------------------------------------------------------------------------
----------------------------------------------------------------------------------------------------------------------------- ----------
---------------------------------------------------------------------------------------------------------------------------------------
----------------------------------------------------------------------------------------------------------------------------- ----------
---------------------------------------------------------------------------------------------------------------------------------------
----------------------------------------------------------------------------------------------------------------------------- ----------
------------------------------------------------------------------------------------------------------------------------------- --------
------------------------------------------------------------------------------------------------------------------- --------------------
----------------------------------------------------------------------------------------------------------------------------- ----------
------------------------------------------------------------------------------------------------------------- --------------------------
----------------------------------------------------------------------------------------------------------------------------- ----------
----------------------------------------------------------------------------------------------- ----------------------------------------
----------------------------------------------------------------------------------------------------------------------------- ----------
---------------------------------------------------------------------------------------------------------------------------------------
----------------------------------------------------------------------------------------------------------------------------- ----------
---------------------------------------------------------------------------------------------------------------------------------------
----------------------------------------------------------------------------------------------------------------------------- ----------
---------------------------------------------------------------------------------------------------------------------------------------
----------------------------------------------------------------------------------------------------------------------------- ----------
---------------------------------------------------------------------------------------------------------------------------------------
----------------------------------------------------------------------------------------------------------------------------- ----------
---------------------------------------------------------------------------------------------------------------------------------------
----------------------------------------------------------------------------------------------------------------------------- ----------
---------------------------------------------------------------------------------------------------------------------------------------
----------------------------------------------------------------------------------------------------------------------------- ----------
----------------------------------------------------------------------------------------------------------------------------- ----------
---------------------------------------------------------------------------------------------------------------------- -----------------
----------------------------------------------------------------------------------------------------------------------------- ----------
-------------------------------------------------------------------------------------------------------- -------------------------------