quarterly economic & property report
DESCRIPTION
The Quarterly Economic Report is a great tool for overcoming objections based on the macro-economy. These objections are typically concerns about whether interest rates will go up, unemployment will increase or the economy will crash. All of these issues are discussed in the report.TRANSCRIPT

Quarter 1 | 2012
Quarterly Economic& Property ReportAUSTRALIA

Q4 2011 | QUARTERLY ECONOMIC REPORT
•CPI: 3.5%
• SVHL Rate: 7.3%
• AUS Unemployment Rate: 5%
• AUS Population Growth: 1.2%
• Average AUS Fuel Price: $1.45 pl
KEY FACTS
Overview - General Economic and Property Overview
The Australian property market experienced a year where gradual improvements to affordability occurred in most localities. Property values across most segments of the market declined and when combined with the recent cuts in the cash rate, buyer inquiry levels began to increase in the finalmonths of the year. This is positive newswhenobserving the overall decline in activity levels of 2011. When compared to other industries and assets classes, property has proved to be fairly robust over 2011. The equity market continues to be significantly below the five year average and is highly reliant ondevelopments occurring overseas, outside the reach of Australia’s control. The retail industryexperiencedanotherdifficultyearofconsumerspreferringtosavetheirdisposableincome. Regardless of where you sit on the fence for asset growth in 2012, one thing is for certain. When considering the environment in 2011 of tightening interest rates, hints by theReserveBankofAustralia(RBA)thatmoreratehikeswerelikely,theremovaloffiscalstimulus, wide-spread concern over the carbon tax, the perceived instability of the federal government, increasing volatility in the world economy, increasingly cautious consumers in the post-GFC environment, and natural disasters, the Australian property market has fared quite well in relation to other developed nations.
The end is not near for the European debt crisis, with Europe entering into a recession for the final quarter of 2011. China’s growth has contracted over 2011, assisting to easecommodity prices, which should result in lowering the high terms of trade. While there is positive news coming out of the US, it still remains in a very challenging period where unemployment is high and rates have remained low.
There is no two ways about it, the environment is seeing tighter credit conditions, with banks facing higher funding costs, all resulting in no more cheap credit. This is a low growth environment for all asset categories. The International Monetary Fund (IMF) has cut global growth prospects again, down to 2.5 per cent, a decrease of 1.1 per cent from previous predictions. This has made the federal government’s target of reaching a budget surplusincreasinglydifficult.WhileAustraliacontinuestohaveflexibilityinmonetaryandfiscalpolicytoadjusttotheglobalconditions,2012willseereducedgovernmentspendingin the attempt to return the government to budget surplus next year, a challenge that has come at a very inconvenient time.
If the global economy continues to be turbulent over 2012, sentiment will struggle to recover and access to credit will be tougher. However, if the global economy stabilises, thenAustralia(possessingstrongdomesticeconomicconditions)shouldbeoneofthefirstcountries to lead the way into recovery.
QUARTERLY ECONOMIC & PROPERTY REPORT
NATIONAL RESEARCH REPORT
| P. 2 PRDnationwide

Confidence
PESSIMISTS STRONG THROUGH 2011
2011 appears to have steadily dampened sentiment as the long-term Australian Consumer Sentiment Index of a six month moving average has decreased by 18.3 points over the year to register 95.8 points. Not since the Global Financial Crisis of 2008 has pessimists outweighed optimists in the index.
On a monthly basis the Australian Consumer Sentiment Index decreased a further 8.6 points over the month of December 2011, to record a score of 94.7 points. This result is considerably negative, considering the survey was undertaken a week after the recent rate cut by the RBA.
OutofthefivestatesmeasuredfortheIndex,sentimentcontinuestobehighestinWesternAustraliaat115.5points,whichexperiencedafurthermonthly increaseoffivepercent.Victoria recorded the lowest index score at 86.2 points, followed closely by South Australia at 86.5 points. Queensland experienced the smallest shift in sentiment, decreasing by 2.7 per cent to reach an index score of 101.4 points, while New South Wales decreased by 9.6 per cent to 95 points.
• TheConsumerSentimentIndexindicatesshort-runchangestoconsumerwillingnesstopurchasegoodsintheforthcomingquarter.
• TheIndexisbasedonamonthlysurveyof1,200AustralianhouseholdsconductedbytheMelbourneInstituteandWestpac.
• It represents current and future perspectives of the broad economic climate andhouseholdfinancialstate.
2
60
70
80
90
100
110
120
130
Dec
-91
Dec
-92
Dec
-93
Dec
-94
Dec
-95
Dec
-96
Dec
-97
Dec
-98
Dec
-99
Dec
-00
Dec
-01
Dec
-02
Dec
-03
Dec
-04
Dec
-05
Dec
-06
Dec
-07
Dec
-08
Dec
-09
Dec
-10
Dec
-11
Con
sum
er S
entim
ent I
ndex
Australian Consumer Sentiment
Australian Consumer Sentiment Index Six Month Moving Average
Prepared by PRDnationwide ResearchSource: Westpac/Melbourne Institute, last updated Jan-2012
| P. 3
RESEARCH REPORT | Q1 2012 | QUARTERLY ECONOMIC & PROPERTY REPORT | NATIONAL
PRDnationwide

Confidence cont.
BUSINESS CONFIDENCE TEMPORARILY FALLS INTO THE NEGATIVE
OvertheSeptember2011quarter,confidencehasdecreasedsignificantlytorecord-3.9index points on the NAB Quarterly Index, equating to a fall of 9.9 points. This low level of confidenceisthefirsttimeithasfallenpasttheequilibriumsincetheGlobalFinancialCrisis(GFC) of late 2008. During this time, the Index took nine months to recover.
RecentdatareleasedbytheNABforthemonthofNovemberhasbusinessconfidenceat+2 points, remaining steady over the month from the increase in October. Although this is well below the longer-term average of +6 points, it is still positive despite the continuing concerns with the European debt crisis. Business confidence strengthened in SouthAustralia (increase of nine points), Queensland and Tasmania (both increased eight points), while it deteriorated heavily in New South Wales (fall of nine points) and Western Australia (fall of seven points).
Whilemostindustriescontinuetoreportbusinessconfidenceinthepositiveterritory,itwasgenerallyreportedthatconfidencehadfalleninNovember,withthelargestdecreasefeltinconstruction (down 14 points), andmining (down 10 points). Confidence has howeverincreasedinfinance/business/propertyupfourpointsto+4.
The Business Conditions Index marginally increased by one point to +1 in November. This is on par with the long-term trend of +1. There were improvements in employment conditions, while trading conditions deteriorated.
CreditconditionshavetightenedinNovember2011,withfirmsreportingmoredifficultyinobtainingfinance,despitetheportionofbusinessthatdonotrequirecreditrisingfrom46per cent to 49 per cent.
• TheBusinessConfidence Index indicatesexpectationsof business conditions for theupcomingquarter.
•TheIndexisbasedonasurveyofapproximately900smalltolargebusinessesinthenon-farmsectorsandisconductedbytheNationalAustraliaBank(NAB).
2
-40-35-30-25-20-15-10-505101520253035
Sep
-94
Mar
-95
Sep
-95
Mar
-96
Sep
-96
Mar
-97
Sep
-97
Mar
-98
Sep
-98
Mar
-99
Sep
-99
Mar
-00
Sep
-00
Mar
-01
Sep
-01
Mar
-02
Sep
-02
Mar
-03
Sep
-03
Mar
-04
Sep
-04
Mar
-05
Sep
-05
Mar
-06
Sep
-06
Mar
-07
Sep
-07
Mar
-08
Sep
-08
Mar
-09
Sep
-09
Mar
-10
Sep
-10
Mar
-11
Sep
-11
Inde
x va
lue
Quarter
Business Confidence
ImprovingConfidence
Prepared by PRDnationwide ResearchSource: National Australia Bank (NAB), last updated Jan-12
RESEARCH REPORT | Q1 2012 | QUARTERLY ECONOMIC & PROPERTY REPORT | NATIONAL
| P. 4 PRDnationwide

Macroeconomic Climate
INFLATION REMAINS BENIGN
TheSeptember2011CPIfiguresrecordedanannualchangeof3.5percent,whichisadecrease from the previous quarter of 3.6 per cent, but still outside the RBA target range oftwotothreepercent.TheRBApredictsthatinflationwilltrackwithinthetargetrangeover the next couple of years.
Theunderlyinginflationfigure,asmeasuredbytheRBAremovesvolatileitemssuchasfruit and fuel, remains inside the target range but has continued to soften marginally from the March 2011 quarter by 0.3 per cent to 2.3 per cent as of the September 2011 quarter.
AccordingtotheAustralianGovernment’smid-yearbudgetreview,thebudgetdeficitfor2011/12 was expected to be 2.5 per cent of GDP, compared with an earlier estimate of 1.5 per cent of GDP. This increase reflected a combination of factors including lowereconomic growth and lower than expected capital gains tax revenue. The Government had announced a series of measures in response and is still forecasting a small surplus in 2012/13.
As a result of stronger data showing the start of the mining investment boom and steady consumption growth, the NAB has predicted further growth than primarily forecasted in the medium term for Australia. The bank has predicted a more bullish 4.5 per cent growth for 2012, than the RBA and Treasury.
As a result of the continued financial crisis within the Euro-zone, European businessconfidencehassignificantlydeteriorated,affectingeconomicactivity.TheNABforecaststhat Europe will experience an even larger recession, affecting the growing economies of China,IndiaandBrazil.Globalgrowthisforecastedtobecutto3.25percentfor2012(below trend).
•InflationismeasuredasachangeintheConsumerPriceIndex(CPI),calculatedbytheAustralianBureauofStatisticsasthepriceofaweighted‘basket’ofgoodsandserviceswhichaccountforahighproportionofexpenditurebymetropolitanhouseholds.
•TheReserveBankofAustralia(RBA)aimstoconstraininflationinalong-runtargetrangeof2-3%throughthesettingofinterestrates.
2
0%
2%
4%
6%
8%
Sep
-01
Mar
-02
Sep
-02
Mar
-03
Sep
-03
Mar
-04
Sep
-04
Mar
-05
Sep
-05
Mar
-06
Sep
-06
Mar
-07
Sep
-07
Mar
-08
Sep
-08
Mar
-09
Sep
-09
Mar
-10
Sep
-10
Mar
-11
Sep
-11
Ann
ual C
hang
e in
CP
I
Quarter
Inflation
All groups Excluding volatile items
Reserve Bank's Target Range
Prepared by PRDnationwide ResearchSource: ABS Cat 6401, last updated Jan- 2012
| P. 5
RESEARCH REPORT | Q1 2012 | QUARTERLY ECONOMIC & PROPERTY REPORT | NATIONAL
PRDnationwide

Macroeconomic Climate cont.
WILL RATES DECREASE FURTHER IN 2012?With global economic conditions worsening and equity markets increasing in volatility, sentimentandconfidenceinthemarkethasdeteriorated.AsaresulttheRBAhastakenlargestepstoavoiddampeningAustralianproductivitybycuttingtheofficialcashrateinNovember and December, by .25 per cent each month. The standard home loan interest rate has decreased to 7.3 per cent from the prolonged steady period at 7.8 per cent.
Following the decline in the cash rate, housing rates are now around the post-1996 average. The RBA is anticipating that if the weak conditions continue overseas, further reductions might be necessary in the middle of 2012.
The NAB anticipates that the bond markets should be calmer in 2012, with surprisingly stronger than anticipated growth in the US offsetting the weakening European market (which entered into a recession in Q4 2011). Earlier market predictions of a further rate cut in February 2012 have softened, but remain likely. If bank funding costs continue to increase, the RBA may be forced into cutting rates. However, longer term cuts in 2012 are not expected.
Looking ahead towards 2012, Australia is in an economically sound situation, where it has significantflexibilitybetweenfiscalandmonetarypolicywhenfacingfuturevolatileglobalevents.Bankshoweverareworriedthatduetoasignificantriseinfundingcosts(asaresult of the European crisis), future decreases to the cash rate will not be passed on.
•Thehousingloaninterestrateistheaveragerateofinterestbeingofferedbyhousinglenders.ItishigherthantheRBA’stargetcashrateduetolendingcostsandprofitmargins.
•InterestratesaresetbytheRBA,whoactsindependentlyofgovernmentandsetsinter-estrateswiththegoalofmaintaininginflationinalong-runtargetrangeof2%and3%.TheRBAmeetsmonthlytoreviewthecurrentinterestrateandisonlyrequiredtojustifyitsdecisionifitchoosestoaltertherate.
2
0.0
2.0
4.0
6.0
8.0
10.0
12.0
14.0
16.0
18.0
Dec
-81
Dec
-82
Dec
-83
Dec
-84
Dec
-85
Dec
-86
Dec
-87
Dec
-88
Dec
-89
Dec
-90
Dec
-91
Dec
-92
Dec
-93
Dec
-94
Dec
-95
Dec
-96
Dec
-97
Dec
-98
Dec
-99
Dec
-00
Dec
-01
Dec
-02
Dec
-03
Dec
-04
Dec
-05
Dec
-06
Dec
-07
Dec
-08
Dec
-09
Dec
-10
Dec
-11 Sta
ndar
d B
ank
Hou
sing
Loa
n In
tere
st R
ate
%
Month
Housing Loan Interest Rate
Prepared by PRDnationwide ResearchSource: RBA Bulletin F05, last updated Jan-2012
RESEARCH REPORT | Q1 2012 | QUARTERLY ECONOMIC & PROPERTY REPORT | NATIONAL
| P. 6 PRDnationwide

Foreign Exchange
AUSTRALIAN DOLLAR REMAINS RESILIENTDuring the month of December 2011 the Australian Dollar Exchange Index increased a 1.6 per cent to register an index value of 75.8, whilst there was no annual change in the Australian Dollar over 2011.
Since September 2011, the Australian Dollar has remained slightly above parity with the US Dollar. Over 2011 the Australian Dollar has depreciated the most against the Japanese Yen (down 4.9 (per cent), while appreciating the most to the New Taiwan Dollar (up 3.9 per cent).
The NAB export index has increased marginally in November to -1 index point. Wholesale wastheonlyindustrytoreportadeclineintheexportsindex,whileconstruction,financeand property faired well over the month.
Early data for January shows the Euro falling to a low of 1.266, the lowest level since August 2010. France has lost its Standard and Poor (S&P) AAA rating to AA+, with Italy, SpainandPortugalbeingratedasjunk.S&PhaveplacedFranceand13otherEuropeancountries with a negative outlook and may further reduce their credit rating.
Lower Chinese economic growth is expected in 2012, with commodity prices likely to have already peaked. As a result the Australian terms of trade will decrease resulting in a lower AUD outlook for the year.
Dec-10 Dec-11 % ChangeEU Euro 0.76 0.78 2.6%JP Yen 82.83 78.73 -4.9%NZ Dollar 1.32 1.31 -0.2%UK Pound 0.66 0.66 0.1%US Dollar 1.02 1.02 -0.1%Source: RBA Bulletin F11
2
40
45
50
55
60
65
70
75
80
Dec
-01
Mar
-02
Jun-
02S
ep-0
2D
ec-0
2M
ar-0
3Ju
n-03
Sep
-03
Dec
-03
Mar
-04
Jun-
04S
ep-0
4D
ec-0
4M
ar-0
5Ju
n-05
Sep
-05
Dec
-05
Mar
-06
Jun-
06S
ep-0
6D
ec-0
6M
ar-0
7Ju
n-07
Sep
-07
Dec
-07
Mar
-08
Jun-
08S
ep-0
8D
ec-0
8M
ar-0
9Ju
n-09
Sep
-09
Dec
-09
Mar
-10
Jun-
10S
ep-1
0D
ec-1
0M
ar-1
1Ju
n-11
Sep
-11
Dec
-11
Trad
e W
eigh
ted
Inde
x
Month
Trade Weighted Exchange Rate Index
Prepared by PRDnationwide ResearchSource: RBA Bulletin F11, last updated Jan-12
ImprovingAffordabilityof Imports
•ThetradeweightedexchangerateindexiscompiledmonthlybytheReserveBankandrankstheAustralianDollaragainstthecurrenciesofoursignificanttradingpartners.
•Exchangeratesdirectlyaffectthepricesofourexportsinforeigntradedollars.
| P. 7
RESEARCH REPORT | Q1 2012 | QUARTERLY ECONOMIC & PROPERTY REPORT | NATIONAL
PRDnationwide

Fuel Prices
FUEL PRICES UNEXPECTEDLY SOFTENIn dollar value terms, the nation experienced a decrease of three cents to the average petrol price during the month ending December 2011. The average price Australians paid at the pump was at $1.45 per litre. During the year petrol prices increased at an average rate of 14.8 per cent across the nation.
Melbourne is now the capital city where motorists pay the least at $1.39 per litre. The city experienced no change over the quarter and only a 12.1 per cent increase over the year. In Darwin consumers continue to pay the most at $1.52 per litre, followed closely by Hobart at $1.51.
Over the three month period ending December 2011, all capital cities experienced an increase in petrol prices with Canberra increasing the most at 4.9 per cent. This was followed by Hobart (2.7 per cent), while Sydney and Brisbane both increased by 0.7 per cent.
During the course of the year, Sydney petrol prices increased the most at 13.7 per cent, while Hobart increased the least at 8.1 per cent.
Recent data shows that the falling Australian dollar has lead fuel prices to increase dramatically in October, with a national high occurring in Hobart at $1.56 per litre.
2
$0.40
$0.60
$0.80
$1.00
$1.20
$1.40
$1.60
$1.80
Nov
-01
May
-02
Nov
-02
May
-03
Nov
-03
May
-04
Nov
-04
May
-05
Nov
-05
May
-06
Nov
-06
May
-07
Nov
-07
May
-08
Nov
-08
May
-09
Nov
-09
May
-10
Nov
-10
May
-11
Nov
-11
Aver
age
Ret
ail P
rice
of U
LP
Month
Retail Fuel Prices
Brisbane Melbourne Sydney
Prepared by PRDnationwide ResearchSource: AAA/Fueltrac, last updated Jan-2012
• Sourced fromFueltrac, this chart tracks the average retail price for unleaded petrolacrossabroadrangeofsuppliersinmetroareas.
RESEARCH REPORT | Q1 2012 | QUARTERLY ECONOMIC & PROPERTY REPORT | NATIONAL
| P. 8 PRDnationwide

Commodities Prices
RESOURCE INVESTMENT BEGINS TO SHOWThe Australian economy was largely driven by commodities being purchased by the industrialisation of China and India in 2011. Towards the end of 2011 a decline was experienced in this demand with weakening growth from these countries. It is anticipated that demand from China and India shall continue to decrease slightly over 2012, easing commodity prices off the peaks established over 2011.
During the month of December 2011, the Commodity Price Index decreased by 2.5 per cent to reach 104.5 points. When compared to the previous year, the index is 9.6 per cent higher.
The NAB forecasts Australian GDP growth to surge to 4.5 per cent in 2012 through the recoveryofminingexportsaftertheQueenslandfloodsof2011(whichsignificantlyreducedexporting capacity) and increased mining investment (according to the ABS up an incredible 84 per cent in 2011 and anticipated 57 per cent in 2012). This substantial investment in mining will place large demand for existing labour during and after the construction phase.
The Bureau of Resources and Energy Economics (BREE) estimated that the value of advancedprojectsattheendoflastyearincreasedto$232billion,from$173billionsixmonth earlier.
ItisanticipatedthattheseveraladditionallargescaleLNGprojectscouldexpandAustralia’sproduction capacity by up to four times the existing amount. The large boost to capacity in the resources sector will likely soften commodity prices in the medium term, but when compared to historical prices, should remain elevated.
2
0
20
40
60
80
100
120
140
Dec
-91
Dec
-92
Dec
-93
Dec
-94
Dec
-95
Dec
-96
Dec
-97
Dec
-98
Dec
-99
Dec
-00
Dec
-01
Dec
-02
Dec
-03
Dec
-04
Dec
-05
Dec
-06
Dec
-07
Dec
-08
Dec
-09
Dec
-10
Dec
-11
RB
A co
mm
odity
pric
e in
dex
valu
e
Month
RBA Commodity Price Index
Prepared by PRDnationwide ResearchSource: RBA Bulletin G5, last updated Jan-12
•PrimarycommoditiesaccountformorethanhalfofAustralia’sexportearning.
•TheReserveBank’sCommodityPriceIndexprovidesanindicatorofprimarycommodityprice movements. The index includes 17 commodities with separate weightings, thehighestofwhicharecoal,goldandironore.
•HighcommoditypricesareoneoftheprimarydriversbehindAustralia’srobusteconomy,influencingrealestatepricesparticularlyinWesternAustralia,NorthernTerritory,NorthernQueensland and as of lateSouthAustralia.Coupledwith the resource industry boom,employmentandpopulationgrowth follow,whichspursdemand forhousingand rentalaccommodation,particularlyinneighbouringresourcerichregions.
| P. 9
RESEARCH REPORT | Q1 2012 | QUARTERLY ECONOMIC & PROPERTY REPORT | NATIONAL
PRDnationwide

Construction Market
CONSTRUCTION SPEND SOARS WHILE RESIDENTIAL STRUGGLESThe national gross spend on construction (other than houses) increased during the September2011quarterbyfivepercent.TheoverallspendfortheyearendingSeptember2011wasjustover$101million,up5.9percentfromthepreviousyear.Thegrossspendin the September 2011 quarter was significantly higher than previous quarters at $27million.
TheABShas released recent data showing a decline in both new housing andmajoralteration spending for the September 2011 quarter. The seasonally adjusted figuresdecreased by 1.6 per cent to $45.5 billion. The largest fall occurred in South Australia, with a decrease of 17.9 per cent, followed by 8.9 per cent in Tasmania.
The HIA has requested that the industry requires further reductions in interest rates, short term government stimulus and renewed action for long term housing policy.
Dwelling approvals have increased across Australia by 8.4 per cent in November, following a fall of 10 per cent from the previous month. Victoria increased the most at 39.9 per cent, while approvals decreased the most in Western Australia, at 16.9 per cent.
2
3.7%
1.8%
-0.1%
2.1%
4.7%
0.0%
1.5%
0.9% 1.0%
5.0%
-1.0%
0.0%
1.0%
2.0%
3.0%
4.0%
5.0%
6.0%
Jun-09 Sep-09 Dec-09 Mar-10 Jun-10 Sep-10 Dec-10 Mar-11 Jun-11 Sep-11
Per
cent
age
chan
ge fr
om p
revi
ous
quar
ter
Quarter
National Construction Gross Spend
Prepared by PRDnationwide ResearchSource: ABS Cat 1350, last updated Jan-2012
•Theconstructionindustryisoneofthedrivingareasintheeconomy,havingasignificantcontributiontoGDPandamultipliereffectontheactivityinotherindustries.Indicatorsofpricemovementofconstructionoutputswillbeavaluabletoolineconomicanalysis.
• Construction industryoutputprice indexesarebeingdeveloped tomeasurechangesovertimeinthepriceofnewconstructionoutputs,otherthanhouses.
RESEARCH REPORT | Q1 2012 | QUARTERLY ECONOMIC & PROPERTY REPORT | NATIONAL
| P. 10 PRDnationwide

House Finance
INVESTOR FINANCE RISESThegrossspendonhousingfinancewas$20.3billionduringthemonthofNovember2011.Compared to the previous year, the total spend has decreased by 3.4 per cent, equating to $800 million less.
Investor spend continues to be kept steadyat just above$6billion, following the trendestablished at the start of 2011. For the month of November 2011, investor financialcommitment increased by $500 million to record $6.6 billion.
During the month of November 2011, owner occupier spend decreased by $600 million to equate to $13.8 billion. Approximately 32.2 per cent of the property market is now investor financedandisexpectedtoincreaseasrentalyieldsacrossthenationcontinuetobecomemore attractive.
The total household debt is now $1.6 trillion, equating to more than the average $180,000 per household, with the majority being mortgage debt. Over the 2011 financial year,householdsborrowed$321billion,with$235billion inmortgagerefinance,$86billion inpersonal loans and $11 billion for cars. Despite this, the average wealth of the population continues to increase by an average of eight per cent over the past decade, equating to 6.4 per cent per household.
2
0
2
4
6
8
10
12
14
16
18
20
Nov
-01
Nov
-02
Nov
-03
Nov
-04
Nov
-05
Nov
-06
Nov
-07
Nov
-08
Nov
-09
Nov
-10
Nov
-11
Valu
e of
Com
mitm
ents
($ b
illio
n)
Month
Housing Finance Commitments
Owner Occupied Investment
Prepared by PRDnationwide ResearchSource: ABS Cat. No. 5609, last updated Jan-2012
• Housing finance commitments track the volume of finance commitments made bysignificantlenderstoindividualsforthepurchaseofhousing.
•Thisgraphtracksthevalueofloansapprovedforbothowneroccupiersandinvestors.
| P. 11
RESEARCH REPORT | Q1 2012 | QUARTERLY ECONOMIC & PROPERTY REPORT | NATIONAL
PRDnationwide

Labour Market
LONG-TERM UNEMPLOYMENT REMAINS STEADYDuringthemonthofDecember2011,unemploymentincreasedtofivepercent(whichisjustabove the longer-term five year average of 4.9 per cent).When looking at themovingannualaverage,theratehasbeensteadyat5.1percentsincethefirstquarterof2011.
For the month of December 2011, the nation’s lowest rate of unemployment occurred in the ACT at 3.5 per cent, a rate that has decreased by a nominal 0.1 per cent from the previous month. Tasmania now has the highest rate of unemployment at 6.4 per cent, up from 5.3 in October.
Unemployment in New South Wales increased considerably (up 11 per cent) to 5.5 per cent duringthemonthofDecember,whileVictoria’sunemploymentremainedsteadyatfivepercent. Unemployment in Western Australia has continued to be historically low since September, at 3.8 per cent.
After a period of four successive decreases, the ANZ Job Ads Index remained steady for the month of November 2011. Internet adverts remained steady while newspaper adverts increased marginally by 0.6 per cent.
As a consequence of the strong economy and high Australian Dollar, domestic manufacturing has weakened with business conditions at near recession levels and employment levels tightening for the industry.
It is forecasted that the unemployment rate could increase in the short term, with stronger jobgrowthtoreturninmid-2012,drivingtheratebackbelowfivepercentattheendof2012.
2
2%
4%
6%
8%
10%
12%
Dec
-81
Dec
-82
Dec
-83
Dec
-84
Dec
-85
Dec
-86
Dec
-87
Dec
-88
Dec
-89
Dec
-90
Dec
-91
Dec
-92
Dec
-93
Dec
-94
Dec
-95
Dec
-96
Dec
-97
Dec
-98
Dec
-99
Dec
-00
Dec
-01
Dec
-02
Dec
-03
Dec
-04
Dec
-05
Dec
-06
Dec
-07
Dec
-08
Dec
-09
Dec
-10
Dec
-11
Une
mpl
oym
ent R
ate
Month
Unemployment Rate
Unemployment Rate Australia
Moving Annual Average Australia
Prepared by PRDnationwide ResearchSource: ABS Cat 6202, last updated Jan-11
• Unemployment iscalculatedastheproportionofpeople inthelabourforcethatwereunemployedandactivelyseekingworkduringthesurveyperiod.
•Thelabourforceisdefinedasthenumberofpeopleagedbetween16and55whowereeitheremployedoractivelylookingforworkduringthesurveyperiod.
•Thisgraphtrackstheunemploymentrateonamonthlyandmovingannualaveragebasisoverthelast30years.
RESEARCH REPORT | Q1 2012 | QUARTERLY ECONOMIC & PROPERTY REPORT | NATIONAL
| P. 12 PRDnationwide

Stock Market
EQUITY MARKETS REMAIN BELOW FIVE YEAR AVERAGEThe Australian Securities Index decreased it’s monthly average value during the month of December to reach 4,130 points, down from November’s average of 4,189 points, equating to a decrease of 1.4 per cent over the month.
While the equity markets have continued to be affected by the sovereign debt concerns, there is hope that recent data from the US shows better than expected growth might be gaining momentum.
On the whole, Australian equities are more affordable than at 2006 to 2008 prices, however the core factors which have pulled these equity prices down will remain at least for the short term.
• The S&P/ASX 200 is recognised as the primary investable benchmark inAustralia.The index covers approximately 78% of Australian equity market capitalization. IndexconstituentsaredrawnfromeligiblecompanieslistedontheAustralianStockExchange.This index isdesignedtoaddress investmentmanagers’needstobenchmarkagainstaportfoliocharacterizedbysufficientsizeandliquidity.
•TheS&P/ASXAustralianIndexisareal-time,marketcapitalisationweightedindexthatinclude the largest andmost liquid stocks in theAustralian equitymarket listed on theAustralianStockExchange(ASX).
2
2,500
3,000
3,500
4,000
4,500
5,000
5,500
6,000
6,500
7,000
7,500
Inde
x Va
lue
Day
S&P / ASX 200
Prepared by PRDnationwide ResearchSource: Standard & Poors, last updated Jan-2012
| P. 13
RESEARCH REPORT | Q1 2012 | QUARTERLY ECONOMIC & PROPERTY REPORT | NATIONAL
PRDnationwide

Home Affordability
AFFORDABILITY SET TO INCREASE WITH RATE CUTSThe recent stagnation of affordability proved to be temporary, as over the September 2011 quarter home loan affordability increased by a further 0.9 points to an index score of 29.8 points.
Over the quarter most states recorded an improvement to home loan affordability, with only Victoria experiencing a decrease in the index, down 1.1 per cent to 28.1. The state that experienced the largest growth in affordability was Western Australia, increasing by 9.4 per cent over the quarter. Other states to improve were the Northern Territory (up 6.8 per cent to 46.8 points), Tasmania (up 5.6 per cent to 35.8 points), the ACT (up 5.1 per cent to 56 points) and New South Wales (up 3.6 per cent to 36.9 points). Queensland experienced a marginal increase of 1.1 per cent to register 30.6 points.
On average, Australian households now need approximately 33.6 per cent of the family income to service their home loan. New South Wales continued to be the least affordable state, with households requiring 37.1 per cent of the family income to service their home loan, equating to 3.5 per cent above the national average.
Queensland families require approximately 33.6 per cent of the average family income to service the average home loan, while Victoria requires 35.6 per cent. The ACT requires the least amount, with 17.9 per cent of the average income. According to the REIA, the proportion of family income needed to meet the average rental payment has decreased during the September 2011 quarter to 24.6 per cent.
OvertheSeptember2011quarter,loanstofirsthomebuyershavecontinuedtoincrease(up4.4percent),withnewfinancecommitmentsovertheyearincreasingby5.4percent.Thefirsthomebuyerparticipationrateasatotalnumberofdwellingsfinancedincreasedto15.6per cent, but still remains below the long term trend of 20 per cent of the total market.
•TheHomeLoanAffordabilityIndexmeasuresaverageloanrepaymentsagainstmedianwagesandtracksthesevaluesovertime.
•Continuedpricegrowthinthepropertymarketwithoutanaccompanyingriseinincomesawalongperiodofdeclineinthehomeloanaffordabilityindexacrossthenation.
• TheHomeLoanAffordability indexcommenceditsrapiddescentduring2002.Afterashortlevelingbetween2004and2006,affordabilitylevelshaveagaincontinuedtotrenddownwards.
2
Home Loan Affordability Index
ImprovingAffordability
Prepared by PRDnationwide ResearchSource: REIA / Deposit Power, last updated Jan-2012
RESEARCH REPORT | Q1 2012 | QUARTERLY ECONOMIC & PROPERTY REPORT | NATIONAL
| P. 14 PRDnationwide

Dwelling Market
NEW DWELLINGS STALL IN QUARTER 3The total number of dwelling commencements slightly decreased during the September 2011 quarter by 0.4 per cent, equating to 159 less new homes for the quarter. When compared to the previous year, commencements have decreased by 13.4 per cent.
On a state-by-state basis, Victoria continued to record the highest number of dwelling commencements during the September quarter, representing 37 per cent of all dwellings commenced nationally. Queensland followed with 20 per cent and New South Wales contributed with 18 per cent of commencements.
The least amount of dwellings commenced for a state during the September 2011 quarter was the Northern Territory (up 44 per cent to 200), followed by Tasmania (down 18 per cent to 556).
The Housing Industry Association has stated that taxes on new housing have hindered new housing supply. This has been supported by research undertaken by the Centre of International Economics, which found that housing is one of the most heavily taxed sectors of the economy in both aggregate and relative terms.
It has been reported that the Queensland State Government’s $10,000 boost to build new properties has had only limited success, with calls for the Boost to be extended further into the year.
•Dwellingcommencementsindicatethenumberofnewdwellingsthathavecommencedtheirconstructionphase.
• Amoving yearly average is used to filter out seasonal fluctuations in the number ofdwellingscommenced.
•Nationally,theannualnumberofdwellingcommencementshavebeenonadownwardtrendsinceSep-04(earlierinNSWandVIC)
2
25,000
30,000
35,000
40,000
45,000
50,000
55,000
Sep-
95
Sep-
96
Sep-
97
Sep-
98
Sep-
99
Sep-
00
Sep-
01
Sep-
02
Sep-
03
Sep-
04
Sep-
05
Sep-
06
Sep-
07
Sep-
08
Sep-
09
Sep-
10
Sep-
11
Mov
ing
Annu
al A
vg. o
f Com
men
cem
ents
.
Quarter
Dwelling Commencements
Dwelling Commencements Australia
Annual moving average
Prepared by PRDnationwide ResearchSource: ABS Cat. No. 8750, last updated Jan-2012
| P. 15
RESEARCH REPORT | Q1 2012 | QUARTERLY ECONOMIC & PROPERTY REPORT | NATIONAL
PRDnationwide

Dwelling Market - cont.
BUYING CONDITIONS GOOD IN WA AND QLDOvertheDecember2011quarter,theTimetoBuyaDwellingIndexfluctuatedbetweenthefivemeasuredstates,withSouthAustralia,NewSouthWalesandVictoriaallexperiencinga decrease in the Index, while Queensland and Western Australia increased.
For the month of January 2012 Western Australia now has the highest index value at 153.1 points, but is followed closely by Queensland at 136.7 and New South Wales at 134 points. This represents an increase from the previous quarter of 3.3 per cent for Western Australia, a fall of 12.8 per cent for Queensland and a 19 per cent increase for New South Wales.
According to the Westpac-Melbourne Institute Survey of Consumer Sentiment, family financialconditionsdeterioratedover2011inallstates,withthelargestdeclinefeltinSouthAustralia (down 31 per cent) and Victoria (down 6.5 per cent). Queensland experienced a marginal decline of 0.8 per cent, while New South Wales fell 3.5 per cent. Early indications for 2012 show strong improvements in Victoria (up 23 per cent) and South Australia (up 47.9 per cent), while falling considerably in Queensland (down 25.6 per cent).
•TheTimetoBuyaDwellingIndexindicatesshort-runchangesinconsumersentimentregardingwhetheritisagoodtimetobuyadwelling.
• It is a component of the Melbourne Institute’s Consumer Sentiment Index which isundertakenmonthly.
2
40
60
80
100
120
140
160
180
Dec
-01
Dec
-02
Dec
-03
Dec
-04
Dec
-05
Dec
-06
Dec
-07
Dec
-08
Dec
-09
Dec
-10
Dec
-11
Mov
ing
annu
al a
vera
ge o
f Tim
e to
Buy
a D
wel
ling
Inde
x
Moving Annual Average
Time to Buy a Dwelling IndexNSW VIC QLD WA SA
Prepared by PRDnationwide ResearchSource: Westpac/Melbourne Institute, last updated Jan-2012
RESEARCH REPORT | Q1 2012 | QUARTERLY ECONOMIC & PROPERTY REPORT | NATIONAL
| P. 16 PRDnationwide

Home Prices
SYDNEY BEST PERFORMER FOR 2011According to the ABS House Price Index, all capital cities experienced a decline in value over the 12 month period ending September 2011. On average, property values have fallen by 2.2 per cent, with the largest declines felt in Brisbane (-5.2 per cent) and Darwin (-4.4 per cent). Sydney and Hobart only experienced a nominal decrease of 0.3 per cent each, with Canberra decreasing by 2.2 per cent and Melbourne by 2.1 per cent.
According to the RPData-Rismark Home Value Index, Sydney was the best performing capital city over the quarter ending November 2011, only experiencing a softening in median price by 0.5 per cent to $495,000. According to the Index, the largest decline was felt in Brisbane, recording a seven per cent fall in median price to $410,000.
Both the HIA and Residex have predicted that the property industry will recover in 2012 after a“pricecorrection”anda“periodofnegativeadjustment”.Keyfactorssuchasinterestrates,the Eurozone crisis, inflation, unemployment and the carbon tax are quoted as highlyimportant in determining property outcome for 2012.
If 2012 canbring stability to theglobal financialmarkets, sentiment and confidencewillreturn to investors in the Australian property market. The recent decreases to the cash rate with inclinations of further cuts in early 2012 will make home loans more affordable and increase the pool of potential buyers. Sydney is tipped to perform best in 2012 and will likely achieve modest median price growth of between four to six per cent. Melbourne is going through a period of adjustment after high growth in 2010 and significant portions of itsmarket is now over supplied. This year should see Melbourne go through a period of consolidationwhereflatgrowthwillberecorded.Brisbaneshouldgothroughthebottomofits decline in median price and see signs of a recovery in the second stages of 2012, after experiencingsignificantsofteninginvaluesin2011.LikeBrisbane,thePerthmarketshouldseerenewedconfidencetowardsthesecondhalfof2012,withmarginallevelsofpositivegrowth. Canberra should fair better, having experienced only a marginal decline in the median price over 2011. Canberra will likely receive growth in 2012 between two to four per cent, which would make it second to only Sydney for performing capital cities of 2012. With unemployment increasing substantially over 2011, Hobart may have another year of softening home values in 2012. Adelaide should see the rate of decline slow around two per cent in 2012, as the market consolidates.
•Thecharttotheabovemeasuresanannualperiodchangeinhousepricesofthecapitalcities.
2
-0.3
-2.1
-5.2
-3.2
-4.2
-0.3
-4.4
-2.2
-2.2
-6 -5 -4 -3 -2 -1 0
Sydney
Melbourne
Brisbane
Adelaide
Perth
Hobart
Darwin
Canberra
Average of all capitals
Change in house price index over year ending September 2011 (%)
Cap
ital C
ity
ABS House Price Indexannual % change by capital city
Prepared by Colliers International and PRDnationwide ResearchSource: ABS Cat 6416, last updated Jan 2012
| P. 17
RESEARCH REPORT | Q1 2012 | QUARTERLY ECONOMIC & PROPERTY REPORT | NATIONAL
PRDnationwide
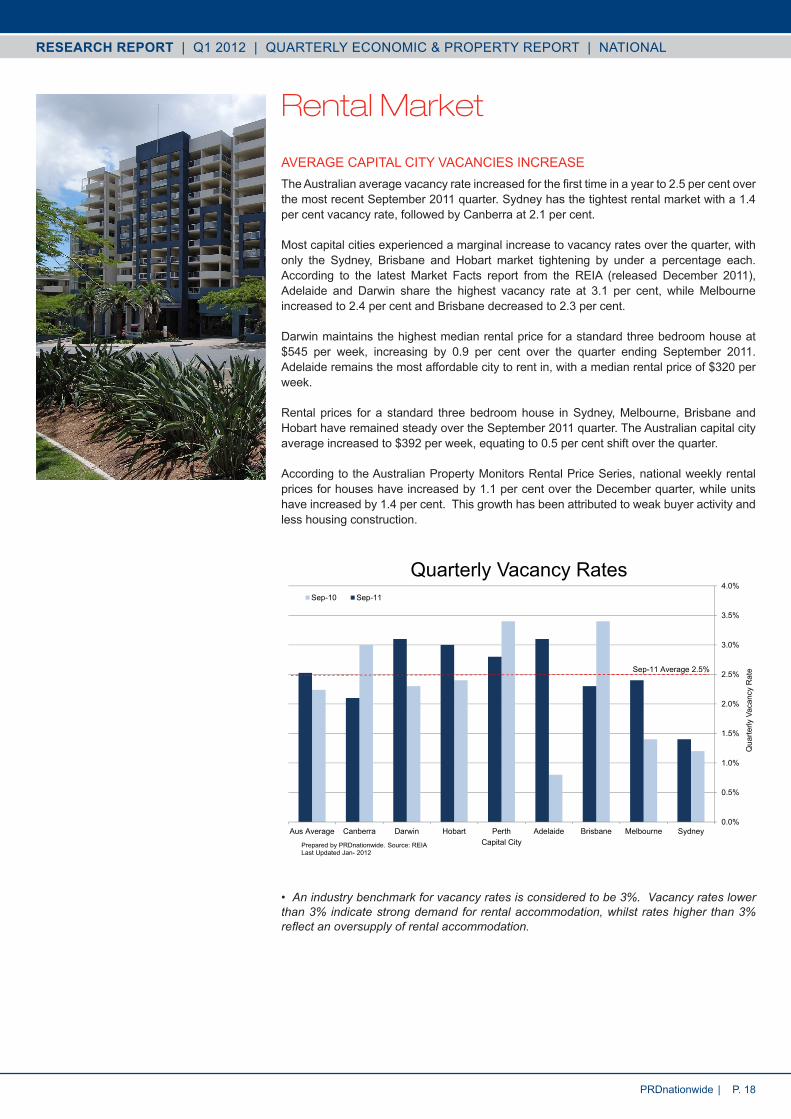
Rental Market
AVERAGE CAPITAL CITY VACANCIES INCREASETheAustralianaveragevacancyrateincreasedforthefirsttimeinayearto2.5percentoverthe most recent September 2011 quarter. Sydney has the tightest rental market with a 1.4 per cent vacancy rate, followed by Canberra at 2.1 per cent.
Most capital cities experienced a marginal increase to vacancy rates over the quarter, with only the Sydney, Brisbane and Hobart market tightening by under a percentage each. According to the latest Market Facts report from the REIA (released December 2011), Adelaide and Darwin share the highest vacancy rate at 3.1 per cent, while Melbourne increased to 2.4 per cent and Brisbane decreased to 2.3 per cent.
Darwin maintains the highest median rental price for a standard three bedroom house at $545 per week, increasing by 0.9 per cent over the quarter ending September 2011. Adelaide remains the most affordable city to rent in, with a median rental price of $320 per week.
Rental prices for a standard three bedroom house in Sydney, Melbourne, Brisbane and Hobart have remained steady over the September 2011 quarter. The Australian capital city average increased to $392 per week, equating to 0.5 per cent shift over the quarter.
According to the Australian Property Monitors Rental Price Series, national weekly rental prices for houses have increased by 1.1 per cent over the December quarter, while units have increased by 1.4 per cent. This growth has been attributed to weak buyer activity and less housing construction.
•Anindustrybenchmarkforvacancyratesisconsideredtobe3%.Vacancyrateslowerthan3%indicatestrongdemandforrentalaccommodation,whilst rateshigher than3%reflectanoversupplyofrentalaccommodation.
2
0.0%
0.5%
1.0%
1.5%
2.0%
2.5%
3.0%
3.5%
4.0%
SydneyMelbourneBrisbaneAdelaidePerthHobartDarwinCanberraAus Average
Qua
rterly
Vac
ancy
Rat
e
Capital City
Quarterly Vacancy RatesSep-10 Sep-11
Sep-11 Average 2.5%
Prepared by PRDnationwide. Source: REIALast Updated Jan- 2012
RESEARCH REPORT | Q1 2012 | QUARTERLY ECONOMIC & PROPERTY REPORT | NATIONAL
| P. 18 PRDnationwide

Demographics
WESTERN AUSTRALIA CONTINUES TO GROW RAPIDLYOver the quarter ending June 2011, the Australian rate of population growth increased slightly by 0.01 per cent to 1.24 per cent for the 12 month period ending June 2011. Although the increase is marginal, it equates to the first increase to the population rate sinceSeptember 2009 and is 278,156 new residents over the year.
The growth rate in Western Australia continues to increase, with an annual increase of 2.18 per cent (up from two per cent), equating to 49,999 new residents. Victoria registered the highest number of new residents with 76,543 during the 12 month period ending June 2011. ThisisjustaboveNewSouthWaleswith64,871newresidentsandQueenslandwith64,364.
The Northern Territory has registered the slowest population growth at 0.22 per cent for the 12 month period ending June 2011. This represents an increase of only 497 new residents for the state. Tasmania was not far behind, recording only 0.58 per cent growth (2,934 new residents) during the twelve month period.
The natural increase of the Australian population has slowed with only 568 more newborns over the June 2011 quarter, than the previous year, equating to an increase of 1.5 per cent. WhiletherehasbeenasignificantdecreaseinthenumberofimmigrantsenteringAustraliaover the past year, it could be about to change with the most recent quarter experiencing a 10percentincreasefromthepreviousyear.OvertheJune2011quarter,theslightmajorityof the overseas migrants tended to reside in Victoria, followed by New South Wales, then Western Australia.
•PopulationchangetracksthechangeinpopulationacrossthestatesandterritoriesofAustralia.Populationgrowthisseenasthekeydriverofdemandforhousing.
2
1.4%
1.9%
2.4%
1.1%
2.8%
0.8%
1.9%
1.9%
1.9%
0.9%
1.4% 1.4%
0.8%
2.2%
0.6%
0.2%
1.8%
1.2%
0.0%
0.5%
1.0%
1.5%
2.0%
2.5%
3.0%
NSW VI
C
QLD SA W
A
TAS NT
AC
T
AU
ST
Annu
al p
erce
ntag
e ch
ange
State
Population Growth 2006v2011Annual Percentage change over five years
Annual % change year ending Jun-11
Prepared by Colliers International and PRDnationwide ResearchSource: ABS Cat 3101, last updated Jan-2012
| P. 19
RESEARCH REPORT | Q1 2012 | QUARTERLY ECONOMIC & PROPERTY REPORT | NATIONAL
PRDnationwide

Demographics - cont.
MORE MIGRANTS LEAVE NSWThe number of net migrants entering Victoria continued to increase over the June 2011 quarter. Approximately 1,128 more migrants decided to call Victoria home, an increasing trend since the end of 2007.
Western Australia attracted a net 1,822 new residents from neighbouring states, increasing itsannualmovingaveragetojustbelowthatofQueensland.
Queensland received 2,076 new interstate migrants during the June 2011 quarter. Over the twelve month period ending June 2011, Queensland’s average quarterly migration rate was 1,788 new interstate migrants. The average rate of growth appears to have reached an equilibrium after a recent decline.
New South Wales still records the highest outward migration of residents nationwide and until recently, this rate was in decline. However, over the past year this rate has increased again. The annual average rate of migrants leaving New South Wales has increased to 3,305 residents and has not been this high since December 2009. In the June 2011 quarter, outward net migration increased to 3,942 residents.
South Australia continued to lose residents, with 690 net residents departing during the quarter, while the ACT increased a net 145 interstate migrants.
• Net interstatemigration tracksthenetpopulationchange ineachstateattributable tointerstatemigration.
•Netinterstatemigrationfiguresfluctuatewiththeseasons,soamovingyearlyaverageisshowntofilteroutthesechanges.
2
-15,000
-10,000
-5,000
0
5,000
10,000
15,000
Jun-
85
Jun-
86
Jun-
87
Jun-
88
Jun-
89
Jun-
90
Jun-
91
Jun-
92
Jun-
93
Jun-
94
Jun-
95
Jun-
96
Jun-
97
Jun-
98
Jun-
99
Jun-
00
Jun-
01
Jun-
02
Jun-
03
Jun-
04
Jun-
05
Jun-
06
Jun-
07
Jun-
08
Jun-
09
Jun-
10
Jun-
11
Ann
ual A
vg. o
f Num
ber o
f Per
sons
.
Quarter
Net Interstate Migration
NSW
VIC
QLD
WA
Prepared by Colliers International and PRDnationwide ResearchSource: ABS Cat 3401, last updated Jan- 2012
RESEARCH REPORT | Q1 2012 | QUARTERLY ECONOMIC & PROPERTY REPORT | NATIONAL
| P. 20 PRDnationwide
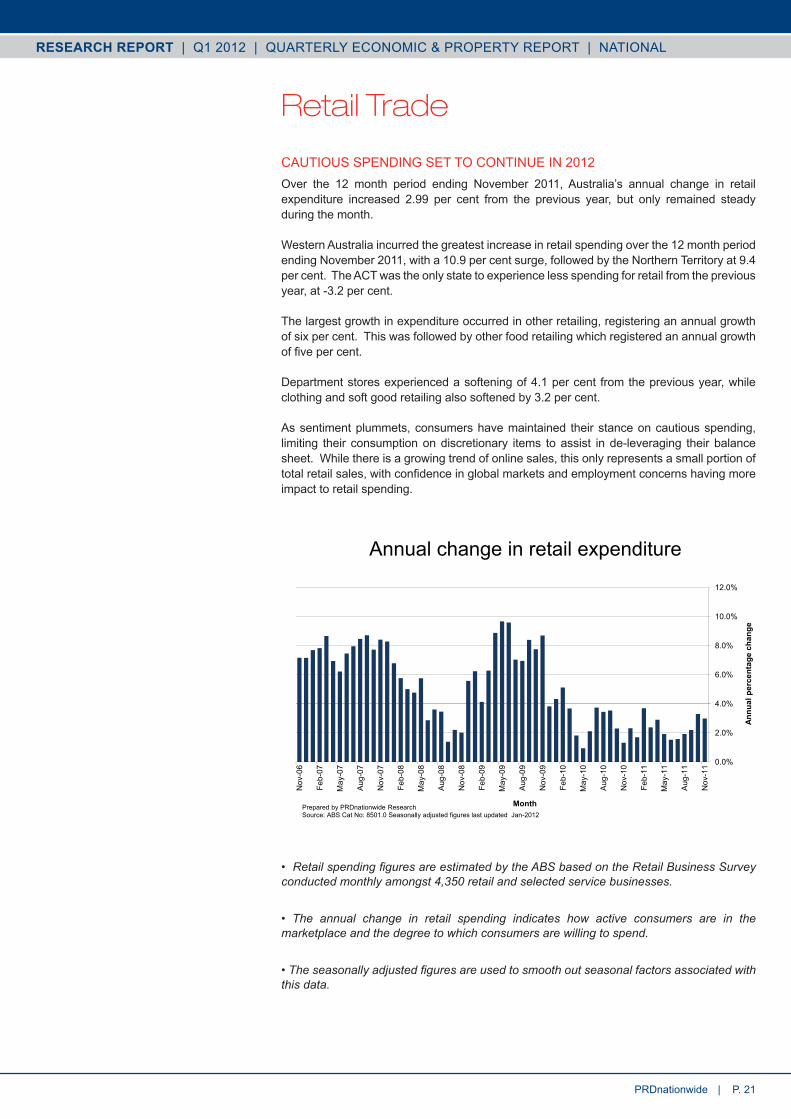
Retail Trade
CAUTIOUS SPENDING SET TO CONTINUE IN 2012Over the 12 month period ending November 2011, Australia’s annual change in retail expenditure increased 2.99 per cent from the previous year, but only remained steady during the month.
Western Australia incurred the greatest increase in retail spending over the 12 month period ending November 2011, with a 10.9 per cent surge, followed by the Northern Territory at 9.4 per cent. The ACT was the only state to experience less spending for retail from the previous year, at -3.2 per cent.
The largest growth in expenditure occurred in other retailing, registering an annual growth of six per cent. This was followed by other food retailing which registered an annual growth offivepercent.
Department stores experienced a softening of 4.1 per cent from the previous year, while clothing and soft good retailing also softened by 3.2 per cent.
As sentiment plummets, consumers have maintained their stance on cautious spending, limiting their consumption on discretionary items to assist in de-leveraging their balance sheet. While there is a growing trend of online sales, this only represents a small portion of totalretailsales,withconfidenceinglobalmarketsandemploymentconcernshavingmoreimpact to retail spending.
•RetailspendingfiguresareestimatedbytheABSbasedontheRetailBusinessSurveyconductedmonthlyamongst4,350retailandselectedservicebusinesses.
• The annual change in retail spending indicates how active consumers are in themarketplaceandthedegreetowhichconsumersarewillingtospend.
•Theseasonallyadjustedfiguresareusedtosmoothoutseasonalfactorsassociatedwiththisdata.
2
0.0%
2.0%
4.0%
6.0%
8.0%
10.0%
12.0%
Nov
-06
Feb-
07
May
-07
Aug
-07
Nov
-07
Feb-
08
May
-08
Aug
-08
Nov
-08
Feb-
09
May
-09
Aug
-09
Nov
-09
Feb-
10
May
-10
Aug
-10
Nov
-10
Feb-
11
May
-11
Aug
-11
Nov
-11
Annu
al p
erce
ntag
e ch
ange
Month
Annual change in retail expenditure
Prepared by PRDnationwide ResearchSource:ABSCatNo:8501.0SeasonallyadjustedfigureslastupdatedJan-2012
| P. 21
RESEARCH REPORT | Q1 2012 | QUARTERLY ECONOMIC & PROPERTY REPORT | NATIONAL
PRDnationwide

About PRDnationwide ResearchPRDnationwide’s research division provides reliable, unbiased, and authoritative property research and consultancy to clients in metro and regional locations across Australia. Our extensive research capability and specialised approach ensures our clients can make the most informed and financially sounds decisions about residential and commercialproperties.
Our Knowledge
AccesstoaccurateandobjectiveresearchisthefoundationofallgoodpropertydecisionsAsthefirstandonlytrulyknowledgebasedpropertyservicescompany,PRDnationwideshares experience and knowledge to deliver innovative and effective solutions to our clients.
We have a unique approach that integrates people, experience, systems and technology to create meaningful business connections We focus on understanding new issues impacting the property industry; such as the environment and sustainability, the economy, demographic and psychographic shifts, commercial and residential design; and forecast future implications around such issues based on historical data and fact.
Our People
Ourresearchteamismadeupofhighlyqualifiedresearcherswhofocussolelyonpropertyanalysis. Skilled in deriving macro and micro quantitative information from multiple credible sources, we partner with clients to provide strategic advice and direction regarding property and market performance. We have the added advantage of sourcing valuable and factual qualitative market research in order to ensure our solutions are the most well considered andfinanciallyviable.
Our experts are highly sought after consultants for both corporate and government bodies and their advice has helped steer the direction of a number of property developments and secured successful outcomes for our clients.
Our Services
PRDnationwide provides a full range of property research services across all sectors and markets within Australia. We have the ability and systems to monitor market movements, demographicchangesandpropertytrends.Weuseourknowledgeofmarketsizes,pricestructure and buyer profiles to identify opportunities for clients and provide marketknowledge that is unbiased, thorough and reliable.
Our services include:
• Advisory and consultancy
• MarketAnalysisincludingprofilingandtrends
• Primary qualitative and quantitative research
• Demographic and target market analysis
• Geographic information mapping
• ProjectAnalysisincludingproductandpricingrecommendations
• Rental and investment return analysis
• Competitiveprojectactivityanalysis
• Economic indicators
• Social research, including focus groups
110officesnationwide
“We set industry benchmarks when partnering with our clients to answer key questions and solve complex issues in the residential development arena.”
RESEARCH REPORT | Q1 2012 | QUARTERLY ECONOMIC & PROPERTY REPORT | NATIONAL
| P. 22 PRDnationwidewww.prdnationwide.com.au

Our Research Reports
Property Watch® Reports:
Over 130 snapshots of various areas aroundAustralia, as well as specific reports onproperty topics of interest such as resale growth, infrastructure planning, luxury properties, and supply and demand.
Highlight Reports:
Major annual reports examining the macro and micro economic information of largercatchment areas within select city, rural, and coastal regions.
Quarterly Economic and Property Report:
Produced quarterly to examine economic and property trends nationally.
Niche Reports:
Coveringtopicalsubjectssuchasmixeduseandtransitorienteddevelopments,marinaberths, waterfront property and luxury property markets.
Suburb Profiles:
Detailed demographic and sales information for statistical local areas (suburbs) in Queensland, New South Wales, Victoria, and Australian Capital Territory.
Residential Unit Reports:
Quarterlyreportsbasedonprimaryresearchintothesaleofnewunitswithinmajormetroand coastal cities identifying trends and opportunities
Research Consultancy Service
We set industry benchmarks when partnering with our clients to answer key questions and solve complex issues in the residential development arena.
Our specialised consultancy service adds value to our clients’ business by identifying the best means for gaining a competitive advantage. We have extensive experience in providing advice on virtually every type of residential property and the issues and considerations that surround them.
We simplify your decision-making process by providing comprehensive information and recommendations including (but not limited to):
PRDnationwide Level 5, 10 Market StBrisbane, QLD, 4000TEL 07 3229 3344FAX 07 3166 0462
RESEARCHER
Aaron MaskreyDirector | Research PRDnationwidePh: (07) 3370 1702E: [email protected]
PRDnationwide does not give any warranty in relation to the accuracy of the information contained in this report. If you intend to rely upon the information contained herein, you must take note thattheinformation,figuresandprojectionshavebeen provided by various sources and have not beenverifiedbyus.Wehavenobeliefonewayorthe other in relation to the accuracy of such informa-tion,figuresandprojections.
PRDnationwide will not be liable for any loss or damageresultingfromanystatement,figure,calculation or any other information that you rely upon that is contained in the material. COPYRIGHT - PRDnationwide 2012.
Prepared by PRDnationwide Research
For further details contact Aaron Maskrey
Tel 07 3370 1702
www.prdnationwide.com.au
PRDnationwide is a Colliers International company
Primary &
Secondary Market
Analysis
Target Market
Analysis &
Consumer Research
GIS Mapping &
Spatial Analysis
Marketing &
Launch Strategies
Amenity Analysis
Product & Pricing
Mix Anaylsis
Your Property
Join PRDnationwide
PRDnationwide welcomes passionate individuals who are interested in business ownership.
Whenyoujoinourfamilyofmorethan110officesyouprofitfromprovenmarketingtools, leading-edge technology, specialised training and powerful brand recognition.
If you are interested in knowing more about owning and operating a PRDnationwide business either now or in the future, please contact:
Elias Sleiman on 0438184127 or [email protected]
| P. 23
RESEARCH REPORT | Q1 2012 | QUARTERLY ECONOMIC & PROPERTY REPORT | NATIONAL
PRDnationwide

PRDnationwide Pty Ltd
www.prdnationwide.com.au