prdnationwide quarterly economic & property report ed 3 2012
DESCRIPTION
The Quarterly Economic and Property Report includes commentary on macro-economic indicators and how they relate to property.TRANSCRIPT

QUARTERLY ECONOMIC AND PROPERTY REPORT QUARTER 3 | 2012

Want some positive news? Australia is still
the place to be for growth and prosperity.
Officially this is the longest spell of growth
without a recession that Australia has ever
achieved. In fact, 21 years without a
recession is a record for any nation. The
Reserve Bank Governor recently
mentioned Australia’s glass is more than
half full, even if many people don’t see it
that way. Consider this- the 1970s saw the
popularisation of a measure that was
dubbed ‘the misery index’. This was the
number achieved when combining the
unemployment and inflation rates. This
measure is at its lowest level in Australia
since the 1960s.
Australian based assets have become
desirable for central banks across the
globe. This has helped prevent a rapid
decline of the Australia dollar as global
commodity prices have fallen. When
comparing the current yield of 10 year
Australian bonds to the German equivalent,
the Australian bonds deliver twice the
German rate. It is no wonder why other
countries view Australia as a safe haven.
Nowhere has this reassessment of risk
been greater than in the Eurozone. In
2005, the Greek and Spanish governments
could borrow money through the bond
market for roughly the same interest rate
as Germany at around 3.1per cent.
Financial markets treated the different
governments of the Eurozone as if they
were the same. Today it costs the Spanish
government four times as much to borrow
as Germany. The Greek government pays
eighteen times more than Germany. The
debt crisis has led to a dramatic resetting
of interest rates across Europe. Essentially,
an investment of €100 in German equities
in late 2009 would have grown to €114
today. The same investment in Greek
shares would be worth €26.
But how did this affect property? Well the
single currency brought very low German
interest rates to countries that were used to
much higher rates, triggering a boom in
house prices. In the 10 years to 2007, Irish
house prices almost quadrupled, while
Spanish house prices almost tripled. Over
the same period German house prices
were roughly unchanged. The Global
Financial Crisis of 2008 saw the collapse in
Irish and Spanish house prices that has
wreaked havoc on highly leveraged banks.
There is more positive news domestically,
with RP Data’s latest figures showing an
improvement to dwelling values in most
capital cities over the month of June. This
could be a direct result of the recent period
of falling interest rates. Certainly the fall in
rates and the added stimulus from the new
budget for low to medium income earners
has seen an improvement to retail
expenditure. All that is missing from this
picture is strong consumer sentiment and
buyer confidence, which is likely to return
once the volatility overseas ceases.
The first release of the Census 2011
showed that the Australian Bureau of
Statistics (ABS) have been over estimating
the growth in the Australian population.
This oversight will likely have ramifications
in other statistical releases from the ABS,
such as the Australian unemployment rate.
Looking ahead, the ABS will be measuring
the population on newly formed statistical
areas that do not share geographical
boundaries with the previous local
government area boundaries. Moving
forward it shall be interesting to see how
local councils will utilise the new
demographical figures which do not
correspond to their council area.
Economic and Property Overview
Key Facts:
CPI: 1.6%
SVHL Rate: 7.05%
AUS Unemployment Rate: 5.0%
Average AUS Fuel Price: $1.50pl
2

• Consumer sentiment continues to be
poor, as the long-term six month moving
average Index has remained below the
equilibrium of 100 points since mid 2011.
However, this six month average Index
increased by 0.1 points over the month
of June to register 96.6 points. When
compared to the previous year, a total
decrease of 7.7 points has been
recorded.
• On a monthly basis the Australian
Consumer Sentiment Index increased
further by 0.3 points over the month of
June 2012, to record a score of 96.6
points.
• Out of the five states measured for the
Index, sentiment decreased the most
over June 2012 in South Australia (down
7.4 per cent), followed by New South
Wales (down 5.6 per cent). Sentiment
increased the most in Western Australia
(up 19 per cent), followed by Queensland
(up 6.6 per cent). Optimists now
outweigh pessimists in Western Australia,
with the highest Index score at 107.5
points. Queensland is the only measured
state to score below the 100 equilibrium
mark, with an Index score of 93.5 points.
• It shall be interesting to view the
fluctuations in consumer sentiment now
that the long awaited carbon price and
minerals tax has been introduced on the
1st of July.
Confidence Sentiment remains low
Australian Consumer Sentiment Graph (right):
• The Consumer Sentiment Index indicates short-run changes to consumer willingness to purchase goods in the forthcoming quarter.
• The Index is based on a monthly survey of 1,200 Australian households conducted by the Melbourne Institute and Westpac.
• It represents current and future perspectives of the broad economic climate and household financial state.
Australian Consumer Sentiment
3
60
70
80
90
100
110
120
130
Ju
n-9
2
Ju
n-9
3
Ju
n-9
4
Ju
n-9
5
Ju
n-9
6
Ju
n-9
7
Ju
n-9
8
Ju
n-9
9
Ju
n-0
0
Ju
n-0
1
Ju
n-0
2
Ju
n-0
3
Ju
n-0
4
Ju
n-0
5
Ju
n-0
6
Ju
n-0
7
Ju
n-0
8
Ju
n-0
9
Ju
n-1
0
Ju
n-1
1
Ju
n-1
2
Con
su
me
r S
en
tim
en
t In
de
x
Australian Consumer Sentiment Index Six Month Moving Average
Prepared by PRDnationwide ResearchSource: Westpac/Melbourne Institute, last updated July-2012

• Australian business conditions have
increased slightly in the month of June as
firms reported better sales, but
confidence fell to a 10 month low on
concerns about the European debt crisis
and domestic taxes. Confidence
decreased to record -3.0 index points on
the NAB Quarterly Index, equating to a
fall of 1.8 points.
• Over the June 2012 quarter, business
confidence fell in the resource driven
states as a likely reflection on the
contraction of commodity prices, while it
increased strongly in Victoria. Confidence
is now weakest in Queensland (at -7)
followed by Victoria and New South
Wales (both at -4), while highest in South
Australia (zero) and Western Australia
(-1).
• Confidence declined heavily over the
March 2012 quarter in mining (down 18
to -14 points) and manufacturing (down
9 to -10 points). In contrast confidence
improved in finance/business/property
(up 12 to +2 points).
• The Australian Industry Group has
reported that 42 per cent of its surveyed
members plan to raise prices immediately
following the introduction of the carbon
tax.
• The sovereign debt situation in Europe is
particularly worrying as Spanish 10-year
bonds increased above the seven per
cent mark. The ratio of bad loans held by
Spanish banks rose to an 18-year high of
8.7 per cent in April. An independent
audit of Spanish banks found that they
may require up to €62bn in extra funding,
in addition to the €100bn of funding
already agreed by European authorities.
While the Spanish debt is unsustainable,
it now appears that Portugal, Ireland and
Greece will require full bailouts.
Unfortunately Italian bond yields are also
increasing and could be the next test for
the Eurozone.
• The People's Bank of China (PBOC) and
the European Central Bank both cut
rates, while the Bank of England
extended quantitative easing by £50
billion. The PBOC is now trying to get
both deposit and lending rates to a level
that encourages the system to create
more credit. This is further evidence of a
China slowdown.
Confidence cont. International volatility restricts confidence
Business Confidence Graph (right):
• The Business Confidence Index indicates expectations of business conditions for the upcoming quarter.
• The Index is based on a survey of approximately 900 small to large businesses in the non-farm sectors and is conducted by the National Australia Bank (NAB).
Business Confidence
4
-40
-35
-30
-25
-20
-15
-10
-5
0
5
10
15
20
25
30
35
Ju
n-9
5
Dec-9
5
Ju
n-9
6
Dec-9
6
Ju
n-9
7
Dec-9
7
Ju
n-9
8
Dec-9
8
Ju
n-9
9
Dec-9
9
Ju
n-0
0
Dec-0
0
Ju
n-0
1
Dec-0
1
Ju
n-0
2
Dec-0
2
Ju
n-0
3
Dec-0
3
Ju
n-0
4
Dec-0
4
Ju
n-0
5
De
c-0
5
Ju
n-0
6
Dec-0
6
Ju
n-0
7
Dec-0
7
Ju
n-0
8
Dec-0
8
Ju
n-0
9
Dec-0
9
Ju
n-1
0
De
c-1
0
Ju
n-1
1
Dec-1
1
Ju
n-1
2
Ind
ex v
alu
e
Quarter
ImprovingConfidence
Prepared by PRDnationwide ResearchSource: National Australia Bank (NAB), last updated Jul-12

• The March 2012 CPI figures recorded an
annual change of 1.6 per cent, which
equates to a dramatic decrease from the
previous quarter of 3.1 per cent, and is
well below the RBA target range of two
to three per cent.
• The underlying inflation figure, as
measured by the RBA removes volatile
items such as fruit and fuel, has
remained at the bottom of the target
range at 2.0 per cent, and has decreased
from the December 2011 quarter by 0.5
per cent to 2.0 per cent.
• The US Federal Reserve extended its
"Operation Twist" bond buying
programme which is designed to keep
interest rates low, until at least late 2014.
Operation Twist is where the Federal
Bank borrows short dated securities at
low interest rates and buys 30 year
securities to push down longer-term
interest rates, rates that are used for
business and housing loans.
• There is a strong divergence from
productivity to wages within Australia.
The nation’s long-term productivity
(output) growth has been 1.7 per cent a
year, while the gross domestic product
per hour worked has dropped over the
past five years to 0.8 per cent year.
Within the mining sector, output has
increased by 33 per cent, while the
number of employees has increased by
207 per cent. Within the utilities industry,
output has increased by 12 per cent,
while employment has increased by 86
per cent.
Macroeconomic Climate Inflation below target area
Inflation Graph (right):
• Inflation is measured as a change in the Consumer Price Index (CPI), calculated by the Australian Bureau of Statistics as the price of a weighted 'basket' of goods and services which account for a high proportion of expenditure by metropolitan households.
• The Reserve Bank of Australia (RBA) aims to constrain inflation in a long-run target range of 2-3% through the setting of interest rates.
Inflation
5
0%
2%
4%
6%
8%
Mar-
02
Sep-0
2
Mar-
03
Sep-0
3
Mar-
04
Sep-0
4
Mar-
05
Sep-0
5
Mar-
06
Sep-0
6
Mar-
07
Sep-0
7
Mar-
08
Sep-0
8
Mar-
09
Sep-0
9
Mar-
10
Sep-1
0
Mar-
11
Sep-1
1
Mar-
12
An
nu
al C
ha
nge
in
CP
I
Quarter
All groups Excluding volatile items
Reserve Bank's Target Range
Prepared by PRDnationwide ResearchSource: ABS Cat 6401, last updated July- 2012

• The Reserve Bank of Australia (RBA) has
once again cut the official cash rate in the
second quarter of 2012, with a drop of
0.5 per cent in May and a further 0.25
per cent in June. This equates to an
official lending rate of 3.5 per cent and is
well below the 10 year average of 5.11
per cent. In total, over the past seven
months the RBA has cut the cash rate by
1.25 per cent. It is viewed that the RBA
has moved rates back into a stimulatory
policy setting.
• The standard variable housing loan
interest rate has decreased in the second
quarter by 0.35 per cent to 7.05 per
cent. While major lending institutions
have not passed on the recent rate cuts
in full, the standard variable housing loan
rate is now 0.3 per cent below the 10
year average of 7.35 per cent.
• While many economists were split
whether the RBA would cut the cash rate
by 1.0 per cent or 0.5 per cent, the
decision to only cut the rate by 0.25 per
cent has again shown that the RBA is
fairly bullish about the local economy. In
fact the RBA stated in its minutes that
the recent domestic data had not shown
weakening conditions. However, it is
aware of the uncertainty in Europe
potentially having a spillover affect locally.
The NAB predicts a further rate cut in
either August or September.
• Essentially, the key reasons for the rate
cut in June were :
I. Commodity prices have declined,
which is helping to reduce inflation.
Maintaining low inflation over the
longer term will, however, require
growth in domestic costs to slow as
the effects of the earlier exchange
rate appreciation wane.
II. Financial markets have initially
responded positively to signs of
further progress towards longer-term
sustainability in European financial
affairs. Uncertainty still looms for
other overseas markets including
parts of Asia and the US.
III.In Australia, recent data suggest that
the economy continued to grow in
the first part of 2012, at a pace
somewhat stronger than had been
earlier indicated. Labour market
conditions also firmed a little,
notwithstanding job shedding in
some industries; the rate of
unemployment remains low.
IV.Interest rates for borrowers have
declined, to be a little below their
medium-term averages and business
credit has increased more strongly in
recent months, though credit growth
remains modest overall.
Macroeconomic Climate cont. RBA moves rates to stimulate market confidence
Housing Loan Interest Rate Graph (right):
• The housing loan interest rate is the average rate of interest being offered by housing lenders. It is higher than the RBA’s target cash rate due to lending costs and profit margins.
• Interest rates are set by the RBA, who acts independently of government and sets interest rates with the goal of maintaining inflation in a long-run target range of 2% and 3%. The RBA meets monthly to review the current interest rate and is only required to justify its decision if it chooses to alter the rate.
Housing Loan Interest Rate
6
0.0
2.0
4.0
6.0
8.0
10.0
12.0
14.0
16.0
18.0
May-8
2
Ma
y-8
3
Ma
y-8
4
Ma
y-8
5
Ma
y-8
6
Ma
y-8
7
Ma
y-8
8
Ma
y-8
9
Ma
y-9
0
Ma
y-9
1
Ma
y-9
2
Ma
y-9
3
Ma
y-9
4
Ma
y-9
5
Ma
y-9
6
May-9
7
Ma
y-9
8
Ma
y-9
9
Ma
y-0
0
Ma
y-0
1
Ma
y-0
2
Ma
y-0
3
Ma
y-0
4
Ma
y-0
5
Ma
y-0
6
Ma
y-0
7
Ma
y-0
8
Ma
y-0
9
Ma
y-1
0
May-1
1
Ma
y-1
2 Sta
nd
ard
Ba
nk H
ou
sin
g L
oa
n In
tere
st R
ate
%
MonthPrepared by PRDnationwide ResearchSource: RBA Bulletin F05, last updated July-2012
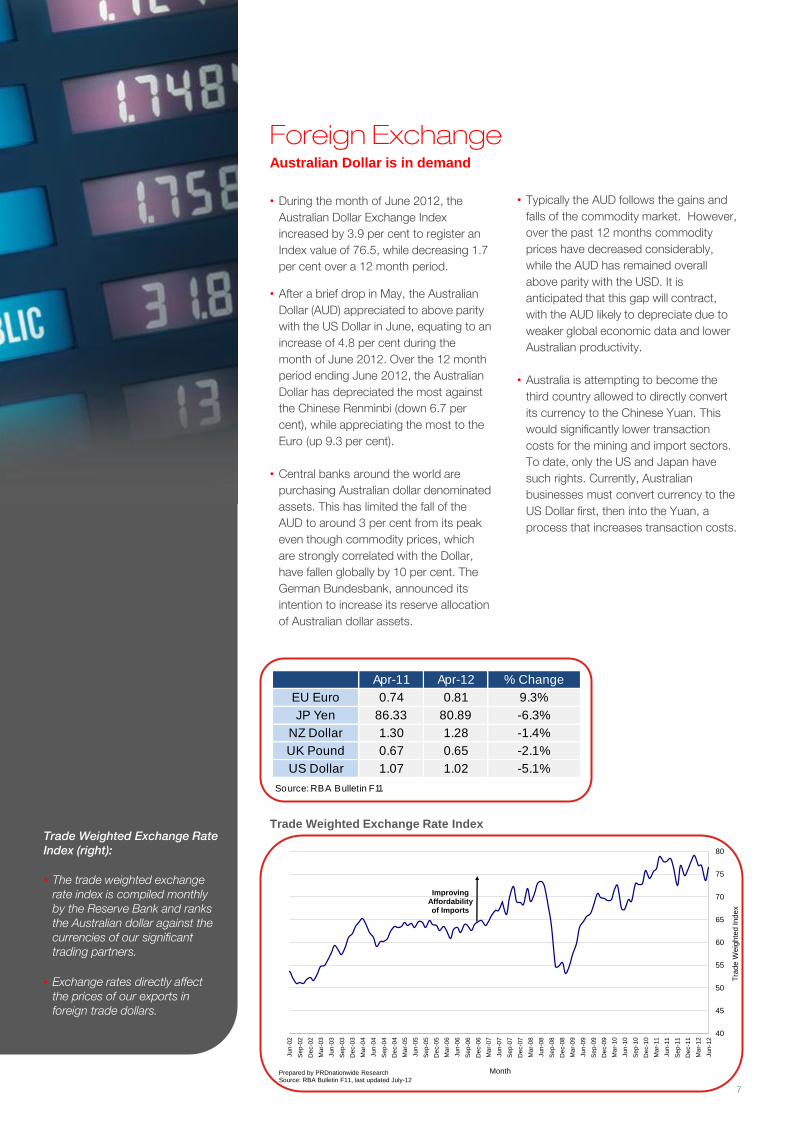
• During the month of June 2012, the
Australian Dollar Exchange Index
increased by 3.9 per cent to register an
Index value of 76.5, while decreasing 1.7
per cent over a 12 month period.
• After a brief drop in May, the Australian
Dollar (AUD) appreciated to above parity
with the US Dollar in June, equating to an
increase of 4.8 per cent during the
month of June 2012. Over the 12 month
period ending June 2012, the Australian
Dollar has depreciated the most against
the Chinese Renminbi (down 6.7 per
cent), while appreciating the most to the
Euro (up 9.3 per cent).
• Central banks around the world are
purchasing Australian dollar denominated
assets. This has limited the fall of the
AUD to around 3 per cent from its peak
even though commodity prices, which
are strongly correlated with the Dollar,
have fallen globally by 10 per cent. The
German Bundesbank, announced its
intention to increase its reserve allocation
of Australian dollar assets.
• Typically the AUD follows the gains and
falls of the commodity market. However,
over the past 12 months commodity
prices have decreased considerably,
while the AUD has remained overall
above parity with the USD. It is
anticipated that this gap will contract,
with the AUD likely to depreciate due to
weaker global economic data and lower
Australian productivity.
• Australia is attempting to become the
third country allowed to directly convert
its currency to the Chinese Yuan. This
would significantly lower transaction
costs for the mining and import sectors.
To date, only the US and Japan have
such rights. Currently, Australian
businesses must convert currency to the
US Dollar first, then into the Yuan, a
process that increases transaction costs.
Foreign Exchange Australian Dollar is in demand
Trade Weighted Exchange Rate Index (right):
• The trade weighted exchange rate index is compiled monthly by the Reserve Bank and ranks the Australian dollar against the currencies of our significant trading partners.
• Exchange rates directly affect the prices of our exports in foreign trade dollars.
Trade Weighted Exchange Rate Index
7
Apr-11 Apr-12 % Change
EU Euro 0.74 0.81 9.3%
JP Yen 86.33 80.89 -6.3%
NZ Dollar 1.30 1.28 -1.4%
UK Pound 0.67 0.65 -2.1%
US Dollar 1.07 1.02 -5.1%
Source: RBA Bulletin F11
40
45
50
55
60
65
70
75
80
Ju
n-0
2
Se
p-0
2
De
c-0
2
Ma
r-0
3
Ju
n-0
3
Se
p-0
3
De
c-0
3
Ma
r-0
4
Ju
n-0
4
Se
p-0
4
De
c-0
4
Ma
r-0
5
Ju
n-0
5
Se
p-0
5
De
c-0
5
Ma
r-0
6
Ju
n-0
6
Se
p-0
6
De
c-0
6
Ma
r-0
7
Ju
n-0
7
Se
p-0
7
De
c-0
7
Ma
r-0
8
Ju
n-0
8
Se
p-0
8
De
c-0
8
Ma
r-0
9
Ju
n-0
9
Se
p-0
9
De
c-0
9
Ma
r-1
0
Ju
n-1
0
Se
p-1
0
De
c-1
0
Ma
r-1
1
Ju
n-1
1
Se
p-1
1
De
c-1
1
Ma
r-1
2
Ju
n-1
2
Tra
de
We
igh
ted
In
de
x
MonthPrepared by PRDnationwide ResearchSource: RBA Bulletin F11, last updated July-12
ImprovingAffordabilityof Imports

• In dollar value terms, the nation
experienced a decrease of 1.2 per cent
to the average petrol price during the
month ending May 2012. The average
price Australians pay at the pump
decreased to $1.50 per litre. During the
year petrol prices increased at an
average rate of 3.0 per cent across the
nation.
• Melbourne continues to be the capital
city where motorists pay the least but is
now joined by Sydney at $1.46 per litre.
Melbourne experienced 5.0 per cent
increase over a three month period
ending May 2012, while prices in Sydney
remained unchanged. In Darwin
consumers continue to pay the most at
$1.59 per litre, followed by Hobart and
Canberra at $1.54.
• Over the three month period ending May
2012, all other capital cities (except for
Sydney) experienced an increase to
petrol prices with Canberra increasing
the most at 5.5 per cent. Brisbane
experienced an increase of 2.1 per cent,
while Hobart increased at 2.0 per cent.
• During the course of the 12 month
period, Canberra’s petrol prices
increased the most at 7.7 per cent, while
Sydney experienced the smallest shift for
a capital city, with the average price
remaining stagnant.
• Recent weaker than anticipated
international economic data has assisted
in the deterioration of crude oil prices.
The price of a barrel of Brent crude oil fell
below $90 for the first time in 18 months,
over continued worries over global
growth. The price for oil in the short term
looks fairly bullish, with accumulating
inventories and sufficient supply.
• The Harvard Kennedy School has
released a recent report that predicts oil
production for both crude oil and natural
gas is expected to increase from 93
million barrels a day in 2011 to 110.6
barrels a day in 2020. This is a result of
an investment boost into exploration and
production of $1.5 trillion in 2003.
Fuel Prices Weak demand drives fuel prices down
Retail Fuel Prices Graph (right):
• Sourced from Fueltrac, this chart tracks the average retail price for unleaded petrol across a broad range of suppliers in metro areas.
Retail Fuel Prices
8
$0.40
$0.60
$0.80
$1.00
$1.20
$1.40
$1.60
$1.80
Ju
n-0
2
De
c-0
2
Ju
n-0
3
De
c-0
3
Ju
n-0
4
De
c-0
4
Ju
n-0
5
De
c-0
5
Ju
n-0
6
De
c-0
6
Ju
n-0
7
De
c-0
7
Ju
n-0
8
De
c-0
8
Ju
n-0
9
De
c-0
9
Ju
n-1
0
De
c-1
0
Ju
n-1
1
De
c-1
1
Ju
n-1
2
Ave
rag
e R
eta
il P
ric
e o
f U
LP
Month
Brisbane Melbourne Sydney
Prepared by PRDnationwide ResearchSource: AAA/Fueltrac, last updated July-2012
• During the month of June 2012, the
Commodity Price Index decreased by 1.7
per cent to reach 97.5 points. When
compared to the previous year, the Index
has fallen by 10 per cent. Commodity
prices are still above the longer-term 10
year average of 72.4 index points.
• Times are changing for the major mining
companies with Rio Tinto announcing
that they will cut 10 per cent to its
services and support, following BHP
Billiton's cost conscious comments
made earlier in the year. The ongoing
global economic uncertainty has made a
more volatile environment for commodity
trading.
• Chinese manufacturing activity
contracted at the fastest rate in seven
months to June 2012, driven by falling
exports and weak domestic demand.
This has had a significant impact to
commodity prices, as the high price for
iron ore and coal has powered the
Australian economy. The Chinese slow
down will place a big hindrance to the
budget surplus plans for 2012-13.
• According to the AME Group, Australia is
the largest exporter of coking coal, with
55 per cent of the total world export
volume. China and Japan, the two
largest customers for Australian coking
coal, import 22 per cent and 18 per cent
respectively.
• Looking ahead into the second half of
2012, the moderation in the economic
data from China and the US combined
with fresh concerns over the Eurozone
will likely keep commodity prices low.
However, if there is further stimulus
spending in both China and the US,
expect commodity prices to be pushed
higher.
• IBISWorld predicts diamond and
gemstone mining revenue will increase by
35.6 per cent over this financial year to
reach $509 million. Australia exports 93
per cent of its gemstone and diamond
production. It is also predicted that the
electricity generation industry will increase
its revenue by 28.7 per cent to reach
$19.1 billion, as a result of the flow-on
effects of the carbon tax.
Commodities Prices Commodity prices continue to soften
RBA Commodity Price Index Graph (right):
• Primary commodities account for more than half of Australia’s export earning.
• The Reserve Bank’s Commodity Price Index provides an indicator of primary commodity price movements. The index includes 17 commodities with separate weightings, the highest of which are coal, gold and iron ore.
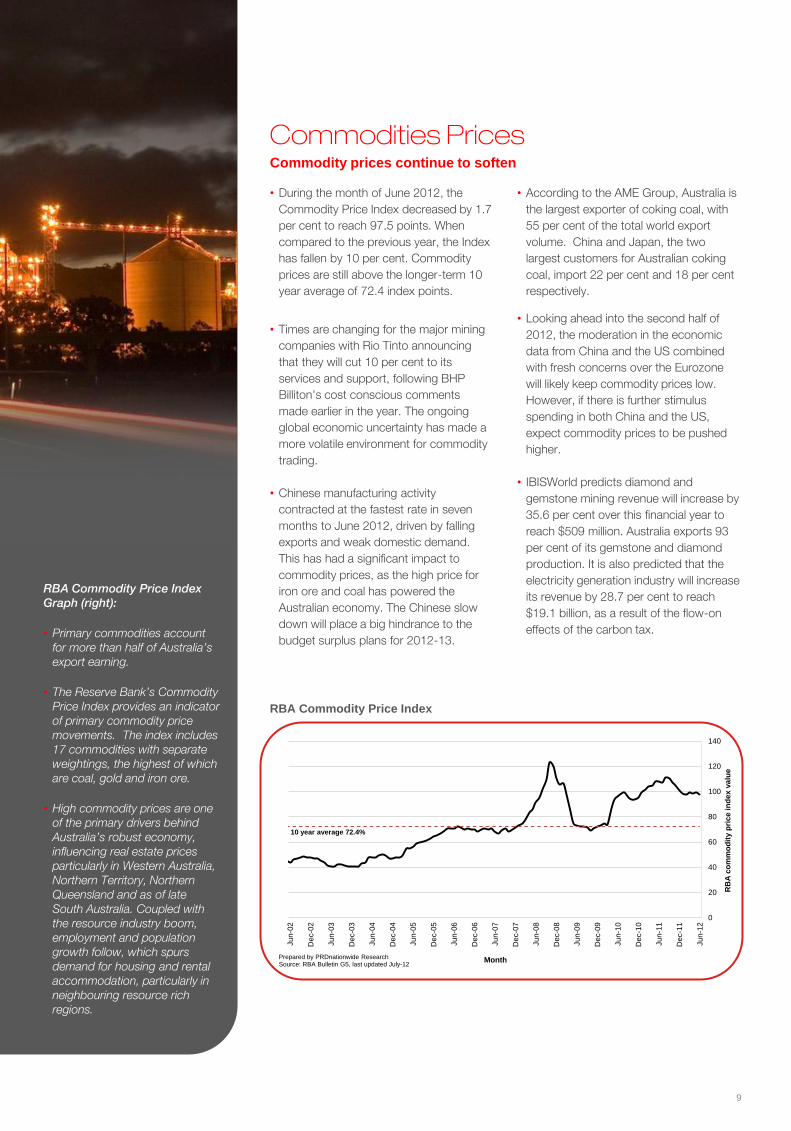
• High commodity prices are one of the primary drivers behind Australia’s robust economy, influencing real estate prices particularly in Western Australia, Northern Territory, Northern Queensland and as of late South Australia. Coupled with the resource industry boom, employment and population growth follow, which spurs demand for housing and rental accommodation, particularly in neighbouring resource rich regions.
RBA Commodity Price Index
9
0
20
40
60
80
100
120
140
Ju
n-0
2
De
c-0
2
Ju
n-0
3
De
c-0
3
Ju
n-0
4
De
c-0
4
Ju
n-0
5
De
c-0
5
Ju
n-0
6
De
c-0
6
Ju
n-0
7
De
c-0
7
Ju
n-0
8
De
c-0
8
Ju
n-0
9
De
c-0
9
Ju
n-1
0
De
c-1
0
Ju
n-1
1
De
c-1
1
Ju
n-1
2
RB
A c
om
mo
dit
y p
ric
e in
de
x v
alu
e
MonthPrepared by PRDnationwide ResearchSource: RBA Bulletin G5, last updated July-12
10 year average 72.4%
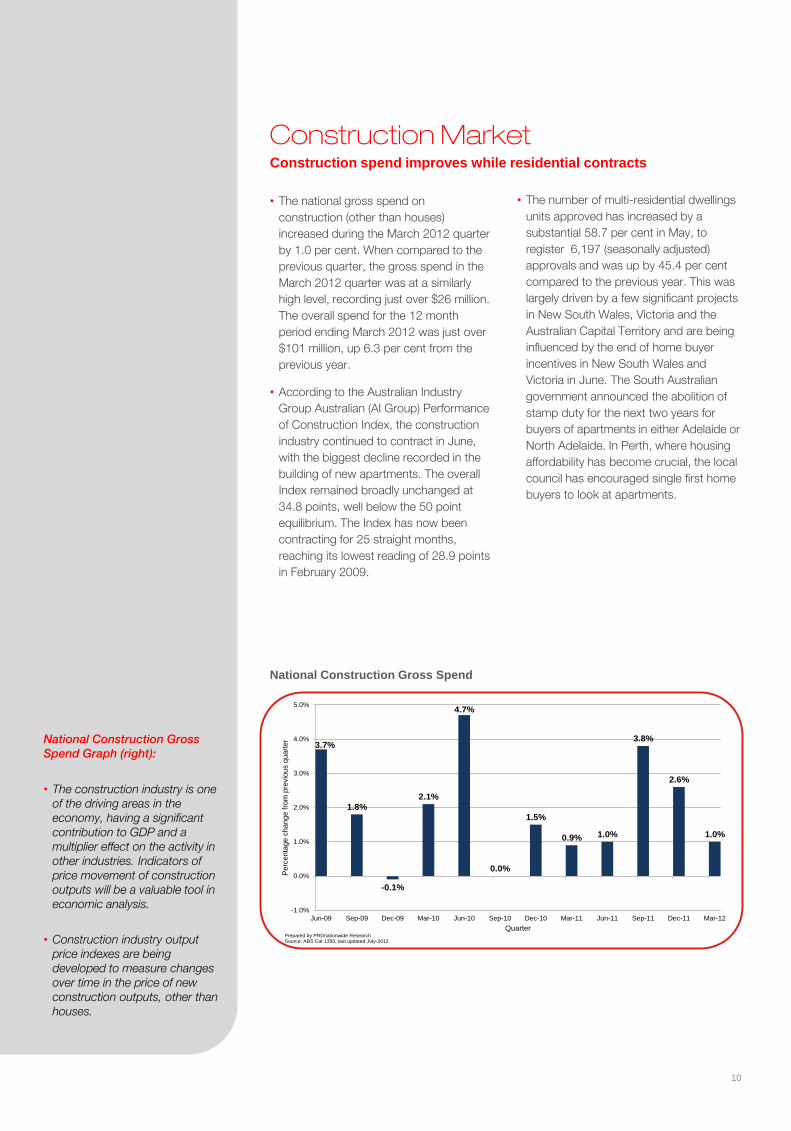
• The national gross spend on
construction (other than houses)
increased during the March 2012 quarter
by 1.0 per cent. When compared to the
previous quarter, the gross spend in the
March 2012 quarter was at a similarly
high level, recording just over $26 million.
The overall spend for the 12 month
period ending March 2012 was just over
$101 million, up 6.3 per cent from the
previous year.
• According to the Australian Industry
Group Australian (AI Group) Performance
of Construction Index, the construction
industry continued to contract in June,
with the biggest decline recorded in the
building of new apartments. The overall
Index remained broadly unchanged at
34.8 points, well below the 50 point
equilibrium. The Index has now been
contracting for 25 straight months,
reaching its lowest reading of 28.9 points
in February 2009.
• The number of multi-residential dwellings
units approved has increased by a
substantial 58.7 per cent in May, to
register 6,197 (seasonally adjusted)
approvals and was up by 45.4 per cent
compared to the previous year. This was
largely driven by a few significant projects
in New South Wales, Victoria and the
Australian Capital Territory and are being
influenced by the end of home buyer
incentives in New South Wales and
Victoria in June. The South Australian
government announced the abolition of
stamp duty for the next two years for
buyers of apartments in either Adelaide or
North Adelaide. In Perth, where housing
affordability has become crucial, the local
council has encouraged single first home
buyers to look at apartments.
Construction Market Construction spend improves while residential contracts
National Construction Gross Spend Graph (right):
• The construction industry is one of the driving areas in the economy, having a significant contribution to GDP and a multiplier effect on the activity in other industries. Indicators of price movement of construction outputs will be a valuable tool in economic analysis.
• Construction industry output price indexes are being developed to measure changes over time in the price of new construction outputs, other than houses.
National Construction Gross Spend
10
3.7%
1.8%
-0.1%
2.1%
4.7%
0.0%
1.5%
0.9% 1.0%
3.8%
2.6%
1.0%
-1.0%
0.0%
1.0%
2.0%
3.0%
4.0%
5.0%
Jun-09 Sep-09 Dec-09 Mar-10 Jun-10 Sep-10 Dec-10 Mar-11 Jun-11 Sep-11 Dec-11 Mar-12
Pe
rcen
tage
ch
an
ge
fro
m p
revio
us q
ua
rter
QuarterPrepared by PRDnationwide ResearchSource: ABS Cat 1350, last updated July-2012

• The gross spend on housing finance was
$20.2 billion during the month of May
2012. Compared to the previous year,
the total spend has decreased by 1.5 per
cent, equating to $300 million less.
Since the stimulus fuelled market of 2009
and 2010, which saw low interest rates,
the average monthly spend on housing
has been $20.6 billion.
• Investor spend fall slightly to $6.6 billion,
and is just under the average of $6.7
billion for 2012. For the month of May
2012, investor financial commitment
decreased by $300 million.
• During the month of May 2012, owner
occupier spend remained unchanged at
$13.6 billion. Approximately 32.5 per
cent of the property market is now
investor financed and is expected to
increase as rental yields across the
nation continue to become more
attractive.
• Increases in house finance were recorded
in Western Australia, Victoria and
Queensland. New South Wales recorded
the largest decrease, falling by 2.6 per
cent.
• The number of first home buyers as a
percentage of total owner occupied
housing commitments increased 17.8 per
cent in May, compared to 16.8 per cent
in April.
• Although it might be too earlier to see the
results, by observing the recent house
finance data from the ABS, it appears the
cut to interest rates in May has not yet
stimulated the property market.
• Japanese banks are ascertaining whether
to enter into the Australian home lending
market to compete with the big four
banks, which currently account for 90 per
cent of the market. Sony Bank is the
latest to be linked with making a push
into the $1 trillion mortgage market with
Mitsubishi UFJ, Sumitomo Mitsui
Financial Group and Mizuho Group also
considering entering this market.
House Finance Stable owner occupier spending
Housing Finance Commitments Graph (right):
• Housing finance commitments track the volume of finance commitments made by significant lenders to individuals for the purchase of housing.
• This graph tracks the value of loans approved for both owner occupiers and investors.
Housing Finance Commitments
11
0
2
4
6
8
10
12
14
16
18
20
May-0
2
Ma
y-0
3
Ma
y-0
4
Ma
y-0
5
Ma
y-0
6
Ma
y-0
7
Ma
y-0
8
Ma
y-0
9
Ma
y-1
0
Ma
y-1
1
Ma
y-1
2
Va
lue
of C
om
mitm
en
ts (
$ b
illio
n)
Month
Owner Occupied Investment
Prepared by PRDnationwide ResearchSource: ABS Cat. No. 5609, last updated July-2012

• During the month of June 2012
unemployment decreased to 5.0 per cent
and is on par with the longer-term five
year average. Since the turn of the year
unemployment has remained stubbornly
above 5.0 per cent. When looking at the
moving annual average, the rate has
increased to 5.2 per cent, equating to the
first shift in the rate for over a year.
• For the month of June 2012, the
nation’s lowest rate of unemployment
occurred in Western Australia at 3.6 per
cent, a rate that has decreased by 0.3
per cent from the previous month.
Tasmania continues to have the highest
rate of unemployment at 7.0 per cent, up
0.8 per cent over the month.
• Unemployment in New South Wales
increased by 0.1 per cent to 5.1 per cent
during the month of June, while Victorian
unemployment decreased by 0.2 per
cent to 5.3 per cent. Unemployment in
Queensland has decreased over the
month by 0.7 per cent to 5.1 per cent.
• Roy Morgan Research recorded a
large1.5 per cent increase in its
unemployment rate to 9.7 per cent in the
month of June 2012. There is an
increasing level of disparity between the
Ray Morgan rate of unemployment and
the RBA rate, which on average would
only be a 2.2 per cent difference, has
now increased to 4.6 per cent.
• The Dun & Bradstreet sentiment survey
for the June quarter revealed that half of
the surveyed companies are expected to
be damaged by the minimum wage rise
of $17 per week, the high Australian
dollar and the carbon tax. Employment
plans have fallen to a 12 month low, while
long term investment plans also were
subdued for the year ahead.
• DEEWR’s Monthly Leading Indicator of
Employment has fallen for the sixth
consecutive month in June 2012. This
confirms that employment is likely to
continue to grow more slowly than its
long-term trend rate of 1.7 per cent per
annum in coming months. In comparison,
cyclical employment has fallen for sixteen
consecutive months.
• The ANZ Job Advertisement Index
declined again in June by 1.2 per cent,
following a fall of 2.6 per cent in May.
• The gains in the US labour market
appears to have halted, with the number
of Americans making new claims for
weekly unemployment benefit rising to its
highest level since December on a
monthly average basis. The
unemployment rate has now been
unchanged for three months and
employment growth has been weak for
four.
Labour Market Long-term unemployment increases
Unemployment Rate Graph (right):
• Unemployment is calculated as the proportion of people in the labour force that were unemployed and actively seeking work during the survey period.
• The labour force is defined as the number of people aged between 16 and 55 who were either employed or actively looking for work during the survey period.
• This graph tracks the unemployment rate on a monthly and moving annual average basis over the last 30 years.
Unemployment Rate
12
2%
4%
6%
8%
10%
12%
Ju
n-8
2
Ju
n-8
3
Ju
n-8
4
Ju
n-8
5
Ju
n-8
6
Jun-8
7
Ju
n-8
8
Ju
n-8
9
Ju
n-9
0
Ju
n-9
1
Ju
n-9
2
Ju
n-9
3
Ju
n-9
4
Ju
n-9
5
Ju
n-9
6
Ju
n-9
7
Ju
n-9
8
Ju
n-9
9
Ju
n-0
0
Ju
n-0
1
Ju
n-0
2
Ju
n-0
3
Ju
n-0
4
Ju
n-0
5
Jun-0
6
Ju
n-0
7
Ju
n-0
8
Ju
n-0
9
Ju
n-1
0
Ju
n-1
1
Ju
n-1
2
Un
em
plo
ym
en
t R
ate
Month
Unemployment Rate Australia
Moving Annual Average Australia
Prepared by PRDnationwide ResearchSource: ABS Cat 6202, last updated July-12

• On the whole, the Australian Securities
Index has remained stable since the turn
of the year, but is significantly below the
average Index score achieved 12 months
prior with a fall of 9.3 per cent. The Index
decreased its monthly average value
during June 2012 to reach 4,065 points,
down from May’s average of 4,208
points, equating to an decrease of 3.4
per cent over the month.
• The RBA has mentioned in the latest
bulletin that the portion of household
assets held in equities has more than
halved from 18 per cent to 8 per cent.
• Over the past financial year, resource
shares have performed the worst, along
with IT and consumer discretionary
stocks, while defence sectors, utilities
and health shares all performed strongly.
• Similar to 2011, global growth is falling
short of expectations in 2012. A result of
the subdued growth in 2012 was a 15
per cent correction to the All Ordinaries,
while 2011 experienced a 23 per cent
decline. Over May 2012, there has been a
10 per cent decline in the Index and has
since experienced flat growth. Economic
growth had previously reignited through
the assistance of central banks. So far in
2012, assistance has not been as
forward in coming (apart from a limited
extension from the US Federal Bank)
which has accelerated the fall in
commodity prices.
Stock Market Subdued stock market in 2012
S&P / ASX 200 Graph (right):
• The S&P/ASX 200 is recognized as the primary investable benchmark in Australia. The index covers approximately 78% of Australian equity market capitalization. Index constituents are drawn from eligible companies listed on the Australian Stock Exchange. This index is designed to address investment managers' needs to benchmark against a portfolio characterized by sufficient size and liquidity.
• The S&P/ASX Australian Index is a real-time, market capitalisation weighted index that include the largest and most liquid stocks in the Australian equity market listed on the Australian Stock Exchange (ASX).
S&P / ASX 200
13
2,500
3,000
3,500
4,000
4,500
5,000
5,500
6,000
6,500
7,000
7,500
29-Jun-02 29-Jun-03 29-Jun-04 29-Jun-05 29-Jun-06 29-Jun-07 29-Jun-08 29-Jun-09 29-Jun-10 29-Jun-11 29-Jun-12
Ind
ex V
alu
e
DayPrepared by PRDnationwide ResearchSource: Standard & Poors, last updated July-2012
June-11 12 month average 4,665
June-12 12 month average 4,229

• Superannuation contributions over the
March 2012 quarter totalled $20.1 billion,
equating to an decrease of 2.2 per cent.
Employers contributed $16.926 billion
(84 per cent) and members contributed
just over $3 billion (15 per cent). Other
contributions, which include spouse
contributions and government co-
contributions, totalled $137 million.
• Total superannuation assets increased
by 2.2 per cent during the quarter to
$1.38 trillion. During the March 2012
quarter, industry funds' assets increased
by 7.3 per cent, corporate funds' assets
increased by 6.4 per cent, public sector
funds' assets increased by 6.3 per cent,
retail funds' assets increased by 5.2 per
cent and self-managed superannuation
funds' assets increased by 4.9 per cent.
• Australians are missing $17.4 billion in
lost superannuation, equating to more
than the big four banks' six month profits
combined. This is however, a 14 per cent
reduction from $20.2 billion in 2009 to
2010.
• The Productivity Commission has
suggested that Fair Work Australia or
another independent body decide on the
default fund for workers who do not
nominate a superfund. Currently unions
or employers have this choice, with
industry funds often the largest
beneficiary. This could be an important
shift when considering every eight out of
ten Australians do not select their super
fund.
Superannuation Contributions dip over the quarter
Superannuation Contributions Graph (right):
• The APRA Annual Superannuation Bulletin comprises statistics on the superannuation industry which have been prepared from the following sources:
I. superannuation returns submitted to APRA
II. data from quarterly returns submitted to APRA by select exempt public sector superannuation schemes in Australia.
III. data provided by the ATO on self-managed superannuation funds
IV. returns submitted to APRA under the Life Insurance Act 1995 by registered life companies in Australia
V. returns submitted to APRA by retirement savings account (RSA) providers
Superannuation Contributions
$0
$20,000
$40,000
$60,000
$80,000
$100,000
$120,000
$140,000
$160,000
$180,000
1997 1998 1999 2000 2001 2002 2003 2004 2005 2006 2007 2008 2009 2010 2011
To
tal C
on
trib
uti
on
s (
$ m
illi
on
)
Financial Year
Employer Member Total Contributions
Prepared by PRDnationwide ResearchSource: APRA Bulletin, last updated Apr-12
14

• The Home Loan Affordability Index has
continued to increase since mid-2011,
with affordability increasing by a further
0.9 points in the March 2012 quarter to
an Index score of 31.3 points.
• Over the quarter the majority of the
states felt an increase in affordability, with
only Western Australia and the Northern
Territory experiencing a fall in the Index.
Victoria, Queensland, and South
Australia, all recorded an increase of 1.6
points, while Western Australia
decreased the most by 2.3 points. When
compared to the previous year, the state
that experienced the largest growth in
affordability was Victoria, increasing by
14.4 per cent. The ACT experienced the
smallest increase at 1.3 per cent to
register 54.6 points.
• The average Australian household
requires 32 per cent of the family income
to service a home loan. Queensland
families require approximately 29.5 per
cent, while Victoria requires 33.1 per
cent. The ACT requires the least amount,
with 18.3 per cent and New South Wales
requires the most, at 36.5 per cent of the
average family income. According to the
REIA, the proportion of family income
required to meet the average rental
payment has decreased slightly during
the March 2012 quarter to 24.8 per cent.
• The 2011 Census displayed an
interesting insight to housing affordability.
When comparing the national median
dwelling price in August 2011 to the
annual household income, it showed that
the typical Australian home costs 6.3
times the average annual income, up
from 6.1 times in 2006.
Home Affordability Affordability rallies in Q1 2012
Home Loan Affordability Index Graph (right):
• The Home Loan Affordability Index measures average loan repayments against median wages and tracks these values over time.
• Continued price growth in the property market without an accompanying rise in income saw a long period of decline in the home loan affordability index across the nation.
• The Home Loan Affordability index commenced its rapid descent during 2002. After a short leveling between 2004 and 2006, affordability levels have again continued to trend downwards.
Home Loan Affordability Index
15
20.0
30.0
40.0
50.0
60.0
70.0
80.0
Ma
r-82
Ma
r-83
Ma
r-84
Ma
r-85
Ma
r-86
Ma
r-87
Ma
r-88
Ma
r-89
Ma
r-90
Ma
r-91
Ma
r-92
Ma
r-93
Ma
r-94
Ma
r-95
Ma
r-96
Ma
r-97
Ma
r-98
Ma
r-99
Ma
r-00
Ma
r-01
Ma
r-02
Ma
r-03
Ma
r-04
Ma
r-05
Ma
r-06
Ma
r-07
Ma
r-08
Ma
r-09
Ma
r-10
Ma
r-11
Ma
r-12
Ind
ex
va
lue
Quarter
NSW Vic Qld
Prepared by PRDnationwide ResearchSource: REIA / Deposit Power, last updated July- 2012
ImprovingAffordability

• The total number of dwelling
commencements drastically decreased
during the March 2012 quarter by 24.6
per cent, equating to 9,096 less new
homes for the quarter. When compared
to the previous year, commencements
have decreased by 23.5 per cent.
• On a state-by-state basis, Victoria
continued to record the highest number
of dwelling commencements during the
March quarter, representing 37 per cent
of all dwellings commenced nationally.
Queensland followed with 19 per cent
and New South Wales contributed with
17 per cent of commencements.
• The least amount of dwellings
commenced for a state during the first
quarter of 2012 was the Northern
Territory (down 27.8 per cent to 192),
followed by Tasmania (down 24 per cent
to 492).
• As a result of the 2011 Census, the
number of households recorded was
considerably less than previous
estimated, from 8.7 million down to 7.8
million. This overestimation will in large
affect the housing shortage quantity, as
the National Housing Supply Council
(NHSC) predicted there will be shortfall of
369,000 homes by 2016.
• The latest figures to be release by the
ABS have shown that building approvals
has increased by 27.3 per cent over the
month of May 2012. Victoria lead the
way, with an increase of 31.8 per cent.
Dwelling approvals increased in Western
Australia (up 24.8 per cent) South
Australia (up 16.2 per cent), Queensland
(up 10.3 per cent), New South Wales (up
25.1 per cent), ACT (up 27.5 per cent)
and Northern Territory (up 21.5 per cent).
Only in Tasmania did the number of
approvals fall, decreasing by 12.1 per
cent.
Dwelling Market New dwellings plummet
Dwelling Commencements Graph (right):
• Dwelling commencements indicate the number of new dwellings that have commenced their construction phase.
• A moving yearly average is used to filter out seasonal fluctuations in the number of dwellings commenced.
• Nationally, the annual number of dwelling commencements have been on a downward trend since Sep-04 (earlier in NSW and VIC).
Dwelling Commencements
16
25,000
30,000
35,000
40,000
45,000
50,000
55,000
Ma
r-96
Ma
r-97
Ma
r-98
Ma
r-99
Ma
r-0
0
Ma
r-01
Ma
r-02
Ma
r-03
Ma
r-04
Ma
r-05
Ma
r-06
Ma
r-07
Ma
r-08
Ma
r-09
Ma
r-10
Ma
r-11
Ma
r-12
Mo
vin
g A
nn
ua
l A
vg
. o
f C
om
me
nc
em
en
ts .
Quarter
Dwelling Commencements Australia
Annual moving average
Prepared by PRDnationwide ResearchSource: ABS Cat. No. 8750, last updated July-2012

• Over the June 2012 quarter, the Time to
Buy a Dwelling Index significantly
decreased in Queensland (by 14.2 Index
points) and South Australia (by 4.7 Index
points), while increasing in New South
Wales, Western Australia and Victoria.
• For the June 2012 quarter Western
Australia registered the highest Index
value at 144.4 points, an increase of 44.4
per cent from the previous year. The
lowest Index score was registered in
Queensland at 115.3, while the Index
improved in New South Wales (to 126.9
points) and Victoria (to 127.8 points).
• According to the Westpac-Melbourne
Institute Survey of Consumer Sentiment,
family financial conditions improved over
the 12 month period ending June 2012 in
three of the five measured states, with
the largest increase felt in Western
Australia (up 40.2 per cent) followed by
New South Wales (up 8.8 per cent) and
Queensland (up 3.7 per cent). South
Australia experienced a steep decline of
25.3 per cent, while Victoria fell 2.9 per
cent. Indications for the coming 12
months show a strong decrease in South
Australia (forecasted to fall 26.1 per cent)
while Western Australia could rise by 10.4
per cent.
Dwelling Market Cont. Best buying in Western Australia
Time to Buy a Dwelling Index Graph (right):
• The Time to Buy a Dwelling Index indicates short-run changes in consumer sentiment regarding whether it is a good time to buy a dwelling.
• It is a component of the Melbourne Institute’s Consumer Sentiment Index which is undertaken monthly.
Time to Buy a Dwelling Index
17
40
60
80
100
120
140
160
180
Ju
n-0
2
Ju
n-0
3
Ju
n-0
4
Ju
n-0
5
Ju
n-0
6
Ju
n-0
7
Ju
n-0
8
Ju
n-0
9
Ju
n-1
0
Ju
n-1
1
Ju
n-1
2
Mo
vin
g a
nn
ua
l a
ve
rag
e o
f T
ime
to
Bu
y a
Dw
ellin
g In
de
x
Moving Annual Average
Time to Buy a Dwelling IndexNSW VIC QLD WA SA
Prepared by PRDnationwide ResearchSource: Westpac/Melbourne Institute, last updated July-2012

• According to the RP Data-Rismark
Dwelling Price Index, all capital cities,
except for Darwin and Canberra,
experienced a decline in value over the
12 month period ending June 2012. On
average, property values have fallen by
3.8 per cent, with the largest declines felt
in Melbourne (-6.6 per cent) Hobart (-5.2
per cent) and Brisbane (-4.7 per cent).
Perth and Adelaide only experienced a
slight decrease of 1.4 and 2.4 per cent
respectively. Darwin experienced an
increase of 0.2 per cent, while Canberra
increased the most at 1.3 per cent.
• It is surprising to find that when
observing changes in home values over
the month, most capital cities have
experienced positive growth, with only
Adelaide and Darwin experiencing a small
decline at 1.1 and 0.8 per cent
respectively.
• A recent study by Barclays Economic
Research portrays a diverse picture for
house prices around the world. House
prices are rising in Germany and Austria,
but remain stagnant in the US, UK and
Australia and are weakening in China and
the Netherlands. Australian house prices
are likely to remain flat during 2012 to
2013 with a recovery expected as
international economic conditions and
domestic growth prospects improve. A
combination of low unemployment, rising
personal savings and strong domestic
financial institutions continue to underpin
the housing market and imply that a
dramatic decline to values are unlikely.
BIS Shrapnel has confirmed that the
fundamentals throughout Australia are
beginning to favour an improvement in
residential market conditions. Barclays
predicts that in both the US and
Germany, a combination of low price-to-
income ratios and low interest rates are
leading to healthy levels of affordability,
which are expected to translate to
respectable house price gains in coming
years. It is no surprise that the report
predicts prices to continue to decline in
the rest of the Eurozone, with sharp falls
in markets such as Ireland and Spain.
Home Prices Home values advance in June
RP Data-Rismark Dwelling Price Index Graph (right):
• The chart to the above measures an annual period change in house prices of the capital cities.
RP Data-Rismark Dwelling Price Index Change by Capital City
18
-2.0%
-1.4%
-6.6%
-5.2%
0.2%
1.3%
-4.7%
-2.4%
-3.8%
1.0%
2.0%
1.0%
2.7%
-0.8%
2.0%
1.0%
-1.1%
1.0%
-8.0% -6.0% -4.0% -2.0% 0.0% 2.0% 4.0%
Sydney
Perth
Melbourne
Hobart
Darwin
Canberra
Brisbane
Adelaide
5 Capital city aggregate
Change in house price index (%)
Cap
ita
l C
ity
June 2012 Monthly Change
June 2012 Annual Change
Prepared by PRDnationwide ResearchSource: RP Data-Rismark, last updated July 2012

• The Australian average vacancy rate
contracted to 2.4 per cent over the most
recent March 2012 quarter. Sydney
remains the tightest rental market with a
1.6 per cent vacancy rate, followed by
Perth and Darwin at 1.9 per cent.
• Three capital cities experienced a
marginal decrease in vacancy rates over
the quarter, with Darwin leading the way
through a decline of 1.4 per cent,
followed by Brisbane (-0.6 per cent) and
Perth (-0.4 per cent). Vacancies
expanded the most in Hobart, by 0.8 per
cent and now has the highest vacant rate
at 3.9 per cent.
• Darwin maintains the highest median
rental price for a standard three bedroom
house at $559 per week, through a
substantial increase of 6.9 per cent over
the quarter. Adelaide remains the most
affordable city to rent in, with a median
rental price of $325 per week.
• Rental prices for a standard three
bedroom house in Melbourne, Sydney
and Hobart have remained steady over
the March 2012 quarter. The Australian
capital city average increased to $405 per
week, equating to a 2.2 per cent shift
over the quarter.
• According to the Australian Property
Monitors Rental Price Series, the national
median weekly asking rent for houses
remained steady over the March 2012
quarter, with units decreasing by 1.1 per
cent.
Rental Market Capital city vacancy rate stabilises
Quarterly Vacancy Rates Graph (right):
• An industry benchmark for vacancy rates is considered to be 3%. Vacancy rates lower than 3% indicate strong demand for rental accommodation, whilst rates higher than 3% reflect an oversupply of rental accommodation.
Quarterly Vacancy Rates
19
0.0%
0.5%
1.0%
1.5%
2.0%
2.5%
3.0%
3.5%
4.0%
4.5%
5.0%
SydneyMelbourneBrisbaneAdelaidePerthHobartDarwinCanberraAus Average
Qu
art
erly V
aca
ncy R
ate
Capital City
Mar-11 Mar-12
Mar-2012 Average 2.4%
Prepared by PRDnationwide. Source: REIALast Updated July- 2012

• After a weak finish to the year in 2011,
retail expenditure has increased on a
monthly basis. The most recent month
of May 2012 recorded an improved 0.5
per cent increase to the total retail
turnover.
• Over the 12 month period ending May
2012, Australia’s annual change in retail
expenditure increased 3.6 per cent from
the previous year, aided in large by the
increase in spending through the month
of May.
• Resource rich Western Australia
continued to spend well above the
national average to incur the greatest
increase in retail spending over the 12
month period ending May 2012, with a
9.9 per cent surge, followed by Northern
Territory at 5.1 per cent. All states
recorded an increase in spending, with
Tasmania registering the smallest growth
at 0.3 per cent.
• It appears consumers were wiling to
spend more in cafes, restaurants and
takeaway food services, as the industry
received an increased 8.5 per cent in
expenditure throughout a 12 month
period ending May 2012. This was
followed by other retailing, registering an
annual growth of 6.0 per cent.
• Department stores was the only industry
to experienced a softening over 12
months, by declining 0.3 per cent from
the previous year. Clothing and soft good
retailing, as well as household good
retailing only managed slight increases to
expenditure, increasing by 0.9 per cent
and 0.7 per cent respectively.
• The recent Budget appears to have
already impacted low to medium income
earning households, with boosted
demand for retail and service providers
across the country, helping to shift (albeit
momentarily) consumer behaviour.
Retail Trade Modest consumer spending set for 2012
Annual Change in Retail Expenditure Graph (right):
• Retail spending figures are estimated by the ABS based on the Retail Business Survey conducted monthly amongst 4,350 retail and selected service businesses.
• The annual change in retail spending indicates how active consumers are in the marketplace and the degree to which consumers are willing to spend.
• The seasonally adjusted figures are used to smooth out seasonal factors associated with this data.
Annual Change in Retail Expenditure
20
0.0%
2.0%
4.0%
6.0%
8.0%
10.0%
12.0%
Ma
y-0
2
Aug-0
2
Nov-0
2
Feb-0
3
Ma
y-0
3
Aug
-03
Nov-0
3
Feb-0
4
Ma
y-0
4
Aug
-04
Nov-0
4
Feb-0
5
Ma
y-0
5
Aug
-05
Nov-0
5
Feb-0
6
Ma
y-0
6
Aug-0
6
Nov-0
6
Feb-0
7
Ma
y-0
7
Aug
-07
Nov-0
7
Feb-0
8
Ma
y-0
8
Aug
-08
Nov-0
8
Feb-0
9
Ma
y-0
9
Aug
-09
Nov-0
9
Feb-1
0
Ma
y-1
0
Aug-1
0
Nov-1
0
Feb-1
1
Ma
y-1
1
Aug
-11
Nov-1
1
Feb-1
2
Ma
y-1
2
An
nu
al
pe
rce
nta
ge
ch
an
ge
MonthPrepared by PRDnationwide ResearchSource: ABS Cat No: 8501.0 Seasonally adjusted figures last updated July-2012

• The number of net migrants entering
Western Australia continued to increase
at an exponential rate of 113.8 per cent
over the 12 month period ending
December 2011. The state recorded a
net 2,812 new residents, which equates
to the second largest number of net
residents entering a state (behind
Queensland).
• Queensland net migration has increased
once again, with 3,289 new interstate
migrants during the December 2011
quarter. This high level of growth has not
been experienced since mid-2009.
• The rate of interstate migrant growth has
slowed in Victoria since mid-2011.
Approximately 559 net migrants decided
to call Victoria home during the
December 2011 quarter, equating to a
decrease of 35.3 per cent from the
previous year.
• New South Wales still records the highest
outward migration of residents
nationwide. During the December 2011
quarter a net outward migration of 5,084
residents shifted to other states, equating
to a decline of 35.5 per cent from the
previous year.
• South Australia continued to lose
residents, with 572 net residents
departing during the quarter, while the
ACT increased a net 416 interstate
migrants.
Demographics Cont. Western Australia on track to become the destination of choice
Net Interstate Migration Graph (right):
• Net interstate migration tracks the net population change in each state attributable to interstate migration.
• Net interstate migration figures fluctuate with the seasons, so a moving yearly average is shown to filter out these changes.
Net Interstate Migration
21
-15,000
-10,000
-5,000
0
5,000
10,000
15,000
Dec-8
5
Dec-8
6
Dec-8
7
Dec-8
8
Dec-8
9
Dec-9
0
Dec-9
1
Dec-9
2
Dec-9
3
Dec-9
4
Dec-9
5
Dec-9
6
Dec-9
7
Dec-9
8
Dec-9
9
Dec-0
0
Dec-0
1
Dec-0
2
Dec-0
3
Dec-0
4
De
c-0
5
Dec-0
6
Dec-0
7
Dec-0
8
Dec-0
9
Dec-1
0
Dec-1
1
An
nu
al A
vg.
of N
um
be
r o
f P
ers
on
s .
Quarter
NSW
VIC
QLD
WA
Prepared by Colliers International and PRDnationwide ResearchSource: ABS Cat 3401, last updated July- 2012

• The number of births in 2011 has
decreased from the previous year, with
4,696 less newborns equating to fall of
3.0 per cent. The sharp rate of decline in
the number of immigrants entering
Australia over the past year has stopped,
with Australia realising three consecutive
quarters of increases in the rate of net
international migrant growth. The most
recent quarter experienced a 33.3 per
cent increase from the previous year.
Overall, Australia increased its population
by 12,882 net migrants in 2011 from the
previous year. Over the December 2011
quarter, the majority of the overseas
migrants tended to take up residence in
New South Wales (30 per cent), followed
by Victoria (24 per cent) and Western
Australia (22 per cent).
Demographics Net international migrant numbers increased
Population Growth Graph (right):
• Population change tracks the change in population across the states and territories of Australia. Population growth is seen as the key driver of demand for housing.
Population Growth
22
0
10,000
20,000
30,000
40,000
50,000
60,000
70,000
80,000
De
c-1
99
1
De
c-1
99
2
De
c-1
99
3
De
c-1
99
4
De
c-1
99
5
De
c-1
99
6
De
c-1
99
7
De
c-1
99
8
De
c-1
99
9
De
c-2
00
0
De
c-2
00
1
De
c-2
00
2
De
c-2
00
3
De
c-2
00
4
De
c-2
00
5
De
c-2
00
6
De
c-2
00
7
De
c-2
00
8
De
c-2
00
9
De
c-2
01
0
De
c-2
01
1
Nu
mb
er
of
Pe
rso
n(s
)
Period
4 per. Mov. Avg. (Natural Increase - Australia)
4 per. Mov. Avg. (Net Overseas Migration - Australia)
Prepared by PRDnationwide ResearchSource: ABS Cat 3101, last updated July-2012

• According to the Census 2011, the
Australian population was just over 21.5
million (last estimations are just over 22.5
million) with 50.6 per cent women and
49.4 per cent men. The median age has
risen to 37 with 13.8 per cent of the
Australian population now aged over 65,
equating to an increase of 11.3 per cent
from 1991.
• Population growth is at 1.4 per cent, one
of the highest for a developed nation.
Migration is crucial to this growth,
typically adding an intake of nearly
200,000 migrants a year. This equates
to a contribution of 61 per cent of
population growth since the 2006
Census, or about 1.2 million people. The
natural increase contributed just under of
750,000 persons.
• The focus on skilled migration over the
past five years has resulted in a much
younger profile of arrivals, compared with
the Australian born population.
• There is a large divergence of Australia’s
growth and prosperity that is seen
throughout the new Census numbers.
For example, population growth is fastest
in the likes of Western Australia and
Queensland, with Western Australia
accounting for all but one of the top ten
fastest growing towns in Australia over
the past five years.
• Although Australia’s population growth
has been good, averaging 1.4 per cent
per annum over five years, (up from 1.3
per cent over the preceding five years)
the Australian Bureau of Statistics has
been overestimating the size of the
nation. The new estimate residential
population of 22.3 million people in the
June quarter of 2011 reflects a
downward revision of almost 300,000
people, or seven per cent.
• The number of people who own their
home outright has declined from 34 per
cent to 32 per cent, while the number of
renters has increased by two per cent to
30 per cent.
• Throughout Australia, only 14.6 per cent
of all dwellings are apartments, equating
to a decline from the previous Census of
0.1 per cent. Sydney has the largest
concentration of unit stock, at 27.6 per
cent of total dwellings, compared to 16.6
per cent in Melbourne and 12.8 per cent
in Brisbane.
• The median weekly household income
increased by 20 per cent to $1,234, but
is still less than the 31 per cent increase
experienced in the previous census.
• Typical household rent has increased 49
per cent, while the average household
mortgage payment has increased by 38
per cent. In this time, family income has
grown by just 20 per cent.
• Astute investors will be aware the
attraction of the big cities was confirmed
with the latest Census. The combined
population of Sydney, Melbourne,
Brisbane and Perth grew by 9.9 per cent
between 2006 to 2011, to reach 12.2
million, while the rest of Australia grew by
only 6.3 per cent.
• The Census also confirms that investing
in mining towns can be volatile, with a
highly transient population. A typical
Australian suburb would register less than
five per cent of people on Census night a
‘visitor’, while mining towns registered
over 30 per cent.
Census 2011 Key insights
23
“We set industry benchmarks when partnering with our clients to answer key questions and solve complex issues in the residential development arena.”
PRDnationwide’s research division provides
reliable, unbiased, and authoritative property
research and consultancy to clients in metro and
regional locations across Australia. Our extensive
research capability and specialised approach
ensures our clients can make the most informed
and financially sound decisions about residential
and commercial properties.
Our Knowledge
Access to accurate and objective research is
the foundation of all good property decisions.
As the first and only truly knowledge based
property services company, PRDnationwide
shares experience and knowledge to deliver
innovative and effective solutions to our clients.
We have a unique approach that integrates
people, experience, systems and technology
to create meaningful business connections We
focus on understanding new issues impacting the
property industry; such as the environment and
sustainability, the economy, demographic and
psychographic shifts, commercial and residential
design; and forecast future implications around
such issues based on historical data and fact.
Our People
Our research team is made up of highly qualified
researchers who focus solely on property analysis.
Skilled in deriving macro and micro quantitative
information from multiple credible sources, we
partner with clients to provide strategic advice
and direction regarding property and market
performance. We have the added advantage of
sourcing valuable and factual qualitative market
research in order to ensure our solutions are the
most well considered and financially viable.
Our experts are highly sought after consultants for
both corporate and government bodies and their
advice has helped steer the direction of a number
of property developments and secured successful
outcomes for our clients.
About PRDnationwide Research
Our Services
PRDnationwide provides a full range of property
research services across all sectors and markets
within Australia. We have the ability and systems to
monitor market movements, demographic changes
and property trends. We use our knowledge of
market sizes, price structure and buyer profiles to
identify opportunities for clients and provide market
knowledge that is unbiased, thorough and reliable.
Our services include:
• Advisory and consultancy
• Market Analysis including profiling and trends
• Primary qualitative and quantitative research
• Demographic and target market analysis
• Geographic information mapping
• Project Analysis including product and pricing
recommendations
• Rental and investment return analysis
• Competitive project activity analysis
• Economic indicators
• Social research, including focus groups

Join PRDnationwide
PRDnationwide welcomes passionate individuals who are interested in business ownership.
When you join our family of more than 110 offices you profit from proven marketing tools, leading-edge technology, specialised training and powerful brand recognition. If you are interested in knowing more about owning and operating a PRDnationwide business either now or in the future, please contact:
Elias Sleiman 0438 184 127 [email protected]
PRDnationwide
32-36 Doggett Street Newstead QLD 4006 GPO Box 2750 Brisbane QLD 4001
P 07 3229 3344 F 07 3221 7744 E [email protected]
www.prdnationwide.com.au
Researcher
Aaron Maskrey Director | Research 07 3370 1702 [email protected]
Prepared by PRDnationwide Research. For further details, contact Aaron Maskrey on 07 3370 1702 www.prdnationwide.com.au
PRDnationwide is a Colliers
International company.
Property Watch® Reports
Over 130 snapshots of various areas around
Australia, as well as specific reports on property
topics of interest such as resale growth, infra-
structure planning, luxury properties, and supply
and demand.
Highlight Reports
Major annual reports examining the macro and
micro economic information of larger catchment
areas within select city, rural, and coastal regions.
Quarterly Economic and Property Report
Produced quarterly to examine economic and
property trends nationally.
Niche Reports
Covering topical subjects such as mixed use and
transit oriented developments, marina berths,
waterfront property and luxury property markets.
Our Research Reports
Suburb Reports
Detailed demographic and sales information for
statistical local areas (suburbs) in Queensland,
New South Wales, Victoria, and Australian
Capital Territory.
Residential Unit Reports
Quarterly reports based on primary research into
the sale of new units within major metro and coastal
cities identifying trends and opportunities.
Research Consultancy Service
We set industry benchmarks when partnering with
our clients to answer key questions and solve com-
plex issues in the residential development arena.
Our specialised consultancy service adds value to
our clients’ business by identifying the best means
for gaining a competitive advantage. We have
extensive experience in providing advice on virtually
every type of residential property and the issues
and considerations that surround them.
We simplify your decision-making process
by providing comprehensive information and
recommendations including (but not limited to):
PRDnationwide does not give any warranty in relation to the accuracy of the information contained in this report. If you intend to rely upon the information contained herein, you must take note that the information, figures and projections have been provided by various sources and have not been varified by us. We have no belief one way or the other in relation to the accuracy of such information, and projections.
PRDnationwide will not be liable for any loss or damage resulting from any statement, figure calculation or any other information that you rely upon that is contained in the material. COPYRIGHT - PRDnationwide 2012.


RESEARCH
PROPERTY KNOWLEDGE YOUR HOME OF