quarterly climate impacts southern region and outlook · few areas in southwestern texas and...
TRANSCRIPT

Contact: Rudy Bartels ([email protected])Southern Regional Climate Center
Quarterly Climate Impacts and Outlook
Southern RegionQuarterly Climate Impacts and Outlook | June 2017
Southern RegionJune 2017
Highlights for the Region• It was a warmer than normal spring
(March-May) for the southern region, with all six states reporting warmer than normal temperatures for March, April, and May collectively. The year 2017, at this point (Jan–May), is the second warmest year on record for the southern region.
• Precipitation was abundant in southern Louisiana, eastern Tennessee, and northern Arkansas. Whereas most of Texas had below normal precipitation.
• March 2017 brought wildfires to the western part of the southern region, Texas and Oklahoma. The wildfires killed 7 people and thousands of cattle. The wildfires also destroyed over 2 million acres of land. April and May brought rain to put out many of the remaining wildfires.
National – Significant Events for May and Spring 2017
Regional – Climate Overview for March to May 2017
Percent of Normal Precipitation (%)March 1, 2016–May 31, 2017
May average streamflow compared to historical streamflow.
Departure from Normal Temperature (°F) March 1, 2016–May 31, 2017
StreamflowsTemperature and Precipitation Anomalies
The above figure illustrates May average streamflow in the Texas Gulf and Lower Mississippi Basins as compared to historical streamflow. Streamflows in Texas are exhibiting near normal flow, except for in the eastern counties where a cluster of stations are above normal, and in the southern counties a cluster of stations are below normal. There are areas in central Louisiana, Mississippi, and southern Arkansas that are reporting well above normal streamflow.
Spring precipitation was variable throughout the southern region. Eastern Texas, southern Texas, northern Arkansas, southern Louisiana, and northeastern Oklahoma reported 150–300% above normal precipitation. In contrast, parts of western and central Texas were 5–50 % below normal precipitation. Northern and central Texas, northern Louisiana, northern Mississippi, and southern Oklahoma reported slightly below normal precipitation.
Overall, temperatures averaged between 1° to 5°F above normal for the period spanning from March to May, 2017. There were clusters of 3°F–5°F above normal temperatures in all of the southern region states. There were a few areas in southwestern Texas and southern Mississippi that reported 1°F below normal temperatures. The 2017 year still ranks second warmest for the southern region as a whole going into the summer months with an overall temperature of 60.43°F.
The average U.S. temperature during May was 60.6°F, 0.4°F above average. The spring U.S. temperature was 53.5°F, 2.6°F above average, and the eighth highest on record. May U.S. precipitation was 3.31 inches, 0.40 inch above average. The spring precipitation total was 9.39 inches, 1.45 inches above average, and the 11th wettest on record.
Material provided in this map was compiled from NOAA’s State of the Climate Reports. For more information please visit: www.ncdc.noaa.gov/sotc
#regionalclimateoutlooks
Contact: Rudy Bartels ([email protected])Southern Regional Climate Center
Southern RegionQuarterly Climate Impacts and Outlook | June 2017
Regional – Impacts for March–May 2017
Earth Scan Lab at Louisiana State University www.esl.lsu.edu
NOAA/NWS Climate Prediction Center www.cpc.noaa.gov
NOAA/NOS Gulf of Mexico Coastal Services Center www.csc.noaa.gov
NOAA Gulf of Mexico Collaboration Team www.regions.noaa.gov
NOAA/NESDIS National Centers for Environmental Information www.ncei.noaa.gov
NOAA/NWS Southern Region www.srh.noaa.gov
Southern Climate Impacts Planning Program www.southernclimate.org
Southern Regional Climate Center www.srcc.lsu.edu
Gulf Region Partners
According to the Climate Prediction Center, summer (June to August) temperatures for the southern region are expected to be above normal in all six states, with the greatest chance for warmer temperatures being in southern Louisiana, Mississippi, and Texas.
For most of the region, there is an equal chance of above or below normal precipitation in summer (June to August), except for Oklahoma and most of Texas where there is a slight chance of above normal summer precipitation.
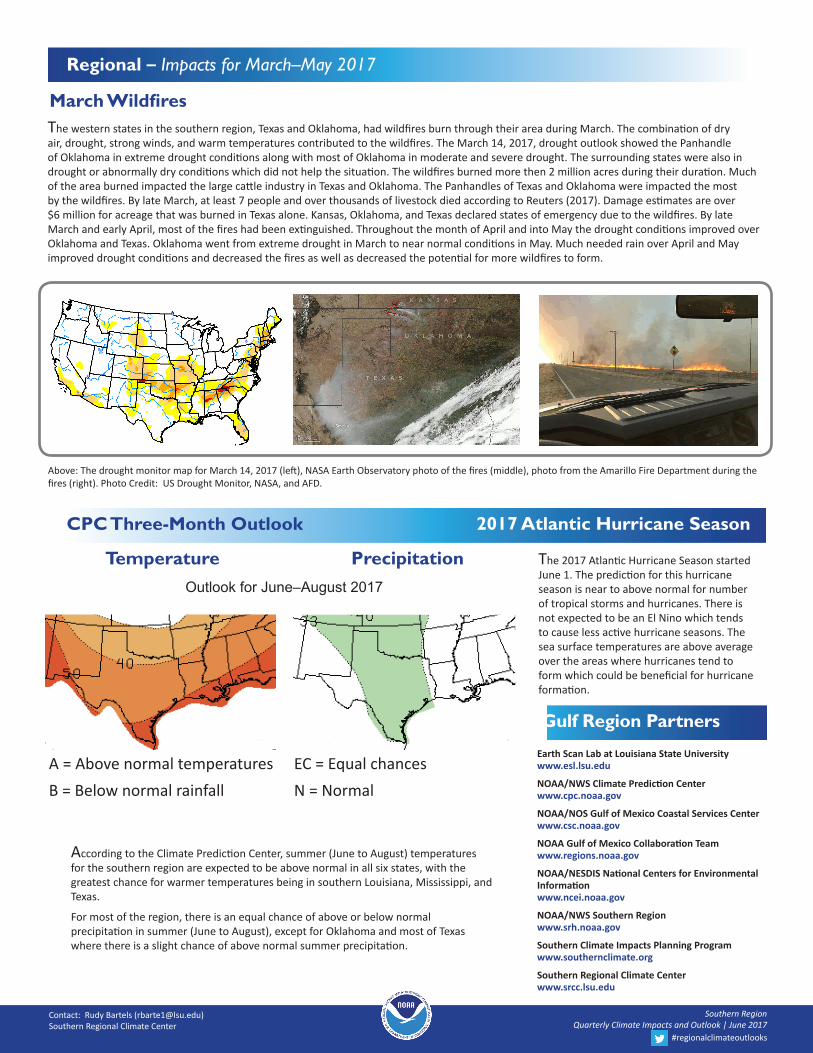
The western states in the southern region, Texas and Oklahoma, had wildfires burn through their area during March. The combination of dry air, drought, strong winds, and warm temperatures contributed to the wildfires. The March 14, 2017, drought outlook showed the Panhandle of Oklahoma in extreme drought conditions along with most of Oklahoma in moderate and severe drought. The surrounding states were also in drought or abnormally dry conditions which did not help the situation. The wildfires burned more then 2 million acres during their duration. Much of the area burned impacted the large cattle industry in Texas and Oklahoma. The Panhandles of Texas and Oklahoma were impacted the most by the wildfires. By late March, at least 7 people and over thousands of livestock died according to Reuters (2017). Damage estimates are over $6 million for acreage that was burned in Texas alone. Kansas, Oklahoma, and Texas declared states of emergency due to the wildfires. By late March and early April, most of the fires had been extinguished. Throughout the month of April and into May the drought conditions improved over Oklahoma and Texas. Oklahoma went from extreme drought in March to near normal conditions in May. Much needed rain over April and May improved drought conditions and decreased the fires as well as decreased the potential for more wildfires to form.
The 2017 Atlantic Hurricane Season started June 1. The prediction for this hurricane season is near to above normal for number of tropical storms and hurricanes. There is not expected to be an El Nino which tends to cause less active hurricane seasons. The sea surface temperatures are above average over the areas where hurricanes tend to form which could be beneficial for hurricane formation.
CPC Three-Month Outlook 2017 Atlantic Hurricane Season
Temperature Precipitation
A = Above normal temperatures B = Below normal rainfall
EC = Equal chancesN = Normal
Outlook for June–August 2017
Above: The drought monitor map for March 14, 2017 (left), NASA Earth Observatory photo of the fires (middle), photo from the Amarillo Fire Department during the fires (right). Photo Credit: US Drought Monitor, NASA, and AFD.
March Wildfires