quantitative trait loci (qtl) analysis for rice grain ... · qtl. the relative contribution was...
TRANSCRIPT

Copyright � 2008 by the Genetics Society of AmericaDOI: 10.1534/genetics.108.089862
Quantitative Trait Loci (QTL) Analysis For Rice Grain Widthand Fine Mapping of an Identified QTL Allele gw-5 in a
Recombination Hotspot Region on Chromosome 5
Xiangyuan Wan,*,†,1 Jianfeng Weng,* Huqu Zhai,† Jiankang Wang,† Cailin Lei,†
Xiaolu Liu,† Tao Guo,* Ling Jiang,* Ning Su† and Jianmin Wan*,†,2
*National Key Laboratory for Crop Genetics and Germplasm Enhancement, Nanjing Agricultural University,Nanjing 210095, China and †Institute of Crop Science and the National Key Facility for Crop Gene Resources
and Genetic Improvement, Chinese Academy of Agricultural Sciences, Beijing 100081, China
Manuscript received April 2, 2008Accepted for publication May 20, 2008
ABSTRACT
Rice grain width and shape play a crucial role in determining grain quality and yield. The genetic basisof rice grain width was dissected into six additive quantitative trait loci (QTL) and 11 pairs of epistaticQTL using an F7 recombinant inbred line (RIL) population derived from a single cross betweenAsominori ( japonica) and IR24 (indica). QTL by environment interactions were evaluated in fourenvironments. Chromosome segment substitution lines (CSSLs) harboring the six additive effect QTLwere used to evaluate gene action across eight environments. A major, stable QTL, qGW-5, consistentlydecreased rice grain width in both the Asominori/IR24 RIL and CSSL populations with the geneticbackground Asominori. By investigating the distorted segregation of phenotypic values of rice grain widthand genotypes of molecular markers in BC4F2 and BC4F3 populations, qGW-5 was dissected into a singlerecessive gene, gw-5, which controlled both grain width and length–width ratio. gw-5 was narrowed downto a 49.7-kb genomic region with high recombination frequencies on chromosome 5 using 6781 BC4F2
individuals and 10 newly developed simple sequence repeat markers. Our results provide a basis for map-based cloning of the gw-5 gene and for marker-aided gene/QTL pyramiding in rice quality breeding.
RICE (Oryza sativa L.) is the world’s most importantcereal crop and is considered a model cereal crop
due to its relatively small genome size, vast germplasmcollection, enormous repertoire of molecular geneticresources, and efficient transformation system (Paterson
et al. 2005). Rice grain quality consists of several com-ponents: cooking texture, palatability, flavor, grain ap-pearance, milling efficiency, and nutritional quality.Among these, the cooking, eating, and appearancequalities constitute important economic concerns thatinfluence rice production in many rice-producing areasof the world. Rice grain appearance is mainly specifiedby grain shape as defined by grain length, width andthe length–width ratio (LWR), and chalkiness of theendosperm (Zhang 2007). Preference for rice grainshape, however, varies among consumer groups. Forinstance, long and slender grain varieties are preferredby consumers in the United States and Western Europeand in most Asian countries or areas, including China,India, Pakistan, and Thailand; in contrast, consumers
in Japan, South Korea, and Sri Lanka prefer short andbold grain cultivars (Unnevehr et al. 1992; Juliano andVillareal 1993). Therefore, breeding for the appro-priate grain shape needs to be considered in the con-text of market preference. Additionally, rice grainwidth and shape can greatly affect other important ricequality traits, such as endosperm chalkiness, millingefficiency, eating, and cooking properties (McKenzie
and Rutger 1983; Takita 1989; Chauhan et al. 1995;Tan et al. 2000; Xu et al. 2004). Similarly, rice grainwidth and shape also play important roles in deter-mining grain yield (Lin and Wu 2003; Yoon et al. 2006).Notably, grain shape is also an important indicator ofthe evolution of crops due to the continuous selectionfor large seeds during early domestication. However,small seeds are usually favored by natural selection, assmall seed size is frequently associated with more seedsper plant, early maturity, and wider geographic dis-tribution (Harlan 1992). Therefore, the great eco-nomic importance associated with grain width andshape necessitates in-depth study of their genetic basisand development mechanism(s) to better understandbiological development processes and to facilitatebreeding in rice.
Several independent studies have identified a num-ber of QTL for rice grain width in primary mapping
1Present address: Boyce Thompson Institute for Plant Research, CornellUniversity, Ithaca, NY 14853.
2Corresponding author: Institute of Crop Science, Chinese Academy ofAgricultural Sciences, 12 Zhongguancun South St., Beijing 100081,China. E-mail: [email protected]
Genetics 179: 2239–2252 (August 2008)

populations (Lin et al. 1995; Huang et al. 1997; Redona
and Mackill 1998; Tanet al. 2000; Xu et al. 2002; Aluko
et al. 2004; Li et al. 2004b). In these studies, grain widthwas evaluated in a single environment, so the stability ofthe resultant QTL remained unknown. However, thisstability information is critical in determining the use-fulness of the QTL in marker-aided selection (MAS)breeding. Additionally, among the 31 grain-width QTLdetected in these studies, one was consistently identifiedin the same genomic region of rice chromosome 5,with an average percentage of phenotypic variationexplained (PVE) of 35.9%. Whether this QTL corre-sponds to only one gene or to a cluster of genes, eachwith relatively small contribution to the total geneticeffects, remains unknown. Thus, it is necessary toestablish whether this QTL is a single Mendelian factorand to further narrow down its location on genetic andphysical maps.
Primary mapping populations such as F2:3, backcross(BC), doubled haploids (DH), and recombinant inbredlines (RILs) are not appropriate for fine mapping of anidentified QTL, as they simultaneously segregate at thewhole parental chromosome segments (Yamamotoet al.2000). On the other hand, chromosome segment sub-stitution lines (CSSLs) or near-isogenic lines can sim-plify or eliminate the effect of genetic background onthe expression of QTL and therefore facilitate fine map-ping and isolation of the alleles of target QTL (Frary
et al. 2000; Fridman et al. 2004; He et al. 2006; Konishi
et al. 2006; Wan et al. 2006). A recent study reported thatQTL GW2 for rice grain width and weight on chromo-some 2 encodes a RING-type E3 ubiquitin ligase thatnegatively regulates cell division by targeting its sub-strate(s) to proteasomes for proteolysis. Loss of GW2results in increasing cell numbers and wider spikelethull, thus enhancing rice grain width, weight, and yield(Song et al. 2007). Furthermore, a major grain-widthQTL qGW-5 on chromosome 5 was consistently detectedin all eight environments including two cropping sea-sons (2001 and 2002) and four locations (Nanjing,Jinhu, Donghai, and Hainan in China), and the donorIR24 allele of qGW-5 had a significant and stable effecton decreasing rice grain width in the isogenic back-ground of Asominori (Wan et al. 2005).
The objectives of this study were the following: (1) toobtain information on rice grain-width QTL includingadditive QTL, epistatic QTL, QTL by environment inter-actions, and gene action of identified additive QTL; (2)to dissect the major QTL qGW-5 into a single gene;and (3) to localize the gw-5 gene to a narrow genomicregion.
MATERIALS AND METHODS
Plant materials: Four different populations (RILs, CSSLs,BC4F2, and BC4F3) were used to conduct QTL analysis and finemapping in this study. Seventy-one RILs were derived from the
single cross between Asominori and IR24 by single-seeddescent (Tsunematsu et al. 1996). A total of 66 CSSLs with agenetic background of mostly Asominori, denoted as CSSL1-66, were produced by crossing and backcrossing 19 selectedRILs with Asominori (without selection) until the BC3F1 gen-eration, as described in supplemental Figure S1 (Kubo et al.1999; Wan et al. 2004a). Of two narrow-grain lines (CSSL28and 29) harboring the gw-5 gene, CSSL28 was used to developBC4F2 and BC4F3 populations by backcrossing to Asominoriwith subsequent self-pollination.
Field experiment design and phenotypic evaluation: Thisstudy was carried out in 12 environments, E1–E12, includingfive locations and eight cropping seasons (supplemental Table1S). Asominori, IR24, and their 71 RILs were grown in 4environments (E1–E4), and the parental varieties and their 66CSSLs were planted in 8 environments (E1–E8). Each exper-imental plot consisted of two replicates, with the design of 10rows 3 10 plants for each line. At maturity, each plot washarvested in bulk. After drying, grains were milled using themethod of Wan et al. (2004a), and grain width was determinedon the basis of the method of Wan et al. (2005).
Two thousand one hundred seventy-one, 1248, 2465, and897 CSSL28/Asominori F2 (BC4F2) plants were grown in E9,E10, E11, and E12, respectively. One hundred BC4F3 families(16 plants per family) were planted in E11. At maturity, seedswere collected from primary panicles. Paddy and brown ricewere used to evaluate grain length and grain width using themethods of Wan et al. (2005, 2006), and the LWR, whichrepresents the grain shape, was calculated as the ratio of grainlength/width. Of the 6781 BC4F2 plants, 805 homozygousindividuals with wide grain were used to precisely map the gw-5gene.
DNA preparation, PCR protocol, and DNA markeranalysis: DNA was extracted from fresh rice leaves of BC4F2
plants as described by Dellaporta et al. (1983). PCR wasperformed using the procedure of Chen et al. (1997). PCRproducts were separated on an 8% nondenaturing poly-acrylamide gel and detected using the silver staining methodof Sanguinetti et al. (1994). The required density ofmarkers in the genomic region harboring the gw-5 genewas achieved using previously published simple sequencerepeat (SSR) and expressed sequence tag (EST) markers onrice chromosome 5 (McCouch et al. 2002; Wu et al. 2002) aswell as the SSR markers newly developed in this study. NewSSR markers were designed using the method of Wan et al.(2006). Primer sequences, map positions, and amplifiedlengths of 10 new SSR markers are listed in supplementalTable 2S.
QTL analysis and gene action of identified additive QTL:The linkage map of the Asominori/IR24 RIL populationincluding 375 markers (Tsunematsu et al. 1996) was usedfor QTL analysis. Tests of QTL additive effects, epistatic inter-actions and QTL 3 environment interactions (QEI) wereperformed using the QTL Mapper 1.0 program (Wang et al.1999). The LOD ¼ 4.03 (up to P ¼ 0.005) was used as thethreshold for determining the presence of additive or epistaticQTL. The relative contribution was calculated as the PVE bythe QTL. Additionally, gene action of identified additive QTLwas evaluated by a t-test to show the presence of significantdifferences between the phenotypic values of the recurrentparent Asominori and those of CSSLs harboring the targetQTL alleles derived from the donor parent IR24.
Fine mapping of the gw-5 gene: For fine mapping of thegw-5 gene, the bulked-extreme and recessive-class approachas described in Zhang et al. (1994) was used to calculaterecombination frequencies between the gw-5 gene and mo-lecular markers in the 805 homozygous BC4F2 plants with widegrain. Thus, the recombination frequency ¼ (N1 1 N2/2)/N,
2240 X. Wan et al.

where N is the total number of wide-grain plants surveyed, N1 isthe number of wide-grain plants with the band pattern of thenarrow-grain parent, and N2 is the number of wide-grain plantswith heterozygous band patterns.
RESULTS
Stability of QTL for rice grain width and gene actionof identified QTL: The phenotypic distributions of ricegrain width in the RIL populations grown in the E1–E4environments (supplemental Table 1S) are shown inFigure 1. Variance among genotypes (G) was highly sig-nificant for grain width, but was not significant among
environments (E). The significant G 3 E interactionexplained 3.5% of the total phenotypic variation. Sixadditive effect QTL for rice grain width were identifiedand mapped to six chromosomes, with LOD valuesranging from 7.68 to 23.77 (Table 1). Among the QTL,qGW-5 was consistently located in the Y1060L–R569interval on chromosome 5 in populations grown acrossall four environments, and the average PVE by qGW-5was 24.3%. The IR24 allele at the qGW-5 locus was foundto reduce grain width by an average of 0.115 mm.Moreover, stability of qGW-5 was relatively high, as itsQEI was not significant. Additionally, 11 pairs ofepistatic QTL for rice grain width were detected and
Figure 1.—Phenotypic distri-butions of rice grain width inthe Asominori/IR24 recombi-nant inbred lines in four environ-ments (E1–E4).
TABLE 1
The putative additive QTLs and their environmental interactions for grain width of milled rice
Loci ChromosomeMarkerinterval Environment LOD score PVEa (%)
Additiveeffect (mm)
Positiveallele
QEIeffect
qGW-5 5 Y1060L–R569 E1 21.66 24.4 0.11 Ab NSc
E2 23.77 22.2 0.11 A NSE3 17.50 25.9 0.12 A NSE4 16.45 24.7 0.12 A NS
qGW-9 9 G1445–XNpb293 E1 10.06 12.9 �0.08 Ib NSE2 10.20 11.7 �0.08 I NSE3 9.08 11.5 �0.08 I NSE4 7.68 11.0 �0.08 I NS
qGW-10 10 C16–XNpb127 E1 10.09 12.9 0.08 A NSE2 10.03 9.0 0.07 A 0.02*
qGW-12 12 R1869–R367 E3 10.45 14.6 �0.09 I �0.02*E4 8.88 11.0 �0.08 I �0.03**
qGW-1 1 R1613–XNpb216 E2 11.37 14.8 �0.09 I �0.04**qGW-4 4 C335–C6212 E2 8.29 6.6 �0.06 I �0.03**
*P , 0.05; **P , 0.01.a Percentage of phenotypic variation explained.b Positive effects of QTL contributed by Asominori (A) and IR24 (I) alleles.c Nonsignificant effect of the QEI.
Fine Mapping of a Rice Grain-Width QTL 2241

mapped on 10 chromosomes. Of these, three digenicinteractions occurred between an additive effect QTL(qGW-1, qGW-4, or qGW-12) and a modifying factor(Table 2).
Eighteen lines were selected from the total 66 CSSLsand used to analyze gene action of the six additive effectQTL. The donor IR24 segments harboring qGW-5 andqGW-9 were transferred into 2 (CSSL28 and 29) and 4CSSLs (CSSL53–55 and 57), respectively (Kubo et al.1999). Significant difference in grain width of milledrice was observed between Asominori and each ofCSSL28 and CSSL29 across all eight environments,indicating that the gene action of qGW-5 was significantand stable in the Asominori genetic background (Fig-
ure 2). With qGW-9, significant difference in grain widthbetween Asominori and each of the four target CSSLswas found only in a few environments. The direction ofthe effect of qGW-9 in CSSL53 and CSSL55 was consis-tent with that in the RIL population (Table 1), but oppo-site to that in CSSL54 (Figure 2). Thus, the gene actionof qGW-9 was sensitive to both the genetic backgroundand environmental conditions. Similar results were alsoobserved for qGW-1, qGW-4, qGW-10, and qGW-12 (sup-plemental Figure S2). Therefore, the observed stabilityand gene action of these QTL indicates that qGW-5 is themost important genetic factor that controls rice grain-width difference between the Asominori and IR24parental lines.
TABLE 2
The putative epistatic QTLs and their environmental interactions for grain width of the milled rice
Chr. Interval i A-QTLa Chr. Interval j A-QTL Environment LOD score PVEb (%) AAijc E-AAijd
1 R1613–XNpb216 qGW-1 7 XNpb50–C105 E1 12.48 9.49 0.09 0.030**E2 6.04 5.51 0.06 NS
1 XNpb252–XNpb87-2 2 C560–C601 E2 6.22 3.83 �0.05 NSE3 6.85 5.21 �0.06 NS
1 C112–XNpb346 3 G1316–C80 E1 9.31 4.22 0.06 0.030*E4 6.17 6.91 �0.07 �0.021*
6 XNpb27–XNpb16�1 9 XNpb103–C39 E3 8.24 7.1 0.07 NSE4 7.50 9.03 0.08 0.026*
2 XNpb349–V83B 11 C410–C1350 E3 9.27 9.27 �0.08 �0.029**E4 8.92 11.43 �0.09 �0.023**
2 XNpb227–C132 4 C335–C1612 qGW-4 E2 14.83 7.5 �0.08 �0.032**2 G1185–C1236 4 Ky4–R2737 E3 7.06 9.27 �0.08 �0.027**3 C80–C1677 7 C1008–R2394 E1 8.35 4.22 0.06 0.021*3 XNpb392–R2778 11 C6–C1003A E1 8.41 5.74 �0.07 NS3 C1351–R19 12 R1869–R367 qGW-12 E2 7.92 3.83 0.05 �0.022*8 R2976–C277 11 C6–C1003A E1 10.90 11.72 0.10 0.040**
Chr., chromosome. *P , 0.05; **P , 0.01.a Additive effect QTL.b Percentage of phenotypic variation explained.c Additive by additive epistatic effects of QTL.d Interaction effect of epistatic QTL by environment.
Figure 2.—Grain widthof the milled rice in Asomi-nori and target CSSLs carry-ing qGW-5 or qGW-9 allelesin eight environments (E1–E8). * and ** indicate signif-icance levels of 5 and 1%,respectively; ns, nonsignifi-cant difference. The openand shaded boxes representthe chromosomal segmentsfrom Asominori and IR24,respectively. The test was con-ducted between Asominoriand IR24 or one target CSSL.
2242 X. Wan et al.

QTL qGW-5 controlled both rice grain width andlength–width ratio in the BC4F2 population: In E9, thephenotypic distributions of grain width of paddy andbrown rice in the CSSL28/Asominori F2 populationappeared to be bimodal with boundaries of 3.28 and2.80 mm, respectively (Figure 3, A and B). The ratio ofnarrow- (1921) to wide-grain individuals (250) was7.68:1, which does not fit with the expected segregationratio of 3:1 for the inheritance of a single gene. Similarly,the ratio of small to large LWR individuals was 1:7.68(Figure 3, E and F). Interestingly, all 250 small LWRindividuals showed wide grains, and all 1921 large LWRplants presented narrow grains. Moreover, significantlynegative correlations (r ¼ �0.94** and �0.94**) wereobserved between grain width and LWR of paddy rice aswell as brown rice in the total 2171 BC4F2 individuals.Furthermore, although LWR is a complex trait reflectinggrain length and width, QTL for grain length hadrelatively small effects on the phenotypic variation ofLWR in the BC4F2 population, as shown by Figure 3, Cand D, which clearly indicated that minor factor(s)conferred the phenotypic variations of grain length.These results suggest that qGW-5 mainly affected bothrice grain width and LWR in the BC4F2 population. This
is further supported by the fact that the ratios of narrow-to wide-grain individuals were 7.05:1, 7.36:1, and 7.54:1in the CSSL28/Asominori F2 populations that included1248 plants in E10, 2465 in E11, and 897 in E12 (Figure4, A–C); their corresponding ratios of small to large LWRindividuals were 1:7.05, 1:7.36, and 1:7.54, respectively.
Dissecting QTL qGW-5 into a single gene, gw-5: Todissect qGW-5 into a single gene, we analyzed fourgenetic models that could possibly lead to the observeddistortion of segregation in the BC4F2 population. Widerice grain could be controlled by one of the followingmodels: (1) two recessive linked genes at the qGW-5locus, (2) a recessive gene linked with gamete sterilitygene(s), (3) a recessive gene linked with gene(s) forweak germination or seedling viability, or (4) a recessivegene linked with hybrid partial sterility gene(s). If case 1is correct, genotypes of the markers near qGW-5 includ-ing Asominori(A)/A, A/CSSL28(L), and L/L should showthe normal 1:2:1 ratio in the BC4F2 population. How-ever, the ratios of 8 SSR markers in the interval 20.6–39.2cM near qGW-5 did not exhibit the predicted1:2:1 ratio (Figure 5, A1–D1). If case 2 is the correctmodel, the above ratios of 7.68:1, 7.05:1, 7.36:1, and7.54:1 should correspond to 1:3.9:3.8, 1:3.7:3.4, 1:3.7:
Figure 3.—Frequencydistributions of grain width,grain length, and length–width ratio in the CSSL28/Asominori BC4F2 popula-tion (2171 individuals) inE9. (A) Grain width ofpaddy rice; (B) grain widthof brown rice; (C) grainlength of paddy rice; (D)grain length of brown rice;(E) length–width ratio ofpaddy rice; (F) length–widthratio of brown rice.
Fine Mapping of a Rice Grain-Width QTL 2243

3.6, and 1:3.9:3.8 for A/A:A/L:L/L, respectively. But theobserved actual ratios listed in Figure 5, A1–D1, clearlyexclude case 2. Additionally, rice seeds with the geno-type of A/A, A/L, or L/L had similar germination abilityand seedling viability (supplemental Table 3), ruling outthe model presented in case 3.
Several observations support the fourth case. First,complete fertility was observed for Asominori, IR24, andCSSL28, whereas partial sterility occurred in Asomi-nori/CSSL28 F1 plants, which evidently resulted fromhybrid partial sterility gene(s). Second, an indica–japonica hybrid partial sterility gene S31(t) mapped to20.9–24.7 cM on chromosome 5 in our laboratory(Zhao et al. 2006) was linked with qGW-5 located at36.4–44.9 cM (Table 1). Third, eight SSR markers in the20.6–39.2cM region showed regularly progressive seg-
regation distortions in the three genotypes, with ratiosof LL 1 AL/AA from 7.33:1 at 39.2 cM to 14.79:1 at 20.6cM (Figure 5, A1), indicating that the closer the distancefrom the SSR markers to the S31(t) gene, the strongerthe degree of segregation distortion. Thus, the S31(t)gene played a crucial role in inducing the distortion ofthe ratios. In contrast, four SSR markers (RM163,RM430, RM506, and RM408) far from the qGW-5 locusshowed a nearly normal ratio of 3:1 for LL 1 AL/AA(Figure 5, A1). Similar results were also observed inE10–E12 (Figure 5, B1–D1). Additionally, when 300randomly selected BC4F2 plants were divided into threegroups on the basis of the three genotypes of theRMw513 marker, 35, 37, 42, and 36 plants with thegenotype A/A in E9–E12, respectively, showed wide ricegrains (Figure 5, A2–D2), whereas all other narrow-grain plants presented the genotype of A/L or L/L,indicating that the distorted segregation of marker ge-notypes was consistent with that of grain-width pheno-type. Finally, all individuals in 35 BC4F3 families with thegenotype A/A at the RMw513 locus showed wide grainswithout segregation. Of 2408 BC4F3 plants derived from152 BC4F2 plants with the genotype A/L, the ratio ofnarrow- (2124) to wide-grain plants (284) was 7.48:1,consistent with that in the BC4F2 population (Figures 3and 4). These findings clearly indicate that qGW-5 be-haves like a single gene in the CSSL28/Asominori F2
population and that both wide rice grains and smalllength–width ratio are mainly controlled by a recessiveqGW-5 allele, named gw-5.
Environmental impact on the effect of the gw-5 gene:Since wide rice grain was controlled by the gw-5 gene inthe BC4F2 population, the environmental impact on theeffect of the gw-5 gene could be evaluated by comparingthe average grain width of BC4F2 individuals with thegenotype of gw-5/gw-5 among the E9–E12 environ-ments. The largest effect of the gw-5 gene occurred inE9 and E11, with average grain widths of 3.36 6 0.05 and3.36 6 0.04 mm, and 2.88 6 0.04 and 2.88 6 0.05 mmfor paddy rice and brown rice, respectively; gw-5 had thesmallest effect in E10, in which paddy rice and brownrice had average grain widths of 3.20 6 0.05 and 2.66 6
0.04 mm, respectively. Moreover, significant differencesof grain width were observed between E9/E11 and E12,as well as E12 and E10 (Table 3), thus showing that theenvironment had a significant impact on the effect ofthe gw-5 gene. Likewise, a similar environmental impactwas also found on the effect of the GW-5 gene (supple-mental Table 4).
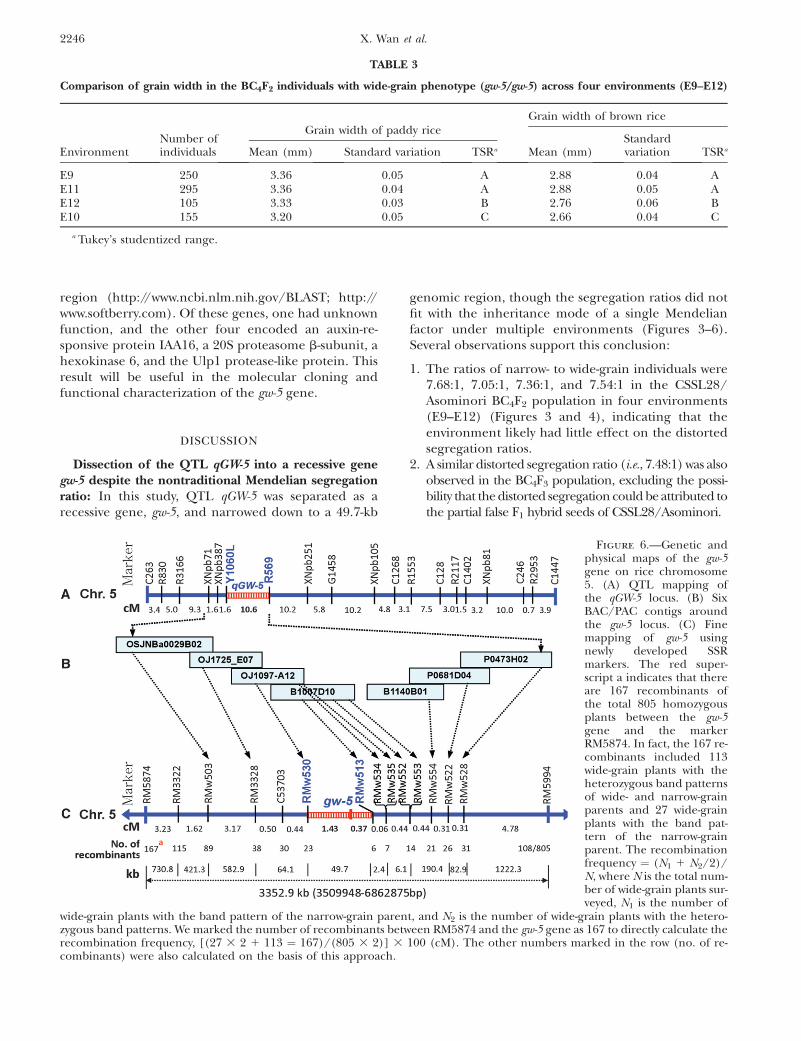
Fine mapping of the gw-5 gene in a recombinationhotspot region on chromosome 5: For fine mapping,805 wide-grain homozygotes of the total 6781 BC4F2
individuals were used to calculate the recombinationfrequency between the gw-5 gene and the surroundingmolecular markers. Using previously published SSR andEST markers, we detected three SSR markers (RM3328,RM3322, and RM5874) and one EST marker (C53703)
Figure 4.—Frequency distributions of grain width of paddyrice in the CSSL28/Asominori F2 populations grown in E10,E11, and E12. (A) Grain width of paddy rice in E10 (1248 in-dividuals); (B) grain width of paddy rice in E11 (2465 individ-uals); (C) grain width of paddy rice in E12 (897 individuals).
2244 X. Wan et al.

on one side of the gw-5 gene, and one SSR marker(RM5994) on the other side (Figure 6C). Ten poly-morphic SSR markers were then designed using DNAsequences of seven BAC/PAC contigs in Nipponbare(supplemental Table 2S and Figure 6B). Among themarkers, RMw530 and RMw513 had 23 and 6 recombi-nants with the gw-5 gene in the 805 homozygotes, re-spectively (Figure 6C). Thus, the gw-5 gene was locatedin the 1.8-cM genetic region on chromosome 5. Search-ing for the contigs OJ1097_A12 (harboring RMw530)and B1007D10 (carrying RMw513) in the Nipponbaregenome (http://www.gramene.org), we found thatRMw530 and RMw513 reside at 5,309,078 and 5,358,806bp on chromosome 5, respectively. Thus, the gw-5 gene
was narrowed down to a 49.7-kb genomic region (Figure6C).
The 17.1-cM genetic region (RM5874–RM5994) canbe divided into 10 intervals, with ratios of physical-to-genetic distance of 226.3, 261.7, 183.9, 68.9, 27.6, 40.0,14.2, 257.3, 267.4, and 255.4 kb/cM (Figure 7). The gw-5gene was located in the RMw530–RMw513 interval withthe kb/cM of 27.6. In rice, the genomewide average isestimated at 244 kb/cM (Chen et al. 2002), indicatingthat the crossover frequency between RMw530 andRMw513 was approximately nine times that of the wholegenome in rice.
On the basis of the available sequence annotation, wefound five predicted candidate genes in the 49.7-kb
Figure 5.—The ratios ofthree genotypes of SSRmarkers and frequency dis-tributions of grain width in300 BC4F2 individualsacross four environments(E9–E12). A1–D1 representthe ratios of three geno-types of 12 SSR markers inE9–E12, respectively; A2–D2 show the frequency dis-tributions of grain width atthe RMw513 locus in E9–E12, respectively.
Fine Mapping of a Rice Grain-Width QTL 2245
region (http://www.ncbi.nlm.nih.gov/BLAST; http://www.softberry.com). Of these genes, one had unknownfunction, and the other four encoded an auxin-re-sponsive protein IAA16, a 20S proteasome b-subunit, ahexokinase 6, and the Ulp1 protease-like protein. Thisresult will be useful in the molecular cloning andfunctional characterization of the gw-5 gene.
DISCUSSION
Dissection of the QTL qGW-5 into a recessive genegw-5 despite the nontraditional Mendelian segregationratio: In this study, QTL qGW-5 was separated as arecessive gene, gw-5, and narrowed down to a 49.7-kb
genomic region, though the segregation ratios did notfit with the inheritance mode of a single Mendelianfactor under multiple environments (Figures 3–6).Several observations support this conclusion:
1. The ratios of narrow- to wide-grain individuals were7.68:1, 7.05:1, 7.36:1, and 7.54:1 in the CSSL28/Asominori BC4F2 population in four environments(E9–E12) (Figures 3 and 4), indicating that theenvironment likely had little effect on the distortedsegregation ratios.
2. A similar distorted segregation ratio (i.e., 7.48:1) was alsoobserved in the BC4F3 population, excluding the possi-bility that the distorted segregation could be attributed tothe partial false F1 hybrid seeds of CSSL28/Asominori.
Figure 6.—Genetic andphysical maps of the gw-5gene on rice chromosome5. (A) QTL mapping ofthe qGW-5 locus. (B) SixBAC/PAC contigs aroundthe gw-5 locus. (C) Finemapping of gw-5 usingnewly developed SSRmarkers. The red super-script a indicates that thereare 167 recombinants ofthe total 805 homozygousplants between the gw-5gene and the markerRM5874. In fact, the 167 re-combinants included 113wide-grain plants with theheterozygous band patternsof wide- and narrow-grainparents and 27 wide-grainplants with the band pat-tern of the narrow-grainparent. The recombinationfrequency ¼ (N1 1 N2/2)/N, where N is the total num-ber of wide-grain plants sur-veyed, N1 is the number of
wide-grain plants with the band pattern of the narrow-grain parent, and N2 is the number of wide-grain plants with the hetero-zygous band patterns. We marked the number of recombinants between RM5874 and the gw-5 gene as 167 to directly calculate therecombination frequency, [(27 3 2 1 113 ¼ 167)/(805 3 2)] 3 100 (cM). The other numbers marked in the row (no. of re-combinants) were also calculated on the basis of this approach.
TABLE 3
Comparison of grain width in the BC4F2 individuals with wide-grain phenotype (gw-5/gw-5) across four environments (E9–E12)
EnvironmentNumber ofindividuals
Grain width of paddy riceGrain width of brown rice
Mean (mm) Standard variation TSRa Mean (mm)Standardvariation TSRa
E9 250 3.36 0.05 A 2.88 0.04 AE11 295 3.36 0.04 A 2.88 0.05 AE12 105 3.33 0.03 B 2.76 0.06 BE10 155 3.20 0.05 C 2.66 0.04 C
a Tukey’s studentized range.
2246 X. Wan et al.

3. Eight SSR markers in the 20.6–39.2 cM region on ricechromosome 5 showed progressive distortions ofsegregation in three genotypes, with ratios of (GW-5/GW-5 1 GW-5/gw-5)/gw-5/gw-5 from 6.14 at 39.2 cMto 14.79 at 20.6 cM (Figure 5, A1–D1), showing thatthe closer the SSR markers to the hybrid partial-sterility gene S31(t) (Zhao et al. 2006), the strongerthe degree of segregation distortion. However, fourSSR markers located far from qGW-5 and the S31(t)gene showed a nearly normal ratio of 3:1 (Figure 5,A1–D1).
4. Complete fertility was observed for Asominori, IR24and CSSL28, whereas partial sterility occurred inAsominori/CSSL28 F1 plants, which evidently re-sulted from the hybrid partial sterility. Thus, theS31(t) gene should play a crucial role in triggering thedistorted ratios of marker genotypes near the gw-5gene.
5. Among 300 BC4F2 plants, 35, 37, 42, and 36 plantswith the gw-5/gw-5 genotype in E9–E12, respectively,showed wide rice grains (Figure 5, A2–D2), whereasall other narrow-grain plants presented the genotypeof GW5/gw-5 or GW-5/GW-5. This indicated that thedistorted segregation of marker genotypes was con-sistent with that of phenotypic values of grain width.
6. Rice seeds with the genotype of GW-5/GW-5, GW-5/gw-5, or gw-5/gw-5 had similar germination ability andseedling viability (supplemental Table 3), whichruled out the possibility that a gene(s) for weakgermination or seedling viability linked to the gw-5gene resulted in the distorted segregation in theBC4F2 population.
7. We used 805 wide-grain plants and 10 SSR markers tonarrow down the gw-5 gene to a 49.7-kb genomicregion on rice chromosome 5 (Figure 6), furtherdemonstrating that qGW-5 corresponded to the re-cessive gw-5 gene. Therefore, although it did notshow the inheritance mode of a single gene in theBC4F2 population, qGW-5 was separated as the gw-5gene, and the observed distorted segregation mightbe caused by its linkage to the hybrid partial-sterility
S31(t) gene located at a genetic distance of �15.0 cM(Figure 6; Zhao et al. 2006).
Dissection of the genetic modes of QTL underlyingcomplex quantitative traits: The QTL qGW-5 allele, gw-5, was narrowed down to a 49.7-kb genomic regionexhibiting recombination hotspots (Figures 3–7), illus-trating that a QTL could be treated as a singleMendelian factor to perform research on functionalgenomics of a quantitative trait. Using a strategy offorward genetics, many QTL have been dissected intosingle genes for fine mapping and map-based cloning inrecent years. The genetic modes of QTL established assingle Mendelian factors can be categorized into at leastsix different types (Figure 8, A–F), i.e., the allele of aQTL corresponding to (1) a dominant major gene forthe phenotypic distribution with a discrete boundaryand a ratio of 3:1 (e.g., in rice, Fan et al. 2006; Wan et al.2006; and in wheat, Cuthbert et al. 2006) or (2) with apartially overlapping boundary and a ratio of 3:1 in thesecondary F2 population (e.g., in rice, Wan et al. 2004b;Yamamoto et al. 2000); (3) an additive major gene forthe phenotypic distribution with two discrete bound-aries and a ratio of 1:2:1 (e.g., in soybean, Yamanakaet al.2005) or (4) with two partially overlapping boundariesand a ratio of 1:2:1 (e.g., in rice, Yamamoto et al. 1998);(5) an additive major gene for the continuous distribu-tion in a secondary F2 population and a ratio of 1:2:1 inF3 families (e.g., in rice, Monna et al. 2002; Takeuchi
et al. 2003; and in wheat, Roder et al. 2008) or (6) a non-Mendelian segregating major gene linked to othergene(s) for gamete sterility, hybrid partial sterility, weakgermination, or seedling viability (this study). Thesemodes not only disclose the complex genetic propertiesof QTL, but also provide some useful rules of how tointerpret the results with non-Mendelian segregationratios in advanced backcross progenies when establish-ing QTL into single genes and fine mapping QTL. Sincethe first use of a complete RFLP linkage map to identifyQTL controlling fruit mass, concentration of solublesolids, and fruit pH in the tomato by Paterson et al.(1988), .1000 QTL regulating agronomic and eco-nomic traits in crops have been identified, but only a fewhave been precisely mapped and isolated. One impor-tant reason may be the complex genetics of QTL asdescribed above. Therefore, greater research contribu-tion by the geneticists in the field of QTL mapping isrequired so that more QTL will be dissected intoindividual genes on the basis of the genetic modes ofdifferent QTL (Figure 8) and fine mapping and map-based cloning carried out. In addition, overlappingsubstitute lines have been used to achieve high resolu-tion mapping of QTL in plants (Paterson et al. 1990;Eshed and Zamir 1995). Recently, a reverse geneticsapproach was employed for fine mapping of QTL, inwhich recombinants in a target region harboring a QTLof interest were identified by comprehensive genotyp-
Figure 7.—Physical-to-genetic distance ratios in 10 markerintervals near the gw-5 gene.
Fine Mapping of a Rice Grain-Width QTL 2247

ing followed by phenotyping of the resultant informa-tive recombinants (Li et al. 2004a). By combining thismethod with tests of advanced backcross progenies,several QTL were precisely localized in narrow genomicregions (Chen and Tanksley 2004; Thomson et al.2006). Furthermore, QTL isogenic recombinant analy-sis has been developed to speed up fine mapping of aQTL with a single population (Peleman et al. 2005). Theprogress on QTL fine mapping would facilitate researchon the functional genomics of complex quantitativetraits and provide new insights into the genetic theory ofquantitative traits.
The significance of this work to the basic under-standing of genetic principles of QTL across taxa inplants: Classical quantitative genetics describes theaggregate behavior of suites of genes influencing aquantitative trait. However, an understanding of quan-titative inheritance at the molecular level requiresdetailed descriptions on genetic properties of individ-ual genes controlling the quantitative trait, which ismade possible by QTL mapping (Paterson 1995). Basicproperties of individual QTL, such as additivity, domi-nance, and overdominance, have been analyzed, and awide range of different modes of gene action is evidentfor various QTL (Paterson et al. 1991; Redona andMackill 1996). Many basic genetic phenomena arereconciled with the results from QTL mapping, suchas transgression, heterosis, the number of genes for aquantitative trait, and the importance of epistasis(Paterson 1995; Yano and Sasaki 1997). However, sev-eral key genetic questions from most identified QTL inplants still remain unclear, e.g., the number of genes at
individual QTL, the kinds of phenotypic distributionscontrolled by individual QTL alleles, and the types ofgenetic effects of individual QTL alleles. It is relativelydifficult to answer these questions by primary QTLmapping strategies on the basis of F2, RIL, DH, and BCpopulations, while CSSLs or NILs harboring target QTLare useful for in-depth exploration of genetic modesand effects of QTL in plants. In this study, we used BC4F2
and BC4F3 populations to identify the QTL qGW-5corresponding to a single gene gw-5 with a recessivegenetic effect. However, the phenotypic segregationratio controlled by the gw-5 gene did not fit the 3:1 of asingle-gene inheritance (Figures 3–6). On the basis ofthis finding, we summarized at least six different modesof how to dissect a QTL into a single gene, which can beapplied in plants such as rice, soybean, and wheat. Thesemodes not only enable researchers in the field of QTLmapping to dissect more QTL into individual genes, butalso clearly indicate the types of genetic effects of QTLalleles on the basis of phenotypic distributions insecondary F2 and F3 populations (Figure 8). Moreimportantly, this study provides a classic example ofthe dissection of genetic properties and modes ofidentified QTL and further performance of QTL finemapping when distorted phenotypic distributions areobserved in advanced backcross progenies. Therefore,this report describes significant findings for dissectingand furthering the understanding of genetic principlesof QTL. Furthermore, the research strategies used inthis study are applicable among other taxa in plants.
Additionally, cereal species such as rice (Oryza),maize (Zea), sorghum (Sorghum), and wheat (Triti-
Figure 8.—Six models for dis-secting a QTL into a single genein a secondary F2 population. (A)The allele of a QTL belongs to adominance major gene leading toa ratio of 3:1 with a discrete bound-ary. (B) The allele of a QTL is adominant major gene resulting ina ratio of 3:1 with an overlappingboundary. (C) The allele of a QTLbelongs to an additive major genecontributing to a ratio of 1:2:1 withtwo discrete boundaries. (D) The al-lele of a QTL is an additive majorgene leading to a ratio of 1:2:1 withtwo overlapping boundaries. (E)The allele of a QTL belongs to anadditive major gene resulting inthe continuous distribution in a sec-ondary F2 population, and a ratio of1:2:1 can be observed by investigat-ing F3 families. (F) The allele of aQTL is a non-Mendelian segregat-ing major gene linked to othergene(s) for gamete sterility, hybridsterility, weak germination ability,and/or weak seedling viability.
2248 X. Wan et al.

cum) began to diverge from a common ancestor only�50–70 million years ago and have undergone largelyparallel selection regimes associated with domesticationand improvement over the past several thousand years(Paterson et al. 2003). This makes it possible to per-form comparative mapping among these cereal species.As a result, a close correspondence among QTL affect-ing complex traits such as seed size has been demon-strated in sorghum, sugarcane, maize, wheat, barley, andrice (Paterson et al. 1995). Thus, QTL analysis in onetaxon may provide significant clues to similar findings inother taxa, and correspondence of QTL across diversetaxa also provides strong empirical support for the useof model systems in research of complex phenotypes inplants (Paterson 1995). On the other hand, the ricegenome sequence provides a platform for comparingand integrating genomic information about diversecereals and together with genetic maps and sequencesamples from other cereals yields new insights into boththe shared and independent dimensions of cereal evolu-tion (Paterson et al. 2003). Therefore, the results ofgenetics and QTL fine mapping of rice seed dimensionsobtained here are applicable toward the moleculardissection of evolution and domestication among cerealspecies.
A potential application of the gw-5 gene for improvinggrain quality of rice on the basis of molecular designbreeding strategy: Biological data (including QTL/gene mapping) continue to dramatically accumulatewith the rapid development of biotechnology andgenomics. Nevertheless, the lack of appropriate toolsand methods of simulation breeding renders it difficultto integrate this information into traditional cropbreeding. Strategies such as molecular design breeding(MDB) can resolve, at least partly, this conflict andfacilitate crop breeding. Before going to the field,breeders design a blueprint for obtaining particularbreeding objectives, by which the crossing and selectionprocess can be simulated and optimized, thus greatlyenhancing breeding efficiency (Wang et al. 2007a,b).Until now, most of the successful research on MDBor MAS breeding has been conducted on resistanceto diseases or insects conferred by major genes, butfew efforts have addressed the improvement of complexquantitative traits, possibly due to the lack of in-formation on QTL epistasis, QEI effects, gene actionof QTL, and markers closely linked to target QTL (Li
2001). On the other hand, the continuous phenotypicdistribution in progeny and measurement of rice grainwidth and shape after the reproductive stage make itdifficult for breeders to efficiently improve grain ap-pearance using conventional selection methods. In ad-dition, rice grain width and shape can greatly affectother important quality traits such as endospermchalkiness, milling efficiency, cooking texture, andpalatability of cooked rice, and play an important role indetermining rice grain yield. Therefore, grain width
and shape are good candidate traits for MDB in ricebreeding programs.
In the meantime, qGW-5 can be recommended as adesirable QTL for improving rice grain quality due tothe following observations:
1. qGW-5 has been shown to control rice grain shape notonly in Indica/Japonica (Xu et al. 2002; Tan et al.2005; Wan et al. 2005, 2006) and Indica/Indica (Lin
et al. 1995; Tan et al. 2000; Lin and Wu 2003) pop-ulations, but also in a cultivated rice germplasmcollection based on the whole-genome associationmapping strategy (Iwata et al. 2007). The rice germ-plasm set consists of 281 landraces and 51 moderncultivars originating from 23 rice-producing coun-tries and is considered extremely useful for rice im-provement in breeding experiments (Kojima et al.2005). Therefore, qGW-5 should be applicable andimportant in the improvement of grain appearancequality in traditional and molecular rice breedingprograms.
2. The expression stability of qGW-5 is relatively highboth at the level of multiple QTL (Tables 1 and 2)and an individual QTL allele across multiple environ-ments (Figure 2).
3. qGW-5 accounts for a large proportion of the overallphenotypic variation (Table 1; Wan et al. 2005).
4. Dissecting qGW-5 into the gw-5 gene as well as its finemapping make it a desirable candidate for MDB, asthe deleterious gene(s) near the gw-5 allele can beeasily removed by MAS, and 11 flanking markerswithin a 2.0-cM distance (Figure 6C) can be readilyused by breeders for MAS of the gw-5 into elitecultivars.
Additionally, other major QTL for grain length (Wan
et al. 2006), endosperm chalkiness (Wan et al. 2004b),starch viscosity (rapid viscosity analyzer profile charac-teristics), amylose content, and protein content (Wan
et al. 2004a; Weng et al. 2006; our unpublished data) inrice have also been characterized in detail, dissectedinto single genes, and precisely mapped. The MDB meth-odology and computer programs have recently been de-veloped and employed by our laboratory (Wang et al.2004, 2007a,b; Li et al. 2007). Thus, QTL/gene pyr-amiding on the basis of MDB and MAS strategiesshould be feasible for simultaneously improving mul-tiple rice quality traits. In this regard, the field exper-iment work is ongoing.
Localization of the gw-5 gene in the recombinationhotspot region: Recombination at the meiotic stageplays an important role in genome evolution, crop cross-breeding, and map-based cloning of genes/QTL. In thisstudy, four recombination hotspot regions (Figure 7)corresponded to three BAC/PAC contigs (OJ1725_E07,OJ1097_A12, and B1007D10) in Nipponbare (Figure6B). We found that the G 1 C contents of OJ1725_E07,OJ1097_A12, and B1007D10 contigs were 40.3, 41.4,
Fine Mapping of a Rice Grain-Width QTL 2249

and 42.5%, the densities of the predicted genes were13.5, 11.3, and 16.3 (genes/100 kb), and the percen-tages of repetitive sequences were 9.8, 10.2, and 8.4%,respectively. Thus, the relatively high densities of thepredicted genes and low repetitive sequences werefound to be comparable to those in the hotspot regionsof rice chromosome 1 (Wu et al. 2003) and in the ge-nomes of Arabidopsis and other cereals (Arabidopsis
Genome Initiative 2000; Ware and Stein 2003). TheG 1 C content in these hotspot regions was almost thesame as in the hotspot regions of rice chromosome 1(Wu et al. 2003), but relatively lower than that in hotspotregions of Arabidopsis, yeast, and human (Jeffreys
et al. 1998; Gerton et al. 2000), indicating that a specificmechanism may exist for activating recombination inthe hotspots of rice chromosomes 1 and 5. This novelfinding creates an opportunity, as well as poses a chal-lenge, for molecular geneticists in the further explora-tion of the relationship between fine structure andcrossover frequency of rice chromosomes by dissectingthe mechanism of high recombination frequencies inthe four regions surrounding the gw-5 gene between thetwo parents (Asominori and CSSL28). Similarly, linkagemapping strategies have been used to investigate therecombination hotspots on chromosomes of a widevariety of organisms, e.g., wheat (Faris et al. 2000), neu-rospora (Yeadon et al. 2004), mouse (Kelmenson et al.2005), and human (Minin et al. 2007).
We greatly thank A. Yoshimura, Kyushu University, Japan, for kindlyproviding us with the RIL and CSSL populations and genotype data.We also thank San Francisco Edit (http://www.sfedit.net) for kindlyproofreading, editing, and refining the English of this manuscript.This research was supported by a grant from the National High Tech-nology Research and Development Program of China (2003AA222131)and the project 111 program.
LITERATURE CITED
Aluko, G., C. Martinez, J. Tohme, C. Castano, C. Bergman et al.,2004 QTL mapping of grain quality traits from the interspecificcross Oryza sativa 3 O. glaberrima. Theor. Appl. Genet. 109: 630–639.
Arabidopsis Genome Initiative, 2000 Analysis of the genome se-quence of the flowering plant Arabidopsis thaliana. Nature 408:796–815.
Chauhan, J. S., V. S. Chauhan and S. B. Lodh, 1995 Comparativeanalysis of variability and correlations between quality compo-nents in traditional rainfed upland and lowland rice. Indian J.Genet. Plant Breed. 55: 6–12.
Chen, K. Y., and S. D. Tanksley, 2004 High-resolution mappingand functional analysis of se2.1: a major stigma exsertion quanti-tative trait locus associated with the evolution from allogamyto autogamy in the genus Lycopersicon. Genetics 168: 1563–1573.
Chen, M. S., G. Presting, W. B. Barbazuk, J. L. Goicoechea, B.Blackmon et al., 2002 An integrated physical and geneticmap of the rice genome. Plant Cell 14: 537–545.
Chen, X., S. Temnykh, Y. Xu, Y. G. Cho and S. R. McCouch,1997 Development of a microsatellite framework map provid-ing genome-wide coverage in rice (Oryza sativa L.). Theor. Appl.Genet. 95: 553–567.
Cuthbert, P. A., D. J. Somers, J. Thomas, S. Cloutier and A. Brule-Babel, 2006 Fine mapping Fhb1, a major gene controlling fusa-
rium head blight resistance in bread wheat (Triticum aestivum L.).Theor. Appl. Genet. 112: 1465–1472.
Dellaporta, S. L., J. Wood and J. B. Hicks, 1983 A plant DNA minipreparation: Version II. Plant Mol. Biol. Rep. 1: 19–21.
Eshed, Y., and D. Zamir, 1995 An introgression line population ofLycopersicon pennellii in the cultivated tomato enables the identi-fication and fine mapping of yield-associated QTL. Genetics 141:1147–1162.
Fan, C. C., Y. Z. Xing, H. L. Mao, T. T. Lu, B. Han et al., 2006 GS3, amajor QTL for grain length and weight and minor QTL for grainwidth and thickness in rice, encodes a putative transmembraneprotein. Theor. Appl. Genet. 112: 1164–1171.
Faris, J. D., K. M. Haen and B. S. Gill, 2000 Saturation mapping ofa gene-rich recombination hot spot region in wheat. Genetics154: 823–835.
Frary, An., T. C. Nesbitt, Am. Frary, S. Grandillo, E. V. D. Knaap
et al., 2000 fw2.2: A quantitative trait locus key to the evolutionof tomato fruit size. Science 289: 85–88.
Fridman, E., F. Carrari, Y. S. Liu, A. R. Fernie and D. Zamir,2004 Zooming in on a quantitative trait for tomato yield usinginterspecific introgressions. Science 305: 1786–1789.
Gerton, J. L., J. Derisi, R. Shroff, M. Lichten, P. O. Brown et al.,2000 Global mapping of meiotic recombination hotspots andcoldspots in the yeast Saccharomyces cerevisiae. Proc. Natl. Acad.Sci. USA 97: 11383–11390.
Harlan. J., 1992 Crops & Man. American Society of Agronomy/Crop Science Society of American, Madison, WI.
He, G. M., X. J. Luo, F. Tian, K. G. Li, Z. F. Zhu et al.,2006 Haplotype variation in structure and expression of a genecluster associated with a quantitative trait locus for improvedyield in rice. Genome Res. 16: 618–626.
Huang, N., A. Parco, T. Mew, G. Magpantay, S. McCouch et al.,1997 RFLP mapping of isozymes, RAPD and QTLs for grainshape, brown planthopper resistance in a doubled haploid ricepopulation. Mol. Breed. 3: 105–113.
Iwata, H., Y. Uga, Y. Yoshioka, K. Ebana and T. Hayashi,2007 Bayesian association mapping of multiple quantitativetrait loci and its application to the analysis of genetic variationamong Oryza sativa L. germplasms. Theor. Appl. Genet. 114:1437–1449.
Jeffreys, A. J., J. Murray and R. Neumann, 1998 High-resolutionmapping of crossovers in human sperm defines a minisatellite-associated recombination hotspot. Mol. Cell 2: 267–273.
Juliano, B. O., and C. P. Villareal, 1993 Grain Quality Evaluation ofWorld Rices. International Rice Research Institute, Manila, ThePhilippines.
Kelmenson, P. M., P. Petkov, X. Wang, D. C. Higgins, B. J. Paigen
et al., 2005 A torrid zone on mouse chromosome 1 containinga cluster of recombinational hotspots. Genetics 169: 833–841.
Kojima, Y., K. Ebana, S. Fukuoka, T. Nagamine and M. Kawase,2005 Development of an RFLP-based rice diversity researchset of germplasm. Breed. Sci. 55: 431–440.
Kubo, T., K. Nakamura and A. Yoshimura, 1999 Development of aseries of Indica chromosome segment substitution lines in Japon-ica background of rice. Rice Genet. Newsl. 16: 104–106.
Li, Z. K., 2001 QTL mapping in rice: a few critical considerations,pp. 153–171 in Rice Genetics IV, edited by G. S. Khush, D. S. Brar
and B. Hardy. Science Publishers, New Delhi.Li, H., G. Ye and J. Wang, 2007 A modified algorithm for the im-
provement of composite interval mapping. Genetics 175: 361–374.
Li, J. M., M. Thomsonand S. R. McCouch, 2004a Fine mapping of agrain-weight quantitative trait locus in the pericentromeric re-gion of rice chromosome 3. Genetics 168: 2187–2195.
Li, J. M., J. H. Xiao, S. Grandillo, L. Y. Jiang, Y. Z. Wan et al.,2004b QTL detection for rice grain quality traits using an in-terspecific backcross population derived from cultivated Asian(O. Sativa L.) and African (O. glaberrium S.) rice. Genome 47:697–704.
Lin, H. X., S. K. Min, Z. M. Xiong, H. R. Qian, J. Y. Zhuang et al.,1995 RFLP mapping of QTLs for grain shape traits in indica rice(Oryza sativa L. subsp. Indica). Scientia Agric. Sin. 28: 1–7.
Lin, L. H., and W. R. Wu, 2003 Mapping of QTLs underlyinggrain shape and grain weight in rice. Mol. Plant Breed. 1: 337–342.
2250 X. Wan et al.
McCouch, S. R., L. Teytelman, Y. B. Xu, K. B. Lobos, K. Clare et al.,2002 Development and mapping of 2240 new SSR markers forrice (Oryza sativa L.). DNA Res. 9: 199–207.
McKenzie, K. S., and J. N. Rutger, 1983 Rice grain shape and ricegrain quality. Crop Sci. 23: 306–313.
Minin, V. N., K. S. Dorman, F. Fang and M. A. Suchard,2007 Phylogenetic mapping of recombination hotspots in hu-man immunodeficiency virus via spatially smoothed change-point processes. Genetics 175: 1773–1785.
Monna, L., X. Lin, S. Kojima, T. Sasaki and M. Yano, 2002 Geneticdissection of a genomic region for a quantitative trait locus, Hd3,into two loci, Hd3a and Hd3b, controlling heading date in rice.Theor. Appl. Genet. 104: 772–778.
Paterson, A. H., 1995 Molecular dissection of quantitative traits:progress and prospects. Genome Res. 5: 321–333.
Paterson, A. H., E. S. Lander, J. D. Hewitt, S. Peterson, S. E.Lincoln et al., 1988 Resolution of quantitative traits intoMendelian factors by using a complete linkage map of restrictionfragment length polymorphisms. Nature 335: 721–726.
Paterson, A. H., J. W. DeVerna, B. Lanini and S. D. Tanksley,1990 Fine mapping of quantitative trait loci using selected over-lapping recombinant chromosomes, in an interspecies cross oftomato. Genetics 124: 735–742.
Paterson, A. H., S. Damon, J. D. Hewitt, D. Zamir, H. D. Rabinowitch
et al., 1991 Mendelian factors underlying quantitative traits intomato: comparison across species, generations, and environ-ments. Genetics 127: 181–197.
Paterson, A. H., Y. R. Lin, Z. Li, K. F. Schertz, J. F. Doebley et al.,1995 Convergent domestication of cereal crops by indepen-dent mutations at corresponding genetic loci. Science 269:1714–1718.
Paterson, A. H., J. E. Bowers, D. G. Peterson, J. C. Estill and B. A.Chapman, 2003 Structure and evolution of cereal genomes.Curr. Opin. Genet. Dev. 13: 644–650.
Paterson, A. H., M. Freeling and T. Sasaki, 2005 Grains ofknowledge: genomics of model cereals. Genome Res. 15: 1643–1650.
Peleman, J. D., C. Wye, J. Zethof, A. P. Sørensen, H. Verbakel et al.,2005 Quantitative trait locus (QTL) isogenic recombinant anal-ysis: a method for high-resolution mapping of QTL within a sin-gle population. Genetics 171: 1341–1352.
Redona, E. D., and D. J. Mackill, 1996 Mapping quantitative traitloci for seedling vigor in rice using RFLPs. Theor. Appl. Genet.92: 395–402.
Redona, E. D., and D. J. Mackill, 1998 Quantitative trait locus anal-ysis for rice panicle and grain characteristics. Theor. Appl. Genet.96: 957–963.
Roder, M. S., X. Q. Huang and A. Borner, 2008 Fine mapping ofthe region on wheat chromosome 7D controlling grain weight.Funct. Integr. Genomics 8: 79–86.
Konishi, S., T. Izawa, S. Y. Lin, K. Ebana, Y. Fukuta et al., 2006 AnSNP caused loss of seed shattering during rice domestication. Sci-ence 312: 1392–1396.
Sanguinetti, C. J., N. E. Dias and A. J. G. Simpson, 1994 Rapid sil-ver staining and recover of PCR products separated on polyacryl-amide gels. Biotechniques 17: 915–919.
Song, X. J., W. Huang, M. Shi, M. Z. Zhu and H. X. Lin, 2007 AQTL for rice grain width and weight encodes a previouslyunknown RING-type E3 ubiquitin ligase. Nat. Genet. 39: 623–630.
Takeuchi, Y., S. Y. Lin, T. Sasaki and M. Yano, 2003 Fine linkagemapping enables dissection of closely linked quantitative traitloci for seed dormancy and heading in rice. Theor. Appl. Genet.107: 1174–1180.
Takita, T., 1989 Breeding for grain shape in rice. Agri. Sci. 44: 39–42.
Tan, Y. F., Y. Z. Xing, J. X. Li, S. B. Yu, C. G. Xu et al., 2000 Geneticbases of appearance quality of rice grains in Shanyou 63, an eliterice hybrid. Theor. Appl. Genet. 101: 823–829.
Tan, Y. P., L. Z. Li, P. Li, L. X. Wang and Z. L. Hu, 2005 Quantitativetrait loci for grain appearance traits of rice using a double hap-loid population. Mol. Plant Breed. 3: 314–322.
Thomson, M. J., J. D. Edwards, E. M. Septiningsih, S. E. Harrington
and S. R. McCouch, 2006 Substitution mapping of dth1.1, aflowering-time quantitative trait locus (QTL) associated with trans-
gressive variation in rice, reveals multiple Sub-QTL. Genetics 172:2501–2514.
Tsunematsu, H., A. Yoshimura, Y. Harushima, Y. Nagamura, N.Kurata et al., 1996 RFLP framework map using recombinantinbred lines in rice. Breed. Sci. 46: 279–284.
Unnevehr, L. J., B. Duff and B. O. Juliano, 1992 Consumer DemandFor Rice Grain Quality. International Rice Research Institute,Manila, The Philippines/International Development ResearchCentre, Ottawa, Canada.
Wan, X. Y., J. M. Wan, C. C. Su, C. M. Wang, W. B. Shen et al.,2004a QTL detection for eating quality of cooked rice in a pop-ulation of chromosome segment substitution lines. Theor. Appl.Genet. 110: 71–79.
Wan, X. Y., J. F. Weng, H. Q. Zhai and J. M. Wan, 2004b Fine map-ping of pgwc-8 gene affecting percentage of grains with chalkinessin rice (Oryza sativa. L). Rice Genet. Newsl. 21: 54–56.
Wan, X. Y., J. M. Wan, J. F. Weng, L. Jiang, J. C. Bi et al.,2005 Stability of QTLs for rice grain dimension and endospermchalkiness characteristics across eight environments. Theor.Appl. Genet. 110: 1334–1346.
Wan, X. Y., J. M. Wan, L. Jiang, J. K. Wang, H. Q. Zhai et al.,2006 QTL analysis for rice grain length and fine mapping ofan identified QTL with stable and major effects. Theor. Appl.Genet. 112: 1258–1270.
Wang, D. L., J. Zhu, Z. K. Li and A. H. Paterson, 1999 MappingQTLs with epistatic effects and QTL by environment interactionsby mixed linear model approaches. Theor. Appl. Genet. 99:1255–1264.
Wang, J. K., M. van Ginkel, R. Trethowan, G. Ye, I. DeLacy et al.,2004 Simulating the effects of dominance and epistasis on se-lection response in the CIMMYT wheat breeding program usingQuCim. Crop Sci. 44: 2006–2018.
Wang, J., S. C. Chapman, D. B. Bonnett, G. J. Rebetzke and J.Crouch, 2007a Application of population genetic theory andsimulation models to efficiently pyramid multiple genes viamarker-assisted selection. Crop Sci. 47: 580–588.
Wang, J. K., X. Y. Wan, H. H. Li, W. H. Pfeiffer, J. Crouch et al.,2007b Application of identified QTL-marker associations inrice quality improvement through a design-breeding approach.Theor. Appl. Genet. 115: 87–100.
Ware, D., and L. Stein, 2003 Comparison of genes among cereals.Curr. Opin. Plant Biol. 6: 121–127.
Weng, J. F., X. Y. Wan, X. J. Wu, H. L. Wang, H. Q. Zhai et al.,2006 Stable expression of QTL for amylase content (AC) andprotein content (PC) of milled rice (Oryza sativa L.) using a CSSLpopulation. Acta Agron. Sin. 32: 14–19.
Wu, J. Z., H. Mizuno, M. Hayashi-Tsugane, Y. Ito, Y. Chiden et al.,2003 Technical advance physical maps and recombination fre-quency of six rice chromosomes. Plant J. 36: 720–730.
Wu, J. Z., T. Maehara, T. Shimokawa, S. Yamamoto, C. Harada et al.,2002 A comprehensive rice transcript map containing 6591 ex-pressed sequence tag sites. Plant Cell 14: 525–535.
Xu, J. L., Q. Z. Xue, L. J. Luo and Z. K. Li, 2002 Genetic dissectionof grain weight and its related traits in rice (Oryza sativa L.). Chi-nese J. Rice Sci. 16: 6–10.
Xu, Z. J., W. F. Chen, D. R. Ma, Y. N. Lu, S. Q. Zhou et al.,2004 Correlations between rice grain shapes and main qualitativecharacteristics. Acta Agron. Sin. 30: 894–900.
Yamamoto, T., Y. Kuboki, X. Y. Lin, T. Sasaki and M. Yano,1998 Fine mapping of quantitative trait loci Hd-1, Hd-2 andHd-3, controlling heading date of rice, as single Mendelian fac-tors. Theor. Appl. Genet. 97: 37–44.
Yamamoto, T., H. X. Lin, T. Sasaki and M. Yano, 2000 Identificationof heading date quantitative trait loci Hd-6 and characterization ofits epistatic interactions with Hd-2 in rice using advanced back-cross progeny. Genetics 154: 885–891.
Yamanaka, N., S. Watanabe, K. Toda, M. Hayashi, H. Fuchigami
et al., 2005 Fine mapping of the FT1 locus for soybean floweringtime using a residual heterozygous line derived from a recombi-nant inbred line. Theor. Appl. Genet. 110: 634–639.
Yano, M., and T. Sasaki, 1997 Genetic and molecular dissection ofquantitative traits in rice. Plant Mol. Biol. 35: 145–153.
Yeadon, P. J., F. J. Bowring and D. E. A. Catcheside, 2004 Alleles ofthe hotspot cog are codominant in effect on recombination in thehis-3 region of neurospora. Genetics 167: 1143–1153.
Fine Mapping of a Rice Grain-Width QTL 2251

Yoon, D. B., K. H. Kang, H. J. Kim, H. G. Ju, S. J. Kwon et al.,2006 Mapping quantitative trait loci for yield componentsand morphological traits in an advanced backcross populationbetween Oryza grandiglumis and the O. sativa japonica cultivarHwaseongbyeo. Theor. Appl. Genet. 112: 1052–1062.
Zhang, Q. F., 2007 Strategies for developing Green Super Rice.Proc. Natl. Acad. Sci. USA 104: 16402–16409.
Zhang, Q. F., B. Z. Shen, X. K. Dai, M. H. Mei, M. A. S. Maroof et al.,1994 Using bulked extremes and recessive class to map genes
for photoperiod-sensitive genic male sterility in rice. Proc. Natl.Acad. Sci. USA 91: 8675–8679.
Zhao, Z. G., C. M. Wang, L. Jiang, H. Ikehashi and J. M. Wan,2006 Identification of a new hybrid sterility gene in rice (Oryzasativa L.). Euphytica 151: 331–337.
Communicating editor: A. H. Paterson
2252 X. Wan et al.