quantitative radiobiology for treatment...
TRANSCRIPT

Quantitative radiobiology for treatment evaluation

TG-166: biological models discussed
w The linear-quadratic (L-Q) model • to account for fractionation and dose-rate effects
w Effective volume, effective dose, and generalized equivalent uniform dose (gEUD) models • to account for volume effects on radiobiological response
w Tumor control probability (TCP) and normal tissue complication probability (NTCP) models
w The use of these models in commercial treatment planning systems

Comparison of rival treatment plans
w Visual inspection of isodose distributions (2D, 3D) • highly subjective
w Visual comparison of DVHs • fairly subjective
w Quantitative measures of plan “quality” from DVH • Dmin, Dmax, D90, D100, V90, V100, etc. • Veff, Deff, EUD • TCPs, NTCPs

Visual inspection of isodose plans
Four plans for comparison: • photons + electrons • 5-field photons • 5-field IMRT • 9-field IMRT

Comparison of tumor DVHs (from Andrzej Niemierko, ASTRO, 2001)
Median dose = 63.7 Gy for both plans

Some quantitative measures to go by
IMRT: most uniform (lower standard deviation), higher V90, but lower D100 AP-PA: higher D100, but lower V90 and also higher Dmax
Plan D90 D100 V90 V100 Range (Gy)
Std. dev. (Gy)
IMRT 59Gy 30Gy 94% 50% 30 - 65 2.5
AP-PA 57Gy 55Gy 83% 50% 55 - 73 3.5

But which is the better plan?
w Need to consider both tumor and normal tissue DVHs
w Want good coverage of the target, low Dmax to normal tissues, and low volume of normal tissues receiving doses close to “tolerance”

Can the DVH be reduced to a single “biologically relevant” number?
w Yes, if we have a volume-effect model of dose response • most common is the power-law model

Power-law volume-effect models (they have been around for a long time and we
still use them today)

General power-law model Dv = D1.v-n
where Dv is the dose which, if delivered to fractional volume, v, of an organ, will produce the same biological effect as dose D1 given to the whole organ
This is the basis of many present-day biological treatment planning methods

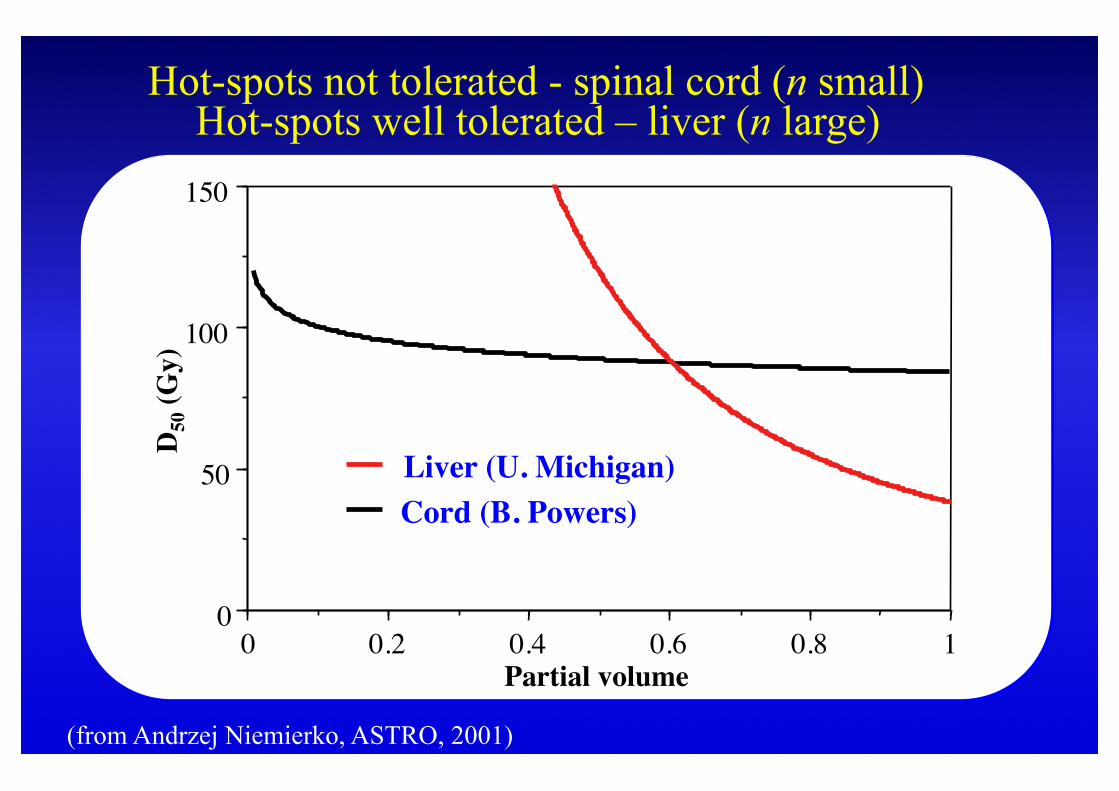
What does the volume effect exponent “n” mean?
w n is negative for tumors w n is positive for normal tissues w n = 0 means that cold spots in tumors or hot spots
in normal tissues are not tolerated w n = 1 means that isoeffect doses change linearly
with volume w n large means that cold spots in tumors or hot
spots in normal tissues are well tolerated
0
50
100
150
0 0.2 0.4 0.6 0.8 1
D50
(Gy)
Partial volume
Hot-spots not tolerated - spinal cord (n small)
Liver (U. Michigan) Cord (B. Powers)
Hot-spots well tolerated – liver (n large)
(from Andrzej Niemierko, ASTRO, 2001)

Two methods to get a single number to represent a DVH
As a very simple demonstration, a two-step DVH is reduced to one step:
Kutcher & Berman: effective volume at maximum dose, Veff
Lyman & Wolbarst: effective dose to whole (or reference) volume, Deff

Mohan et al expression for Deff (1992)
where Vi is the subvolume irradiated to dose Di, Vtot is the total volume of the organ or tissue, and n is the tissue-specific volume-effect parameter in the power-law model
Mohan et al called this the “effective uniform dose”

The EUD equation (Niemierko, 1999)
Niermierko renamed Deff the Equivalent Uniform Dose EUD (originally defined only for tumors in 1997 but extended to all tissues in 1999 and initially called it the generalized EUD, or gEUD)
where vi is the volume of the tissue in dose bin Di as a fraction of the volume of the total organ or tumor i.e. vi = Vi/Vtot Note that EUD is identical to Deff, of Mohan et al with a = 1/n
a
i
aiiDvEUD
/1
⎥⎦
⎤⎢⎣
⎡= ∑

Tumors
Normal tissues
(from Andrzej Niemierko, ASTRO, 2001)

EUD – Tumors (from Andrzej Niemierko, ASTRO, 2001)
5%
0.5D50
90%
D50
5%
1.5D50
Cold Spot Hot Spot
Tumor a EUD/D50
% TCP(%) (γ50=2)
Breast -7.2 74 8

TCP & NTCP: logistic model (from Andrzej Niemierko, ASTRO, 2001)
(N )TCP =1
1+EUD50EUD
⎡
⎣ ⎢
⎤
⎦ ⎥
4γ 50
0
0.5
1
(N)T
CP
Dose (EUD) EUD50

EUD – Tumors (from Andrzej Niemierko, ASTRO, 2001)
5%
0.5D50
90%
D50
5%
1.5D50
Cold Spot Hot Spot
Tumor a EUD/D50
(%) TCP(%) (γ50=2)
Breast -7.2 74 8
Melanoma -10 67 4
Chordoma -13 63 2
−∞ 50 <1

EUD - Normal Structures (from Andrzej Niemierko, ASTRO, 2001)
5%
0.5D5
90%
D5
5%
1.5D5
Cold Spot Hot Spot
Structure a EUD/D5
(%) NTCP(%) (γ50=4)
Liver 0.6 99 4.6
Lung 1 100 5
Heart 3.1 103 7
Brain 4.6 105 10
Spinal cord 14 122 55
+∞ 150 >95

Optimization w The objective is to develop the treatment plan
which will deliver a dose distribution that will ensure the highest TCP that meets the NTCP constraints imposed by the radiation oncologist
w This will usually be close to the peak of the probability of uncomplicated local control (PULC) curve

Nasopharynx: comparison of conventional (2-D) with non-coplanar (3-D) techniques
Kutcher, 1998
Probability of uncomplicated local control (PULC) given by: PULC =TCP(1-NTCP)

Creating a Score function for plan optimization or plan evaluation
(from Andrzej Niemierko, ASTRO, 2001)
!
DVH
!
EUD
!
(N)TCP
!
DVH3
!
EUD3
!
(N)TCP3
!
DVH2
!
EUD2
!
(N)TCP2
!
Score = TCPi( )wi
i
#targets
" 1- NTCPk( )wk
k
#normal
"
EUD used to optimize treatment plans
According to AAPM TG Report 166: “incorporating EUD-based cost functions into inverse planning
algorithms for the optimization of IMRT plans may result in improved sparing of
OARs without sacrificing target coverage”

DVH data can be used directly without calculation of EUDs: the NTCP probit-based model
The Pinnacle TP system uses the Kutcher and Burman DVH reduction method to calculate the effective volume υeff

Another example: TCPs calculated using the Poisson statistics model
According to Poisson statistics, if a number of patients with similar tumors are treated with a certain regimen, the probability of local control, which is the probability that no cancer cells will survive, is given by:
where Nm is the mean number of cancer cells surviving
in any patient

Poisson statistics model (cont’d.) Then, if the average number of cancer cells in
each patient’s tumor before treatment is N0, and the mean surviving fraction of cells after treatment is Sm:

Which is better for optimization, EUD or TCP/NTCP?
“Although both concepts can be used interchangeably for plan optimization, the EUD has the advantage of fewer model parameters, as compared to
TCP/NTCP models, and allows more clinical flexibility”
(AAPM TG 166 Report)

TG 166 conclusion “A properly calibrated EUD model
has the potential to provide a reliable ranking of rival treatment plans and is most useful when a clinician needs to select the best
plan from two or more alternatives”
NTCP and TCP calculations: effect of dose/fraction
w Since biological effects are a function of dose/fraction, EUD, NTCP and TCP calculations need to take this into account
w One way to do this is to transform all doses within the irradiated volume to “effective” doses at some standard dose/fraction e.g. 2 Gy, before calculation of the TCP or NTCP
w This may be done using the linear-quadratic model

The 2 Gy/fraction equivalent dose

Alternatively could use the LQ model directly: TCP calculations using Poisson statistics
According to the Poisson statistics model: where, using the L-Q model:

Want more on calculation of TCPs?
Try reading: “Tumor control probability in
radiation treatment” by Marco Zaider and Leonid
Hanin, Med. Phys. 38, 574 (2011)

Biological models used in treatment planning systems
w Monaco • Tumor: Poisson statistics cell kill model • Normal tissues: EUD
w Pinnacle • Tumor: LQ-based Poisson TCP model; EUD • Normal tissues: Lyman-Kutcher NTCP model; EUD
w Eclipse • Tumor: LQ-based Poisson TCP model; EUD • Normal tissues: LQ-based Poisson NTCP model;
Lyman-Kutcher NTCP model

Do we know what parameters to use?
w Yes, well, kind of! w At least we are close for normal tissues due to the
QUANTEC initiative stimulated by the AAPM w QUANTEC: Quantitative Analyses of Normal
Tissue Effects in the Clinic • development of large data bases • model evaluation and data analysis • publication of best-fit models and parameters

Summary w Biological models can be used for treatment
planning, optimization, and evaluation w Power-law volume effect models are used
extensively w Inhomogeneous dose distributions, possibly
corrected for the effect of fractionation, can be reduced to a single number, the EUD, TCP, NTCP, or PULC

Final slide Can we compare rival treatment plans?
Yes, Dr. Padovani, if you multiply the EUD by α, subtract from this EUD2 multiplied by β, and then subtract the number you 1st
thought of, you can compare treatment plans perfectly