quantitative mapping of patented technology — the case of
TRANSCRIPT

Technological Forecasting & Social Change 77 (2010) 466–478
Contents lists available at ScienceDirect
Technological Forecasting & Social Change
Quantitative mapping of patented technology — The case of electricalconducting polymer nanocomposite
Pei-Chun Lee a,b,1, Hsin-Ning Su b,⁎, Feng-Shang Wu a,2
a Graduate Institute of Technology and Innovation Management, National Chengchi University, No. 64, Sec. 2, Chih-nan Rd. Wenshan, Taipei, 116, Taiwanb Science and Technology Policy Research and Information Center, National Applied Research Laboratories, 14 F., No. 106, Sec. 2, He-Ping E. Rd., Taipei, 106, Taiwan
a r t i c l e i n f o
⁎ Corresponding author. Tel.: +886 2 27377173; faE-mail addresses: [email protected] (P.-C. Lee
1 Science and Technology Policy Research and InfoTaiwan. Tel.: +886 2 27377176; fax: +886 2 273778
2 Tel.: +886 2 29393091 #81127.
0040-1625/$ – see front matter © 2009 Elsevier Inc.doi:10.1016/j.techfore.2009.08.006
a b s t r a c t
Article history:Received 3 June 2009Received in revised form 24 August 2009Accepted 26 August 2009
This study aims to obtain global technology evolution by constructing and analyzing patentcitation network and patent citation map for the field of electrical conducting polymernanocomposite. A total of 1421 patents are retrieved from USPTO patent database and patentcitation network is established by combing both patent citation and social network analysis.Network properties, e.g. Degree Centrality, Betweenness Centrality, and Closeness Centrality,are calculated for representing several technology evolution mechanisms that first proposed inthis study. Also, a distance-based patent citation map is constructed by calculating relativedistances and positions of patents in the patent citation network. Quantitative ways ofexploring technology evolution are investigated in this study to unveil important or emergingtechniques as well as to demonstrate dynamics and visualization of technology evolutions.
© 2009 Elsevier Inc. All rights reserved.
Keyword:Network analysisTechnology evolutionMappingPatent citationQuantitative analysis
1. Introduction
1.1. Mapping knowledge evolution by bibliometric analysis
Kuhn published “The structure of scientific revolution” [1] and popularized the terms “paradigm” and “paradigm shift”. Dosi [2]investigated technology trajectory on the basis of paradigm shift and found continuous innovation can be regarded as proceedingsof technology paradigm, while discontinuous innovation might be the initiation of a new paradigm. The differentiation betweencontinuous innovation and discontinuous innovation may be positive for understanding initiation of a new paradigm as well asposition and diffusion of a specific technology or knowledge. A lot of methodologies have been proposed and applied into variousknowledge fields for understanding or mapping their technology development paradigms. However, what usually used for thispurpose is bibliometric analysis on patents or scientific papers by way of text mining and statistics, keyword-based approach orcitation-based approach.
Kostoff has very complete and systematic studies on literature-related analysis and publishes a series of papers based oncombination of text mining and statistics on scientific papers, also he proposes a systematic Literature-related discovery methodfor linking two or more literature concepts that have heretofore not been linked, in order to produce novel, interesting, plausible,and intelligible knowledge [3–19].
Attempts have been made to explore ways of mapping knowledge evolution. Keyword-based analysis as a type of co-wordanalysis [20,21]started to play an important role in understanding the dynamics of knowledge development [22]. Ding et al.
x: +886 2 27377838.), [email protected] (H.-N. Su), [email protected] (F.-S. Wu).rmation Center, National Applied Research laboratories, 14 F., No. 106, Sec. 2, He-Ping E. Rd., Taipei, 10638.
All rights reserved.
,
467P.-C. Lee et al. / Technological Forecasting & Social Change 77 (2010) 466–478
mapped information retrieval research by using co-word analysis on papers collected from Science Citation Index (SCI) and SocialScience Citation Index (SSCI) for the period1987–1997 [23]. Baldwin et al.mapped ethics anddementia researchby using keywords[24]. Tian et al. used Institute for Scientific Information (ISI) database to measure scientific output of the field of GeographicInformation System (GIS) by using keywords [25]. Similar approaches have beenmade tomap knowledge evolution in other fields,such as software engineering [26], chemistry [27], scientometrics [28], neural network research [29,30], biological safety [31],optomechatronics [32], bioeletronics [33], adverse drug reactions [34,35], biotechnology [36,37], environmental science [38],condensedmatter physics [39], etc., and even this keyword-based analysis has been applied to investigation of a phenomenon or amore specific topic such as severe acute respiratory syndrome (SARS) and tsunami [40,41], and Parkinson's disease [42].
However, the above mentioned methodologies are all based on keyword analysis which provides less sense of knowledgeaccumulation over time or limited understanding on causal interpretation of human knowledge development. Therefore, citation-based analyses have been alsowidely investigated by researchers to avoid the abovementioned problemand facilitate bibliometricanalysis on accumulated knowledge. For example, Kajikawa has utilized citation analysis on SCI papers together with clusteringcitation network actors to understand structural change of sustainable energy [43], biomass and bio-fuels [44] and organic LED [45].
1.2. Mapping patented technology by patent citation
It has long been a very critical part of human knowledge system that patent and scientific publications are two most significantways of disclosing science and technology progress in the society. Former publications can be served as important references or basesfor later publication, in this way human knowledge can be gradually accumulated to sustain and expand knowledge system. Theimportant featuring characteristic of patent and scientific publication for knowledge accumulation is their citations showing whichformer literatures have been contributed to this paper/patent and providing the context of knowledge accumulation. A number ofresearches have noted that patent citations trace out technological building relationships among inventions [46,47]. Also, citation hasbeen widely used in bibliometric study to evaluate technology development, research performance, and even map knowledgeevolution or technological trajectory. For instance, Acosta investigated the links between science and technology based on an analysisof scientific citations in patent documents to study in greater depth the relationship between science and technological developmentin thevarious regionsof Spain [48], Hall et al. suggested thatof all patent related indicators, patent citation is amore adequate indicatorto evaluate market value [49], Stuart and Podolny used patent citations to measure firms' technological niches and niche shifts [50].
Otte and Rousseau studied citation network, utilized as a type of social interaction networks, by the use of social network analysis,and calculate network property to discover how information can be disseminated among actors [51], and Liebowitz indicated thepossibility of mapping knowledge flows and measuring relationships among actors in a network [52]. Accordingly, this study aims touse the alternative citation-based method to avoid the problem of lacking causal knowledge accumulation if only keywords areconsidered in theanalysis, andreap reward fromthewell-assigned citations in structuredpatentdocuments for drawinganoverviewofhow electrical conducting polymer nanocomposite technology is evolved. In summary, patent citation information allows the buildingof patent linkageswhich eventually lead to a patent citation network as awhole. The constructed patent citation network, with patentsas network nodes (actors) and patent citation as network ties, allows quantitative analysis on patent citation network by calculatingnetwork properties, e.g. Degree Centrality, Betweenness Centrality, and Closeness Centrality. In this sense, mechanism of knowledgeflow or technology evolution mechanism, e.g. technology convergence, technology diffusion, etc., can be quantitatively analyzed.
However, a lot of similar attempts have beenmade to obtain technology development contexts by patent citation analysis [43–45,47], the purpose of this study is not to use conventional method to investigate a new technology domain, but to extend fromconventional patent citation network research to a more systematic process of patented technology evaluation together withconverting 3-dimensional citation network to a 2-dimensional patent map which can be more easily interpreted by human eyes.The quantitative 2-dimensional map provides a quick way, which is much easier than complex equations or theories, for people todirectly perceive technological change through human eyes.
2. Research method
2.1. Initial patent sampling
This research selects nanocomposite material as research target to draw its patent citation network. Patents with “nano” and“composite” appeared in title or abstract of patents are retrieved from USPTO (Patent retrieval time: Jun. 11, 2008). The retrievedpatents are carefully reviewed to remove those which are not closely related to nanocomposite material, and finally a total of 672patents are remained as “initial patent” in this study.
2.2. The development of technology–function matrix
The obtained 672 patents are critically analyzed and classified into two dimensions: 1) technological dimension based on thematrix material disclosed in patents, i.e. Polymer, Clay, Ceramic, Metal, etc., and 2) functional dimension based on the function ofinvented techniques, i.e.Mechanical and dimensional stability, Permeability, Thermal stability, Flame retardancy, Chemical resistance,Surface appearance, Electrical conductivity, Optical and light emitting property, Cement/adhesivity, Magnetic property, etc. (Table 1).Validation is done by comparing the content of classified patents with multiple sources and through informal interviews withmembers of the expert panel. It is worth noted that one single patent may disclose more than one matrix material or more than one

mji=1
Table 1Initial 672 patents classification on the basis of material and functions.
Matrix material
Polymer Clay Ceramic Metal Other Total
Function Mechanical and dimensional stability 176 4 59 35 11 285Permeability 52 1 1 0 1 55Thermal stability 70 1 16 13 3 103Flame retardancy 19 0 0 0 1 20Chemical resistance 17 0 5 4 4 30Surface appearance 6 0 2 0 1 9Electrical conductivity 69 a 0 28 30 21 148Optical and light emitting property 77 0 19 10 15 121Cement/adhesivity 7 0 1 0 0 8Magnetic property 10 0 7 28 0 45Other 56 2 20 19 23 120Total 503 6 138 120 57 824
a Research target selected in this study.
468 P.-C. Lee et al. / Technological Forecasting & Social Change 77 (2010) 466–478
function, one patent thus can be categorized intomore than one classification, so the total patent count in Table 1 is 824 instead of theoriginal 672. The classification of “other” in both matrix and function in Table 1 are either some other materials or functions notconsidered in this study, or more than threematrices or functions are disclosed in one single patent trying to reduce the specificity ofits disclosed matrix or function. The obtained technology–function matrix shown in Table 1 provides an overview, or a so-called“patent map”, for the development of nanocomposite material. Subsequently, this research selects 69 patents with the technology of“polymer” matrix and function of “electrical conductivity” to meet the requirement of the research target set in this study.
2.3. Network patent sampling
After classification of technology and function, the 69 patents with polymer matrix and function of electrical conductivity areused as primary patents based on which their backward citation patents and forward citation patents are retrieved from USPTOdatabase as the secondary patents which are upstream patents and downstream patents of the primary patents, respectively. Byexamining upstream and downstream patents, a technological context of what upstream patents contribute to primary patentsand what downstream patents are contributed by primary patents can be understood and the underlying knowledge flows canthus be analyzed. In summary, this research uses 1) primary patents: the 69 patents with polymermatrix and function of electricalconductivity, and 2) secondary patents: 690 backward citation patents of the 69 primary patents and 716 forward citation patentsof the 69 primary patents, as actors of the patent citation network to be drawn in this study. The total number of obtained patentsis 1421 instead of 1475 (the sum of primary patents and secondary patents) after removal of duplicated count (some patentsbelong to both primary and secondary patents). The 1421 patents are defined as “network patents” and are therefore treated asnetwork actors (node), along with the network ties built by patent citation linkages, a patent citation network for understandingthe development context of electrical conducting polymer nanocomposite can be achieved.
2.4. Patent citation network and network property calculation
After construction of the patent citation network, network property is subsequently calculated. In social network theory,“Centrality” is a key network property to estimate how easy an actor retrieves or controls resources from the network. Freemanproposed three ways of measuring network centrality, Degree Centrality, Betweenness Centrality, and Closeness Centrality [53].The higher centrality indicates more associations with actors in a network. Brass and Burkhardt [54] pointed out the highercentrality of a person in a social network, the more power s/he possesses from the viewpoint of organizational behavior. Thisresearch also uses the three ways of measurement for obtaining centrality of patented technology in order to understand theimportance, influence, diffusivity and convergency of a patented technology.
2.4.1. Degree CentralityNetwork nodes (actor) which directly linked to a specific node are in the neighborhood of that specific node. The number of
neighbors is defined as nodal degree, or degree of connection. Granovetter suggested nodal degree is proportional to probability ofobtaining resource [55]. Nodal degree represents to what degree a node (actor) participates the network, this is a basic concept formeasuring centrality.
InDegree Centrality: the number of time that patent i is cited by other patents. The higher InDegree Centrality, the more timesthat patent i is cited, meaning the higher momentum of knowledge diffusion from patent i to other patents.
d ið Þ =Xj
mji
if patent i is cited by patent j.

469P.-C. Lee et al. / Technological Forecasting & Social Change 77 (2010) 466–478
OutDegree Centrality: the number of times that patent i cites other patents. The higher OutDegree Centrality, the more timesthat patent i cites other patents, meaning the higher momentum of knowledge convergence from other patents to patent i.
mij=1
dij:the
d ið Þ =Xj
mij
if patent i cites patent j.
2.4.2. Betweenness CentralityThe concept of betweenness is a measure of how often an actor is located on the shortest path (geodesic) between other actors
in the network. Those actors located on the shortest path between other actors are playing roles of intermediary that help any twoactors without direct contact reach each other indirectly. Actors with higher Betweenness Centrality are those located at the coreof the network.
b ið Þ =Xj;k≠1
gjikgjk
gjk : the shortest path between patent (actor) j and patent k.gjik : the shortest path between patent j and patent k that contains patent i.
2.4.3. Closeness CentralityThe Closeness Centrality of an actor is defined by the inverse of the average length of the shortest paths to/from all the other
actors in the network. Higher Closeness Centrality indicates higher influence on other actors. In a directed network, ClosenessCentrality can be divided into InClosenesss Centrality and OutCloseness Centrality.
InCloseness Centrality: the shortest path from other patents to patent i, the higher InCloseness Centrality, the higher influenceof patent i on other patents.
c ið Þ =XNj=1
1dji
shortest path from patent j to patent i.
dji:theOutCloseness Centrality: the shortest path from patent i to other patents, the higher OutCloseness Centrality, the easier forpatent i to be influenced by other patents.
c ið Þ =XNj=1
1dij
shortest path from patent i to patent j.
2.5. Concordance between network properties and technology evolution mechanisms
The previously mentioned network properties can be used as indicators for characterizing technology evolution context, andtherefore quantitative analysis on the evolution context can be obtained. In this study,we propose the applications of the five networkproperties on evaluating evolution contexts for electrical conducting nanocomposite technology, namely the concordance betweennetwork properties and technology evolution mechanisms, which provides a quantitative approach toward evolution mechanism:
(1) InDegree Centrality: the number of times that a patent is cited, it can be used as an indicator to measure knowledge flowfrom one target patent to later patents. Because of its implication of knowledge diffusion, InDegree Centrality is defined asan indicator to measure momentum of technology diffusion.
(2) OutDegree Centrality: the number of times that a patent cites other patent(s), it can be used as an indicator to measureknowledge flow received by a target patent. Because of its implication of knowledge convergence, OutDegree Centrality isdefined as an indicator to measure momentum of technology convergence.
(3) Betweenness Centrality: how often an actor is located on the shortest path (geodesic) between other actors in the network.Therefore, Betweenness is defined as an indicator to measure momentum of technology transition.
(4) InCloseness Centrality: the shortest path fromother patent(s) to a target patent. The shorter path, the stronger the target patentinfluences other patent(s). InCloseness Centrality is therefore defined as an indicator to measure momentum of influence.
(5) OutCloseness Centrality: the shortest path from a target patent to other patent(s). The shorter path, the stronger the targetpatent is influenced by other patent(s). OutCloseness Centrality is therefore defined as an indicator to measure momentumof being influenced.
Even though the five network properties represents five mechanisms of technology evolution. Patents with higher centralitiesare those located closer to the core of a target research field, or they can be called the core patents. But the idea of “core” relies onwhich of the five above indicators is used.

470 P.-C. Lee et al. / Technological Forecasting & Social Change 77 (2010) 466–478
2.6. Constructing distance-based patent citation map
In this study, a patent citationmap is obtainedby calculating relative positions anddensity of network actors in a two-dimensionmap on the basis of network constructed previously. We use algorithm proposed by van Eck and Waltman's in 2007 [35].
1) Actor position: the positions of network actors in the map are based on visualization of similarities. If there are totally n actors,a two-dimensional map where the actor 1–n are positioned in a way that the distance between any pair of actor i and j reflectstheir association strengths aij as accurately as possible, i.e. distance between i and j is proportional to aij, van Eck andWaltman's algorithm is used to minimize a weighted sum of the squared Euclidean distance between all pairs of actors, theobjective function to be minimized is given as below:
E x1;…; xnð Þ =Xi<j
aijjjxi − xjjj2
Where the vector xi=(xi1,xi2) denotes the location of actor i in a two-dimensional space and ||•|| denotes the Euclidean norm.
2) Actor density: actor density at a specific location in a map has to be calculated. The actor density is calculated by first placing akernel function at each actor location and taking a weighted average of the kernel function.
The actor density at location x=(x1, x2) is given by
D xð Þ = 1
h2Pni=1
cii
Xi=1
ciiKx1 − xi1
h;x2 − xi2
h
� �
Where K denotes a kernel function and h denotes a smoothing parameter. Cii denotes the number of occurrence of actor I and x=(x1, x2) denotes the location of actor i in themap. The kernel functionK is a non-increasingGaussian kernel function given by
K t1; t2nð Þ = 12π
exp − t21 + t222
!
3. Results and discussion
The selection of paper or patent used for discovering development trend will fundamentally lead to different results. Therelation between paper and patent has long been subject to debate. However, instead of analyzing the interplay between paperand patent, this study aims to shed light on the use of patent as a technological system for understanding technological trends aswell as propose a systematic and quantitative method for the patent-based mapping.
Fig. 1. Patent count by countries.

Table 2Top 20 standard industrial classifications for 1069 network patent.
Ranking Standard Industrial Classification (SIC) SIC code Patent count
1 Electronic components and accessories and communications equipment 366–367 2132 Professional and scientific instruments 38 (except 3825) 1973 Rubber and miscellaneous plastics products 30 1224 Industrial inorganic chemistry 281 1125 Miscellaneous chemical products 289 1056 Paints, varnishes, lacquers, enamels, and allied products 285 957 Plastics materials and synthetic resins 282 808 Electrical industrial apparatus 362 629 Industrial organic chemistry 286 4110 Stone, clay, glass and concrete products 32 3711 Textile mill products 22 3612 Miscellaneous electrical machinery, equipment and supplies 369 3313 Special industry machinery, except metal working 355 2614 General industrial machinery and equipment 356 2315 All other SICs 99 1616 Electrical lighting and wiring equipment 364 1517 Fabricated metal products 34 (except 3462, 3463, and 348) 1418 Drugs and medicines 283 919 Primary and secondary non-ferrous metals 333–336, 339 (except 3399), and 3463 920 Agricultural chemicals 287 8
Data source: this study, (USPTO UPC to SIC concordance, 2008).
Fig. 2. Patent citation network for electrical conducting polymer nanocomposite for 1952–1991.
471P.-C. Lee et al. / Technological Forecasting & Social Change 77 (2010) 466–478
3.1. Initial patent analysis
According to the technology and functionmatrix shown in Table 1, in terms of technology, most patents disclosed nanocompositematerialwithpolymermatrix (503patents) and subsequently ceramicmatrix (138patents). In termsof function,most patents are for
472 P.-C. Lee et al. / Technological Forecasting & Social Change 77 (2010) 466–478
mechanical and dimensional stability (285 patents), and then electrical conductivity (148 patents), and optical and light emittingproperty (121 patents). This research aims to study electrical conducting polymer nanocomposite, so the 69 patents with technologyof “polymer” matrix and function of “electrical conductivity” are selected as primary patents for subsequent investigation.
3.2. Network patent analysis
For all the obtained 1421 network patents, countries with the most patents are US (1129 patents), Japan (143 patents),Germany (32 patents), Korea (23 patents), and UK (18 patents). This reveals that electrical conducting polymer nanocompositerelated technologies are mainly located in the US, Japan, and Europe but US is much more significant than other countries (Fig. 1).
If 1421 network patents are classified by Standard Industrial Classification) (USPTO UPC to SIC concordance, 2008) [56], asshown in Table 2, there are 213 patents in no. 1 classification (electronic components and accessories and communicationsequipment), 197 patents in no. 2 classification (professional and scientific instruments), and 122 patents in no. 3 classification(rubber and miscellaneous plastics products). The sum of classification no. 1, 2 and 3 is more than one third of the total 1421network patents. This implies the strong application of electrical conducting polymer nanocomposite on electric instrument, andthe emerging nanotechnology combined with conventional nanocomposite material bring great influences on electroniccomponents or scientific instrument.
3.3. Patent citation network analysis
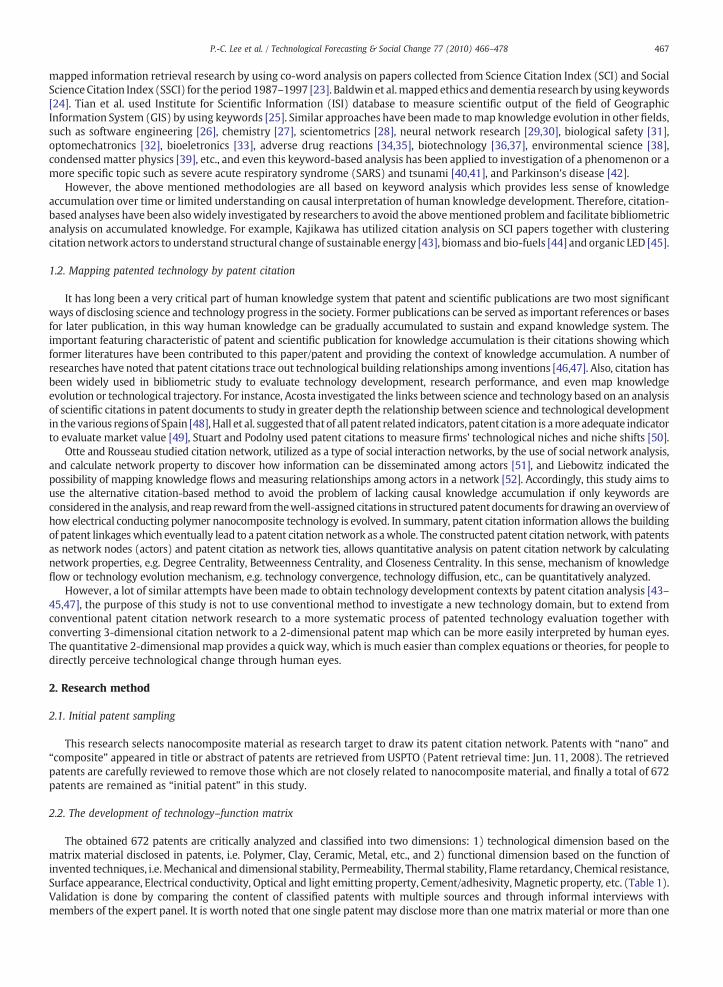
3.3.1. Network visualizationThe patent citation network composed of 1421 patents and 1705 patent citation relationships are plotted by computer, shown
in Figs. 2–4 for patents filed on different time period (note: patents which act as isolated node/actors without any networking are
Fig. 3. Patent citation network for electrical conducting polymer nanocomposite for 1952–2000.

473P.-C. Lee et al. / Technological Forecasting & Social Change 77 (2010) 466–478
not shown in figures). Each node represents a patent and each network tie with arrow represents a citation relationship. Thepatents pointed by arrows of the network ties are cited by those located at the other end of the network ties. In Fig. 2, patentcitation network based on patents filed in the period 1952–1991 is plotted and only several patents are networked together andpresented a simple radial structure. In Fig. 3, more patents are networked for the period 1952–2000 but still several separatedclusters can be observed. In Fig. 4, networking is fully matured and almost all patents are networked together for the total timeperiod 1952–2008 in this study.
3.3.2. Network properties calculationAccording to aforementioned method of calculating network properties, network properties, i.e. Betweenness Centrality,
InCloseness Centrality, OutCloseness Centrality, InDegree Centrality and OutDegree Centrality of each network node arecalculated. Fig. 5 shows the average of Betweenness Centrality, OutDegree Centrality and InDegree Centrality for each year.Significant peaks around the period of 1984 and 1992, 1997–2001 indicate important time periods for development of relatedtechnology. After 1992, network becomes more mature. The similar peak positions for Between Centrality curve and InDegreeCentrality curve suggests technology diffusion and technology transition are closely associated with each other.
Network properties (InDegree Centrality, OutDegree Centrality, and Betweenness Centrality) for each country are alsoaveraged to determine how significant a country contributes to the development of technology. As shown in Fig. 6, US, Taiwan, andKorea are the three countries with the highest Betweenness Centralities. Antilles, Ireland, and US are the three countries with thetop three InDegree Centralities, and Israel, Canada, and Korea are the three countries with the top three OutDegree Centralities.However, since each country possesses different number of patents, statistical bias for countries with limited number of patents ispossible.
Table 3 shows patents with top 10 network properties. These patents with top network properties are core patents or keytechnologies that are classified by aforementioned momentums of technology development, i.e. technology diffusion, technology
Fig. 4. Patent citation network for electrical conducting polymer nanocomposite for 1952–2008.

Fig. 6. InDegree Centrality, Outdegree Centrality, Betweenness Centrality for each country.
Fig. 5. Average of Betweenness Centrality, Outdegree Centrality and InDegree Centrality for each year.
474 P.-C. Lee et al. / Technological Forecasting & Social Change 77 (2010) 466–478
convergence, influence, being influenced, and technology transition. Patents listed in Table 3 are completely filed by the USassignees. Endicott Interconnect Technologies, Zyvex Performance Materials, Minnesota Mining and Manufacturing Co., andHyperion Catalysis International are top companies that own most patents in Table 3, indicating their important roles as coreactors in this technology field.
3.3.3. 2-dimensional mappingThe patent citation map with country as actor is shown in Fig. 7 (Color gradient from blue to red indicates low to high actor
density) where two separate domains reflecting distribution pattern of global techniques. The two domains dominated by the twocountries with highest number of patents— the US and Japan. Where the US can be seen as the technology leader of countries ofBelgium, Netherlands, Sweden, South Africa, Austria, China, Netherlands Antilles, Australia, India, Switzerland, and Ireland. On the

Table 3Patents with top 10 network properties
InDegree Centrality —
momentum of technologydiffusion
OutDegree Centrality —
momentum of technologyconvergence
InCloseness Centrality —
momentum ofinfluence
OutCloseness Centrality —
momentum of beinginfluenced
Betweenness Centrality —
momentum of technologytransition
Ranking Patent no. Patent no. Patent no. Patent no. Patent no.
1 4663230 7217754 7025607 7025607 53384302 5278020 6616794 7235745 7235745 52780203 5589152 7265174 7384856 7384856 52387294 5338430 6495208 7429510 7429510 53874625 5238729 6986853 7449381 7449381 46632306 5334292 6194099 7241496 7241496 61940997 6205016 6762237 7244407 7244407 53342928 5387462 5338430 7296576 7296576 66167949 5986206 5238729 7344691 7344691 598620610 5938934 5387462 7479516 7479516 6205016
Fig. 7. 2-dimensional patent citation map with country as actor.
475P.-C. Lee et al. / Technological Forecasting & Social Change 77 (2010) 466–478
other hand, Japan can be regarded as technology leader of Great Britain, Israel, Korea,Mexico, Italy, France, Finland, and Taiwan. TheUS easily becomes the leading country of patented technologies due to its advantage of Sci-Tech resources and, of course, the largenumber of patents in very many aspects. But surprisingly, it is positive to see the clear boundary between the two domains led bydifferent countries. This indicates positive technological diversification required for diverse ways of contribution to this society.

Fig. 8. 2-dimensional patent citation map with country as patent as actor.
476 P.-C. Lee et al. / Technological Forecasting & Social Change 77 (2010) 466–478
The patent citation map with patent (shown as patent number) as actor in the map is shown in Fig. 8. A total of 113 patentswith InDegree equal to or larger than 2 are selected to construct the map where relative distance between any pair of actors anddensity of InDegree for each actor can be visualized. Fig. 8 shows patents uniformly occupy different spots of the map and form abig continent, unlike isolated islands in Fig. 7, indicating well-distributed or highly concentrated patented techniques in thistechnology field.
4. Conclusion
Social network analysis on patent citation is demonstrated in this study to explore how patented technology development canbe evolved from a patent citation network which visually represents the essential structure of technology evolution. Also, thelinkages between the five different mechanisms of technology evolution and the five network properties, namely the concordancebetween technology evolution mechanisms and network properties, are defined and proposed in this study in order to provide aquantitative approach toward understanding technology evolutionmechanisms for electrical conducting polymer nanocompositetechnology. A patented technique plays multiple roles and shows different levels of importance in terms of the proposed five typesof mechanism. The evolution mechanism represented by network property is a function of time in the overall technologydevelopment. Therefore, by calculating patents' network properties at different time points, a dynamic and quantitativeunderstanding of technology evolution can be obtained.
According to the large number of patents in top 3 SICs in Table 2, it can be speculated that electrical conducting polymernanocomposites are significantly applied on electric instrument, and the emerging nanotechnology combined with conventionalnanocomposite material brings great influences on electronic components or scientific instrument.
The similar peak positions for Between Centrality curve and InDegree Centrality curve in Fig. 5 suggest technology diffusion andtechnology transition are closely associated together. Table 3 shows top centrality patents in one type of network property are

477P.-C. Lee et al. / Technological Forecasting & Social Change 77 (2010) 466–478
easily to be top centrality again in other type of network properties. This suggests each mechanism of technology evolution doesnot happen alone but is supposed to be more or less associated to other type of mechanisms. In other words, critical patents arelikely to be important in several aspects of technology evolution mechanisms.
It is found that 1984 and 1992, 1997–2001 are the important years for the development of electrical conducting polymernanocomposite. US, Europe, Canada, Japan, Korea and Taiwan are major countries in this field. According to Standard IndustryClassification, the largest portion of these patents is electronic components and scientific instruments. Endicott InterconnectTechnologies, Zyvex Performance Materials, Minnesota Mining and Manufacturing Co., and Hyperion Catalysis International arecore companies in electrical conducting polymer nanocomposite industry.
The length of a network tie in Figs. 2–4 is calculated for better visualization and has nothing to do with any network property.However, the length of a network tie can be proportional to similarity between two patents at both ends of a network tie, so itwould be desirable to calculate similarity of two linked patents. For example, by calculating occurrence of same keyword in thetwo patents, and the obtained similarity can be used as the attribute of network tie. Text mining technique can possibly be appliedon patents in each separated sub-domains in Figs. 2–4 to understand the differences among sub-domains, so deeper insight abouthow technology is evolved in each sub-domain can be employed in future study.
The 2-dimensional patent citation maps with country or patent as actor are shown in Figs. 7 and 8. This allows astraightforward view of the whole development of selected technology, and provides a quick idea of how the global technologyhas been developed, or a so-called knowledge map for positioning every patented technique in the patent citation map. However,this study only demonstrates the construction of patent citation map by the use of overall patents without considering timehorizon. A dynamic map is also possible if we plot the 2-dimensional patent citation map for every year so the development overtime can be observed.
In Summary, this study provides a way of patent evaluation and understanding technology development context in asystematic manner which facilitates more efficient technologymanagement. Systematic methodologies involving citation analysishave been investigated in the field of technology forecast [57–59], but this study focuses more on systematic patent analysis and2-dimensional visualization on the basis of conventional methods, and then demonstrates a systematic and quantitative way foranalyzing and evaluating patented techniques by integrating basic patent statistics, technology–function classification, standardindustrial classification, patent citation, network properties calculation and two-dimensional mapping. All of these contributeto a systematic approach for obtaining an overview of large amount of selected patents, more importantly this paper providesa quantitative way of evaluating patent and thus a computerized calculation is possible for potential quantitative applicationse.g. R&D resource allocation, research performance evaluation, patent valuation, 2-dimensinol patent map visualization etc.
References
[1] T.S. Kuhn, J. Dewey, O. Neurath, The Structure of Scientific Revolutions, University of Chicago Press, Chicago, 1970.[2] G. Dosi, Technological paradigms and technological trajectories: a suggested interpretation of the determinants and directions of technical change, Res. Policy
11 (1982) 147–162.[3] R.N. Kostoff, H.J. Eberhart, D.R. Toothman, Database tomography for technical intelligence: a roadmap of the near-earth space science and technology
literature, Inf. Process. Manag. 34 (1998) 69–85.[4] R.N. Kostoff, R. Tshiteya, K.M. Pfeil, J.A. Humenik, Electrochemical power text mining using bibliometrics and database tomography, J. Power Sources 110
(2002) 163–176.[5] R.N. Kostoff, R. Tshiteya, K.M. Pfeil, J.A. Humenik, G. Karypis, Power source roadmaps using bibliometrics and database tomography, Energy 30 (2005)
709–730.[6] R.N. Kostoff, J. Antonio del R'ıo, H.D. Cortés, C. Smith, A. Smith, C.Wagner, L. Leydesdorff, G. Karypis, G. Malpohl, R. Tshiteya, The structure and infrastructure of
Mexico's science and technology, Technol. Forecast. Soc. Change 72 (2005) 798–814.[7] R.N. Kostoff, Literature-related discovery (LRD): introduction and background, Technol. Forecast. Soc. Change 75 (2) (2008) 165–185.[8] R.N. Kostoff, Literature-related discovery (LRD): potential treatments for cataracts, Technol. Forecast. Soc. Change 75 (2) (2008) 215–225.[9] R.N. Kostoff, S. Bhattacharya, M. Pecht, Assessment of China's and India's science and technology literature—introduction, background, and approach, Technol.
Forecast. Soc. Change 74 (9) (2007) 1519–1538.[10] R.N. Kostoff, D. Johnson, C.A. Bowles, S. Bhattacharya, A.S. Icenhour, K. Nikodym, R.B. Barth, S. Dodbele, Assessment of India's Research Literature, Technol.
Forecast. Soc. Change 74 (2007) 1574–1608.[11] R.N. Kostoff, M.B. Briggs, R.L. Rushenberg, C.A. Bowles, A.S. Icenhour, K.F. Nikodym, R.B. Barth, M. Pecht, Chinese science and technology—structure and
infrastructure, Technol. Forecast. Soc. Change 74 (2007) 1539–1573.[12] R.N. Kostoff, M.B. Briggs, R.L. Rushenberg, C.A. Bowles, M. Pecht, D. Johnson, S. Bhattacharya, A.S. Icenhour, K. Nikodym, R.B. Barth, Comparisons of the
structure and infrastructure of Chinese and Indian Science and Technology, Technol. Forecast. Soc. Change 74 (2007) 1609–1630.[13] R.N. Kostoff, R.G. Koytcheff, C.G. Lau, Global nanotechnology research literature overview, Technol. Forecast. Soc. Change 74 (2007) 1733–1747.[14] R.N. Kostoff, J.A. Block, J.L. Solka, M.B. Briggs, R.L. Rushenberg, J.A. Stump, D. Johnson, T.J. Lyons, J.R. Wyatt, Literature-related discovery (LRD): lessons learned,
and future research directions, Technol. Forecast. Soc. Change 75 (2) (2008) 276–299.[15] R.N. Kostoff, M.B. Briggs, J.L. Solka, R.L. Rushenberg, Literature-related discovery (LRD): methodology, Technol. Forecast. Soc. Change 75 (2) (2008) 186–202.[16] R.N. Kostoff, M.B. Briggs, T.J. Lyons, Literature-related discovery (LRD): potential treatments for Multiple Sclerosis, Technol. Forecast. Soc. Change 75 (2) (2008)
239–255.[17] R.N. Kostoff, J.L. Solka, R.L. Rushenberg, J.A. Wyatt, Literature-related discovery (LRD): water purification, Technol. Forecast. Soc. Change 75 (2) (2008) 256–275.[18] R.N. Kostoff, M.B. Briggs, Literature-related discovery (LRD): potential treatments for Parkinson's disease, Technol. Forecast. Soc. Change 5 (2) (2008)
226–238.[19] R.N. Kostoff, Comparison of China/USA science and technology performance, Journal of Informetrics 2 (2008) 354–363.[20] J. King, A review of bibliometric and other science indicators and their role in research evaluation, J. Inf. Sci. 13 (1987) 261.[21] J. Law, J. Whittaker, Mapping acidification research: a test of the co-word method, Scientometrics 23 (1992) 417–461.[22] B.M. Gupta, S. Bhattacharya, A bibliometric approach towards mapping the dynamics of science and technology, DESIDOC Bul. Inf. Technol. 24 (2004) 3–8.[23] Y. Ding, G.G. Chowdhury, S. Foo, Bibliometric cartography of information retrieval research by using co-word analysis, Inf. Process. Manag. 37 (2001)
817–842.[24] C. Baldwin, J. Hughes, T. Hope, R. Jacoby, S. Ziebland, Ethics and dementia: mapping the literature by bibliometric analysis, Int. J. Geriatr. Psychiatry 18 (1) (2003)
41–54.

478 P.-C. Lee et al. / Technological Forecasting & Social Change 77 (2010) 466–478
[25] Y. Tian, C. Wen, S. Hong, Global scientific production on GIS research by bibliometric analysis from 1997 to 2006, Journal of Informetrics 2 (2008) 65–74.[26] N. Coulter, I. Monarch, S. Konda, Software engineering as seen through its research literature: a study in co-word analysis, J. Am. Soc. Inf. Sci. 49 (1998).[27] M. Callon, J.P. Courtial, F. Laville, Co-word analysis as a tool for describing the network of interactions between basic and technological research: the case of
polymer chemistry, Scientometrics 22 (1991) 155–205.[28] J.P. Courtial, A coword analysis of scientometrics, Scientometrics 31 (1994) 251–260.[29] E.C.M. Noyons, A.F.J. Van Raan, Monitoring scientific developments from a dynamic perspective: self-organized structuring to map neural network research,
J. Am. Soc. Inf. Sci. 49 (1) (1998) 68–81.[30] A.F.J. Van Raan, R.J.W. Tijssen, The neural net of neural network research: an exercise in bibliometric mapping, Scientometrics 26 (1993) 169–192.[31] A. Cambrosio, C. Limoges, J.P. Courtial, F. Laville, Historical scientometrics? Mapping over 70 years of biological safety research with coword analysis,
Scientometrics 27 (1993) 119–143.[32] E.C.M. Noyons, A.F.J. van Raan, Bibliometric cartography of scientific and technological developments of an R & D field, Scientometrics 30 (1994) 157–173.[33] S. Hinze, Bibliographical cartography of an emerging interdisciplinary discipline: the case of bioelectronics, Scientometrics 29 (1994) 353–376.[34] F. Rikken, H.A.L. Kiers, R. Vos, Mapping the dynamics of adverse drug reactions in subsequent time periods using INDSCAL, Scientometrics 3 (1995) 367–380.[35] A. Clarke, M. Gatineau, M. Thorogood, N. Wyn-Roberts, Health promotion research literature in Europe 1995–2005, Eur. J. Public Health 17 (2007) 24.[36] A. Rip, J.P. Courtial, Co-word maps of biotechnology: an example of cognitive scientometrics, Scientometrics 6 (1984) 381–400.[37] M.A. De Looze, J. Lemarié, Corpus relevance through co-word analysis: an application to plant proteins, Scientometrics 39 (1997) 267–280.[38] Y.S. Ho, Bibliometric analysis of adsorption technology in environmental science, J. Environ. Prot. Sci. 1 (2007) 1–11.[39] S. Bhattacharya, P.K. Basu, Mapping a research area at the micro level using co-word analysis, Scientometrics 43 (1998) 359–372.[40] W.T. Chiu, J.S. Huang, Y.S. Ho, Bibliometric analysis of severe acute respiratory syndrome-related research in the beginning stage, Scientometrics 61 (2004)
69–77.[41] W.T. Chiu, Y.S. Ho, Bibliometric analysis of tsunami research, Scientometrics 73 (2007) 3–17.[42] T. Li, Y.S. Ho, C.Y. Li, Bibliometric analysis on global Parkinson's disease research trends during 1991–2006, Neurosci. Lett. 441 (2008) 248–252.[43] Y. Kajikawa, J. Yoshikawa, Y. Takeda, K. Matsushima, Tracking emerging technologies in energy research: toward a roadmap for sustainable energy, Technol.
Forecast. Soc. Change 75 (2008) 771–782.[44] Y. Kajikawa, Y. Takeda, Structure of research on biomass and bio-fuels: a citation-based approach, Technol. Forecast. Soc. Change 75 (2008) 1349–1359.[45] Y. Kajikawa, Y. Takeda, Citation Network Analysis of Organic LEDs, Technol. Forecast. Soc. Change 76 (2009) 1115–1123.[46] A.B. Jaffe, M. Trajtenberg, R. Henderson, Geographic localization of knowledge spillovers as evidenced by patent citations, Q. J. Econ. (1993) 577–598.[47] S.B. Chang, K.K. Lai, S.M. Chang, Exploring technology diffusion and classification of business methods: using the patent citation network, Technol. Forecast.
Soc. Change 76 (2009) 107–117.[48] M. Acosta, D. Coronado, Science–technology flows in Spanish regions—an analysis of scientific citations in patents, Res. Policy 32 (2003) 1783–1803.[49] B.H. Hall, A. Jaffe, M. Trajtenberg, Market value and patent citations, Rand J. Econ. (2005) 16–38.[50] T.E. Stuart, J.M. Podolny, Local search and the evolution of technological capabilities, Strateg. Manage. J. 17 (1996) 21–38.[51] E. Otte, R. Rousseau, Social network analysis: a powerful strategy, also for the information sciences, J. Inf. Sci. 28 (2002) 441.[52] J. Liebowitz, Linking social network analysis with the analytic hierarchy process for knowledge mapping in organizations, J. Knowl. Manag. 9 (2005) 76–86.[53] L.C. Freeman, Centrality in social networks: conceptual clarification, Social networks 1 (1979) 215–239.[54] D.J. Brass, M.E. Burkhardt, Centrality and power in organizations, Networks and organizations: Structure, form and action 191 (1992) 215.[55] M.S. Granovetter, The strength of weak ties, Am. J. Sociol. 78 (1973) 1360.[56] Concordance Between the U.S. Patent Classification (USPC) System and the Standard Industrial Code (SIC) System, Patent Technology Monitoring Division
(PTMD) Research Publications, Jun. 2008.[57] D. Zhu, A.L. Porter, Automated extraction and visualization of information for technological intelligence and forecasting, Technol. Forecast. Soc. Change 69
(2002) 495–506.[58] A.L. Porter, QTIP: quick technology intelligence processes, Technol. Forecast. Soc. Change 72 (2005) 1070–1081.[59] T.U. Daim, G. Rueda, H. Martin, P. Gerdsri, Forecasting emerging technologies: use of bibliometrics and patent analysis, Technol. Forecast. Soc. Change 73
(2006) 981–1012.
Pei-Chun Lee is a Ph.D. student in Graduate Institute of Technology and Innovation Management, National Chengchi University, Taiwan, and also an assistantresearcher of Science and Technology Policy Researcher and Information Center, National Applied Research Laboratories, Taiwan. She receivedMBA from GraduateInstitute of Technology and Innovation Management, National Chengchi University, Taiwan. Her research interests are Science and Technology Policy, InnovationSystem, Social Network Analysis and Knowledge Map, aiming to investigate policy and management strategy for national and global science and technologydevelopment.
Feng-Shang Wu is an Associate Professor at the Graduate Institute of Technology and Innovation Management at National Chengchi University in Taiwan. Hereceived an MSc in Chemical Engineering from Texas Tech University and an MBA and a PhD in Management from Rensselaer Polytechnic Institute, USA.Previously, he has also served as a consultant to several government agencies and high technology corporations in Taiwan. His main teaching and research areasare R&D and innovation management, technological forecasting and assessment, and university-industry cooperation.
Hsin-Ning Su is an associate researcher of Science and Technology Policy Researcher and Information Center, National Applied Research Laboratories, Taiwan. Hereceived Ph.D. in Material Science and Engineering from Illinois Institute of Technology and M.S. in Chemistry from National Taiwan University. His researchinterests are Science and Technology Policy, Innovation System, Social Network Analysis and Knowledge Evolution, aiming to understand evolutionary mechanismof scientific and technological development.