quantitative effectiveness indicator (qei) 1 – course success rate
TRANSCRIPT

Crafton Hills College Educational Master Planning Committee Quantitative Effective Indicators (QEIs)
1 of 17 Prepared by Keith Wurtz Date: 20100126, Revised: 20100226 QEI7_0809.doc
Quantitative Effectiveness Indicator (QEI) 1 – Course Success Rate
Overall Course Success. Success rate is defined as earning a grade of A, B, C, or CR/P
divided by the number of grades on record (A, B, C, D, F, CR/P, NC/NP, W or I) in any
course where students earn a grade on record (GOR). The GOR represents the
number of students enrolled at census.
Developmental/Basic Skills Course Success. Developmental/basic skills course
success refers to the success rate in courses coded as “B” (basic skills) as identified in
the CB08, Course-Basic-Skills-Status field in MIS or courses in math, reading, or
English considered to be developmental courses (see Appendix C).
Transfer Course Success. Transfer course success refers to the success rate in
courses with a transfer status of “A” (transferable to both UC and CSU) or “B”
(transferable to CSU only). The field in MIS is CB05, Course-Transfer-Status. Also
includes courses identified by CHC as transferable to some but not all CSUs and UCs.
(Refer to Appendix A for a list of the transferable courses.)
Career Technical Education (CTE) Course Success. CTE course success refers to the
success rate in courses with an occupational code of “B” (advanced occupational) or “C”
(clearly occupational) and a credit status code of “D” (credit – degree applicable) or “C”
(credit – not degree applicable). The corresponding fields in MIS are CB09, Course-
SAM-Priority-Code, and CB04, Course-Credit-Status. (Refer to Appendix B for a list of
the CTE courses.)
Figure 1. QEI 1 – Course Success Rate by Academic Year from 2004 – 2005 to 2008 –
2009.
0.0%
20.0%
40.0%
60.0%
80.0%
100.0%
2004-05 2005-06 2006-07 2007-08 2008-9
Academic Year
Su
cc
es
s R
ate
CTE
Transfer
Overall
Developmental

Crafton Hills College Educational Master Planning Committee Quantitative Effective Indicators (QEIs)
2 of 17 Prepared by Keith Wurtz Date: 20100126, Revised: 20100226 QEI7_0809.doc
Table 1: QEI 1 – Course Success Rate by Academic Year from 2004 – 2005 to 2008 – 2009.
Success 2004-05 2005-06 2006-07 2007-08 2008-09
# N % # N % # N % # N % # N %
CTE 4,798 6,015 79.8 5,669 6,892 82.3 6,356 7,698 82.6 6,009 7,542 79.7 6,179 7,705 80.2
Transfer 15,209 21,710 70.1 14,901 21,456 69.4 15,350 22,372 68.6 16,198 23,099 70.1 19,144 26,977 71.0
Developmental 2,433 4,338 56.1 2,336 4,132 56.5 2,611 4,515 57.8 2,961 5,065 58.5 3,511 5,753 61.0
Overall 21,714 31,027 70.0 21,465 30,452 70.5 22,799 32,497 70.2 23,493 33,360 70.4 26,888 37,696 71.3 Note. “#” refers to the number of successful grades, “N” refers to the number of GOR, and “%” is the number of successful grades divided by the number of GOR.
Table 1A: Possible Five Year Goals using the Five Year Average Success Rate as a Baseline.
Success 5 Year Average
.10 Effect Size*
ARCC Peer Group
High
Five Year Course Success Rates
Mean when Exclude
Highest**
Mean when exclude lowest
& highest**
Maintain/Reach Success Rate
# N % Lowest Highest
CTE 29,011 35,852 80.9 84.5% 85.4% 26.7% 100.0% 80.3% 80.7% 80.0% Transfer 80,802 115,614 69.9 74.4% NA 26.7% 100.0% 73.3% 73.4% Developmental 13,852 23,803 58.2 63.0% 65.9% 48.5% 100.0% 68.7% 69.9% Overall 116,359 165,032 70.5 75.1% NA 26.7% 100.0% 75.5% 75.6% 73.4%
Note. “#” refers to the number of successful grades, “N” refers to the number of GOR, and “%” is the number of successful grades divided by the number of GOR. Excluding the courses with less than 10 GOR lowered the mean average success rate from what was reported previously in three areas: The number of records excluded because of the number of GOR ranged from 1 – 46 in each of the four success rate areas. Yellow – recommended ambitious but reasonable five year goal. Where possible, preference was given to success rates generated at Crafton. *The Effect Size (ES) goal was set by identifying a .10 effect size increase in each retention rate. A .10 effect size corresponds to a Pearson r of .05. The effect size represents the magnitude of the difference between the target and the baseline measure. Using an effect size increases the likelihood that the difference is not only statistically significant but practical as well. **Every course with 100% success or retention rate was excluded when calculating the mean average.

Crafton Hills College Educational Master Planning Committee Quantitative Effective Indicators (QEIs)
3 of 17 Prepared by Keith Wurtz Date: 20100126, Revised: 20100226 QEI7_0809.doc Prepared by Keith Wurtz Date: 20100126 QEI_0809.doc
Quantitative Effectiveness Indicator (QEI) 2 – Course Retention Rate
Overall Course Retention. Retention rate is defined as earning a grade of A, B, C, D, F,
CR/P, NC/NP, or I) divided by the number of grades on record (GOR; A, B, C, D, F,
CR/P, NC/NP, W or I) in any course where students earn a grade on record (GOR).
The GOR represents the number of students enrolled at census.
Developmental/Basic Skills Course Retention. Developmental/basic skills course
retention refers to the retention rate in courses coded as “B” (basic skills) as identified in
the CB08, Course-Basic-Skills-Status field in MIS or courses in math, reading, or
English considered to be developmental courses (see Appendix C).
Transfer Course Retention. Transfer course retention refers to the retention rate in
courses with a transfer status of “A” (transferable to both UC and CSU) or “B”
(transferable to CSU only). The field in MIS is CB05, Course-Transfer-Status. Also
includes courses identified by CHC as transferable to some but not all CSUs and UCs.
(Refer to Appendix A for a list of the transferable courses.)
Career Technical Education (CTE) Course Retention. CTE course retention refers to the
retention rate in courses with an occupational code of “B” (advanced occupational) or
“C” (clearly occupational) and a credit status code of “D” (credit – degree applicable) or
“C” (credit – not degree applicable). The corresponding fields in MIS are CB09, Course-
SAM-Priority-Code, and CB04, Course-Credit-Status. (Refer to Appendix B for a list of
the CTE courses.)
Figure 2. QEI 2 – Course Retention Rate by Academic Year from 2004 – 2005 to 2008
– 2009.
0.0%
20.0%
40.0%
60.0%
80.0%
100.0%
2004-05 2005-06 2006-07 2007-08 2009-10
Academic Year
Rete
nti
on
Rate
CTE
Transfer
Overall
Developmental

Crafton Hills College Educational Master Planning Committee Quantitative Effective Indicators (QEIs)
4 of 17 Prepared by Keith Wurtz Date: 20100126, Revised: 20100226 QEI7_0809.doc
Table 2: QEI 2 – Course Retention Rate by Academic Year from 2004 – 2005 to 2008 – 2009.
Retention 2004-05 2005-06 2006-07 2007-08 2008-09
# N % # N % # N % # N % # N %
CTE 5,510 6,015 91.6 6,410 6,892 93.0 7,107 7,698 92.3 6,912 7,542 91.6 7,160 7,705 92.9
Transfer 18,404 21,710 84.8 18,485 21,456 86.2 18,981 22,372 84.8 20,030 23,099 86.7 23,530 26,977 87.2
Developmental 3,398 4,338 78.3 3,380 4,132 81.8 3,603 4,515 79.8 4,134 5,065 81.6 4,852 5,753 84.3
Overall 26,438 31,027 85.2 26,471 30,452 86.9 27,851 32,497 85.7 28,992 33,360 86.9 33,109 37,696 87.8 Note. “#” refers to the number of retained students, “N” refers to the number of GOR, and “%” is the number of retained students divided by the number of GOR.
Table 2A: Possible Five Year Goal using the Five Year Average Retention Rate as a Baseline.
Success 5 Year Average
.10 Effect Size*
ARCC Five Year Course Success Rates
Mean when Exclude
Highest**
Mean when exclude lowest
& highest**
Maintain/Reach retention rate
# N % Lowest Highest
CTE 33,099 35,852 92.3 94.7% Not available
for retention
55.0% 100.0% 89.2% 89.4% 92.0%
Transfer 99,430 115,614 86.0 89.3% 50.0% 100.0% 86.0% 86.2% 88.0%
Developmental 19,367 23,803 81.4 85.1% 70.5% 100.0% 86.1% 87.1%
Overall 142,861 165,032 86.6 89.7% 50.0% 100.0% 87.0% 87.1% 88.0% Note. “#” refers to the number of retention grades, “N” refers to the number of GOR, and “%” is the number of retention grades divided by the number of GOR. Excluding the courses with less than 10 GOR lowered the mean average retention rate from what was reported previously in three areas: The number of records excluded because of the number of GOR ranged from 1 – 46 in each of the four retention rate areas. Yellow – recommended ambitious but reasonable five year goal. Where possible, preference was given to retention rates generated at Crafton. *The Effect Size (ES) goal was set by identifying a .10 effect size increase in each retention rate. A .10 effect size corresponds to a Pearson r of .05. The effect size represents the magnitude of the difference between the target and the baseline measure. Using an effect size increases the likelihood that the difference is not only statistically significant but practical as well. **Every course with 100% success or retention rate was excluded when calculating the mean average.

Crafton Hills College Educational Master Planning Committee Quantitative Effective Indicators (QEIs)
5 of 17 Prepared by Keith Wurtz Date: 20100126, Revised: 20100226 QEI7_0809.doc Prepared by Keith Wurtz Date: 20100126 QEI_0809.doc
Quantitative Effectiveness Indicator (QEI) 3 – ARCC Persistence
ARCC Persistence (Fall to Fall). Percent of first-time students with a minimum of six
units earned in a Fall term and who returned and enrolled in a credit course the
subsequent Fall term anywhere in the system. Students who transferred to a four-year
institution or received an award prior to the subsequent Fall term are removed from the
cohort.
Figure 3. QEI 3 – Fall to Fall ARCC Persistence Rate from 2004 to 2007.
Table 3: QEI 3 – Fall to Fall ARCC Persistence Rate from 2004 to 2007.
Time Period Persistence
# N %
Fall 2004 to Fall 2005 457 679 67.3
Fall 2005 to Fall 2006 447 664 67.3
Fall 2006 to Fall 2007 484 724 66.9
Fall 2007 to Fall 2008 535 814 65.7 Note. “#” refers to the number of students who earned a GOR in the subsequent fall semester, “N” refers to the number of students
who earned a GOR in the initial fall semester, and “%” is the number of students who earned a GOR in the subsequent fall semester
divided by the number of students who earned a GOR in the initial fall semester.
Table 3A: Possible Baselines and Five Year Goals for Fall to Fall ARCC Persistence.
Time Period Persistence .10 Effect
Size*
ARCC
# N % Peer Mean Peer High
4 Year Average 1,923 2,881 66.7 71.2% 66.5% 74.6%
Fall 2007 to Fall 2008 535 814 65.7 70.3% 66.5% 74.6% Note. “#” refers to the number of students who earned a GOR in the subsequent fall semester, “N” refers to the number of students who earned a GOR in the initial fall semester, and “%” is the number of students who earned a GOR in the subsequent fall semester divided by the number of students who earned a GOR in the initial fall semester. Yellow – recommended ambitious but reasonable five year goal. *The Effect Size (ES) goal was set by identifying a .10 effect size increase in each persistence rate. A .10 effect size corresponds to a Pearson r of .05. The effect size represents the magnitude of the difference between the target and the baseline measure. Using an effect size increases the likelihood that the difference is not only statistically significant but practical as well.
Crafton Hills College Educational Master Planning Committee Quantitative Effective Indicators (QEIs)
6 of 17 Prepared by Keith Wurtz Date: 20100126, Revised: 20100226 QEI7_0809.doc Prepared by Keith Wurtz Date: 20100126 QEI_0809.doc
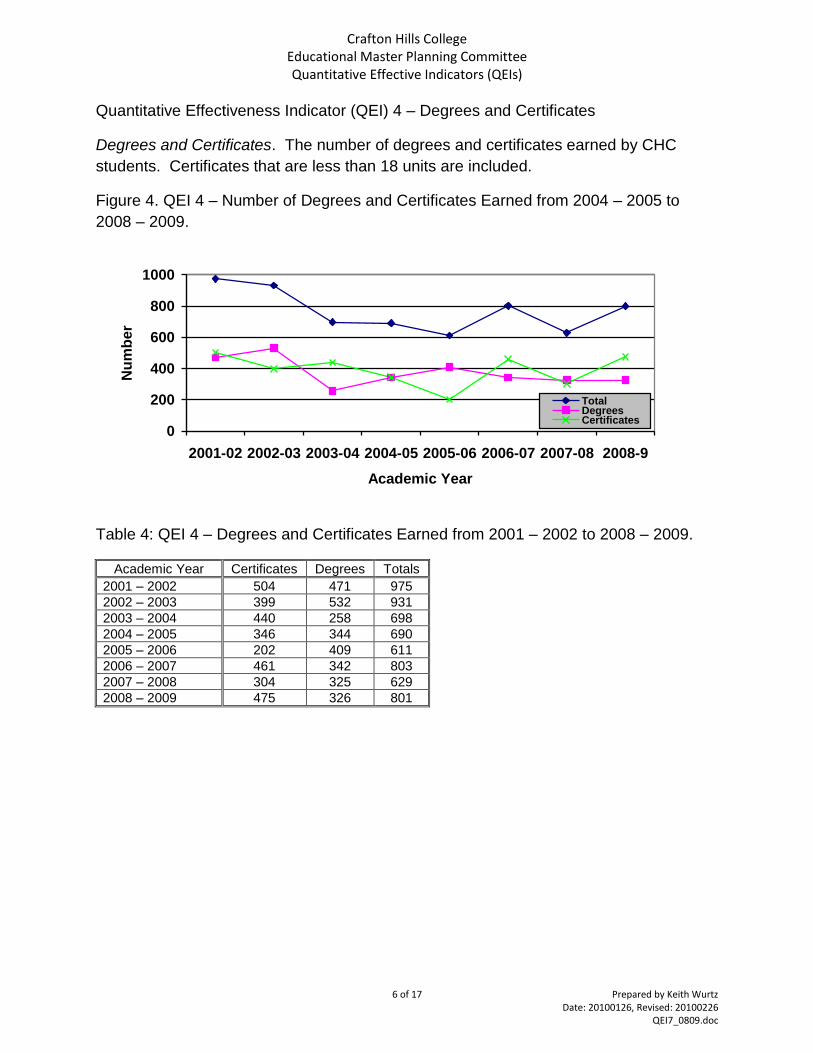
Quantitative Effectiveness Indicator (QEI) 4 – Degrees and Certificates
Degrees and Certificates. The number of degrees and certificates earned by CHC
students. Certificates that are less than 18 units are included.
Figure 4. QEI 4 – Number of Degrees and Certificates Earned from 2004 – 2005 to
2008 – 2009.
0
200
400
600
800
1000
2001-02 2002-03 2003-04 2004-05 2005-06 2006-07 2007-08 2008-9
Academic Year
Nu
mb
er
TotalDegreesCertificates
Table 4: QEI 4 – Degrees and Certificates Earned from 2001 – 2002 to 2008 – 2009.
Academic Year Certificates Degrees Totals
2001 – 2002 504 471 975
2002 – 2003 399 532 931
2003 – 2004 440 258 698
2004 – 2005 346 344 690
2005 – 2006 202 409 611
2006 – 2007 461 342 803
2007 – 2008 304 325 629
2008 – 2009 475 326 801

Crafton Hills College Educational Master Planning Committee Quantitative Effective Indicators (QEIs)
7 of 17 Prepared by Keith Wurtz Date: 20100126, Revised: 20100226 QEI7_0809.doc Prepared by Keith Wurtz Date: 20100126 QEI_0809.doc
Table 4A: Possible Baselines and Five Year Goals for Number of Degrees and
Certificates Earned.
Academic Year Certificates Degrees Totals Goal
3 Year Average 413 331 744 Maintain Current Level
5 Year Average 358 349 707
8 Year Average 391 376 767
Most recent year 475 326 801 800
Five Year Average as Baseline
.10 Effect Size 373 363 736
.20 Effect Size 387 377 764
Eight Year Average as Baseline
.10 Effect Size 407 391 798
.20 Effect Size 422 406 829
Most Recent Year as Baseline
.10 Effect Size 494 339 833
.20 Effect Size 516 352 865 Yellow – recommended ambitious but reasonable five year goal. *The Effect Size (ES) goal was set by identifying a .10 and a .20 effect size increase. A .10 effect size corresponds to a 4% increase on average and a .20 effect size corresponds to an 8% increase on average. The effect size represents the magnitude of the difference between the target and the baseline measure. Using an effect size increases the likelihood that the difference is not only statistically significant but practical as well.

Crafton Hills College Educational Master Planning Committee Quantitative Effective Indicators (QEIs)
8 of 17 Prepared by Keith Wurtz Date: 20100126, Revised: 20100226 QEI7_0809.doc Prepared by Keith Wurtz Date: 20100126 QEI_0809.doc
Quantitative Effectiveness Indicator (QEI) 5 – Transfer Rate
Transfer Rate. Percent of first-time Crafton Hills College (CHC) transfer students with a
minimum of 6 transferable units earned who attempted a transfer math or English
course within three years and who are shown to have transferred to a four-year
university as identified by the National Student Clearinghouse.
First-time CHC Transfer Student. The first term in which a student earned a GOR in the
SBCCD. A student was counted as a first-time college student if they earned a GOR in
the summer of fall semester of the initial cohort year at CHC. A student was counted as
earning six transferable units if they earned six transferable units in the three years of
the cohort (e.g.: 2002 – 2003 to 2004 – 2005). A student was counted as attempting a
transfer math or English course if they earned a GOR in any transfer math or English
course within the three years of the cohort. A first-time CHC transfer student earned
their first GOR at Crafton, completed six transferable units within three years, and
attempted a transfer math or English course within three years.
Figure 5. QEI 5 – Three Year Transfer Rate for Five Cohorts Ending in the following
Years: 2004 – 2005, 2005 – 2006, 2006 – 2007, 2007 – 2008, and 2008 – 2009.
0.0%
10.0%
20.0%
30.0%
40.0%
2002-03 to 2004-05 2003-04 to 2005-06 2004-05 to 2006-07 2005-06 to 2007-08 2006-07 to 2008-09

Crafton Hills College Educational Master Planning Committee Quantitative Effective Indicators (QEIs)
9 of 17 Prepared by Keith Wurtz Date: 20100126, Revised: 20100226 QEI7_0809.doc Prepared by Keith Wurtz Date: 20100126 QEI_0809.doc
Table 5: QEI 5 – Three Year Transfer Rate for Five Cohorts Ending in the following
Years: 2004 – 2005, 2005 – 2006, 2006 – 2007, 2007 – 2008, and 2008 – 2009.
Time Period Transfer Rate
# N %
2002-03 to 2004-05 507 1,936 26.2
2003-04 to 2005-06 567 1,997 28.4
2004-05 to 2006-07 576 1,970 29.2
2005-06 to 2007-08 540 1,929 28.0
2006-07 to 2008-09 588 2,084 28.2 Note. “#” refers to the number of students who transferred to a four-year institution as identified by the National Student Clearinghouse, “N” refers to the number of students who earned their first GOR at Crafton, completed six transferable units within three years, and attempted a math or English course within three years., and “%” is the number of students who transferred (i.e. “#”) divided by the number of students in the cohort (i.e.”N”).
Table 5A: Possible Baselines and Five Year Goals for the Transfer Rate.
Time Period Transfer Rate .10 Effect
Size* ARCC Six
Year CHC Rate # N %
5 Year Average 2778 9916 28.0 32.8% 31%
2006-07 to 2008-09 588 2,084 28.2 32.9% 31% Note. “#” refers to the number of students who transferred to a four-year institution as identified by the National Student Clearinghouse, “N” refers to the number of students who earned their first GOR at Crafton, completed six transferable units within three years, and attempted a math or English course within three years., and “%” is the number of students who transferred (i.e. “#”) divided by the number of students in the cohort (i.e.”N”). Yellow – recommended ambitious but reasonable five year goal. *The Effect Size (ES) goal was set by identifying a .10 effect size increase in each persistence rate. A .10 effect size corresponds to a Pearson r of .05. The effect size represents the magnitude of the difference between the target and the baseline measure. Using an effect size increases the likelihood that the difference is not only statistically significant but practical as well.

Crafton Hills College Educational Master Planning Committee Quantitative Effective Indicators (QEIs)
10 of 17 Prepared by Keith Wurtz Date: 20100126, Revised: 20100226 QEI7_0809.doc Prepared by Keith Wurtz Date: 20100126 QEI_0809.doc
Quantitative Effectiveness Indicator (QEI) 6 – Transfer Readiness Rate
Transfer Readiness. Percent of first-time Crafton Hills College (CHC) transfer students
with a minimum of 6 transferable units earned who attempted a transfer math or English
course within three years and who are shown to have completed 60 transferable units
with a 2.00 GPA and who have successfully completed transfer level math and English.
First-time CHC Transfer Student. The first term in which the student earned a GOR in
the SBCCD. A student was counted as a first-time college student if they earned a
GOR in the summer of fall semester of the initial cohort year at CHC. A student was
counted as earning six transferable units if they earned six transferable units in the
three years of the cohort (e.g.: 2002 – 2003 to 2004 – 2005). A student was counted as
attempting a transfer math or English course if they earned a GOR in any transfer math
or English course within the three years of the cohort. A first-time CHC transfer student
earned their first GOR at Crafton, completed six transferable units within three years,
and attempted a transfer math or English course within three years.
Figure 6. QEI 6 – Three Year Transfer Readiness Rate for Five Cohorts Ending in the
following Years: 2004 – 2005, 2005 – 2006, 2006 – 2007, 2007 – 2008, and 2008 –
2009.
0.0%
10.0%
20.0%
30.0%
2002-03 to 2004-05 2003-04 to 2005-06 2004-05 to 2006-07 2005-06 to 2007-08 2006-07 to 2008-09

Crafton Hills College Educational Master Planning Committee Quantitative Effective Indicators (QEIs)
11 of 17 Prepared by Keith Wurtz Date: 20100126, Revised: 20100226 QEI7_0809.doc Prepared by Keith Wurtz Date: 20100126 QEI_0809.doc
Table 6: QEI 6 – Three Year Transfer Readiness Rate for Five Cohorts Ending in the
following Years: 2004 – 2005, 2005 – 2006, 2006 – 2007, 2007 – 2008, and 2008 –
2009.
Time Period Transfer Readiness
# N %
2002-03 to 2004-05 92 1,936 4.8
2003-04 to 2005-06 109 1,997 5.5
2004-05 to 2006-07 91 1,970 4.6
2005-06 to 2007-08 109 1,929 5.7
2006-07 to 2008-09 141 2,084 6.8 Note. “#” refers to the number of students who transfer ready, “N” refers to the number of students who earned their first GOR at Crafton, completed six transferable units within three years, and attempted a math or English course within three years., and “%” is the number of students who transfer ready (i.e. “#”) divided by the number of students in the cohort (i.e.”N”).
Table 6A: Possible Baselines and Five Year Goals for the Transfer Readiness Rate.
Time Period Transfer Readiness .10 Effect
Size* ARCC Six
Year CHC Rate # N %
5 Year Average 542 9,916 5.5 8.1% 18.4%
2006-07 to 2008-09 141 2,084 6.8 9.6% 18.4% Note. “#” refers to the number of students who transfer ready, “N” refers to the number of students who earned their first GOR at Crafton, completed six transferable units within three years, and attempted a math or English course within three years., and “%” is the number of students who transfer ready (i.e. “#”) divided by the number of students in the cohort (i.e.”N”). Yellow – recommended ambitious but reasonable five year goal. *The Effect Size (ES) goal was set by identifying a .10 effect size increase in each persistence rate. A .10 effect size corresponds to a Pearson r of .05. The effect size represents the magnitude of the difference between the target and the baseline measure. Using an effect size increases the likelihood that the difference is not only statistically significant but practical as well.

Crafton Hills College Educational Master Planning Committee Quantitative Effective Indicators (QEIs)
12 of 17 Prepared by Keith Wurtz Date: 20100126, Revised: 20100226 QEI7_0809.doc Prepared by Keith Wurtz Date: 20100126 QEI_0809.doc
Quantitative Effectiveness Indicator (QEI) 9 – Productivity
Instructional. The productivity measure used for instruction is the Weekly Student
Contact Hours (WSCH) per Full Time Equivalent Faculty (FTEF) ratio. The WSCH
refers to the number of hours of student instruction conducted in a week during a
primary (fall or spring) term of an academic year. As an illustration, one student in a 3-
unit course generates 3 weekly contact hours (3 weekly hours * 1 student at census = 3
weekly contact hours), ten students generate 30 contact hours (3 weekly hours * 10
students at census = 30 weekly contact hours), thirty students generate 90 contact
hours (3 weekly hours * 30 students at census = 90 weekly contact hours), and thirty-
five students generate 105 weekly contact hours (3 weekly hours * 35 students at
census = 105 weekly contact hours).
FTEF refers to the load factor associated with each section assignment. As an
illustration, one weekly census 3-unit fall section that meets 3 hours a week is a load
factor of .20 or 20%. A full-time load in one primary term is considered to be 1 FTE or
five 3-unit sections. FTEF varies depending on the unit value of a course. The target
norm WSCH/FTEF ratio for community colleges is 525. Specifically, thirty-five students
in a 3 unit weekly census course generate a WSCH to FTEF ratio of 525 (3 * 35 = 105 /
.20 = 525).
Figure 9. QEI 9 – WSCH / FTEF ratio by Primary Term and Academic Year from 2005 –
2006 to 2009 – 2010.
400.00
500.00
600.00
2005-06 2006-07 2007-08 2008-9 2009-10
Academic Year
WS
CH
/ F
TE
F R
ati
o
FallSpringTotal
Crafton Hills College Educational Master Planning Committee Quantitative Effective Indicators (QEIs)
13 of 17 Prepared by Keith Wurtz Date: 20100126, Revised: 20100226 QEI7_0809.doc Prepared by Keith Wurtz Date: 20100126 QEI_0809.doc
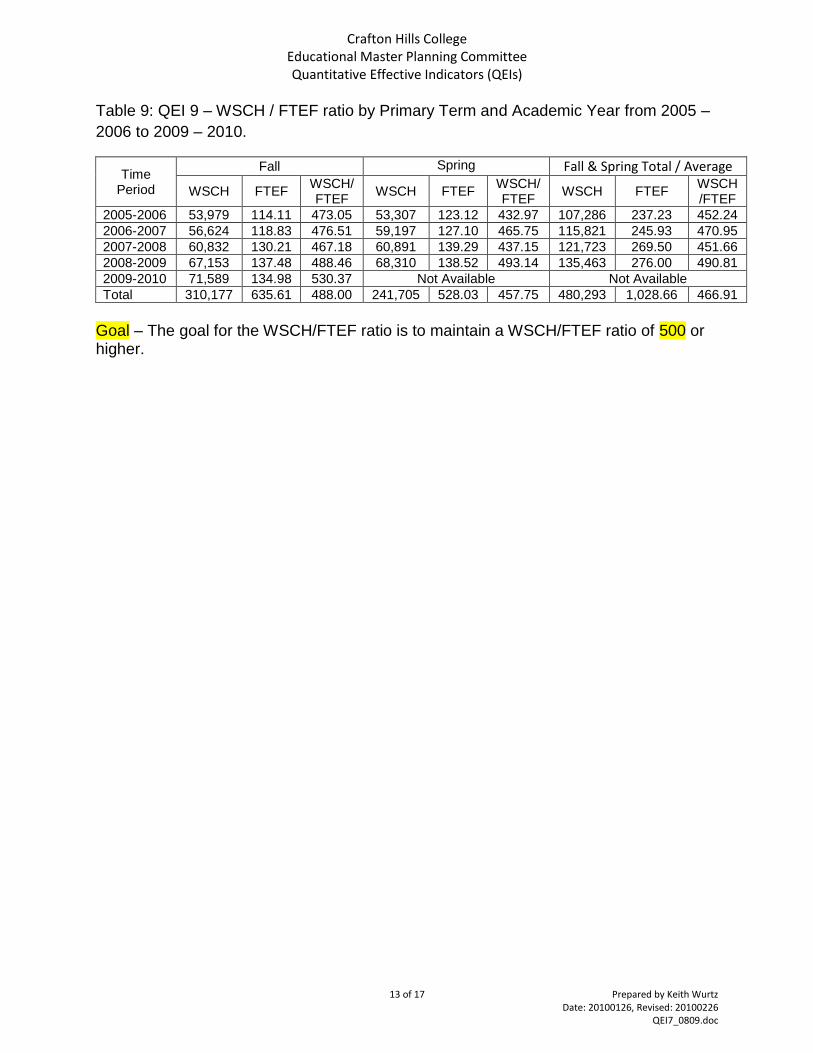
Table 9: QEI 9 – WSCH / FTEF ratio by Primary Term and Academic Year from 2005 –
2006 to 2009 – 2010.
Time Period
Fall Spring Fall & Spring Total / Average
WSCH FTEF WSCH/FTEF
WSCH FTEF WSCH/FTEF
WSCH FTEF WSCH/FTEF
2005-2006 53,979 114.11 473.05 53,307 123.12 432.97 107,286 237.23 452.24
2006-2007 56,624 118.83 476.51 59,197 127.10 465.75 115,821 245.93 470.95
2007-2008 60,832 130.21 467.18 60,891 139.29 437.15 121,723 269.50 451.66
2008-2009 67,153 137.48 488.46 68,310 138.52 493.14 135,463 276.00 490.81
2009-2010 71,589 134.98 530.37 Not Available Not Available Total 310,177 635.61 488.00 241,705 528.03 457.75 480,293 1,028.66 466.91
Goal – The goal for the WSCH/FTEF ratio is to maintain a WSCH/FTEF ratio of 500 or higher.
Crafton Hills College Educational Master Planning Committee Quantitative Effective Indicators (QEIs)
14 of 17 Prepared by Keith Wurtz Date: 20100126, Revised: 20100226 QEI7_0809.doc Prepared by Keith Wurtz Date: 20100126 QEI_0809.doc
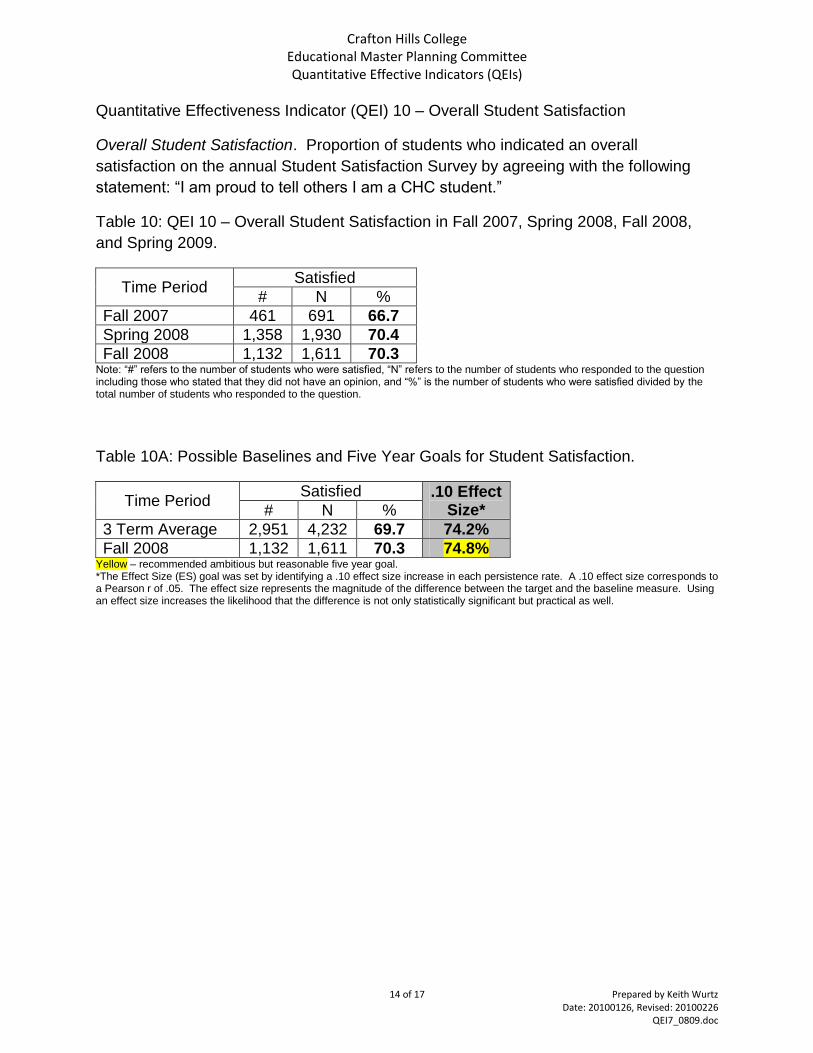
Quantitative Effectiveness Indicator (QEI) 10 – Overall Student Satisfaction
Overall Student Satisfaction. Proportion of students who indicated an overall
satisfaction on the annual Student Satisfaction Survey by agreeing with the following
statement: “I am proud to tell others I am a CHC student.”
Table 10: QEI 10 – Overall Student Satisfaction in Fall 2007, Spring 2008, Fall 2008,
and Spring 2009.
Time Period Satisfied
# N %
Fall 2007 461 691 66.7
Spring 2008 1,358 1,930 70.4
Fall 2008 1,132 1,611 70.3 Note: “#” refers to the number of students who were satisfied, “N” refers to the number of students who responded to the question including those who stated that they did not have an opinion, and “%” is the number of students who were satisfied divided by the total number of students who responded to the question.
Table 10A: Possible Baselines and Five Year Goals for Student Satisfaction.
Time Period Satisfied .10 Effect
Size* # N %
3 Term Average 2,951 4,232 69.7 74.2%
Fall 2008 1,132 1,611 70.3 74.8% Yellow – recommended ambitious but reasonable five year goal. *The Effect Size (ES) goal was set by identifying a .10 effect size increase in each persistence rate. A .10 effect size corresponds to a Pearson r of .05. The effect size represents the magnitude of the difference between the target and the baseline measure. Using an effect size increases the likelihood that the difference is not only statistically significant but practical as well.

Crafton Hills College Educational Master Planning Committee Quantitative Effective Indicators (QEIs)
15 of 17 Prepared by Keith Wurtz Date: 20100126, Revised: 20100226 QEI7_0809.doc Prepared by Keith Wurtz Date: 20100126 QEI_0809.doc
Appendix A Transferable Courses
ACCT-198 ASL-102 CHEM-123 ENGL-155 HIST-161 OCEAN-101 RELIG-110
ACCT-208 ASL-103 CHEM-150 ENGL-160 HIST-164 PCD-111 RELIG-135
ACCT-209 ASL-104 CHEM-151 ENGL-170 HIST-170 PE-263 RELIG-176
ACCT-210 ASTRON-150 CHEM-212 ENGL-226 HIST-171 PE/I-105X4 SOC-100
ACCT-211 ASTRON-160 CHEM-213 ENGL-232 INTDIS-101 PE/I-106X4 SOC-105
ACCT-220 BIOL-100 CIS-101 ENGL-250 INTDIS-140 PE/I-108X4 SOC-130
ACCT-221 BIOL-123 CIS-103 ENGL-260 INTDIS-200A PE/I-120X4 SOC-141
ACCT-224 BIOL-130 CIS-105 ENGL-261 JAPN-101 PE/I-127X4 SOC-150
ACCT-226 BIOL-131 CIS-109 ENGL-270 JAPN-102 PE/I-130X4 SPAN-101
ACCT-230A BIOL-247A CIS-111 ENGL-271 JOUR-120 PE/I-143X4 SPAN-102
ADJUS-101 BIOL-247B CIS-113 ENGL-275 JOUR-135 PE/I-148X4 SPAN-103
ADJUS-102 BIOL-248A CIS-114 FIRET-100 LIBR-100 PE/I-155X4 SPAN-104
ADJUS-103 BIOL-248B CIS-116 FIRET-101 MARKET-100 PE/I-159X4 SPEECH-100
ADJUS-104 BUSAD-100 CIS-117 FIRET-102 MARKET-110 PE/I-163X4 SPEECH-100H
ADJUS-105 BUSAD-105 CIS-118 FIRET-103 MARKET-198 PE/I-168X4 SPEECH-110
ADJUS-106 BUSAD-145 CIS-153 FIRET-104 MATH-102 PE/I-174X4 SPEECH-111
ADJUS-107 BUSAD-155 CIS-160 FIRET-106 MATH-103 PE/I-190X4 SPEECH-111H
ADJUS-108 BUSAD-198 CIS-162 FIRET-115 MATH-108 PE/I-200FX3 SPEECH-120
ADJUS-198 BUSAD-200 CIS-163 FIRET-116 MATH-115 PE/T-130X4 SPEECH-120H
AH-101 BUSAD-210 CIS-165 FIRET-118 MATH-117 PHIL-101 SPEECH-125
AH-198 BUSAD-230 CIS-165X3 FIRET-198 MATH-151 PHIL-103 SPEECH-135
ANAT-101 CD-100 CIS-166 FIRET-204 MATH-250 PHIL-105 SPEECH-140
ANAT-150 CD-105 CIS-168 FIRET-205 MATH-251 PHYSIC-100 SPEECH-145
ANAT-151 CD-111 CIS-175 FIRET-206 MATH-252 PHYSIC-110 SPEECH-155
ANAT-159X4 CD-112 CIS-184 FIRET-207 MATH-265 PHYSIC-111 SPEECH-174
ANAT-236A CD-115 CIS-198 FRENCH-101 MATH-266 PHYSIC-200 SPEECH-247A
ANAT-236B CD-126 CIS-203 FRENCH-102 MICRO-102 PHYSIC-201 THART-100
ANAT-236C CD-130 CIS-211 GEOG-110 MICRO-150 POLIT-100 THART-108
ANAT-237A CD-132 ECON-100 GEOG-110H MICRO-246A POLIT-102 THART-109
ANAT-238A CD-133 ECON-200 GEOG-111 MICRO-247A POLIT-104 THART-110
ANAT-246 CD-134 ECON-201 GEOG-119A MICRO-247X4 POLIT-110 THART-120
ANAT-247 CD-136 EDU-290 GEOG-120 MICRO-248A PSYCH-100 THART-130X4
ANAT-248 CD-137 EMS-103 GEOG-175 MICRO-248X4 PSYCH-100H THART-133
ANTHRO-100 CD-182 EMS-150 GEOL-100 MUSIC-100 PSYCH-102 THART-140X4
ANTHRO-102 CD-185 EMS-151 GEOL-100H MUSIC-101 PSYCH-103 THART-145X4
ANTHRO-106 CD-186 EMS-152 GEOL-101 MUSIC-102 PSYCH-108 THART-150X4
ANTHRO-107 CD-198 EMS-153 GEOL-112 MUSIC-103 PSYCH-110 THART-163X4
ANTHRO-110 CD-205X2 EMS-154 GEOL-113 MUSIC-120 PSYCH-111 THART-174X4
ART-100 CD-211 EMS-155 GEOL-160 MUSIC-132X4 PSYCH-112 THART-176X4
ART-102 CD-212 EMS-156 GEOL-175X4 MUSIC-134 PSYCH-116 THART-179X4
ART-105 CD-244 EMS-157 GEOL-246A MUSIC-135X4 PSYCH-117 THART-205
ART-120X4 CD-250 EMS-198 GEOL-246X4 MUSIC-140X4 PSYCH-118 THART-220
ART-124X4 CD-270 ENGL-101 GEOL-270X4 MUSIC-141X4 PSYCH-121 THART-221
ART-126X4 CD-271 ENGL-102 HEALTH-102 MUSIC-150X4 PSYCH-132 THART-225X4
ART-132X4 CD-272 ENGL-108 HEALTH-263 MUSIC-156X4 PSYCH-150 THART-226
ART-175X4 CD-295 ENGL-109 HIST-100 MUSIC-174X4 REALST-100 THART-246X4
ART-202X4 CHC-100 ENGL-120 HIST-101 MUSIC-175X4 RELIG-100
ART-247X4 CHEM-101 ENGL-127X4 HIST-135 MUSIC-179X4 RELIG-101
ASL-101 CHEM-102 ENGL-152 HIST-160 MUSIC-247X4 RELIG-101H

Crafton Hills College Educational Master Planning Committee Quantitative Effective Indicators (QEIs)
16 of 17 Prepared by Keith Wurtz Date: 20100126, Revised: 20100226 QEI7_0809.doc Prepared by Keith Wurtz Date: 20100126 QEI_0809.doc
Appendix B
CTE Courses
ACCT-105 CIS-105 EMS-160 FIRET-227BX3 FIRET-520 RADIOL-213A
ACCT-198 CIS-111 EMS-198 FIRET-228AX3 FIRET-521 RADIOL-213B
ACCT-208 CIS-113 EMS-921X20 FIRET-228BX3 FIRET-522 RADIOL-214
ACCT-209 CIS-114 ENGL-120 FIRET-228DX3 FIRET-523 RESP-051X4
ACCT-226 CIS-116 FIRET-049 FIRET-229CX3 FIRET-524 RESP-101
ADJUS-102 CIS-117 FIRET-080 FIRET-230CX3 FIRET-526 RESP-102
ADJUS-103 CIS-118 FIRET-081 FIRET-232BX3 FIRET-528 RESP-103
ADJUS-104 CIS-125 FIRET-082 FIRET-232CX3 FIRET-529 RESP-104
ADJUS-105 CIS-130 FIRET-083 FIRET-233AX3 FIRET-532 RESP-105
ADJUS-106 CIS-140 FIRET-084 FIRET-233BX3 FIRET-902X4 RESP-106
ADJUS-107 CIS-140X2 FIRET-085 FIRET-233CX3 GEOG-175 RESP-108
ADJUS-108 CIS-141 FIRET-086 FIRET-233DX3 JOUR-120 RESP-109AX2
ADJUS-198 CIS-141X2 FIRET-087 FIRET-234AX3 JOUR-135 RESP-109BX2
AH-090 CIS-142 FIRET-088 FIRET-234BX3 MARKET-106 RESP-110X4
AH-101 CIS-142X2 FIRET-090BX3 FIRET-234CX3 MARKET-110 RESP-112
AH-198 CIS-143 FIRET-090CX3 FIRET-235AX3 MARKET-198 RESP-130
BUSAD-039 CIS-143X2 FIRET-091AX3 FIRET-235CX3 PSYCH-121 RESP-131
BUSAD-103 CIS-153 FIRET-091DX3 FIRET-239AX3 RADIOL-100 RESP-132
BUSAD-105 CIS-160 FIRET-092BX3 FIRET-239DX3 RADIOL-101 RESP-133
BUSAD-198 CIS-161 FIRET-094AX3 FIRET-240AX3 RADIOL-103 RESP-134
BUSAD-200 CIS-162 FIRET-094BX3 FIRET-240BX3 RADIOL-104 RESP-135
BUSAD-210 CIS-163 FIRET-095DX3 FIRET-240CX3 RADIOL-105 RESP-136
BUSAD-213 CIS-164 FIRET-096AX3 FIRET-240DX3 RADIOL-106 RESP-137
BUSAD-230 CIS-165X3 FIRET-100 FIRET-241AX3 RADIOL-107 RESP-138X4
CD-100 CIS-166 FIRET-101 FIRET-242BX3 RADIOL-108 RESP-139
CD-105 CIS-168 FIRET-102 FIRET-242DX3 RADIOL-109 RESP-201
CD-112 CIS-171 FIRET-103 FIRET-250DX3 RADIOL-110 RESP-202
CD-115 CIS-175 FIRET-104 FIRET-254AX3 RADIOL-111 RESP-203
CD-126 CIS-190A FIRET-106 FIRET-254BX3 RADIOL-112 RESP-204
CD-130 CIS-190B FIRET-113 FIRET-254CX3 RADIOL-113 RESP-205
CD-132 CIS-190C FIRET-115 FIRET-254DX3 RADIOL-114 RESP-206
CD-133 CIS-198 FIRET-116 FIRET-256DX3 RADIOL-115 RESP-207
CD-134 CIS-203 FIRET-118 FIRET-257AX3 RADIOL-115A RESP-208
CD-136 CIS-211 FIRET-170 FIRET-257BX3 RADIOL-115B RESP-209BX2
CD-137 EMS-020 FIRET-176 FIRET-257DX3 RADIOL-116 RESP-211X4
CD-182 EMS-021X20 FIRET-183 FIRET-259BX3 RADIOL-117 RESP-218
CD-185 EMS-022 FIRET-198 FIRET-259DX3 RADIOL-200 SLPA-119
CD-186 EMS-023 FIRET-204 FIRET-275 RADIOL-201 SLPA-120
CD-198 EMS-024 FIRET-205 FIRET-276 RADIOL-202 SLPA-123
CD-205X2 EMS-103 FIRET-206 FIRET-277 RADIOL-203 SLPA-124
CD-211 EMS-105 FIRET-207 FIRET-501X4 RADIOL-204 SLPA-125
CD-212 EMS-150 FIRET-220AX3 FIRET-503X4 RADIOL-205 SLPA-126
CD-244 EMS-151 FIRET-220DX3 FIRET-509 RADIOL-207 SLPA-127
CD-250 EMS-152 FIRET-223AX3 FIRET-510 RADIOL-208 SPEECH-135
CD-270 EMS-153 FIRET-223DX3 FIRET-511 RADIOL-209
CD-271 EMS-154 FIRET-224AX3 FIRET-512 RADIOL-210
CD-272 EMS-155 FIRET-224BX3 FIRET-513 RADIOL-211
CD-295 EMS-156 FIRET-226BX3 FIRET-515 RADIOL-212
CIS-091 EMS-157 FIRET-227AX3 FIRET-519 RADIOL-213

Crafton Hills College Educational Master Planning Committee Quantitative Effective Indicators (QEIs)
17 of 17 Prepared by Keith Wurtz Date: 20100126, Revised: 20100226 QEI7_0809.doc Prepared by Keith Wurtz Date: 20100126 QEI_0809.doc
Appendix C
Developmental/Basic Skills Courses
ENGL-015 MATH-095C
ENGL-908 MATH-903X2
ENGL-914 MATH-942
MATH-090 MATH-943X2
MATH-090A MATH-952
MATH-090B MATH-953X2
MATH-090C READ-078X2
MATH-095 READ-091
MATH-095A READ-925X2
MATH-095B READ-956X2
Courses included in the Overall Success and Retention Categories Only
ACCT-021 PCD-050
ANAT-246X4 PCD-055
ANAT-247X4 PE/I-070X4
ANAT-248X4 RESP-050
CHC-099X4 RESP-925X4
CIS-062 RESP-927X4
CIS-900X4 SPAN-015
FIRET-901 SPEECH-050
LRC-050 TEST-100
LRC-960X4 WKEXP-099