quantitative characters under assortative mating: gametic model
TRANSCRIPT
THEORETICAL POPULATION BIOLOGY 25, 312-330 (1984)
Quantitative Characters under Assortative Mating: Gametic Model
A. GIMELFARB*
Department of Biostatistics, School of Public Health, University of Michigan, Ann Arbor, Michigan 48109
Received May 25, 1983
The gametic model introduced by Gimelfarb (1982, Theor. Pop. Biol. 22, 324-366) is applied to investigating the dynamics, represented in the model by a second-order recurrence equation, the the variance of sex-independent and sex- controlled characters under assortative mating. It is shown that, for any additive character, there always exists a unique equilibrium for the variance, which is stable. Dynamical properties of the variance under positive and negative matings are considered, and numerical evaluations of the equilibrium values as well as of the dynamical changes of the variance arc presented. Comparisons with results from a biological experiment are made.
INTRODUCTION
The earliest investigation of the dynamics of quantitative characters under assortative mating based on phenotypic resemblance of mates was under- taken by Wright in his (1921) paper. In this work he derived, using a genie model of inheritance, a recurrence relation for the dynamics of the variance and obtained a formula for the equilibrium value of the variance of a polygenic character, assuming equal allelic effects, equal allelic frequencies and free recombination between all the loci.
Crow and Felsenstein (1968) generalized Wright’s results to unequal allelic effects, unequal allelic frequencies and arbitrary recombinations. Nagylaki (1982) obtained additional results based on the classical genie model of genetic inheritance. Lande (1977) applied his genie model with continuously distributed allelic effects to the dynamics of additive characters under weak assortative mating and strong stabilizing selection.
Feldman and Cavalli-Sforza (1977, 1979) used a zygotic model of genetic inheritance as a part of the “complex transmission” model of quantitative characters to investigate the dynamics of characters under assortative mating and stabilizing selection. Rice et al. (1978) and Cloninger et al. (1979) also
* Present address: Department of Mathematics, Northeastern University, Boston, Massachussets 02 115.
004Om5809/84 $3.00 Copyright 0 1984 by Academic Press, Inc. All rights of reproduction in any form reserved.
312

QUANTITATIVE CHARACTERS UNDERASSORTATIVE MATING 313
made use of a zygotic model in their path analysis treatment of assortative mating for characters with biological and cultural inheritance.
Wilson (1973) and Wagener (1976) introduced a model of assortative mating which is different from the classical linear model of “pure” assortment. This model of “preferential” or “selective” mating, which is equivalent to a selection on randomly mating pairs, was further advanced by Karlin (1979a, b, 1980) in his works on the dynamics of quantitative characters based on the phenotypic model of heredity with Gaussian mode of inheritance.
In this paper, the dynamics of sex-independent and sex-controlled characters under phenotypic assortative mating is investigated with the use of the gametic model of genetic inheritance suggested in (Gimelfarb, 1982).
GENERAL DYNAMICAL EQUATION
The following gametic model was introduced by Gimelfarb (1982) for sex- controlled characters.
The values of a quantitative character of a female X and a male Y are represented in the model by sums of the genotypic values x or y and environ- mental components e * or e* *:
X=x+e** (for females),
y=y+e* (for males). (1)
The environmental component of an individual is assumed to be distributed independently of the genotypic value and with zero mean. The genotypic value of an individual is a function (developmental function) of the gametic effects of the gametes constituting the individual’s genotype:
Y=f*(a,P),
x=f**(a,P),
where a is the effect of the gamete received by an individual from the father, and p is the effect of the gamete received from the mother. As a first approx- imation, the following expressions for developmental functions of a sex- controlled character, implying that the character is additive, were suggested:
S*(a,P)=a+P (for males),
f**(a,P)=C(a+/3)+B (for females). (3)
Processes of gametoproduction are incorporated into the model by means of the gametogenetic functions H*(il 1 a, p) for males and H**(;i 1 a, /I) for females, which are defined as the probabilities for a gamete with effect 1 to
314 A. GIMELFARB
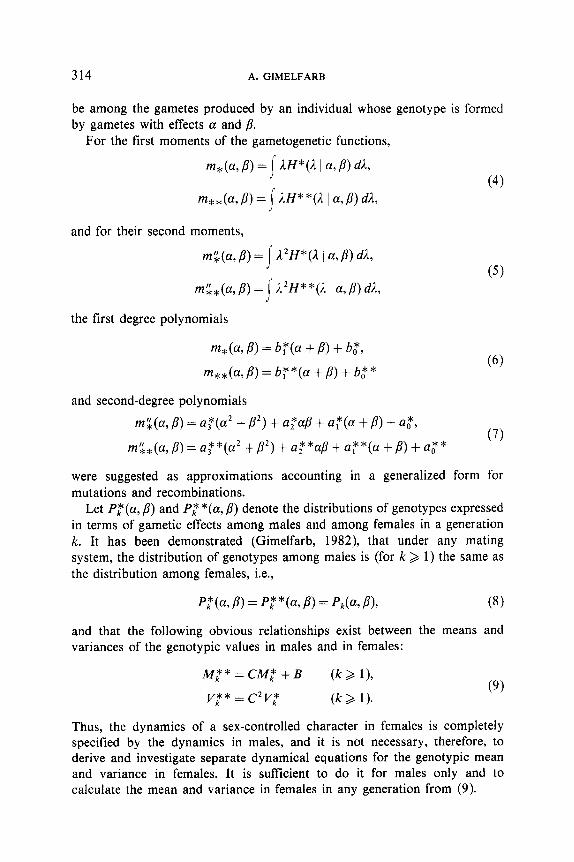
be among the gametes produced by an individual whose genotype is formed by gametes with effects a and j?.
For the first moments of the gametogenetic functions,
m,,(a, /3) =I AH* “(1 I a, P) d&
and for their second moments,
(4)
(5)
the first degree polynomials
mda, P> = b,*(a + B> + b,*,
m**(a,P)=bT*(a+/3)+b,** (6)
and second-degree polynomials
m$(a,p) = uf(a* + B’) + uz*ap + a,*(a t P) t a$,
m~*(a,/3)=a~*(a2+~*)tu~*a~+u~*(at/3)tu,** (7)
were suggested as approximations accounting in a generalized form for mutations and recombinations.
Let P:(a, /3) and Pt *(a, p) denote the distributions of genotypes expressed in terms of gametic effects among males and among females in a generation k. It has been demonstrated (Gimelfarb, 1982), that under any mating system, the distribution of genotypes among males is (for k 2 1) the same as the distribution among females, i.e.,
Pk*(a, P) = Pk* *(a, P> = PAa, P>, (8)
and that the following obvious relationships exist between the means and variances of the genotypic values in males and in females:
M;*=CMt+B (k > 11,
v,** = c’v,* (9)
(k> 1).
Thus, the dynamics of a sex-controlled character in females is completely specified by the dynamics in males, and it is not necessary, therefore, to derive and investigate separate dynamical equations for the genotypic mean and variance in females. It is sufficient to do it for males only and to calculate the mean and variance in females in any generation from (9).
QUANTITATIVE CHARACTERS UNDER ASSORTATIVE MATING 315
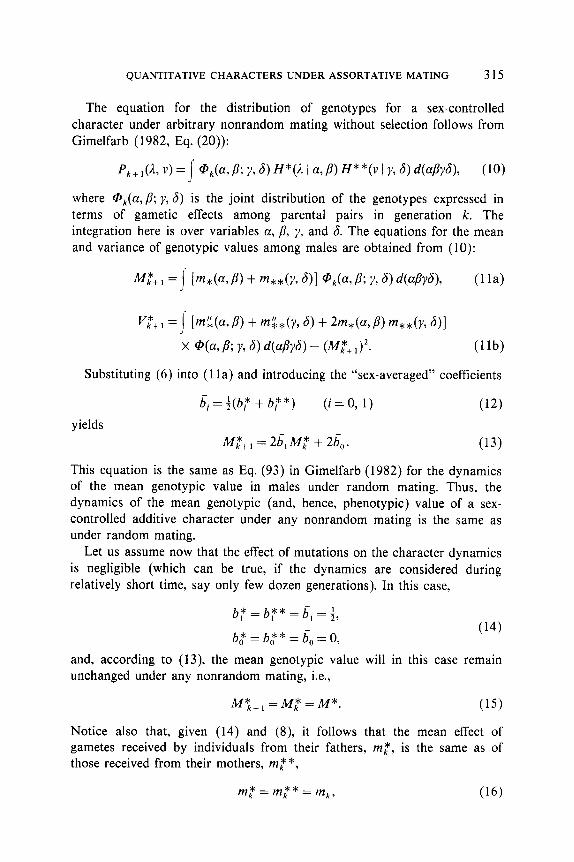
The equation for the distribution of genotypes for a sex-controlled character under arbitrary nonrandom mating without selection follows from Gimelfarb (1982, Eq. (20)):
Pk+ ,(A, v> = I @k(cf, P; 7, 6) H*o, I a, P> If* *(v I Y> 4 4orpY4, (10)
where @,Jcz, p; y, S) is the joint distribution of the genotypes expressed in terms of gametic effects among parental pairs in generation k. The integration here is over variables a, /I, y, and 6. The equations for the mean and variance of genotypic values among males are obtained from (10):
Substituting (6) into (1 la) and introducing the “sex-averaged” coefficients
iii = f(bjr + b” “) (i=O, 1) (12) yields
AI;+, =2&M; + 2b,. (13)
This equation is the same as Eq. (93) in Gimelfarb (1982) for the dynamics of the mean genotypic value in males under random mating. Thus, the dynamics of the mean genotypic (and, hence, phenotypic) value of a sex- controlled additive character under any nonrandom mating is the same as under random mating.
Let us assume now that the effect of mutations on the character dynamics is negligible (which can be true, if the dynamics are considered during relatively short time, say only few dozen generations). In this case,
b+b,**&,=+,
b,+b**=b =O 0 0 3
(14)
and, according to (13), the mean genotypic value will in this case remain unchanged under any nonrandom mating, i.e.,
M*k+1= A4; = ivl*. (15)
Notice also that, given (14) and (8), it follows that the mean effect of gametes received by individuals from their fathers, m,*, is the same as of those received from their mothers, mz*,
m$=m**=m k k, (16)

316 A. GIMELFARB
and, hence,
il4k* = 2m,.
Because of (15), it follows that
m ktl=mk=m=$W.
Introducing the ‘<sex-averaged” coefficients
(17)
di = +(a” + a* *> (i=O, 1,2,3), (18)
the substitution of (6) and (7) into (1 lb) yields
q+ I = 2a, v; + 2@, - 2&) COV/( + (1/2C) cov, + F(M”), (19)
where C is a parameter of the developmental function for females from (3) and F(M*) is the function
F(M*) = (a, + a,/2 - f)(M*)* + 2a,A4* + 2a,. (20)
Comparing this expression with Eq. (93) in Gimelfarb (1982) for the genotypic variance dynamics under random mating, we shall see that
F(M”) = (1 - 2&) P, (21) where V’ is the genotypic variance at equilibrium under random mating.
Cov, in (19) is the covariance of genotypic values of parents in generation k:
cov, = I C(a + P)(Y + 4 @(a, B; Y, d> d(&4 - wf*1*, (22)
and covk is the covariance of the effects of the gametes constituting parental zygotes, i.e.,
covk = ( a/lP,(a, /I) d(a/3) - m2. (23)
Notice that this expression can be rewritten for k > 1 as
COVk = i
/Iv@,-, (a, P; Y, 4 H*(13. I a, P) ff**(v I Y, 4 WvaP$) - Sf*>’
= m*@,P> m*&, 4 Qk-,(a,P; y, 6) @P$) - Mf*>“.
From (4)
covk = + I (a + P>(y + 6) @,_ I(a, P; Y14 d(a, Pr@ - fP*)*, (24)
QUANTITATIVE CHARACTERS UNDER ASSORTATIVE MATING 317
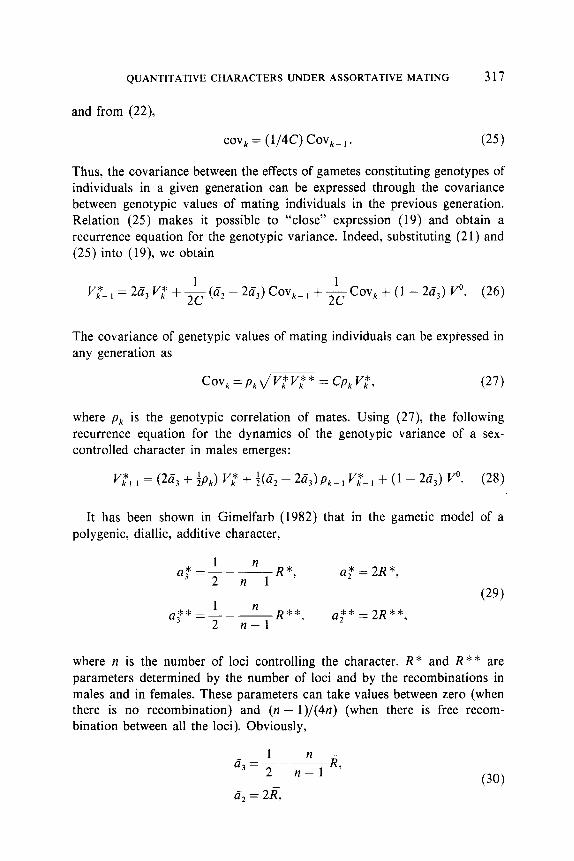
and from (22),
COVk = (1/4C) cov,- 1. (25)
Thus, the covariance between the effects of gametes constituting genotypes of individuals in a given generation can be expressed through the covariance between genotypic values of mating individuals in the previous generation. Relation (25) makes it possible to “close” expression (19) and obtain a recurrence equation for the genotypic variance. Indeed, substituting (21) and (25) into (19), we obtain
V;+ , = 2a, V; + & (a2 - 2ti,) Cov,- , + & Cov, + (1 - 2E,) v”. (26)
The covariance of genetypic values of mating individuals can be expressed in any generation as
cov, = pk l/m = cp, vk*, (27)
where pk is the genotypic correlation of mates. Using (27), the following recurrence equation for the dynamics of the genotypic variance of a sex- controlled character in males emerges:
V;+ , = (25, + fp,) V$ + ;(n, - 24) pk-, I’$-, + (1 - ‘X,) V(‘. (28)
It has been shown in Gimelfarb (1982) that in the gametic model of a polygenic, diallic, additive character,
1 a:=--
2 nR*, n-l
a*=2R* 2 2
1 a3 **=--
2 AR*“, n-l
af*=2R** 3
(29)
where n is the number of loci controlling the character. R * and R ** are parameters determined by the number of loci and by the recombinations in males and in females. These parameters can take values between zero (when there is no recombination) and (n - 1)/(4n) (when there is free recom- bination between all the loci). Obviously,
1 a,=---- 2
n R, n-l
(30) a, = 2R,
318 A. GIMELFARB
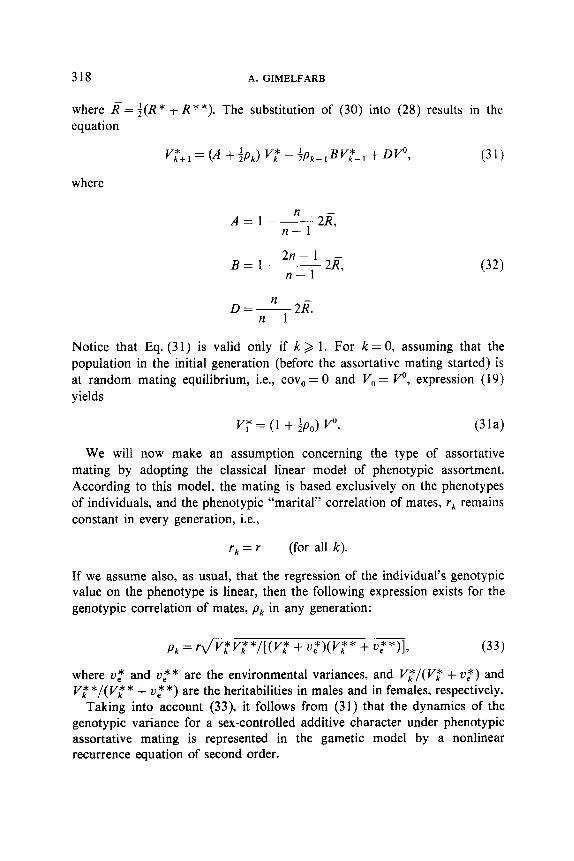
where I?= ;(z? * + R**). The substitution of (30) into (28) results in the equation
where
A-l-n2I7, n-1
B=1-2n-12R 7-F’ (32)
D=--....- n 2R. n-1
Notice that Eq. (31) is valid only if k > 1. For k = 0, assuming that the population in the initial generation (before the assortative mating started) is at random mating equilibrium, i.e., cov,, = 0 and V, = p, expression (19) yields
VT = (1 + $7,) P. (314
We will now make an assumption concerning the type of assortative mating by adopting the classical linear model of phenotypic assortment. According to this model, the mating is based exclusively on the phenotypes of individuals, and the phenotypic “marital” correlation of mates, rk remains constant in every generation, i.e.,
rk = r (for all k).
If we assume also, as usual, that the regression of the individual’s genotypic value on the phenotype is linear, then the following expression exists for the genotypic correlation of mates, pk in any generation:
pk=rdVVk*Vk** /[(V,* t vp)(v,** + ue**>1, (33)
where v,* and vg* are the environmental variances, and Vc/(V,* t VP) and V,* */(V,* * + VP *) are the heritabilities in males and in females, respectively.
Taking into account (33), it follows from (31) that the dynamics of the genotypic variance for a sex-controlled additive character under phenotypic assortative mating is represented in the gametic model by a nonlinear recurrence equation of second order.
QUANTITATIVE CHARACTERS UNDERASSORTATIVE MATING 319
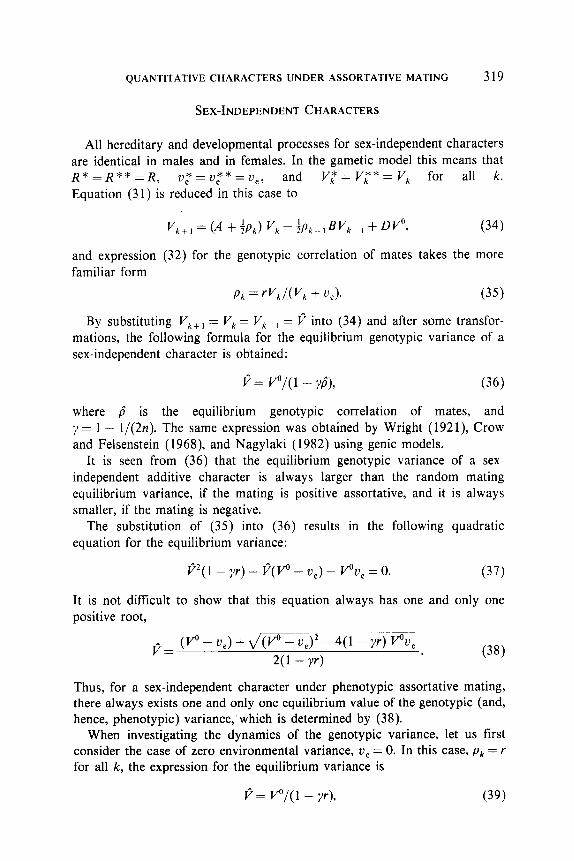
SEX-INDEPENDENT CHARACTERS
All hereditary and developmental processes for sex-independent characters are identical in males and in females. In the gametic model this means that R*=R**=R, v*=v$*=v,, and Vz=V,**=V, for all k. Equation (31) is reduced in this case to
V k+l= (‘4 +iPk) Vk-~Pk-PL +oP,
and expression (32) for the genotypic correlation of mates takes the more familiar form
Pk = rvk/(vk + ve>. (35)
By substituting Vk+ , = Vk = Vkp, = v into (34) and after some transfor- mations, the following formula for the equilibrium genotypic variance of a sex-independent character is obtained:
P= P/(1 - $), (36)
where p” is the equilibrium genotypic correlation of mates, and y = 1 - 1/(2n). Th e same expression was obtained by Wright (192 l), Crow and Felsenstein (1968), and Nagylaki (1982) using genie models.
It is seen from (36) that the equilibrium genotypic variance of a sex- independent additive character is always larger than the random mating equilibrium variance, if the mating is positive assortative, and it is always smaller, if the mating is negative.
The substitution of (35) into (36) results in the following quadratic equation for the equilibrium variance:
P’(1 - yr) - P(P - ve) - Pv, = 0. (37)
It is not difficult to show that this equation always has one and only one positive root,
p= (P - VJ + &v” - v,y - 4(1 - v) Pv,
2(1 - P-1
Thus, for a sex-independent character under phenotypic assortative mating, there always exists one and only one equilibrium value of the genotypic (and, hence, phenotypic) variance,‘which is determined by (38).
When investigating the dynamics of the genotypic variance, let us first consider the case of zero environmental variance, v, = 0. In this case, pk = r for all k, the expression for the equilibrium variance is
P= P/(1 - yr), (39)
320 A. GIMELFARB
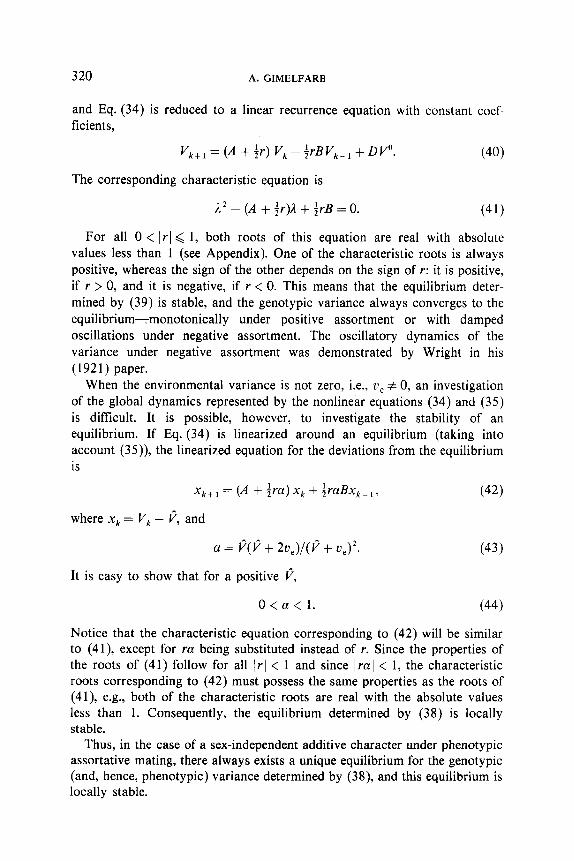
and Eq. (34) is reduced to a linear recurrence equation with constant coef- ficients,
The corresponding characteristic equation is
A2 - (A + fr)A + $3 = 0. (41)
For all 0 < Irl < 1, both roots of this equation are real with absolute values less than 1 (see Appendix). One of the characteristic roots is always positive, whereas the sign of the other depends on the sign of r: it is positive, if I > 0, and it is negative, if r < 0. This means that the equilibrium deter- mined by (39) is stable, and the genotypic variance always converges to the equilibrium7monotonically under positive assortment or with damped oscillations under negative assortment. The oscillatory dynamics of the variance under negative assortment was demonstrated by Wright in his (1921) paper.
When the environmental variance is not zero, i.e., u, # 0, an investigation of the global dynamics represented by the nonlinear equations (34) and (35) is difficult. It is possible, however, to investigate the stability of an equilibrium. If Eq. (34) is linearized around an equilibrium (taking into account (35)), the linearized equation for the deviations from the equilibrium is
X k+, = (A + fra) xk t $-ah,-, , (J-9
where xk = Vk - p, and
a = P(P f 2u,)/(J7+ u,y.
It is easy to show that for a positive c’,
(43)
O<a<l. (44)
Notice that the characteristic equation corresponding to (42) will be similar to (41), except for ra being substituted instead of r. Since the properties of the roots of (41) follow for all ) rl < 1 and since 1 ra I < 1, the characteristic roots corresponding to (42) must possess the same properties as the roots of (41), e.g., both of the characteristic roots are real with the absolute values less than 1. Consequently, the equilibrium determined by (38) is locally stable.
Thus, in the case of a sex-independent additive character under phenotypic assortative mating, there always exists a unique equilibrium for the genotypic (and, hence, phenotypic) variance determined by (38), and this equilibrium is locally stable.
QUANTITATIVE CHARACTERS UNDERASSORTATIVE MATING 321
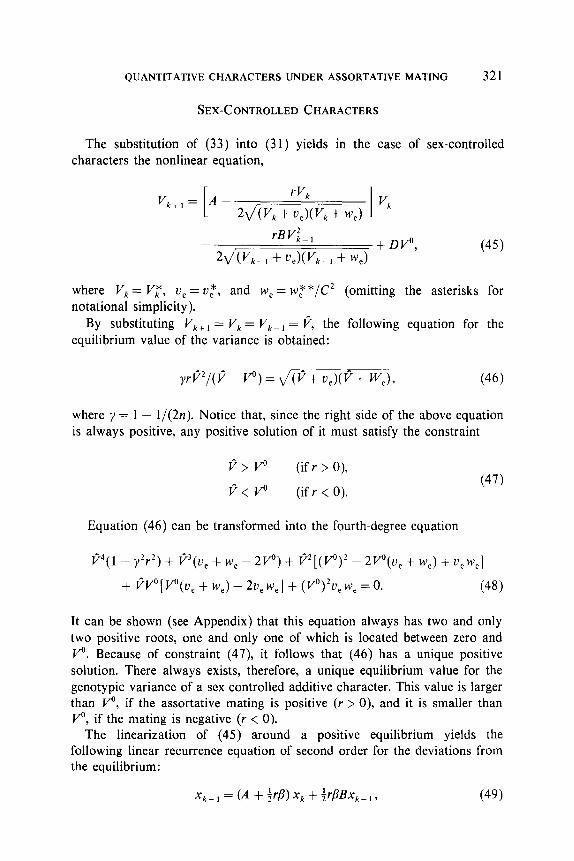
SEX-CONTROLLED CHARACTERS
The substitution of (33) into (31) yields in the case of sex-controlled characters the nonlinear equation,
V ktl= A- L
rVk
2d/(vk + ‘e)(‘k + we) I ‘k
rBVi-1
2d/(vk-1 + ue>(vk-, + we>
+Dp, (45)
where V, = Vz, U, = u:, and w = w$*/C’ (omitting the asterisks for e notational simplicity).
By substituting Vk+ , = Vk = V,- 1 = p, the following equation for the equilibrium value of the variance is obtained:
vP’/(P- P>=~u,)(v+ w,j, (46)
where y = 1 - 1/(2n). Notice that, since the right side of the above equation is always positive, any positive solution of it must satisfy the constraint
P> P (if r > 0),
P< P (if r < 0). (47)
Equation (46) can be transformed into the fourth-degree equation
P”(1 - y2r2) + P3(v, + w, - 2P) + P’[(P)’ - 2vO(u, + we) + u,w,j
+ W[ P(v, + we) - 2v, we] + (vyu, w, = 0. (48)
It can be shown (see Appendix) that this equation always has two and only two positive roots, one and only one of which is located between zero and V“. Because of constraint (47), it follows that (46) has a unique positive solution. There always exists, therefore, a unique equilibrium value for the genotypic variance of a sex-controlled additive character. This value is larger than p, if the assortative mating is positive (r > 0), and it is smaller than p, if the mating is negative (r < 0).
The linearization of (45) around a positive equilibrium yields the following linear recurrence equation of second order for the deviations from the equilibrium:
X k+ 1 = (A + +rp> xk + $r@xk-, , (49)
322 A. GIMELFARB
where xk = V, - f, and
P= P[(F+ u,)(P+ We) + ;qu, + we> + u,v,] [(P+ u,)(P+ w,>]3’2 * (50)
It can be shown that
o<p< 1. (51)
Because of this constraint on p, Eq. (49) is a complete analogy of (42) which has been shown to have both of its characteristic roots real with the absolute values less than 1. Therefore, a positive equilibrium solution of (45), subject to constraint, (47) is locally stable.
Thus, in the case of a sex-controlled additive character under phenotypic assortative mating, there always exists a unique equilibrium for the genotypic (and, hence, phenotypic) variance, and this equilibrium is locally stable.
DISCUSSION
The main result of the previous sections is that under phenotypic assor- tative mating, there always exists a unique equilibrium for the variance of sex-independent or sex-controlled additive characters, and this equilibrium is locally stable. The equilibrium value of the variance is larger than the random mating equilibrium value, if the mating is positive, and it is smaller than the random mating equilibrium value, if the mating is negative.
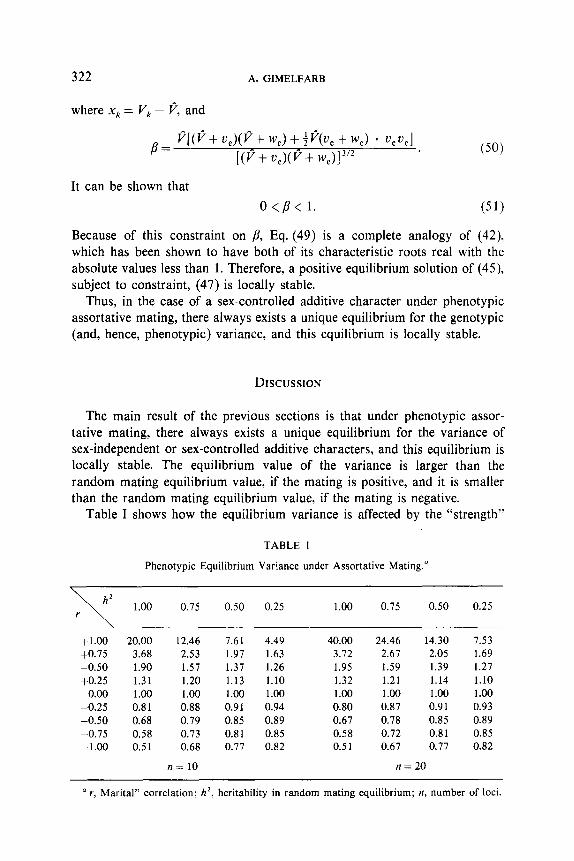
Table I shows how the equilibrium variance is affected by the “strength”
TABLE I
Phenotypic Equilibrium Variance under Assortative Mating.”
hZ 1.00 0.75 0.50 0.25 1.00 0.75 0.50 0.25 r
+l.OO 20.00 12.46 7.61 4.49 40.00 24.46 14.30 7.53 to.75 3.68 2.53 1.97 1.63 3.72 2.67 2.05 1.69 -0.50 1.90 1.57 1.37 1.26 1.95 1.59 1.39 1.27 to.25 1.31 1.20 1.13 1.10 1.32 1.21 1.14 1.10
0.00 1.00 1.00 1.00 1 .oo 1.00 1.00 1.00 1.00 -0.25 0.81 0.88 0.91 0.94 0.80 0.87 0.91 0.93 -0.50 0.68 0.79 0.85 0.89 0.67 0.78 0.85 0.89 -0.75 0.58 0.73 0.81 0.85 0.58 0.72 0.81 0.85 -1.00 0.51 0.68 0.77 0.82 0.5 1 0.67 0.77 0.82
n= 10 n = 20
a r, Marital” correlation; h*, heritability in random mating equilibrium; n, number of loci.
QUANTITATIVE CHARACTERS UNDER ASSORTATIVE MATING 323
of the assortative mating (measured by the “marital” correlation, r), the effect of environment (measured by the heritability in the random mating equilibrium, h2 = v”/(V” f 0,)) and the number of loci n. The entries in the table are the ratios of the equilibrium variance under assortative mating to the random mating equilibrium variance.
Several conclusions can be drawn from this table. First, there is an apparent asymmetry of responses to positive and to negative assortative matings. When the “strength” of assortment (measured by the absolute value of the “marital” correlation) is the same, the response to the positive mating is more substantial than to the negative mating. Under positive mating, the equilibrium variance can increase as much as 2n times as compared to the random mating equilibrium value (when Y = t 1 and hZ = 1). Under negative mating, on the other hand, the equilibrium variance can never drop below one-half of the random mating equilibrium value.
The second conclusion that can be drawn from the table is that within a realistic range of parameters (e.g., -0.75 < r < 0.75 and h2 < 0.75), the number of loci controlling the character has only a slight effect on the equilibrium variance for a large enough number of loci.
It is also seen that within the realistic range of parameters, the effect of assortative mating on the equilibrium variance, as compared to the effect of random mating, is not very substantial. It may, therefore, be concluded that the phenotypic assortative mating does not in general represent a significant evolutionary factor affecting the variation in natural populations.
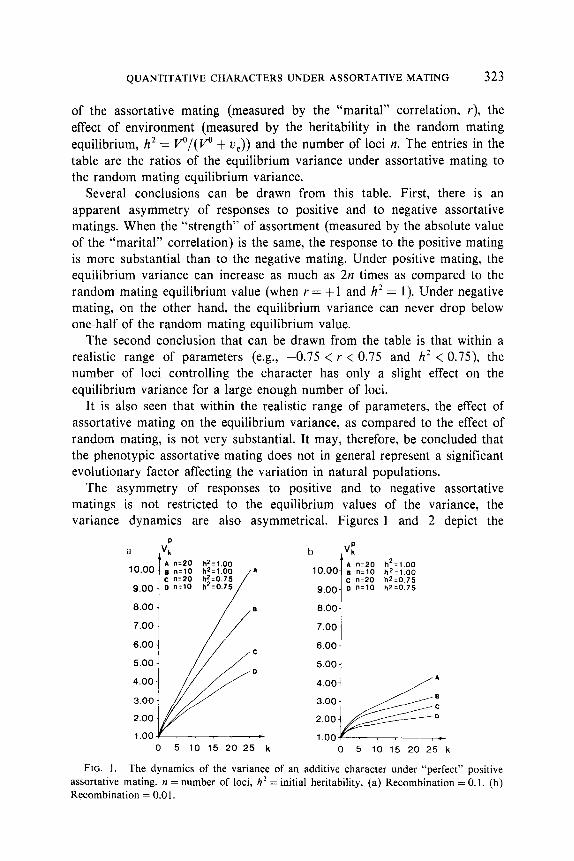
The asymmetry of responses to positive and to negative assortative matings is not restricted to the equilibrium values of the variance, the variance dynamics are also asymmetrical. Figures 1 and 2 depict the
8.00
7.00
6.00
5.00
4.00
3.00
2.00
1.00
4.002
@
A
3.00 a c
2.00 0
1.00 ----T) 0 5 10 15 20 25 k 0 5 10 15 20 25 k
8.00
7.00 :
6.00
5.00 1
FIG. 1. The dynamics of the variance of an additive character under “perfect” positive assortative mating. n = number of loci, h* = initial heritability. (a) Recombination = 0.1. (b) Recombination = 0.0 1.

324 A. GIMELFARB
t I I , ,r i I / r ,t
0 5 IO 15 20 25 k 0 5 10 15 20 25 k
FIG. 2. The dynamics of the variance of an additive character under “perfect” negative assortative mating. n = number of loci, h2 = initial heritability. (a) Recombination = 0. I. (b) Recombination = 0.0 1.
dynamics during 25 generations of the “perfect” positive (r = +I) and negative (Y = -1) assortative matings of the phenotypic variance Vc of a sex- independent character, as computed from (34) and (35). It was assumed that in the initial generation the population was in the random mating equilibrium with Vg= 1.
It is seen from the graphs that the increase of the variance under positive mating is monotonic, whereas the decrease of the variance under negative mating is accompanied during early generations by damped oscillations.
It can also be noticed that an increase in either the number of loci or in the rate of recombination has an accelerating effect on the variance dynamics, especially noticeable under the positive matings. Lower heritability can be seen to have a slowing effect on the variance dynamics.
The oscillations of the variance in the first generations of the negative matings are more pronounced when the number of loci is small. When the number of loci is relatively large, the variance drops to almost its equilibrium value after the first generation, i.e., all changes of the variance under negative assortative mating occur in this case in just one generation.
It is interesting to compare the predictions of the model with outcomes of biological experiments. Laboratory experiments on phenotypic assortative mating in Drosophila melanogaster were conducted.’ The number of bristles on the fourth and fifth abdominal segments for females and on the third and fourth segments for males was chosen as the quantitative character. In the wild population, from which the original flies for the experiments were sampled, the character was approximately normally distributed in both sexes with the mean 39 and variance 17 in females, and 33 and 13, respectively, in males. From the literature (Falconer, 1960) as well as from our own preliminary experiments, the character shows a high additive genetic component. The environmental variance under our laboratory conditions was
’ The experiments were conducted by Galina Epelman (Ioffe), my colleague in the Agrophysical Institute in Leningrad, to whom I express my gratitude.
QUANTITATIVE CHARACTERS UNDER ASSORTATIVE MATING 325
estimated as 47% of the total variance (in females), which is slightly higher than the 39% estimation given by Falconer (1960).
Two experiments, one on the positive and the other on the negative phenotypic assortative mating, were done. For both experiments, the initial generation was composed of 300 females and 300 males randomly chosen from the offspring of the 300 females collected in the wild. The abdominal bristle number for every chosen fly was counted, and the flies were arranged (separately in two sexes) according to their bristle number. Individual matings were then performed for the two mating systems.
For the positive mating, a female and male of the same rank were placed in one vial. For the negative mating, on the other hand, a female and a male of opposite ranks were placed into one vial. Then, among the offspring from all the 300 individual matings under a given mating system, 300 females and 300 males were chosen randomly, their bristle number was counted, and they were again arranged and individually mated in the same way as previously: of the same ranks for the positive mating and of the opposite ranks for the negative mating. This was repeated for 8 generations. Under such a procedure, the rank correlation of the mating pairs was maintained in every generation as + 1 or as -1 for the positive and the negative matings, respec- tively. Computations of the “marital” correlations (product-moment correlations) revealed that they were not significantly different from +l and -1 for respective matings in any generation. Thus, the described procedures corresponded to the “perfect” positive and negative phenotypic assortative matings.
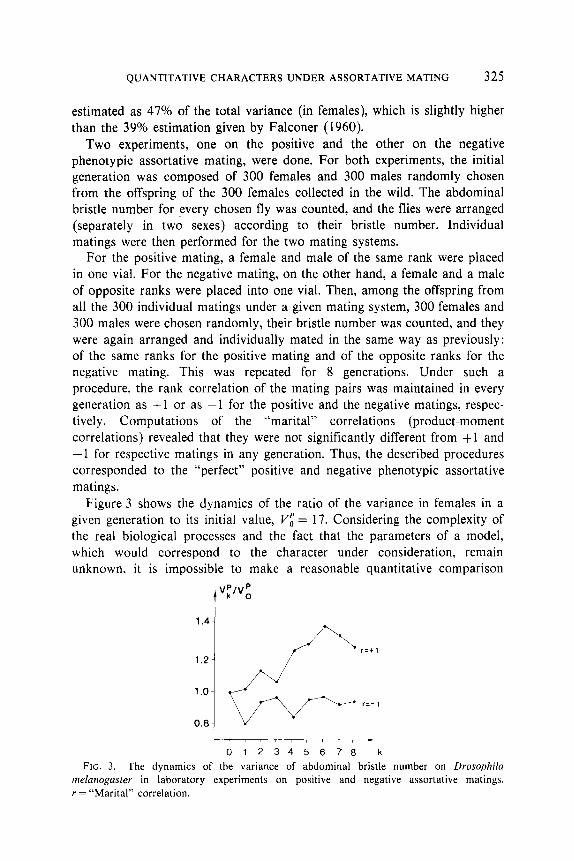
Figure 3 shows the dynamics of the ratio of the variance in females in a given generation to its initial value, I$ = 17. Considering the complexity of the real biological processes and the fact that the parameters of a model, which would correspond to the character under consideration, remain unknown, it is impossible to make a reasonable quantitative comparison
1.4-
0.8 4
r:+1 1.2.
1.0. r=- 1
1 , ,+
012345678 k FIG. 3. The dynamics of the variance of abdominal bristle number on Drosophila
melunogaster in laboratory experiments on positive and negative assortative matings. r = “Marital” correlation.
326 A. GIMELFARB
between the model and the experiment. Some qualitative comparisons can, however, be made. There is a noticeable asymmetry of responses to the positive and to the negative matings: the increase under the positive mating is more pronounced than the decrease under the negative mating. The substantial decrease of the variance in the first generation of the negative mating as compared to the changes in the following generations is also noticeable. Though not verified statistically, these outcomes correspond to the predictions of the model.
APPENDIX
Let us prove that the roots of the equation
A2 - (A + ;r>n + frB = 0,
where
A=l-- It 2R, n-l
B=1--2R,
are real with absolute values less than 1. To do that, we have to demonstrate that
(A + tr)” - 2rB > 0.
(Al)
WI
(A3)
(A4)
Let us rewrite the left side of this expression as
(;r + (A - 2B))* + 4B(A - B).
Since (A -B) = 2R > 0, the above expression is always positive and, hence, (A4) is true.
Let us prove now that the first root of (Al), which is always positive, is less than 1, i.e.,
2, = $[(A + fr) + \/(A + $)* - 2rB] < 1. (‘45)
It is easy to show that (AS) is equivalent to
(r/2)(1 -B) < 1 -A. (4

QUANTITATIVE CHARACTERS UNDER ASSORTATIVE MATING 321
Since
l-A=n2R>O, n-l
1-B=s2R>O,
(A6) implies 1
2- l/n ’
which is true, since r < 1, whereas the right side is always larger than i. The second root of (Al),
1, = 5 [(A + ;r) - &A + +r)’ - 2rB], Gw
is positive, if Y > 0 and consequently, 1, < i, < 1 in this case. It remains, therefore, to prove that
A, > -1, if r < 0. (A9)
The substitution of (A8) into (A9) after some transformations yields
(1 + A)/(1 -B) > -r/2. (Al01
Since r > -1, the right side of (AlO) is less than or equal to l/2. On the other hand, the left side of (AlO) is always larger than l/2, since even (1 -A)/(1 -B) h as been shown to be larger than l/2. Thus, (AlO) is satisfied, and, consequently, inequality (A9) is also satisfied.
In order to prove that Eq. (48) has two positive roots with one and only one of them between 0 and p, we shall make use of the Budan-Fourier method (Ledermann and Vajda, 1980). Let us first rewrite the equation as
P4(1 -p*> + P(v + w - 2P) + P(P - v)(P -w)
+ w(P(v + co) - 2vw) + (P)*vo = 0, (All)
where p* = y2r2 < 1, v = U, > 0, and w = W, > 0. Denoting the left side of this as f( 0 and computing its derivatives up to fourth at P = 0, we obtain
f(0) = (P)*v0,
f’(0) = P(P(v + w) - 2vo),
f”(0) = 2( vo - v)( vo - w),
f”‘(0) = 6(v + u + 2v0),
f”(0) = 24(1 -p’).
(Al21
328 A. GIMELFARB
It is seen that f(0) > 0 andf’“(0) > 0. It can also be shown that
f'(0) < 0 implies f iii (0) > 0.
Indeed,
is equivalent to
f’(0) = P(P(v + 0) - 2VW) < 0
P < 2VW/(V + o),
implying
f iii(O) = 6(v + w - 2v0)
i
4vw >6 vtw--
v+co
6(v - w)’ = > 0,
v+w
which proves (A13). It can also be shown that
f iii(O) < 0 implies f i(O) > 0.
Indeed,
f”‘(0) = 6(v t o - 2I”7 < 0
(A13)
(Al41
is equivalent to
implying
P > gv + co),
f’(0) = v-y P(v + 0) - 2VW)
> VO(f(v + wy t 2VO)
= pyv - w)’ > 0,
which proves (A14). Thus, the sequence of the derivatives (A12) may have the following three
sign combinations: (+ - ? + +), (t + ? - t), or (t + ? + +). The first two combinations have two sign changes indicating that Eq. (Al 1) has either two or no positive roots, whereas the third combination may have either two or
no sign changes, also indicating that the equation has either two or no positive roots.

QUANTITATIVE CHARACTERS UNDERASSORTATIVE MATING 329
Computing the derivatives off(@ at pi= p, we obtain
f( v”> = -( ~)4Pu2,
fi( P) = -4( Tp)3$,
f”(P) = 2((P)* + V”(v + co) + vco - ~(V”)*,U*), (A15)
f”‘( v”) = 6(2P + (v + w) - 4v0,~*),
f’“(v”) = 24(1 +I’).
It is seen that f( v”) < 0, fi( v”) < 0, and f’“( v”) > 0. There are, therefore, four sign combinations possible for the sequence of derivatives (A15): (----+), (---+ +), (--+ + +), and (--+- +). The last combination cannot occur, since it has three sign changes, i.e., more than in the sequence (A12), which cannot happen if p > 0. All three of the other combinations have one sign change. This implies, of course, that sequence (A 12) cannot have unchanged signs and has, therefore, exactly two sign changes.
If N(0) and N( v”) denote the number of sign changes in (A12) and (A15), respectively, the number of roots of (A 11) located between 0 and p is equal to N(0) - N( v”), w ic h’ h in our case is 1. Thus, Eq. (A 11) has two positive roots, one and only one of which is less than I”‘.
ACKNOWLEDGMENTS
I wish to thank J. Bull, J. Crow, and R. Lande for their assistance and discussions.
REFERENCES
CLONINGER, C. R.. RICE, J., AND REICH, T. 1979. Multifactorial inheritance with cultural transmission and assortative mating. II. A general model of combined polygenic and cultural inheritance, Amer. J. Hum. Genet. 31, 176-198.
CROW, J. F., AND FELSENSTEIN, J. 1968. The effect of assortative mating on the genetic composition of a population, Eugen. Qunrr. 15, 85-97.
FALCONER, D. S. 1960. “Introduction to Quantitative Genetics,” Roland Press, New York. FELDMAN, M. W., AND CAVALLI-SFORZA, L. L. 1977. The evolution of continuous variation.
II. Complex transmission and assortative mating, Theor. Pop. Biol. 11, 161-181. FELDMAN, M. W., AND CAVALLI-SFORZA, L. L. 1979. Aspects of variance and covariance
analysis with cultural inheritance, Theor. Pop. Biol. 15, 276-307. GIMELFARB, A. 1982. Quantitative character dynamics: Gametic model, Theor. Pop. Bioi. 22,
324-366. KARLIN, S. 1979a. Models for multifactorial inheritance. I. Multivariate formulations and
basic convergence result, Theor. Pop. Biol. 15, 308-355. KARLIN, S. 1979b. Models for multifactorial inheritance. II. The covariance structure for a

330 A. GIMELFARB
scalar phenotype under selective assortative mating and sex-dependent symmetric parental transmission, Theor. Pop. Biol. 15, 356-393.
KARLIN, S. 1980. Models of multifactorial inheritance. V. Linear assortative mating as against selective (nonlinear) assortative mating, Theor. Pop. Biol. 17, 255-275.
LANDE, R. 1977. The influence of the mating system on the maintenance of genetic variability in polygenic characters, Genetics 86, 485498.
LEDERMANN, W., AND VAJDA, S. (Eds.) 1980. “Handbook of Applicable Mathematics,” Volume I, Algebra, Wiley, New York/Toronto.
NAGYLAKI, TH. 1982. Assortative mating for a quantitative character, J. Math. Biol. 16, 51-14.
RICE, J., CLONINGER, C. R., AND RICE, T. 1978. Multifactorial inheritance with cultural transmission and assortative mating. I. Description and basic properties of the unitary models, Amer. J. Hum. Genet. 30, 618-643.
WAGENER, D. K. 1976. Preferential mating: Nonrandom mating of a continuous phenotype, Theor. Pop. Biol. 10, 185-204.
WILSON, S. R. 1973. The correlation between relatives under the multifactorial model with assortative mating, Ann. Hum. Genet. 37, 189-215.
WRIGHT, S. 1921. Systems of Mating. III. Assortative mating based on somatic resemblance, Genetics 6. 144-161.