quantifying the production of dissolved organic … the production of dissolved organic nitrogen in...
TRANSCRIPT

Quantifying the production of dissolved organic nitrogen in headwater streams using15N tracer additions
Laura T. Johnson,1,a,* Jennifer L. Tank,1 Robert O. Hall, Jr.,2 Patrick J. Mulholland,3,4 Stephen K.Hamilton,5 H. Maurice Valett,6,b Jackson R. Webster,6 Melody J. Bernot,1,c William H. McDowell,7
Bruce J. Peterson,8 and Suzanne M. Thomas 8
1 Department of Biological Sciences, University of Notre Dame, Notre Dame, Indiana2 Department of Zoology and Physiology, University of Wyoming, Laramie, Wyoming3 Environmental Sciences Division, Oak Ridge National Laboratory, Oak Ridge, Tennessee4 Department of Ecology and Evolutionary Biology, University of Tennessee, Knoxville, Tennessee5 Kellogg Biological Station, Michigan State University, Hickory Corners, Michigan6 Department of Biological Sciences, Virginia Polytechnic Institute and State University, Blacksburg, Virginia7 Department of Natural Resources and the Environment, University of New Hampshire, Durham, New Hampshire8 Ecosystems Center, Marine Biological Laboratory, Woods Hole, Massachusetts
Abstract
Most nitrogen (N) assimilation in lake and marine ecosystems is often subsequently released via autochthonousdissolved organic nitrogen (DON) production, but autochthonous DON production has yet to be quantified inflowing waters. We measured in-stream DON production following 24 h 15N-nitrate (NO{
3 ) tracer additions in 36headwater streams, a subset of sites from the second Lotic Intersite Nitrogen eXperiment. Streams were located infive North American ecoregions and drained basins dominated by native vegetation, agriculture, or urban landuse. Using a two-compartment model, we could quantify DON production in 15 streams as a function of DO15Nderived from 15N tracer in biomass compartments. The streams with detectable DON production had higher %modified land use (agriculture + urban) in their basins than did streams with undetectable DON production.Median DON production represented 8% of total NO{
3 uptake when we used N biomass estimates based on Nassimilated over 1 d (measured directly from the 15N additions). Median DON production was 17% of total NO{
3uptake when we used N assimilated over 42 d (extrapolated from previous 15N tracer studies). Variation in DONproduction was positively correlated with ecosystem respiration, indicating that stream heterotrophy mayinfluence DON production. In-stream DON production was similar in magnitude to stream denitrification andnitrification, indicating that the production of autochthonous DON can represent a substantial transformation ofstream N. Our results confirm that headwater streams can quickly convert inorganic N into organic forms,although the ultimate fate of DON remains unclear.
Dissolved organic nitrogen (DON) generally represents alarge fraction of the total dissolved nitrogen (N) pool inrelatively unpolluted streams (Lewis et al. 1999; Perakisand Hedin 2002), and total organic N (including particulateN) dominates N flux in large rivers across North America(Scott et al. 2007). Agriculture and urban land uses oftenincrease DON concentrations and bioavailability instreams across the United States (Pellerin et al. 2006),although this increase is generally lower than the drasticincreases in inorganic N (Stanley and Maxted 2008). It istypically assumed that the majority of DON in streamsoriginates from allochthonous sources such as riparian soilsand that the resulting DON pool comprises mainlyrefractory humic compounds (Aitkenhead-Peterson et al.2003).
Most studies examining stream DON have focused onmeasuring DON fluxes in stream water or describingallochthonous sources of DON. Because production ofdissolved organic carbon (DOC) by in-stream processes canbe significant (Kaplan and Bott 1989), DON productionmay also be significant in streams. Production of autoch-thonous dissolved organic matter (DOM, a portion ofwhich is DON) by aquatic biota can occur through severalmechanisms, including the release of cell constituents viadeath, senescence, viral lysis, or herbivory (Baines and Pace1991; Bertilsson and Jones 2003), and these processes occurin both autotrophs (e.g., algae, macrophytes) and hetero-trophs (i.e., bacteria, fungi). Additionally, DOM releasefrom aquatic primary producers can occur via passiveleakage across cell membranes or active exudation,although the physiological explanation behind this releaseis not well known (Bertilsson and Jones 2003). AutotrophicDOM production may also vary among phytoplanktontaxa (Hellebust 1965), decrease with cell size (Malinsky-Rushansky and Legrand 1996), or increase in activelygrowing phytoplankton (Baines and Pace 1991). AquaticDON production is usually attributed to extracellularrelease via autotrophs in both marine and lake ecosystems,and we predict that this mechanism will apply in streams aswell.
* Corresponding author: [email protected]
Present address:a National Center for Water Quality Research, Heidelberg
University, Tiffin, Ohiob Flathead Lake Biological Station, University of Montana,
Polson, Montanac Department of Biology, Ball State University, Muncie,
Indiana
Limnol. Oceanogr., 58(4), 2013, 1271–1285
E 2013, by the Association for the Sciences of Limnology and Oceanography, Inc.doi:10.4319/lo.2013.58.4.1271
1271

It has been challenging to quantify the proportion of in-stream DON production relative to total DON fluxbecause of the lability and rapid turnover rates of this Nsource, which may include a diversity of amino acids,peptides, and proteins (Kirchman 2003). Kaplan andNewbold (2003) suggested that monomeric forms ofDON, which are compounds likely resulting from autotro-phic DON production, constitute only a small proportionof the total DON pool in streams. Yet monomeric forms ofDON are rapidly taken up in stream both by benthicbiofilms (Johnson et al. 2009) and via uptake in hyporheiczones (Brookshire et al. 2005). Results from 15N ammoni-um (NHz
4 ) tracer additions in relatively pristine headwaterstreams measured in the first Lotic Intersite NitrogeneXperiment (LINX I) found that DO15N export could bedetected in only four of 10 streams, and in those fourstreams just 4–10% of added 15N was exported as DO15N(reviewed by Ashkenas et al. [2004]), indicating either thatin-stream DON production was minimal or that autoch-thonous production of DO15N was rapidly re-assimilated.In contrast to headwater streams, Bronk et al. (1994) found25–41% of the N assimilated by phytoplankton wasreleased as DON in oceanic, coastal, and estuarineenvironments.
As part of the LINX II project, we quantified in-streamDON production and estimated the proportion of DONproduction relative to total N uptake across a wide range ofstreams flowing through varying land uses from multipleregions in North America. We measured DO15N following24 h 15N-nitrate (15NO{
3 ) additions to 36 streams located infive different regions, which varied in both their rates ofgross primary production (GPP) and in water columnnutrient availability. Based on results from lake and marineecosystems, we predicted that in-stream DON productionwould be influenced by human land use and would vary byregion because both of these factors influence GPP andnutrient concentrations. Specifically, GPP is higher instreams with open canopies (e.g., prairie, desert, and tundrastreams) and higher incident light (Mulholland et al. 2001;Bernot et al. 2010). Additionally, human land use (e.g.,agriculture, urbanization) can reduce stream canopy coverand increase light availability (Allan 2004) and alsoincrease the availability of both inorganic N and phospho-rus (P) via fertilizer and sewage inputs (Kemp and Dodds2001; Paul and Meyer 2001), which in combination canstimulate GPP (Allan 2004; Bernot et al. 2010). Wepredicted that high rates of GPP, whether associated withnaturally open canopies in reference streams (e.g., desertsand prairies) or as a result of human modification (e.g.,agriculture and urbanization), would result in higher in-stream DON production because of increased autotrophicextracellular release of DON.
Methods
Site description—We measured DO15N in a subset ofheadwater streams (n 5 36) from the LINX II. Streamswere located in five regions—three streams from Massa-chusetts (MA), six streams from southwest Michigan (MI),and nine streams each from Puerto Rico (PR), western
North Carolina and north Georgia (NC), and northwestWyoming (WY)—and ranged in discharge from 2 to268 L s21 during the study period (Table 1). Wecategorized the streams as reference (i.e., dominated bynative vegetation), agricultural, or suburban and urbanbased on land use adjacent to the stream and immediatelyupstream in the basin. The percentages of each land-usetype were measured for each stream using the U.S.Geological Survey (USGS) National Elevation Data Setand the 2001 USGS National Land Cover Datasets, exceptin the case of PR, for which we used the 1991–1992 LandsatThematic Mapper imagery, as derived by Helmer et al.(2002). Across all five regions (MA, MI, PR, NC, and WY)we selected streams to encompass a wide range ofconditions rather than to fit distinct land-use categories; amore detailed description was published by Mulhollandet al. (2008). In general, native vegetation was primarilyforest, ranging from tropical to temperate deciduous,except in WY, where native vegetation was shrub-steppewith little forest canopy cover. Agricultural land use variedregionally and included intensive row crops, cattle grazing,and irrigated pasture. Suburban and urban land use variedin intensity, including dense city centers, town parks, golfcourses, and residential development.
15NO{3 tracer additions—Here we briefly describe the
methods for the 24 h 15NO{3 tracer additions to each of the
36 streams conducted in 2003–2006; detailed methods werepublished by Mulholland et al. (2008). At each site, weadded $ 98% K15NO3 into the stream for 24 h, along witha conservative tracer (either NaCl or NaBr), at a constantrate to reach a target d15N enrichment of 20,000%; thisaddition resulted in a , 7.5% increase in background NO{
3concentrations at all sites. All 15NO{
3 tracer additions wereconducted during baseflow conditions during spring andsummer for MA, MI, NC, and WY and during the dryseason in PR. In each stream, experimental reach lengthsranged from 260 to 1832 m and varied depending ondischarge and background NO{
3 concentrations. We
collected background samples for 15NO{3 , 15N-ammonium
(15NHz4 ), DO15N, and 15N content in biomass compart-
ments (see description below) at six stations downstreamfrom the 15N release point several hours prior to the start ofthe 15NO{
3 tracer addition to estimate natural isotopicabundance. Then we collected 15NO{
3 samples at allstations 12 h and 23 h after starting the 15N tracer additionto calculate 15NO{
3 uptake. Finally, we collected samples ofDO15N, 15NHz
4 , 15NO{3 , and 15N in biomass compart-
ments 24 h after the tracer addition ended to quantifyDO15N production. We collected additional water samplesconcurrently with isotope sampling to analyze for concen-trations of NO{
3 , NHz4 , and total dissolved nitrogen
(TDN); all water samples were filtered within 2 h ofcollection (precombusted Whatman GF/F, 0.7 mm nominalpore size).
15N sample analysis—We extracted 15NO{3 using the
alkaline headspace diffusion method (Sigman et al. 1997),which required that we add 3 g of MgO and 5 g of NaCl toeach water sample to drive off NHz
4 as NH3 while boiling
1272 Johnson et al.

Table
1.
Str
eam
reg
ion
s;la
nd
-use
cla
ssif
ica
tio
ns
(cla
ss.)
;a
nd
mea
np
hy
sica
l,ch
emic
al,
an
db
iolo
gic
al
cha
ract
eris
tics
.A
dja
cen
tla
nd
use
toth
est
rea
min
clu
des
refe
ren
cest
rea
ms
wit
hn
ati
ve
veg
eta
tio
n(R
EF
),a
gri
cult
ura
l(A
G),
an
du
rba
n(U
RB
).M
ean
stre
am
dis
cha
rge,
tem
per
atu
re(T
emp
),n
itra
te(N
O{ 3
),a
mm
on
ium
(NH
z 4),
dis
solv
edo
rga
nic
nit
rog
en(D
ON
)a
nd
solu
ble
rea
ctiv
ep
ho
sph
oru
s(S
RP
)co
nce
ntr
ati
on
sa
sw
ell
as
gro
ssp
rim
ary
pro
du
ctio
n(G
PP
)a
nd
eco
syst
emre
spir
ati
on
(ER
)a
rere
po
rted
.M
od
eled
in-s
trea
mD
ON
pro
du
ctio
nra
tes
(kD
ON
pro
d)
are
sho
wn
,w
her
ed
etec
ted
.P
ara
met
ers
bel
ow
det
ecti
on
are
ind
ica
ted
by
nd
.
Reg
ion
Str
eam
La
nd
-use
cla
ssD
isch
arg
e(L
s21)
Tem
p(u
C)
NO
{ 3
(mg
NL
21)
NH
z 4
(mg
NL
21)
DO
N(m
gN
L2
1)
SR
P(m
gP
L2
1)
GP
P(g
O2
m2
2d
21)
ER
(gO
2m
22
d2
1)
kD
ON
pro
d
(h2
1)
MA
Ca
rtC
reek
RE
F5
17
.91
52
93
50
22
0.2
3.8
0.0
04
0M
AIS
_1
04
UR
B2
17
.11
33
61
21
60
20
.79
.10
.00
14
MI
Bel
lin
gh
am
AG
23
11
.81
45
32
83
10
20
.94
.10
.00
13
MI
Arc
ad
iaU
RB
11
02
0.0
27
43
21
94
11
0.8
14
.10
.00
70
NC
Jerr
yB
ran
chA
G2
61
8.0
40
61
08
45
01
80
.54
.50
.02
20
PR
Gra
nd
eA
G1
22
3.0
27
61
17
01
35
.27
.60
.01
07
PR
Ma
iza
les
AG
25
23
.02
06
77
81
27
.35
.30
.03
15
PR
Bis
ley
RE
F1
32
1.3
17
13
10
22
0.0
52
.40
.00
56
PR
Pa
red
RE
F5
22
.11
05
34
57
0.4
0.4
0.0
01
3P
RV
aca
AG
11
22
3.0
44
63
16
39
3.1
15
.70
.05
93
PR
Pet
un
iaU
RB
52
4.3
99
71
55
32
60
.34
.60
.00
10
PR
Cei
ba
UR
B4
92
5.3
51
25
04
83
22
9.3
11
.70
.01
21
WY
Gil
tner
AG
15
81
2.0
50
39
23
16
.21
1.4
0.0
01
0W
YS
pre
ad
RE
F2
68
14
.33
29
33
3.2
9.8
0.0
00
9W
YT
eto
nP
ines
UR
B9
10
.91
52
12
63
2.7
1.5
0.0
00
3M
AG
rav
elly
Bro
ok
RE
F2
21
.41
12
43
58
02
80
0.2
11
.3n
dM
IB
usk
irk
AG
61
7.9
82
21
46
81
10
.15
.6n
dM
IB
ull
etR
EF
61
2.6
38
51
11
14
21
.61
5.6
nd
MI
Ho
ney
suck
leR
EF
99
22
.24
21
32
54
0.1
7.9
nd
MI
Wa
yla
nd
UR
B1
21
7.8
69
57
45
62
51
.84
.1n
dN
CB
lack
sB
ran
chA
G1
89
16
.11
73
95
67
0.5
8.7
nd
NC
Ho
glo
tB
ran
chA
G5
31
7.6
15
51
71
00
30
.31
.6n
dN
CB
igH
urr
ica
ne
Bra
nch
RE
F1
21
4.7
24
16
86
30
.13
.4n
dN
CC
un
nin
gh
am
Cre
ekR
EF
49
12
.71
03
22
0.0
55
.2n
dN
CH
ug
hW
hit
eC
reek
RE
F1
91
2.7
73
93
0.1
2.2
nd
NC
Cra
wfo
rdB
ran
chU
RB
45
17
.31
03
15
32
43
6.5
nd
NC
Mu
dC
reek
UR
B5
21
6.7
14
06
89
20
.17
.8n
dN
CS
ug
arl
oa
fC
reek
UR
B8
01
3.8
54
31
73
0.1
17
.9n
dP
RR
itR
EF
20
19
.01
31
72
3,
10
.54
.5n
dP
RM
trib
UR
B2
32
0.8
17
42
20
48
47
31
17
.17
.4n
dW
YH
ead
qu
art
ers
AG
13
11
6.0
1.0
31
41
15
3.3
7.1
nd
WY
Kim
ba
llA
G1
54
11
.22
81
70
41
3.6
12
nd
WY
Dit
chR
EF
56
16
.8,
12
11
02
2.8
4n
dW
YT
wo
Oce
an
sR
EF
65
12
.81
94
85
10
2.9
12
.6n
dW
YF
ish
UR
B1
03
9.9
23
54
20
26
7.3
nd
nd
WY
Go
lfU
RB
11
01
8.6
11
10
32
4.2
10
nd
DON production in streams 1273

to reduce sample volumes to , 100 mL. Initial watervolumes varied across streams from 0.1 to 2 liters, to obtainat least 20 mg of N for analysis via mass spectrometry.Samples collected during the 15N tracer addition werespiked with 14N to reduce the d15N by a fivefold measurefor analytical purposes. After boiling, we added 0.5 g ofDevarda’s alloy to each sample to reduce NO{
3 to NH3 andimmediately sealed the samples in polyethylene bottlescontaining a suspended, acidified (with 25 mL of 2.5 mol L21
KHSO4) Teflon filter pack to trap NH3 from theheadspace. Bottles were then incubated at 60uC for 48 hfollowed by 1 week at room temperature on a shaker tableto ensure complete diffusion of NH3 into the headspaceand onto the acidified filter. After incubation, filters weredried in an acidified dessicator, sealed in tin capsules, andanalyzed via mass spectrometry.
We processed water samples for 15NHz4 using a similar
alkaline headspace diffusion method (Holmes et al. 1998)by adding 3 g of MgO and 50 g of NaCl per liter of sample;suspending an acidified filter pack in the bottle headspace;and incubating the samples on a shaker table at 40uC for2 weeks to allow for full diffusion of NH3 into theheadspace to be captured on the acidified filter. Again,sample volumes varied across streams based on back-ground NHz
4 concentrations and ranged from 0.5 to4 liters. We spiked 15NHz
4 samples with 14NHz4 when
concentrations were below 2 mg N L21 to raise the mass ofN to 20 mg N to allow detection by mass spectrometry.Following incubation, filters were dried and analyzed usingthe same procedure as for 15NO{
3 samples.We calculated DO15N by measuring TD15N and sub-
tracting 15NO{3 and 15NHz
4 . We analyzed TD15N samplesusing a persulfate digestion, which oxidized all N forms toNO{
3 (Valderamma 1981; Ameel et al. 1993). The persulfatedigestion reagent was added to the samples at a ratio of 2 mLreagent to 15 mL sample and was then autoclaved at 120uCfor 1 h. After cooling, samples were boiled and incubated asdescribed above for the 15NO{
3 samples, ensuring a pH . 10prior to incubation for optimal diffusion of NH3. Recoveryof N on the filters relative to the expected mass of Ncalculated from measured TDN concentrations variedacross streams and regions. In streams where we were ableto fit a model of DON production to measured DO15N flux(see description below), mean recovery by region was asfollows: MI 5 92%, WY 5 26%, PR 5 45% (range 12–97%), NC 5 59%, and MA 5 85%. In addition to dissolvedN pools, we analyzed the 15N content in various benthicbiomass compartments in each stream. Distinct patches offilamentous green algae, epilithon, epipsammon, epixylon,bryophytes, macrophytes, grass, algal mats, sand, microbialbiofilm, decomposing leaves and wood, fine benthic organicmatter, roots, and rarely invertebrates were sampled at eachdownstream station throughout the reach using methodsdescribed by Tank et al. (2000) and Mulholland et al. (2000).Samples from biomass compartments were dried and groundto fine powder, sealed in tin capsules, and analyzed via massspectrometry.
The 15N content in water samples and biomasscompartments was analyzed on either a Finnigan Delta-Sor a Europa 20/20 mass spectrometer at the Stable Isotope
Laboratory at the Marine Biological Laboratory in WoodsHole, Massachusetts, or on a Europa Integra massspectrometer at the Stable Isotope Laboratory at theUniversity of California, Davis, California. Results wereexpressed as d15N (%) 5 ([Rsample/Rstandard] 2 1) 3 1000,where Rsample is the ratio of 15N : 14N of the sample andRstandard is the ratio of 15N : 14N of the standard,atmospheric N2 (R 5 0.0036765). The d15N values wereconverted to mole fraction (MF 5 15N/[14N + 15N]) andthen corrected for ambient MF or natural abundance bysubtracting the MF of pre-addition or samples from theupstream control reach at each site. Tracer 15N fluxes werecalculated for each water sample by multiplying the MFexcess by stream discharge and the concentrations of N asNO{
3 , NHz4 , or DON. Tracer 15N (mg 15N m22) for each
biomass compartment was then calculated by multiplyingMF excess by N standing stock (mg N m22) of thatcompartment in the stream. Biomass 15N (B, mg m21) perdistance of stream length (m) was estimated by multiplyingthe areal biomass 15N (mg 15N m22) by wetted width (m).
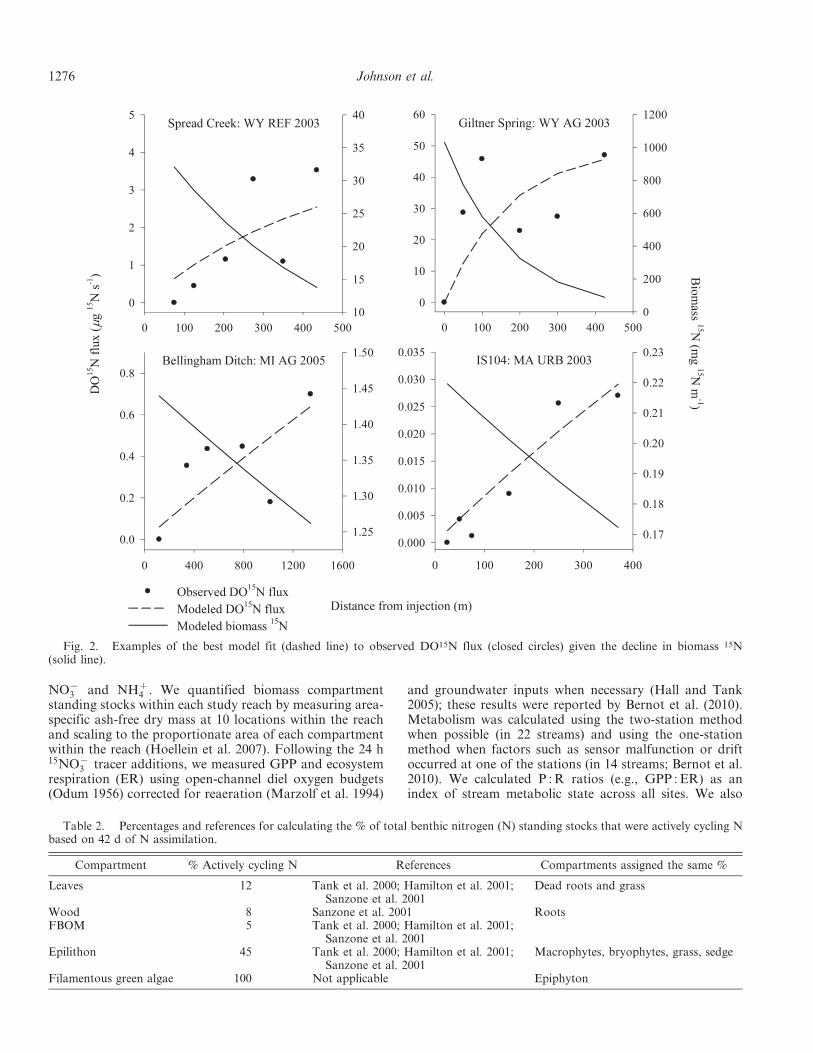
DO15N production model—The rate of DON productionwas calculated by fitting a two-compartment mass balancemodel to the longitudinal profile of DO15N flux (mg 15N s21)measured at three to seven stations 24 h after the 15N additionended, based on the method in Mulholland et al. (2000). Themodel describes the change in biomass 15N (B, mg m21) andDO15N over distance (x; Fig. 1) using the equations
d B
dx~k1B ð1Þ
d DO15N
dx~kDONprod
B{k2DO15N ð2Þ
where k1 is the measured rate of decline in biomass 15N withdistance (m21), kDONprod
is the DON production rate per unit
time (s21), and k2 is the DO15N uptake rate per unit distance(m21). The solution to Eq. 1 is
B~B0e{k1x ð3Þ
where B0 is the biomass 15N (mg m21) at the point of the15NO{
3 addition. The linearized version of Eq. 3 results in
lnB~{k1xzB0 ð4Þwhich we used to calculate k1 (slope of the decline) and B0 (y-intercept; where x 5 0) via linear regression. When thedecline in biomass 15N was not statistically significant (vialinear regression analysis, p . 0.05), we used the mostupstream values of biomass 15N for B0 and previouslypublished rates of assimilatory NO{
3 uptake for k1 (whichequals total NO{
3 uptake rate, ktot, minus NO{3 uptake due
to denitrification, kden; Mulholland et al. 2008). Substitutingfor B into Eq. 2, we solved for DO15N (mg 15N s21), thus:
DO15N~kDONprod
B0
k2{k1(e{k1x{e{k2x)zDO15N0e{k2x ð5Þ
Because there was no tracer DO15N at the point of the15NO{
3 addition (DO15N0 5 0), we ignored the last term inEq. 5.
1274 Johnson et al.

We iteratively solved for values of the two unknowns,kDONprod
and k2, that minimized the negative log-likelihoodof the modeled DON flux (Eq. 5) with observed longitu-dinal DO15N flux (Fig. 2; Hilborn and Mangel 1997). Thelikelihood function assumed errors were normally distrib-uted. To estimate k2, or the uptake rate of DON, thelongitudinal pattern in the flux of DO15N must exhibit ahump-shaped profile (rather than a linear increase), whichwould result from an increase in DO15N via productionfollowed by a downstream decrease due to uptake. Becauseonly one stream exhibited a humped-shaped curve (WYurban 2004, data not shown), we generally assumed DO15Nuptake was 0 (i.e., k2 5 0) and only solved for oneparameter kDONprod
that best fit the increase in DO15N fluxwith distance downstream. We then estimated kDONprod
byminimizing the negative log-likelihood of the model in Eq.5 relative to the data using the nlm function in R (RDevelopment Core Team 2011). We graphed the likelihoodprofile across a broad range of the free parameter, kDONprod
,for each model fit to ensure that that the solution estimatedusing the nonlinear minimization was in fact the globalminimum of the negative log-likelihood profile. Weestimated uncertainty on parameter values via a likelihoodratio test that was equivalent to a 95% confidence interval(Hilborn and Mangel 1997). In this test, values of kDONprod
,with negative log-likelihood . 1.92 of the minimum weredeemed unlikely and outside of the 95% confidence interval(Hilborn and Mangel 1997). If the values of kDONprod
withinthis confidence interval included zero, then kDONprod
wasconsidered to be not significantly different than zero.
Constraining estimates of total in-stream DON produc-tion—To calculate DON production (mg m22 h21), wemultiplied kDONprod
(h21) by the summed benthic standing
stock of N (mg m22) in each stream that was available to bereleased as DON. Because we do not know the exact size ofthe N standing stock that contributed to DON production,we bracketed our estimate of DON production using twoestimates of the benthic N standing stock that wouldactively cycle DON. The first estimate we used was theactively cycling N biomass based on 1 d of N assimilation.This estimate was directly measured as the amount of Nassimilated into biomass during the 24 h 15N traceraddition and not immediately mineralized to NHz
4 (mg Nm22 h21, derived from 15NO{
3 tracer uptake during 24 hadditions; see Mulholland et al. [2008] for reach-scaleuptake rates). Assimilatory N uptake corrected for loss viamineralization (Uassim) was calculated using the equation
Uassim~(Utot{Uden)|(1{fraction mineralized) ð6Þ
where Utot is the total N uptake measured during the 15Ntracer addition, Uden is the amount of N uptake due todenitrification, and the fraction mineralized is the propor-tion of Uassim released as NHz
4 (L.T. Johnson unpubl.). Wemultiplied the corrected Uassim by 24 h to calculate theamount of N assimilated during the 15N tracer addition.Hereafter, we refer to DON production calculated with thisestimate of N biomass as DON production based on Nassimilated over 1 d.
Because stream N pools did not reach isotopic equilib-rium during our 24 h 15NO{
3 tracer additions, activelycycling N biomass based on 1 d of N assimilation mayunderestimate the true N biomass available for release asDON. Therefore, we also calculated the actively cycling Nbiomass based on previous 15N tracer additions conductedfor 42 d, in which most biomass compartments reachedisotopic equilibrium (Peterson et al. 2001). We call thisapproach DON production based on N assimilated over42 d. These estimates of actively cycling N biomass werecalculated using previously published measurements fromthe LINX I experiments of the % actively cycling N of totalN biomass from various stream compartments, except forfilamentous green algae, which we set at 100% (see Table 2for citations, note that streams differed from LINX II). Ineach stream, we then multiplied the % of actively cycling Nby the total benthic N standing stock for each compart-ment and summed each compartment within the stream.Compartments that were not included in these earlierstudies were categorized into similar compartments (e.g.,dead grass was assigned the same % as leaves; Table 2).
Stream ecosystem characteristics—As a part of the largerLINX II project, multiple ancillary variables were mea-sured to help identify controls on NO{
3 cycling. Back-ground water chemistry measurements were analyzed usingthe following methods: NO{
3 was measured using ionchromatography or colorimetry (APHA 1995), NHz
4 usingindophenol colorimetry or fluorometry (APHA 1995;Holmes et al. 1999; Taylor et al. 2007), soluble reactivephosphorus (SRP) using molybdate-blue colorimetry(APHA 1995), and DOC and TDN using high-temperaturecombustion and chemiluminescence (APHA 1995). Wecalculated DON concentration as TDN minus the sum of
Fig. 1. Conceptual diagram of the two-compartment massbalance model used to calculate DON production rates. Thismodel describes the rate (kDONprod
; h21) at which 15N in biomass(B; mg 15N m22) is released as DO15N (DO15N; mg 15N s21) andthe rate of uptake for released DO15N (k2; m21). We found noevidence of DO15N uptake in 14 of 15 streams and solved onlyfor kDONprod
.
DON production in streams 1275
NO{3 and NHz
4 . We quantified biomass compartmentstanding stocks within each study reach by measuring area-specific ash-free dry mass at 10 locations within the reachand scaling to the proportionate area of each compartmentwithin the reach (Hoellein et al. 2007). Following the 24 h15NO{
3 tracer additions, we measured GPP and ecosystemrespiration (ER) using open-channel diel oxygen budgets(Odum 1956) corrected for reaeration (Marzolf et al. 1994)
and groundwater inputs when necessary (Hall and Tank2005); these results were reported by Bernot et al. (2010).Metabolism was calculated using the two-station methodwhen possible (in 22 streams) and using the one-stationmethod when factors such as sensor malfunction or driftoccurred at one of the stations (in 14 streams; Bernot et al.2010). We calculated P : R ratios (e.g., GPP : ER) as anindex of stream metabolic state across all sites. We also
Fig. 2. Examples of the best model fit (dashed line) to observed DO15N flux (closed circles) given the decline in biomass 15N(solid line).
Table 2. Percentages and references for calculating the % of total benthic nitrogen (N) standing stocks that were actively cycling Nbased on 42 d of N assimilation.
Compartment % Actively cycling N References Compartments assigned the same %
Leaves 12 Tank et al. 2000; Hamilton et al. 2001;Sanzone et al. 2001
Dead roots and grass
Wood 8 Sanzone et al. 2001 RootsFBOM 5 Tank et al. 2000; Hamilton et al. 2001;
Sanzone et al. 2001Epilithon 45 Tank et al. 2000; Hamilton et al. 2001;
Sanzone et al. 2001Macrophytes, bryophytes, grass, sedge
Filamentous green algae 100 Not applicable Epiphyton
1276 Johnson et al.

measured stream temperature continuously for 3 d duringthe tracer additions and calculated discharge from thedilution of a conservative tracer (sodium chloride orbromide; Webster and Valett 2006).
Statistical analysis—To analyze these data, we firstexamined factors that influenced our ability to detectDO15N production, then we explored how varying land useaffected DON production, and finally we identified whatfactors controlled variation in detectable DON production.We used a logarithmic transformation when necessary tohomogenize variances if the assumptions of parametricstatistics were not met. We used logistic regression toidentify stream characteristics that differed among streamswith detectable vs. undetectable DON production. We alsoused a one-way ANOVA followed by a Tukey’s test tocategorically examine the effect of land use on DONproduction. We used Pearson’s product moment correla-tion to relate ancillary variables to in-stream DONproduction. To assess how the magnitude of DONproduction compared to other N cycling processes instreams, we compared DON production to denitrificationmeasured within the same streams (from the LINX IIproject, Mulholland et al. 2008) using a paired t-test and tonitrification measured in 11 relatively unaltered streams(LINX I project, Peterson et al. 2001) using a t-test. Thesestatistical analyses were performed using SYSTAT 12(Systat Software), with statistical significance determinedat the a 5 0.05 level.
Results
Stream characteristics—Streams were highly variable inbiological and chemical attributes (Table 1). Ambient NO{
3concentration varied greatly (, 1–1453 mg N L21) amongstreams and was higher in urban streams (389 6 418standard deviation [SD] mg N L21) compared to agricultural(297 6 410 SD mg N L21) and reference (92 6 117 SD mg NL21) streams (ANOVA, F2,35 5 3.45, p 5 0.043). Althoughsome agricultural streams had higher NO{
3 concentrationscompared to reference streams, they were not statisticallydistinct (Tukey’s test, p 5 0.16). GPP and ER differed by a10-fold measure among the 36 streams (GPP 0.1–16.2 g O2
m22 d21; ER 0.4–17.9 g O2 m22 d21), resulting in P : R ratiosfrom 0.01 to 1.8 (Bernot et al. 2010). Most streams (n 5 31)were heterotrophic (i.e., P : R , 1), and five streams wereautotrophic on the day of the tracer addition (P : R . 1).Other factors were similarly variable (Table 1); mean streamtemperature varied from 9.9uC to 25.3uC, NHz
4 concentra-tions varied from 1 to 2204 mg N L21, and ambient SRPconcentrations varied from , 1 to 311 mg P L21. DONconcentrations ranged from 2 to 847 mg N L21.
Detecting in-stream DON production—Across the 36streams, DO15N flux was measurable in 26 streams butexhibited no downstream pattern and thus resulted in non-significant production rates in 11 streams. In the remaining15 streams, DO15N flux was measureable and increasedthroughout the stream reach, resulting in DON productionrates that were significant (i.e., the confidence intervals did
not contain zero). Of those streams, DON production rates(kDONprod
) ranged 44-fold from 0.0003 to 0.059 h21
(Fig. 3A). Across regions, 11 of the 15 streams withkDONprod
. 0 drained agricultural or urban land use, andalmost half of these streams were in PR (five streams). Weexpected to find detectable kDONprod
across all WY streamsbecause they had the highest rates of GPP (. 2.7 g O2
m22 d21); however, we only detected DON production inthree of nine streams in that region. We also expected tofind detectable kDONprod
in all agricultural and urbanstreams with high GPP, but kDONprod
was undetectable inseven of 13 such streams that had GPP between 1.8 and13.6 g O2 m22 d21 (Table 1).
Streams with detectable DON production (n 5 15) had ahigher % modified land use (agriculture + urban) in thestream basin compared to streams with undetectable DONproduction (n 5 21; Fig. 4; logistic regression, p 5 0.01).Similarly, NO{
3 concentrations in streams with detectableDON production were significantly higher than in streamswith undetectable DON production (logistic regression, p5 0.04). NO{
3 concentrations correlated positively with %modified land use (Pearson’s correlation, r 5 0.56, p 50.03).
Among streams with detectable DON production,kDONprod
was positively correlated with background SRPconcentrations (Fig. 5A; r 5 0.53, p 5 0.04, n 5 15) andmean stream temperature (Fig. 5B; r 5 0.64, p 5 0.01, n 515) and weakly correlated with increases in ER (Fig. 5C;r 5 0.44, p 5 0.10, n 5 15). Temperature and SRPconcentrations were also strongly correlated with eachother (r 5 0.78, p . 0.001, n 5 15). There were nosignificant correlations between kDONprod
and GPP, P : Rratios, or forms of dissolved N (NO{
3 , NHz4 , DON, or
TDN; p . 0.05, n 5 15).
DON production—The standing stock of N available forDON production varied among streams and dependedupon whether we estimated actively cycling N biomassbased on 1 d of N assimilation (measured directly from our15NO{
3 additions) or based on 42 d of N assimilation (fromLINX I studies; Table 3). When calculated from 1 d of Nassimilation, actively cycling N biomass estimates rangedfrom 7 to 659 mg N m22, and, except for three streams,actively cycling N biomass estimates based on 42 d of Nassimilation were higher (53–6435 mg N m22; Table 3).Furthermore, N biomass from the two calculations within astream were up to 188% different (median 122%), althoughin one stream (Bellingham), N biomass measures from thetwo calculations fell within 2% of each other (Table 3).
DON production based on N assimilated over 1 d variedwidely across streams and ranged from 0.02 to 6.84 mg Nm22 h21 (median 5 0.22 mg N m22 h21). Unlike kDONprod
,the lowest DON production was in Spread Creek, a WYreference stream, and the highest was in Maizales, anagricultural stream in PR. DON production was margin-ally correlated with SRP concentrations (Fig. 5D; r 5 0.50,p 5 0.06, n 5 15), stream temperature (Fig. 5E; r 5 0.50, p5 0.06, n 5 15), and ER (Fig. 5F; r 5 0.51, p 5 0.06, n 515) but was not associated with metrics of streamautotrophy or forms of dissolved N (p . 0.05, n 5 15).
DON production in streams 1277

Fig. 3. DON production across all 15 streams varied by stream, dominant riparian land use(reference 5 dark gray, agricultural 5 white, urban 5 light gray), and year. The best model fitdetermined from maximum likelihood estimation (MLE) are reported for (A) per-unit time DONproduction rates (kDONprod
) and two estimates of areal DON production calculated by multiplyingkDONprod
by actively cycling N biomass based on (B) 1 d of N assimilation or (C) 42 d ofN assimilation.
1278 Johnson et al.

Median DON production based on N assimilated over42 d was 0.88 mg N m22 h21 and was higher than over 1 din all but three PR streams (Grande, Maizales, and Ceiba).As with kDONprod
, the lowest DON production was in TetonPines, a WY urban stream (0.11 mg N m22 h21), while thehighest DON production was in Vaca, a PR agriculturalstream (9.22 mg N m22 h21). DON production was notcorrelated with SRP concentrations (Fig. 5G; r 5 0.19, p 50.49, n 5 15) or stream temperature (Fig. 5H; r 5 0.25, p 50.37, n 5 15). However, DON production was significantlycorrelated with ER, similar to results found with kDONprod
(Fig. 5I; r 5 0.57, p 5 0.03, n 5 15). DON production wasnot correlated to metrics of stream autotrophy (e.g., GPPor P : R ratios) or forms of dissolved N (p . 0.05, n 5 15).
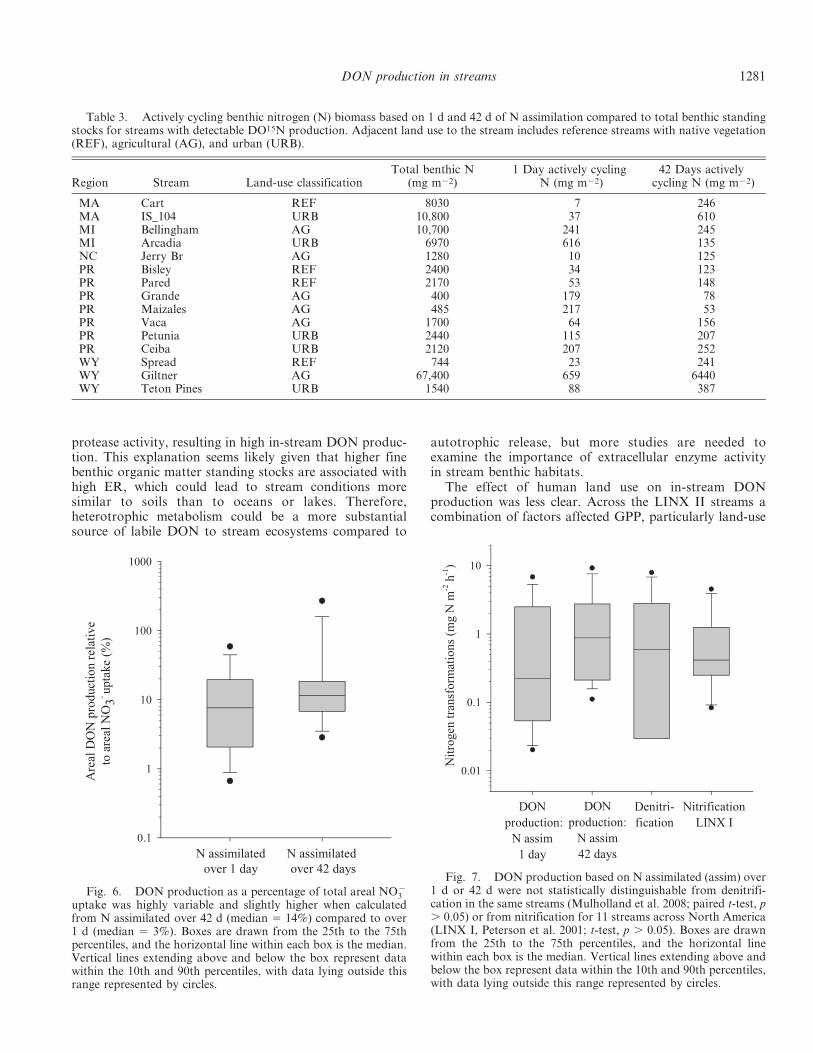
DON production was often a substantial proportion oftotal NO{
3 uptake in streams. DON production based on Nassimilated over 42 d was a greater proportion of totalNO{
3 uptake (range 5 3–317%; median 5 17%) than over1 d (range 5 1–59%; median 5 8%; Fig. 6). In fact, in twostreams, DON production calculated from N assimilatedover 42 d was even higher than total NO{
3 uptake (Cart, aMA reference stream [317%] and Jerry Branch, a NCagricultural stream [240%]), which indicates that weoverestimated actively cycling N biomass with the 42 dapproach in these streams. In comparison to other Ncycling fluxes, rates of DON production calculated from Nassimilated over either 1 d (median 5 0.22 mg N m22 h21)or 42 d (median 5 0.88 mg N m22 h21) were notsignificantly different than rates of denitrification measuredin the same streams of mixed land use used in the LINX IIproject (median 5 0.58 mg N m22 h21; 1 d paired t-test, t 5
20.35, df 5 14, p 5 0.74; 42 d paired t-test, t 5 0.44, df 514, p 5 0.67) or nitrification measured in 11 relativelyunaltered streams from the LINX I project (median 50.42 mg N m22 h21; 1 day t-test, t 5 20.67, df 5 24, p 50.51; 42 d t-test, t 5 1.11, df 5 24, p 5 0.28; Fig. 7).
Discussion
Overall, in 26 of 36 headwater streams draining differentland-use types across North America, we were able tomeasure DO15N flux from assimilated 15NO{
3 incorporatedinto biomass compartments after a 24 h tracer additionindicating DON was produced within each of thesestreams. Further, DON production was statistically signif-icant in 15 streams, where DO15N flux increased withdistance downstream. Thus, we suggest that in somestreams, a measurable fraction of assimilated NO{
3 canquickly (, 24 h) be released back into stream water asDON. When it was measurable, in comparison to other Ntransformation rates, DON production was not statisticallydistinguishable from denitrification rates quantified in thesame streams (Mulholland et al. 2008) or from nitrificationrates measured in 11 relatively pristine streams associatedwith the LINX I project (Peterson et al. 2001; Webster et al.2003; Fig. 7); all three of these transformation rates varyconsiderably across headwater streams.
Our results showing that autochthonous DON produc-tion can be similar to other transformation rates of N (e.g.,nitrification, denitrification) support results from otheraquatic ecosystems. Autochthonous DON production is akey component of the N cycle in the open ocean and is adominant source of the total DON pool (Berman andBronk 2003). Autochthonous DON production is similarlyimportant in lake ecosystems, although most studies havepreviously focused on DOC production as a percent of Cfixed during photosynthesis (reviewed by Bertilsson andJones [2003]). Other estimates of autochthonous DONproduction in streams are limited to results from the15NHz
4 additions from the LINX I studies (as reviewed byAshkenas et al. [2004]) and 15NO{
3 additions to SpringCreek in Idaho (Hall et al. 2009a), where incorporation of15N into DO15N was analyzed via mass balance, ratherthan direct measurement. From these studies in relativelypristine low-nutrient streams, DO15N production repre-sented no more than 10% of assimilated 15N tracer. Inaddition, Kaplan and Bott (1989) found that labileconstituents of DON (dissolved free amino acids) exhibiteddiel cycles associated with a vernal algal bloom in a streamdraining an agricultural landscape (White Clay Creek,Pennsylvania). Our results from 15 streams indicate that in-stream DON production represented a median of 8–17% oftotal NO{
3 uptake and was therefore a potentially largetransformation of N. By including the study of streamswith varying nutrient status, our results refine ourunderstanding of N cycling in headwater streams, whereDON inputs have previously been assumed to be dominat-ed by allochthonous sources (Aitkenhead-Peterson et al.2003).
In-stream DON production correlated positively withER, a measure of both stream heterotrophy and autotrophy,
Fig. 4. Streams with detectable DO15N production hadhigher % modified land use (agriculture + urban) in the streambasin compared to streams undetectable DO15N production(ndetectable 5 15, nundetectable 5 21), as indicated via logisticregression. The logit curves of the probability of detectable DONproduction are reported (Logit 5 21.404 + [0.0311 3 arcsinesquare root % modified land use]; p 5 0.013).
DON production in streams 1279

rather than with any metric directly reflecting streamautotrophy (GPP, P : R, light availability), thus implyingan influence of stream heterotrophy on DON production.We found this result somewhat surprising given thatassimilated N standing stocks were positively correlated toGPP (r 5 0.55, p 5 0.04, n 5 15). The role of heterotrophs inthe cycling of DON is often considered to be consumptive,especially because autochthonous DON tends to be morebioavailable than allochthonous DON (Kaplan and New-bold 2003). Further, DON produced in-stream may also be asource of energy (i.e., organic C to support heterotrophicrespiration) when inorganic N is elevated, as suggested byLutz et al. (2011) for streams across an N gradient in thesouthern Appalachian Mountains. Across all 72 streams inthe LINX II data set, ER was influenced by a multitude ofparameters, including land-use type, inorganic N availabil-ity, benthic organic matter standing stocks, temperature,
and GPP, but ER was primarily driven by fine benthicorganic matter standing stocks and was also correlated withGPP (i.e., indicating that part of ER was autotrophicrespiration; Bernot et al. 2010). Thus, we think that thiscorrelation with ER results from a combination ofproduction and consumption processes and indicates apotential role of heterotrophic microbes in regulating DONproduction in streams.
Another possible explanation for this correlation isextracellular enzyme activity. In soils, extracellular prote-ases are thought to be responsible for much of theproduction of labile DON (e.g., amino acids; Schimel andBennett 2004). Proteolysis of soil proteins and peptides isusually higher than net mineralization and can be a largesource of free amino acids (Lipson and Nasholm 2001). Ifstream microbes are behaving similarly to their terrestrialcounterparts, streams with high ER may also have high
Fig. 5. Correlations of SRP, temperature, and ER with (A–C) DON production rates (kDONprod) and DON production based on N
assimilated over (D–F) 1 d and (G–I) over 42 d. Significant associations were estimated using Pearson’s product moment correlation (p ,0.05), and all data except for temperature data were log-transformed prior to analysis.
1280 Johnson et al.
protease activity, resulting in high in-stream DON produc-tion. This explanation seems likely given that higher finebenthic organic matter standing stocks are associated withhigh ER, which could lead to stream conditions moresimilar to soils than to oceans or lakes. Therefore,heterotrophic metabolism could be a more substantialsource of labile DON to stream ecosystems compared to
autotrophic release, but more studies are needed toexamine the importance of extracellular enzyme activityin stream benthic habitats.
The effect of human land use on in-stream DONproduction was less clear. Across the LINX II streams acombination of factors affected GPP, particularly land-use
Table 3. Actively cycling benthic nitrogen (N) biomass based on 1 d and 42 d of N assimilation compared to total benthic standingstocks for streams with detectable DO15N production. Adjacent land use to the stream includes reference streams with native vegetation(REF), agricultural (AG), and urban (URB).
Region Stream Land-use classificationTotal benthic N
(mg m22)1 Day actively cycling
N (mg m22)42 Days actively
cycling N (mg m22)
MA Cart REF 8030 7 246MA IS_104 URB 10,800 37 610MI Bellingham AG 10,700 241 245MI Arcadia URB 6970 616 135NC Jerry Br AG 1280 10 125PR Bisley REF 2400 34 123PR Pared REF 2170 53 148PR Grande AG 400 179 78PR Maizales AG 485 217 53PR Vaca AG 1700 64 156PR Petunia URB 2440 115 207PR Ceiba URB 2120 207 252WY Spread REF 744 23 241WY Giltner AG 67,400 659 6440WY Teton Pines URB 1540 88 387
Fig. 6. DON production as a percentage of total areal NO{3
uptake was highly variable and slightly higher when calculatedfrom N assimilated over 42 d (median 5 14%) compared to over1 d (median 5 3%). Boxes are drawn from the 25th to the 75thpercentiles, and the horizontal line within each box is the median.Vertical lines extending above and below the box represent datawithin the 10th and 90th percentiles, with data lying outside thisrange represented by circles.
Fig. 7. DON production based on N assimilated (assim) over1 d or 42 d were not statistically distinguishable from denitrifi-cation in the same streams (Mulholland et al. 2008; paired t-test, p. 0.05) or from nitrification for 11 streams across North America(LINX I, Peterson et al. 2001; t-test, p . 0.05). Boxes are drawnfrom the 25th to the 75th percentiles, and the horizontal linewithin each box is the median. Vertical lines extending above andbelow the box represent data within the 10th and 90th percentiles,with data lying outside this range represented by circles.
DON production in streams 1281

activity, light availability, and DIN concentrations (Bernotet al. 2010). We anticipated that increased GPP resultingfrom human land-use activities, specifically canopy-clearingcombined with increased background nutrient concentra-tions, would stimulate in-stream DON production. Insupport of this prediction, streams with detectable DO15Nproduction had a higher proportion of human-modified landuse in their drainage basins, and SRP availability waspositively correlated with DON production rates (kDONprod
).
This correlation with SRP may indicate an influence of landuse because agricultural and urban land-use practicesgenerally increase stream SRP. However, SRP concentra-tions in our 15 streams with measurable in-stream DONproduction were not related to % human land use in thebasin and only reached a maximum of 26 mg P L21. Inaddition, we found no direct relation with GPP and DONproduction, indicating that autotrophic DON release wasnot the mechanism behind the influence of land use. Becausebacteria can use DON as a source of organic C (Lutz et al.2011), if human land use resulted in high labile DOC alongwith elevated inorganic N, DON produced within the streammay have been consumed slowly, allowing us to detect itsproduction.
The most consistent correlate of DON production, ER,was not directly affected by human land use based uponstructural equation modeling (SEM; Bernot et al. 2010). Infact, again using SEM, we found no direct effect of humanland use on assimilatory 15NO{
3 uptake in the larger LINXII study of 72 streams because the effects of human land usewere varied and in opposition to each other (Hall et al.2009b). Such complicated relationships likely hold true forin-stream DON production as well. Overall, human landuse may increase in-stream DON production, but furtherstudy is required to fully understand the strength andcausative nature of this relationship.
Our inability to detect DO15N production in many ofour study streams may have been influenced by method-ological difficulties associated with the indirect measure-ment of DO15N using the persulfate digestion method(Valderrama 1981; Ameel et al. 1993). In general, thisapproach requires highly accurate measurements of15NHz
4 , 15NO{3 , and TD15N to accurately estimate
DO15N by subtraction; analytical errors in any step canresult in high variation in DO15N estimates (Bronk et al.2000). Streams with lower percent recovery (, 50%) oftenhad a confounding matrix of complex DOM in streamwater, as exemplified by one of the MI reference streamsthat drained a wetland (recovery 5 44%). In these cases, wesuggest that the digestion reagent may interact with thesurrounding stream-water matrix, thereby reducing diffu-sion of 15NH3 into the headspace and reducing percentrecovery. We are unsure of the effect that low percentrecovery following persulfate digestion may have on thed15N signatures used to calculate DO15N, but priorresearch in soils indicates that the mole fraction of 15Ndecreases with increasing percent recovery (Stark and Hart1996). Therefore, in cases in which the percent recovery ofDON was low (e.g., in WY and Pared and Maizales in PR),we may have overestimated DO15N and thus overestimatedDO15N production rates. More likely, however, the lower
recovery in some streams would result in higher variabilityamong samples, making it less likely that we would be ableto detect significant DON production. Nevertheless,streams with low N recovery generally had low DO15Nproduction rates compared to streams with higher percentrecovery, but estimates from streams with low percentrecovery should be viewed with caution.
Both structural (e.g., biomass) and functional (e.g.,activity) attributes of the particulate organic N pool willinfluence apparent rates of in-stream DON production. Themetrics used to represent actively cycling N biomass affectedestimates of autochthonous DON production among someof the 15 streams. For example, Giltner Spring, a WYagricultural stream, had the third lowest kDONprod
(0.001 h21),but because it had the highest actively cycling N standingstocks, DON production per unit stream bed area was thesecond highest we measured. In contrast, Cart Creek, a MAreference stream, had moderate kDONprod
, but N assimilatedinto standing stocks was the lowest across all our studystreams, resulting in the third lowest DON production rates.Yet in other cases, all components of the DON productioncalculation were high, such as in Vaca, an agriculturalstream in PR, where we found the highest kDONprod
as well asthe third highest DON production based on N assimilatedover 1 d and the highest DON production based on Nassimilated over 42 d. Additionally, in most cases, theestimate of DON production based on N assimilated over42 d was higher than that estimated over 1 d. Although weare confident that N assimilated over 1 d likely underesti-mates actively cycling N standing stocks, there is someuncertainty in applying estimates of N assimilated over 42 dfrom the fraction of actively cycling N standing stocksderived from other studies. Therefore, we feel these estimatesof DON production bracket actual rates that likely fallsomewhere in between. More research quantifying in-streamDON production is needed, with particular emphasis on theidentification of the fraction of total benthic N standingstocks that is available for transformation into other formsof N.
In-stream DON production may be an overlookedand underestimated pathway that can alter the formand bioavailability of N in streams. Research on streamDON cycling has focused primarily on allochthonous DONbecause in many streams it represents most of the DONpool (McDowell and Asbury 1994; Campbell et al. 2000;Perakis and Hedin 2002). Often only a fraction ofallochthonous DON is bioavailable (Volk et al. 1997;Kaushal and Lewis 2005), though this fraction mayincrease with human activity (Seitzinger and Sanders1997; Pellerin et al. 2006). Therefore, DON producedwithin streams following assimilation of inorganic N islikely a more bioavailable source of DON and may be abiologically significant source of N for stream organismscompared to allochthonous DON. That said, when we usedthe two-compartment model to estimate DON uptake, wecould only quantify DO15N uptake in one stream. Wesuggest three potential explanations for this phenomenon:(1) reach lengths were not long enough to detect asignificant decline in DO15N 24 h after the end of the15NO{
3 addition, because reach lengths were optimized to
1282 Johnson et al.

measure NO{3 uptake; (2) in-stream DON may not have
been consumed at a measurable rate in these streams; or (3)bioavailable DON may have been rapidly consumed withinstream biofilms (i.e., internal cycling) prior to reaching thewater column where DO15N samples were collected.Although we generally could not document DON uptake,we know that DON produced within the stream wasexported downstream, where it may serve as a source ofbioavailable organic N for downstream systems.
At the watershed scale, in-stream DON production inhuman-altered streams could influence N removal within astream network. Across all 72 LINX II streams, most15NO{
3 retained was assimilated into biomass (84% of Nretention) rather than denitrified (16%; Mulholland et al.2008; Hall et al. 2009b). Given that some fraction ofassimilated 15NO{
3 would be released as DON, it thenbecomes unavailable for immediate and permanent remov-al via denitrification. Moreover, for this newly producedDON to be transformed back into NO{
3 and becomeavailable for denitrification, it would have to be assimilatedby stream biota, mineralized to NHz
4 , and then nitrified toNO{
3 . We also know that as inorganic N concentrationsincrease in streams (e.g., due to land-use change), theefficiency of denitrification in reducing NO{
3 loads alsodeclines (Royer et al. 2004; Mulholland et al. 2008), and thein-stream DON production pathway may have less of aneffect on net stream N retention. It is currently unclear howin-stream DON production and its subsequent assimilationis influenced by high background concentrations of NHz
4and NO{
3 , both of which are highly bioavailable incomparison. Yet, once transported by rivers to estuaries,autochthonous DON may stimulate eutrophication, asSeitzinger and Sanders (1997) found in the Delaware andHudson River estuaries draining mixed land use. Thus, it isimperative that we fully understand the interaction betweenin-stream DON production and inorganic N cycling,especially in the context of changing human land use.
In summary, the use of 24 h 15NO{3 tracer additions
showed that in-stream DON production can represent asubstantial portion of NO{
3 uptake in some streams, andDON production rates were similar to other biogeochemicaltransformations of N (e.g., denitrification and nitrification).The specific mechanisms by which stream heterotrophy andhuman land use affected autochthonous DON productionare less clear, but nonetheless our results indicate that bothmay regulate DON production either through streamstructure (e.g., the standing stock of N available for DONproduction or function (e.g., the rate of DON productionper unit time). More importantly, our data reinforce theconclusion that streams quickly convert inorganic N intoorganic forms, both particulate and dissolved. Yet the fate oforganic N in downstream ecosystems remains uncertain,particularly in the face of anthropogenic N enrichment.
AcknowledgmentsWe thank the National Science Foundation (NSF) Long Term
Ecological Research network, the U.S. Forest Service, theNational Park Service, local municipalities, and the many privatelandowners who granted us access to their property. We alsothank the many students and scientists who helped with fieldwork
and laboratory analyses that contributed to the LINX II projectand especially those associated with the subset of regions includedin this study. Reviews by Emily Bernhardt, Natalie Griffiths, MiaStephen, and an anonymous reviewer greatly improved earlierversions of this manuscript. This work was supported by a grantfrom the National Science Foundation Division of EnvironmentalBiology (NSF DEB-0111410), and L. Johnson was partiallysupported by fellowships from the Center for Aquatic Conserva-tion at the University of Notre Dame and the Bayer Corporationwhile preparing this manuscript. This article is dedicated to thememory of Patrick J. Mulholland, whose exceptional leadershipensured the success of the LINX II project. His inspiration to thefield of stream biogeochemistry has been immeasurable and hissupport and collaboration will be sorely missed.
References
AITKENHEAD-PETERSON, J. A., W. H. MCDOWELL, AND J. C. NEFF.2003. Sources, production, and regulation of allochthonousdissolved organic matter inputs to surface waters, p. 26–70. In S.E. G. Findlay and R. L. Sinsabaugh [eds.], Aquatic ecosystems:Interactivity of dissolved organic matter. Academic Press.
ALLAN, J. D. 2004. Landscapes and riverscapes: The influence ofland use on stream ecosystems. Ann. Rev. Ecol. Syst. 35:257–284, doi:10.1146/annurev.ecolsys.35.120202.110122
AMEEL, J. J., R. P. AXLER, AND C. J. OWEN. 1993. Persulfatedigestion for determination of total nitrogen to the Gulf ofMexico. Nature 403: 758–761.
AMERICAN PUBLIC HEALTH ASSOCIATION (APHA). 1995. Standardmethods for the examination of water and wastewater, 19thed. APHA.
ASHKENAS, L. R., S. L. JOHNSON, S. V. GREGORY, J. L. TANK, AND
W. M. WOLLHEIM. 2004. A stable isotope tracer study ofnitrogen uptake and transformation in an old-growth foreststream. Ecology 85: 1725–1739, doi:10.1890/03-0032
BAINES, S. B., AND M. L. PACE. 1991. The production of dissolvedorganic matter by phytoplankton and its importance to bacteria:Patterns across marine and freshwater systems. Limnol.Oceanogr. 36: 1078–1090, doi:10.4319/lo.1991.36.6.1078
BERMAN, T., AND D. A. BRONK. 2003. Dissolved organic nitrogen:A dynamic participant in aquatic ecosystems. Aquat. Microb.Ecol. 31: 279–305, doi:10.3354/ame031279
BERNOT, M. J., AND OTHERS. 2010. Inter-regional comparison ofland-use effects on stream metabolism. Freshw. Biol. 55:1874–1890, doi:10.1111/j.1365-2427.2010.02422.x
BERTILSSON, S., AND J. B. JONES. 2003. Supply of dissolved organicmatter to aquatic ecosystems: Autochthonous sources, p. 3–24. InS. E. G. Findlay and R. L. Sinsabaugh [eds.], Aquatic ecosystems:Interactivity of dissolved organic matter. Academic Press.
BRONK, D. A., P. M. GLIBERT, AND B. B. WARD. 1994. Nitrogenuptake, dissolved organic nitrogen release, and new production.Science 265: 1843–1846, doi:10.1126/science.265.5180.1843
———, M. W. LOMAS, P. M. GLIBERT, K. J. SCHUKERT, AND M. P.SANDERSON. 2000. Total dissolved nitrogen analysis: Compar-isons between the persulfate, UV and high temperatureoxidation methods. Mar. Chem. 69: 163–178, doi:10.1016/S0304-4203(99)00103-6
BROOKSHIRE, E. N. J., H. M. VALETT, S. A. THOMAS, AND J. R.WEBSTER. 2005. Coupled cycling of dissolved organic nitrogenand carbon in a forest stream. Ecology 86: 2487–2496,doi:10.1890/04-1184
CAMPBELL, J. L., J. W. HORNBECK, W. H. MCDOWELL, D. C. BUSO,J. B. SHANLEY, AND G. E. LIKENS. 2000. Dissolved organicnitrogen budgets for upland, forested ecosystems in NewEngland. Biogeochemistry 49: 123–142, doi:10.1023/A:1006383731753
DON production in streams 1283

HALL, R. O., JR., M. A. BAKER, C. D. ARP, AND B. J. KOCH. 2009a.Hydrologic control of nitrogen removal, storage, and exportin a mountain stream. Limnol. Oceanogr. 54: 2128–2142,doi:10.4319/lo.2009.54.6.2128
———, AND J. L. TANK. 2005. Correcting whole-stream estimatesof metabolism for groundwater input. Limnol. Oceanogr.:Methods 3: 222–229, doi:10.4319/lom.2005.3.222
———, AND OTHERS. 2009b. Nitrate removal in stream ecosystemsmeasured by 15N addition experiments: Total uptake. Limnol.Oceanogr. 54: 653–665, doi:10.4319/lo.2009.54.3.0653
HAMILTON, S. K., J. L. TANK, D. F. RAIKOW, W. M. WOLLHEIM, B. J.PETERSON, AND J. R. WEBSTER. 2001. Nitrogen uptake andtransformation in a Midwestern U.S. stream: A stable isotopeenrichment study. Biogeochemistry 54: 297–340, doi:10.1023/A:1010635524108
HELLEBUST, J. A. 1965. Excretion of some organic compounds bymarine phytoplankton. Limnol. Oceanogr. 10: 192–206,doi:10.4319/lo.1965.10.2.0192
HELMER, E. H., O. RAMOS, T. D. LOPEZ, M. QUINONES, AND W.DIAZ. 2002. Mapping the forest type and land cover of PuertoRico, a component of the Caribbean biodiversity hotspot.Caribb. J. Sci. 38: 165–183.
HILBORN, R., AND M. MANGEL. 1997. The ecological detective:Confronting models with data. Princeton Univ. Press.
HOELLEIN, T. J., J. L. TANK, E. J. ROSI-MARSHALL, S. A. ENTREKIN,AND G. A. LAMBERTI. 2007. Controls on spatial and temporalvariation of nutrient uptake in three Michigan headwater streams.Limnol. Oceanogr. 52: 1964–1977, doi:10.4319/lo.2007.52.5.1964
HOLMES, R. M., A. AMINOT, R. KEROUEL, B. A. HOOKER, AND B. J.PETERSON. 1999. A simple and precise method for measuringammonium in marine and freshwater ecosystems. Can. J.Fish. Aquat. Sci. 56: 1801–1808.
———, J. W. MCCLELLAND, D. M. SIGMAN, B. FRY, AND B. J.PETERSON. 1998. Measuring 15N-NH z
4 in marine, estuarineand fresh waters: An adaptation of the ammonia diffusionmethod for samples with low ammonium concentrations.Mar. Chem. 60: 235–243, doi:10.1016/S0304-4203(97)00099-6
JOHNSON, L. T., J. L. TANK, AND C. P. ARANGO. 2009. The effect ofland use on dissolved organic carbon and nitrogen uptake instreams. Freshw. Biol. 54: 2335–2350, doi:10.1111/j.1365-2427.2009.02261.x
KAPLAN, L. A., AND T. L. BOTT. 1989. Diel fluctuations in bacterial-activity on streambed substrata during vernal algal blooms:Effects of temperature, water chemistry, and habitat. Limnol.Oceanogr. 34: 718–733, doi:10.4319/lo.1989.34.4.0718
———, AND J. D. NEWBOLD. 2003. The role of monomers instream ecosystem metabolism, p. 97–119. In S. E. G. Findlayand R. L. Sinsabaugh [eds.], Aquatic ecosystems: Interactivityof dissolved organic matter. Academic Press.
KAUSHAL, S. S., AND W. M. LEWIS. 2005. Fate and transport oforganic nitrogen in minimally disturbed montane streams ofColorado, USA. Biogeochemistry 74: 303–321, doi:10.1007/s10533-004-4723-5
KEMP, M. J., AND W. K. DODDS. 2001. Spatial and temporalpatterns of nitrogen concentrations in pristine and agricul-turally-influenced prairie streams. Biogeochemistry 53:125–141, doi:10.1023/A:1010707632340
KIRCHMAN, D. L. 2003. The contribution of monomers and otherlow-molecular weight compounds to the flux of dissolvedorganic material in aquatic ecosystems, p. 218–243. In S. E. G.Findlay and R. L. Sinsabaugh [eds.], Aquatic ecosystems:Interactivity of dissolved organic matter. Academic Press.
LEWIS, W. M., J. M. MELACK, W. H. MCDOWELL, M. MCCLAIN,AND J. E. RICHEY. 1999. Nitrogen yields from undisturbedwatersheds in the Americas. Biogeochemistry 46: 149–162.
LIPSON, D., AND T. NASHOLM. 2001. The unexpected versatility ofplants: Organic nitrogen use and availability in terrestrialecosystems. Oecologia 128: 305–315, doi:10.1007/s004420100693
LUTZ, B. D., E. S. BERNHARDT, B. J. ROBERTS, AND P. J.MULHOLLAND. 2011. Examining the coupling of carbon andnitrogen cycles in Appalachian streams: The role of dissolvedorganic nitrogen. Ecology 92: 720–732, doi:10.1890/10-0899.1
MALINSKY-RUSHANSKY, N. Z., AND C. LEGRAND. 1996. Excretionof dissolved organic carbon by phytoplankton of differentsizes and subsequent bacterial uptake. Mar. Ecol. Prog. Ser.132: 249–255, doi:10.3354/meps132249
MARZOLF, E. R., P. J. MULHOLLAND, AND A. D. STEINMAN. 1994.Improvements to the diurnal upstream-downstream dis-solved-oxygen change technique for determining whole-stream metabolism in small streams. Can. J. Fish. Aquat.Sci. 51: 1591–1599, doi:10.1139/f94-158
MCDOWELL, W. H., AND C. E. ASBURY. 1994. Export of carbon,nitrogen, and major ions from 3 tropical montane watersheds.Limnol. Oceanogr. 39: 111–125, doi:10.4319/lo.1994.39.1.0111
MULHOLLAND, P. J., J. L. TANK, D. M. SANZONE, W. M.WOLLHEIM, B. J. PETERSON, J. R. WEBSTER, AND J. L. MEYER.2000. Nitrogen cycling in a forest stream determined by a 15Ntracer addition. Ecol. Monogr. 70: 471–493.
———, AND OTHERS. 2001. Inter-biome comparison of factorscontrolling stream metabolism. Freshw. Biol. 46: 1503–1517,doi:10.1046/j.1365-2427.2001.00773.x
———, AND OTHERS. Stream denitrification across biomes and itsresponse to anthropogenic nitrate loading. Nature 452:202–206, doi:10.1038/nature06686
ODUM, H. T. 1956. Primary production in flowing waters. Limnol.Oceanogr. 1: 102–117, doi:10.4319/lo.1956.1.2.0102
PAUL, M. J., AND J. L. MEYER. 2001. Streams in the urbanlandscape. Ann. Rev. Ecol. Syst. 32: 333–365, doi:10.1146/annurev.ecolsys.32.081501.114040
PELLERIN, B. A., S. S. KAUSHAL, AND W. H. MCDOWELL. 2006.Does anthropogenic nitrogen enrichment increase organicnitrogen concentrations in runoff from forested and human-dominated watersheds? Ecosystems 9: 852–864, doi:10.1007/s10021-006-0076-3
PERAKIS, S. S., AND L. O. HEDIN. 2002. Nitrogen loss fromunpolluted South American forests mainly via dissolved organiccompounds. Nature 415: 416–419, doi:10.1038/415416a
PETERSON, B. J., AND OTHERS. 2001. Control of nitrogen exportfrom watersheds by headwater streams. Science 292: 86–90,doi:10.1126/science.1056874
R DEVELOPMENT CORE TEAM. 2011. R: A language and environ-ment for statistical computing [Internet]. Vienna (Austria): RFoundation for Statistical Computing [accessed March 2012].Available from http://www.R-project.org
ROYER, T. V., J. L. TANK, AND M. B. DAVID. 2004. Transport andfate of nitrate in headwater agricultural streams in Illinois. J.Environ. Qual. 33: 1296–1304, doi:10.2134/jeq2004.1296
SANZONE, D. M., J. L. TANK, J. L. MEYER, P. J. MULHOLLAND, AND
S. E. G. FINDLAY. 2001. Microbial incorporation of nitrogenin stream detritus. Hydrobiologia 464: 27–35, doi:10.1023/A:1013930102876
SCHIMEL, J. P., AND J. BENNETT. 2004. Nitrogen mineralization:Challenges of a changing paradigm. Ecology 85: 591–602,doi:10.1890/03-8002
SCOTT, D., J. HARVEY, R. ALEXANDER, AND G. SCHWARTZ. 2007.Dominance of organic nitrogen from headwater streamsto large rivers across the conterminous United States.Glob. Biogeochem. Cycles 21: GB1003, doi:10.1029/2006GB002730
1284 Johnson et al.

SEITZINGER, S. P., AND R. W. SANDERS. 1997. Contribution ofdissolved organic nitrogen from rivers to estuarine eutrophi-cation. Mar. Ecol. Prog. Ser. 159: 1–12, doi:10.3354/meps159001
SIGMAN, D. M., M. A. ALTABET, R. MICHENER, D. C. MCCORKLE,B. FRY, AND R. M. HOLMES. 1997. Natural abundance-levelmeasurement of the nitrogen isotopic composition of oceanicnitrate: An adaptation of the ammonia diffusion method.Mar. Chem. 57: 227–242, doi:10.1016/S0304-4203(97)00009-1
STANLEY, E. H., AND J. T. MAXTED. 2008. Changes in the dissolvednitrogen pool across land cover gradients in Wisconsinstreams. Ecol. Appl. 18: 1579–1590, doi:10.1890/07-1379.1
STARK, J. M., AND S. C. HART. 1996. Diffusion technique forpreparing salt solutions, Kjeldahl digests, and persulfatedigests for nitrogen-15 analysis. Soil Sci. Soc. Am. J. 60:1846–1855, doi:10.2136/sssaj1996.03615995006000060033x
TANK, J. L., AND OTHERS. 2000. Analysis of nitrogen cycling in a foreststream during autumn using a 15N-tracer addition. Limnol.Oceanogr. 45: 1013–1029, doi:10.4319/lo.2000.45.5.1013
TAYLOR, B. W., C. F. KEEP, R. O. HALL, B. J. KOCH, L. M.TRONSTAD, A. S. FLECKER, AND A. J. ULSETH. 2007.Improving the fluorometric ammonium method: Matrix
effects, background fluorescence, and standard additions.J. N. Am. Benthol. Soc. 26: 167–177, doi:10.1899/0887-3593(2007)26[167:ITFAMM]2.0.CO;2
VALDERRAMA, J. C. 1981. The simultaneous analysis of totalnitrogen and total phosphorus in natural-waters. Mar. Chem.10: 109–122, doi:10.1016/0304-4203(81)90027-X
VOLK, C. J., C. B. VOLK, AND L. A. KAPLAN. 1997. Chemicalcomposition of biodegradable dissolved organic matter instreamwater. Limnol. Oceanogr. 42: 39–44, doi:10.4319/lo.1997.42.1.0039
WEBSTER, J. R., AND H. M. VALETT. 2006. Solute dynamics, p.169–186. In F. R. Hauer and G. A. Lamberti [eds.], Methodsin stream ecology. Academic Press.
———, AND OTHERS. 2003. Factors affecting ammonium uptake instreams—an inter-biome perspective. Freshw. Biol. 48:1329–1352, doi:10.1046/j.1365-2427.2003.01094.x
Associate editor: Alexander D. Huryn
Received: 21 September 2012Accepted: 03 March 2013Amended: 12 March 2013
DON production in streams 1285