quantifying privacy choices with experimental economics college of management north carolina state...
Post on 18-Dec-2015
214 views
TRANSCRIPT

Quantifying Privacy Choices withExperimental Economics
College of ManagementNorth Carolina State University
WEISHarvard University
June 2-3, 2005
David L. BaumerProfessor of Law
Julia B. EarpAssociate Professor
of IT J.C. PoindexterAssociate Professor
of Finance

Privacy Values of Consumers
Many studies have addressed consumer privacy concerns
Why are these endeavors important?– Company policies– Enforcement– Auditing– Legislation

Privacy Values of Consumers
For Example, Earp et al.– Worldwide survey of over
1000 respondents– 36 scale items– Consumers are most
concerned with (in order):• Information Transfer• Notice / Awareness• Information Storage
“Examining Internet Privacy Policies within the Context of User Privacy Values.” IEEE Transactions on Engineering Management, May 2005.

Survey Limitations
There are no consequences to choices Responses tend to make respondents
look good Sizeable disparities between what
respondents say and what they do

The Continuing Question
» How can we accurately determine the value that consumers place on privacy?

Uses of Experimental Economics
To test game-theoretic hypotheses (interactive behavior experiments)
To perform investigations into industrial organization issues
To test theories of individual choice– Decision-making under uncertainty

Individual Choice
Subjects participate in a game – opportunities for certain gambles or risks– real money
Construct a utility curve Predict individual behavior

Privacy Related Objectives
Develop an economic model of consumer privacy concerns– General– Financial– Healthcare
Economic model that relates benefits/risk to access choices

Why Experimental Economics?
Unreliability of surveys All external factors can be controlled
and the system can be agitated by single influences– Passage of privacy legislation– Increased outbreaks of identity theft– New technologies

The General Experiment: Assumptions
Assume more intensive Internet usage can bring increased benefits, but can also bring additional risks
Rely on a “money account” measure for tracking net benefit from Internet usage choices

The General Experiment: Process Participants choose a usage level Outcomes are announced News stories of exceptional outcomes
are revealed Sensitivity to the introduction of privacy
changes– Legislation– Technology protection– Education– Hacker innovations
Participant with the highest net value in his/her account wins

Payoff Matrix
Payoff Matrix will reflect possible benefits and possible risks/burdens to using the Internet
The possible benefits of using the Internet
The possible risks of using the Internet

Pilot Experiment #1:Online Job Search
Two pilot groups Four week time period where
participants submitted resumes in an experimental setting
Grade incentive (using a money account)

Pilot Experiment #1:Online Job Search Choices General employment websites
– 50% chance of being hired in the first three months– Average starting salary = $30,000.
Employer websites– Requires more information – 50% probability of being hired in the first three
months– Average starting salary = $40,000
Headhunter websites– Requires much more information– 25% probability of being hired in the first 3 months– Average starting salary of $60,000
Family and friend contacts – Average starting salary = $20,000

Group A: 27 Undergrad Students
GEW EW HW None
Week1 Freq.Prot.
22
2119
1 3
Week2 Freq.Prot.
11
2222
2 2
Week3 Freq.Prot.
00
1714
8 1
Week4 Freq.Prot.
32
1010
3 11

Group B: 32 Graduate Students
GEW EW HW None
Week1 Freq.Prot.
21
2214
6 2
Week2 Freq.Prot.
00
1511
10 2
Week3 Freq.Prot.
11
106
15 1
Week4 Freq.Prot.
10
1311
9 7

Pilot Experiment #2:Automated Process
Proof-of-Concept General Pilot Experiment 12 participants No indication of probabilities presented 5 Scenarios with 5 iterations each
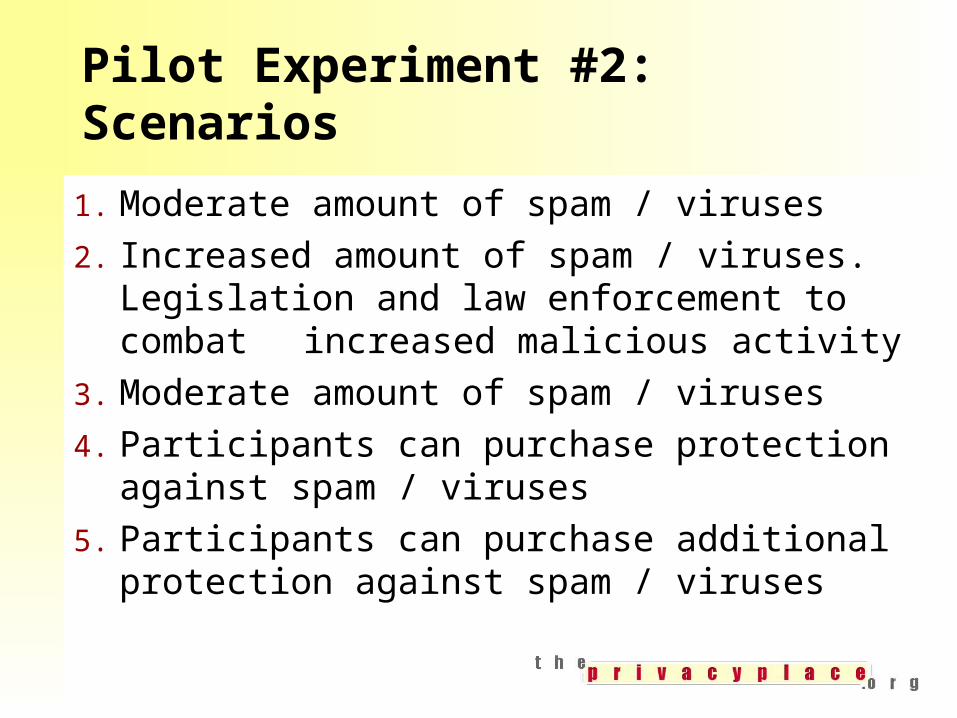
Pilot Experiment #2:Scenarios
1. Moderate amount of spam / viruses2. Increased amount of spam / viruses.
Legislation and law enforcement to combat increased malicious activity
3. Moderate amount of spam / viruses4. Participants can purchase protection
against spam / viruses5. Participants can purchase additional
protection against spam / viruses

Pilot Experiment #2:Usage and Risk Levels
Scenario Grand Avg. Risk Avg. Usage Avg.
1 12.6 10.8 14.4
2 9.5 8.9 10.0
3 11.5 10.2 12.9
4 13.4 11.7 15.2
5 14.9 14.3 15.6
Low is 3, Moderate is 10, and High is 20. No use is 0.

Internet Exp. Average Choices
0
24
6
810
12
1416
18
1 2 3 4 5
Scenarios 1 Through 5
Site & Use Level
Riskiness Index
Composite
Site Risk
Use Level

The Next Steps
A more sophisticated simulation environment
Several experiments– General experiment– Financial experiment– Health care experiment
Augment with survey results In the end, determine what consumers
truly value and when they are willing to compromise

For Information on Privacy Researchat NCSU:
http://theprivacyplace.org/
and
http://www4.ncsu.edu/~jbearp/