quantification of tramadol and m1 in post mortem … final.pdf · tramadol assim como o estado de...
TRANSCRIPT

QUANTIFICATION OF TRAMADOL AND M1 IN POST MORTEM SAMPLES BY GAS CHROMATOGRAPHY–ION
TRAP MASS SPECTROMETRY AND PRELIMINARY PHARMACOGENOMIC STUDIES
Master Thesis
_______________________________________________
Isabel Sofia Moreira Barbosa Costa
Master Degree in Legal Medicine and Forensic Sciences
Faculty of Medicine, University of Coimbra
Coimbra 2012

Dissertação de candidatura ao grau de
Mestre em Medicina Legal e Ciências Forenses
apresentada à Faculdade de Medicina da
Universidade de Coimbra
Dissertation thesis for the degree of
Master Degree in Legal Medicine and Forensic Sciences
submitted to the Faculty of Medicine,
University of Coimbra
Orientador: Professor Doutor Ricardo Jorge Dinis Oliveira, Department of Forensic
Sciences, Faculty of Medicine, University of Porto, Porto, Portugal; Department of
Sciences, Advanced Institute of Health Sciences – North, CESPU, CRL, Gandra,
Portugal.
Coorientador: Mestre Ana Elisabete Pereira Correia de Oliveira, REQUIMTE,
Laboratory of Toxicology, Department of Biological Sciences, Faculty of Pharmacy,
University of Porto, Porto, Portugal; Department of Sciences, Advanced Institute of
Health Sciences – North, CESPU, CRL, Gandra, Portugal.
Coorientador: Professora Doutora Helena Maria de Sousa Ferreira e Teixeira, Faculty
of Medicine, University of Coimbra, Coimbra, Portugal.

Quantification of tramadol and M1 in post mortem samples by gas chromatography–ion trap mass spectrometry and preliminary pharmacogenomic studies
i
ACKNOWLEDGMENTS
Firstly I would like to express my deepest gratitude to my supervisor, Professor
Doctor Ricardo Dinis Oliveira for accepting to orient this thesis. Thanks also for the
availability, readiness, understanding, collaboration, for the contribution to my training
and the provision of all necessary means to carry out this work, without which would
not have been possible to perform. I am very grateful for his encouragement and
revision of this thesis.
I also express my gratitude and appreciation to Master Ana Oliveira for all the
support given during the elaboration of this thesis, understanding, encouragement and
patience. I would also like to thank for the revision of all work.
I also thank to Professor Doctor Helena Teixeira for the availability, sympathy
and for the transmitted knowledge through the Master Degree. I would also like to
thank for the revision of this thesis.
I also want to express my gratitude to the Laboratory of Toxicology, Department
of Biological Sciences of Faculty of Pharmacy of Porto, specifically to Professor Doctor
Paula Guedes for allowing access to the labs and GC-MS equipment, and all the
support during the course of this thesis.
I would like to thank Department of Clinical Analysis and Public Health,
Polytechnic Health Institute – North, CESPU, CRL, Vila Nova de Famalicão, Portugal,
specifically to Professor Doctor Jorge Proença, for providing all the financial support to
perform this thesis.
I thank to Professor Doctor Duarte Nuno Vieira, Coordinator of the Master
Degree of Legal Medicine and Forensic Sciences.
Special thanks go to Master Teresa Baltazar for all the support during the
realization of this work, encouragement, friendship and care.

Quantification of tramadol and M1 in post mortem samples by gas chromatography–ion trap mass spectrometry and preliminary pharmacogenomic studies
ii
To my friends and some of them, fellow undergraduate, thank you for the
support.
A special thanks to my family for all the support, care and dedication.
Last but not the least important, I also would thank to my boyfriend Álvaro, for
the motivation support and care that was transmitted day after day, throughout this
journey.

Quantification of tramadol and M1 in post mortem samples by gas chromatography–ion trap mass spectrometry and preliminary pharmacogenomic studies
iii
ABSTRACT
Tramadol is a centrally acting opioid analgesic, widely used for moderate to
severe pain due to its efficacy and safety. Although tramadol induce less adverse
effects compared to other opioids, serious complications can occur in case of
intoxication. The intoxication by this drug it is also common in individuals with an abuse
history of opioids, despite its low potential in developing dependence. Moreover, the
administration of toxic doses of tramadol concomitantly with other central nervous
system depressants is one of the most common causes of severe or lethal acute
intoxication.
Currently, several analytical techniques are being used to quantify tramadol and
its main pharmacologically active metabolite, O-desmethyltramadol (M1) in ante
mortem specimens, namely in plasma, blood, saliva, urine and hair. However, in post
mortem samples, there are few studies that evaluate the importance of M1 in the cause
of death and the importance of polymorphism in the pharmacokinetics of tramadol.
This work aimed the optimization and validation of an analytical method for the
detection and quantification of tramadol and M1 in post mortem blood samples by gas
chromatography-ion trap mass spectrometry (GC-IT/MS). The same blood specimens
were addressed to study cytochrome P450 2D6 (CYP2D6), multidrug resistance
protein 1 (MDR1), μ-opioid receptor gene (OPRM1) and catechol-O-methyltransferase
(COMT) single nucleotide polymorphisms (SNP) by real-time polymerase chain
reaction (PCR).
The Part I of this dissertation describes the use and therapeutic applicability of
tramadol as well as considerations about pharmacokinetic and pharmacodynamic of
tramadol and M1. A review of the literature was also made on tramadol intoxications
and validated analytical methods to quantify tramadol and metabolites in several
biological matrices. Special consideration is devoted to the importance of
pharmacogenomics in the interpretation of forensic and clinical toxicological results.
The Part II is reserved for the general and specific objectives of this work. In Part III the
experimental work is described according with the proposed objectives, as well as the
method validation, its application to real cases of post mortem blood samples and
genotyping and phenotyping analysis. In Part IV all references consulted for the
present work are presented.
The GC-IT/MS method described in this study exhibited a good selectivity,
lower limit of detection (LOD) and lower limit of quantification (LLOQ) (0.74 and 0.56
ng/mL for tramadol and 2.24 and 1.70 ng/mL for M1 respectively) in a matrix with

Quantification of tramadol and M1 in post mortem samples by gas chromatography–ion trap mass spectrometry and preliminary pharmacogenomic studies
iv
relevant importance in forensic toxicological analysis. The regression analysis for both
analytes showed linearity in the range 5-1000 ng/mL with determination coefficients (r2)
ranging from 0.9991 to 0.9999. The coefficients of variation (%CV) oscillated between
0.70 and 12.45%. This method was then successfully applied for the quantification of
tramadol and M1 in real post mortem blood samples from five cases of suspected
tramadol fatal intoxications.
Regarding polymorphism studies, four subjects with at least one functional
allele were categorized as extensive metabolizers (EMs). Nevertheless it was not
possible to establish any comparison between polymorphic results and concentrations
of tramadol and M1, due to the much reduced number of samples. In addition, high
tramadol concentrations could not be completely explained only based on
polymorphisms studied. Besides pharmacogenomics, the pharmacokinetics of the drug
can be affected by many other factors namely, age, disease, concomitant medication,
metabolic interactions and kidney or liver function. One of the five cases was not
possible to determine the genotype. In this case, it is important to consider the
possibility of being a poor metabolizer (PM) subject for rare mutations that are
extremely uncommon in Caucasians, which could not be identified with the assay used.
In conclusion it was develop and validate a GC-IT/MS method to quantify
tramadol and M1 in post mortem blood samples. Moreover, 4 polymorphisms were
applied in blood samples. If further samples were available, interesting correlations
were expected to be obtained. Nevertheless, the methods were validated and are
ready to be routinely used in forensic aplications.
Keywords: Tramadol; O-desmethyltramadol; Gas Chromatography; Mass
Spectrometry; Intoxication; Polymorphisms; CYP2D6; MDR1; OPRM1; COMT.
Quantification of tramadol and M1 in post mortem samples by gas chromatography–ion trap mass spectrometry and preliminary pharmacogenomic studies
v
RESUMO
O tramadol é um analgésico opióide de ação central, muito utilizado para a dor
moderada a severa devido à sua eficácia e segurança. Apesar do tramadol induzir
menores efeitos adversos comparativamente com outros opióides, podem ocorrer
complicações graves em caso de intoxicação. A intoxicação por este fármaco é
também comum em indivíduos com um historial de abuso de opióides, apesar do seu
baixo potencial de desenvolvimento de dependência. No entanto, a administração de
doses tóxicas de tramadol, concomitantemente com outros depressores do sistema
nervoso central, é uma das causas mais comuns de intoxicação aguda grave ou letal.
Atualmente, várias técnicas analíticas estão disponíveis para quantificar o
tramadol e o seu principal metabolito O-desmetiltramadol (M1), farmacologicamente
activo, em amostras ante mortem, nomeadamente em plasma, sangue, saliva, urina e
cabelo. Contudo, em amostras post mortem, são escassos os estudos que avaliaram a
importância do M1 na causa de morte e a importância do polimorfismo na
farmacocinética do tramadol.
Este trabalho teve como objetivo a otimização e a validação de um método
analítico por cromatografia gasosa acoplada a espetrometria de massa com “ion-trap”
(GC-IT/MS), para a deteção e quantificação de tramadol e M1 em amostras de sangue
post mortem. As mesmas amostras de sangue foram utilizadas para estudar os
polimorfismos de nucleótido único (SNP) nos genes do citocromo P450 2D6
(CYP2D6), proteína de resistência a múltiplas drogas (MDR1), gene do recetor µ-
opióide (OPRM1) e catecol O-metiltransferase (COMT) pela reacção em cadeia da
polimerase (PCR) em tempo-real.
Na Parte I da presente dissertação aborda a aplicabilidade terapêutica do
tramadol assim como o estado de arte relativo à farmacocinética e farmacodinâmica
do tramadol e M1. Procedeu-se também à revisão da literatura sobre as intoxicações
por tramadol e métodos analíticos validados para a quantificação de tramadol e
metabolitos em várias matrizes biológicas. Especial consideração é dada à
importância da farmacogenómica na interpretação dos resultados toxicológicos
forenses e clínicos. Na Parte II encontram-se definidos os objetivos gerais e
específicos deste trabalho. Na Parte III o trabalho experimental é descrito de acordo
com os objetivos propostos, assim como a validação do método desenvolvido, a sua
aplicação em casos reais de sangue post mortem e análises de genotipagem e
fenotipagem. Na Parte IV estão descritas todas as referências bibliográficas
consultadas para a realização do presente trabalho.

Quantification of tramadol and M1 in post mortem samples by gas chromatography–ion trap mass spectrometry and preliminary pharmacogenomic studies
vi
O método de GC-IT/MS descrito neste estudo exibiu uma boa seletividade,
baixo limite de detecção (LOD) e baixo limite de quantificação (LLOQ) (0.74 e 0.56
ng/mL para o tramadol e 2.24 e 1.70 ng/mL para o M1 respetivamente), numa matriz
com importância relevante na análise toxicológica forense. As análises de regressão
para ambos os analitos mostraram linearidade no intervalo 5-1000 ng/mL com
coeficientes de determinação (r2) que variaram de 0.9991 a 0.9999. Os coeficientes de
variação (CV%) oscilaram entre 0,70 e 12,45%. Este método foi aplicado com sucesso
para a quantificação do tramadol e M1 em amostras reais de sangue post mortem de
cinco casos de suspeita de intoxicação fatal por tramadol.
Em relação aos estudos dos polimorfismos, quatro indivíduos foram
classificados como metabolizadores extensos (EMs). No entanto, não foi possível
estabelecer qualquer comparação entre os resultados dos polimorfismos e
concentrações de tramadol e M1, devido ao número muito reduzido de amostras. Para
além disso, as concentrações elevadas de tramadol não podem ser completamente
explicadas apenas com base nos polimorfismos estudados. Além da
farmacogenómica, a farmacocinética do fármaco pode ser afetada por muitos outros
fatores, como por exemplo idade, doença, medicação concomitante, interações
metabólicas e função renal ou hepática. Num dos cinco casos, não foi possível
determinar o genótipo. Neste caso, é importante ter em conta a possibilidade de ser
um sujeito metabolizador pobre (PM) para mutações que não são comuns em
Caucasianos, que não puderam ser identificados com a análise realizada.
Em conclusão, foi desenvolvido e validado um método de GC-IT/MS para
quantificar o tramadol e M1 em amostras de sangue post mortem. Além disso, quatro
polimorfismos foram aplicados em amostras de sangue. Se outras amostras
estivessem disponíveis, seria de esperar obter melhores correlações. No entanto, os
métodos foram validados e estão prontos para ser utilizados rotineiramente em
aplicações forenses.
Palavras-chave: Tramadol; O-desmetiltramadol; Cromatografia Gasosa;
Espetrometria de Massa; Intoxicação; Polimorfismos; CYP2D6; MDR1; OPRM1;
COMT.
Quantification of tramadol and M1 in post mortem samples by gas chromatography–ion trap mass spectrometry and preliminary pharmacogenomic studies
vii
ABREVIATION LIST
BSTFA, N,O-bis(trimethylsilyl) trifluoroacetamide;
CE-UV-LINF, capillary electrophoresis with ultraviolet laser-induced native
fluorescence detection;
CNECV, Portuguese National Council of Ethics for Life Sciences;
CNS, central nervous system;
COMT, catechol-O-methyltransferase;
CV, coefficient of variation;
CYP, Cytochrome P450;
CYP2D6, Cytochrome P450 2D6;
GC-EI/MS, gas chromatography-electron impact mass spectrometry;
GC-IT/MS, gas chromatography-ion trap mass spectrometry;
GC-MS, gas chromatography-mass spectrometry;
GC-NPD, gas chromatography-nitrogen-phosphorus detector;
EMs, extensive metabolizers;
ESI, electrospray ionization;
HClO4, perchloric acid;
HPLC, high performance liquid chromatography;
HPLC-DAD, high performance liquid chromatography-diode-array detector;
HPLC-FL, high performance liquid chromatography-fluorescence detection;
HPLC-UV, high performance liquid chromatography-ultraviolet detection;
IMs, intermediate metabolizers;
IS, internal standard;
LC, liquid chromatography;
LC-MS, liquid chromatography-mass spectrometry;
LC-MS/MS, liquid chromatography-tandem mass spectrometry;
LLE, liquid-liquid extraction;
LOD, limit of detection;
LLOQ, lower limit of quantification;
LPME, liquid-phase microextraction;
M1, O-desmethyltramadol;
M2, N-desmethyltramadol;
M3, N,N-didesmethyltramadol;
M4, N,N,O-tridesmethyltramadol;

Quantification of tramadol and M1 in post mortem samples by gas chromatography–ion trap mass spectrometry and preliminary pharmacogenomic studies
viii
M5, N,O-didesmethyltramadol;
M6, 4-hydroxy-ciclohexyltramadol;
M7, 4-hydroxy-ciclohexyl-N-desmethyl tramadol;
MDR1, multidrug resistance protein 1;
Met, methionine;
MS/MS, tandem mass spectrometry;
MSTFA, N-methyl-N-(trimethylsilyl) trifluoroacetamide;
m/z, mass-to-charge ratio;
NaOH, sodium hydroxide;
NS, not specified;
NSAIDs, non-steroidal anti-inflammatories;
OPRM1, μ-Opioid receptor gene;
PCR, polymerase chain reaction;
PMs, poor metabolizers;
SD, standard deviation;
SIM, selected ion monitoring;
SNPs, single nucleotide polymorphisms;
SPE, solid-phase extraction;
SPE-LC-MS/MS, solid-phase extraction liquid chromatography-tandem mass
spectrometry;
SPME, solid-phase microextraction;
SSRIs, selective serotonin reuptake inhibitors;
TMCS, trimethylchlorosilane;
tr, retention time;
UMs, ultrarapid metabolizers;
UPLC, ultra-performance liquid chromatography;
UPLC-MS/MS, ultra-performance liquid chromatography-tandem mass spectrometric;
Val, valine.

Quantification of tramadol and M1 in post mortem samples by gas chromatography–ion trap mass spectrometry and preliminary pharmacogenomic studies
ix
INDEX OF FIGURES
Figure 1. Enantiomers of tramadol. .............................................................................. 3
Figure 2. Chemical structures of tramadol and M1. ...................................................... 4
Figure 3. Sample preparation procedure. (A) Sample pre-treatment. (B) Extraction /
purification with solid-phase extraction (SPE). (C) Derivatization procedure. ............. 33
Figure 4. Derivatization reaction of tramadol. ............................................................. 34
Figure 5. Derivatization reaction of M1. ...................................................................... 34
Figure 6. DNA extraction procedure for real-time PCR. .............................................. 38
Figure 7. Reconstructed mass spectrum of tramadol. (A) First peak, tramadol without
derivatization. (B) Second peak, tramadol derivatized. ................................................ 43
Figure 8. Reconstructed mass spectrum of M1. (A) First peak, M1 diderivatized. (B)
Second peak, M1 monoderivatized. ............................................................................ 44
Figure 9. Reconstructed GC-MS (SIM mode) chromatogram of a blank and spiked
blood sample (1000 ng/mL) of tramadol (m/z 58+336+264), M1 (m/z 58+394+322) and
internal standard (IS; m/z 109+137+179). ................................................................... 46
Figure 10. Calibration curves of tramadol and M1. Plotted peak areas of the
analytes/IS peak areas versus concentrations (5, 10, 50, 100, 500 and 1000 ng/mL). 47
Figure 11. Reconstructed GC-MS (SIM mode) chromatogram of a real blood sample
positive for tramadol and M1 (subject number 3). It is represented the ion
chromatogram of tramadol (m/z 58+336+264), M1 (m/z 58+394+322) and IS (m/z
109+137+179). ........................................................................................................... 53
Quantification of tramadol and M1 in post mortem samples by gas chromatography–ion trap mass spectrometry and preliminary pharmacogenomic studies
x
INDEX OF TABLES
Table 1. Clinical features of serotonin syndrome [45-49]. ............................................. 7
Table 2. Review of tramadol intoxications. .................................................................... 8
Table 3. Symptoms reported after tramadol overdose, (n=87 patients, including 15
children) [7]. ................................................................................................................ 10
Table 4. Review of the analytical methods for qualitative and quantitative analysis of
tramadol and metabolites. ........................................................................................... 18
Table 5. Detection parameters of tramadol, M1 and IS by GC-MS. ............................ 35
Table 6. Blood linear regression analysis of tramadol and M1 standard solutions (5-
1000 ng/mL) performed on three different days. ......................................................... 47
Table 7. Precision, accuracy and recovery (%) for tramadol and M1. ......................... 48
Table 8. The genotypes identified by real-time PCR for polymorphisms in study. ....... 49
Table 9. Concentration of tramadol and M1 in real post mortem blood samples. ........ 52

Quantification of tramadol and M1 in post mortem samples by gas chromatography–ion trap mass spectrometry and preliminary pharmacogenomic studies
xi
INDEX
ACKNOWLEDGMENTS ................................................................................................ i
ABSTRACT .................................................................................................................. iii
RESUMO ...................................................................................................................... v
ABREVIATION LIST ................................................................................................... vii
INDEX OF FIGURES ................................................................................................... ix
INDEX OF TABLES...................................................................................................... x
INDEX ......................................................................................................................... xi
PART I: General Introduction ..................................................................................... 1
1. History and use of tramadol ................................................................................... 2
2. Physical and chemical properties ........................................................................... 3
3. Pharmacokinetics of tramadol and O-desmethyltramadol ...................................... 4
4. Pharmacodynamics of tramadol and O-desmethyltramadol ................................... 5
4.1. Mechanism of action........................................................................................... 5
4.2. Adverse effects ................................................................................................... 6
4.3. Dependency and addiction ................................................................................. 7
5. Tramadol intoxications cases ................................................................................. 8
5.1. Case reports: intoxication due to single tramadol administration ...................... 10
5.2. Case reports: intoxication due to tramadol and other drugs .............................. 11
5.3. Case reports: tramadol intoxication in children ................................................. 14
6. Treatment of tramadol intoxication ....................................................................... 14
7. The importance of genetic polymorphism in tramadol pharmacokinetics and
pharmacodynamics ..................................................................................................... 15
8. Analytical methods to quantify tramadol and O-desmethyltramadol ..................... 17
PART II: General and specific objectives of the thesis .......................................... 27
Objectives of the thesis ........................................................................................ 28
PART III: Experimental Part ...................................................................................... 29

Quantification of tramadol and M1 in post mortem samples by gas chromatography–ion trap mass spectrometry and preliminary pharmacogenomic studies
xii
Chapter I .................................................................................................................... 30
Materials and methods.......................................................................................... 30
1. Material and methods .......................................................................................... 31
1.1. Ethics statement ............................................................................................... 31
1.2. Reagents and standards .................................................................................. 31
1.3. Biological specimens ........................................................................................ 32
1.4. Preparation of stock and working standard solutions ........................................ 32
1.5. Sample preparation for gas-chromatography mass spectrometry analysis ....... 32
1.6. Gas chromatography-mass spectrometry conditions ........................................ 35
1.7. Method validation ............................................................................................. 35
1.8. Genetic polymorphism ...................................................................................... 38
Chapter II ................................................................................................................... 40
Results and discussion ........................................................................................ 40
1. Results and discussion ........................................................................................ 41
1.1. Sample preparation for gas-chromatography mass spectrometry analysis ....... 41
1.2. Method validation ............................................................................................. 42
1.3. Genetic polymorphism ...................................................................................... 48
Chapter III .................................................................................................................. 51
Application of the developed GC-MS method to real post mortem blood
samples .................................................................................................................. 51
1. Proof of applicability ............................................................................................. 52
Chapter IV .................................................................................................................. 56
Conclusions and future perspectives .................................................................. 56
1. Conclusions and future perspectives ................................................................... 57
PART IV: References ................................................................................................ 59

Quantification of tramadol and M1 in post mortem samples by gas chromatography–ion trap mass spectrometry and preliminary pharmacogenomic studies
1
PART I: General Introduction

Quantification of tramadol and M1 in post mortem samples by gas chromatography–ion trap mass spectrometry and preliminary pharmacogenomic studies
2
1. History and use of tramadol
Tramadol is a synthetic opioid from the aminocyclohexanol group that was firstly
synthesized in Germany by the pharmaceutical company Grünenthal GmbH, in 1962. It
was introduced on the market in 1977 with the trade name Tramal® and thereafter,
several pharmaceutical companies have introduced it with other trade names and
different pharmaceutical forms were developed [1, 2].
Tramadol is marketed in the form of a racemic mixture of (+) and (-) two
enantiomers [1, 3]. In Portugal, it is commercialized in the form of a salt - tramadol
hydrochloride, as a single component or in combination with paracetamol [4]. Tramadol
is a weak agonist on μ-opioid receptor and its analgesic effect is owed to the increase
of the serotonergic transmission and noradrenaline reuptake inhibition. This is currently
often used in clinical practice (hospital and ambulatory use) in acute and chronic pain
treatment of moderate and in some cases, of severe intensity, due to its effectiveness
and safety [1]. It is a viable therapeutic option and an alternative to other opioid
analgesics since it has low potential for abuse, dependence, tolerance and low
probability to cause adverse effects, including respiratory depression [5].
Tramadol has many pharmacological properties with therapeutic importance
beyond their known analgesic effect. It has been shown to be useful in the treatment of
several analgesic indications as postoperative, dental, abdominal, neuropathic,
musculoskeletal, rheumatological, cardiac, renal colic, malignant and chronic pain
(effectively similar to low doses of strong opioids), headache, fibromyalgia, premature
ejaculation, anesthetics and pediatric applications. It has also been used in non-
analgesic indications, such as psychiatry, nocturnal leg cramps and in postoperative
shivering [6-14].
Tramadol has also an important role in patients where the administration of non-
steroidal anti-inflammatories (NSAIDs) is contraindicated, where stronger opioids may
be undesirable because of the potential for abuse or for patients who do not tolerate its
adverse effects, which are generally more intense [7, 8]. However, there are still some
concerns about the use of tramadol. The existing studies on the safety of tramadol
when used in long term (more than two years) are still limited and their efficacy is
variable due to the genetic polymorphisms of its metabolism. Another concern is that in
most patients with chronic pain, antidepressants are also administered which leads to
an increasing risk of serotonin syndrome [7, 15].

Quantification of tramadol and M1 in post mortem samples by gas chromatography–ion trap mass spectrometry and preliminary pharmacogenomic studies
3
The extended-release formulation of tramadol (tramadol ER), a long-acting
analgesic, has demonstrated efficacy in patients with moderate to severe chronic pain
caused by osteoarthritis and low back pain with an acceptable tolerability and safety,
and has proved to have advantages in patients with need of analgesic treatment in a
longer period of time [16].
2. Physical and chemical properties
Tramadol ((1RS,2RS)-2-[(dimethylamino)methyl]-1-(3-methoxyphenyl)-cyclo-
hexanol); molecular mass 263.37 g/mol) has two stereoisomers and four enantiomers
[1] (Fig. 1).
Mirror Plane (+) (-)
‘cis’-enantiomers
‘trans’-enantiomers
Figure 1. Enantiomers of tramadol.

Quantification of tramadol and M1 in post mortem samples by gas chromatography–ion trap mass spectrometry and preliminary pharmacogenomic studies
4
In 1978, Frankus et al. developed a pharmacological study and observed that
after dividing the compound 1-(m-Methoxyphenyl)-2-(dimethylaminomethyl)-
cyclohexan-1-ol into cis- and trans-isomers, the resultant conformers were
geometrically similar to morphine. However, the trans-isomer was more active than the
cis-isomer as well as the (+/-) trans-isomer form was more active than (-/-) form [17,
18]. The enantiomers (+/-) and (-/-) are selective agonists of the μ-opioid receptors and
act synergistically to improve the analgesia without increasing the adverse effects. The
(+/-) enantiomer is about 4 times stronger than (-/-) in inhibiting serotonin uptake and (-
/-) is approximately 10 times stronger than (+/-) in inhibiting noradrenaline uptake,
thereby increasing the inhibitory effects in nociceptive transmission from the spinal
medulla [19, 20].
Tramadol is mainly metabolized to O-desmethyltramadol (M1; (3-[2-(1-Amino-1-
methylethyl)-1-hydroxycyclohexyl]phenol; molecular mass 249.34 g/mol)), a
pharmacologically active metabolite, with an higher affinity for µ opioid receptors than
the parent compound (Fig. 2) [21]. The (+/-) M1 enantiomer has 300-400 times greater
affinity for these receptors than tramadol, whereas the (-/-) M1 mostly inhibits
noradrenalin reuptake [22, 23].
Tramadol(C16H25NO2) M1 (C15H23NO2)
Figure 2. Chemical structures of tramadol and M1.
3. Pharmacokinetics of tramadol and O-desmethyltramadol
Tramadol can be administered by oral, intravenous, intramuscular or rectal,
routes/vias, however in clinical practice, oral administration is the main route for
tramadol [4].

Quantification of tramadol and M1 in post mortem samples by gas chromatography–ion trap mass spectrometry and preliminary pharmacogenomic studies
5
Before excretion, tramadol is mainly metabolized by the cytochrome P450 2D6
(CYP2D6) isoenzyme in the liver, by the demethylation (mainly O- and N-
demethylation) and by the conjugation reactions (mainly conjugation with glucuronic
acid and sulfate). The primary metabolites O-desmethyltramadol (M1) and N-
desmethyltramadol (M2) may be further metabolized to three additional secondary
metabolites namely, N,N-didesmethyltramadol (M3), N,N,O-tridesmethyltramadol (M4)
and N,O-didesmethyltramadol (M5). Only one of these metabolites, M1, is
pharmacologically active [24, 25].
After oral administration, tramadol is rapidly absorbed and has a distribution
volume of 3 L/Kg [26]. Approximately 90% of the drug is excreted in urine, 10% in
feces, 20% are excreted as free and conjugated M1 and 17% as M2 [9, 27, 28]. The
half-life is approximately 5-6 h for tramadol and approximately 8 h for M1, however, in
patients with renal failure (creatinine clearance < 79 mL/min) there is a decreased
excretion of these compounds compared to individuals with normal renal function
(creatinine clearance > 100 mL/min). In patients with cirrhosis, there is a decrease in
tramadol metabolism with a consequent increase of blood levels and double half-life
time [1, 29-31].
4. Pharmacodynamics of tramadol and O-desmethyltramadol
4.1. Mechanism of action
Tramadol is a centrally acting opioid analgesic, which has a dual mechanism of
action, as already mentioned: it is a weak agonist of μ-opioid receptors and inhibits
serotonin and noradrenaline reuptake at the synapses of the spinal cord, acting on the
pain transmission mechanism [27]. This drug has moderate affinity to μ-opioid receptor
and a weaker affinity to δ and κ receptors [1]. Tramadol affinity to μ receptors is about
10 times weaker than codeine and 6,000 times weaker than morphine [32].
μ-opioid receptor is coupled to G-proteins, which are responsible for the
transduction of response after activation of the receptors by opioids [33]. The activation
of μ-opioid receptor in presynaptic membrane by tramadol or M1 activates the G-
protein complex leading to an increase in membrane permeability to K+ and a decrease
of Ca2+ influx to the nerve endings occurring a decrease in the release of
neurotransmitters related to the pain [34, 35]. The activation of μ-opioid receptors
mediate supra spinal and spinal analgesia, sedation, respiratory depression, inhibition

Quantification of tramadol and M1 in post mortem samples by gas chromatography–ion trap mass spectrometry and preliminary pharmacogenomic studies
6
of intestinal motility and the release of several neurotransmitters and hormones.
However, tramadol is a weak agonist of these receptors, producing fewer adverse
effects than those caused by other opioid analgesics (e.g. morphine and
buprenorphine) [36-38]. The analgesic effect of tramadol is also dependent on the
analgesic activity of M1, which is characterized by a higher affinity for the μ-opioid
receptor [39]. The (+/-) M1 enantiomer has 300-400 times greater affinity for these
receptors than tramadol, whereas the (-/-) M1 mostly inhibits noradrenalin reuptake [22,
23]. Other metabolites such as M2, M3 and M4 are pharmacologically inactive and do
not have affinity for opioid receptors [40].
The opioid mechanisms account only for a part of tramadol analgesia. Inhibition
of noradrenaline and serotonin reuptake also plays an important role and the
consequences of reduced CYP2D6 activity for the clinical effects of tramadol are
difficult to predict [32, 39].
4.2. Adverse effects
The most common adverse effects associated with tramadol are similar to those
seen with other opioid receptor agonists (e.g. constipation, somnolence, pruritus,
nausea, vomiting, dizziness, fatigue, sweating, dry mouth, drowsiness and orthostatic
hypotension) [1, 41]. Besides these effects, it can also lead to hypertension,
anaphylaxis, hallucinations and confusion [36, 42]. Rare adverse effects like
hypoglycemia, hepatic failure, refractory shock and asystole have also been described
in literature. Although tramadol has a low potential for respiratory depression (a
common and potentially effect in most of the opioids), several fatal and non-fatal
respiratory depression cases associated with tramadol administration are reported in
literature [27, 43].
Concomitant administration of selective serotonin reuptake inhibitors (SSRIs)
(e.g. venlafaxine, fluoxetine, sertraline, citalopram and paroxetine) with tramadol, can
cause serotonin syndrome [44], which although not very often can lead to potentially
fatal consequences. This syndrome is an iatrogenic disorder that results from
excessive stimulation of serotonin receptors and can induce several changes and
eventually coma and death (Table 1).

Quantification of tramadol and M1 in post mortem samples by gas chromatography–ion trap mass spectrometry and preliminary pharmacogenomic studies
7
Table 1. Clinical features of serotonin syndrome [45-49].
Mental status Autonomic hyperactivity
Neuromuscular disorders
Confusion Tachycardia Ataxia
Hypomania Hyperthermia Tremor
Hallucinations Diaphoresis Hyperreflexia
Agitation ___ Rigidity
Serotonin syndrome can also result from co-administration of tramadol with
tricyclic antidepressants (e.g. amitriptyline) [1, 47]. However, at high concentrations of
tramadol, this syndrome can occur only with tramadol administration itself [47, 50].
4.3. Dependency and addiction
Tramadol tendency to cause dependence and addiction is still controversial.
Preston et al. (1991) [51] concluded that the development of dependence during
tramadol treatment of up to 6 months is not significant, but the possibility of physical
dependence during long-term treatment cannot be completely excluded. And thus,
patients monitoring is required to prevent significant dependence [52].
While preclinical investigations suggest that abuse liability associated with
tramadol use is low, there are increasing numbers of cases reported to the U.S. Food
and Drug Administration of abuse, dependence and withdrawal associated with
tramadol use [52]. Yates et al. (2001) [53] reported a clinical case of a 29 year-old
female with no history of substance abuse that developed tramadol dependence after 3
years consuming up to 30 (50 mg) tablets of tramadol per day. In another study,
Prakash et al. (2010) [54] described a case of a 37 year-old male with no history of
substance abuse who developed tramadol dependence syndrome following a sprain
injury in his leg. However, he started taking it on his own after any injury. On physical
examination tremors, sweating, sleep disturbance, decreased psychomotor activity,
euthymic mood with anxious affect and mild distractibility were observed without
impairment of cognition. This demonstrates that tramadol has potential risk of abuse
and physical dependence but it is lower than other opioids (e.g. morphine,
hydrocodone) [51, 55].

Quantification of tramadol and M1 in post mortem samples by gas chromatography–ion trap mass spectrometry and preliminary pharmacogenomic studies
8
Leo et al. (2000) [52] reported a case of a 46 year-old female with history of
opioid (specifically pentazocine) and alcohol dependence with complaints on
restlessness, diaphoresis, tremulousness and anxiety. The patient admitted to have a
one year history of tramadol abuse, initially prescribed for analgesia, consuming up to
30 (50 mg) tablets of tramadol in divided doses daily. However, tramadol has been
recommended as useful treatment option in patients undergoing opioid detoxification
[56].
5. Tramadol intoxications cases
Although there is currently lack of information about acute tramadol intoxication,
the number of cases reporting addiction, abuse or intentional overdose is increasing
(Table 2). Fatal intoxications due to tramadol alone are not common. However, the
administration of toxic doses of tramadol concomitantly with other central nervous
system (CNS) depressants is one of the most common causes of severe or lethal acute
intoxication.
Tramadol therapeutic blood concentration in adults range from: 0.01 to 0.25
mg/L. However, in toxic blood concentrations (0.8 mg/L), fatal complications can arise
even in the absence of other drugs [57] .
Table 2. Review of tramadol intoxications.
Reference / number of cases studied
Main analytes
Samples Peripheral blood
concentration (mg/L) Method
[27] / 2 Tramadol, M1 and M2
Post mortem blood and urine
Case 1: 7.7 (tramadol), 1.33 (M1) and 0.6 (M2); Case 2: 48.34 (tramadol), 2.43 (M1) and 10.09 (M2)
HPLC-FL
[36] / 1 Tramadol and M1
Post mortem blood, liver and kidney
5.2 (tramadol) and positive (M1)
HPLC-DAD: tramadol and M1 in blood; GC-MS: tramadol in liver and kidney
[37] / 1 Tramadol, M1 and M2
Post mortem peripheral and heart blood, urine, gastric content, liver, kidney and bile
9.6 mg/L (tramadol) and positive (M1 and M2)
HPLC-DAD: tramadol in all samples; GC-MS: tramadol, M1 and M2 in urine

Quantification of tramadol and M1 in post mortem samples by gas chromatography–ion trap mass spectrometry and preliminary pharmacogenomic studies
9
[38] / 1 Tramadol Post mortem blood
3.7
NS
[49] / 1 Tramadol Ante mortem blood
9.5 GC-MS
[58] / 1 Tramadol Ante mortem urine
Positive GC-MS
[59] / 4 Tramadol Post mortem blood
Case 1: 134; Case 2: 0.880; Case 3: 3.0; Case 4: 1.90
HPLC-DAD
[60] / 1 Tramadol, M1 and M2
Post mortem heart and peripheral blood, liver, urine, kidney, vitreous humor, lung, heart, brain, spleen, gastric content, bile and muscle
6.2 (tramadol), 0.68 (M1) and 0.20 (M2)
GC-MS
[42] / 1 Tramadol and M1
Ante mortem urine and blood
23,9 (tramadol) and positive (M1)
GC-MS: tramadol and M1 in urine; HPLC-DAD: tramadol in blood (quantification)
[50] / 1 Tramadol Ante mortem serum
0.68 GC-MS
[61] / 12 Tramadol, M1 and M2
Post mortem heart and peripheral blood
0.03 to 22.59 (tramadol), 0.02 to 1.84 (M1) and 0.01 to 2.08 (M2)
GC-MS
[62] / 1 Tramadol Post mortem blood
13
GC-MS (quantification), HPLC-DAD (detection)
[63] / 1
Tramadol, M1 and M2
Peripheral blood, bile, liver and gastric contents
38.3 (tramadol), positive (M1 and M2)
GC-NPD (tramadol); GC-MS (M1 and M2);
[64] / 7 Tramadol Post mortem heart and peripheral blood, urine, brain, liver and kidney
0.069 to 8.67 LC-MS/MS
GC-MS, gas chromatography-mass spectrometry; GC-NPD, gas chromatography-nitrogen-phosphorus detector; HPLC-DAD, high performance liquid chromatography-diode-array detector; HPLC-FL, high performance liquid chromatography-fluorescence detection; LC-MS/MS, high performance liquid chromatography- tandem mass spectrometric; M1, O-desmethyltramadol; M2, N-desmethyltramadol; NS, not specified.

Quantification of tramadol and M1 in post mortem samples by gas chromatography–ion trap mass spectrometry and preliminary pharmacogenomic studies
10
The most common symptoms of acute tramadol intoxication are presented in
Table 3 [7]. However, these symptoms vary according to the dosage, therapeutic
formulation, administration route and an addiction/substance abuse history.
Table 3. Symptoms reported after tramadol overdose, (n=87 patients, including 15 children) [7].
Symptoms of overdose
Patients (%)
Lethargy 30
Nausea 14
Tachycardia 13
Agitation 10
Dizziness 9
Seizures 8
Vomiting 6
Coma 5
Hypertension 5
Confusion 3
Respiratory
depression
2
Ataxia 2
Diplopia 1
Dry mouth 1
Diaphoresis 1
5.1. Case reports: intoxication due to single tramadol administration
Backer et al. [27] quantified in post mortem blood and identified in urine
tramadol, M1 and M2 in 2 cases of fatal intoxication due to single tramadol
administration. The tramadol concentration found in case 2 is one of the highest ever
described in literature (48.3 mg/L) where the therapeutic range was exceeded in 160-
fold. The authors concluded that in both cases, the underlying pathophysiological
mechanism may be assumed to be respiratory depression.
In another fatal intoxication case described by Musshoff et al. [37], tramadol
was quantified in several post mortem samples. Tramadol peripheral blood
concentration of 9.6 mg/L exceeded at least 30-times the normal therapeutic range.
Highest concentrations were measured in bile and urine (46.1 and 46.0 mg/L
respectively). The concentration of tramadol in liver and kidney, in relation to blood,
failed to suggest a major sequestration of drug in either specimen, which is consistent
to the reported volume of distribution of 3 L/Kg. The authors concluded that in both

Quantification of tramadol and M1 in post mortem samples by gas chromatography–ion trap mass spectrometry and preliminary pharmacogenomic studies
11
cases, the underlying pathophysiological mechanism could be assumed to be
respiratory depression.
Levine et al. [26] analyzed tramadol distribution in four post mortem cases but
none of the deaths were attributed to tramadol intoxication. However, blood
concentrations of tramadol ranged from 0.27 to 6.5 mg/L. Loughrey et al. [38]
described a case of accidental overdose of tramadol leading to fatal acute hepatic
failure. Toxicological analysis revealed a blood tramadol concentration of 3.7 mg/L.
Although well above the therapeutic range, tramadol concentration was in much lower
levels than previously reported with fatal ingestion. It is possible that in these previous
cases, death occurred at an early stage due to CNS or respiratory depression before
liver injury became apparent. Lusthof and Zweipfenning [62] presented a suicide case
due to tramadol (blood concentration of 13 mg/L), where 7-aminoflunitrazepam was
also detected but in a very low concentration that could not be directly responsible for
the death.
Multiple organ failure syndrome due to tramadol intoxication is rare but still
documented. Decker et al. [36] described a case of a fatal intoxication due to single
tramadol administration at a blood concentration of 8 mg/L. The mechanism of death
was multiple organ failure syndrome. In the autopsy, pulmonary edema, diffuse
hemorrhagic mucosa of the gastrointestinal tract and a shock liver were observed.
Wang et al. [49] also presented a case of multiple organ failure syndrome due to
tramadol intoxication alone (blood concentration of 9.5 mg/L). There is no evidence that
the lung is a target organ of tramadol, however symptoms such as adult respiratory
distress syndrome were observed in this case. This fact indicates that there are still
some unknown mechanisms about tramadol.
5.2. Case reports: intoxication due to tramadol and other drugs
The concomitant use of tramadol with CNS depressants, particularly
antidepressants, benzodiazepines, barbiturates and/or alcohol, other opioids
analgesics and abused drugs may potentiate the adverse effects of this drug in the
CNS, in several ways [59-61, 63]. For instance, tramadol is metabolized through O-
demethylation (catalysed by the enzyme CYP2D6) to its active metabolite (M1). Such
as tramadol, many selective serotonin reuptake inhibitors (SSRIs) and tricyclic
antidepressants are substrates for the CYP2D6. Consequently, competitive inhibitions
of isozyme prevent it to bind completely to tramadol, reducing the metabolism of the
drug. Thus, there is an increase in the concentration of tramadol that can lead to an

Quantification of tramadol and M1 in post mortem samples by gas chromatography–ion trap mass spectrometry and preliminary pharmacogenomic studies
12
acute intoxication [23, 61, 65] and in some susceptible individuals, idiosyncratic
induction of serotonin syndrome [47]. Although a number of factors can increase or
decrease the risk of an adverse drug reaction (e.g., genetic predisposition, diet and
disease), the presence of drug combinations was considered the foremost risk and
these other factors were taken into consideration as contributive factors [65].
Ripple et al. [66] reported a tramadol lethal intoxication but discovered multiple
drugs with serotonin-effects. Tramadol blood concentration was 0.70 mg/L but death
could not be attributed only to tramadol. Deaths involving the use of certain serotonin
active drugs (tramadol, venlafaxine, fluoxetine, sertraline, citalopram and paroxetine),
occurred between 2002 and 2008 were reviewed by Pilgrim et al. [65], to assess the
incidence of contraindicated or ill advised drug combinations. This is important because
contraindicated or inappropriate drug combinations can lead to adverse drug reactions
and subsequent fatal toxicity. An example is the co-administration of tramadol and
fluoxetine, which is likely to cause potentially fatal serotonin toxicity. In this study,
tramadol was the most common drug usually detected, alongside a serotonergic
antidepressant.
Four cases of lethal intoxication for tramadol and other CNS depressant drugs
(particularly benzodiazepines) have been described by Clarot et al. [59]. The results
demonstrated that in three of these four cases, tramadol blood concentration was
greater than the toxic concentration limits. In one case, the concentration found of 134
mg/L was considered to be 62-times the toxic level. In two of these four cases, it was
found a toxic co-ingestion of bromazepam and in three cases an enzymatic inducer
(meprobamate, phenobarbital) was found at infra-therapeutic or therapeutic
concentration. Daubin et al. [42] also described a tramadol overdose case in
combination with other CNS depressants (hydroxyzine, gabapentin and clonazepam),
leading to refractory shock. This case demonstrated that tramadol overdose (23.9
mg/L) may cause refractory shock and asystole when taken in combination with CNS
depressants.
Bynum et al. [60] described a case of a fatal multiple drug overdose involving
tramadol and amitriptyline and evaluated the distribution of these drugs and
metabolites (nortriptyline, M1 and M2) in various tissues and fluids. A heart to
peripheral blood ratio of 5.0 was observed. This fact can be explained by the existent
diffusion from the stomach and/or gastrointestinal tract. Moreover, authors could not
rule out the possibility of peri mortem aspiration, which can contaminate the airways
and induce redistribution into the heart blood via the pulmonary vessels. In some
Quantification of tramadol and M1 in post mortem samples by gas chromatography–ion trap mass spectrometry and preliminary pharmacogenomic studies
13
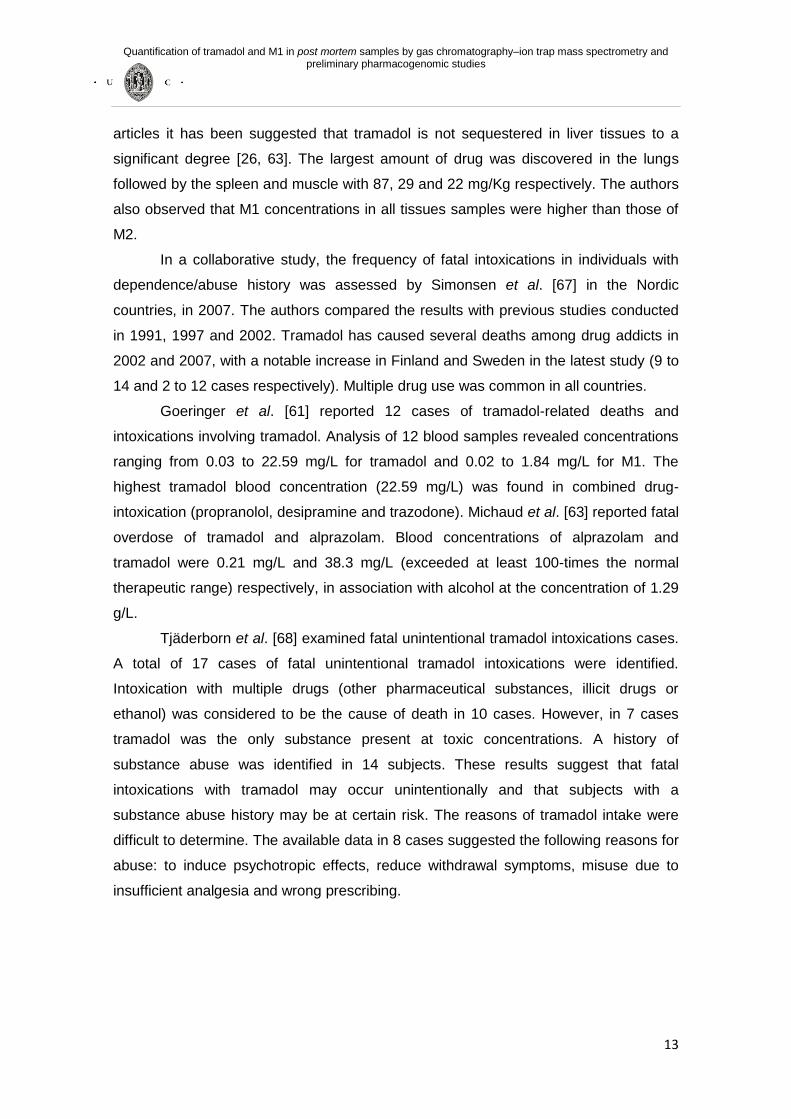
articles it has been suggested that tramadol is not sequestered in liver tissues to a
significant degree [26, 63]. The largest amount of drug was discovered in the lungs
followed by the spleen and muscle with 87, 29 and 22 mg/Kg respectively. The authors
also observed that M1 concentrations in all tissues samples were higher than those of
M2.
In a collaborative study, the frequency of fatal intoxications in individuals with
dependence/abuse history was assessed by Simonsen et al. [67] in the Nordic
countries, in 2007. The authors compared the results with previous studies conducted
in 1991, 1997 and 2002. Tramadol has caused several deaths among drug addicts in
2002 and 2007, with a notable increase in Finland and Sweden in the latest study (9 to
14 and 2 to 12 cases respectively). Multiple drug use was common in all countries.
Goeringer et al. [61] reported 12 cases of tramadol-related deaths and
intoxications involving tramadol. Analysis of 12 blood samples revealed concentrations
ranging from 0.03 to 22.59 mg/L for tramadol and 0.02 to 1.84 mg/L for M1. The
highest tramadol blood concentration (22.59 mg/L) was found in combined drug-
intoxication (propranolol, desipramine and trazodone). Michaud et al. [63] reported fatal
overdose of tramadol and alprazolam. Blood concentrations of alprazolam and
tramadol were 0.21 mg/L and 38.3 mg/L (exceeded at least 100-times the normal
therapeutic range) respectively, in association with alcohol at the concentration of 1.29
g/L.
Tjäderborn et al. [68] examined fatal unintentional tramadol intoxications cases.
A total of 17 cases of fatal unintentional tramadol intoxications were identified.
Intoxication with multiple drugs (other pharmaceutical substances, illicit drugs or
ethanol) was considered to be the cause of death in 10 cases. However, in 7 cases
tramadol was the only substance present at toxic concentrations. A history of
substance abuse was identified in 14 subjects. These results suggest that fatal
intoxications with tramadol may occur unintentionally and that subjects with a
substance abuse history may be at certain risk. The reasons of tramadol intake were
difficult to determine. The available data in 8 cases suggested the following reasons for
abuse: to induce psychotropic effects, reduce withdrawal symptoms, misuse due to
insufficient analgesia and wrong prescribing.

Quantification of tramadol and M1 in post mortem samples by gas chromatography–ion trap mass spectrometry and preliminary pharmacogenomic studies
14
5.3. Case reports: tramadol intoxication in children
Tramadol has become widely used in recent years for treatment of chronic and
acute pain, not only in the elderly but also in pediatric patients [15, 58, 69]. However,
unintentional intoxication with seizures (after the inadvertent administration of 4 mg/Kg
of tramadol) and severe CNS depression has been reported in children less than 1
year-old [58, 70]. Unintentional tramadol intoxication of a 4 year-old girl was reported
by Grosek et al. [58]. Despite the negative history, the suspicion of opioid intoxication
(CNS and respiratory depression, respiratory acidosis, cyanosis and miosis) led them
to administer an opioid antagonist, naloxone. Urine toxicology screening was not
completed, because tramadol was not part of the standard opioid urine toxicology
screening. However, a toxicological analysis with GC-MS confirmed the presence of
tramadol.
As described in adults, serotonin syndrome can occur in children intoxicated
with tramadol. Severe case of unintentional tramadol intoxication in an 8 month old girl
was reported by Maréchal et al. [50]. Tramadol serum levels confirmed the intoxication
(680 mg/L). Clinical signs (agitation, tachycardia, hyperthermia, hyperreflexia and
hypertension) were indicative of serotonin syndrome.
6. Treatment of tramadol intoxication
Treatment of acute tramadol intoxication consists in the administration of the
opioids antagonists (e.g. naloxone), anticonvulsant drugs, if seizures occur, and other
supportive measures such as intubation and mechanical ventilation in respiratory
depression, for maintaining vital functions [58]. Naloxone is greatly important in opioid
CNS and respiratory depression reversion, in opioids suspected intolerance diagnosis
and in overdose cases. This opioid antagonist has been used to induce reversion of
symptoms in this type of intoxication [49, 58, 71, 72]. However, naloxone should be
administered with precaution in patients subjected to high doses of opioids, particularly
in children (may initiate seizures) [50] or in patients that have an opioid physical
dependence [58]. In the latter case, rapid reversal of opioid effects by naloxone may
trigger the acute withdrawal syndrome [4].
Several cases are described in the literature, showing the successful use of
naloxone. In a case of unintentional tramadol intoxication of a 4 year-old girl, the
suspicion of opioid intoxication led to naloxone administration [49]. Wang et al. [49]

Quantification of tramadol and M1 in post mortem samples by gas chromatography–ion trap mass spectrometry and preliminary pharmacogenomic studies
15
presented a case of a 19 year-old patient who had multiply organ dysfunction
syndrome due to oral tramadol alone. Initially, the individual had developed deep coma,
acute respiratory distress syndrome, hepatic and renal dysfunction, and shock. With
the application of supportive measures and naloxone administration his overall status
gradually improved. In the Marquardt et al. [72] study, naloxone improved CNS
depression in seven out of eight patients.
Leo et al. [52] present a case of a patient with longstanding tramadol
dependence that was successful treated with methadone detoxification. The patient
tolerated well, with significant reduction in subjective symptoms of opioid withdrawal.
7. The importance of genetic polymorphism in tramadol
pharmacokinetics and pharmacodynamics
Pharmacogenomics provides the hereditary basis for inter-individual differences
in drug efficacy, side effects and toxicity [5].
Cytochrome P450 (CYPs) enzymes play an important role in drug metabolism,
being responsible for about 80% of all metabolism [73]. The genes that encode the
CYPs are functionally polymorphic and responsible for the appearance of different
phenotypes. The enzyme encoded by the CYP2D6 gene plays an important role in the
metabolism of several drugs (approximately 25% of all drugs administered in clinical
practice including tramadol) [74]. More than 80 distinct allelic variants for CYP2D6 are
known, which leads to a greater phenotypic and genetic heterogeneity with in
populations [75].
The genetic variants give rise to different phenotypes in the drug metabolizing
enzyme CYP2D6: poor metabolizers (PMs), homozygous for non-functional alleles and
poor metabolism, intermediate metabolizers (IMs), heterozygous for a functional allele
and one non-functional, ultrarapid metabolizers (UMs), multiple functional copies of the
gene and substantially accelerated metabolism, or more common in the population the
extensive metabolizers (EMs), homozygous for functional alleles [9, 76]. Phenotype
distributions in European Caucasians show a frequency of 7 - 10% for PMs, 10 - 15%
for IMs, 70 - 80% for EMs, and 3 - 5% for UMs [77]. In comparison to Caucasians, the
incidence of PMs is much lower in Asian and African populations. Caucasians have a
significantly increased frequency of three defective genes: CYP2D6*4, CYP2D6*3 and
CYP2D6*6 whereas the frequency of CYP2D6*5 defective alleles are similar to that of
other ethnic groups, all contributing to the PMs phenotype [78]. In contrast, other
Quantification of tramadol and M1 in post mortem samples by gas chromatography–ion trap mass spectrometry and preliminary pharmacogenomic studies
16
polymorphisms like CYP2D6*10 are specifically frequent in Asian subjects and the *45
and *46 alleles in subjects from Black African origin [5].
Genetic variation in drug metabolizing enzymes can lead to inter-individual
differences in drugs response, and also to adverse side effects, including death [76,
79]. As the analgesic effect of tramadol is dependent on the CYP2D6 activity, in
individuals with PMs, the analgesic effect is lower because the drug is partially
metabolized to M1 [80]. Another risk group consists on individuals whose metabolism is
substantially accelerated, e.g. due to more than two functional copies of the CYP2D6
gene. They require higher doses than usual to achieve therapeutic parent drug levels in
blood [76]. The IMs phenotype may also be relevant to the clinical effects of CYP2D6
substrates although to a lesser extent when compared with PMs and UMs phenotypes
[9].
Other possible polymorphisms influencing tramadol pharmacokinetics are
present in multidrug resistance protein (MDR1), μ-opioid receptor gene (OPRM1) and
catechol-O-methyltransferase (COMT) gene.
The MDR1 gene with 28 exon is located in chromosome 7q21.12, and the
coding region accounts for less than 5% of the total. Over 50 single nucleotide
polymorphisms (SNPs) that have been identified in the human MDR1 gene [81-83].
Among them, C3435T may play a role in inducing drug resistance by altering the
expression level of the MDR1 gene [83]. MDR1 gene codifies to Pg-glycoprotein which
represents an important efflux transporter involved in bioavailability and elimination of
several other drugs in humans. Tramadol is a substrate of P-glycoprotein, and a
polymorphism, as C3435T in the MDR1 gene, may affect the pharmacokinetics of
tramadol [84].
The COMT is an enzyme that catabolizes catecholamines and thus influences
the dopaminergic and adrenergic/noradrenergic neurotransmission [85]. The COMT
gene has been identified as a potential determinant of pain sensitivity in humans [86].
There are different SNPs in the COMT gene which induce important functional
alterations of the enzyme [87]. The most studied SNPs in the COMT gene is
Val158Met, that occurs in codon 158, resulting in a valine to methionine transition
(Val/Met). The Val allele is associated with higher enzymatic activity than the Met allele
[87, 88]. COMT Val158Met polymorphism could be important for the understanding of
why certain individuals are more prone to develop opioid-induced hyperalgesia and
tolerance to the antinociceptive actions of opioids [89].

Quantification of tramadol and M1 in post mortem samples by gas chromatography–ion trap mass spectrometry and preliminary pharmacogenomic studies
17
Genetic polymorphisms involved in the µ-opioid receptor have been associated
with an altered pain threshold and susceptibility to opioid drugs. The most common
SNP in the OPRM1 gene is the A118G (adenine (A) to guanine (G) substitution)
polymorphism. Individuals with the GG or GA genotype have shown an elevated
sensitivity to pain and a reduced analgesic response to opioids compared with
individuals with the AA genotype [90-93].
Besides pharmacogenomics, the pharmacokinetics of the drug can be affected
by many other factors namely, age, disease, comorbidities, concomitant medication,
metabolic interactions and kidney or liver function [5, 76].
8. Analytical methods to quantify tramadol and O-desmethyltramadol
Analytical Chemistry plays an important role in ante mortem and post mortem
forensic and clinical toxicology. Therefore, the identification and quantification of
tramadol and its main active metabolite M1 is of major importance. Several analytical
methods of tramadol and M1 quantification in various biological matrices have been
described. A synopsis is given in Table 4.

Quantification of tramadol and M1 in post mortem samples by gas chromatography–ion trap mass spectrometry and preliminary pharmacogenomic studies
18
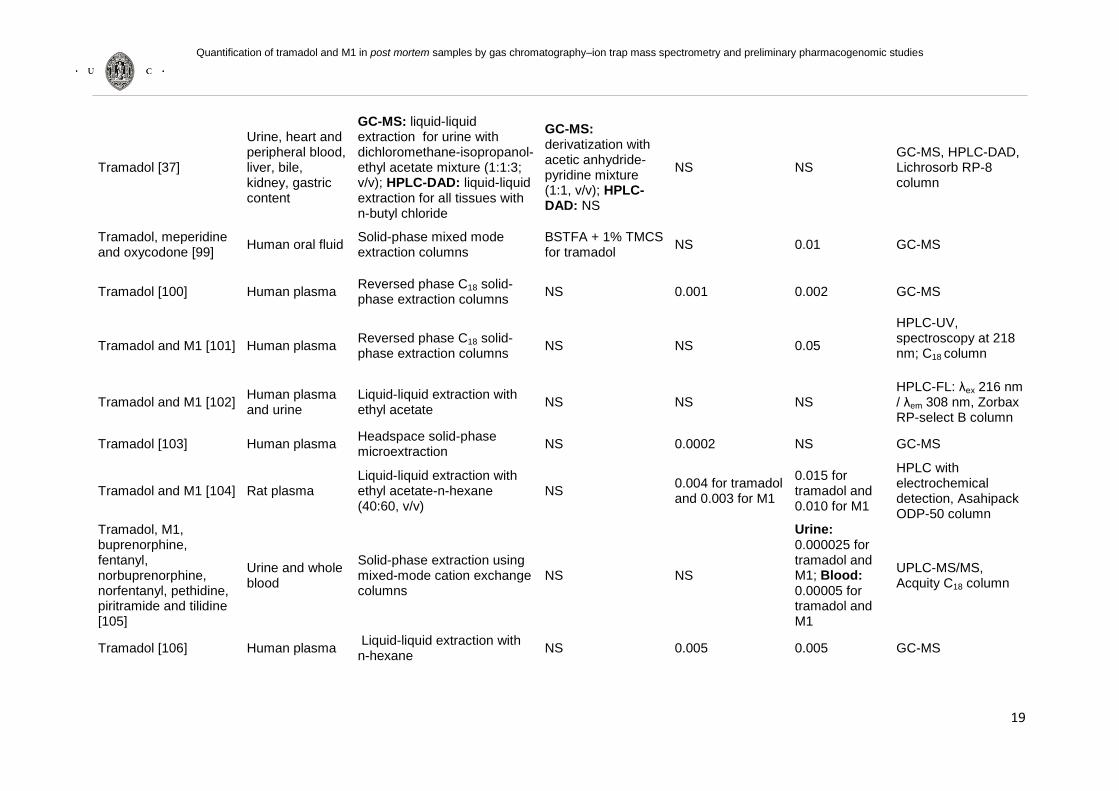
Table 4. Review of the analytical methods for qualitative and quantitative analysis of tramadol and metabolites.
Analytes/reference Sample Sample preparation Derivatization LOD (mg/L), (ng/mg - hair)
LLOQ (mg/L), (ng/mg - hair)
Method
Tramadol [94] Human plasma Liquid-liquid extraction with ethyl acetate
NS 0.009 0.017
HPLC-UV, spectroscopy at 225 nm, LiChrospher 60 RP-select B column;
Tramadol [95] Rabbit plasma Liquid-liquid extraction with ethyl acetate
NS 0.25 0.4
HPLC-DAD, Phenomenex Bondclone RP-18 column
Tramadol, M1, M2, M5, M6 and M7 [43]
Urine of dogs Liquid-liquid extraction with diisopropyl ether / dichloromethane (1:1)
NS
HPLC-FL: 0.005 for tramadol, M1, M2 and M5; LC-MS/MS: NS
HPLC-FL: 0.01 for tramadol, M1, M2 and M5; LC-MS/MS: NS
HPLC-FL (tramadol, M1, M2 and M5): λex 275 nm / λem 300nm; LC–MS/MS (M6 and M7), Phenomenex Luna C18 ODS2 column
Tramadol [96] Human plasma Liquid-liquid extraction with ethyl acetate / hexane (1:4)
NS 0.01 0.01
HPLC-UV, spectroscopy at 218 nm, LiChrosorb RP-18 column
Tramadol [97] Hair Solid-phase extraction using mixed-mode cation exchange columns
NS 0.5 NS GC-MS
Tramadol, M1, M2 and M5 [98]
Rat perfused liver
NS NS NS 0.002 for all metabolites
HPLC-FL, Chromolith
TM
Performance RP-18 column
Quantification of tramadol and M1 in post mortem samples by gas chromatography–ion trap mass spectrometry and preliminary pharmacogenomic studies
19
Tramadol [37]
Urine, heart and peripheral blood, liver, bile, kidney, gastric content
GC-MS: liquid-liquid extraction for urine with dichloromethane-isopropanol-ethyl acetate mixture (1:1:3; v/v); HPLC-DAD: liquid-liquid extraction for all tissues with n-butyl chloride
GC-MS: derivatization with acetic anhydride- pyridine mixture (1:1, v/v); HPLC-DAD: NS
NS NS GC-MS, HPLC-DAD, Lichrosorb RP-8 column
Tramadol, meperidine and oxycodone [99]
Human oral fluid Solid-phase mixed mode extraction columns
BSTFA + 1% TMCS for tramadol
NS 0.01 GC-MS
Tramadol [100] Human plasma Reversed phase C18 solid-phase extraction columns
NS 0.001 0.002 GC-MS
Tramadol and M1 [101] Human plasma Reversed phase C18 solid-phase extraction columns
NS NS 0.05
HPLC-UV, spectroscopy at 218 nm; C18 column
Tramadol and M1 [102] Human plasma and urine
Liquid-liquid extraction with ethyl acetate
NS NS NS HPLC-FL: λex 216 nm / λem 308 nm, Zorbax RP-select B column
Tramadol [103] Human plasma Headspace solid-phase microextraction
NS 0.0002 NS GC-MS
Tramadol and M1 [104] Rat plasma Liquid-liquid extraction with ethyl acetate-n-hexane (40:60, v/v)
NS 0.004 for tramadol and 0.003 for M1
0.015 for tramadol and 0.010 for M1
HPLC with electrochemical detection, Asahipack ODP-50 column
Tramadol, M1, buprenorphine, fentanyl, norbuprenorphine, norfentanyl, pethidine, piritramide and tilidine [105]
Urine and whole blood
Solid-phase extraction using mixed-mode cation exchange columns
NS NS
Urine: 0.000025 for tramadol and M1; Blood: 0.00005 for tramadol and M1
UPLC-MS/MS, Acquity C18 column
Tramadol [106] Human plasma Liquid-liquid extraction with n-hexane
NS 0.005 0.005 GC-MS

Quantification of tramadol and M1 in post mortem samples by gas chromatography–ion trap mass spectrometry and preliminary pharmacogenomic studies
20
Tramadol and M1 [107] Human plasma Liquid-liquid extraction with tert-butyl-methylether
NS NS 0.05 HPLC-FL: λex 280 nm / λem 310 nm, Spherisorb CN 5µ
Tramadol, M1 and M2 [26]
Heart and peripheral blood, urine, bile, liver and kidney
Liquid-liquid extraction with n-butyl chloride and methylene chloride
NS 0.05 0.10 GC-MS
Tramadol [108] Human plasma Liquid-liquid extraction with n-hexane
BSTFA + 1% TMCS 0.01 0.04 GC-MS
Tramadol and M1 [109] Goat plasma Liquid-liquid extraction with tert-butylmethyl ether
NS NS 0.025 for tramadol and 0.01 for M1
HPLC-UV, 220nm, RP-18 column
Tramadol [110] Human saliva Liquid-liquid extraction with hexane-ethyl acetate (4:1)
NS 0.1 0.25 HPLC-DAD, Zorbax SB-C18 column
Tramadol and M1 [111] Human plasma
The sample preparation consisted in plasma protein precipitation from 0.2 mL plasma using 0.2 mL solution of perchloric acid 7%
NS NS 0.0021 for tramadol and 0.0022 for M1
LC-MS/MS, Zorbax SB-C18 column
Tramadol and M1 [112] Human plasma
Analytes were extracted from 200 µL aliquots of human plasma via protein precipitation using acetonitrile
NS NS 0.001 for tramadol and 0.0005 for M1
LC-MS/MS, Aquasil C18 column
11 opioids including tramadol [113]
Human plasma Automated off-line solid-phase extraction system, with C18 columns
NS 0.0008 0.003
LC-MS/MS, Phenomenex C12 MAX-RP column
Tramadol and M1[114] Human plasma Liquid-liquid extraction with ethyl acetate
NS NS 0.0041 for tramadol and 0.0032 for M1
HPLC-FL: λex/λem (200/300 nm, 200/295 nm, 212/305 nm), RP-18 column

Quantification of tramadol and M1 in post mortem samples by gas chromatography–ion trap mass spectrometry and preliminary pharmacogenomic studies
21
Tramadol, M1, M2 and M5 [25]
Human plasma, saliva and urine
Liquid-liquid extraction with ethyl acetate
NS NS 0.0025
HPLC-FL: λex 200 nm / λem 301 nm, Chromolith
TM
Performance RP-18 column
Tramadol [115] Human urine and plasma
Three-phase hollow fiber liquid-phase microextraction
NS 0.00008 NS GC-MS
Tramadol, morphine, 6-acetylmorphine, codeine and 6-acetylcodeine [116]
Hair Solid-phase mixed mode extraction columns
MSTFA + 5% TMCS
40 for tramadol 0.05 GC-MS
Tramadol, M1, M2, amitriptyline and nortriptyline [60]
Heart and peripheral blood, liver, urine, kidney, vitreous humor, lung, heart, brain, spleen, gastric content, bile and muscle
Liquid-liquid extraction with n-butyl chloride / ethyl ether mixture (75:25)
NS NS 0.25 GC-MS
Tramadol, M1 and M2 [61]
Heart and peripheral blood
Liquid-liquid extraction with n-butyl chloride;
NS 0.01 0.02 GC-MS
Tramadol, M1 and M2 [76]
Post mortem peripheral blood
Liquid-liquid extraction with dichloromethane isopropyl alcohol (M1 and M2) and butyl acetate (tramadol)
NS NS 0.1 for tramadol, 0.01 for M1 and M2
GC-MS (tramadol); LC-MS/MS (M1 and M2), C18 column
Tramadol, metoprolol and midazolam [64]
Post mortem heart and peripheral blood, urine, brain, liver and kidney
Liquid-liquid extraction with dichloromethane
NS NS 0.0078 LC-MS/MS, Synergy 4µ Polar-RP 80A column

Quantification of tramadol and M1 in post mortem samples by gas chromatography–ion trap mass spectrometry and preliminary pharmacogenomic studies
22
Tramadol [59] Post mortem blood
Liquid-liquid extraction with dichloromethane hexane ethylacetate (5:4:1, v/v/v)
NS 0.025 NS HPLC-DAD, C18 BDS column
Tramadol, M1 and M2 [117]
Human plasma Liquid-liquid extraction with ethyl acetate
NS NS
0.0025 for tramadol, 0.00125 for M1 and 0.005 for M2
HPLC-FL: λex 200 nm / λem 301 nm, Chromolith
TM
Performance RP-18 column
Tramadol [118] Human urine NS NS 0.02 0.05 CE-UV-LINF, λem 257 nm, fused-silica capillaries of 75 cm
49 licit and illicit drugs including tramadol [119]
Oral fluid Solid-phase extraction using bond elut certify
® LRC
cartridges
GC-MS: Ethyl acetate / pentafluoropropionic anhydride (3:2 v/v); LC-MS/MS: NS
0.0015 0.0049 GC-MS (tramadol); LC-MS/MS, Luna C18
column
Tramadol [120] Human plasma Liquid-liquid extraction with tert-butylmethyl ether
NS NS 0.017
HPLC-FL: λex 202 nm / λem 296 and 314 nm, C18 column; HPLC-UV/VIS spectroscopy at 275 nm, C18 column
Tramadol and acetaminophen [121]
Human plasma Liquid-liquid extraction with ethyl acetate
NS NS 0.005 LC-MS, Hanbon LiChrospher CN column;
Tramadol and M1 [122] Human plasma Liquid-liquid extraction with tert-butyl methyl ether
NS 0.0003 for tramadol and 0.0004 for M1
0.001 for tramadol and M1
HPLC-FL: λex 202 nm / λem 296 and 314 nm, Kromasil 100 C18
column
Tramadol, M1, metoprolol and α-hydroxymetoprolol [123]
Human plasma and urine
Liquid-liquid extraction with ethyl ethanoate
NS NS 0.0125 for tramadol and 0.005 for M1
HPLC-FL: λex 216 nm / λem 312 nm, Zorbax RP-select B column

Quantification of tramadol and M1 in post mortem samples by gas chromatography–ion trap mass spectrometry and preliminary pharmacogenomic studies
23
12 opioid agonists including tramadol [124]
Serum, blood, urine, cerebrospinal fluid, vitreous humor and bile
Reversed phase C18 solid-phase extraction columns
NS 0.0001 for tramadol
NS LC-MS, Superspher RP 18 columns
Tramadol and M1 [125] Human plasma
Liquid-liquid extraction with diethyl ether dichloromethane-butanol (5:3:2, v/v/v)
NS 0.001 for tramadol and 0.0005 for M1
0.003 for tramadol and 0.0015 for M1
HPLC-FL: λex 275 nm / λem 300 nm, Hypersil C18 column
24 drugs including tramadol [126]
Hair Headspace-solid phase microextraction
NS 0.1 0.4 GC-MS
BSTFA, N,O-bis(trimethylsilyl) trifluoroacetamide; CE-UV-LINF, capillary electrophoresis-ultraviolet laser-induced native fluorescence detection; GC-MS, gas chromatography-mass spectrometry; GC-NPD, gas chromatography-nitrogen-phosphorus detector; HPLC-DAD, high performance liquid chromatography-diode-array detector; HPLC-FL, high performance liquid chromatography-fluorescence detection; HPLC-UV, high performance liquid chromatography-ultraviolet detection; LC-MS, liquid chromatography-mass spectrometry; LC-MS/MS, liquid chromatography-tandem mass spectrometric; LLOQ, lower limit of quantification; LOD, limit of detection; M1, O-desmethyltramadol; M2, N-desmethyltramadol; M5, N,O-didesmethyltramadol; M6, 4-hydroxy-ciclohexyl tramadol; M7, 4-hydroxy-ciclohexyl-N-desmethyl tramadol; MSTFA, N-methyl-N-(trimethylsilyl) trifluoroacetamide; NS, not specified; TMCS, trimethylchlorosilane; UPLC-MS/MS, ultra-performance liquid chromatography-tandem mass spectrometric.

Quantification of tramadol and M1 in post mortem samples by gas chromatography–ion trap mass spectrometry and preliminary pharmacogenomic studies
24
Usually, an initial sample preparation step is essential for pre-concentration,
isolation and extraction of tramadol and M1 in biological samples prior to its
subsequent chromatographic analysis [115]. Liquid-liquid extraction (LLE) and solid-
phase extraction (SPE) has been widely used as sample preparation step to extract
tramadol and M1 from these samples. In the past few years special attention has been
given to the sample preparation techniques which do not require the use of large
volumes of organic solvents, have high sensitivity and speed, such as SPE. Another
advantage of SPE is its capacity to automation, which allows a reduction in the sample
preparation time and increase the accuracy of the method. However, despite its
effectiveness, the costs are high and is sometimes incompatible with unstable samples
[127]. Bjørk et al. [128] developed a method of automated solid-phase extraction liquid
chromatography-tandem mass spectrometry (SPE-LC-MS/MS) for the analysis of 19
drugs and metabolites including tramadol and M1.
The most recent and promising techniques in the extraction of these
compounds from biological matrices are the solid-phase microextraction (SPME) and
liquid-phase microextraction (LPME). SPME is a simple, rapid, with high sensitivity and
less spending of solvent extraction technique that has proved to be a powerful
alternative to conventional methods. However, SPME fibers are fragile and relatively
expensive and tend to degrade with repeated use. A simple, rapid and sensitive
method for determination of tramadol in plasma samples was developed by Sha et al.
[103] using SPME and gas GC-MS with limit of detection (LOD) of 0.0002 mg/L.
Sporkert and Pragst [126] also developed a method of SPME for simultaneous
extraction of 24 drugs including tramadol in hair samples and analysis by GC-MS with
LOD of 0.1 ng/mg for tramadol. LPME is an emerging technique based on the use of
small amounts of organic solvents to extract analytes from aqueous matrices [103, 115,
126]. Ghambarian et al. [115] developed a method of LPME for extraction of tramadol
from plasma and urine samples and analysis by GC-MS, with good linearity and high
sensitivity (LOD of 0.00008 mg/L).
Several authors have reported the analysis of tramadol and its active metabolite
M1 simultaneously by high performance liquid chromatography (HPLC) with ultraviolet
[101, 109], electrochemical [104], fluorescence [25, 43, 98, 102, 107, 114, 122, 123,
125, 129] and mass spectrometry detection [26, 60, 61, 76, 105, 111, 112, 128].
However, there are several disadvantages using HPLC-UV for determining tramadol
and M1 concentrations in biological samples. Tramadol contains a weak absorbing
chromophore in its molecule [95, 130], which makes determination of low tramadol

Quantification of tramadol and M1 in post mortem samples by gas chromatography–ion trap mass spectrometry and preliminary pharmacogenomic studies
25
concentrations problematic [94], though there is a benzene ring present in tramadol
and its metabolite molecules [114]. Furthermore, biological samples containing
tramadol need to be extracted using multi-step pH-dependent procedures prior to
HPLC. For the moment, only two types of detectors have reached low quantification
levels: fluorescence and mass spectrometry, not only due to the detectors
performances and chromatographic columns used but also to the optimized
parameters of the methods involving the extraction processes [114]. Tandem mass
spectrometry (MS/MS) has been used to enhance the sensitivity at minor
concentrations.
The GC-MS and liquid chromatography-tandem mass spectrometric (LC-
MS/MS) have also shown high sensitivity, specificity and efficiency. Although most of
the procedures used for the determination of tramadol and M1 are based on GC-MS,
the preparation of the sample is still time consuming and complex when compared to
LC-MS/MS, because of the need for derivatization of these polar compounds. The
derivatization of the compounds allows an increase in its volatility, improving the
thermal stability and consequently the detectability of the derivative [131]. The most
employed derivatizing agent for compounds analyzes is N,O-bis(trimethylsilyl)
trifluoroacetamide + 1% trimethylchlorosilane (BSTFA + 1% TMCS). Tramadol and M1
have been analyzed by GC-MS in several biological samples, including blood [60, 61,
76], urine, liver, bile, kidney [26, 60], gastric content, vitreous humor, lung, heart, brain,
spleen, and muscle [60].
Advanced and sophisticated methods have been recently described such as
ultra-performance liquid chromatography-tandem mass spectrometry (UPLC-MS/MS).
Verplaetse and Tytgat [105] presented a highly sensitive UPLC-MS/MS method for the
analysis of various drugs and their metabolites (including tramadol and M1) in urine
and whole blood. The alkaline wash step in the SPE protocol, the high pH of the mobile
phase, the use of electrospray ionization (ESI) and the use of a column with small
particle size (1.7 µm) were found to be crucial parameters warranting the high
sensitivity of the method. However, despite ultra-performance liquid chromatography
(UPLC) presented high specificity and selectivity and short runtimes with a higher
resolution chromatographic separation, is a very expensive chromatographic
technique, compared with LC-MS/MS and GC-MS [105].
Recently the capillary electrophoresis with ultraviolet laser-induced native
fluorescence detection (CE-UV-LINF) emerged as a powerful analytical technique. CE
enables rapid separations with high separation efficiency and compatibility with small

Quantification of tramadol and M1 in post mortem samples by gas chromatography–ion trap mass spectrometry and preliminary pharmacogenomic studies
26
sample volumes. LINF can result in extremely low limits of detection in CE. The main
problem in CE is the small inner diameter of the capillary which causes a low sensitivity
with instruments equipped with a UV detector [132]. Soetebeer et al. [118] described a
sensitive and highly selective CE-UV-LINF method for the direct determination of
tramadol in urine samples without extraction or pre-concentration with LOD 0.02 mg/L.
Quantification of tramadol and M1 in post mortem samples by gas chromatography–ion trap mass spectrometry and preliminary pharmacogenomic studies
27
PART II: General and specific objectives of the thesis

Quantification of tramadol and M1 in post mortem samples by gas chromatography–ion trap mass spectrometry and preliminary pharmacogenomic studies
28
Objectives of the thesis
The general objective of this work was to validate an analytical method for
qualitative and quantitative analysis of tramadol and M1 by GC-MS and to study the
CYP2D6, MDR1, OPRM1 and COMT gene polymorphisms by real-time polymerase
chain reaction (PCR) in five post mortem blood samples from cases of suspected
tramadol fatal intoxications.
The specific objectives if this thesis were:
- To study different conditions of GC-MS method in order to obtain the best peak
resolution and separation of the compounds;
- To study different conditions of sample preparation for GC-MS analysis;
- To optimize the extraction procedure;
- To study the sensitivity, selectivity, limit of detection (LOD), lower limit of
quantification (LLOQ), accuracy and precision of the developed method;
- The application of the GC-MS method to real post mortem blood samples;
- The same post mortem blood samples were then genotyped for the presence of
CYP2D6*4 allele (T1236T>C) SNP. MDR1 (C3435T), OPRM1 (A118G) and
COMT (Val158Met) SNPs were also analyzed by real-time PCR.
- A final objective was to give a first insight (due to the limited number of
samples) for the comparison of the genotyping results with concentrations of
tramadol and M1 found in the samples. Further studies (with more samples) will
be necessary to assess any correlation between variables.

Quantification of tramadol and M1 in post mortem samples by gas chromatography–ion trap mass spectrometry and preliminary pharmacogenomic studies
29
PART III: Experimental Part

Quantification of tramadol and M1 in post mortem samples by gas chromatography–ion trap mass spectrometry and preliminary pharmacogenomic studies
30
Chapter I
Materials and methods

Quantification of tramadol and M1 in post mortem samples by gas chromatography–ion trap mass spectrometry and preliminary pharmacogenomic studies
31
1. Material and methods
1.1. Ethics statement
All research was approved by the Portuguese National Council of Ethics for Life
Sciences (CNECV). According to the current Portuguese law for medico-legal
autopsies and following the ethical principles of Declaration of Helsinki, no informed
written or oral consent of the victim family is required for scientific research in routinely
collected samples. Therefore the use of these samples beyond establishing the cause
of death is foreseen by the law.
1.2. Reagents and standards
The analytical standard O-desmethyltramadol hydrochloride (3-[2-(1-Amino-1-
methylethyl)-1-hydroxycyclohexyl]phenol hydrochloride); molecular mass 285.809
g/moL), were a generous gift from Grünenthal (Amadora, Portugal). Tramadol
hydrochloride ((±)-cis-2-(Dimethylaminomethyl)-1-(3methoxyphenyl)cyclohexanol
hydrochloride; molecular mass 299.84 g/moL) and phenacetin (N-(4-Ethoxyphenyl)
acetamide); molecular mass 179.216 g/moL, internal standard, IS) were obtained from
Sigma-Aldrich (St Louis, MO, USA) and LGC Standards respectively.
Methanol and N,O-bis(trimethylsilyl)trifluoroacetamide/trimethylchlorosilane
(BSTFA+1%TMCS) were purchased from Sigma-Aldrich (St Louis, MO, USA), sodium
hydroxide (NaOH) and perchloric acid (HClO4) from Panreac (Barcelona, Spain).
Ethanol and 2-propanol were acquired from Merck (Darmstadt, Germany). Nitrogen
(99.99% purity) and helium (99.99%) were obtained from Gasin (Portugal).
Bond Elut®C18 cartridges (100 mg, 1 mL) were purchased from Varian (Sint-
Katelijne-Waver, Belgium). FavorPrepTM genomic DNA mini kit (blood/cultured cell) was
obtained from Favorgen® Biotech Corp. (Taiwan, China). CYP2D6 (T1236T>C,
rs1128503), MDR1 (C3435T, rs1045642), OPRM1 (A118G, rs1799971) and COMT
(Val158Met, rs4680) SNPs assays were obtained from Applied BiosystemsTM.
All the reagents used were of analytical grade or from the highest available
grade.

Quantification of tramadol and M1 in post mortem samples by gas chromatography–ion trap mass spectrometry and preliminary pharmacogenomic studies
32
1.3. Biological specimens
Post mortem blood samples (1 mL) of cases of suspected tramadol fatal
intoxications were obtained from the North Branch of the Portuguese National Institute
of Legal Medicine and Forensic Sciences, I.P.. The samples were collected according
to the guidelines normally followed at this institution and were stored at -80 ºC prior to
analysis [133].
1.4. Preparation of stock and working standard solutions
Stock solutions of tramadol and M1 were prepared in methanol at the
concentration of 1 mg/mL. Tramadol and M1 concentrations of working standard
solutions for the calibration curve were prepared at different concentrations by diluting
of the stock solutions in methanol (5, 10, 50, 100, 500 and 1000 ng/mL). A working
solution of the IS at 20 µg/mL was also prepared in methanol. All working solutions
were prepared fresh daily. All stock solutions were stored at -80 ºC prior use.
1.5. Sample preparation for gas-chromatography mass spectrometry analysis
Blood samples were pre-treated by sonication for 20 minutes at room
temperature. Then, 500 µL of HClO4 (7%) were added, vortexed for 1 minute and
centrifuged at 13000 rpm, 20 minutes at 4 ºC.
1.5.1. Tramadol and M1 extraction from biological sample
Different methods of LLE and SPE were tested to determine the optimal
conditions of extraction but here it is only described the method that resulted in high
recoveries.
SPE was performed using C18 cartridges connected to a vacuum manifold and
conditioned twice with 1 mL of methanol, followed by thrice 1 mL of 0.001 M NaOH.
The supernatant was then passed through the cartridges. The cartridges were washed
with 1 mL of 0.001 M NaOH. After drying under full vacuum for 1 minute, the analytes
were eluted with 2 mL of 2-propanol. The eluate was evaporated to dryness at 50 ºC
under a gentle stream of nitrogen (Fig. 3).

Quantification of tramadol and M1 in post mortem samples by gas chromatography–ion trap mass spectrometry and preliminary pharmacogenomic studies
33
Bond Elut® C18 cartridges
Conditioning: (2×) 1 mL of methanol + (3×) 1 mL of
0.001M NaOH
↓
Load: all sample/blank or standard supernatant volume
subjected to extraction
↓
Wash: (3×) 1 mL of 0.001M NaOH
↓
Elution: (2×) 1 mL of 2-propanol
↓
Dry under nitrogen flow
Derivatization procedure
25 µL of BSTFA + 1% TMCS
+
25 µL of ethyl acetate
↓
70 ºC, 20 minutes
↓
Cool to room temperature
↓
Dry under nitrogen flow
↓
Dissolve the obtained residue in 50 μL of ethyl acetate
↓
Injection of 2 μL into GC-EI/MS
B
C
Pre-treatment
500 µL of blood
+
25 µL of IS
↓
20 minutes in ultrasonic bath
↓
500 µL of 7% HClO4
↓
Homogenize 1 minute
↓
Centrifuge 13000 rpm, 20 minutes, 4 ºC
A
Figure 3. Sample preparation procedure. (A) Sample pre-treatment. (B) Extraction/purification
with solid-phase extraction (SPE). (C) Derivatization procedure. BSTFA, N,O-bis(trimethylsilyl)
trifluoroacetamide; GC-EI/MS, gas chromatography-electron impact/mass spectrometry; HClO4,
perchloric acid; IS, internal standard; NaOH, sodium hydroxide; TMCS, trimethylchlorosilane.
1.5.2. Derivatization procedure
In this study, tramadol and M1 were derivatized by silylation, reacting with
BSTFA and TMCS. BSTFA is the silylation reagent that reacts with tramadol and M1

Quantification of tramadol and M1 in post mortem samples by gas chromatography–ion trap mass spectrometry and preliminary pharmacogenomic studies
34
and replaces active hydrogens with a –Si(CH3)3 (trimethylsilyl) group (Fig. 4 and 5).
TMCS increases the reactivity of BSTFA.
Figure 4. Derivatization reaction of tramadol.
Figure 5. Derivatization reaction of M1.
Tramadol and M1 derivatization was performed with the addition of 25 µL of
BSTFA + 1% TMCS and 25 µL ethyl acetate to the evaporated solution, mixed and
heated for 20 minutes at 70 ºC. After cooling to room temperature, the samples were
evaporated to dryness under nitrogen flow, reconstituted with 25 µL of ethyl acetate
and 2 µL of each derivatized sample were injected into the GC-MS system.
Tramadol BSTFA Tramadol derivatized
Si
CH3
CH3
CH3
H
CH2
N
CH3
CH3
OMe
O Si
CH3
CH3
CH3
H
OH
CH2
N
CH3
CH3
OMe
+ Silylation
M1 BSTFA M1 diderivatized
Si
CH3
CH3
CH3
+ Silylation
H
OH
CH2
N
CH3
CH3
OH
H
CH2
N
CH3
CH3
O
O
CH3
CH3
CH3
Si
Si
CH3
CH3
CH3
M1 BSTFA M1 monoderivatized
Si
CH3
CH3
CH3
+ Silylation
H
OH
CH2
N
CH3
CH3
OH
H
CH2
N
CH3
CH3
OH
O
CH3
CH3
CH3
Si

Quantification of tramadol and M1 in post mortem samples by gas chromatography–ion trap mass spectrometry and preliminary pharmacogenomic studies
35
1.6. Gas chromatography-mass spectrometry conditions
Quantitative GC-MS analysis were performed on a Varian CP-3800 gas
chromatographer (USA) equipped with an ion-trap Varian GC-MS Saturn 2200 mass
detector. Chromatographic separation was achieved using a capillary column
Agilent®VF-5ms (30 m × 0.25 mm i.d. × 0.25 µm) and a high-purity helium C-60 carrier
gas. An initial temperature of 90 ºC was maintained for 2 min, increased to 300 ºC at
20 ºC/min, and held for 3 min, giving a total run time of 16 min approximately. The flow
of the carrier gas was maintained at 1.0 mL/min. The injector port was set at 280 ºC.
Analyses were performed in fullscan in splitless injection mode.
The obtained full scan chromatogram was reprocessed using the following
selected qualifier ions and retention times for each analyte, presented in Table 5. The
underlined ions were used for quantification.
Table 5. Detection parameters of tramadol, M1 and IS by GC-MS.
Analytes Retention time (tr) (minutes) Fragments (m/z)
Tramadol
Derivatized: 10.375
Without derivatization: 10.392
Derivatized: 58; 336
Without derivatization: 58; 264
M1
Diderivatized: 10.665
Monoderivatized: 10.801
Diderivatized: 58; 394
Monoderivatized: 58; 322
IS 8.900 109; 137; 179
The integration of the chromatographic peaks for quantitative analysis was
performed by monitoring the fullscan chromatogram with specific selected ion
monitoring (SIM) mode, allowing a more precise peak integration [133].
1.7. Method validation
A full method validation should be performed for any analytical method whether
new or based upon literature [134]. Analytical method validation is a mandatory step to
evaluate the ability of developed methods to provide accurate results for their routine
application. The validation of the method was performed accordingly European
Medicines Agency (EMA) [135] and other authors [136, 137]. EMA guidelines relies on
the Food and Drug Administration guidance [138] which is now almost generally

Quantification of tramadol and M1 in post mortem samples by gas chromatography–ion trap mass spectrometry and preliminary pharmacogenomic studies
36
accepted by the biopharmaceutical industries as the gold standard method validation
approach [139].
The LOD, LLOQ, precision, accuracy, recovery and linearity of the method were
determined. In order to obtain these validation data, calibration curves were prepared
by spiking blank whole blood with appropriate volumes of tramadol and M1 standard
solutions.
1.5.3. Selectivity
Six blank samples with no analytes or IS added were extracted by SPE as
described previously and analyzed by GC-MS to detect possible chromatographic
interferences with tramadol and M1. Chromatographic selectivity was evaluated by the
presence or absence of co-eluting peaks at the retention times of the analytes. Three
independent experiments were performed.
1.5.4. Linearity
The method linearity was determined by evaluation of the regression curve
(ratio of analyte peak area and IS peak area versus analyte concentration) and
expressed by the determination coefficient (r2) using spiked samples. Three
independent calibration curves (y = mx + b) were obtained using six different
concentrations of tramadol and M1 (5, 10, 50, 100, 500 and 1000 ng/mL) and mean
slopes were obtained for calculating the concentration of real samples (unknown
concentrations). These concentrations were prepared daily as mentioned before.
1.5.5. Limit of detection and lower limit of quantification
In our study, LOD and LLOQ were obtained based on the standard deviation of
the response and the slope of the calibration curve. The LOD is expressed accordingly
to equation 1.1 and LLOQ accordingly to equation 1.2., in which σ is the standard
deviation of the response and S is the slope of the calibration curve.
(1.1) S
LOD3.3

Quantification of tramadol and M1 in post mortem samples by gas chromatography–ion trap mass spectrometry and preliminary pharmacogenomic studies
37
(1.2) S
LLOQ10
1.5.6. Precision and accuracy
The precision of the analytical method describes the closeness of repeated
individual measures of analyte. Precision is expressed as the coefficient of variation
(%CV). Intraday precision data was quantified by analyzing the areas of three
replicates of three concentrations (low, 10; medium, 100; and high, 1000 ng/mL) and
calculating the %CV. The areas of the same three concentrations, injected on three
consecutive days, were used to calculate the interday repeatability (%CV). A %CV
value of ≤15% for interday and intraday analysis was considered satisfactory. The
accuracy of an analytical method describes the closeness of the determined value
obtained by the method to the true concentration of the analytes (expressed as a
percentage). The accuracy of the method was evaluated by spiking blank matrix with
three different tramadol and M1 concentrations (low, 10; medium, 100; and high, 1000
ng/mL) and through the calculation of the percentage deviation between the calculated
value and the nominal value [accuracy (%) = (experimental concentration/theoretical
concentration) × 100]. A deviation percentage of ≤15% was considered satisfactory.
1.5.7. Recovery
The recovery was evaluated by analyzing two sample groups of the same
concentrations (10, 100 and 1000 ng/mL) in triplicate, but differently processed. In the
first group, tramadol, M1 and IS were analyzed following the extraction procedure
mentioned above. In the second group, tramadol, M1 and IS were added to the 2-
propanol before drying. The recovery was evaluated by the comparison of the mean
response of the two groups. The response of the unextracted group represents 100%
recovery. A deviation percentage of ≤20% was considered satisfactory.
1.5.8. Proof of applicability
Post mortem blood samples from five cases of suspected tramadol fatal
intoxications were analyzed in this study to validate the method on real samples. Blood
samples were obtained from the North Branch of the Portuguese National Institute of
Legal Medicine I.P.. The samples were stored and processed as described above.

Quantification of tramadol and M1 in post mortem samples by gas chromatography–ion trap mass spectrometry and preliminary pharmacogenomic studies
38
1.8. Genetic polymorphism
Genomic DNA was isolated and purified using FavorPrepTM genomic DNA mini
kit (blood/cultured cell), according to the manufacturer’s protocol (Fig. 6).
Isolation and purification of genomic DNA
Sample Preparation:
200 µL blood + 30 µL Proteinase K
+
Mix and incubate
↓
Cell Lysis:
200 µL FABG Buffer
+
Mix and incubate
↓
Binding:
200 µL ethanol
+
Transfer the sample mixture to FABG Column
+
Centrifuge
↓
Washing:
400 μL W1 Buffer
+
Centrifuge
+
600 μL Wash Buffer
+
Centrifuge
↓
Elution:
100 μL Elution Buffer
+
Centrifuge
Figure 6. DNA extraction procedure for real-time PCR.
All genotypes were determined by direct allelic discrimination using direct
primers and probes in the ABI Prism Real Time PCR System 7300 and TaqmanTM
Allelic Discrimination. Genotyping of CYP2D6 (rs1128503) [76, 107], MDR1
(rs1045642) [84, 140], OPRM1 (rs1799971) [90] and COMT (rs4680) [87, 89] gene,
was performed as previously described.
For rs1799971 probe sequences were as follows for VIC/FAM GGTCAACTTGT
CCCACTTAGATGGC[A/G]ACCTGTCCGACCCATGCGGTCCGAA. For rs4680, probe

Quantification of tramadol and M1 in post mortem samples by gas chromatography–ion trap mass spectrometry and preliminary pharmacogenomic studies
39
sequences were as follows for VIC/FAM CCAGCGGATGGTGGATTTCGCTG
G[A/G]TGAAGGACAAGGTGTGCATGCCTGA. For rs1128503 probe sequences were
as follows for VIC/FAM GCCCACTCTGCACCTTCAGGTTCAG[A/G]CCCTTCAAGATC
TACCAGGACGAGT. For rs1045642, probe sequences were as follows for VIC/FAM
TGTTGGCCTCCTTTGCTGCCCTCAC[A/G]ATCTCTTCCTGTGACACCACCCGGC.
Allelic discrimination PCR reactions were carried out in 6 µL volumes using 2.5
µL of TaqMan® Universal PCR Master Mix (2×), 0.125 µL of 40× assay mix, 2.375 µL of
sterile H2O and 1 µL of genomic DNA. Amplification of DNA was carried out on an ABI
7300 using the following conditions: 95 ºC for 10 min, followed by 45 cycles of 95 ºC for
15s and 60 ºC for 1 min. Data capture and analysis was performed through the ABI
7300 real-time PCR System (Applied Biosystems) with allele-specific probes for the
common and variant SNPs (FAMand VIC, respectively) by the Sequence Detection
Systems software (Applied Biosystems version 1.2.3).

Quantification of tramadol and M1 in post mortem samples by gas chromatography–ion trap mass spectrometry and preliminary pharmacogenomic studies
40
Chapter II
Results and discussion

Quantification of tramadol and M1 in post mortem samples by gas chromatography–ion trap mass spectrometry and preliminary pharmacogenomic studies
41
1. Results and discussion
1.1. Sample preparation for gas-chromatography mass spectrometry analysis
1.1.1. Pre-treatment of samples and extraction
Blood is the matrix of choice in toxicological analysis for the detection and
quantification of xenobiotics, since there is a good correlation between blood
concentration and the toxic effect [133]. However, it is a complex biological matrix, with
the presence of many interferents, in particular, proteins, hormones, blood cells and
possible clots.
The separation of the analytes of interest from the matrix and elimination of
possible interferences is crucial for subsequent chromatographic analysis.
Nevertheless, few methods have focused on the inherent problems associated to post
mortem specimens, particularly blood which is often haemolysed and degraded
frequently causing column blockage and reducing extraction efficiency and recovery
[141]. To solve this problem, before the SPE procedure, we pre-treated blood samples
by sonication for 20 minutes at room temperature.
Different intervals of time were tested (15 and 30 minutes), but 20 minutes
proved to be the appropriate time, facilitating the passage of the sample along the
cartridge during the extraction process. In the next step, 500 µL HClO4 (7%) was
added, to achieve protein precipitation. Also 5% and 10% HClO4 were tested as well as
common solvents such as methanol and acetonitrile. However, 7% HClO4 proved to
lead to a more efficient purification.
In SPE, the best results were obtained with a modified procedure, published by
Merslavič and Zupančič-Kralj [100]. Comparatively, LLE methods were not so efficient
and the loss of analytes was more evident. The chosen extraction method for this study
proved to be simple and rapid in the preparation of samples prior to analysis by GC-
MS. Suitable extracts were obtained for chromatographic analysis with the use of
smaller volumes of organic solvents compared with LLE and with the efficient removal
of interferents of the biological matrix. The extraction efficiency was considerable, given
the low volume of sample used (500 μL) and also presented a good recovery of the
analytes of interest.

Quantification of tramadol and M1 in post mortem samples by gas chromatography–ion trap mass spectrometry and preliminary pharmacogenomic studies
42
1.1.2. Derivatization
Tramadol and M1 are polar organic compounds with low volatility, which limits
its analysis by GC. The derivatization of the analytes allowed an increase in its
volatility, improving the thermal stability and consequently the detectability of the
derivative [131]. Tramadol and M1 quantification by GC-MS was not possible due to
the presence of one and two hydroxyl groups, respectively in its chemical structure,
leading to need of implementation of derivatization step in sample preparation
procedure.
1.2. Method validation
1.1.3. Detection by gas-chromatography mass spectrometry
Preliminary tests were performed to determine the best conditions of
chromatographic separation and detection in order to obtain the best peak resolution
and separation of tramadol and M1.
In the chromatograms it is possible to identify two peaks for both tramadol and
M1.

Quantification of tramadol and M1 in post mortem samples by gas chromatography–ion trap mass spectrometry and preliminary pharmacogenomic studies
43
100%
100 200 3000%
25%
50%
75%
58.2
264.2
Re
lative
inte
nsity
(%)
m/z
(A)
100%
100 200 3000%
25%
50%
75%
58.2
336.2
Rela
tive
inte
nsity
(%)
m/z
(B)
Figure 7. Reconstructed mass spectrum of tramadol. (A) First peak, tramadol without
derivatization. (B) Second peak, tramadol derivatized.

Quantification of tramadol and M1 in post mortem samples by gas chromatography–ion trap mass spectrometry and preliminary pharmacogenomic studies
44
100 200 300 4000%
25%
50%
75%
100%
Re
lative
inte
nsity
(%)
m/z
58.2
394.3
(A)
100 200 300 4000%
25%
50%
75%
100%
Re
lative
inte
nsity
(%)
m/z
58.2
322.2
(B)
Figure 8. Reconstructed mass spectrum of M1. (A) First peak, M1 diderivatized. (B) Second
peak, M1 monoderivatized.

Quantification of tramadol and M1 in post mortem samples by gas chromatography–ion trap mass spectrometry and preliminary pharmacogenomic studies
45
Based on mass spectrum of each peak, for tramadol the first peak represents
tramadol derivatized and the second peak tramadol without derivatization (Fig. 7). In
the case of M1, the first peak represents M1 diderivatized and second peak M1
monoderivatized (Fig. 8).
For tramadol and M1 three ions were used. The most abundant ion (m/z 58 for
both analytes) was used for quantification, and the other ions were used for the proper
identification of each analytes, corresponding to the confirmation ions: m/z 264 and 336
for tramadol and m/z 322 and 394 for M1.
Analyzing the mass spectra (Fig. 7 and 8), it was possible to verify that there is
an abundant ion at m/z 58 in both peaks of tramadol and M1. The mass spectra of
tramadol (first peak) revealed low abundance product ion at m/z 264 and 336,
representing the protonated and the derivatized molecule of tramadol, respectively.
The second peak of tramadol has a fragment with m/z 58 and m/z 264 with low
abundance. Regarding the mass spectra of M1, the m/z 58 was also found in high
abundance in the two peaks. On the other hand, first peak revealed low abundance
product ion at m/z 394, representing the protonated diderivatized molecule of M1. The
mass spectra of second peak showed lower abundance at m/z 322, representing the
protonated monoderivatized molecule of M1.
1.1.4. Selectivity
The GC-MS chromatograms of spiked samples were compared with the
chromatograms obtained with a blank blood sample. No interference peaks were
detected in the retention times of tramadol and M1, or in the IS and selected ions (Fig.
9).

Quantification of tramadol and M1 in post mortem samples by gas chromatography–ion trap mass spectrometry and preliminary pharmacogenomic studies
46
8.5 9.5 10.5 11.5
Minutes
01
2
3
4
5
0.00
6
0.25
0.50
0.75
1.00
1.25
1.50
0100
200
300
400
500
600
MCounts
kCounts Blank sample
M1
Selected ions: 58.0 + 264.0 + 322.0 + 336.0 + 394.0
Selected ions: 109.0 + 137.0 +
179.0
Tramadol
MCounts
IS
12.5
Figure 9. Reconstructed GC-MS (SIM mode) chromatogram of a blank and spiked blood
sample (1000 ng/mL) of tramadol (m/z 58+336+264), M1 (m/z 58+394+322) and internal
standard (IS; m/z 109+137+179).
1.1.5. Linearity
In the present work, the linearity of tramadol and M1 was evaluated in triplicate
in the range of 5 ng/mL to 1000 ng/mL and all samples were analyzed according to the
procedure previously described (Chapter I). The three independent calibration curves
were obtained with six concentrations (5, 10, 50, 100, 500 and 1000 ng/mL). The
weighted least squares regression equations and coefficients of correlation were
calculated from these curves. The GC-MS chromatogram peak area ratios of
tramadol/IS and M1/IS were determined to establish calibration equations (Fig. 10).

Quantification of tramadol and M1 in post mortem samples by gas chromatography–ion trap mass spectrometry and preliminary pharmacogenomic studies
47
Figure 10. Calibration curves of tramadol and M1. Plotted peak areas of the analytes/IS peak
areas versus concentrations (5, 10, 50, 100, 500 and 1000 ng/mL).
The method was linear at the concentration range established, with
determination coefficients (r2) greater than 0.99 for the calibration curves of tramadol
and M1 (Table 6).
Table 6. Blood linear regression analysis of tramadol and M1 standard solutions (5-1000
ng/mL) performed on three different days.
Xenobiotic n = 3 Y = mx + b Concentration range (ng/mL)
r2 LOD
(ng/mL) LLOQ
(ng/mL)
Tramadol
Day 1
y = 0.0035x + 0.0188
0.9993
Day 2 y = 0.0038x - 0.0027 5 - 1000 0.9997 0.74 2.24
Day 3
y = 0.0038x - 0.0055
0.9994
M1
Day 1
y = 0.0045x - 0.0065
0.9998
Day 2
y = 0.0045x - 0.0169
5 -1000
0.9991
0.56
1.70
Day 3
y = 0.0044x - 0.0066
0.9999
LOD, limit of detection; LLOQ, lower limit of quantification.

Quantification of tramadol and M1 in post mortem samples by gas chromatography–ion trap mass spectrometry and preliminary pharmacogenomic studies
48
1.1.6. Limit of detection and lower limit of quantification
The LOD and LLOQ (0.74 and 0.56 ng/mL for tramadol and 2.24 and 1.70
ng/mL for M1 respectively) (Table 6) suggest a good capacity of this method for the
quantification of both compounds, even in low concentration.
1.1.7. Precision and accuracy
As the %CV values calculated for intra and inter-day precision studies of
tramadol and M1 did not exceed 15%, the developed method was considered precise
for both analytes. Accuracies in the range 85.79 - 110.24% for tramadol and 85.67 -
106.19% for M1 were determined (Table 7), which are within the proposed acceptance
limits for this parameter (100 ± 15%) [135].
Table 7. Precision, accuracy and recovery (%) for tramadol and M1.
Xenobiotic Concentration
(ng/mL)
Intra-day precision (%, n = 3)
Intra-day precision (%, n = 3)
Accuracy (%, n = 3)
Recovery (%)
10 4.1 12.1 103.9
Tramadol 100 3.3 4.9 106.4 109.8
1000 4.4 5.0 100.0
10
7.5
8.6
85.0
M1 100 3.2 4.6 94.3 107.8
1000 6.7 7.6 94.7
1.1.8. Recovery
At three different concentrations of tramadol and M1 (10, 100, 1000 ng/mL), the
results obtained indicated an efficient clean-up procedure, with extraction recoveries of
109.8 and 107.8% for tramadol and M1, respectively, which are within the proposed
acceptance limits for this parameter (100 ± 20%) (Table 7) [135].
1.3. Genetic polymorphism
Genetic factors play, in general, a dominant role over other factors in the
metabolism of individual drugs [76]. In the present study, five post mortem blood
samples from cases of suspected tramadol fatal intoxications were analyzed for COMT,

Quantification of tramadol and M1 in post mortem samples by gas chromatography–ion trap mass spectrometry and preliminary pharmacogenomic studies
49
MDR1, CYP2D6 and OPRM1 SNPs. Genotyping of these SNPs allows the
identification of UMs and PMs individuals, which is important to better understand the
efficacy, side effects and toxicity of this drug and thus adjust therapy in these subjects
depending on their genotype. For most drugs, the effect and treatment outcomes are
determined by the interplay of multiple genes [140]. Table 8 shows the results of the
four SNPs for all five samples:
Table 8. The genotypes identified by real-time PCR for polymorphisms in study.
nº COMT MDR1 CYP2D6
OPRM1
1
Val/Met TT CC GA
2 Val/Val CT CC AA
3 Val/Val CT CC AA
4 Val/Val TT Indeterminated AA
5 Val/Met CT CC GA
A, adenine; C, cytosine; COMT, catechol-O-methyltransferase; CYP2D6, cytochrome P450 2D6; G, guanine; MDR1, multidrug resistance protein 1; Met, methionine; OPRM1, μ-opioid receptor gene; T, thymine; Val, valine.
The enzyme encoded by the CYP2D6 gene plays an important role in the
metabolism of tramadol [74]. More than 80 distinct allelic variants for CYP2D6 are
known, which leads to a wide spectrum of metabolic capacity and phenotype diversity
within populations [9, 76, 81]. Subjects who did not possess any of the common
inactivating alleles or gene duplications are considered to be homozygous EMs,
carriers of one variant allele are considered to be IMs, and carriers of two variant
alleles are classified as PMs [142]. The allelic frequencies of the *3, *4, *5 and *6
alleles in Caucasians, account for the majority of the CYP2D6 PMs [78]. The
duplication or multiduplication of the CYPD6 gene (mostly CYP2D6*1 and CYP2D6*2
alleles in Caucasians) is associated with an ultrarapid metabolism of some compounds
including tramadol [9].
In this study, all subjects were genotyped for the presence of CYP2D6*4 allele.
In Caucasians, CYP2D6*4 allele occurs due to a mutation resulting in a defective splice
and a premature stop codon [143]. In the molecular analysis of this allele, it was
verified that four subjects are homozygous (CC). All these subjects with at least one
Genotype
Quantification of tramadol and M1 in post mortem samples by gas chromatography–ion trap mass spectrometry and preliminary pharmacogenomic studies
50
functional allele were categorized as EMs. For one sample, it was not possible to
determine the genotype.
The studied COMT SNP (Val158Met) occurs in codon 158, resulting in a Val to
Met transition. The Val/Val genotype gives rise to an effective enzyme, whereas the
Met/Met genotype produces a defective enzyme, with lower enzymatic activity [87, 88].
The analysis of the SNP demonstrated that two subjects have intermediate enzyme
activity with heterozygous (Val/Met) genotype and three subjects exhibit high enzyme
activity with wild-type homozygous (Val/Val) genotype. So, in subjects with less activity
COMT enzyme, it is possible that these have more pain due to decreased endogenous
opioid, comparatively with the subjects who exhibit higher enzyme activity [144]. This
SNP may then explain part of the inter-individual difference in the adaptation and
response to pain and may be involved in this opioid dosing requirements and side
effects [144, 145].
A well-known mechanism responsible for drug resistance is over-expression of
ABC-transporter genes such as MDR1. Over 50 SNPs have been identified in the
human MDR1 gene. Among them, C3435T SNP on exon 26 is a silent mutation and
may play a role in inducing drug resistance by altering the expression level of the
MDR1 gene [81-83]. Tramadol is a substrate of P-glycoprotein, an important efflux
transporter involved in bioavailability and elimination of several other drugs in humans.
A polymorphism, as C3435T in the MDR1 gene, may affect the pharmacokinetics of
tramadol [84]. In this study, three subjects are heterozygous (CT) and two homozygous
(TT) for polymorphisms of MDR1 C3435T. Alteration in function of the P-glycoprotein
transporter could alter the relative amounts of tramadol in the CNS, and thereby
influencing the prevalence and severity of tramadol related central side effects. Studies
have shown that the T allele is linked to weaker expression/activity of P-glycoprotein,
and consequently less drug resistance [140].
The µ-opioid receptor is the primary binding site for tramadol. The most studied
SNP in OPRM1 (A118G), results in an amino acid exchange from asparagine to
aspartate at position 40 [90, 92]. In this study, three subjects have AA and two GA
genotypes for this SNP. In general, individuals with the GG or GA genotype show an
elevated sensitivity to pain and a reduced analgesic response to opioids compared with
individuals with the AA genotype [90, 91, 93].
In Chapter III the studied polymorphisms results are discussed jointly with M1
and tramadol concentrations determined in these cases.

Quantification of tramadol and M1 in post mortem samples by gas chromatography–ion trap mass spectrometry and preliminary pharmacogenomic studies
51
Chapter III
Application of the developed GC-MS method
to real post mortem blood samples

Quantification of tramadol and M1 in post mortem samples by gas chromatography–ion trap mass spectrometry and preliminary pharmacogenomic studies
52
1. Proof of applicability
This method was applied for toxicological analysis of real post mortem blood
samples of five suspected cases of tramadol fatal intoxications. Two peripheral blood
samples, two heart blood samples and one blood with no indication of the sampling
were obtained from the North Branch of the Portuguese National Institute of Legal
Medicine and Forensic Sciences I.P..
For proper forensic interpretation it is necessary to take into account not only
the therapeutic, toxic and fatal range but the clinical history, circumstances of death,
data obtained during the autopsy and other relevant aspects [105, 146]. The blood
samples collection site is another important aspect. Peripheral blood is the preferential
sample, as this collection site allows a reduction of the impact of post mortem
redistribution/diffusion in quantitative interpretation of results [147].
The concentrations were calculated by using the linear regression obtained
from the validated method. All samples analyzed were positive for tramadol and
metabolite M1 (Table 9).
Table 9. Concentration of tramadol and M1 in real post mortem blood samples.
The blood samples collection site
nº Concentrations (ng/mL)
Tramadol M1
Peripheral blood 1 2389.8 148.21
Peripheral blood 2 533.52 180.17
Blood with no indication
of the sampling
3 490.55 44.39
Heart Blood 4 3995.9 461.29
Heart Blood 5 427.03 86.17
Analysis of blood samples revealed concentrations ranging from 427.03 to
3995.9 ng/mL for tramadol and 44.39 to 461.29 ng/mL for M1. The tramadol
therapeutic blood concentration in adults range from: 100 - 250 ng/mL [57].
Reconstructed chromatogram of real blood peripheral sample (subject number 3) is
shown in Fig. 11. However, as previously mentioned, for the correct interpretation of
the results, other aspects should be taking into account beyond the concentrations of
the compounds, but this information was not available.
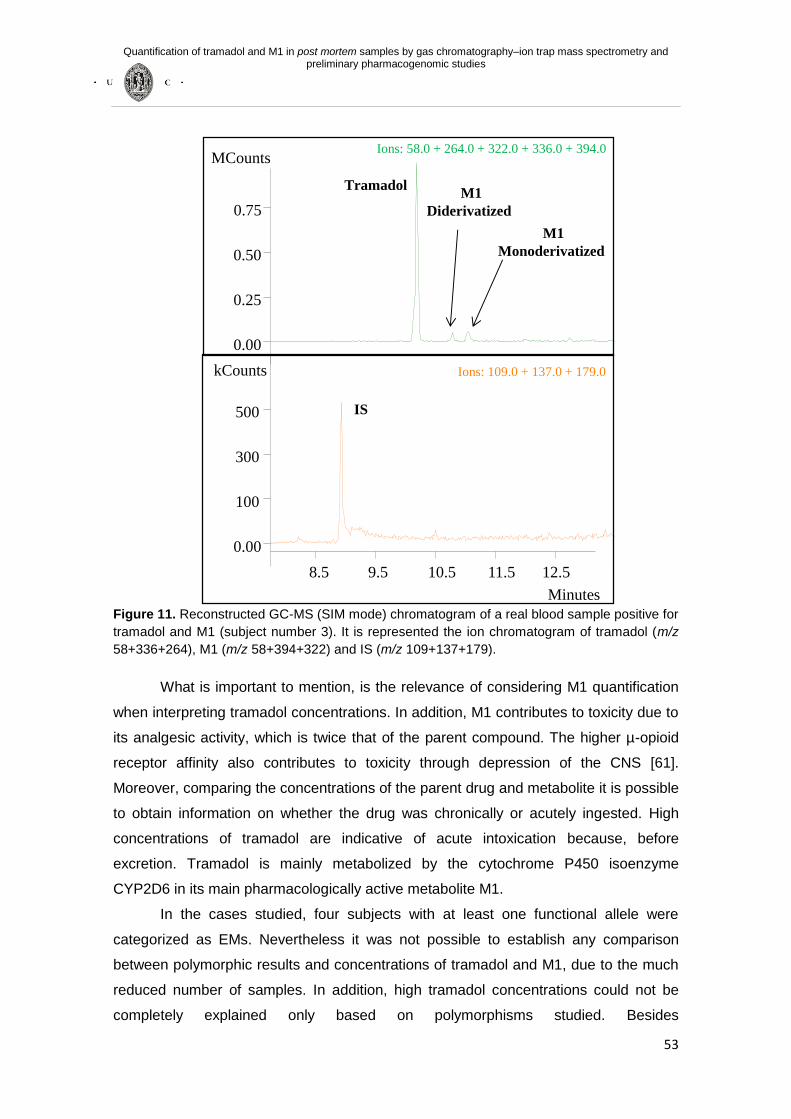
Quantification of tramadol and M1 in post mortem samples by gas chromatography–ion trap mass spectrometry and preliminary pharmacogenomic studies
53
8.5 9.5 10.5 11.5
Minutes
0.00
0.25
0.50
0.00
0.75
100
300
500
MCounts
M1
Diderivatized
Ions: 58.0 + 264.0 + 322.0 + 336.0 + 394.0
Ions: 109.0 + 137.0 + 179.0
Tramadol
IS
12.5
kCounts
M1
Monoderivatized
Figure 11. Reconstructed GC-MS (SIM mode) chromatogram of a real blood sample positive for
tramadol and M1 (subject number 3). It is represented the ion chromatogram of tramadol (m/z
58+336+264), M1 (m/z 58+394+322) and IS (m/z 109+137+179).
What is important to mention, is the relevance of considering M1 quantification
when interpreting tramadol concentrations. In addition, M1 contributes to toxicity due to
its analgesic activity, which is twice that of the parent compound. The higher µ-opioid
receptor affinity also contributes to toxicity through depression of the CNS [61].
Moreover, comparing the concentrations of the parent drug and metabolite it is possible
to obtain information on whether the drug was chronically or acutely ingested. High
concentrations of tramadol are indicative of acute intoxication because, before
excretion. Tramadol is mainly metabolized by the cytochrome P450 isoenzyme
CYP2D6 in its main pharmacologically active metabolite M1.
In the cases studied, four subjects with at least one functional allele were
categorized as EMs. Nevertheless it was not possible to establish any comparison
between polymorphic results and concentrations of tramadol and M1, due to the much
reduced number of samples. In addition, high tramadol concentrations could not be
completely explained only based on polymorphisms studied. Besides

Quantification of tramadol and M1 in post mortem samples by gas chromatography–ion trap mass spectrometry and preliminary pharmacogenomic studies
54
pharmacogenomics, the pharmacokinetics of the drug can be affected by many other
factors namely, age, disease, comorbidities, concomitant medication, metabolic
interactions and kidney or liver function [5, 76], but this information was not accessible.
One of the five cases was not possible to determine the genotype. In this case, it is
important to consider the possibility of being a PM subject for rare mutations, which
could not be identified with the assay used (e.g. *11, *12, *13, *14, *15, *16). These
mutations are extremely uncommon in Caucasians, with an allele frequency of less
than 0.001% [75].
In case 1, Val/Met genotype for COMT shows intermediate enzyme activity and
GA genotype for OPRM1 exhibits an elevated sensitivity to pain and a reduced
analgesic response to opioids. Moreover, as it is homozygous TT for the polymorphism
of MDR1, the expression/activity of P-glycoprotein is lower and consequently less drug
resistance. In this case, the tramadol and M1 were quantified in peripheral blood
concentrations of 2398.8 and 148.21 ng/mL, respectively. The results of COMT and
OPRM1 genotypes can explain a lower analgesia and by this may have contributed to
higher doses ingested, despite being EM. However, as it is homozygous TT, it should
be expected less resistance to treatment. Further studies and more cases are
necessary to access the individual contributive effect of each polymorphism.
Cases 2 and 3 have similar concentrations of tramadol (533.52 ng/mL for case
2 and 490.55 ng/mL for case 3) and lower concentrations of M1 (180.17 ng/mL for case
2 and 44.39 ng/mL for case 3). Both are EMs and have AA genotypes that show a
reduced sensitivity to pain, and consequently greater analgesia. However, both have
CT genotypes which demonstrate greater expression/activity of P-glycoprotein and
consequently greater drug resistance. Similarly to the explanations given for case 1,
further studies and more cases are necessary to access the individual contributive
effect of each polymorphism. However, the case 3 exhibit high enzyme activity with
wild-type homozygous Val/Val genotype, comparatively with the case 2 which is
Val/Met. In these cases, the dose is also unknown and the pharmacogenomics and
pharmacokinetics of the drug also may have been affected by various factors such as
renal and/or liver insufficiency.
The case 4 shows the highest concentration of tramadol and M1, 3995.9 and
461.29 ng/mL respectively, but this may be explained by the fact that they have been
quantified in heart blood and not in peripheral blood, as previously reported. In this
case, it was not possible to determine the CYP2D6 genotype, as previously reported.

Quantification of tramadol and M1 in post mortem samples by gas chromatography–ion trap mass spectrometry and preliminary pharmacogenomic studies
55
The same happens for the case 5 wherein the concentration of tramadol and
M1 were quantified in heart blood, but at concentrations less than those of the case 4,
427.03 and 86.17 ng/mL, respectively. In this case, the subject has CT genotype for
MDR1, Val/Met genotype for COMT and GA genotype for OPRM1. These genotype
results can explain a lower analgesia, the elevated sensitivity to pain and a reduced
analgesic response to opioids greater and consequently greater expression/activity of
P-glycoprotein drug resistance. This may have contributed to the subject to take a
higher dose. However, such as in the other cases described here, other factors may
affect the pharmacogenomics and pharmacokinetics of the drug, but this information
was not available.

Quantification of tramadol and M1 in post mortem samples by gas chromatography–ion trap mass spectrometry and preliminary pharmacogenomic studies
56
Chapter IV
Conclusions and future perspectives

Quantification of tramadol and M1 in post mortem samples by gas chromatography–ion trap mass spectrometry and preliminary pharmacogenomic studies
57
1. Conclusions and future perspectives
I. A sensitive, reproducible, precise, accurate and inexpensive GC-MS method
was developed and validated to quantify tramadol and M1 in post mortem blood
samples;
II. Few studies are published exploring the quantification of tramadol and M1 in of
post mortem blood samples and very few have evaluated the importance of the
metabolite M1 fatal cases of tramadol intoxication;
III. The proposed GC-MS method was successfully applied in the quantification of
these analytes in real post mortem blood samples and shown to be appropriate
for routine analysis. Blood samples represents the most used matrix with
relevant importance in toxicological post mortem analysis;
IV. The GC-MS method described in this study exhibited a good selectivity, lower
LOD and LLOQ (0.74 and 0.56 ng/mL for tramadol and 2.24 and 1.70 ng/mL for
M1 respectively). In addition, the regression analysis for both analytes showed
linearity in the range 5-1000 ng/mL with r2 ranging from 0.9991 to 0.9999. The
%CV oscillated between 0.70 and 12.45%.
V. Although the sample preparation is more time-consuming, due to the
derivatization step, it was possible to obtain a simple and efficient method using
only 500 µL of sample;
VI. The same blood specimens were addressed to study CYP2D6, MDR1, OPRM1
and COMT SNPs by PCR;
VII. Regarding polymorphism studies, four subjects with at least one functional
allele were categorized as EMs. Nevertheless it was not possible to establish
any comparison between polymorphic results and concentrations of tramadol
and M1, due to the much reduced number of samples;
VIII. Moreover, high tramadol concentrations could not be completely explained only
based on polymorphisms studied. Besides pharmacogenomics, the
pharmacokinetics of the drug can be affected by many other factors namely,

Quantification of tramadol and M1 in post mortem samples by gas chromatography–ion trap mass spectrometry and preliminary pharmacogenomic studies
58
age, disease, concomitant medication, metabolic interactions and kidney or liver
function;
IX. One of the five cases was not possible to determine the genotype. In this case,
it is important to consider the possibility of being a PM subject for rare
mutations that are extremely uncommon in Caucasians, which could not be
identified with the assay used;
X. The genotyping analysis are relevant in forensic field in order to better
understand the causes that contributed to the tramadol intoxication and how
genetic factors may contribute;
XI. Future projects will be needed to better understand the role of genetic factors in
acute tramadol intoxications, since this have a high impact (e.g. how quickly the
xenobiotic it is cleared from the blood and metabolized in the liver);
XII. As it was not possible to establish any comparison between polymorphic results
and concentrations of tramadol and M1, be interesting to analyze the CYP2D6,
MDR1, OPRM1 and COMT polymorphisms using an higher number of blood
post mortem samples;
XIII. Moreover, other factors may also affect the pharmacogenomics, the
pharmacokinetics of the drug and it will be interesting correlate them with
concentrations of tramadol and M1.

Quantification of tramadol and M1 in post mortem samples by gas chromatography–ion trap mass spectrometry and preliminary pharmacogenomic studies
59
PART IV: References

Quantification of tramadol and M1 in post mortem samples by gas chromatography–ion trap mass spectrometry and preliminary pharmacogenomic studies
60
1. Leppert, W. (2009). Tramadol as an analgesic for mild to moderate cancer pain. Pharmacological Reports 61, 978-992.
2. Tramdolinfo. Tramadol information. Available from: http://www.tramadolinfo.com/articles/history.html. Accessed May 2012.
3. Dayer, P., Desmeules, J., and Collart, L. (1997). Pharmacology of tramadol. Drugs 53, 18-24.
4. INFARMED - Autoridade Nacional do Medicamento e Produtos de Saúde, IP / Ministério de Saúde, (2011). Prontuário Terapêutico - 10. Available from: http://www.infarmed.pt/portal/page/portal/INFARMED/PUBLICACOES/PRONTUARIO. Accessed May 2012.
5. Kleine-Brueggeney, M., Musshoff, F., Stuber, F., and Stamer, U. M. (2010). Pharmacogenetics in palliative care. Forensic Science International 203, 63-70.
6. Katz, W. A. (2005). Use of nonopioid analgesics and adjunctive agents in the management of pain in rheumatic diseases. Curr. Opin. Rheumatol. 14, 63-71.
7. Close, B. R. (2005). Tramadol: does it have a role in emergency medicine? Emergency Medicine Australasia 17, 73-83.
8. Leppert, W., and Luczak, J. (2005). The role of tramadol in cancer pain treatment--a review. Support Care Cancer 13, 5-17.
9. Leppert, W. (2011). CYP2D6 in the metabolism of opioids for mild to moderate pain. Pharmacology 87, 274-85.
10. Cepeda, M. S., Camargo, F., Zea, C., and Valencia, L. (2007). Tramadol for osteoarthritis: a systematic review and metaanalysis. J Rheumatol. 34, 543-55.
11. Sumpton, J. E., and Moulin, D. E. (2008). Fibromyalgia: presentation and management with a focus on pharmacological treatment. Pain Res Manag. 13, 477-83.
12. Roskell, N. S., Beard, S. M., Zhao, Y., and Le, T. K. (2011). A meta-analysis of pain response in the treatment of fibromyalgia. Pain Pract. 11, 516-27.
13. Whittle, S. L., Richards, B.. L., Husni, E., and Buchbinder, R. (2011). Opioid therapy for treating rheumatoid arthritis pain. Cochrane Database Syst Rev. 11, CD003113.
14. McMahon, C. G., and Porst, H. (2011). Oral agents for the treatment of premature ejaculation: review of efficacy and safety in the context of the recent International Society for Sexual Medicine criteria for lifelong premature ejaculation. J Sex Med. 8, 2707-25.
15. Veyckemans, F., and Pendeville, P. E. (2007). Utilisation du tramadol dans l’antalgie aiguë postopératoire en pédiatrie. Tramadol for acute postoperative pain in children. Annales Françaises d’Anesthésie et de Réanimation 26, 564-569.
16. Rosenberg, M. T. (2009). The role of tramadol ER in the treatment of chronic pain. Int J Clin Pract. 63, 1531-43.
17. Frankus, E., Friderichs, E., Kim, S. M., and Osterloh, G. (1978). [On separation of isomeres, structural elucidation and pharmacological characterization of 1-(m-methoxyphenyl)-2-(dimethylaminomethyl)-cyclohexan-1-ol (author's transl)]. Arzneimittelforschung 28, 114-21.
18. Nossaman, V. E., Ramadhyani, U., Kadowitz, P. J., and Nossaman, B. D. (2010). Advances in perioperative pain management: use of medications with dual analgesic mechanisms, tramadol & tapentadol. Anesthesiol Clin. 28, 647-66.
19. Saudan, S., and Habre, W. (2007). Pharmacokinetics of tramadol in children. Ann Fr Anesth Reanim. 26, 560-3.
20. Raffa, R. B., Friderichs, E., Reimann, W., Shank, R. P., et al. (1993). Complementary and synergistic antinociceptive interaction between the enantiomers of tramadol. J Pharmacol Exp Ther. 267, 331-40.

Quantification of tramadol and M1 in post mortem samples by gas chromatography–ion trap mass spectrometry and preliminary pharmacogenomic studies
61
21. Halling, J., Weihe, P., and Brosen, K. (2008). CYP2D6 polymorphism in relation to tramadol metabolism: a study of faroese patients. Ther Drug Monit. 30, 271-5.
22. Gillen, C., Haurand, M., Kobelt, D. J., and Wnendt, S. (2000). Affinity, potency and efficacy of tramadol and its metabolites at the cloned human mu-opioid receptor. Naunyn Schmiedebergs Arch Pharmacol. 362, 116-21.
23. Valle, M., Garrido, M. J., Pavón, J. M., and Calvo, R., et al. (2000). Pharmacokinetic-pharmacodynamic modelling of the antinociceptive effects of main active metabolites of tramadol, (+)-O-desmethyltramadol and (–)-Odesmethyltramadol, in rats. J Pharmacol Exp Ther. 293, 646–653.
24. Paar, W. D., Frankus, P., and Dengler, H. J. (1992). The metabolism of tramadol by human liver microsomes. Clin Investig. 70, 708-10.
25. Ardakani, Y. H., and Rouini, M. R. (2007). Improved liquid chromatographic method for the simultaneous determination of tramadol and its three main metabolites in human plasma, urine and saliva. J Pharm Biomed Anal. 44, 1168-73.
26. Levine, B., Ramcharitar, V., and Smialek, J. E. (1997). Tramadol distribution in four postmortem cases. Forensic Sci Int. 86, 43-8.
27. de Backer, B., Renardy, F., Denooz, R., and Charlier, C. (2010). Quantification in postmortem blood and identification in urine of tramadol and its two main metabolites in two cases of lethal tramadol intoxication. J Anal Toxicol. 34, 599-604.
28. Lintz, W., Erlaçin, S., Frankus, E., and Uragg, H. (1981). [Biotransformation of tramadol in man and animal (author's transl)]. Arzneimittelforschung 31, 1932-43.
29. Klotz, U. (2003). Tramadol - the impact of its pharmacokinetic and pharmacodynamic properties on the clinical management of pain. Arzneimittelforschung 53, 681-7.
30. Singlas, E., Stahlberg, H. J., and Lintz, W. (1989). Pharmacokinetic study of tramadol and its metabolite M1 in patients with chronic hepatocellular insufficiency due to cirrhosis. Data on file. Report No. FO – PK 288. Grünenthal GmbH (Aachen FRG).
31. Lintz W. (1990). Pharmacokinetics of tramadol and its metabolite M1 in patients with impaired renal function and in those undergoing hemodialysis or other artificial blood purification processes. Data on file. Report No. FO - PK 218. Grünenthal GmbH (Aachen FRG).
32. Raffa, R. B., Friderichs, E., Reimann, W., Shank, R. P., et al. (1992). Opioid and nonopioid components independently contribute to the mechanism of action of tramadol, an 'atypical' opioid analgesic. J Pharmacol Exp Ther. 260, 275-85.
33. Davis, M., and Pasternak, G. (2009). Opioid receptors and opioid pharmacodynamics. In Opioids in Cancer Pain. (M. Davis, P. Glare, J. Hardy, and C. Quigley, Eds.), pp. 1-27. Oxford University Press, Oxford.
34. Lullmann, H., Mohr, K., Ziegler, A., and Bieger, D. (2000). Thieme. Color Atlas of Pharmacology. 2nd Edition: 210-220.
35. Griffi, R., and Woolf, C. (2011). Pharmacology of Analgesia. In Principles of Pharmacology: The Pathophysiologic Basis of Drug Therapy. (D. Golan, A. Tashjian, E. Armstrong, and A. Armstrong, Eds.), pp. 264-283. Lippincott Williams & Wilkins, Philadelphia.
36. de Decker, K., Cordonnier, J., Jacobs, W., Coucke, V., et al. (2008). Fatal intoxication due to tramadol alone: case report and review of the literature. Forensic Sci Int. 175, 79-82.

Quantification of tramadol and M1 in post mortem samples by gas chromatography–ion trap mass spectrometry and preliminary pharmacogenomic studies
62
37. Musshoff, F., and Madea, B. (2001). Fatality due to ingestion of tramadol alone. Forensic Sci. Int. 116, 197-199.
38. Loughrey, M. B., Loughrey, C. M., Johnston, S., and O'Rourke, D. (2003). Fatal hepatic failure following accidental tramadol overdose. Forensic Sci Int. 134, 232-3.
39. Lotsch, J. (2005). Opioid metabolites. J Pain Symptom Manage 29, 10-24. 40. Raffa, R. B. (2008). Basic pharmacology relevant to drug abuse assessment:
tramadol as example. J Clin Pharm Ther. 33, 101-8. 41. Ortho-McNeil Pharmaceutical, Inc.. (2004). ULTRAM® (tramadol hydrochloride
tablets) [package insert]. Raritan, N. J.: Ortho-McNeil Pharmaceutical, Inc.. 42. Daubin, C., Quentin, C., Goullé, J. P., Guillotin, D., et al. (2007). Refractory
shock and asystole related to tramadol overdose. Clin Toxicol (Phila) 45, 961-4. 43. Saccomanni, G., Del Carlo, S., Giorgi, M., Manera, C., et al. (2010).
Determination of tramadol and metabolites by HPLC-FL and HPLC-MS/MS in urine of dogs. J Pharm Biomed Anal. 53, 194-9.
44. Pilgrim, J. L., Gerostamoulos, D., and Drummer O. H. (2010). Deaths involving serotonergic drugs. Forensic Sci Int. 198, 110-7.
45. Lantz, M. S., Buchalter, E. N., and Giambanco, V. (1998). Serotonin syndrome following the administration of tramadol with paroxetine. Int J Geriatr Psychiatry 13, 343-5.
46. Devulder, J., De Laat, M., Dumoulin, K., Renson, A., et al. (1996). Nightmares and hallucinations after long-term intake of tramadol combined with antidepressants. Acta Clin Belg. 51, 184-6.
47. Kitson, R., and Carr, B. (2005). Tramadol and severe serotonin syndrome. Anaesthesia 60, 934-5.
48. Kesavan, S., and Sobala, G. M. (1999). Serotonin syndrome with fluoxetine plus tramadol. J R Soc Med. 92, 474-5.
49. Wang, S. Q., Li, C. S., and Song, Y. G. (2009). Multiply organ dysfunction syndrome due to tramadol intoxication alone. Am J Emerg Med. 27, 903 e5-7.
50. Marechal, C., Honorat, R., and Claudet, I. (2011). Serotonin syndrome induced by tramadol intoxication in an 8-month-old infant. Pediatr Neurol. 44, 72-4.
51. Preston, K. L., Jasinski, D. R., and Testa, M. (1991). Abuse potential and pharmacological comparison of tramadol and morphine. Drug Alcohol Depend. 27, 7-17.
52. Leo, R. J., Narendran, R., and DeGuiseppe, B. (2000). Methadone detoxification of tramadol dependence. J Subst Abuse Treat. 19, 297-9.
53. Yates, W. R., Nguyen, M. H., and Warnock, J. K. (2001). Tramadol dependence with no history of substance abuse. Am J Psychiatry 158, 964.
54. Prakash, J., and Saini, R. (2010). Tramadol Dependence: A Case Report. MJAFI 66, 93-94.
55. Adams, E. H., Breiner, S., Cicero, T. J., Geller, A., et al. (2006). A comparison of the abuse liability of tramadol, NSAIDs, and hydrocodone in patients with chronic pain. J Pain Symptom Manage 31, 465-76.
56. Lanier, R. K., Lofwall, M. R., Mintzer, M. Z., Bigelow, G. E., et al. (2010). Physical dependence potential of daily tramadol dosing in humans. Psychopharmacology (Berl) 211, 457–66.
57. The International Association of Forensic Toxicologists (TIAFT), (2010). Reference blood level list of therapeutic and toxic substances. Available from: http://www.tiaft.org/. Accessed September 2012.
58. Grosek, S., Mozina, M., Grabnar, I., and Primozic, J. (2009). Diagnostic and therapeutic value of naloxone after intoxication with tramadol in a young girl. Pediatr Int. 51, 842-3.

Quantification of tramadol and M1 in post mortem samples by gas chromatography–ion trap mass spectrometry and preliminary pharmacogenomic studies
63
59. Clarot, F., Goullé, J. P., Vaz, E., and Proust, B. (2003). Fatal overdoses of tramadol: is benzodiazepine a risk factor of lethality? Forensic Sci Int. 134, 57-61.
60. Bynum, N. D., Poklis, J. L, Gaffney-Kraft, M., Garside, D., et al. (2005). Postmortem distribution of tramadol, amitriptyline, and their metabolites in a suicidal overdose. J Anal Toxicol. 29, 401-6.
61. Goeringer, K. E., Logan, B. K., and Christian, G. D. (1997). Identification of tramadol and its metabolites in blood from drug-related deaths and drug-impaired drivers. J Anal Toxicol. 21, 529-37.
62. Lusthof, K. J., and Zweipfenning, P. G. (1998). Suicide by tramadol overdose. J Anal Toxicol. 22, 260.
63. Michaud, K., Augsburger, M., Romain, N., Giroud, C., et al. (1999). Fatal overdose of tramadol and alprazolam. Forensic Sci Int. 105, 185-9.
64. Oertel, R., Pietsch, J., Arenz, N., Zeitz, S. G., et al. (2011). Distribution of metoprolol, tramadol, and midazolam in human autopsy material. Journal of Chromatography A. 1218, 4988-4994.
65. Pilgrim, J. L., Gerostamoulos, D., and Drummer, O. H. (2011). Deaths involving contraindicated and inappropriate combinations of serotonergic drugs. Int J Legal Med. 125, 803-15.
66. Ripple, M. G., Pestaner, J. P., Levine, B. S., and Smialek, J. E. (2000). Smialek, Lethal combination of tramadol and multiple drugs affecting serotonin. Am. J. Forensic Med. Pathol. 21, 370–374.
67. Simonsen, K. W., Normann, P. T., Ceder, G., Vuori, E., et al. (2011). Fatal poisoning in drug addicts in the Nordic countries in 2007. Forensic Sci Int. 207, 170-6.
68. Tjaderborn, 58. Tjaderborn, M., Jönsson, A. K., Hägg, S., and Ahlner, J. (2007). Fatal unintentional intoxications with tramadol during 1995-2005. Forensic Sci Int. 173, 107-11.
69. Bozkurt, P. (2005). Use of tramadol in children. Pediatric Anesthesia 15, 1041-1047.
71. Dhivya, C., De Silva, P., and Dhatariya, K. (2007). An uncommon presentation of a common drug overdose-the dangers of underestimating tramadol. J Med Sci Res. 1, 59-62.
72. Marquardt, K. A., Alsop, J. A., and Albertson, T. E. (2005). Tramadol exposures reported to statewide poison control system. Ann. Pharmacother 39, 1039-44.
73. Eichelbaum, M., Ingelman-Sundberg, M., and Evans, W. E. (2006). Pharmacogenomics and individualized drug therapy. Annu. Rev. Med. 57, 119-137.
74. Ingelman-Sundberg, M. (2005). Genetic polymorphism of cytochrome P450 2D6 (CYP2D6): clinical consequences, evolutionary aspects and functional diversity. Pharmacogenom J. 5, 6-13.
75. Stamer, U. M., and Stüber, F. (2007). Genetic factors in pain and its treatment. Curr Opin Anaesthesiol 20, 478-484.
76. Levo, A., Koski, A., Ojanperä, I., Vuori, E., et al. (2003). Post-mortem SNP analysis of CYP2D6 gene reveals correlation between genotype and opioid drug (tramadol) metabolite ratios in blood. Forensic Sci Int. 135, 9-15.
77. Fux, R., Mörike, K., Pröhmer, A. M., Delabar, U., et al. (2005). Impact of CYP2D6 genotype on adverse effects during treatment with metoprolol: a prospective clinical study. Clin Pharmacol Ther. 78, 378-387.
78. Masimirembwa, C. M., and Hasler, J. A. (1997). Genetic polymorphism of drug metabolizing enzymes in African populations: implications for the use of neuroleptics and antidepressants. Brain Res Bull 44, 561-571.

Quantification of tramadol and M1 in post mortem samples by gas chromatography–ion trap mass spectrometry and preliminary pharmacogenomic studies
64
79. Meyer, U. A., and Zanger, U. M. (1997). Molecular mechanisms of genetic polymorphisms of drug metabolism. Annu. Rev. Pharmacol. Toxicol. 37, 269-296.
80. Poulsen, L., Arendt-Nielsen, L., Brøsen, K., and Sindrup, S. H. (1996). The hypoalgesic effect of tramadol in relation to CYP2D6. Clin Pharmacol Ther. 60, 636-644.
81. Sakaeda, T., Nakamura, T., and Okumura, K. (2003). Pharmacogenetics of MDR1 and its impact on the pharmacokinetics and pharmacodynamics of drugs. Pharmacogenomics. 4, 397-410.
82. Kimchi-Sarfaty, C., Oh, J. M., Kim, I. W., Sauna, Z. E., et al. (2007). A “silent” polymorphism in the MDR1 gene changes substrate specificity. Science 315, 525-528.
83. Taheri, M., Mahjoubi, F., and Omranipour, R. (2010). Effect of MDR1 polymorphism on multidrug resistance expression in breast cancer patients. Genetics and Molecular Research 9, 34-40.
84. Slanař, O., Nobilis, M., Kvétina, J., Matousková, O., et al. (2007). Pharmacokinetics of tramadol is affected by MDR1 polymorphism C3435T. Eur J Clin Pharmacol. 63, 419-421.
85. Nackley, A. G., Shabalina, S. A., Tchivileva, I. E., Satterfield, K., et al. (2006). Human Catechol-O-Methyltransferase Haplotypes Modulate Protein Expression by Altering mRNA Secondary Structure. Science 314, 1930-1933
86. Dai, F., Belfer, I., Schwartz, C. E., Banco, R., et al. (2010). Association of catechol-O-methyltransferase genetic variants with outcome in patients undergoing surgical treatment for lumbar degenerative disc disease. Spine J. 10, 949-57.
87. Matsuda, J. B., Barbosa, F. R., Morel, L. J, França Sde, C., et al. (2010). Serotonin receptor (5-HT 2A) and catechol-O-methyltransferase (COMT) gene polymorphisms: Triggers of fibromyalgia?. Bras J Rheumatol. 50, 141-9.
88. Mannisto, P. T., and Kaakkola, S. (1999). Catechol-O-methyltransferase (COMT) biochemistry, molecular biology, pharmacology, and clinical efficacy of new selective COMT inhibitors. Pharmacol Rev. 51, 593-628.
89. Jensen, K. B., Lonsdorf, T. B., Schalling, M., Kosek, E., et al. (2009). Increased sensitivity to thermal pain following a single opiate dose is influenced by the COMT val(158)met polymorphism. PLoS One 4, e6016.
90. Shi, Q., Cleeland, C. S., Klepstad, P., Miaskowski, C., et al. (2010). Biological pathways and genetic variables involved in pain. Qual Life Res. 19, 1407-17.
91. Sia, A. T., Lim, Y., Lim, E. C., Goh, R. W., et al. (2008). A118G single nucleotide polymorphism of human mu-opioid receptor gene influences pain perception and patient-controlled intravenous morphine consumption after intrathecal morphine for postcesarean analgesia. Anesthesiology 109, 520-526.
92. Bond, C., La Forge, K. S., Tian, M., Melia, D., et al. (1998). Single-nucleotide polymorphism in the human mu opioid receptor gene alters beta-endorphin binding and activity: possible implications for opiate addiction. Proc Natl Acad Sci U S A 95, 9608-13.
93. Chou, W. Y., Wang, C. H., Liu, P. H., Liu, C. C., et al. (2006). Human opioid receptor A118G polymorphism affects intravenous patient-controlled analgesia morphine consumption after total abdominal hysterectomy. Anesthesiology 105, 334-337.
94. Yeh, G. C., Sheu, M. T., Yen, C. L., Wang, Y. W., et al. (1999). High-performance liquid chromatographic method for determination of tramadol in human plasma. J Chromatogr B Biomed Sci Appl. 723, 247-53.

Quantification of tramadol and M1 in post mortem samples by gas chromatography–ion trap mass spectrometry and preliminary pharmacogenomic studies
65
95. Kucuk, A., Kadioglu, Y., and Celebi, F. (2005). Investigation of the pharmacokinetics and determination of tramadol in rabbit plasma by a high-performance liquid chromatography-diode array detector method using liquid-liquid extraction. J Chromatogr B Analyt Technol Biomed Life Sci. 816, 203-8.
96. Gana, S. H., Ismaila, R., Wan Adnanb, W. A., and Wanc, Z. (2002). Method development and validation of a high-performance liquid chromatographic method for tramadol in human plasma using liquid–liquid extraction. Journal of Chromatography B 772, 123-129.
97. Hadidia, K. A., Almasadb, J. K., Al-Nsourc, T., and Abu-Ragheib S. (2003). Determination of tramadol in hair using solid phase extraction and GC–MS. Forensic Science International 135, 129-136.
98. Rouini, M. R., Ghazi-Khansari, M., Ardakani, Y. H., Dasian, Z., et al. (2008). A disposition kinetic study of tramadol in rat perfused liver. Biopharm Drug Dispos. 29, 231-5.
99. Moore, C., Rana, S., and Coulter, C. (2007). Determination of meperidine, tramadol and oxycodone in human oral fluid using solid phase extraction and gas chromatography-mass spectrometry. J Chromatogr B Analyt Technol Biomed Life Sci. 850, 370-5.
100. Merslavic, M., and Zupancic-Kralj, L. (1997). Determination of tramadol in human plasma by capillary gas chromatography-mass spectrometry using solid-phase extraction. J Chromatogr B Biomed Sci Appl. 693, 222-7.
101. Gan, S. H., and Ismail, R. (2001). Validation of a high-performance liquid chromatography method for tramadol and o-desmethyltramadol in human plasma using solid-phase extraction. Journal of Chromatography B 759, 325-335.
102. Li, Q., Wang, R., Guo, Y., Wen, S., et al. (2010). Relationship of CYP2D6 genetic polymorphisms and the pharmacokinetics of tramadol in Chinese volunteers. J Clin Pharm Ther. 35, 239-47.
103. Sha, Y. F., Shen, S., and Duan, G. L. (2005). Rapid determination of tramadol in human plasma by headspace solid-phase microextraction and capillary gas chromatography-mass spectrometry. J Pharm Biomed Anal. 37, 143-7.
104. Valle, M., Pavón, J. M., Calvo, R., Campanero, M. A., et al. (1999). Simultaneous determination of tramadol and its major active metabolite O-demethyltramadol by high-performance liquid chromatography with electrochemical detection. J Chromatogr B Biomed Sci Appl 724, 83-9.
105. Verplaetse, R., and Tytgat, J. (2012). Development and validation of a sensitive UPLC-MS/MS method for the analysis of narcotic analgesics in urine and whole blood in forensic context. Forensic Sci Int. 215, 136-45.
106. Leis, H. J., Fauler, G., and Windischhofer, W. (2004). Synthesis of d1-N-ethyltramadol as an internal standard for the quantitative determination of tramadol in human plasma by gas chromatography–mass spectrometry. Journal of Chromatography B 804, 369-374.
107. Allegaert, K., Anderson, B. J., Verbesselt, R., Debeer, A., et al. (2005). Tramadol disposition in the very young: an attempt to assess in vivo cytochrome P-450 2D6 activity. British Journal of Anaesthesia 95, 231-9.
108. Gambaro, V., Benvenuti, C., De Ferrari, L., Dell'Acqua, L., et al. (2003). Validation of a GC/MS method for the determination of tramadol in human plasma after intravenous bolus. Farmaco. 58, 947-50.
109. de Sousa, A. B., Santos, A. C., Schramm, S. G., Porta, V., et al. (2008). Pharmacokinetics of tramadol and o-desmethyltramadol in goats after intravenous and oral administration. J Vet Pharmacol The.r 31, 45-51.
110. El-Sayed, A. Y., Mohamed, K. M., Hilal, M. A., Mohamed, S. A., et al. (2011). Development and Validation of High-Performance Liquid Chromatography-

Quantification of tramadol and M1 in post mortem samples by gas chromatography–ion trap mass spectrometry and preliminary pharmacogenomic studies
66
Diode Array Detector Method for the Determination of Tramadol in Human Saliva. J Chromatograph Separat Techniq., 2-4.
111. Vlase, L., Leucuta, S. E., and Imre, S. (2008). Determination of tramadol and O-desmethyltramadol in human plasma by high-performance liquid chromatography with mass spectrometry detection. Talanta 75, 1104-9.
112. Patel, B. N., Sharma, N., Sanyal, M., and Shrivastav, P. S. (2009). An accurate, rapid and sensitive determination of tramadol and its active metabolite O-desmethyltramadol in human plasma by LC-MS/MS. J Pharm Biomed Anal. 49, 354-66.
113. Musshoff, F., Trafkowski, J., Kuepper, U., and Madea, B. (2006). An automated and fully validated LC-MS/MS procedure for the simultaneous determination of 11 opioids used in palliative care, with 5 of their metabolites. J Mass Spectrom. 41, 633-40.
114. Curticapean, A., Muntean, D., Curticapean, M., Dogaru, M., et al. (2008). Optimized HPLC method for tramadol and O-desmethyl tramadol determination in human plasma. J Biochem Biophys Methods 70, 1304-12.
115. Ghambarian, M., Yamini, Y., and Esrafili, A. (2011). Three-phase hollow fiber liquid-phase microextraction based on two immiscible organic solvents for determination of tramadol in urine and plasma samples. J Pharm Biomed Anal. 56, 1041-5.
116. Barroso, M., Dias, M., Vieira, D. N., López-Rivadulla, M., et al. (2010). Simultaneous quantitation of morphine, 6-acetylmorphine, codeine, 6-acetylcodeine and tramadol in hair using mixed-mode solid-phase extraction and gas chromatography-mass spectrometry. Anal Bioanal Chem. 396, 3059-69.
117. Rouini, M. R., Ardakani, Y. H., Soltani, F., Aboul-Enein, H. Y., et al. (2006). Development and validation of a rapid HPLC method for simultaneous determination of tramadol, and its two main metabolites in human plasma. J Chromatogr B Analyt Technol Biomed Life Sci. 830, 207-11.
118. Soetebeera, U. B., Schierenberg, M. O., Schulz, H., Grünefeld, G., et al. (2000). Assay of tramadol in urine by capillary electrophoresis using laser-induced native fluorescence detection. Journal of Chromatography B 745, 271-278.
119. Wylie, F. M., Torrance, H., Anderson, R. A., and Oliver, J. S. (2005). Drugs in oral fluid Part I. Validation of an analytical procedure for licit and illicit drugs in oral fluid. Forensic Science International 150, 191-198.
120. Nobilis, M., Pastera, J., Anzenbacher, P., Svoboda, D., et al. (1996). High-performance liquid chromatographic determination of tramadol in human plasma. J Chromatogr B Biomed Appl. 681, 177-83.
121. Zhu, T., Ding, L., Guo, X., Yang L., et al. (2007). Simultaneous Determination of Tramadol and Acetaminophen in Human Plasma by LC–ESI–MS. Chromatographia 66, 171-178.
122. Campanero, M. A., Calahorra, B., García-Quetglás, E., Escolar, M., et al. (1998). High-Performance Liquid Chromatographic Assay for Simultaneous Determination of Tramadol and Its Active Metabolite in Human Plasma. Application to Pharmacokinetic Studies. Chromatographia Vol. 48, No. 7-8.
123. Li, Q., and Wang, R. (2006). Simultaneous analysis of tramadol, metoprolol and their metabolites in human plasma and urine by high performance liquid chromatography. Chin Med J (Engl) 119, 2013-7.
124. Bogusz, M. J., Maier, R. D., Krüger, K. D., and Kohls, U. (1998). Determination of common drugs of abuse in body fluids using one isolation procedure and liquid chromatography--atmospheric-pressure chemical-ionization mass spectromery. J Anal Toxicol. 22, 549-58.

Quantification of tramadol and M1 in post mortem samples by gas chromatography–ion trap mass spectrometry and preliminary pharmacogenomic studies
67
125. Gu, Y., and Fawcett., J. P. (2005). Improved HPLC method for the simultaneous determination of tramadol and O-desmethyltramadol in human plasma. Journal of Chromatography B 821, 240-243.
126. Sporkert, F., and Pragst, F. (2000). Use of headspace solid-phase microextraction (HS-SPME) in hair analysis for organic compounds. Forensic Sci. Int. 107, 129-148.
127. Rossi, D. T., and Zhang, N. (2000). Automating solid-phase extraction: current aspects and future prospects. J Chromatogr A 885, 97-113.
128. Bjork, M. K., Nielsen, M. K., Markussen, L. Ø., Klinke, H. B., et al. (2010). Determination of 19 drugs of abuse and metabolites in whole blood by high-performance liquid chromatography-tandem mass spectrometry. Anal Bioanal Chem. 396, 2393-401.
129. Nobilis, M., Kopecký, J., Kvetina, J., Chládek, J., et al. (2002). High-performance liquid chromatographic determination of tramadol and its O-desmethylated metabolite in blood plasma. Application to a bioequivalence study in humans. J Chromatogr A 949, 11-22.
130. Schutz, H. (1979). [Detection of the new analgetic Tramadol (Tramal) (author's transl)]. J Clin Chem Clin Biochem. 17, 85-8.
131. Sparkman, O., Penton, Z., and Kitson, F. (2011). Gas Chromatography and Mass Spectrometry: A Practical Guide. Academic Press, London.
132. Zhang, X., Stuart, J. N., and Sweedler, J. V. (2002). Capillary electrophoresis with wavelength-resolved laser-induced fluorescence detection. Anal Bioanal Chem. 373, 332-43.
133. Dinis-Oliveira, R. J., Carvalho, F., Duarte, J. A., Remião, F., et al. (2010). Collection of biological samples in forensic toxicology. Toxicol Mech Methods 20, 363-414.
134. Peters, F. T., and Maurer, H. H. (2002). Bioanalytical method validation and its implications for forensic and clinical toxicology - A review. Accred Qual Assur. 7, 441-449.
135. European Medicines Agency (EMA), (2011). EMA Guideline on bioanalytical method validation, London.
136. Moreira, P. N., de Pinho, P. G., Baltazar, M. T., Bastos, M. L., et al. (2012). Quantification of paraquat in postmortem samples by gas chromatography-ion trap mass spectrometry and review of the literature. Biomed Chromatogr. 26, 338-49.
137. Gouveia, C. A., Oliveira, A., Pinho, S., Vasconcelos, C., et al. (2012). Simultaneous quantification of morphine and cocaine in hair samples from drug addicts by GC-EI/MS. Biomed Chromatogr. 26, 1041-7.
138. U. S. Department of Health and Human Services, (2001). Guidance for Industry: bioanalytical method validation.
139. Smith, G. (2009). Review of the 2008 European Medicines Agency concept paper on bioanalytical method validation. Bioanalysis 1, 877-81.
140. Ross, J. R., Riley, J., Taegetmeyer, A. B., Sato, H., et al. (2008). Genetic variation and response to morphine in cancer patients: catechol-O-methyltransferase and multidrug resistance-1 gene polymorphisms are associated with central side effects. Cancer 112, 1390-403.
141. Gerostamoulos, J., and Drummer, O. H. (1996). Solid phase extraction of morphine and its metabolites from postmortem blood. Forensic Sci Int. 77, 53-63.
142. Matouskova, O., Slanar, O., Chytil, L., and Perlik, F. (2011). Pupillometry in healthy volunteers as a biomarker of tramadol efficacy. Journal of Clinical Pharmacy and Therapeutics 36, 513–517.

Quantification of tramadol and M1 in post mortem samples by gas chromatography–ion trap mass spectrometry and preliminary pharmacogenomic studies
68
143. Samer, C. F., Piguet, V., Dayer, P., and Desmeules, J. A. (2005). Polymorphisme génétique et interactions médicamenteuses: leur importance dans le traitement de la douleur. Can J Anesth. 52, 806–821.
144. Zubieta, J. K., Heitzeg, M. M., Smith, Y. R., Bueller, J. A., et al. (2003). COMT val158met genotype affects mu-opioid neurotransmitter responses to a pain stressor. Science 299, 1240-3.
145. Lotta, T., Vidgren, J., Tilgmann, C., Ulmanen, I., et al. (1995). Kinetics of human soluble and membrane-bound catechol O-methyltransferase: a revised mechanism and description of the thermolabile variant of the enzyme. Biochemistry 34, 4202-10.
146. de Groat, W. C., Kawatani, M., Hisamitsu, T., Cheng, C. L., et al. (1990). Mechanisms underlying the recovery of urinary bladder function following spinal cord injury. J Auton Nerv Syst. 30, 71-7.
147. Pelissier-Alicot, A. L., Gaulier, J. M., Champsaur, P., and Marquet, P. (2003). Mechanisms underlying postmortem redistribution of drugs: a review. J Anal Toxicol. 27, 533-44.