quality report on international trade in goods … international trade in goods statistics ... table...
TRANSCRIPT

Quality Report on International Trade In Goods Stat istics
– Edition 2011 –

TABLE OF CONTENTS
1 Introduction ................................................................................................................................. 5
1.1 International trade in goods statistics ................................................................................... 5
1.2 EU legislation ....................................................................................................................... 5
1.3 Quality reports and indicators .............................................................................................. 6
2 Relevance ..................................................................................................................................... 7
3 Accuracy ...................................................................................................................................... 7
3.1 Collected and estimated data................................................................................................ 7 3.1.1 Intra-EU trade .................................................................................................................. 7 3.1.2 Extra-EU trade ............................................................................................................... 10
3.2 Measurement units ............................................................................................................. 12 3.2.1 Statistical value .............................................................................................................. 12 3.2.2 Net mass and supplementary quantity ........................................................................... 14
3.3 Revisions ............................................................................................................................ 14
3.4 Confidentiality ................................................................................................................... 15
3.5 Control procedures ............................................................................................................. 18
4 Timeliness and Punctuality ...................................................................................................... 18
5 Accessibility and Clarity ........................................................................................................... 20
6 Coherence and Comparability ................................................................................................. 20
6.1 Comparability over space ................................................................................................... 20 6.1.2 Community figures versus national figures ................................................................... 20 6.1.1 Asymmetries in extra-EU trade statistics ....................................................................... 22 6.1.3 Asymmetries in intra-EU trade statistics ....................................................................... 23
6.2 Comparability over time .................................................................................................... 24
6.3 Coherence with other statistics .......................................................................................... 25
6.4 Internal coherence .............................................................................................................. 25
7 Trade-offs between Output Quality Components .................................................................. 26
8 Assessment of User Needs and Perceptions ............................................................................ 26
9 Performance, Cost and Respondent burden........................................................................... 27
9.1 Performance and Cost ........................................................................................................ 27
9.2 Respondent burden ............................................................................................................. 27
10 Confidentiality, Transparency and Security .......................................................................... 31
Annex 1 - 2008 figures ...................................................................................................................... 33
Annex 2 - Glossary ............................................................................................................................ 46

TABLE OF FIGURES
Table 1: Share of collected and estimated data in intra-EU trade ......................................................................8
Table 2: Estimates in intra-EU trade – Data sources and level of details ...........................................................9
Table 3: Share of collected and estimated data in extra-EU trade ....................................................................10
Table 4: Estimates in extra-EU trade – Data sources and level of details ........................................................11
Table 5: Intra-EU trade – Estimated statistical value versus collected invoice value ......................................12
Table 6: Intra-EU trade – Exemption from statistical value reporting and estimation methods ......................13
Table 7: Impact of revisions (in %) on intra- and extra-EU trade - Reference Year: 2009 ..............................14
Table 8: Impact of the confidentiality on intra- and extra-EU trade - Reference Year: 2009 ..........................15
Table 9: Impact of different types of confidentiality on intra- and extra-EU trade - Share in total value ........16
Table 10: Number of CN8 codes affected according to the type of confidentiality .........................................17
Table 11: Punctuality of detailed and aggregated data .....................................................................................19
Table 12: Conceptual differences between Community statistics and national statistics .................................21
Table 13: Extra-EU asymmetries (in %) ..........................................................................................................22
Table 14: Intra-EU asymmetries (in %)............................................................................................................23
Table 15: Changes affecting comparability over time ......................................................................................24
Table 16: Evolution of CN8 codes over time ...................................................................................................24
Table 17: Coherence across domains ...............................................................................................................25
Table 18: Intrastat exemption thresholds and share of beneficiary traders ......................................................28
Table 19: Intrastat simplification thresholds and share of beneficiary PSIs .....................................................28
Table 20: Intrastat statistical value thresholds and share of beneficiary PSIs ..................................................29
Table 21: Extrastat statistical thresholds ..........................................................................................................30

ABBREVIATIONS
BoP Balance of Payments
CN Combined Nomenclature
EU European Union
HS Harmonised System
ITGS International Trade in Goods Statistics
PSI Provider of the Statistical Information
UN United Nations
VAT Value Added Tax
VIES VAT Information Exchange System

1 Introduction
5Quality Report on International Trade in Goods Statistics
Quality Report on International Trade In Goods Stat istics
– Edition 2011 –
1 Introduction The purpose of this Quality Report is to provide users with a tool for assessing the quality of the international trade in goods statistics (ITGS) disseminated by Eurostat. It complements the User Guide which aims at describing the basic concepts and methodology used for the data compilation, the collection and the processing stages and the data availability and dissemination from Eurostat. The Quality Report presents the main quality indicators compiled for the reference year 2009. The purpose is not to sort the EU Member States from best to worst for each quality indicator. The purpose is to provide users with information on different factors affecting statistics, thus allowing them to assess the data quality.
1.1 International trade in goods statistics International Trade in Goods Statistics are a part of the official European Union (EU) statistics which provide data on movement of goods between countries. They measure the value and quantity of goods traded between the EU Member States (intra-EU trade) and goods traded by the EU Member States with non-member countries (extra-EU trade). They are the official harmonised source of information about imports, exports and trade balance of the EU and of its Member States as well as of the euro area. As international trade forms an important part of the world economy, statistics on the trading of goods are therefore an instrument of primary importance for numerous public and private sector decision makers. For example, international trade statistics: • enable Community authorities to prepare multilateral and bilateral negotiations within the framework
of the common commercial policy; • enable Community authorities to evaluate the progress of the Single Market and the integration of
EU economies; • constitute an essential source of information for balance of payments statistics, national accounts and
economic studies; • help EU companies to conduct market research and define their commercial strategy. This list, which is not exhaustive, demonstrates the diversity of the users and of their needs. ITGS are based on two data collections systems: Extrastat and Intrastat. Extrastat data which relate to trading of goods with non-member countries are collected by Customs administrations and are based on the records of trade transactions in customs declarations. Intrastat data on the other hand are directly collected from traders once a month. This is the consequence of the abolition of customs controls at the borders between the Member States in 1993.
1.2 EU legislation Generally speaking, the EU legislation known as the ‘Acquis Communautaire’ comprises Primary legislation and Secondary legislation. The Primary legislation consists of the Treaties (e.g. Amsterdam, Nice, Treaty on EU and functioning of EU) and other agreements possessing similar status. The Secondary legislation consists of regulations, directives, decisions, recommendations and opinions based

1 Introduction
6Quality Report on International Trade in Goods Statistics
upon the Treaties. Regulations are directly applicable in Member States and do not need the adoption of national laws to be implemented.
As regards ITGS, Secondary legislation is laid down in regulations in order to ensure a harmonised approach for the production of statistics by all Member States. EU provisions do not interfere in the compilation methods of the data required for national needs and are directly applicable for European statistics only.
The provisions on ITGS are determined in several regulations and address intra- and extra-EU trade separately. The "Basic Regulations", adopted by the Council and the European Parliament, establish the essential rules governing ITGS. The "Implementing provisions" (IP) are adopted by the Commission and define further details necessary for the implementation of certain articles of the Basic Regulations. The Commission can provide implementing rules only for the articles of the Basic Regulation for which it has been given the implementing power.
The legal base for both intra- and extra-EU trade statistics were revised in 2009. The new regulations do not introduce major changes to the general concepts and principles but rather allow more simplification possibilities in intra-EU trade and align the extra-EU trade statistics with the Modernised Customs Code. Both regulations also include articles on standardised procedures for quality reporting.
Intra-EU trade
Basic Regulation:
Regulation (EC) No 638/2004 of the European Parliament and of the Council amended by Regulation (EC) No 222/2009
Implementing provisions: Commission Regulation (EC) No 1982/2004 amended by Commission Regulation (EC) No 1915/2005
Commission Regulation (EU) No 91/2010 Commission Regulation (EU) No 96/2010
NB: This set of legal acts is commonly referred to as "Intrastat legislation".
Extra-EU trade
Basic Regulation:
Regulation (EC) No 471/2009 of the European Parliament and of the Council
Implementing provisions: Commission Regulation (EU) No 113/2010 Commission Regulation (EU) No 92/2010
NB: This set of legal acts is commonly referred to as "Extrastat legislation".
1.3 Quality reports and indicators The quality concept applied in this report is in conformity with the definition developed by the European Statistical System (ESS). In this definition, quality consists of the following components: relevance, accuracy, timeliness and punctuality, accessibility and clarity, comparability and coherence. Each quality component consists also of several subcomponents. Quality reporting is not a new concept in trade in goods statistics. In 2005, the ITGS legislation made annual reporting on determined quality indicators for intra-EU trade statistics mandatory. Since 2009, the legislation includes also a similar article for extra-EU trade statistics. Member States have to supply Eurostat with an annual Quality Report in a fixed deadline. In practice this reporting process has been harmonised: Member States fulfil their obligation of quality reporting by completing a report pre-filled by Eurostat. The key quality indicators are gathered in this summary Quality Report.

4 Timeliness and Punctuality
7Quality Report on International Trade in Goods Statistics
2 Relevance ESS Definition Relevance is the degree to which statistical outputs meet current and potential user needs. It depends on whether all the statistics that are needed are produced and the extent to which concepts used (definitions, classifications etc.) reflect user needs. The EU ITGS follow largely the international recommendations by United Nations Statistics Division (cf. International Merchandise Trade Statistics: Concepts and Definitions, 2010). The UN manual is updated regularly so that it reflects the changes in the environment of international trade. Furthermore, the EU Regulations as well as classifications for international trade are revised regularly in order to take into account the economic and administrative environment as well as users' needs. International trade forms an important part of the world economy and, as such, must be measured reliably and the relevant statistical data should be comparable and widely disseminated. The statistics satisfy this need in a variety of ways. Users may need either very aggregated or very detailed data on products or partner countries. They may be interested in movements of values of trade in current prices or in movements of the volume of trade at constant prices. Alternatively, their interest may be in the weight of trade or some other quantity measure. These examples, which are far from exhaustive, show the diversity of the users and their requirements. Eurostat tries to meet these various needs and to adapt to the changing environment as the progression toward globalization, in particular, is becoming more and more important. The EU trade statistics are based on the EU legislation which is directly applicable in the Member States. In particular, the legislation includes a clear and precise list of all the statistical variables to be provided by the Member States to Eurostat.
3 Accuracy ESS Definition The accuracy of statistical outputs in the general statistical sense is the degree of closeness estimates to the true values.
The accuracy of international trade in goods statistics is affected in different ways by several factors: • Coverage of data collection and methods to adjust non-collected data • Measurement units • Data revisions • Confidentiality • Control procedures
3.1 Collected and estimated data
3.1.1 Intra-EU trade In order to reduce the burden on enterprises, particularly small and medium sized ones, the Intrastat system is designed in a way that the workload for providers of statistical information varies according to the amount of trade in which they are engaged. To achieve this, each Member State applies a system of thresholds to exempt traders completely from statistical reporting or to limit the information they need to report1. From the above follows that Intrastat data collection does not cover 100 % of Member States' trade with other EU Member States. However, in order to have complete trade coverage in trade statistics,
1 More details about the thresholds and their impact on the response burden are reported in section 9.2.

4 Timeliness and Punctuality
8Quality Report on International Trade in Goods Statistics
the loss caused by the exemption threshold must be compensated with adjustments. Similarly, the loss of coverage due to late-response or non-response from traders liable to submit Intrastat declarations must be offset by means of adjustments. Table 1 shows the share of collected and estimated data (below threshold and non-response) in total intra-EU trade.
Table 1: Share of collected and estimated data in intra-EU trade Reference Year: 2009
MEMBER STATES
Collected data Estimated data
Below the exemption threshold Non response
Arrivals Dispatches Arrivals Dispatches Arrivals Dispatches
Belgium 95.3 % 97.0 % 2.9 % 1.6 % 1.8 % 1.6 % Bulgaria 97.6 % 99.0 % 2.3 % 1.0 % 0.2 % 0.1 %
Czech Republic 98.0 % 98.3 % 1.9 % 1.6 % 0.1 % 0.0 %
Denmark 85.8 % 91.9 % (*) 14.2 % (*) 8.1 %
Germany 96.2 % 97.7 % 3.0 % 1.7 % 0.8 % 0.6 %
Estonia 92.7 % 93.1 % 3.5 % 3.5 % 3.8 % 3.3 %
Ireland 95.7 % 98.0 % 3.5 % 1.6 % 0.8 % 0.4 %
Greece ** : :
Spain 96.2 % 97.0 % 1.8 % 1.3 % 2.0 % 1.7 %
France 99.2 % 99.3 % 0.5 % 0.5 % 0.3 % 0.2 %
Italy 97.2 % 97.6 % 2.8 % 2.4 %
Cyprus 98.6 % 96.9 % 1.4 % 2.9 % 0.0 % 0.1 %
Latvia 90.5 % 94.9 % 6.1 % 3.3 % 3.4 % 1.8 %
Lithuania 96.6 % 97.5 % 3.3 % 2.4 % 0.1 % 0.1 %
Luxembourg 97.7 % 95.8 % 2.2 % 4.0 % 0.1 % 0.2 %
Hungary 89.0 % 94.9 % 5.2 % 3.0 % 5.8 % 2.1 %
Malta ** 99.0 % 99.0 %
Netherlands 87.0 % 92.6 % (*) 13.0 % (*) 7.4 %
Austria 95.1 % 97.8 % 3.4 % 1.3 % 1.5 % 0.9 %
Poland 97.7 % 98.0 % 1.3 % 1.1 % 0.9 % 0.8 %
Portugal 91.6 % 93.9 % 6.4 % 5.2 % 2.0 % 1.0 %
Romania 97.1 % 97.9 % 1.8 % 1.6 % 1.1 % 0.5 %
Slovenia 96.9 % 98.4 % 3.1 % 1.6 % 0.0 % 0.0 %
Slovakia 91.2 % 92.7 % 4.3 % 2.9 % 4.5 % 4.3 %
Finland 95.7 % 98.1 % 2.8 % 1.2 % 1.6 % 0.7 %
Sweden 95.1 % 97.7 % 3.9 % 2.0 % 1.0 % 0.3 %
United Kingdom 95.9 % 96.7 % 2.4 % 3.0 % 1.7 % 0.4 %
Note: The share of estimated data refers to the share in the final data transmitted to Eurostat. This share is larger in the first and intermediate data. : Data not available *: Adjustments both for trade below the exemption threshold and non-response
**: No adjustment is compiled for trade below the exemption threshold and non-response.
Table 2 indicates which information sources are used to estimate the missing data and at which level the estimates are compiled. For most Member States, estimation methods are based on information contained in the fiscal declarations of the enterprises – VAT returns or recapitulative statements (VIES data) - and/or historical intra-EU trade statistics. According to the Intrastat legislation, the breakdown of the estimates transmitted to Eurostat must be at least by 2-digit codes of the Harmonised System (HS2) and

4 Timeliness and Punctuality
9Quality Report on International Trade in Goods Statistics
partner countries. A majority of Member States compile estimates at the minimum level (HS2) while some apply even more detailed breakdowns by products (HS4 or CN8).
Table 2: Estimates in intra-EU trade – Data sources and level of details Reference Year: 2009
MEMBER STATES
Data sources Level of estimates
Estimates for trade below threshold Estimates for non-response
Belgium VAT data VAT data CN8 / partner countries
Bulgaria historical figures historical figures and VAT data HS2 / partner countries Czech Republic VAT data historical figures CN8 / partner countries
Denmark VAT data VAT data CN8 / partner countries Germany historical figures and VAT data historical figures and VAT data HS2 / partner countries Estonia historical figures and VAT data historical figures and VAT data HS2 / partner countries
Ireland VAT data (use of the VAT return for the period in question or forecast done by applying the Holt-Winter's method)
historical figures (use of the Holt-Winter's method) or, failing that, on VAT data
Below the threshold: by partner only Late or non response: CN8 / partner countries
Greece No estimate No estimate Spain VAT data historical figures HS2 / partner countries
France VIES data historical figures HS2 / partner countries
Italy “just-above-the-threshold” traders No adjustment since the survey is total and the obligation of reporting is fiscal.
Below the threshold: HS2 / partner countries
Cyprus VAT data
historical figures (use of the Holt-Winter's method or, if not applicable, of the average of previous actual returns) or, if not applicable, on VAT data
CN8 / partner countries
Latvia historical figures and VAT data when available
historical figures and VAT data when available
HS2 / partner countries
Lithuania VAT data VAT data HS2 / partner countries Luxembourg historical figures and VAT data historical figures and VAT data HS2 / partner countries Hungary VAT data historical figures and VAT data HS4 / partner countries Malta No estimate No estimate Netherlands VAT data historical figures and VAT data HS2 / partner countries
Austria VAT data VAT data for non-response and historical data for late response CN8 / partner countries
Poland historical figures and VAT data historical figures and VAT data CN8 / partner countries Portugal VAT data historical figures and VAT data CN8 / partner countries
Romania historical figures and fiscal data (VAT & VIES)
historical figures and fiscal data (VAT & VIES)
HS4 / partner countries
Slovenia VAT data historical figures and VAT data CN8 / partner countries Slovakia historical figures and VAT data historical figures and VAT data CN8 / partner countries Finland VAT data historical figures and VAT data HS2 / partner countries
Sweden historical figures and VAT data imputation or growth models using historical figures or VAT data
HS2 / partner countries
United Kingdom VAT data growth factors
Below the threshold: CN8 / partner countries Late or non-response: No product or partner breakdown

4 Timeliness and Punctuality
10Quality Report on International Trade in Goods Statistics
3.1.2 Extra-EU trade The problem of late or non-response should theoretically not exist in the Extrastat system. Nevertheless, adjustments may be necessary for delayed or incomplete Customs records. In addition, for simplification purposes, Member States are allowed to compile less detailed information for transactions below the statistical threshold of 1000 euros and 1000 kilograms. Table 3 shows the share of collected and estimated data in total extra-EU trade. Table 4 indicates which information sources are used to estimate the missing data and at which level the estimates are compiled. Table 3: Share of collected and estimated data in extra-EU trade
Reference Year: 2009
MEMBER STATES
Collected data Estimated data
Standard category Less detailed data (below statistical threshold)
Delayed or incomplete records
Imports Exports Imports Exports Imports Exports
Belgium 100.0 % 100.0 % Bulgaria 100.0 % 100.0 %
Czech Republic 100.0 % 100.0 %
Denmark 100.0 % 99.8 % 0.0 % 0.0 % 0.2 %
Germany 99.7 % 99.8 % 0.3 % 0.2 %
Estonia 100.0 % 100.0 %
Ireland 100.0 % 100.0 % 0.0 % 0.0 %
Greece 100.0 % 100.0 %
Spain 100.0 % 100.0 %
France 99.4 % 99.4 % 0.6 % 0.6 %
Italy 99.5 % 99.1 % 0.5 % 0.9 %
Cyprus 100.0 % 100.0 %
Latvia 100.0 % 100.0 %
Lithuania 100.0 % 100.0 %
Luxembourg 100.0 % 100.0 %
Hungary 100.0 % 100.0 %
Malta 100.0 % 100.0 %
Netherlands 99.2 % 99.4 % 0.8 % 0.6 %
Austria 100.0 % 99.9 % 0.0 % 0.1 %
Poland 100.0 % 100.0 %
Portugal 100.0 % 100.0 %
Romania 100.0 % 100.0 %
Slovenia 100.0 % 99.9 % 0.0 % 0.1 %
Slovakia 100.0 % 100.0 %
Finland 100.0 % 100.0 %
Sweden 100.0 % 100.0 %
United Kingdom 98.7 % 99.2 % 1.3 % 0.8 %

4 Timeliness and Punctuality
11Quality Report on International Trade in Goods Statistics
Table 4: Estimates in extra-EU trade – Data sources and level of details
Reference Year: 2009
MEMBER STATES Data sources Level of estimates
Belgium No estimate
Bulgaria No estimate
Czech Republic No estimate
Denmark
Estimation based on control unit price limits to identify the declarations where only the net value added has been reported (allowed in imports after outward processing)
CN8 / partner countries
Germany Estimation based on fixed factor generated on basis of the value structure of former threshold raises HS2 with no partner breakdown
Estonia No estimate
Ireland Estimations made for parcel post No product or partner breakdown For a few cases, by partner country
Greece No estimate
Spain No estimate
France Estimation based on data collected by Customs No product or partner breakdown
Italy Estimation based on data collected by Customs No product or partner breakdown
Cyprus No estimate
Latvia No estimate
Lithuania No estimate
Luxembourg No estimate
Hungary No estimate
Malta No estimate
Netherlands Estimation based on historical data HS2 / partner countries
Austria
Estimation based on yearly updated factors derived from a statistical regression analysis taking into account the distribution of classified transaction values close above the threshold
No product or partner breakdown
Poland No estimate
Portugal No estimate
Romania No estimate
Slovenia Estimation based on data collected by Customs for statistical purposes No product or partner breakdown
Slovakia No estimate
Finland No estimate
Sweden No estimate
United Kingdom Estimation based on data collected by Customs No product or partner breakdown

4 Timeliness and Punctuality
12Quality Report on International Trade in Goods Statistics
3.2 Measurement units
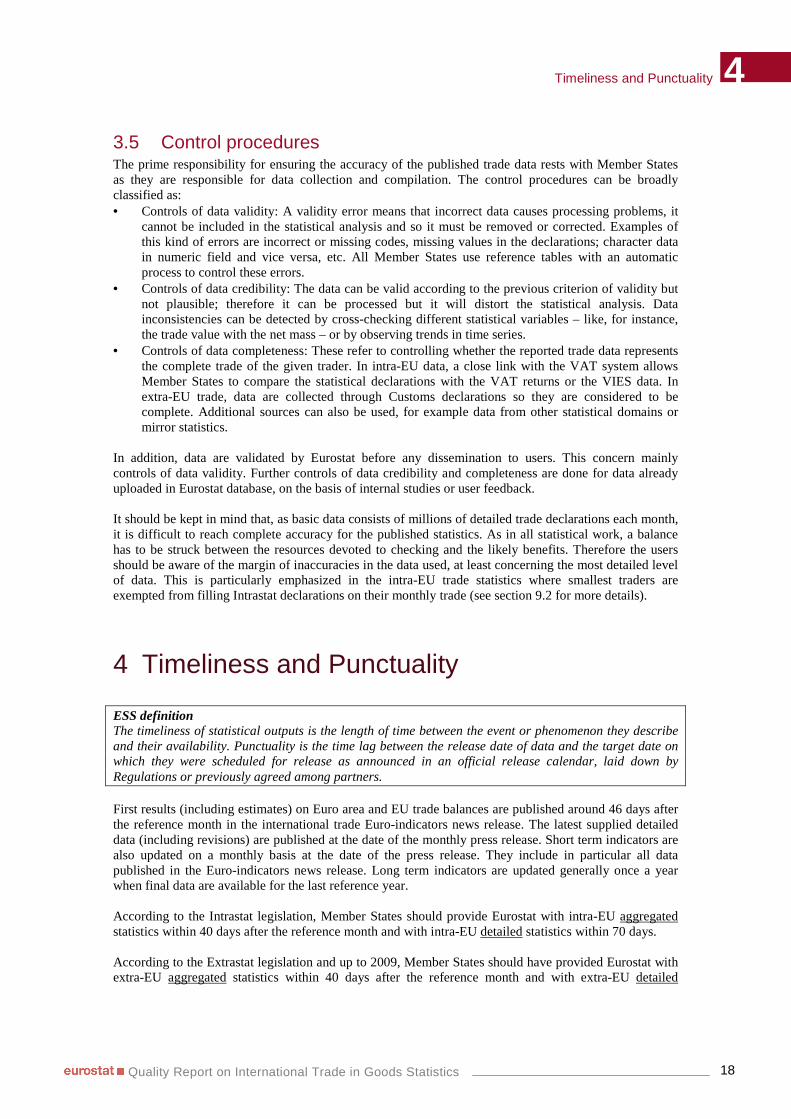
3.2.1 Statistical value International trade in goods statistics apply harmonised principles when compiling the trade values. In general all goods should be valued with the total amount which would be invoiced in case of sale or purchase at the national border of the reporting Member State. It is said to be a FOB value (free on board), for exports/dispatches, and a CIF value (cost, insurance, freight) for imports/arrivals. In extra-EU trade, the statistical value is based on the value determined for customs purposes; therefore there is generally no need to estimate it. In intra-EU trade, only the invoice value – amount agreed on the sales agreement – is systematically collected from the PSIs. Most Member States either do not collect the statistical value at all or collect the statistical value only from the PSIs whose annual trade is above a certain threshold. The statistical value threshold should be fixed in such a way that the statistical value is collected only from PSIs whose global share in total trade does not exceed 70 %. When not provided by the PSI, the statistical value shall be estimated by the National Statistical Authority. The estimation is based on the invoice value and other collected information such as the delivery terms and the mode of transport.
Table 5: Intra-EU trade – Estimated statistical value versus collected invoice value Reference Year: 2009
MEMBER STATES Arrivals Dispatches
Belgium 0.0 % 0.0 % Bulgaria 1.3 % 0.1 % Czech Republic 0.1 % -0.8 % Denmark 0.8 % -1.0 % Germany 0.0 % 0.3 % Estonia 1.9 % -0.9 % Ireland : : Greece : : Spain -0.9 % 0.9 % France -0.1 % -0.5 % Italy -0.1 % 0.2 % Cyprus 0.8 % -1.4 % Latvia 1.7 % -1.1 % Lithuania 1.7 % -0.5 % Luxembourg 0.9 % -0.8 % Hungary 0.4 % -0.5 % Malta : : Netherlands : : Austria 0.0 % 0.0 % Poland 0.3 % -0.6 % Portugal 0.2 % -0.5 % Romania 1.6 % 0.1 % Slovenia 0.6 % -0.8 % Slovakia 1.7 % -0.3 % Finland 2.4 % -0.2 % Sweden 1.0 % -0.7 % United Kingdom 0.4 % -0.4 % Formula = [total statistical value / total invoice value – 1] * 100
: Data not available

4 Timeliness and Punctuality
13Quality Report on International Trade in Goods Statistics
Table 6: Intra-EU trade – Exemption from statistical value reporting and estimation methods
Reference Year: 2009
MEMBER STATES PSIs exempted Estimation methods
Belgium All PSIs exempted No adjustment, use of the invoice value
Bulgaria PSIs above the threshold Correcting coefficient computed from historical data Statistical value collected from PSIs for goods for/after processing
Czech Republic All PSIs exempted Correcting coefficient computed from historical data.
Denmark All PSIs exempted Adjustment from invoice value to statistical value done by applying factors derived from a survey
Germany PSIs above the threshold Correcting coefficient computed from above the threshold data for trade data below the threshold
Estonia PSIs above the threshold Correcting coefficient computed from above the threshold data for trade data below the threshold
Ireland PSIs above the threshold Correcting coefficient computed from above the threshold data for trade data below the threshold
Greece No exemption Statistical value collected from trade operators above the threshold but as well below the threshold. Therefore, no adjustment is needed.
Spain PSIs above the threshold Correcting coefficient computed from above the threshold data for trade data below the threshold
France All PSIs exempted Correcting coefficient computed from historical data.
Italy PSIs above the threshold Correcting coefficient computed from above the threshold data for trade data below the threshold
Cyprus PSIs above the threshold Correcting coefficient computed from above the threshold data for trade data below the threshold
Latvia PSIs above the threshold Correcting coefficient computed from historical data for trade data below the threshold
Lithuania PSIs above the threshold Correcting coefficient computed from above the threshold data for trade data below the threshold
Luxembourg PSIs above the threshold Correcting coefficient computed from above the threshold data for trade data below the threshold
Hungary PSIs above the threshold Correcting coefficient computed from above the threshold data for trade data below the threshold
Malta No exemption No adjustment since both invoice and statistical values are collected
Netherlands All PSIs exempted Correcting coefficients derived from historical data.
Austria PSIs above the threshold No adjustment, use of the invoice value
Poland PSIs above the threshold Correcting coefficient computed from above the threshold data for trade data below the threshold
Portugal PSIs above the threshold Correcting coefficient computed from above the threshold data for trade data below the threshold
Romania PSIs above the threshold Correcting coefficient computed from above the threshold data for trade data below the threshold
Slovenia PSIs above the threshold Correcting coefficient computed from above the threshold data for trade data below the threshold
Slovakia All PSIs exempted Adjustment from invoice value to statistical value done by applying factors derived from a survey on ancillary costs carried out quarterly.
Finland PSIs above the threshold Correcting coefficient computed from above the threshold data for trade data below the threshold
Sweden All PSIs exempted Adjustment from invoice value to statistical value done by applying factors derived from a survey
United Kingdom All PSIs exempted
Delivery terms are collected from the largest traders. Adjustment from invoice value to statistical value done by a model using ancillary cost information derived from a monthly survey.

4 Timeliness and Punctuality
14Quality Report on International Trade in Goods Statistics
3.2.2 Net mass and supplementary quantity
The most common unit of measurement of quantity is the net mass expressed in kilograms. The net mass corresponds to the weight of the goods without packaging.
For certain goods, a supplementary quantity is provided in addition to the net mass. This quantity is expressed in a unit which bring useful information. Supplementary units are units other than kilograms like, for example, litres, numbers of pieces, carats, terajoules or square metres. Further information whether a supplementary unit is collected for a given good is available in the Combined Nomenclature.
Under the provisions on intra-EU trade statistics, where there is a supplementary unit laid down for a specific product code of the Combined Nomenclature, it is not mandatory to request the specification of net mass from the PSIs. Member States can define whether the information about net mass is collected for all CN8 codes or only for part of them.
3.3 Revisions Data are revised frequently according to national needs and practices. They become normally final from six months up to more than one year after the reference year. Revisions to older data are also possible. Table 7 shows the impact of revisions by comparing the last values with the first ones. Signs are indicative of the direction of this impact. Negative signs state higher first values whereas positive signs indicate smaller first values. From table 7 follows that, in most cases there is an underestimation of the first transmitted values. The average extent of the revisions is generally higher for intra-EU trade than for extra-EU trade, and is also higher for arrivals than for dispatches. Table 7: Impact of revisions (in %) on intra- and extra-EU trade - Reference Year: 2009
MEMBER STATES
Intra-EU trade Extra-EU trade Arrivals Dispatches Imports Exports
Belgium -0.9 % -1.4 % 7.4 % 5.2 % Bulgaria -0.3 % 0.4 % 1.7 % -5.0 % Czech Republic -0.2 % -0.8 % -0.1 % -2.1 % Denmark -3.0 % -0.7 % 1.6 % 2.5 % Germany -1.0 % -0.8 % 0.2 % 1.1 % Estonia 0.4 % 1.9 % -6.5 % -0.3 % Ireland 0.6 % 0.4 % 0.2 % 4.6 % Greece 3.2 % 4.8 % 41.6 % 0.1 % Spain 3.6 % 5.5 % 0.0 % 1.8 % Franc e 1.7 % 2.8 % 0.5 % 1.2 % Italy 2.0 % 1.4 % 0.1 % -0.5 % Cyprus 1.7 % 2.2 % 0.4 % 1.4 % Latvia 5.6 % 5.2 % -0.1 % -0.4 % Lithuania 3.8 % 1.0 % -1.3 % 1.4 % Luxembourg 3.7 % 1.9 % 7.1 % 4.0 % Hungary 0.3 % -1.1 % 0.9 % -0.9 % Malta 35.0 % 28.4 % 0.1 % 42.0 % Netherlands -1.2 % 0.6 % 1.3 % -2.0 % Austria -1.3 % -1.9 % 1.6 % 0.6 % Poland 6.1 % 4.4 % 1.0 % -0.2 % Portugal 8.0 % 4.7 % 0.0 % -0.7 % Romania 2.2 % 0.7 % 1.5 % 0.1 % Slovenia 2.4 % -0.2 % 0.2 % -0.2 % Slovakia 1.6 % 0.2 % 0.3 % -0.1 % Finland 5.0 % 1.6 % 1.2 % 3.0 % Sweden 1.0 % 0.0 % 1.9 % 1.6 % United Kingdom 1.8 % 1.5 % -0.1 % 0.2 % EU-27 0.9 % 0.7 % 1.4 % 0.9 % -: First figure>Last figure / +: First figure<Last figure

4 Timeliness and Punctuality
15Quality Report on International Trade in Goods Statistics
3.4 Confidentiality The application of confidentiality has an impact on the data accuracy, in particular at the most detailed level, as some characteristics are not shown at all or are available only at more aggregated levels.
There are two types of confidentiality: • The partner confidentiality - In order to conceal the destination or the source or origin of a product,
the code of the partner country is replaced by a ‘secret country code’, different for intra- and extra-EU trade.
• The product confidentiality - In order to suppress the nature of the goods, all or part of the trade is allocated to a confidential product code. Information about goods may be considered as commercially sensitive either for the value, the quantity or their ratio, since it would give an indication of the price.
The impact of the confidentiality can be assessed using data available in Eurostat Comext database, where special codes are used for hiding the partner or/and the product. Confidentiality can concern either value or quantity variables (net mass and supplementary quantity) or both measurement units. Table 8 shows the impact of confidentiality over total trade, in terms of trade value, net mass and number of 8-digit product codes (CN8) affected. The importance of confidentiality is very different depending on the type of trade, on the flow and on the Member State.
Table 8: Impact of the confidentiality on intra- and extra-EU trade - Reference Year: 2009
MEMBER STATES
Intra-EU trade (%) Extra-EU trade (%)
Arrivals Dispatches Imports Exports
Number of CN8 codes
affected
Impact on
trade value
Impact on net mass
Number of CN8 codes
affected
Impact on trade
value
Impact on net mass (%)
Number of CN8 codes
affected
Impact on trade
value
Impact on net mass
Number of CN8 codes
affected
Impact on trade
value
Impact on net mass
Belgium 37 0.6 % 0.4 % 120 1.9 % 2.8 % 43 1.8 % 1.3 % 120 2.9 % 3.9 % Bulgaria Czech Republic 536 0.5 % 1.4 % 245 0.5 % 1.3 % 283 0.5 % 0.1 % 232 1.3 % 0.6 % Denmark 37 0.6 % 1.6 % 94 8.9 % 5.2 % 35 3.1 % 1.6 % 95 12.7 % 11.2 % Germany 36 1.9 % 7.2 % 193 1.5 % 5.0 % 59 7.8 % 26.3 % 179 1.6 % 7.4 % Estonia Ireland 14 0.0 % 0.0 % 5 0.0 % 0.3 % Greece 12 0.1 % 0.0 % 13 1.6 % 0.5 % 10 0.0 % 0.0 % 12 1.5 % 0.1 % Spain 37 0.2 % 0.2 % 19 0.3 % 1.6 % 33 0.2 % 0.1 % 34 1.1 % 0.9 % France 10 0.0 % 0.0 % 292 2.5 % 4.3 % 10 0.0 % 6.4 % 258 2.1 % 4.5 % Italy 24 0.1 % 0.2 % 107 0.7 % 1.2 % 20 0.1 % 0.0 % 98 0.6 % 0.9 % Cyprus 1 0.2 % 0.0 % 1 0.1 % 0.0 % Latvia Lithuania Luxembourg 4 4.5 % 0.0 % 7 0.9 % 3.3 % 1 0.2 % 0.4 % 5 0.9 % 0.1 % Hungary 1 597 2.9 % 4.1 % 2 037 3.6 % 13.4 % 634 11.7 % 34.1 % 1 546 4.9 % 11.0 % Malta Netherlands 193 5.4 % 3.5 % 423 8.1 % 11.6 % 323 6.5 % 2.5 % 728 8.3 % 3.5 % Austria 96 1.6 % 8.4 % 260 6.2 % 11.9 % 91 9.9 % 42.3 % 252 7.5 % 7.9 % Poland 1 0.0 % 0.0 % Portugal 1 269 0.4 % 1.6 % 589 2.3 % 4.0 % 420 0.5 % 0.4 % 358 3.9 % 6.0 % Romania 83 0.2 % 0.0 % 50 0.2 % 0.0 % 65 0.3 % 0.0 % 41 0.6 % 0.0 % Slovenia 30 0.1 % 0.1 % 11 0.0 % 0.1 % 25 0.3 % 20 0.3 % 0.7 % Slovakia 1 052 1.1 % 1 646 1.7 % 131 0.1 % 334 0.2 % Finland 78 1.0 % 10.6 % 137 7.0 % 12.9 % 64 7.3 % 12.2 % 132 6.6 % 14.1 % Sweden 18 0.2 % 0.2 % 76 2.4 % 1.0 % 19 0.3 % 0.3 % 77 3.8 % 1.7 % United Kingdom 19 0.1 % 2.1 % 76 1.9 % 1.9 % 44 0.9 % 0.5 % 72 1.7 % 2.1 %

4 Timeliness and Punctuality
16Quality Report on International Trade in Goods Statistics
Tables 9 and 10 split the share of confidential data into partner confidentiality, product confidentiality and simultaneously partner and product confidentiality, in terms of trade value and number of CN8 codes affected. For most of the Member States, product confidentiality seems to affect rather more the dispatches/exports than the arrivals/imports. Moreover, some Member States are systematically only using one type of confidentiality.
Table 9: Impact of different types of confidentiality on intra- and extra-EU trade - Share in total value
Reference Year: 2009
MEMBER STATES
Intra-EU trade (%) Extra-EU trade (%)
Arrivals Dispatches Imports Exports
Secret product
Secret partner
Product and
partner
Secret product
Secret partner
Product and
partner
Secret product
Secret partner
Product and
partner
Secret product
Secret partner
Product and
partner Belgium 0.6 % 1.9 % 1.7 % 0.0 % 2.6 % 0.3 % Bulgaria Czech Republic 0.5 % 0.5 % 0.5 % 1.3 % Denmark 0.3 % 0.3 % 4.0 % 4.9 % 2.8 % 0.2 % 2.8 % 9.9 % Germany 0.1 % 1.8 % 1.0 % 0.6 % 0.0 % 0.0 % 7.7 % 1.4 % 0.3 % Estonia Ireland 0.0 % 0.0 % Greece 0.1 % 1.6 % 0.0 % 1.5 % Spain 0.2 % 0.3 % 0.2 % 1.1 % France 0.0 % 0.0 % 0.0 % 2.5 % 0.0 % 0.0 % 0.0 % 2.1 % Italy 0.1 % 0.7 % 0.1 % 0.6 % Cyprus 0.2 % 0.1 % Latvia Lithuania Luxembourg 4.5 % 0.9 % 0.2 % 0.9 % Hungary 2.9 % 3.6 % 11.7 % 4.9 % Malta Netherlands 0.7 % 0.3 % 4.4 % 0.3 % 1.0 % 6.8 % 0.2 % 0.7 % 5.5 % 0.3 % 1.9 % 6.1 % Austria 0.2 % 0.1 % 1.3 % 2.8 % 0.9 % 2.5 % 0.5 % 0.0 % 9.3 % 5.2 % 0.6 % 1.7 % Poland 0.0 % Portugal 0.1 % 0.3 % 1.3 % 1.0 % 0.0 % 0.5 % 0.5 % 3.4 % Romania 0.2 % 0.2 % 0.3 % 0.6 % Slovenia 0.1 % 0.0 % 0.3 % Slovakia 1.1 % 1.7 % 0.1 % 0.2 % Finland 0.3 % 0.7 % 2.4 % 4.6 % 0.1 % 7.3 % 1.5 % 5.1 % Sweden 0.2 % 2.4 % 0.3 % 3.8 % United Kingdom 0.0 % 0.1 % 1.1 % 0.8 % 0.3 % 0.6 % 0.6 % 1.1 %

4 Timeliness and Punctuality
17Quality Report on International Trade in Goods Statistics
Table 10: Number of CN8 codes affected according to the type of confidentiality
Reference Year: 2009
MEMBER STATES
Intra-EU trade (%) Extra-EU trade (%)
Arrivals Dispatches Imports Exports
Secret product
Secret partner
Product and
partner
Secret product
Secret partner
Product and
partner
Secret product
Secret partner
Product and
partner
Secret product
Secret partner
Product and
partner Belgium 37 120 33 10 109 11 Bulgaria Czech Republic 536 245 283 232 Denmark 21 16 52 42 20 15 52 43 Germany 16 20 171 22 13 11 35 170 9 Estonia Ireland 14 5 Greece 12 13 10 12 Spain 37 19 33 34 France 8 2 7 285 8 2 4 254 Italy 24 107 20 98 Cyprus 1 1 Latvia Lithuania Luxembourg 4 7 1 5 Hungary 1 597 2 037 634 1 546 Malta Netherlands 69 104 20 79 324 20 55 246 22 47 650 31 Austria 38 9 49 170 22 68 37 9 45 164 22 66 Poland 1 Portugal 488 781 222 367 74 346 34 324 Romania 83 50 65 41 Slovenia 6 24 11 4 21 20 Slovakia 1 052 1 646 131 334 Finland 35 43 12 125 33 31 12 120 Sweden 18 76 19 77 United Kingdom 8 11 60 16 11 33 48 24
4 Timeliness and Punctuality
18Quality Report on International Trade in Goods Statistics
3.5 Control procedures The prime responsibility for ensuring the accuracy of the published trade data rests with Member States as they are responsible for data collection and compilation. The control procedures can be broadly classified as: • Controls of data validity: A validity error means that incorrect data causes processing problems, it
cannot be included in the statistical analysis and so it must be removed or corrected. Examples of this kind of errors are incorrect or missing codes, missing values in the declarations; character data in numeric field and vice versa, etc. All Member States use reference tables with an automatic process to control these errors.
• Controls of data credibility: The data can be valid according to the previous criterion of validity but not plausible; therefore it can be processed but it will distort the statistical analysis. Data inconsistencies can be detected by cross-checking different statistical variables – like, for instance, the trade value with the net mass – or by observing trends in time series.
• Controls of data completeness: These refer to controlling whether the reported trade data represents the complete trade of the given trader. In intra-EU data, a close link with the VAT system allows Member States to compare the statistical declarations with the VAT returns or the VIES data. In extra-EU trade, data are collected through Customs declarations so they are considered to be complete. Additional sources can also be used, for example data from other statistical domains or mirror statistics.
In addition, data are validated by Eurostat before any dissemination to users. This concern mainly controls of data validity. Further controls of data credibility and completeness are done for data already uploaded in Eurostat database, on the basis of internal studies or user feedback. It should be kept in mind that, as basic data consists of millions of detailed trade declarations each month, it is difficult to reach complete accuracy for the published statistics. As in all statistical work, a balance has to be struck between the resources devoted to checking and the likely benefits. Therefore the users should be aware of the margin of inaccuracies in the data used, at least concerning the most detailed level of data. This is particularly emphasized in the intra-EU trade statistics where smallest traders are exempted from filling Intrastat declarations on their monthly trade (see section 9.2 for more details).
4 Timeliness and Punctuality ESS definition The timeliness of statistical outputs is the length of time between the event or phenomenon they describe and their availability. Punctuality is the time lag between the release date of data and the target date on which they were scheduled for release as announced in an official release calendar, laid down by Regulations or previously agreed among partners. First results (including estimates) on Euro area and EU trade balances are published around 46 days after the reference month in the international trade Euro-indicators news release. The latest supplied detailed data (including revisions) are published at the date of the monthly press release. Short term indicators are also updated on a monthly basis at the date of the press release. They include in particular all data published in the Euro-indicators news release. Long term indicators are updated generally once a year when final data are available for the last reference year. According to the Intrastat legislation, Member States should provide Eurostat with intra-EU aggregated statistics within 40 days after the reference month and with intra-EU detailed statistics within 70 days. According to the Extrastat legislation and up to 2009, Member States should have provided Eurostat with extra-EU aggregated statistics within 40 days after the reference month and with extra-EU detailed

4 Timeliness and Punctuality
19Quality Report on International Trade in Goods Statistics
statistics within 42 days. From 2010 onwards, only extra-EU detailed statistics still need to be provided but within 40 days. Table 11 shows how many times (out of the 12 months of the year 2009) intra- and extra-EU trade data were delivered late and what the average delay of these late deliveries was. This indicator is based on the dates when the first version of each monthly data is sent to Eurostat.
Table 11: Punctuality of detailed and aggregated data
Reference Year: 2009
MEMBER STATES
Aggregated data Detailed data
Intra- and extra-EU trade Intra-EU trade Extra-EU trade
Number of delayed data
deliveries
Average delay
Number of delayed data
deliveries
Average delay
Number of delayed data
deliveries
Average delay
Belgium 1 2 day(s) 1 3 day(s) 4 30 day(s) Bulgaria 1 1 day(s)
Czech Republic
Denmark
Germany 4 2 day(s)
Estonia
Ireland
Greece 2 4 day(s)
Spain 1 1 day(s)
France
Italy 1 9 day(s) 2 1 day(s) 1 1 day(s)
Cyprus 1 1 day(s)
Latvia 1 1 day(s) 1 1 day(s)
Lithuania 1 9 day(s) 1 7 day(s)
Luxembourg 1 1 day(s) 3 3 day(s)
Hungary
Malta 1 1 day(s) 1 1 day(s)
Netherlands
Austria
Poland 1 1 day(s)
Portugal
Romania
Slovenia 1 1 day(s)
Slovakia 1 1 day(s)
Finland
Sweden
United Kingdom 1 1 day(s)

6 Coherence and Comparability
20Quality Report on International Trade in Goods Statistics
5 Accessibility and Clarity ESS definitions The accessibility of statistical outputs is the measure of the ease with which users can obtain the data. It is determined by the physical conditions by means of which users obtain data: where to go, how to order, delivery time, pricing policy, marketing conditions (copyright, etc.), availability of micro or macro data, various formats (paper, files, CD-ROM, Internet, etc.). The clarity of statistical outputs is the measure of the ease with which users can understand the data. It is determined by the information environment within which the data are presented , whether the data are accompanied with appropriate metadata, whether use is made of illustrations such as graphs and maps, whether information on data accuracy are available (including any limitations on use) and the extent to which additional assistance is provided by the producer. All the different dissemination channels are used in dissemination: electronic and paper publications, predefined tables, databases, DVDs and FTP addresses for bulk download. Data are disseminated simultaneously and free of charges to all interested parties through Eurostat's website. The dissemination of the international trade in goods statistics is supported by a complete set of structural metadata making possible to easily identify, retrieve and browse the data. The reference metadata describing the contents and the data quality are as well exhaustive. User support is ensured by the Eurostat help desk.
6 Coherence and Comparability ESS definitions The coherence of two or more statistical outputs refers to the degree to which the statistical processes by which they were generated used the same concepts – classifications, definitions and target populations – and harmonised methods. Coherent statistical outputs have the potential to validly combined and used jointly. Examples of joint use are where the statistical outputs refer to the same population, reference period and region but comprise different sets of data items (say, employment data and production data) or where they comprise the same data items (say, employment data) but for different reference periods, regions or domains. Comparability is a special case of coherence and refers to the latter example above where the statistical outputs refer to the same data items and the aim of combining them is to make comparisons over time, or across regions, or across other domains.
6.1 Comparability over space
6.1.2 Community figures versus national figures EU legislation serves as a basis for compiling the intra- and extra-EU trade statistics published by Eurostat. However, Community statistics, which cover the EU as a whole, and the statistics published by the Member States, are not always directly comparable. Member States may use a different concept at national level but they have to provide Eurostat with harmonised data according to the Community concept. The most common differences between the Community concept and the national concepts are as follows:

6 Coherence and Comparability
21Quality Report on International Trade in Goods Statistics
• Use of the general trade system at national level while the Community statistics are compiled according to the special trade system
• Exclusion of the "quasi-transit" from the national statistics - The "quasi-transit" relates to:
o goods imported from a non-EU country, cleared through Customs and immediately dispatched to another Member State, which is the Member State of final destination;
o or to goods imported from another Member State, which is the Member State of actual export, cleared through Customs and immediately dispatched to a non-EU country.
The Customs formalities make the difference between a simple transit and a quasi-transit. The simple transit shall not be recorded in Community statistics while the quasi-transit shall be.
• Inclusion of repairs in the national statistics - Repairs are nowadays excluded from the scope of Community statistics but may be included in national statistics.
• Country of origin versus Member State of consignment – For intra-EU imports, the partner country shall be the Member State of consignment for Community statistics but may be the country of origin for national statistics.
Table 12 shows the conceptual differences between Community statistics and national statistics for each Member State.
Table 12: Conceptual differences between Community statistics and national statistics Reference Year: 2009
MEMBER STATES
General Trade
System
Exclusion of quasi transit
Inclusion of repairs
Country of origin Other
Belgium * * Bulgaria * * Czech Republic * Denmark * * Germany * * Estonia Ireland * * * Greece * Spain * * * France * * Italy Cyprus * Latvia * Lithuania Luxembourg * * Hungary * * Malta * * * Netherlands * Austria * * * Poland * * Portugal * * Romania Slovenia * Slovakia * * * Finland * Sweden United Kingdom * * *

6 Coherence and Comparability
22Quality Report on International Trade in Goods Statistics
Notes:
Belgium: Returned goods are excluded from national statistics
Germany: additional statistical procedures included in national statistics
Spain: Ceuta and Melilla are included in national statistics France: Goods delivered to vessels and aircrafts are excluded from national statistics
Hungary: Extra-EU imports at national level are by country of consignment
Austria: Goods covered by SASP (Single Authorisation for Simplified Procedures) are included in national statistics
Slovakia: Imports are published at FOB basis United Kingdom: Extra-EU imports at national level are by country of consignment
6.1.1 Asymmetries in extra-EU trade statistics There are two main approaches used for the measurement of international trade in goods, the general trade system and the special trade system.
For EU ITGS, the special trade system is applied, which means that goods from a non-EU country which are received into customs warehouses are not recorded in statistics unless they subsequently go into free circulation in the Member State of receipt (or are placed under the customs procedures for inward processing). Similarly, outgoing goods from customs warehouses are not recorded as exports. The general trade system, which is applied by most of the EU main partner countries, is a wider concept since it includes all goods entering or leaving the country.
It should be noted that intra-EU trade statistics do not have a direct link to customs procedures, thus they are not compiled on a general or special trade basis.
A comparison of the statistics on extra-EU trade with the figures published by non-EU countries for the same trade flows shows inevitably some discrepancies. Besides the trade system and errors such as product or partner misclassifications, the most common reasons for asymmetries are:
• Methodological differences: trade coverage, definition of partner country, definition of statistical territory, different valuations principles;
• Time lag: the same operation is recorded under a different reference period; • Statistical confidentiality: the goods movement is made confidential by one of the partners; • Different practices in the treatment of revisions; • Problems of currency conversion. Table 13 shows the mirror discrepancies in EU27 trade with its top-10 trading partners.
Table 13: Extra-EU asymmetries (in %)
Reference Year: 2009
Partner countries EU27 imports* EU27 exports**
USA -4.4 % -1.3 % China 23.2 % -10.8 % Russia 22.5 % 23.0 % Switzerland -0.4 % 1.5 % Norway 5.1 % 12.9 % Japan 9.4 % -16.5 % Turkey 7.2 % 8.3 % South Korea -3.6 % -6.9 % Brazil 5.3 % -4.9 % India 1.6 % 3.5 % *: (EU imports – Mirror exports) / Mirror flows average
**: (EU exports – Mirror imports) / Mirror flows average

6 Coherence and Comparability
23Quality Report on International Trade in Goods Statistics
6.1.3 Asymmetries in intra-EU trade statistics In theory, intra-EU trade statistics based upon Community concept should be fully comparable; therefore data should generally be less affected by asymmetries than extra-EU trade statistics. Dispatches from Member State A to Member State B, as reported by A, should be almost equal to arrivals into B from A, as reported by B. Due to a different valuation principle (CIF > FOB), arrivals should be slightly higher than dispatches. However, since the Intrastat system came into operation, bilateral comparisons have revealed major and persistent discrepancies in the intra-EU trade statistics. Therefore, comparisons dealing with intra-EU trade statistics have to be made cautiously and should take into account the existence of these discrepancies. The main reasons for the discrepancies are known and are partly same as for extra-EU trade. There are also reasons which are typical for intra-EU trade such as the adjustments for non-collected data or triangular trade. The following Table 14 reports the intra-EU asymmetries at global level and by Member States, calculated using trade in value. It is evident that the impact is very different among the Member States. Many Member States regularly carry out bilateral studies to find out at detailed product level where the problems are and to resolve them. However, remedies are not easily found despite all the analyses done.
Table 14: Intra-EU asymmetries (in %)
Reference Year: 2009
MEMBER STATES Arrivals* Dispatches**
Belgium 5.9 % 7.1 % Bulgaria 3.4 % 8.0 % Czech Republic 1.9 % 3.1 % Denmark 2.7 % 7.1 % Germany -2.3 % 2.5 % Estonia 0.0 % 6.6 % Ireland -7.6 % -12.9 % Greece -5.8 % -0.2 % Spain -2.8 % 4.3 % France -5.1 % 1.6 % Italy -3.9 % 4.2 % Cyprus -25.1 % -84.5 % Latvia 4.4 % -9.7 % Lithuania 9.1 % 12.0 % Luxembourg -3.3 % 10.3 % Hungary 4.6 % 8.8 % Malta -21.0 % -49.9 % Netherlands -2.9 % 7.6 % Austria -1.9 % 3.7 % Poland -5.8 % 7.6 % Portugal 2.7 % 6.3 % Romania 5.0 % 11.2 % Slovenia 3.7 % 17.8 % Slovakia 4.1 % 10.7 % Finland -0.7 % -5.7 % Sweden -3.4 % -3.2 % United Kingdom -10.7 % -2.8 % EU-27 -3.1 % 3.1 % *: (Arrivals – Mirror dispatches) / Mirror flows average / **: (Dispatches – Mirror arrivals) / Mirror flows average

6 Coherence and Comparability
24Quality Report on International Trade in Goods Statistics
6.2 Comparability over time Comparability over time is another important aspect of quality. Changes due to definitions, coverage or methods and other changes will have an impact on the continuity of trade series. The most important methodological changes or other events affecting the international trade in goods statistics during the last few years are listed in the following table.
Table 15: Changes affecting comparability over time
Year Event Quality dimensions affected
2009 Revised Intrastat legislation enters into force – For the arrivals, minimum coverage from collected data reduces from 97 % to 95 % of the total value.
Accuracy, comparability
2007
EU enlargement (accession of Bulgaria and Romania) Relevance, accuracy, comparability
Revision of the Harmonized System Relevance, comparability
2006 Repairs excluded from the scope of Extrastat Relevance, comparability
Collection of net mass in Intrastat no longer mandatory if supplementary unit is collected Accuracy, comparability
2005
Repairs excluded from the scope of Intrastat Relevance, comparability
Revised Intrastat legislation enters into force Relevance, accuracy, timeliness, clarity, comparability
2004 EU enlargement (accession of Czech Republic, Estonia, Cyprus, Latvia, Lithuania, Hungary, Malta, Poland, Slovenia and Slovakia)
Relevance, accuracy, comparability
A particular issue of comparability over time concerns the product classifications. The most detailed statistics are collected and published by 8-digit codes of the Combined Nomenclature (CN). Some changes are made to the Combined Nomenclature every year. Eurostat maintains conversion tables between the CN versions of successive years in order to improve comparison over time. Table 16 gives an overview on the evolution of the CN8 codes over the last years.
Table 16: Evolution of CN8 codes over time
Year Creations Deletions Total Evolution CN Codes
2009 127 257 384 -130 9 569 2008 75 96 171 -21 9 699 2007 917 1039 1956 -122 9 720
2006 486 740 1226 -254 9 842
2005 97 175 272 -78 10 096
2004 273 503 776 -230 10 174
2003 19 15 34 4 10 404
2002 780 654 1434 126 10 400
2001 50 90 140 -40 10 274
The impact of the different methodological and practical changes that have occurred in recent years is difficult to assess precisely. Nevertheless, it can be concluded that a change from an administrative data source (Extrastat) to a purely statistical data collection system (Intrastat) means normally a major break in the trade statistics time series.

6 Coherence and Comparability
25Quality Report on International Trade in Goods Statistics
6.3 Coherence with other statistics Apart from the international trade in goods statistics, information on trade flows can be found in National Accounts, Business Statistics and Balance of Payments. The compilation of the data and the production of the above mentioned statistics follow the recommendations (sources and methods) of different international organisations, i.e. Eurostat, International Monetary Fund, United Nations, etc. Table 17 gives an overall idea of the main differences between these sources.
Table 17: Coherence across domains
International
Trade Statistics
National Accounts Balance of Payments Business Statistics
Concepts & Definitions
Community definition
Aggregation of national statistics based on ESA 95. However, account of the rest of the world is based on national definition.
Aggregation of national statistics based upon IMF 5th manual. It implies some methodological discrepancies (FOB/FOB, difference of coverage). BoP statistics in Member States are most of the time derived from Member States’ ITGS. BoP statistics sent to Eurostat are compiled according to the Community concept.
Statistics are based on activity sector
Statistical unit/ object/ population
Cross-border movement of goods
International transaction with change of ownership
Enterprise, local unit
Classifications (nomenclature)
Combined Nomenclature (CN)
Institutional sectors IMF classification NACE
Geographical breakdown
Detailed geographical breakdown
Intra-EU, Extra-EU, World
Detailed geographical breakdown All partners
Reference period
Monthly Annual Quarterly Annual
Correction methods
National corrections
National corrections National corrections National corrections
6.4 Internal coherence
A key feature of the EU ITGS is their coherence. Aggregated data are constructed from detailed data over Member States and over different product classifications with the help of official correspondence tables. This ensures internal coherence. In addition, Eurostat calculates derived indicators such as unit value indices or seasonally adjusted series from the detailed data provided by Member States in order to maintain coherence.

9 Performance, Cost and Respondent burden
26Quality Report on International Trade in Goods Statistics
7 Trade-offs between Output Quality Components
ESS Handbook for Quality Reports: Output quality components are not mutually exclusive in the sense that there are relationships between the factors that contribute to them. There are cases where the factors leading to improvements with to one component result in deterioration with respect to another. As there are a number of quality components, including some with subcomponents, the number possible pairs of trade-offs is considerable. However, not all of them are relevant for international trade in goods statistics. Some of the most significant trade-offs are considered below: Trade-off between Relevance and Comparability over time The most important methodological changes over time during the last few years are documented in section 6.2. Some changes, such as exclusion of repairs from the scope of statistics, were made in order to improve the relevance of statistics. In a similar manner, the product classifications are subject to regular revisions to ensure that they reflect changes in technology and in trade patterns as well as in user needs. Consequently, comparability over time is affected. Trade-off between Accuracy and Timeliness Trade statistics consist of huge volume of detailed declarations collected in two different systems: Intrastat and Extrastat. As the delay to transmit detailed intra-EU trade data is considerable longer in comparison to detailed extra-EU trade data, aggregated data must be reported in 40 days order to meet the macro-economic needs. Trade-off between Accuracy and Respondent Burden Although respondent burden is not an output quality component as such, it forms an important trade-off with accuracy. Intrastat system is built in such way that smallest traders are exempted from statistical reporting (see section 9.2). Less data are consequently collected, which affects the accuracy of the detailed statistics.
8 Assessment of User Needs and Perceptions ESS Quality Declaration: User Focus We provide our users with products and services that meet their needs. The articulated and non-articulated needs, demands and expectations of external and internal users will guide the ESS, its members, their employees and operations. User needs are regularly monitored. At the EU level, there are regular contacts with key institutional users (Commission services and the European Central Bank) as well as with other main user groups such as trade associations. In daily work, users can easily communicate their requests and needs by using tools directly integrated to dissemination. The requests are further managed by Eurostat helpdesk. Annually, there are almost one million extractions of trade in goods data, more than 11 000 public registered users and 2500 queries.

9 Performance, Cost and Respondent burden
27Quality Report on International Trade in Goods Statistics
The previous large-scale user satisfaction survey on various aspects related to data was undertaken by Eurostat in 2007. The outcome of study was that satisfaction level was very high among users: 85 % of the users were very or fairly satisfied with the data they currently use. Many Member States undertake also user satisfaction surveys regularly. Recently, the most urgent user needs have concerned incomplete information on net mass (see section 3.2.2) and statistics on enterprises involved in international trade in goods, particularly on small- and medium-sized enterprises. Concerning the former, provisions in force since 2010 foresee the use of estimates if net mass is not collected directly from the PSIs. Concerning the latter, statistics on trade by business characteristics are disseminated from reference year 2005 onwards.
9 Performance, Cost and Respondent burden European Statistics Code of Practice Principle 9: Resources must be effectively used. Principle 10: Respondent burden should be proportional to the needs of users and not excessive for respondents, Respondent burden should be measured and targets set for its reduction over time.
9.1 Performance and Cost In order to improve performance and to decrease costs caused by data collection and processing, the use of IT tools in data collection has been considered as a priority. Consequently, the share of paper declarations has decreased over time. Around 90 % of all Intrastat declarations are nowadays received in electronic formats. From July 2009 onwards, no more paper declarations are allowed for exports to non-EU countries. Furthermore, several actions have been undertaken to develop and promote common tools for data validation.
9.2 Respondent burden
In order to reduce the burden on enterprises, particularly small and medium sized ones, the Intrastat system is designed in a way that the intra-EU traders' workload varies according to the annual amount of trade in which they are engaged. To achieve this, Member States have to define each year thresholds for both arrivals and dispatches that exempt enterprises to provide statistical information or that limit the information collected. The thresholds are expressed in annual values of intra-EU trade. There are three types of thresholds:
• Exemption threshold. Enterprises below the exemption threshold do not have to declare their trade in goods. For defining the exemption threshold Member States have to ensure that at least 97 % (95 % for arrivals from 2009 onwards) of their trade value is covered.
• Simplification threshold. It allows enterprises, whose annual trade value is above the exemption threshold but below the simplification threshold, to provide only a limited set of data or use a simplified commodity code. The trade reported by these PSIs may cover for at most 6 % of the total trade. Currently four Member States apply the simplification threshold: France, Luxembourg, Portugal and Slovakia.
• Statistical value threshold. Member States may collect the statistical value but only from part of their enterprises. The statistical value threshold should be fixed in such a way that the statistical value is collected only from the biggest PSIs whose global share in total trade does not exceed 70 %.
Tables 18 to 20 show these thresholds in value and the share of beneficiary traders.

9 Performance, Cost and Respondent burden
28Quality Report on International Trade in Goods Statistics
Table 18: Intrastat exemption thresholds and share of beneficiary traders
Reference Year: 2009
MEMBER STATES
Exemption threshold in euro Share of traders exempted from statistical reporting
Arrivals Dispatches Arrivals Dispatches Total
Belgium 400 000 1 000 000 88 % 83 % 88 %
Bulgaria 127 823 204 517 54 % 73 % 77 %
Czech Republic 320 000 320 000 36 % 46 % 59 %
Denmark 560 000 733 000 78 % 72 % 77 %
Germany 400 000 400 000 92 % 84 % 90 %
Estonia 127 823 127 823 63 % 64 % 62 %
Ireland 191 000 635 000 77 % 83 % 77 %
Greece 100 000 75 000 : : :
Spain 250 000 250 000 88 % 84 % 88 %
France 150 000 150 000 77 % 62 % 75 %
Italy 180 000 250 000 81 % 67 % 76 %
Cyprus 55 000 55 000 37 % 64 % 36 %
Latvia 142 288 139 442 69 % 66 % 68 %
Lithuania 144 810 188 253 60 % 67 % 60 %
Luxembourg 150 000 150 000 77 % 72 % 76 %
Hungary 400 000 400 000 87 % 87 % 87 %
Malta 700 700 2 % 11 % 87 %
Netherlands 900 000 900 000 90 % 86 % 89 %
Austria 300 000 300 000 88 % 75 % 86 %
Poland 264 348 264 348 80 % 78 % 79 %
Portugal 400 000 550 000 91 % 86 % 89 %
Romania 82 749 248 248 73 % 77 % 75 %
Slovenia 120 000 200 000 79 % 76 % 78 %
Slovakia 200 000 400 000 81 % 78 % 78 %
Finland 200 000 300 000 79 % 74 % 78 %
Sweden 450 000 450 000 81 % 80 % 81 %
United Kingdom 296 000 296 000 91 % 93 % 87 %
: Data not available
Table 19: Intrastat simplification thresholds and share of beneficiary PSIs
Reference Year: 2009
MEMBER STATES
Exemption threshold in euro Share of PSIs allowed to make Intrastat simplified declarations
Arrivals Dispatches Arrivals Dispatches Total
France 230 000 460 000 24 % 40 % 35 %
Luxembourg 375 000 375 000 35 % 30 % 34 %
Portugal 550 000 750 000 14 % 18 % 17 %
Slovakia 800 000 2 000 000 62 % 67 % 71 %

9 Performance, Cost and Respondent burden
29Quality Report on International Trade in Goods Statistics
Table 20: Intrastat statistical value thresholds and share of beneficiary PSIs
Reference Year: 2009
MEMBER STATES
Statistical value threshold in euro
Share of PSIs exempted from statistical value reporting
Arrivals Dispatches Arrivals Dispatches Total
Belgium All PSI exempted 100 % 100 % 100 %
Bulgaria 2 045 000 4 090 000 85 % 87 % 85 %
Czech Republic All PSI exempted 100 % 100 % 100 %
Denmark All PSI exempted 100 % 100 % 100 %
Germany 30 000 000 42 000 000 96 % 97 % 95 %
Estonia 2 940 000 3 643 000 90 % 90 % 89 %
Ireland 5 000 000 34 000 000 : : :
Greece No exemption 0 % 0 % 0 %
Spain 6 000 000 6 000 000 96 % 91 % :
France All PSI exempted 100 % 100 % 100 %
Italy 20 000 000 20 000 000 : : :
Cyprus 1 500 000 1 200 000 93 % 86 % 82 %
Latvia 2 290 837 3 272 624 87 % 90 % 88 %
Lithuania 2 896 200 7 240 500 87 % 93 % 87 %
Luxembourg 2 500 000 4 500 000 82 % 84 % 83 %
Hungary 14 000 000 48 000 000 91 % 87 % 88 %
Malta No exemption 0 % 0 % 0 %
Netherlands All PSI exempted 100 % 100 % 100 %
Austria 6 500 000 6 500 000 88 % 85 % 87 %
Poland 8 723 000 15 861 000 92 % 95 % 89 %
Portugal 6 000 000 9 000 000 90 % 90 % 91 %
Romania 2 758 000 5 517 000 89 % 85 % 88 %
Slovenia 4 000 000 9 000 000 92 % 91 % 92 %
Slovakia All PSI exempted 100 % 100 % 100 %
Finland 10 900 000 55 000 000 94 % 97 % 94 %
Sweden All PSI exempted 100 % 100 % 100 %
United Kingdom All PSI exempted 100 % 100 % 100 %
: Data not available
In addition to thresholds in value, Member States may apply other simplification measures. These include for instance optional collection of net mass for CN8 codes with a supplementary unit or the use of simplified reporting for specific products such as industrial plants or parts of motor vehicles.

9 Performance, Cost and Respondent burden
30Quality Report on International Trade in Goods Statistics
Extra-EU trade statistics cover all commercial transactions reported to the Customs. However, it is allowed not to process in details transactions whose value and net mass are lower than the statistical threshold. This threshold is fixed at maximum 1000 euros and 1000 kilograms.
Table 21: Extrastat statistical thresholds
Reference Year: 2009
MEMBER STATES Extrastat statistical threshold
Belgium No threshold
Bulgaria 100 €
Czech Republic No threshold
Denmark Threshold
Germany 1000 € or 1000 kg
Estonia No threshold
Ireland No threshold
Greece No threshold
Spain No threshold
France 1000 € or 1000 kg
Italy 700 € (chapters 1-14), 1000 € (chapters 15-97)
Cyprus No threshold
Latvia No threshold
Lithuania No threshold
Luxembourg No threshold
Hungary No threshold
Malta No threshold
Netherlands No threshold
Austria 1000 €
Poland No threshold
Portugal No threshold
Romania No threshold
Slovenia No threshold
Slovakia No threshold
Finland No threshold
Sweden No threshold
United Kingdom 1000 € or 1000 kg

Annex
31Quality Report on International Trade in Goods Statistics
10 Confidentiality, Transparency and Security European Statistics Code of Practice Principle5: The privacy of data providers (households, enterprises, administrations and other respondents), the confidentiality of the information they provide and its use only for statistical purposes must be absolutely guaranteed. Principle 6: Statistical authorities must produce and disseminate European statistics respecting scientific independence and in an objective, professional and transparent manner in which all users are treated equitably. In international trade in goods statistics the principle of “passive confidentiality” is applied, by which data can be suppressed only at the request of the enterprise who feels that its interests would be harmed by the dissemination of its data. Passive confidentiality is therefore different from “active confidentiality”, where the National Statistical Authority takes the initiative to suppress data automatically when the suppression criteria are met, without informing the enterprises concerned. The considerable amount of detail in trade data means that the potential for the creation of confidential data at detailed level is extremely high. Passive confidentiality allows minimising the loss of information at detailed level. The application of passive confidentiality is mentioned in both the Intrastat and Extrastat Regulations. These regulations also state that the real trade values should be disseminated to all users at least at chapter level, i.e. by 2-digit codes of the Combined Nomenclature except if the confidentiality is not thereby ensured. When receiving a request for confidentiality from an enterprise, the National Statistical Authority must decide whether or not the confidentiality should be granted. The national rules and practices vary between Member States from sophisticated decision making systems to case by case decisions made with common sense approach. Data transmission from Member States to Eurostat follows the principle of a Single Entry Point, endorsed by Statistical Program Committee. Data transmission takes place with the help of eDAMIS (electronic Data files Administration and Management Information System) which is an integrated environment of data transmission tools, allowing highly secure transmissions. At Eurostat, confidential data is stored in secure environments.

Annex 1
32Quality Report on International Trade in Goods Statistics
Annexes
Ana

Annex 1
33Quality Report on International Trade in Goods Statistics
Annex 1 - 2008 figures
Table 1: Share of collected data and adjustments for trade below the exemption threshold and non-response in intra-EU trade (share in total value), 2008
MEMBER STATES
Collected data Estimated data
Below the exemption threshold Non response
Arrivals Dispatches Arrivals Dispatches Arrivals Dispatches
Belgium 96.9 % 97.7 % 2.2 % 1.4 % 1.4 % 1.3 %
Bulgaria 97.6 % 98.8 % 1.5 % 0.8 % 0.9 % 0.4 %
Czech Republic 97.8 % 96.8 % 0.9 % 1.1 % 1.2 % 2.2 %
Denmark 85.5 % 91.4 % (*) 14.5 % (*) 8.6 %
Germany 95.9 % 98.0 % 2.4 % 1.4 % 1.6 % 0.6 %
Estonia 94.4 % 94.5 % 2.9 % 2.8 % 2.7 % 2.7 %
Ireland 96.3 % 98.4 % 2.8 % 1.4 % 0.9 % 0.3 %
Greece ** : :
Spain 97.8 % 98.1 % 1.6 % 1.2 % 0.6 % 0.7 %
France 99.6 % 99.6 % 0.4 % 0.4 %
Italy 97.4 % 97.7 % 2.6 % 2.3 %
Cyprus 99.0 % 98.2 % 1.0 % 1.8 % 0.0 % 0.0 %
Latvia 94.7 % 95.0 % 3.0 % 2.3 % 2.3 % 2.7 %
Lithuania 97.7 % 98.3 % 2.3 % 1.7 % 0.0 % 0.0 %
Luxembourg 98.2 % 98.6 % 1.8 % 1.3 % 0.0 % 0.1 %
Hungary 91.4 % 93.6 % 4.9 % 2.8 % 3.7 % 3.5 %
Malta ** 99.0 % 99.0 %
Netherlands 87.3 % 92.1 % (*) 12.7 % (*) 7.9 %
Austria 95.8 % 97.7 % 2.8 % 1.1 % 1.4 % 1.3 %
Poland 97.7 % 97.9 % 1.3 % 1.3 % 0.9 % 0.7 %
Portugal 93.2 % 95.6 % 2.0 % 2.6 % 4.7 % 1.8 %
Romania 96.6 % 97.7 % 2.1 % 1.5 % 1.4 % 0.8 %
Slovenia 97.7 % 98.6 % 2.3 % 1.4 % 0.0 % 0.0 %
Slovakia 93.9 % 95.2 % 3.6 % 3.1 % 2.5 % 1.7 %
Finland 96.2 % 98.3 % 3.6 % 1.7 % 0.2 % 0.0 %
Sweden 95.6 % 97.8 % 2.4 % 1.9 % 1.9 % 0.4 %
United Kingdom 95.7 % 96.8 % 2.4 % 2.8 % 1.9 % 0.4 %
Note: The share of estimated data refers to the share in the final figures transmitted to Eurostat. This share is usually larger in the intermediate data. : Data not available
*: Only total level of adjustments (no distinction into below the exemption threshold and non-response) is available in Eurostat or the figures provided by the given MS in the national quality report do not match with the data. **: No adjustment is compiled for trade below the exemption threshold and non response.

Annex 1
34Quality Report on International Trade in Goods Statistics
Table 3: Share of collected data and adjustments for trade below the statistical threshold and delayed or incomplete records in extra-EU trade (share in total value), 2008
MEMBER STATES
Collected data Estimated data
Standard category
Below the statistical threshold
Delayed or incomplete records
Imports Exports Imports Exports Imports Exports
Belgium 100.0 % 100.0 %
Bulgaria 100.0 % 100.0 %
Czech Republic 100.0 % 100.0 %
Denmark 100.0 % 99.8 % 0.0 % 0.0 % 0.2 %
Germany 99.8 % 99.7 % 0.2 % 0.3 %
Estonia 100.0 % 100.0 %
Ireland 100.0 % 99.9 % 0.0 % 0.1 %
Greece 100.0 % 100.0 %
Spain 100.0 % 100.0 %
France 99.4 % 99.4 % 0.6 % 0.6 %
Italy 99.7 % 99.2 % 0.3 % 0.8 %
Cyprus 100.0 % 100.0 %
Latvia 100.0 % 100.0 %
Lithuania 100.0 % 100.0 %
Luxembourg 100.0 % 100.0 %
Hungary 100.0 % 100.0 %
Malta 100.0 % 100.0 %
Netherlands 99.5 % 98.4 % 0.5 % 1.6 %
Austria 100.0 % 99.9 % 0.0 % 0.1 %
Poland 100.0 % 100.0 %
Portugal 100.0 % 100.0 %
Romania 100.0 % 100.0 %
Slovenia 99.9 % 99.9 % 0.1 % 0.1 %
Slovakia 100.0 % 100.0 %
Finland 100.0 % 100.0 %
Sweden 100.0 % 100.0 %
United Kingdom 98.8 % 99.4 % 1.2 % 0.6 %
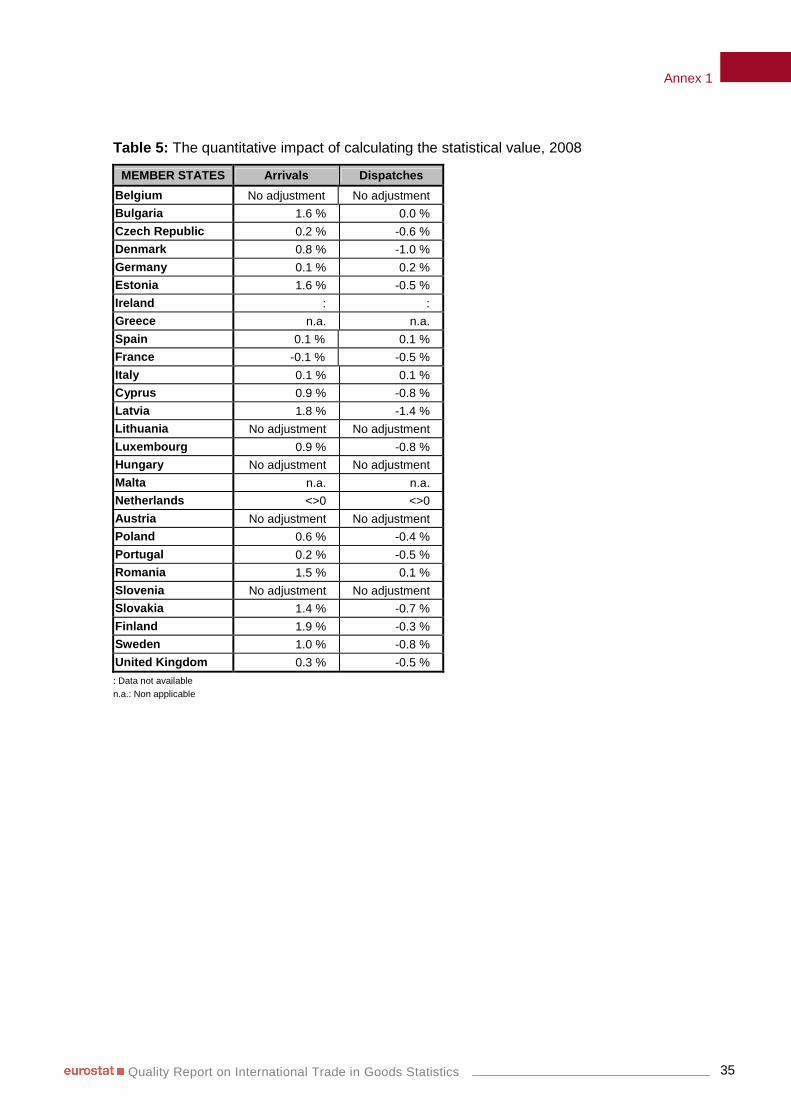
Annex 1
35Quality Report on International Trade in Goods Statistics
Table 5: The quantitative impact of calculating the statistical value, 2008
MEMBER STATES Arrivals Dispatches
Belgium No adjustment No adjustment
Bulgaria 1.6 % 0.0 %
Czech Republic 0.2 % -0.6 %
Denmark 0.8 % -1.0 %
Germany 0.1 % 0.2 %
Estonia 1.6 % -0.5 %
Ireland : :
Greece n.a. n.a.
Spain 0.1 % 0.1 %
France -0.1 % -0.5 %
Italy 0.1 % 0.1 %
Cyprus 0.9 % -0.8 %
Latvia 1.8 % -1.4 %
Lithuania No adjustment No adjustment
Luxembourg 0.9 % -0.8 %
Hungary No adjustment No adjustment
Malta n.a. n.a.
Netherlands <>0 <>0
Austria No adjustment No adjustment
Poland 0.6 % -0.4 %
Portugal 0.2 % -0.5 %
Romania 1.5 % 0.1 %
Slovenia No adjustment No adjustment
Slovakia 1.4 % -0.7 %
Finland 1.9 % -0.3 %
Sweden 1.0 % -0.8 %
United Kingdom 0.3 % -0.5 %
: Data not available n.a.: Non applicable

Annex 1
36Quality Report on International Trade in Goods Statistics
Table 7: Impact of revisions (in %) on intra-and extra-EU trade, 2008
MEMBER STATES
Intra-EU trade Extra-EU trade
Arrivals Dispatches Imports Exports
Belgium -2.7 % -1.9 % 4.4 % 12.9 % Bulgaria -0.6 % -0.7 % -1.3 % 0.0 %
Czech Republic 1.2 % 1.0 % 1.3 % 0.8 %
Denmark -3.5 % -0.5 % 3.2 % 1.0 %
Germany -2.6 % -1.6 % 0.4 % -0.1 %
Estonia 1.1 % 1.5 % -0.9 % 0.1 %
Ireland 1.6 % 0.5 % 1.6 % 3.8 %
Greece 4.5 % 7.2 % 44.0 % 0.7 %
Spain 10.2 % 7.3 % -0.2 % 1.2 %
France 2.3 % 3.2 % 0.2 % -0.7 %
Italy 2.4 % 1.5 % 0.0 % -0.1 %
Cyprus 1.8 % 5.6 % 2.9 % -1.5 %
Latvia 3.7 % 2.9 % 0.0 % 0.0 %
Lithuania 3.8 % 0.0 % 0.0 % 0.0 %
Luxembourg 3.8 % -0.5 % 6.6 % 14.6 %
Hungary 3.6 % 2.5 % 0.2 % -0.1 %
Malta 21.2 % 10.8 % 1.4 % 36.3 %
Netherlands -0.9 % 1.2 % 3.6 % -0.8 %
Austria 2.7 % 2.4 % 4.5 % 0.0 %
Poland 10.8 % 8.1 % -1.6 % -3.6 %
Portugal 9.4 % 4.3 % -0.3 % 0.3 %
Romania 5.1 % 2.2 % 0.2 % 0.1 %
Slovenia 1.4 % 0.2 % 1.1 % 0.2 %
Slovakia 2.8 % 0.4 % -0.3 % -0.1 %
Finland 5.3 % 0.6 % 0.7 % 1.7 %
Sweden 2.4 % 2.4 % 1.6 % 1.2 %
United Kingdom 1.9 % 2.0 % -1.7 % 0.1 %
EU-27 1.5 % 1.1 % 1.3 % 0.7 % -: First figure>Last figure
+: First figure<Last figure

Annex 1
37Quality Report on International Trade in Goods Statistics
Table 8: Impact of the confidentiality on intra- and extra-EU trade, 2008
MEMBER STATES
Intra-EU trade Extra-EU trade
Arrivals Dispatches Imports Exports
Number of CN8 codes
affected
Impact on
trade value (%)
Impact on net mass (%)
Number of CN8 codes
affected
Impact on
trade value (%)
Impact on net mass (%)
Number of CN8 codes
affected
Impact on trade
value (%)
Impact on net mass (%)
Number of CN8 codes
affected
Impact on
trade value (%)
Impact on net mass (%)
Belgium 40 0.7 % 0.5 % 131 1.9 % 2.9 % 43 2.2 % 1.3 % 126 3.2 % 3.9 %
Bulgaria
Czech Republic 586 0.1 % 0.1 % 233 0.6 % 0.3 % 348 0.4 % 0.1 % 213 0.9 % 0.5 %
Denmark 36 0.7 % 1.6 % 95 9.5 % 5.5 % 32 3.7 % 1.5 % 95 10.8 % 12.7 %
Germany 48 2.1 % 6.0 % 396 3.3 % 7.1 % 69 7.7 % 24.4 % 385 3.4 % 9.6 %
Estonia
Ireland 14 0.0 % 0.0 % 6 0.0 % 0.4 %
Greece 12 0.2 % 0.0 % 12 2.9 % 0.7 % 11 0.0 % 0.0 % 12 1.5 % 0.4 %
Spain 40 0.2 % 0.3 % 22 0.3 % 0.7 % 33 0.3 % 0.2 % 38 1.3 % 1.1 %
France 10 0.0 % 0.0 % 300 2.6 % 4.4 % 10 0.1 % 5.4 % 273 2.0 % 4.2 %
Italy 28 1.8 % 0.2 % 112 0.7 % 1.2 % 25 11.3 % 18.5 % 105 0.6 % 1.1 %
Cyprus 1 0.4 % 0.0 % 1 0.4 % 0.0 %
Latvia
Lithuania
Luxembourg 3 4.4 % 0.0 % 7 1.1 % 1.5 % 1 1.3 % 1.4 % 5 1.9 % 0.1 %
Hungary 1 604 2.6 % 5.7 % 2 003 5.5 % 15.6 % 640 15.2 % 37.2 % 1 614 5.2 % 16.3 %
Malta
Netherlands 206 4.7 % 1.0 % 489 8.2 % 1.8 % 277 5.8 % 0.9 % 835 6.2 % 2.8 %
Austria 96 2.1 % 7.5 % 260 6.8 % 12.3 % 83 12.0 % 43.8 % 259 6.9 % 6.3 %
Poland 1 0.0 % 0.0 %
Portugal 1 317 0.3 % 0.7 % 523 2.6 % 4.2 % 1 457 1.6 % 0.9 % 1 097 4.2 % 4.6 %
Romania 85 0.2 % 0.0 % 49 0.2 % 0.0 % 74 0.2 % 0.0 % 42 0.5 % 0.0 %
Slovenia 25 0.1 % 0.0 % 10 0.0 % 0.1 % 23 0.1 % 0.0 % 20 0.2 % 0.8 %
Slovakia 1 031 0.2 % 1 624 1.7 % 88 0.1 % 359 0.3 %
Finland 76 1.2 % 10.1 % 138 7.2 % 14.8 % 65 6.2 % 11.0 % 129 6.6 % 14.4 %
Sweden 18 0.1 % 0.1 % 83 3.3 % 1.3 % 15 0.6 % 1.0 % 83 5.3 % 2.5 %
United Kingdom 25 0.2 % 1.9 % 79 1.8 % 2.0 % 42 0.8 % 0.6 % 78 1.4 % 1.8 %

Annex 1
38Quality Report on International Trade in Goods Statistics
Table 9: Impact of different type of confidentiality on intra- and extra-EU trade (share of total value), 2008
MEMBER STATES
Intra-EU trade (%) Extra-EU trade (%)
Arrivals Dispatches Imports Exports Secret
product Secret partner
Product and
partner
Secret product
Secret partner
Product and
partner
Secret product
Secret partner
Product and
partner
Secret product
Secret partner
Product and
partner Belgium 0.7 % 1.9 % 2.1 % 0.0 % 2.9 % 0.3 %
Bulgaria
Czech Republic 0.1 % 0.0 % 0.6 % 0.0 % 0.3 % 0.0 % 0.6 % 0.3 %
Denmark 0.3 % 0.4 % 5.0 % 4.5 % 3.4 % 0.3 % 2.7 % 8.1 %
Germany 0.1 % 2.0 % 2.4 % 0.9 % 0.1 % 0.0 % 7.7 % 3.2 % 0.3 %
Estonia
Ireland 0.0 % 0.0 %
Greece 0.2 % 2.9 % 0.0 % 1.5 %
Spain 0.2 % 0.3 % 0.3 % 1.3 %
France 0.0 % 0.0 % 0.0 % 2.6 % 0.0 % 0.0 % 0.0 % 2.0 %
Italy 1.8 % 0.7 % 11.3 % 0.6 %
Cyprus 0.4 % 0.4 %
Latvia
Lithuania
Luxembourg 4.4 % 1.1 % 1.3 % 1.9 %
Hungary 2.6 % 5.5 % 15.2 % 5.2 %
Malta
Netherlands 1.0 % 0.3 % 3.5 % 1.0 % 0.4 % 6.9 % 0.2 % 0.6 % 5.0 % 1.3 % 0.7 % 4.2 %
Austria 0.5 % 1.6 % 2.9 % 3.9 % 1.3 % 10.7 % 4.4 % 2.5 %
Poland 0.0 %
Portugal 0.2 % 0.2 % 1.2 % 1.4 % 0.3 % 1.3 % 0.8 % 3.4 %
Romania 0.2 % 0.2 % 0.2 % 0.5 %
Slovenia 0.1 % 0.0 % 0.1 % 0.2 %
Slovakia 0.2 % 1.7 % 0.1 % 0.0 % 0.3 %
Finland 0.5 % 0.8 % 1.9 % 5.3 % 0.1 % 6.1 % 2.0 % 4.6 %
Sweden 0.1 % 3.3 % 0.6 % 5.3 % United Kingdom 0.1 % 0.2 % 1.1 % 0.8 % 0.3 % 0.5 % 0.6 % 0.8 %

Annex 1
39Quality Report on International Trade in Goods Statistics
Table 10: Number of CN8 codes affected according to the type of confidentiality, 2008
MEMBER STATES
Intra-EU trade (%) Extra-EU trade (%)
Arrivals Dispatches Imports Exports Secret
product Secret partner
Product and
partner
Secret product
Secret partner
Product and
partner
Secret product
Secret partner
Product and
partner
Secret product
Secret partner
Product and
partner Belgium 40 131 32 11 116 10
Bulgaria
Czech Republic 578 8 225 8 340 8 204 9
Denmark 21 15 53 42 17 15 52 43
Germany 21 27 367 29 22 7 40 368 17
Estonia
Ireland 14 6
Greece 12 12 11 12
Spain 40 22 33 38
France 8 2 6 294 8 2 5 268
Italy 28 112 25 105
Cyprus 1 1
Latvia
Lithuania
Luxembourg 3 7 1 5
Hungary 1 604 2 003 640 1 614
Malta
Netherlands 86 98 22 187 279 23 74 182 21 143 661 31
Austria 46 50 165 95 38 45 164 95
Poland 1
Portugal 743 574 250 273 543 914 236 861
Romania 85 49 74 42
Slovenia 25 10 23 20
Slovakia 1 031 1 624 87 1 359
Finland 38 38 12 126 36 29 12 117
Sweden 18 83 15 83 United Kingdom 12 13 61 18 13 29 50 28

Annex 1
40Quality Report on International Trade in Goods Statistics
Table 11: Transmission of detailed and aggregated results, 2008
MEMBER STATES
Aggregated data Detailed data
Intra- and extra-EU trade Intra-EU trade Extra-EU trade
Number of delayed
data deliveries
Average delay
in number of days
Number of delayed
data deliveries
Average delay
in number of days
Number of delayed
data deliveries
Average delay
in number of days
Belgium 1 1 days(s) 1 4 days(s) 2 2 days(s) Bulgaria 1 1 days(s)
Czech Republic
Denmark 1 4 days(s) 3 2 days(s) 2 2 days(s)
Germany
Estonia
Ireland 1 1 days(s)
Greece 1 1 days(s)
Spain 1 2 days(s)
France
Italy 1 3 days(s) 1 1 days(s) 1 1 days(s)
Cyprus
Latvia 1 2 days(s)
Lithuania
Luxembourg 1 3 days(s) 1 2 days(s) 1 1 days(s)
Hungary
Malta
Netherlands 1 3 days(s)
Austria
Poland 1 1 days(s)
Portugal
Romania 1 1 days(s)
Slovenia
Slovakia
Finland 1 4 days(s)
Sweden
United Kingdom

Annex 1
41Quality Report on International Trade in Goods Statistics
Table 12: Extra-EU asymmetries (in %), 2008
Partner countries EU27 imports* EU27 exports**
USA -4.2 -3.5 China 21.7 -14.4 Russia -0.6 28.0 Switzerland -3.9 -0.4 Norway -1.9 5.7 Japan -0.1 -13.0 Turkey 6.4 6.2 South Korea -0.7 -6.4 Brazil 11.8 -2.9 India 13.5 11.8 *: (EU imports – Mirror exports) / Mirror flows average
**: (EU exports – Mirror imports) / Mirror flows average

Annex 1
42Quality Report on International Trade in Goods Statistics
Table 14: Intra-EU27 asymmetries (in %), 2008
MEMBER STATES Arrivals* Dispatches**
Belgium 6.2 % 7.3 % Bulgaria 5.9 % 11.3 % Czech Republic 3.0 % 7.3 % Denmark 1.3 % 8.2 % Germany -3.3 % 0.3 % Estonia -0.6 % 9.8 % Ireland -8.8 % -7.9 % Greece -6.1 % 3.2 % Spain -2.9 % 0.7 % France -2.9 % 2.0 % Italy -3.9 % 4.1 % Cyprus -21.4 % -88.1 % Latvia -0.2 % -13.5 % Lithuania 8.8 % 6.3 % Luxembourg -3.4 % -11.9 % Hungary 1.1 % 8.5 % Malta -23.1 % -66.4 % Netherlands -3.7 % 9.0 % Austria -1.5 % 5.4 % Poland -2.9 % 7.6 % Portugal 5.7 % 9.2 % Romania 7.0 % 15.9 % Slovenia 2.8 % 14.4 % Slovakia 0.3 % 14.6 % Finland 0.4 % -6.5 % Sweden -1.3 % -4.6 % United Kingdom -10.1 % -4.5 % EU-27 -2.8 % 2.8 % *: (Arrivals – Mirror dispatches) / Mirror flows average
**: (Dispatches – Mirror arrivals) / Mirror flows average

Annex 1
43Quality Report on International Trade in Goods Statistics
Table 18: Intrastat exemptions thresholds in EUR and share of traders exempted from reporting, 2008
MEMBER STATES
Exemption threshold in value Share of traders exempted from reporting
Arrivals Dispatches Arrivals Dispatches Total
Belgium 400 000 1 000 000 92 % 89 % 92 %
Bulgaria 76 694 153 388 60 % 57 % 57 %
Czech Republic 65 000 130 000 67 % 74 % 90 %
Denmark 268 000 697 000 84 % 79 % 84 %
Germany 300 000 300 000 89 % 79 % 87 %
Estonia 127 823 127 823 65 % 65 % 63 %
Ireland 191 000 635 000 : : :
Greece 75 000 65 000 : : :
Spain 250 000 250 000 88 % 81 % 85 %
France 150 000 150 000 76 % 62 % 75 %
Italy 180 000 250 000 83 % 71 % :
Cyprus 45 000 45 000 49 % 59 % 52 %
Latvia 92 487 139 442 66 % 68 % 65 %
Lithuania 130 329 159 291 63 % 70 % 63 %
Luxembourg 150 000 150 000 91 % 89 % 89 %
Hungary 400 000 400 000 87 % 87 % 86 %
Malta 700 700 0 % 0 % 0 %
Netherlands 400 000 900 000 88 % 87 % 93 %
Austria 300 000 300 000 87 % 74 % 85 %
Poland 128 366 205 386 42 % 54 % 49 %
Portugal 100 000 230 000 91 % 87 % 90 %
Romania 89 643 268 930 74 % 80 % 76 %
Slovenia 85 000 200 000 76 % 75 % 75 %
Slovakia 132 749 265 498 78 % 78 % 78 %
Finland 200 000 300 000 74 % 72 % 74 %
Sweden 238 000 484 000 78 % 78 % 78 %
United Kingdom 385 000 385 000 81 % 80 % 86 %
: Data not available
Table 19: Intrastat simplification thresholds in EUR and share of beneficiary PSIs, 2008
MEMBER STATES
Exemption threshold in value Share of PSIs allowed to use Intrastat simplified declarations
Arrivals Dispatches Arrivals Dispatches Total
France 230 000 460 000 27 % 40 % 38 %
Luxembourg 375 000 375 000 34 % 26 % 33 %
Portugal 305 000 700 000 36 % 35 % 38 %
Slovakia 637 196 1 592 991 66 % 71 % 76 %

Annex 1
44Quality Report on International Trade in Goods Statistics
Table 20: Intrastat statistical value thresholds in EUR and share of beneficiary PSIs, 2008
MEMBER STATES
Statistical value threshold Percentage of PSIs exempted from the reporting of the statistical value
Arrivals Dispatches Arrivals Dispatches Total
Belgium All PSI exempted 100 % 100 % 100 %
Bulgaria 1 534 000 3 579 000 90 % 93 % 90 %
Czech Republic All PSI exempted 100 % 100 % 100 %
Denmark All PSI exempted 100 % 100 % 100 %
Germany 29 000 000 40 000 000 96 % 96 % 96 %
Estonia 3 068 000 3 643 000 89 % 90 % 88 %
Ireland 5 000 000 34 000 000 : : :
Greece No exemption 0 % 0 % 0 %
Spain 6 000 000 6 000 000 93 % 91 % 92 %
France All PSI exempted 100 % 100 % 100 %
Italy 20 000 000 20 000 000 99 % 97 % :
Cyprus 1 000 000 1 000 000 86 % 80 % 85 %
Latvia 2 290 837 3 130 336 90 % 89 % 89 %
Lithuania 2 606 580 5 502 780 86 % 91 % 86 %
Luxembourg 2 500 000 4 500 000 81 % 82 % 81 %
Hungary 10 000 000 40 000 000 90 % 86 % 87 %
Malta No exemption 0 % 0 % 0 %
Netherlands All PSI exempted 100 % 100 % 100 %
Austria 6 500 000 6 500 000 86 % 82 % 90 %
Poland 8 472 000 12 580 000 94 % 93 % 97 %
Portugal 5 830 000 8 100 000 95 % 93 % 94 %
Romania 2 988 000 5 976 000 88 % 85 % 88 %
Slovenia 3 000 000 9 000 000 89 % 89 % 89 %
Slovakia All PSI exempted 100 % 100 % 100 %
Finland 11 200 000 57 000 000 95 % 98 % 95 %
Sweden All PSI exempted 100 % 100 % 100 %
United Kingdom All PSI exempted 100 % 100 % 100 %
: Data not available
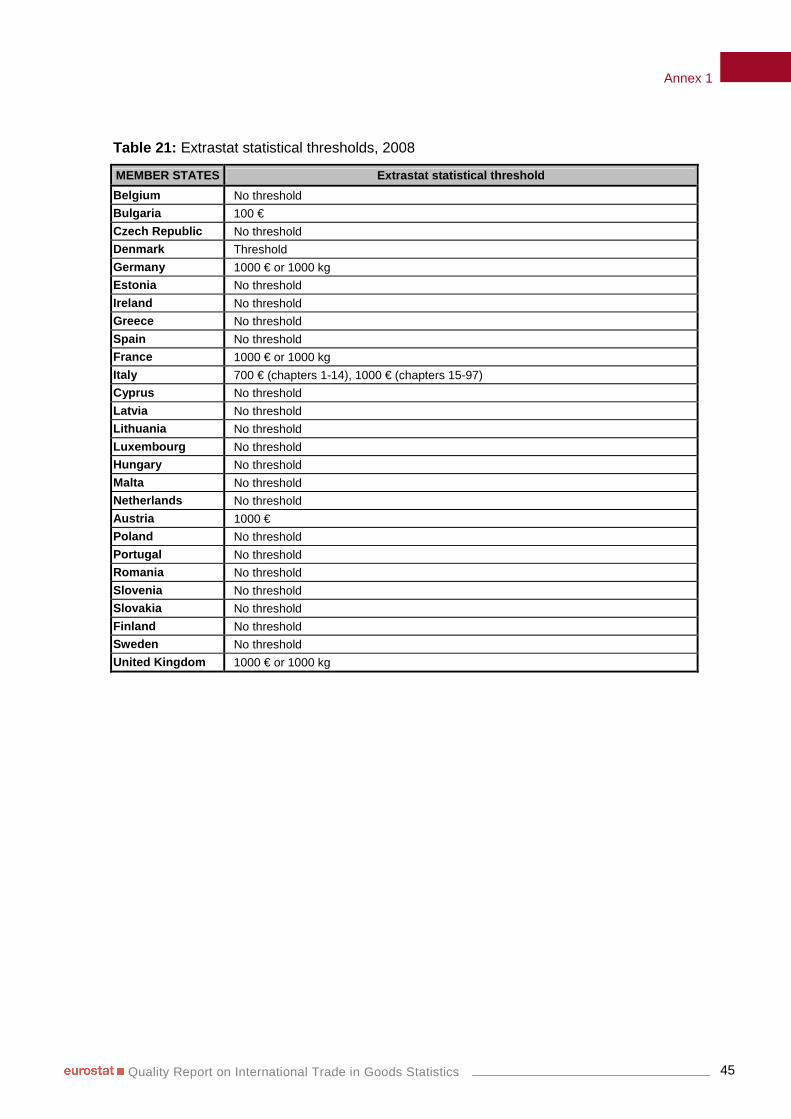
Annex 1
45Quality Report on International Trade in Goods Statistics
Table 21: Extrastat statistical thresholds, 2008
MEMBER STATES Extrastat statistical threshold
Belgium No threshold
Bulgaria 100 €
Czech Republic No threshold
Denmark Threshold
Germany 1000 € or 1000 kg
Estonia No threshold
Ireland No threshold
Greece No threshold
Spain No threshold
France 1000 € or 1000 kg
Italy 700 € (chapters 1-14), 1000 € (chapters 15-97)
Cyprus No threshold
Latvia No threshold
Lithuania No threshold
Luxembourg No threshold
Hungary No threshold
Malta No threshold
Netherlands No threshold
Austria 1000 €
Poland No threshold
Portugal No threshold
Romania No threshold
Slovenia No threshold
Slovakia No threshold
Finland No threshold
Sweden No threshold
United Kingdom 1000 € or 1000 kg

Annex 2
46Quality Report on International Trade in Goods Statistics
Annex 2 - Glossary
Arrivals Imports from another Member State – Arrivals refer to intra-EU imports.
Balance of Payments The term refers to the statistical system through which economic transactions occurring during specific time periods between an economy and the rest of the world can be summarised in a systematic way. The fifth edition of the IMF Balance of Payments Manual (BPM5) provides conceptual guidelines for compiling balance of payments statistics according to international standards.
Combined nomenclature (CN) A systematic list of goods descriptions based on the Harmonized System, serving for the purposes of the Common Customs Tariff, external trade statistics, and other Community policies (Art. 1 Reg. [EEC] No 2658/87, OJ 1987 No L 256, p.1)
Country of origin The country of origin means the country where the goods originate. Goods, which are wholly obtained or produced in a country, originate in that country. Goods, whose production involved more than one country, shall be deemed to originate in the country where they underwent their last, substantial, economically justified processing or they underwent processing resulting in the manufacture of a new product.
Customs declaration The act whereby a person indicates in the prescribed form and manner a wish to place goods under one of the customs procedures provided for by the Community Customs Code (Arts 4 (17), 59 - 78 CC)
Customs procedure The Community Customs Code provides for 8 customs procedures: release for free circulation, transit, customs warehousing, inward processing, processing under customs control, temporary importation, outward processing, and exportation (Art. 4 (16) CC)
Dispatches Exports to another Member State – Dispatches refer to intra-EU exports.
Exports Goods leaving the statistical territory of a country.
Goods All movable property, including electric current
Community goods (i) goods entirely obtained in the customs territory of the Community, without addition of goods from third countries or territories which are not part of the customs territory of the Community; (ii) goods from third countries or territories which are not part of the customs territory of the Community, which have been released for free circulation in a Member State; (iii) goods obtained in the customs territory of the Community either from the goods referred to exclusively in point (ii) or from the goods referred to in points (i) and (ii);
Imports Goods which add to the stock of material resources of a country by entering its economic territory.
National Statistical Authority (NSA)
Within the context of Extrastat and Intrastat Regulations means the national statistical institutes and other bodies responsible in each Member State for producing external trade statistic
Provider of Statistical Information (PSI)
Means any businesses, other ‘institutional’ bodies (such as public and non-profit institutions, schools, hospitals) and individual persons who are

Annex 2
47Quality Report on International Trade in Goods Statistics
providing statistical information.
Quantity of the goods The quantity of the goods can be expressed in two ways: (a) the net mass, which means the actual mass of the goods excluding all packaging; (b) the supplementary units, which mean the possible units measuring quantity other than net mass, as detailed in the annual Commission regulation updating the Combined Nomenclature.
Reference period The reference period is the calendar year and month in which the goods are imported or exported. When the customs declaration is the source for records on imports and exports, the reference period shall indicate the calendar year and month when the declaration is accepted by customs authorities.
Statistical value The statistical value is based on the value of the goods at the time and place the goods cross the border of the Member State of destination on import and of the Member State of actual export on export. Statistical value contains solely and entirely the costs of transport and insurance performed to deliver the goods from the place of their departure to the border of importing or exporting Member State.
VIES The VAT Information Exchange System (V.I.E.S.) enables: - companies to obtain rapidly confirmation of the VAT numbers of their intra-EU trading partners; - VAT administrations to monitor and control the flow of intra-Community trade to detect all kinds of irregularities.