wholesale, retail, and international trade indicators … · wholesale, retail, and international...
TRANSCRIPT

Wholesale, Retail, and International Trade Indicators in a Global Marketplace
October 28, 2015
1
John W. Sperry Survey Statistician Economic Indicators Division
Audio Dial In Number: 1-800-857-9792 Passcode: 7494611

John Sperry is a Survey Statistician with the International Trade Macro Analysis Branch. Since joining the Census Bureau in 2012, John has worked in wholesale and international trade indicator offices. He is currently working on multiple international trade projects, and enjoys teaching data users how to access trade data.
2

Prior Webinar Series Available at: www. census.gov/econ/webinar “Intro to Economic Indicators” Tab
3
Webinars Include:
• U.S. International Trade in Goods and Services (FT-900) • Advanced Monthly Sales for Retail and Food Services (MARTS) • New Residential Construction and Sales (NRC & NRS) • Monthly Wholesale Trade Survey (MWTS) • Quarterly Financial Report – Manufacturing, Mining, Wholesale Trade, and Selected Service
Industries (QFRM) & Retail Trade (QFRR) • Advance Report on Durable Goods Manufacturers' Shipments, Inventories, and Orders (AdvM3) &
Manufacturers' Shipments, Inventories, and Orders (M3) • Housing Vacancies and Homeownership (HVS) • Construction Put in Place (VIP)
• Quarterly Services Survey (QSS)

Webinar Overview
• Introduction • Identify & Review Trade Indicators • Link Trade Indicators with each other • Link Trade Indicators to other Federal data • Live Question and Answer session
4

Recession –The National Bureau of Economic Research (NBER) defines recession as "a period of falling economic activity spread across the economy, lasting more than a few months.“
Seasonal Adjustment – the process of estimating and removing seasonal effects from a time series in order to better reveal certain non-seasonal features.
• SA – Seasonally Adjusted • NSA – Not Seasonally Adjusted
Sampling Variability– statistics from the retail and wholesale sectors presented today are not depicted with associated levels of variability such as standard error.
Gross Domestic Product (GDP) – Measures the value of final goods and services produced in the United States in a given period of time.
North American Industry Classification System (NAICS) - The standard used by Federal statistical agencies in classifying business establishments for the purpose of collecting, analyzing, and publishing statistical data related to the U.S. business economy.
Definitions and Standards Used in the Webinar
5

Trade: What is it and why is it important? Defined:
6
• The act of buying or selling goods and services
Importance:
• Foundation of the economy • Measuring trade is a way to measure the
economy • By measuring trade we can:
• Assess impact of international trade and investment
• Analyze Balances of transactions between the U.S. and other regions / countries
• Enable businesses to assess their market size/market share

Trade: What is it and why is it important? How is trade changing?
7
• Faster • More complex • Widespread
How do we adapt to a changing global marketplace?
Create new indicators and enhance existing indicators • Quarterly Services Survey • Manufacturing and International Trade Report (MITR) • Advance Report: International Trade in Goods

Trade: What is it and why is it important? Who uses trade data?
8
• Government • Federal Reserve Board • Bureau of Economic Analysis
• Businesses • Academia • Trade Policy Officials
Economic Indicators Measuring Trade Include:
• International Trade in Goods and Services • Advance Trade in Goods
• Monthly Wholesale Trade Survey • Advance Monthly Sales for Retail and Food Services
• Monthly Sales for Retail and Food Services
• Manufacturing and Trade Inventories and Sales Report • Quarterly Services Survey

International Trade: Advance Goods & FT900
9
Methodology: census.gov/foreign-trade/guide/sec2.html Available: census.gov/foreign-trade/data/index.html
Advance Report: U.S. International Trade in Goods • New monthly report, released about a week before final FT900
• Goods data on only: Exports, Imports, Balance of Trade
FT900: Joint Release with Bureau of Economic Analysis (BEA) • Census – Goods Data (Customs documentation, Automated Export
System, Statistics Canada)
• BEA – Services Data (surveys, administrative data, industry reports, partner countries) and adjustments for balance of payments
• Monthly (34-36 days after the calendar month)
• Commodity, Country, and State level detail in NAICS, End-Use, and Harmonized System

Advance Goods and FT900: What Makes Them Important • Key component of GDP • Impact Trade Policy • Provide Target Markets
10
Source: U.S. Census Bureau, International Goods and Services Report, August 2015
Advance
Final
Source: U.S. Census Bureau, Advance International Goods Report, August 2015

Wholesale Trade: MWTS
Month-to-Month trends of Sales and Inventories of Wholesalers
• Historic data dating back to 1936
• Current time series on NAICS back to 1992
• Released approximately 40 calendar days after reference month
• Sales, Inventories, Inventories/Sales ratios, and standard errors
Monthly Wholesale Trade Survey (NAICS 42)
• Excludes manufacturers' sales branches and offices (MSBOs) and agents and brokers.
• Industry examples include:
• Motor Vehicle and Motor Vehicle Parts and Supplies Merchant Wholesalers
• Farm Product Raw Material Merchant Wholesalers
• Petroleum and Petroleum Products Merchant Wholesalers
11
Methodology: census.gov/wholesale/www/how_surveys_are_collected/monthly_methodology.html Available: census.gov/wholesale/index.html

MWTS: Importance • Input to GDP
• Provides only available government measure of monthly estimates of wholesale trade activity
12
1.20
1.30
1.40
1.50
1.60
1992 1994 1996 1998 2000 2002 2004 2006 2008 2010 2012 2014
Wholesale Inventories to Sales Ratio January 1992 - June 2015, Seasonally Adjusted
Recession
SA, Wholesale Inventories to Sales Ratio
Source: U.S. Census Bureau, MWTS

Retail Trade: MARTS & MRTS
Month-to-Month change in Sales for Retail and Food Services
• MARTS: monthly about 14 calendar days after reference month
• MRTS: monthly about 44 calendar days after reference month
• Advance Retail Sales estimates for reporting month
• Preliminary Sales data for previous month
Industry Coverage • Retail and Food Services Companies (NAICS Sector 44-45 &
Subsector 722). For example:
• Motor Vehicle and Part Dealers
• Gasoline Stations
• Clothing and Clothing Accessories Stores
13
MRTS Methodology: census.gov/retail/mrts/how_surveys_are_collected.html MARTS Methodology: census.gov/retail/marts/how_surveys_are_collected.html Available: census.gov/retail/index.html

MARTS & MRTS: Importance • MARTS is the earliest available government measure of monthly retail sales
estimates of broad based retail trade activity
• Leading Economic Indicator
14
0
50,000
100,000
150,000
200,000
250,000
300,000
350,000
400,000
450,000
500,000
1992 1994 1996 1998 2000 2002 2004 2006 2008 2010 2012 2014
Mill
ions
of D
olla
rs
Total Sales for Retail Trade and Food Services NAICS 44X72 January 1992 - June 2015, Seasonally Adjusted
Recession
SA, Total Sales for Retail Trade and Food Services Source: U.S. Census Bureau, MARTS

Manufacturing and Trade Inventories and Sales: MTIS
Estimates in the report are based on data from three surveys:
• Monthly Retail Trade Survey (MRTS)
• Monthly Wholesale Trade Survey (MWTS)
• Manufacturers' Shipments, Inventories, and Orders Survey (M3)
Released approximately 43 days after close of reference month
Preliminary current month estimates and revised data for previous month
Data Items include:
• Total Business Sales
• Total Business Inventories
• Inventories/Sales Ratios
15
Methodology: census.gov/mtis/how_surveys_are_collected.html Available: census.gov/retail/index.html

MTIS: Importance • Provides the first monthly estimates of retail inventories which is used as an input
in Gross Domestic Product.
• Provides a broad economic view across three major sectors of the economy.
16
0
100,000
200,000
300,000
400,000
500,000
600,000
700,000
800,000
2005 2007 2009 2011 2013 2015
Mill
ions
of D
olla
rs
Total Inventories for Retail, Wholesaler Merchants, and Manufacturers January 2005 - June 2015, Seasonally Adjusted
RecessionTotal Retail InventoriesTotal Merchant Wholesalers InventoriesTotal Manufacturers Inventories
Source: U.S. Census Bureau, MTIS

MTIS: Calculating Total Business Inventories
17
0
200,000
400,000
600,000
800,000
1,000,000
1,200,000
1,400,000
1,600,000
1,800,000
2,000,000
2005 2007 2009 2011 2013 2015
Mill
ions
of D
olla
rs
Total Inventories for Retail, Wholesaler Merchants, and Manufacturers January 2005 - June 2015, Seasonally Adjusted
RecessionTotal Business InventoriesTotal Retail InventoriesTotal Merchant Wholesalers InventoriesTotal Manufacturers Inventories
Source: U.S. Census Bureau, MTIS

Release Acronym Release Frequency
How is Data Collected Sample Size Key Statistics
for Trade Why is it important?
Monthly Wholesale Trade Report
MWTS Monthly, Approximately 40 Days after reference month
Report Online, Mail Questionnaire, Fax Reminder, Telephone Follow-up
Approximately 4,200 companies
Wholesale Inventories, Sales, and Inventories to Sales Ratio
Provides only available government measure of monthly estimates of wholesale trade activity.
Advanced Monthly Sales for Retail & Food Services
MARTS Monthly, Approximately 9 business days after reference month
Report Online, Mail Questionnaire, Fax Reminder, Telephone Follow-up
Approximately 4,900 companies
Retail and food services sales
Earliest available government measure of monthly retail sales estimates of broad based retail trade activity.
Monthly Sales for Retail & Food Services
MRTS Monthly, approximately 6 weeks after the end of the reference month.
Report Online, Mail Questionnaire, Fax Reminder, Telephone Follow-up
Approximately 12,000 companies
Retail and food services sales
Contributes to two designated principal economic indicators and is an integral component of MARTS and MTIS. Provides current estimates of sales at retail and food services stores and inventories held by retail stores.
Advance Report U.S. International Trade in Goods
N/A Monthly, Approximately 24-31 Days after reference month
Automated Export System, Statistics Canada, Customs Documentation
Population Exports, Imports, Balance of Trade
Provides earliest measure of monthly international trade in goods.
U.S. International Goods and Services Report
FT900 Monthly, Approximately 34-36 Days after reference month
Automated Export System, Statistics Canada, Customs Documentation, BEA
Population Exports, Imports, Balance of Trade
Provides monthly international trade balance in goods and services.
Quarterly Services Survey
QSS Quarterly Report Online, Mail Questionnaire, Fax Reminder, Telephone Follow-up
Approximately 19,500 companies
Selected Services Revenue Earliest available government measure of Service Sector revenue.
Manufacturers’ Shipments, Inventories, and Orders
M3 Monthly Report Online, Mail Questionnaire, Email Reminder, Telephone Follow-up
Approximately 3,000 companies
Value of Shipments, Inventories, Orders
It provides broad-based, monthly statistical data on economic conditions in the domestic manufacturing sector. The survey measures current industrial activity and provides an indication of future business trends.
Manufacturing and Trade Inventories and Sales
MTIS Monthly This data product combines results from MRTS, MWTS, and M3 and does not have its own collection or sample.
Business Inventories to Sales Ratios, Total Business Inventories, Total Business Sales
Provides broad economic view across three major sectors of the economy.
Review
18

Submit Questions Via Chat to Ask Census
19
John Sperry Economic Indicators Division
U.S. Census Bureau
Direct Phone: (301) 763-3431 Email: [email protected]
Web site: http://www.census.gov/economic-indicators/ Webinar Website: http://www.census.gov/econ/webinar

How are Trade Indicators Related? A Possible Journey to the Store Shelf
1. A good, such as a shoe, is manufactured overseas 2. The good is imported into the country—into a wholesale distributor 3. The wholesaler sells the good to a retailer 4. The retailer sells the good to the household
20

Summary of Graphical Standards & Disclaimers
1. Graphs were created as a special analysis for this presentation. 2. Measures of error for wholesale, retail, and manufacturing estimates, if applicable, are not stated with
the estimates in the graphs. An example of wholesale data with variability graphed is below. 3. Data on estimates of sampling variability are available for monthly wholesale and retail data at:
census.gov/econ/currentdata 4. For more information on methodology on wholesale, retail, or manufacturing data presented today
visit: census.gov/mtis/how_surveys_are_collected.html
21
Source: U.S. Census Bureau, MWTS; Census Indicators Database
Total U.S. Merchant Wholesaler Sales NAICS 42, Jan. 2014 – Aug. 2015
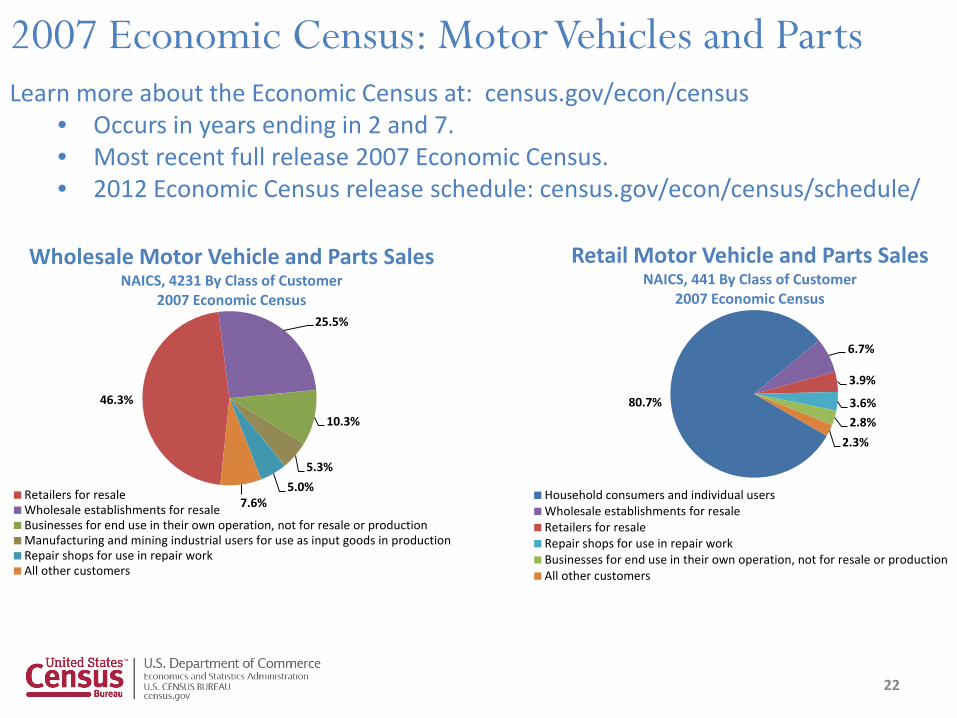
2007 Economic Census: Motor Vehicles and Parts
22
46.3%
25.5%
10.3%
5.3% 5.0%
7.6%
Wholesale Motor Vehicle and Parts Sales NAICS, 4231 By Class of Customer
2007 Economic Census
Retailers for resaleWholesale establishments for resaleBusinesses for end use in their own operation, not for resale or productionManufacturing and mining industrial users for use as input goods in productionRepair shops for use in repair workAll other customers
80.7%
6.7%
3.9%
3.6% 2.8%
2.3%
Retail Motor Vehicle and Parts Sales NAICS, 441 By Class of Customer
2007 Economic Census
Household consumers and individual usersWholesale establishments for resaleRetailers for resaleRepair shops for use in repair workBusinesses for end use in their own operation, not for resale or productionAll other customers
Learn more about the Economic Census at: census.gov/econ/census • Occurs in years ending in 2 and 7. • Most recent full release 2007 Economic Census. • 2012 Economic Census release schedule: census.gov/econ/census/schedule/

How are Trade Indicators Related?
23
0
20,000
40,000
60,000
80,000
100,000
120,000
Jan-05 Jan-06 Jan-07 Jan-08 Jan-09 Jan-10 Jan-11 Jan-12 Jan-13 Jan-14 Jan-15
Mill
ions
of D
olla
rs
Motor Vehicle and Parts Trade By Select Commodities and Industries
January 2005- June 2015, Not Seasonally Adjusted
Recessionary period
NSA, Retail Sales NAICS 441: Motor Vehicle and Parts Dealers
NSA, Wholesale Sales NAICS 4231: Motor Vehicle and Motor Vehicle Parts and Supplies
NSA, General Customs Value Imports of Motor Vehicles and Motor Vehicle Parts (NAICS 3361 & 3363)
Source(s): U.S. Census Bureau, MARTS; U.S. Census Bureau, MWTS U.S. Census Bureau, USA Trade Online

How are Trade Indicators Related?
24
0
20,000
40,000
60,000
80,000
100,000
120,000
Jan-05 Jan-06 Jan-07 Jan-08 Jan-09 Jan-10 Jan-11 Jan-12 Jan-13 Jan-14 Jan-15
Mill
ions
of D
olla
rs
Motor Vehicle and Parts Trade By Select Commodities and Industries
January 2005- June 2015, Not Seasonally Adjusted
Recessionary period
NSA, Retail Sales NAICS 441: Motor Vehicle and Parts Dealers
NSA, Wholesale Sales NAICS 4231: Motor Vehicle and Motor Vehicle Parts and Supplies
NSA, General Customs Value Imports of Motor Vehicles and Motor Vehicle Parts (NAICS 3361 & 3363)
NSA, Motor Vehicles and Parts: U.S. Total Value of Shipments
Source(s): U.S. Census Bureau, MARTS; U.S. Census Bureau, MWTS U.S. Census Bureau, USA Trade Online; U.S. Census Bureau , M3

How are Trade Indicators Related?
25
0
20,000
40,000
60,000
80,000
100,000
120,000
Jan-05 Jan-06 Jan-07 Jan-08 Jan-09 Jan-10 Jan-11 Jan-12 Jan-13 Jan-14 Jan-15
Mill
ions
of D
olla
rs
Motor Vehicle and Parts Trade By Select Industries
January 2005- June 2015, Seasonally Adjusted
Recessionary period
SA, Retail Sales NAICS 441: Motor Vehicle and Parts Dealers
SA, Wholesale Sales NAICS 4231: Motor Vehicle and Motor Vehicle Parts and Supplies
SA, Motor Vehicle and Parts Manufacturing: U.S. Total Value of Shipments
Source(s): U.S. Census Bureau, MARTS; U.S. Census Bureau, MWTS; U.S. Census Bureau, M3

2007 Economic Census: Grocery
26
99.0%
1.0%
Retail Grocery Stores Sales NAICS, 4451 By Class of Customer
2007 Economic Census
Household consumers and individual users
All other customers
35.0%
33.6% 20.8%
4.2%
3.1%
3.3%
Wholesale Grocery and Related Product Sales NAICS, 4244 By Class of Customer
2007 Economic Census
Retailers for resaleRestaurants, hotels, food services, and contract feedingWholesale establishments for resaleManufacturing and mining industrial users for use as input goods in productionExport salesAll other customers
Learn more about the Economic Census at: census.gov/econ/census • Occurs in years ending in 2 and 7. • Most recent full release 2007 Economic Census. • 2012 Economic Census release schedule: census.gov/econ/census/schedule/

How are Trade Indicators Related?
27
0
10,000
20,000
30,000
40,000
50,000
60,000
Jan-05 Jan-06 Jan-07 Jan-08 Jan-09 Jan-10 Jan-11 Jan-12 Jan-13 Jan-14 Jan-15
Mill
ions
of D
olla
rs
Grocery Trade By Select Industries
January 2005- June 2015, Seasonally Adjusted
Recessionary period
SA, Retail Sales NAICS 4451: Grocery Stores
SA, Wholesale Sales NAICS 4244: Grocery and Related Products
Source(s): U.S. Census Bureau, MARTS; U.S. Census Bureau, MWTS

2007 Economic Census: Beer, Wine, and Liquor
28
94.9% 2.5% 1.6%
1.0%
Retail Wine, Beer, & Liquor Stores Sales NAICS, 441 By Class of Customer
2007 Economic Census
Household consumers and individual usersRestaurants, hotels, food services, and contract feedingRetailers for resaleAll other customers
65.5%
21.2%
11.9%
1.4%
Wholesale Beer, Wine, and Distilled Alcoholic Beverage Sales
NAICS, 4248 By Class of Customer 2007 Economic Census
Retailers for resaleWholesale establishments for resaleRestaurants, hotels, food services, and contract feedingAll other customers
Learn more about the Economic Census at: census.gov/econ/census • Occurs in years ending in 2 and 7. • Most recent full release 2007 Economic Census. • 2012 Economic Census release schedule: census.gov/econ/census/schedule/

How are Trade Indicators Related?
29
0
2,000
4,000
6,000
8,000
10,000
12,000
14,000
Jan-05 Jan-06 Jan-07 Jan-08 Jan-09 Jan-10 Jan-11 Jan-12 Jan-13 Jan-14 Jan-15
Mill
ions
of D
olla
rs
Beer, Wine, and Liquor Trade By Select Commodities and Industries
January 2005- June 2015, Not Seasonally Adjusted
Recessionary period
NSA, Retail Sales NAICS 4453: Beer, Wine, and Liquor Stores
NSA, Wholesale Sales NAICS 4248: Beer, Wine, and Distilled Alcoholic Beverages
NSA, General Customs Value Imports of Malt, Beer, Wine, and Liquor (NAICS 31212, 31213, 31214)
Source(s): U.S. Census Bureau, MARTS; U.S. Census Bureau, MWTS U.S. Census Bureau, USA Trade Online

How are Trade Indicators Related?
30
0
2,000
4,000
6,000
8,000
10,000
12,000
14,000
Jan-05 Jan-06 Jan-07 Jan-08 Jan-09 Jan-10 Jan-11 Jan-12 Jan-13 Jan-14 Jan-15
Mill
ions
of D
olla
rs
Beer, Wine, and Liquor Trade By Select Industries
January 2005- June 2015, Seasonally Adjusted
Recessionary period
SA, Retail Sales NAICS 4453: Beer, Wine, and Liquor Stores
SA, Wholesale Sales NAICS 4248: Beer, Wine, and Distilled Alcoholic Beverages
Source(s): U.S. Census Bureau, MRTS; U.S. Census Bureau, MWTS
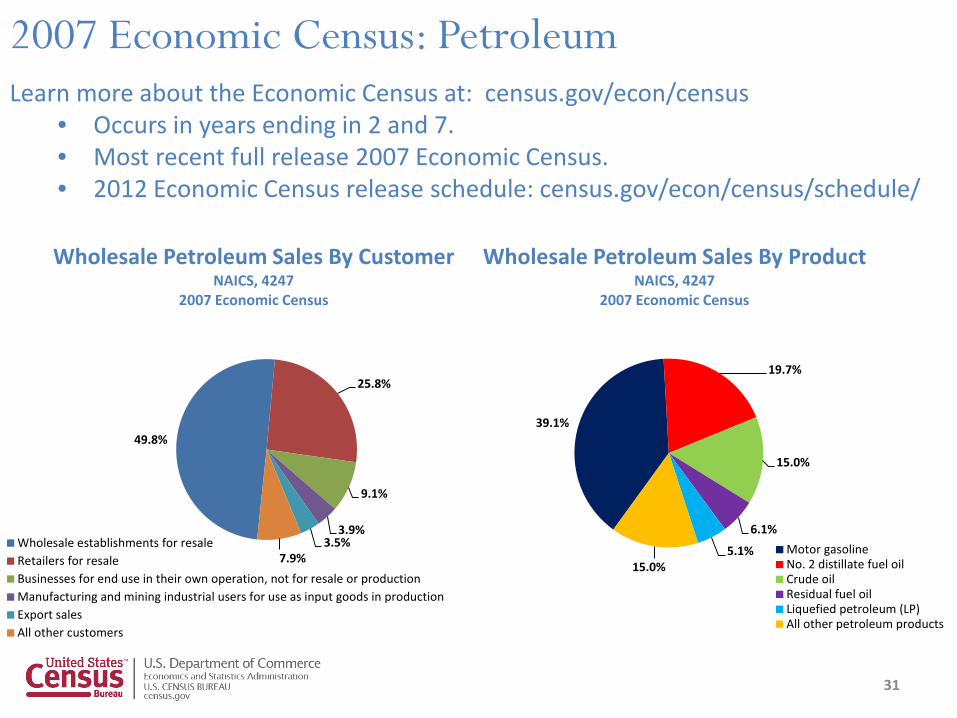
2007 Economic Census: Petroleum
31
49.8%
25.8%
9.1%
3.9% 3.5%
7.9%
Wholesale Petroleum Sales By Customer NAICS, 4247
2007 Economic Census
Wholesale establishments for resaleRetailers for resaleBusinesses for end use in their own operation, not for resale or productionManufacturing and mining industrial users for use as input goods in productionExport salesAll other customers
39.1%
19.7%
15.0%
6.1%
5.1% 15.0%
Wholesale Petroleum Sales By Product NAICS, 4247
2007 Economic Census
Motor gasolineNo. 2 distillate fuel oilCrude oilResidual fuel oilLiquefied petroleum (LP)All other petroleum products
Learn more about the Economic Census at: census.gov/econ/census • Occurs in years ending in 2 and 7. • Most recent full release 2007 Economic Census. • 2012 Economic Census release schedule: census.gov/econ/census/schedule/

Other Commodity & Industry Price Data Sources Consumer Price Index: bls.gov/cpi
• Produces monthly data on changes in the prices paid by urban consumers for a representative basket of goods and services
Producer Price Index: bls.gov/ppi • Measures the average change over time in the selling prices received
by domestic producers for their output
Import / Export Price Index: bls.gov/mxp • Tracks changes in the prices of nonmilitary goods and services traded
between the U.S. and the rest of the world
32

How are Trade Indicators Related?
33
0
25
50
75
100
125
150
Jan-05 Jan-06 Jan-07 Jan-08 Jan-09 Jan-10 Jan-11 Jan-12 Jan-13 Jan-14 Jan-15
Dolla
rs
Unit Price Per Barrel of Imported Crude Oil January 2005- June 2015, Not Seasonally Adjusted
Recessionary period
NSA, Unit Price per Imported Barrel of Crude Oil
Source(s): U.S. Census Bureau, FT900

How are Trade Indicators Related?
34
0
10,000
20,000
30,000
40,000
50,000
60,000
70,000
80,000
90,000
100,000
Jan-05 Jan-06 Jan-07 Jan-08 Jan-09 Jan-10 Jan-11 Jan-12 Jan-13 Jan-14 Jan-15
Mill
ions
of D
olla
rs
Petroleum Trade By Select Commodities and Industries
January 2005- June 2015, Not Seasonally Adjusted
Recessionary period
NSA, Wholesale Trade Sales NAICS 4247: Petroleum and Petroleum Products
NSA, Manufacturing Value of Shipments of Petroleum Refineries
NSA, General Customs Value Imports of Oil, Gas, and Petroleum Refinery Products (NAICS 21111 & 324110)
Source(s): U.S. Census Bureau, MWTS U.S. Census Bureau, USA Trade Online U.S. Census Bureau, M3

Submit Questions Via Chat to Ask Census
35
John Sperry Economic Indicators Division
U.S. Census Bureau
Direct Phone: (301) 763-3431 Email: [email protected]
Web site: http://www.census.gov/economic-indicators/ Webinar Website: http://www.census.gov/econ/webinar

How does Services data compare?
36
bea.gov/international/index.htm
How do trade indicators contribute to Gross Domestic Product (GDP)?
Expenditure approach to measuring GDP • GDP = Consumption + Investment + Government
Spending + Net Exports (Exports – Imports)
All Gross Domestic Product data represented today is from Second Quarter 2015 (Second Estimate) released August 27, 2015
37

Gross Domestic Product Breakdown of Trade Indicators in Net Exports (Exports – Imports)
38
Source: BEA Gross Domestic Product, Table 3
Exports
Imports
• Advance International Trade in Goods Report
• International Trade in Goods and Services Report
Services data provided by Bureau of Economic Analysis
Goods data provided by Census

Gross Domestic Product Graphs Trade Indicators in Net Exports (Exports – Imports)
39
$3,026.3
$3,179.2
$12,213.9
$2,280.3 -$2,797.7
-4,000 -2,000 0 2,000 4,000 6,000 8,000 10,000 12,000 14,000
2015 Second Quarter GDP, Expenditure Approach Values in Billions of Dollars
Source: BEA, GDP Table 3, Gross Domestic Product Second Quarter Second Estimate
SUM: -$517.5

Exports Imports 2015January 120,581 174,891 February 118,022 170,265 March 118,743 185,209
April 121,804 178,815 May 119,585 177,163 June 119,642 178,625
Matching BEA and Census International Trade Figures Trade Indicators in Net Exports (Exports – Imports)
40
Source: BEA Gross Domestic Product Second Quarter 2015 (Second Estimate), Table 3
Source: Census Bureau, July 2015 FT900, Exhibit 10
How can we match Census to BEA figures?

Gross Domestic Product Breakdown of Trade Indicators in Consumption
41
Source: BEA Gross Domestic Product, Table 3
Goods
Services
• Advanced Monthly Sales for Retail and Food Services
• Monthly Retail Trade and Food Services Report
• Quarterly Services Survey • Advanced Monthly Sales for Retail and Food
Services • Monthly Retail Trade and Food Services Report

Gross Domestic Product Breakdown of Trade Indicators in Consumption
42
$3,026.3
-$517.5
$3,179.2
$3,977.9 $8,236.0
-2,000 0 2,000 4,000 6,000 8,000 10,000 12,000 14,000
2015 Second Quarter GDP, Expenditure Approach Values in Billions of Dollars
Source: BEA, GDP Table 3, Gross Domestic Product Second Quarter Second Estimate
SUM: $12,213.9

Gross Domestic Product Breakdown of Trade Indicators in Investment
43
Source: BEA Gross Domestic Product, Table 3
Investment
Inventories
• Quarterly Services Survey
• Manufacturing and Trade Inventories and Sales Report
• Monthly Wholesale Trade Survey • Monthly Retail Trade and Food Services Report • Manufacturers’ Shipments, Inventories, and Orders

Gross Domestic Product Breakdown of Trade Indicators in Investment
44
$3,179.2
-$517.5
$12,213.9
$136.2 $2,890.2
-2,000 0 2,000 4,000 6,000 8,000 10,000 12,000 14,000
2015 Second Quarter GDP, Expenditure Approach Values in Billions of Dollars
Source: BEA, GDP Table 3, Gross Domestic Product Second Quarter Second Estimate
SUM: $3,026.3

Wrapping Up
45
John Sperry Economic Indicators Division
U.S. Census Bureau
Phone: (301) 763-3431 Email: [email protected]
Web site: http://www.census.gov/economic-indicators/ Webinar Website: http://www.census.gov/econ/webinar

Other Census Trade Data
46
Available: census.gov/econ/isp

Other Notable Databases
Database Website Description Bureau of Transportation Statistics: TransBorder Freight Data
http://transborder.bts.gov/programs/international/transborder/index/Index_Interface.html
Provides Canadian &Mexican mode of transportation data by truck, rail, and pipeline for exports and imports .
Bureau of Economic Analysis: International Services
http://bea.gov/iTable/index_ita.cfm Interactive database to pull detailed international services data for.
Economic Census data through American Factfinder
http://www.census.gov/econ/census/data/historical_data.html
Find detailed Economic Census historical data broken out by NAICS category for the Retail and Wholesale sectors
Bureau of Labor Statistics: Employment Situation by Industry
http://www.bls.gov/webapps/legacy/cesbtab1.htm
Employment situation by industry. Includes wholesale and retail trade industries.
Census Indicators Database http://www.census.gov/econ/currentdata/ Provides current and historical data of Census economic indicators.
Census Economic Indicators Briefing Room
http://www.census.gov/economic-indicators/
Links, schedules, and copies of reports for each economic indicator Census produces.
47

• Advance Monthly Retail Sales
• Advance Report Durable Goods
• Business Inventories • Construction Spending • Consumer Price Index • Homeownership Rate • International Trade • Manufacturers’ Goods • Monthly Wholesale • New Residential
Construction
• New Residential Sales • Nonfarm Payroll • Personal Income • Producer Price Index • QFR–Manufacturing • QFR–Retail Trade • Quarterly Services Survey • Real Gross Domestic
Product • Unemployment Rate
America’s Economy: Mobile App
www.census.gov/mobile
Indicators Available:
Available for iPhone, iPad, and Android devices
https://www.youtube.com/watch?v=cd9cZ9sPSpI
48

Exciting Changes with USA Trade Online
November 4, 2015 @ 1:00 PM EST
Visit www.census.gov/econ/webinar for a complete list of upcoming webinars
Upcoming Webinars
49
December 16, 2015 @ 1:00 PM EST
The official source for U.S. merchandise data, USA Trade Online (UTO), is now FREE to the public. In this webinar, you will learn about how to set up and manage your account in UTO. In addition, we’ll cover new data features, new fields and various functions of the database. Dial-In Information for Audio
1-888-324-7209
Participant Passcode 1260036

Manufacturing, Products, and Goods Across Indicators
Do you want to learn more about Manufacturers’ Shipments, Inventories, and Orders (M3) statistics? Are you interested in how manufacturing indicators relate to other federal data? In this webinar, we will explore the relationships between the different manufacturing-related Economic Indicators.
Visit www.census.gov/econ/webinar for a complete list of upcoming webinars
Upcoming Webinars
50
December 16, 2015 @ 1:00 PM EST

For More Information & Feedback
51
John Sperry Economic Indicators Division
U.S. Census Bureau
Phone: (301) 763-3431 Email: [email protected]
Web site: http://www.census.gov/economic-indicators/ Webinar Website: http://www.census.gov/econ/webinar