quality region principles the new visions plan addresses the region’s quality of life in a number...
TRANSCRIPT


Quality Region Principles The New Visions Plan addresses the region’s quality of life in a number of important ways and provides a framework for improving the region’s economy. The following 3 New Visions Planning and Investment Principles support the region’s quality of life: Investing in a Quality Region – A great transportation system with great choices will help make our region a Quality Region. Transportation investments will help preserve and enhance the Capital District's existing urban form, infrastructure, and quality of place. Neighborhood-based local planning efforts are important to the success of an overall regional plan that emphasizes livable communities and smart growth. Transportation investments will:• Plan and build for all modes of transportation, including pedestrian, bicycle, public transit, cars, trucks, marine, aviation, and rail;• Support healthy urban, suburban, and rural communities;• Encourage concentrated development patterns and smart economic growth;• Link transportation planning and land use planning in order to reduce conflicts and improve both;• Protect sensitive environmental resources. Economic Development – Transportation is critical to our region’s economy. New Visions articulates the transportation investment needed for sustainable regional economic growth. All indications are that the region's quality assets are becoming apparent to decision makers outside the region. Transportation choices, strong urban areas, affordable and diverse housing locations, good schools, colleges and universities, ease of mobility, modern air and rail transportation facilities, cultural and recreational opportunities and a clean environment are significant criteria in location decisions of advanced technology firms. These factors support Tech Valley and the region’s economic development and business climate. CDTC will partner with New York State to encourage regional efforts to build a strong, sustainable economy. Regional Equity – Transportation investments will address all needs fairly and equally. Funding for appropriate repair, replacement and reconstruction will be based on the function and condition of the facility -- not ownership. Investments should meet the needs of all users of the transportation system, in a manner that increases access to transportation or does not disproportionately impact people with disabilities, and minority and low-income populations.

Key Recommendations:• Improve CDTC public outreach and marketing efforts – Too many transportation
users, municipalities, businesses, etc. are not aware of the scope and impact of CDTC’s long-range transportation plan (New Visions Plan). CDTC should improve and increase efforts to engage all users, to educate them and to obtain their input.
• Update and upgrade project selection criteria – The existing project selection criteria is relatively technical, relies too heavily on the benefit/cost ratio, does not reflect current priorities or recently emphasized criteria (e.g. economic development, freight, environmental justice, etc.), and is not easily understood by all our members.

• Develop a Training Program that specifically targets local planners, local planning board members and other local decision makers – CDTC should provide training to local decision makers so that they can make informed and educated planning decisions. Potential training topics should include: – Bicycle and Pedestrian Planning & Strategies– Transportation Safety Planning & Strategies– Smart Growth– Complete Streets– Road Diets– Transportation and Land Use– Transportation Economic Development– Environmental Justice
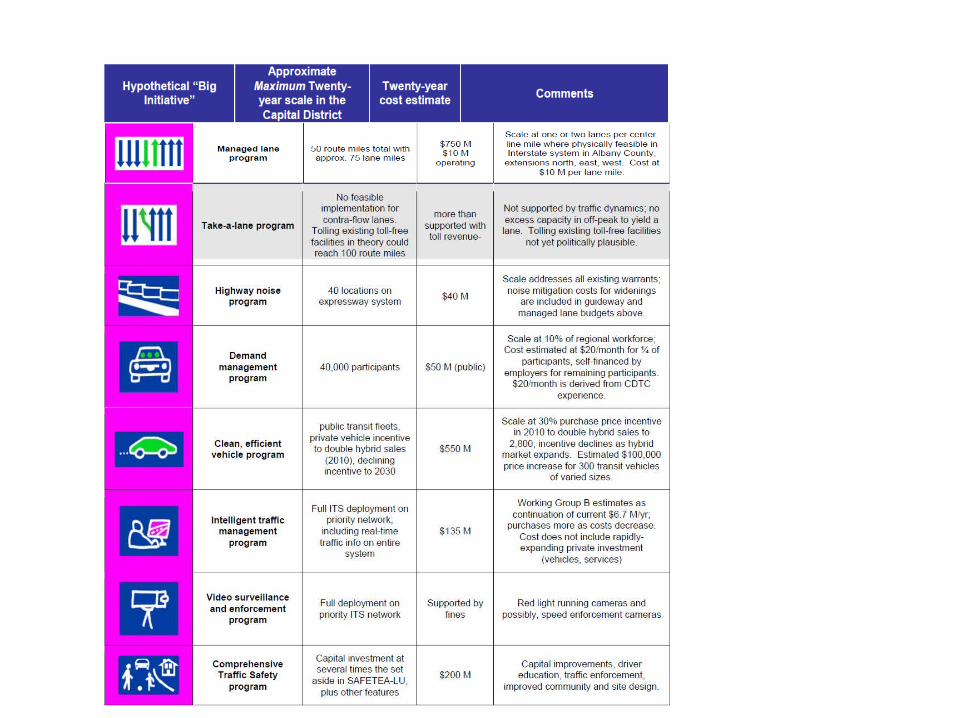
• Refine and further articulate the Big Idea/Big Ticket Initiatives for the
Capital District – The interest, support, and reasons for Big Idea/Big Ticket Initiatives change over time. CDTC should continue to evaluate the needs for these initiatives and their status, and should foster the discussion of these initiatives with the Planning Committee and the Policy Committee members, and the public to measure interest.


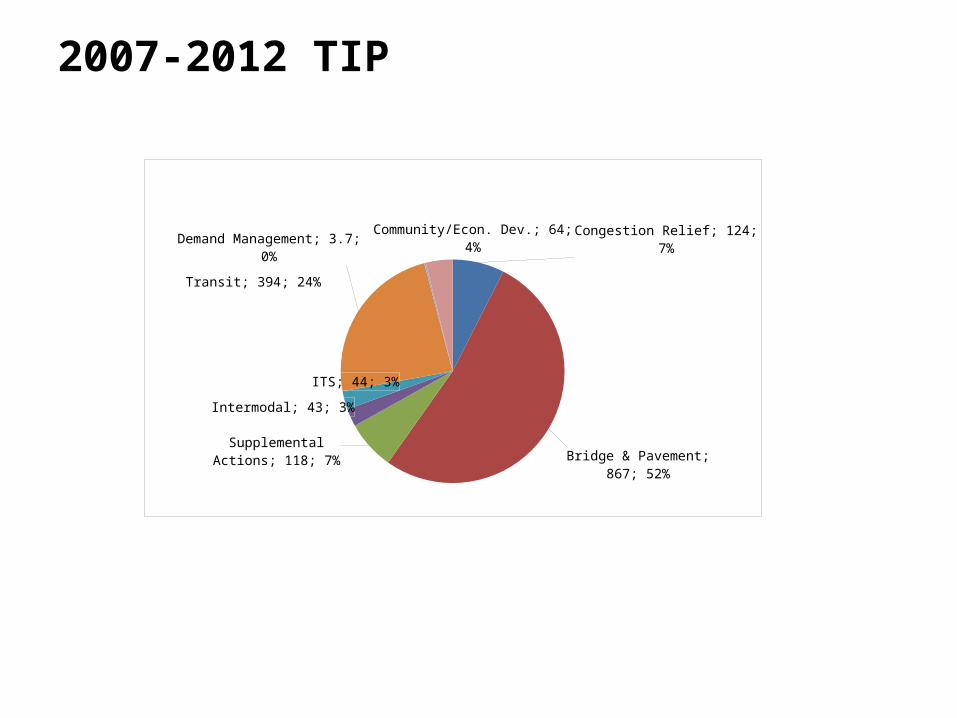
2007-2012 TIP
Congestion Relief; 124; 7%
Bridge & Pavement; 867; 52%Supplemental Actions; 118; 7%
Intermodal; 43; 3%
ITS; 44; 3%
Transit; 394; 24%
Demand Management; 3.7; 0%Community/Econ. Dev.; 64; 4%

2010-2015 TIP
Congestion Relief; 142; 7%
Bridge & Pavement; 1061; 56%
Supplemental Actions; 123; 6%
Intermodal; 46; 2%ITS; 46; 2%
Transit; 360; 19%
Demand Management; 2.7; 0%Community/Econ. Dev.; 115; 6%

2013-2018 TIP
Congestion Relief; 53; 6%
Bridge & Pavement; 509; 62%
Supplemental Actions; 64; 8%
Intermodal; 26; 3%
ITS; 40; 5%
Transit; 125; 15%
Demand Management; 3.8; 0% Community/Econ. Dev.; 5.3; 1%

Transportation Category 2007-2012 TIP 2010-2015 TIP 2013-2018 TIP Average
Percent Congestion Relief 7% $123.542 8% $142.143 6% $52.589 7%Bridge and Pavement Repairs 52% $867.899 56% $1061.374 62% $508.746 56.6%
Supplemental Actions 7% $117.997 7% $123.044 8% $63.582 7.3%Intermodal 3% $42.873 2% $45.731 3% $26.376 2.6%Transit 24% $394.647 19% $359.515 15% $125.535 19.3%Demand Management 0% $3.726 0% $2.676 0% $3.752 0.2%Community/Econ. Dev. 4% $64.485 6% $114.705 1% $5.395 3.6%ITS 3% $44.349 2% $45.947 5% $40.042 3.3%No Applicable Category 0% $2.264 0% $0.00 0% $0.00 0.1%Total $1661.781 $1895.135 $826.018
* The dollar amounts for each TIP are shown in “millions of dollars.”

Mode of Transportation
CDRPC
Workshop5/1/14
% dollars
CDTC Policy Board6/5/14
% dollars
Freight Advisory7/6/14
% dollars
CDTC Planning Committee
8/6/14% dollars
SaratogaTraffic Study
9/10/14% dollars
Albany TorchClub
10/6/14% dollars
Bicycle & PedestrianTask Force 11/25/14% dollars
AVERAGE OF ALL SURVEYS
8% 6% 10% 7% 10% 10% 6% 8.2%
12% 12% 6% 12% 8% 11% 21% 11.7%
9% 10% 27% 8% 11% 12% 8% 12.4%
10% 7% 7% 7% 14% 11% 8% 9.1%
38% 38% 30% 42% 33% 25% 24% 32.9%
9% 15% 9% 15% 7% 15% 19% 12.7%
10% 8% 9% 5% 10% 10% 7% 8.4%
4% 4% 2% 4% 5% 6% 7% 4.6%
NEW VISIONS (Regional Transportation Plan)
Federal Transportation Funding Priorities- If you had $100.00 how would you spend it on transportation?
Travel Demand
Management
Transit -Light Rail
Transit -Buses
Road & Bridge Repair
Intelligent Transportation
Systems
Freight
Bicycle & Pedestrian
Alternative FuelTechnology

Transportation Category
TIP Average Percent
Ballot Average Percent
Alternative Fuel Technology
8.2%Congestion Relief 7% Bridge and Pavement Repairs 56.6% 32.9%
Supplemental Actions/Bike & Pedestrian 7.3% 11.7%Intermodal/Freight 2.6% 12.4%Transit 19.3% 21.1%Demand Management 0.2% 4.6%Community/Econ. Dev. 3.6% ITS 3.3% 9.1%No Applicable Category 0.1% Total 100% 100%


List of 7 big ticket initiatives included in the 2040 New Visions Plan: • Regional Greenway Program• Riverfront Access and Urban Development Program• Street Reconstruction and Reconfiguration• Suburban Town Center Development• Guideway Transit System with Transit-Oriented Development• Integrated Corridor Management Program• Demand Management Program
Decrease previous 2 slides to this list of 7 initiatives

Study Type Albany County
Rensselaer County
Saratoga County
Schenectady County Total
Corridor 6 7 5 3 21Transportation/Land Use 8 2 6 16Bike/Ped 7 2 2 1 12Town/Hamlet/District Center 4 2 4 1 11Zoning/Design Guidelines 3 2 3 8Gateway 1 1 2 4Parking 1 1 2Waterfront Redevelopment 1 1 2Commercial/Multimodal 2 2Road Diet 1 1Complete Streets 1 1
Total 34 13 19 14 80
A summary of these linkage studies appears below:

Please place a blue pin where you live and a red pin where your work.