quality of service for real-time applications over next ... · quality of service for real-time ......
TRANSCRIPT

William IvancicGlenn Research Center, Cleveland, Ohio
Mohammed Atiquzzaman, Haowei Bai, and Hongjun SuUniversity of Dayton, Dayton, Ohio
Raj Jain, Arjan Durresi, Mukyl Goyal, Venkata Bharani, and Chunlei LiuOhio State University, Columbus, Ohio
Sastri KotaLockheed Martin, San Jose, California
Quality of Service for Real-Time ApplicationsOver Next Generation Data Networks
NASA/TM—2001-210904
May 2001
https://ntrs.nasa.gov/search.jsp?R=20050019502 2018-07-13T06:57:11+00:00Z

The NASA STI Program Office . . . in Profile
Since its founding, NASA has been dedicated tothe advancement of aeronautics and spacescience. The NASA Scientific and TechnicalInformation (STI) Program Office plays a key partin helping NASA maintain this important role.
The NASA STI Program Office is operated byLangley Research Center, the Lead Center forNASA’s scientific and technical information. TheNASA STI Program Office provides access to theNASA STI Database, the largest collection ofaeronautical and space science STI in the world.The Program Office is also NASA’s institutionalmechanism for disseminating the results of itsresearch and development activities. These resultsare published by NASA in the NASA STI ReportSeries, which includes the following report types:
• TECHNICAL PUBLICATION. Reports ofcompleted research or a major significantphase of research that present the results ofNASA programs and include extensive dataor theoretical analysis. Includes compilationsof significant scientific and technical data andinformation deemed to be of continuingreference value. NASA’s counterpart of peer-reviewed formal professional papers buthas less stringent limitations on manuscriptlength and extent of graphic presentations.
• TECHNICAL MEMORANDUM. Scientificand technical findings that are preliminary orof specialized interest, e.g., quick releasereports, working papers, and bibliographiesthat contain minimal annotation. Does notcontain extensive analysis.
• CONTRACTOR REPORT. Scientific andtechnical findings by NASA-sponsoredcontractors and grantees.
• CONFERENCE PUBLICATION. Collectedpapers from scientific and technicalconferences, symposia, seminars, or othermeetings sponsored or cosponsored byNASA.
• SPECIAL PUBLICATION. Scientific,technical, or historical information fromNASA programs, projects, and missions,often concerned with subjects havingsubstantial public interest.
• TECHNICAL TRANSLATION. English-language translations of foreign scientificand technical material pertinent to NASA’smission.
Specialized services that complement the STIProgram Office’s diverse offerings includecreating custom thesauri, building customizeddata bases, organizing and publishing researchresults . . . even providing videos.
For more information about the NASA STIProgram Office, see the following:
• Access the NASA STI Program Home Pageat http://www.sti.nasa.gov
• E-mail your question via the Internet [email protected]
• Fax your question to the NASA AccessHelp Desk at 301–621–0134
• Telephone the NASA Access Help Desk at301–621–0390
• Write to: NASA Access Help Desk NASA Center for AeroSpace Information 7121 Standard Drive Hanover, MD 21076

May 2001
National Aeronautics andSpace Administration
Glenn Research Center
William IvancicGlenn Research Center, Cleveland, Ohio
Mohammed Atiquzzaman, Haowei Bai, and Hongjun SuUniversity of Dayton, Dayton, Ohio
Raj Jain, Arjan Durresi, Mukyl Goyal, Venkata Bharani, and Chunlei LiuOhio State University, Columbus, Ohio
Sastri KotaLockheed Martin, San Jose, California
Quality of Service for Real-Time ApplicationsOver Next Generation Data Networks
NASA/TM—2001-210904

Available from
NASA Center for Aerospace Information7121 Standard DriveHanover, MD 21076
Available electronically at http://gltrs.grc.nasa.gov/GLTRS
Acknowledgments
The investigators thank NASA Glenn Research Center for support of this project and Dr. William Ivancic for hisguidance and many technical discussions during the course of this project. They also thank Dr. Arian Durressi for
his help with the project when the Co-PI was on leave. This research was partially funded underNASA Grant NAG3–2318.
Contents were reproduced from the best available copyas provided by the authors.

TABLE OF CONTENTS
Introduction . . . . . . . . . . . . . . . . . . . . . . . . . . . . . . . . . . . . . . . . . . . . . . . . . . . . . . . . . . . . . . . . . . . . . . . . . . . . . . . . 1
Progress . . . . . . . . . . . . . . . . . . . . . . . . . . . . . . . . . . . . . . . . . . . . . . . . . . . . . . . . . . . . . . . . . . . . . . . . . . . . . . . . . . . 1
Presentations . . . . . . . . . . . . . . . . . . . . . . . . . . . . . . . . . . . . . . . . . . . . . . . . . . . . . . . . . . . . . . . . . . . . . . . . . . . . . . . . 2
Conclusion . . . . . . . . . . . . . . . . . . . . . . . . . . . . . . . . . . . . . . . . . . . . . . . . . . . . . . . . . . . . . . . . . . . . . . . . . . . . . . . . . 2
Reports
End-to-End QoS for Differentiated Services and ATM InternetworkingHongjun Su and Mohammed Atiquzzaman, University of Dayton . . . . . . . . . . . . . . . . . . . . . . . . . . . . . . . . . . . . 3
Achieving End-to-End QoS in the Next Generation Internet: Integrated Services overDifferentiated Service NetworksHaowei Bai and Mohammed Atiquzzaman, University of Dayton; andWilliam Ivancic, NASA Glenn Research Center . . . . . . . . . . . . . . . . . . . . . . . . . . . . . . . . . . . . . . . . . . . . . . . . . . 9
Achieving QoS for Aeronautical Telecommunication Networks over Differentiated ServicesHaowei Bai and Mohammed Atiquzzaman, University of Dayton; andWilliam Ivancic, NASA Glenn Research Center . . . . . . . . . . . . . . . . . . . . . . . . . . . . . . . . . . . . . . . . . . . . . . . . . 33
Achieving QoS for TCP Traffic in Satellite Networks with Differentiated ServicesArjan Durresi, Ohio State University; Sastri Kota, Lockheed Martin; Mukul Goyal,Ohio State University; Raj Jain, Nayna Networks, Inc.; and Venkata Bharani, Ohio State University . . . . . . . . 47
Improving Explicit Congestion Notification with the Mark-Front StrategyChunlei Liu, Ohio State University; and Raj Jain, Nayna Networks, Inc. . . . . . . . . . . . . . . . . . . . . . . . . . . . . . . 75
Delivering Faster Congestion Feedback with the Mark-Front StrategyChunlei Liu and Raj Jain, Ohio State University . . . . . . . . . . . . . . . . . . . . . . . . . . . . . . . . . . . . . . . . . . . . . . . . . 93
Presentations
QoS for Real Time Applications over Next Generation Data Networks,Project Status Report: Part I
Mohammed Atiquzzaman, University of Dayton; Raj Jain, Ohio State University;and William Ivancic, NASA Glenn Research Center . . . . . . . . . . . . . . . . . . . . . . . . . . . . . . . . . . . . . . . . . . . . . 101
QoS for Real Time Applications over Next Generation Data Networks,Project Status Report: Part II
Raj Jain, Ohio State University . . . . . . . . . . . . . . . . . . . . . . . . . . . . . . . . . . . . . . . . . . . . . . . . . . . . . . . . . . . . . 159
QoS for Real Time Applications over Next Generation Data Networks,Final Project Presentation
Mohammed Atiquzzaman, University of Dayton; andWilliam Ivancic, NASA Glenn Research Center . . . . . . . . . . . . . . . . . . . . . . . . . . . . . . . . . . . . . . . . . . . . . . . . 185
QoS for Real Time Applications over Next Generation Data NetworksArjan Durresi, Ohio State University . . . . . . . . . . . . . . . . . . . . . . . . . . . . . . . . . . . . . . . . . . . . . . . . . . . . . . . . . 283
NASA/TM—2001-210904 iii


Introduction
This project, which started on January 1, 2000, was funded by NASA Glenn Research Center for duration of one year. The deliverables of the project included the following tasks: • Study of QoS mapping between the edge and core networks envisioned in the Next
Generation networks will provide us with the QoS guarantees that can be obtained from next generation networks.
• Buffer management techniques to provide strict guarantees to real-time end-to-end
applications through preferential treatment to packets belonging to real-time applications. In particular, use of ECN to help reduce the loss on high bandwidth-delay product satellite networks needs to be studied.
• Effect of Prioritized Packet Discard to increase goodput of the network and reduce
the buffering requirements in the ATM switches. • Provision of new IP circuit emulation services over Satellite IP backbones using
MPLS will be studied. • Determine the architecture and requirements for internetworking ATN and the Next
Generation Internet for real-time applications.
Progress The work of this project has been reported in the following six papers/reports, as listed below. Copies of all the papers are attached to this final report.
1. H. Su and M. Atiquzzaman, "End-to-end QoS for Differentiated Services and ATM Internetworking", 9th International Conference on Computer Communication and Network, October 16~18, 2000, Las Vegas, Nevada. 2. H. Bai, M. Atiquzzaman and W. Ivancic, “Achieving End-to-end QoS in the Next Generation Internet: Integrated Services over Differentiated Service Networks”, submitted to 2001 IEEE Workshop on High Performance Switching and Routing, May 29-31, 2001, Dallas, Texas USA. 3. H. Bai, M. Atiquzzaman and W. Ivancic, “Achieving QoS for Aeronautical Telecommunication Networks over Differentiated Services”, submitted for publication as Technical Report, NASA Glenn Research Center. 4. A. Durresi, S. Kota, M. Goyal, R. Jain, V. Bharani, “Achieving QoS for TCP traffic in Satellite Networks with Differentiated Services”, Accepted in Journal of Space Communications.
NASA/TM—2001-210904 1

5. C. Liu and R. Jain, “Improving Explicit Congestion Notification with the Mark-Front Strategy”, Computer Networks, vol 35, no 2-3, pp 285-201, January 2001 6. C. Liu and R. Jain, “Delivering Faster Congestion Feedback with the Mark-Front Strategy”, International Conference on Communication Technologies (ICCT 2000), Beijing, China, August 21-25, 2000.
Presentations
The investigators have presented their progress at two presentations at NASA Glenn Research Center. Copies of the slides from the presentation are attached to this final report.
Conclusion The project has completed on time. All the objectives and deliverables of the project have been completed. Research results obtained from this project have been published in a number of papers in journals, conferences and technical reports.
NASA/TM—2001-210904 2

End-to-end QoS for Differentiated Services and ATM Internetworking1
Hongjun Su Mohammed AtiquzzamanDept. of Electrical Computer Engineering
University of Dayton, Dayton, OH 45469-0226Email: [email protected] [email protected]
Abstract— The Internet was initially design for non real-time datacommunications and hence does not provide any Quality of Service(QoS). The next generation Internet will be characterized by high speedand QoS guarantee. The aim of this paper is to develop a prioritizedearly packet discard (PEPD) scheme for ATM switches to provide ser-vice differentiation and QoS guarantee to end applications runningover next generation Internet. The proposed PEPD scheme differs fromprevious schemes by taking into account the priority of packets gener-ated from different application. We develop a Markov chain model forthe proposed scheme and verify the model with simulation. Numericalresults show that the results from the model and computer simulationare in close agreement. Our PEPD scheme provides service differenti-ation to the end-to-end applications.
Keywords—Differentiated Services, TCP/IP-ATM Internetworking,End-to-end QoS, Queue analysis, analytical model, performance evalu-ation, Markov chains.
I. INTRODUCTION
With quick emergence of new Internet applications, ef-forts are underway to provide Quality of Service (QoS) tothe Internet. Differentiated Services (DS) is one of the ap-proaches being actively pursued by the Internet EngineeringTask Force (IETF) [1], [2], [3], [4], [5]. It is based on ser-vice differentiation, and provides aggregate services to thevarious application classes. DS has defined three serviceclasses. When running DS over ATM (which is implementedby many Internet service providers as their backbones), weneed proper services mapping between them. Premium Ser-vice requires delay and loss guarantees, and hence it can bemapped to the ATM Constant Bit Rate (CBR) service. As-sured Service only requires loss guarantees and hence can bemapped to ATM Unspecified Bit Rate (UBR) service withCell Loss Priority (CLP) bit set to zero. The Best Effort ser-vice does not require any loss or delay guarantee and can bemapped to the ATM UBR service with CLP bit set to one.
It has been shown that Internet may loss packets duringhigh load periods, even worse is that it may suffer conges-tion collapse [6], [7]. Packets loss means all of the resourcesthey have consumed in transit are wasted. When running DSover ATM, packets loss may lead to more serious results.Because messages will be break into small fix size packet(call cells), one packet loss will lead to the whole messagebe transmitted again [8]. This makes the congestion scenarioeven worse. Transmitting useless incomplete packets in acongested network wastes a lot of resource and may result ina very low goodput (good throughput) and poor bandwidth
1This work was supported by NASA grant no. NAG3-2318 and OhioBoard of Regents Research Challenge grant
utilization of the network. A number of message based dis-card strategies have been proposed to solve this problem [8],[9], [10], [11]. These strategies attempt to ensure that theavailable network capacity is effectively utilized by preserv-ing the integrity of transport level packets during congestionperiods. Early Packet Discard (EPD) strategy [8] drops en-tire messages that are unlikely to be successfully transmittedprior to buffer overflow. It prevents the congested link fromtransmitting useless packets and reduces the total number ofincomplete messages. EPD achieves this by using a thresh-old in the buffer. Once the queue occupancy in the bufferexceeds this threshold, the network element will only ac-cept packets that belong to a message that has at least onepacket in the queue or has already been transmitted. Alsoper-VC based EPD schemes [12], [13] are proposed to solvethe fairness problem that a pure EPD may suffer when virtualcircuits compete for the resource. Although EPD can im-prove the goodput at a network switch, it does not distinguishamong priorities of different applications. Previous studieson EPD have assumed a single priority of all ATM psckets,and thus fail to account for the fact that ATM packets couldhave priority and need to be treated differently. Without adifferentiation between the packets, end-to-end QoS guar-antee and service differentiation promised by DS networkscannot be ensured when packets traverse through an ATMnetwork. The objective of this study is to developed messagebased discarding scheme which will account for priority ofpackets and will be able to provide service differentiation toend applications.
In this paper,we propose a prioritized EPD (PEPD)scheme which can provide the necessary service differen-tiation needed by the future QoS network. In the PEPDscheme, two thresholds are used to provide service differen-tiation. We have developed Markov chain models to studythe performance of our proposed scheme. The effective-ness of PEPD in providing service differentiation to the twoclasses of ATM packets coming from a DS network is esti-mated by the model and then validated by results obtainedfrom our simulation. We measure the goodput, packet lossprobability and throughput of the two service classes as afunction of the load. Given a QoS requirement for thetwo service classes, our model can predict the size of thebuffer required at the ATM switches and the value of the twothresholds to be used to achieve the target QoS. This modelcan provide a general framework for analysis of networkscarrying messages from applications which require differen-
NASA/TM—2001-210904 3

tial treatment in terms of Quality of Service (QoS).The rest of this paper is organized as follows. Section II
lists the assumptions used in the model. Section III con-structs a Markov chain model to analyze our proposed PEPDscheme. The model is used to study the performance of thePEPD policy using goodput as the performance criteria. Nu-merical results from both modeling and computer simulationare presented in Section IV. Concluding remarks are givenin Section V.
II. MODELING ASSUMPTIONS
In the dispersed message model [11], [14], a higher layerprotocol data unit (message) consists of a block of consec-utive packets that arrive at a network element at differenttime instants. TCP/IP based systems are examples of such amodel. In TCP/IP, the application message is segmented intopackets, which are then transmitted over the network. At thereceiving end, they are reassembled back into a message bythe transport protocol before being delivered to higher lay-ers.� We assume variable length packets, the length of the pack-ets being geometrically distributed with parameter q (inde-pendent between subsequent packets). Clearly, the averagepacket length is 1=q packets. This kind of assumption is typ-ical for data application such as document file and e-mail.� We also assume that the packets arrive at a network el-ement according to a Poisson process with rate �, and thetransmission time of a packet is exponentially distributedwith rate �. Although we assume that packets are of vari-able length, Lapid’s work [11] shows that this kind of modelfits well for fixed-length packet (which is typical to ATMnetwork) scenarios.� The network element we used in this paper is a simplefinite input queue that can contain at most N packets. Whenthe packets arrive at the network element, it enters the inputqueue only when there is space to hold it; otherwise it isdiscarded.� Packets leave the queue according to a first-in-first-out(FIFO) order. When a server is available, the packet at thehead of the queue can be served. A packet is transmittedby the server of the network element during its service time.Hence, the network element can be viewed as a M/M/1/Nmodel, with arrival rate � and service rate �.� The input load to the network element is defined as � =�=�.
III. PERFORMANCE EVALUATION OF PEPD SCHEME
In this section, we describe the PEPD scheme, followedby model setup and performance analysis.
A. PEPD scheme
HT LT
0N
µλ
Fig. 1. Network element using PEPD policy.
In the PEPD scheme, we use two thresholds: a low thresh-old (LT) and a high threshold (HT ), with 0 � LT �
N;LT � HT � N . As shown in Fig. 1, let QL indicatethe current queue length. The following strategy is used toaccept packets in the buffer.� If QL < LT , all packets are accepted in the buffer.� If LT � QL < HT , new low priority messages willbe discarded; only packets belonging to new messages withhigh priority or packets belonging to messages which havealready entered the buffer are accepted.� If HT � QL < N , all new messages of both prioritiesare discarded.� For QL � N , packets belonging to all messages are lostbecause of buffer overflow.
B. Proposed PEPD model
To model the PEPD scheme, we must distinguish betweentwo modes: the normal mode in which packets are acceptedand the discarding mode in which arriving packets are dis-carded. The state transition diagram for this policy is shownin Fig. 2. In the diagram, state (i; j) indicates that the bufferhas i packets and is in j mode, where 0 � i � N , j = 0or 1. j = 0 corresponds to the normal mode, while j = 1represents the discarding mode. We assume that a head-of-message packet arrives with probability q. The probabilitythat an arriving packet is part of the same message as theprevious packets is p = 1 � q, and hence is discarded withthat probability in the case that that message is being dis-carded.
According to PEPD, if a message starts to arrive whenthe buffer contains more than LT packets, the complete newmessage is discarded if it is of low priority, while if a newmessage starts to arrive when the buffer contains more thanHT packets, the complete message is discarded regardlessof its priority. Once a packet is discarded, the buffer entersthe discarding mode, and discards all packets belonging tothis discarded message. The system will remain in discard-ing mode until another head-of-message packet arrives. Ifthis head-of-message packet arrives when QL < LT , it isaccepted, and the system enters the normal mode. If thispacket arrives when LT � QL � HT , then the system en-ters the normal mode only if this packet has high priority.Otherwise, it stays in the discarding mode. Of course, whenQL > HT , the buffer stays in the discarding mode. Let’sassume that h and l = 1 � h be the probabilities of a mes-sage being of high and low priority respectively. Also let
NASA/TM—2001-210904 4

0,0
0,1
1,0
1,1
2,0
2,1
3,0
3,1
4,0
4,1
i-1,0
i-1,1
i,0
i,1
i+1,0
i+1,1
N,0
N,1
λ λ
µ
µµµµµµ
µµµµµ
µµ
µµ λ
pλ
λql
LT HT
λqλq λhqλhqλhqλhqλql λql λql
λhp qλ+λhp qλ+λhp qλ+λhp qλ+
λqλq
...
...
...
...
pλ
Fig. 2. Steady-state transition diagram the buffers using PEPD
Pi;j(0 � i � N; j = 0; 1) be the steady-state probability ofthe buffer being in state (i; j). From Fig. 2, we can get thefollowing equations. The solutions of these equations willgenerate the steady-state probabilities of the buffer states.
�P0;0 = �P1;0
q�P0;1 = �P1;1
(�+ �)Pi;0 = �Pi�1;0 + �Pi+1;0 + qh�Pi�1;1
1 � i � LT
(�+ �)Pi;0 = (�p+ qh�)Pi�1;0 + �Pi+1;0
+qh�Pi�1;1 LT < i � HT
(�+ �)Pi;0 = p�Pi�1;0 + �Pi+1;0 HT < i < N
(�+ �)PN;0 = p�PN�1;0
�PN;1 = �PN;0 (1)
�Pi;1 = q�Pi;0 + �Pi+1;1 HT � i < N
(qh�+ �)Pi;1 = q�(1� h)Pi;0 + �Pi+1;1
LT � i < HTNX
i=0
(Pi;0 + Pi;1) = 1
C. Performance analysis of PEPD
In this section, we derive the expression of goodputG forhigh and low priority messages. The goodput G is the ratiobetween total good packets exiting the buffer and the totalarriving packets at its input. Good packets are those pack-ets that belong to a complete message leaving the buffer. Inthis paper, we define the goodput for high (or low) priorityas the ratio between total number of good packets with high(or low) priority exiting the system and the total number ofarriving high (or low) priority packets at the buffer. How-ever, we normalize the goodput to the maximum possiblegoodput.
Let W be the random variable that represents the length(number of packets) of an arriving message, and V be therandom variable that represents the success of a message.V = 1 for a good message, and V = 0 for an incompletemessage. Let U be the random variable that represents thepriority of a packet, U = 1 for high priority packets andU = 0 for low priority packets. The goodput for the high
priority packets (Gh) is
Gh =
P1
n=1 nP (W = n; V = 1; U = 1)P1
n=1 nP (W = n;U = 1)(2)
where the numerator represents the total good packets exit-ing the buffer and the denominator is the total arriving pack-ets at a network input. Note that W and V are independentrandom variables, and the length of an arriving message isgeometrically distributed with parameter q, which means theaverage length of the messages is 1=q. Then the denominatorof Eq. (2) can be expressed as1X
n=1
nP (W = n; V = 1) = P (U = 1)
1X
n=1
P (W = n) =h
q
(3)Substituting Eq. (3) in Eq. (2),
Gh =q
h
1X
n=1
nP (W = n; V = 1; U = 1) (4)
The probability of an incoming high priority message oflength n to be transmitted successfully can be expressed asfollows:
P (W = n; V = 1; U = 1) = P (V = 1jW = n;U = 1)
P (W = n;U = 1)
= P (V = 1jW = n;U = 1)
P (W = n)P (U = 1) (5)
= q(1� q)n�1h
P (V = 1jW = n;U = 1)
Let Q be the random variable representing the queue oc-cupancy at the arrival of a head-of-message packet. Then
P (V = 1jW = n;U = 1) =
NX
i=0
P (V = 1jW = n;U = 1;
Q = i)P (Q = i) (6)
where P (Q = i) = Pi;0 + Pi;1 is the probability of thequeue occupancy. Pi;j is obtained from from the solution ofEq. (2). By combining Eqs. (4), (5), and (6), we get thegoodput of the high priority messages as:
Gh = q1X
n=1
nq(1� q)(n�1)NX
i=0
P (V = 1jW = n;U = 1;
Q = i)P (Q = i) (7)
Similarly, we can get the goodput for the low priority mes-sages and the total goodput as follows:
Gl = q
1X
n=1
nq(1� q)(n�1)NX
i=0
P (V = 1jW = n;U = 0;
Q = i)P (Q = i) (8)
G = q
1X
n=1
nq(1� q)(n�1)NX
i=0
P (V = 1jW = n;
Q = i)P (Q = i) (9)
NASA/TM—2001-210904 5

In order to find the values of G, G l and Gh, we need todefine and evaluate the following conditional probabilities:
Sn;i = P (V = 1jW = n;Q = i) (10)
Sl;n;i = P (V = 1jW = n;U = 0; Q = i) (11)
Sh;n;i = P (V = 1jW = n;U = 1; Q = i) (12)
These conditional probabilities can be computed recur-sively. Let’s take Sh;n;i as an example. Consider first asystem that employs the PPD policy. Usually, the successof a packet depends on the evolution of the system after thearrival of the head-of-message. However, there is a boundarycondition for this. Let us first consider a message of length1 � n � N . Assume that the head-of-message packet be-longing to a message of length n � N arrives at buffer whenQ = i. Then, if i � N � n, there is enough space to holdthis message, and this message is guaranteed to be good, i.e
Sn;i = 1 0 � i � N � n; 1 � n � N (13)
note that if Q = N (i.e. the buffer is full), the head-of-message packet is discarded, and the message is guaranteedto be bad. Hence,
Sn;N = 0 1 � n � N (14)
Eqs. (13) & (14) give the boundary conditions for this sys-tem. For other states of the buffer, we have:
Sn;i = (1� r)Sn�1;i+1 + rSn;i�1
N � n+ 1 � i � N � 1; 1 � n � N (15)
where r = �=(� + h�) is the probability that a departureoccurs before an arrival. In this case, we only consider theconditional probability for high priority packets, so the ar-rival rate is h� rather than �. Eq. (15) can be explained asfollows. If the next event following the arrival of a head-of-message packet is the arrival of another packet (whichhas the probability 1 � r), this new packet can be viewedas a new head-of-message packet belonging to a message oflength n � 1. Therefore, the probability that this new mes-sage will succeed is Sn�1;i+1. If the event following the ar-rival of the head-of-message packet is a departure of a packet(which happens with probability r), the probability that themessage is successful is Sn;i�1, since it is equivalent to ahead-of-message packet that arrived at the system with Q=i� 1 packets. So, combining the above two conditions, wecan get:
Sn;i =8>>>><>>>>:
1 N � n+ 1 � ii � N � 1
(1� r)Sn�1;i+1 + rSn;i�1 N � n+ 1 � ii � N � 1
0 i = N
(16)
For a large message, n > N , there is no guarantee thatthis message will succeed, it’s success depended heavily on
the evolution of the system after the arrival of the head-of-message packet even for the case of i = 0. So, for n > Nwe get the following equations:
Sn;i =8>><>>:
(1� r)Sn�1;i+1 + rSn�1;i i = 0
(1� r)Sn�1;i+1 + rSn;i�1 N � n+ 1 � ii � N � 1
0 i = N
(17)
These recursions are computed in ascending order of bothn and i. For a system that employs the PEPD policy, forhigh priority messages, the above recursions remain correctonly when the head-of-message packet arrives at the bufferwhile the number of packets is below the high threshold, i.e.Q = i < HT . For Q = i � HT , these new messages willbe discarded, so
Sh;n;i =
�Sn;i i < HT0 HT � i � N
(18)
with r = �=(�+ h�). Similarly, we can get
Sl;n;i =
�Sn;i i < LT0 LT � i � N
(19)
with r = �=(�+ (1� h)�), while the average is
Sn;i = (1� h)Sl;n;i + hSl;n;i (20)
The above model is used to analyze the performance ofPEPD in the next section.
IV. NUMERICAL RESULTS
In this section, we present results from our analyticalmodel and simulation to illustrate the performance of PEPD.We also validate the accuracy of our analytical model bycomparison with simulation results. In our experiment, weset N = 120 packets, q = 1=6 which corresponds to thecase where the queue size is 20 times the mean messagelength. The incoming traffic load (�) at the input to thebuffer is set in the range of 0:8 � 2:2, where � < 1 rep-resents moderate load, and � � 1 corresponds to higher loadwhich results in congestion buildup at the buffer. Goodputof the combined low and high priority packets is defined asG = h �GH + (1� h) �GL as used in Eq. (20).
In order to validate our model, we compare it with re-sults from computer simulation. The simulation setup issimply two nodes compete for a single link with a queuesize 120 packets. The two nodes generate messages with amean length of 6 (measured in packets). Because the queueoccupancy is a critical parameter used for calculating thegoodput, we compare the queue occupancy obtained fromthe model and computer simulation in Fig. 3. For q = 1=6,it is clear that analytical and simulation results are in close
NASA/TM—2001-210904 6

0 20 40 60 80 100 1200
0.01
0.02
0.03
0.04
0.05
0.06
0.07
Queue length
Pro
babi
lity
Simulation,load 1.0Model,load 1.0Simulation,load 1.4Model,load 1.4Simulation,load 1.8Model,load 1.8Simulation,load 2.2Model,load 2.2
Fig. 3. Comparison of queue occupancy probability from model and sim-ulation with different load. N = 120; LT = 60; HT = 80; h =
0:5; q = 1=6.
0.8 1 1.2 1.4 1.6 1.8 2 2.20
0.1
0.2
0.3
0.4
0.5
0.6
0.7
0.8
0.9
1
Load
Goo
dput
G for simulationG for modelGH for simulationGH for modelGL for simulationGL for model
Fig. 4. Goodput versus load for h = 0:5; N = 120; LT = 60; HT =
80; q = 1=6. G, GH and GL represents average goodput of all, highpriority, and low priority packets respectively.
agreement. Our proposed scheme results in the buffer occu-pancy varying betweenLT andHT for even high loads. Theexact value depends on the average message length, queuethresholds, etc.
Fig. 4 shows the goodput of the buffer using PEPD forq = 1=6 (i.e. mean message length of 6) as a function of theoffered load. In this figure, the probability that a message isof high priority is 0.5. From Fig. 4, it is clear that the re-sults from our model and computer simulation fit well. Sowe conclude that our model can be used to carry out an accu-rate analysis the PEPD policy. Therefore, in the rest of thissection, we will use results from only the model to analyzethe performance of PEPD policy.
Fig. 5 shows the goodput for q = 1=6 as a function ofthe offered load and for different mix (h) of high & low pri-ority packets. For a particular load, increasing the fractionof High Priority (HP) packets (h) results in a decrease ofthroughput of both high and Low Priority (LP) packets. TheLP throughput decreases because the increase in h results
0.8 1 1.2 1.4 1.6 1.8 2 2.20
0.1
0.2
0.3
0.4
0.5
0.6
0.7
0.8
0.9
1
Load
Goo
dput
G for 0.2G for 0.5G for 0.8GH for 0.2GH for 0.5GH for 0.8GL for 0.2GL for 0.5GL for 0.8
Fig. 5. Goodput versus load for h = 0:2; 0:5 and 0.8 with N =
120; LT = 60; HT = 80; q = 1=6. G, GH and GL represents aver-age goodput of all, high priority, and low priority packets respectively.
in fewer LP packets at the input to the buffer in addition toLP packets competing with more HP packets in the bufferspace (0 to LT). On the other hand, increase in h results inmore HP packets. Since the amount of buffer space (HT-LT)which is reserved for HP packets is the same, the through-put of HP packets decrease. Note that the decrease in thethroughput of LP is much faster than the decrease in HP re-sulting in the overall goodput (as defined by Eq. (20) beingconstant. Our proposed technique allows higher goodput forhigh priority packets which may required in scenarios wherean application may need a preferential treatment over otherapplications.
In Fig. 6, we fix LT while varying HT to observe the be-havior of the buffer. It is obvious that for a traffic containingfewer high priority packets, increasing the HT will increasethe performance of the buffer for high priority packets. Thisis because increasing HT will let the high priority packetsget more benefits from discarding low priority packets, es-pecially for lower values of HT . Increasing HT will resultin an initial increase in the goodput for high priority packetsfollowed by a decrease. This is obvious, because for a veryhigh value of HT , the behavior of PEPD will approach thatof PPD for high priority packets.
Fig. 7 shows the goodput for high priority message versusthe fraction of high priority messages. It is also clear that fora particular load, increasing the high priority traffic will de-crease the performance for high priority packets as has beenobserved in Fig 5.
Finally, in Fig. 8, we keep HT constant while changingLT . For a load of 1.6 and a particular mix of high & low pri-ority packets, we observe that the performance of high prior-ity packets is not very sensitive to a change in LT . However,when LT is set close to HT , the goodput for high prior-ity packets will decrease quickly. This is because when thetwo thresholds are set too close, the high priority packets donot get enough benefits from discarding low priority pack-ets. We suggest avoiding this mode of operation because the
NASA/TM—2001-210904 7

60 70 80 90 100 110 1200.4
0.5
0.6
0.7
0.8
0.9
1
High Threshold,HT
Goo
dput
for
high
prio
rity
GH for h=0.2GH for h=0.4GH for h=0.6GH for h=0.7GH for h=0.8GH for h=1.0
Fig. 6. Goodput for high priority messages versus HT for different h withLT = 60; q = 1=6 and input load of 1.6
0 0.1 0.2 0.3 0.4 0.5 0.6 0.7 0.8 0.9 10.4
0.5
0.6
0.7
0.8
0.9
1
Probability of high priority messages,h
Goo
dput
for
high
prio
rity
GH for load=1.2 HT=80GH for load=1.6 HT=80GH for load=2.0 HT=80GH for load=1.6 HT=100GH for load=1.6 HT=120
Fig. 7. Goodput of high priority messages versus h for different load andHT for LT = 60.
buffer is not fully utilized.
V. CONCLUSIONS
In this paper, we have proposed and developed a perfor-mance model for the Priority based Early Packet Discard(PEPD) to allow end to end QoS differentiation for appli-cations over Next Generation Internet. To verify the valid-ity of our proposed analytical model, we compared it withresults from computer simulation. Numerical results showthat the results from the model and computer simulation arein close agreement. The numerical results also show thatour proposed PEPD policy can provide differential QoS tolow and high priority packets. Such service differentiationis essential to provide QoS to applications running Differ-entiated service over ATM. Our result show that the per-formance of PEPD depends on the mix of high & low pri-ority traffic, threshold setting, average message length, etc.Given a certain QoS, the model can be used to dimension thesize of the buffer and the PEPD thresholds. Our model can
10 20 30 40 50 60 70 800.6
0.65
0.7
0.75
0.8
0.85
0.9
0.95
1
Low Threshold, LT
Goo
dput
for
high
prio
rity
GH for h=0.2GH for h=0.4GH for h=0.6GH for h=0.7GH for h=0.8GH for h=1.0
Fig. 8. Goodput for high priority versus LT for N = 120; HT = 80,load=1:6; q = 1=6.
serve as a framework to implement packet based discard-ing schemes using priority. Results show that this schemesolves some critical problems for running Differentiated Ser-vice (DS) over ATM network by ensuring the QoS promisedby the Differentiated Service.
REFERENCES
[1] S. Blake, D. Black, M. Carlson, Z. Wang, and W. Weiss, “An architec-ture for differentiated services.” RFC 2474, Internet Engineering TaskForce, December 1998.
[2] K. Nichols, V. Jacobson, and L. Zhang, “A two-bit differentiated ser-vices architecture for the internet.” RFC 2638, Internet EngineeringTask Force, July 1999.
[3] K. Nichols, S. Blake, F. Baker, and D.Black, “Definition of the differ-entiated services field (DS Field) in the IPv4 and IPv6 headers.” RFC2474, Internet Engineering Task Force, December 1998.
[4] J. Heinanen, F. Blaker, W. Weiss, and J. Wroclawski, “Assured for-wording PHB group.” RFC 2597, Internet Engineering Task Force,June 1999.
[5] X. Xiao and L. M. Ni, “Internet QoS: A big picture,” IEEE Network,pp. 8–18, April 1999.
[6] J. Nagle, “Congestion control in IP/TCP internetworks.” RFC 896,Internet Engineering Task Force, January 1984.
[7] V. Jacobson, “Congestion avoidance and control,” Proceedinds ofSIGCOMM’88, pp. 314–329, August 1988.
[8] A. Romanow and S. Floyd, “Dynamics of TCP traffic over ATM net-work,” IEEE Journal on Selected Areas in Communications, vol. 13,pp. 633–641, 1995.
[9] K. Kawahara, K. Kitajima, T. Takine, and Y. Oie, “Packet loss perfor-mance of the selective cell discard schemes in ATM switches,” IEEEJournal on Selected Areas in Communications, vol. 15, pp. 903–913,1997.
[10] M. Casoni and J. S. Turner, “On the performance of early packet dis-card,” IEEE Journal on Selected Areas in Communications, vol. 15,pp. 892–902, 1997.
[11] Y. Lapid, R. Rom, and M. Sidi, “Analysis of discarding policies inhigh-speed networks,” IEEE Journal on Selected Areas in Communi-cations, vol. 16, pp. 764–772, 1998.
[12] H. Li, K. Y. Siu, H. Y. Tzeng, H. Ikeda, and H. Suzuki, “On TCP per-formance in ATM networks with per-VC early packet discard mecha-nisms,” Computer Communications, vol. 19, pp. 1065–1076, 1996.
[13] J. S. Turner, “Maintaining high throughput during overload in ATMswitches,” IEEE INFOCOM ’96: Conference on Computer Commu-nications, San Fransisco, USA, pp. 287–295, Mar. 26-28 1996.
[14] I. Cidon, A. Khamisy, and M. Sidi, “Analysis of packet loss processesin high speed networks,” IEEE Transactions on Information Theory,vol. 39, pp. 98–108, 1993.
NASA/TM—2001-210904 8

Achieving End-to-end QoS in the Next Generation Internet:
Integrated Services over Differentiated Service Networks 1
Haowei Bai and Mohammed Atiquzzaman 2
Department of Electrical and Computer Engineering
The University of Dayton, Dayton, Ohio 45469-0226
E-mail: [email protected], [email protected]
William Ivancic
NASA Glenn Research Center
21000 Brookpark Rd. MS 54-8,
Cleveland, OH 44135
Abstract
Currently there are two approaches to provide Quality of Service (QoS) in the next generation
Internet: An early one is the Integrated Services (IntServ) with the goal of allowing end-to-end
QoS to be provided to applications; the other one is the Differentiated Services (DiffServ)
architecture providing QoS in the backbone. In this context, a DiffServ network may be viewed
as a network element in the total end-to-end path. The objective of this paper is to investigate
the possibility of providing end-to-end QoS when IntServ runs over DiffServ backbone in the
next generation Internet. Our results show that the QoS requirements of IntServ applications
can be successfully achieved when IntServ traffic is mapped to the DiffServ domain in next
generation Internet.
1The work reported in this project was supported by NASA grant no. NAG3-23182The second author is currently with the School of Computer Science, University of Oklahoma, Norman, OK
73072, Tel: (405) 325 8077, email: [email protected]
NASA/TM—2001-210904 9

1 Introduction
Quality of Service (QoS) has become the objective of the next generation Internet. QoS is generally
implemented by different classes of service contracts for different users. A service class may provide
low-delay and low-jitter services for customers who are willing to pay a premium price to run high-
quality applications, such as, real-time multimedia. Another service class may provide predictable
services for customers who are willing to pay for reliability. Finally, the best-effort service provided
by current Internet will remain for those customers who need only connectivity.
The Internet Engineering Task Force (IETF) has proposed a few models to meet the demand
for QoS. Notable among them are the Integrated Services (IntServ) model [1] and Differentiated
Services (DiffServ) [2] model. The IntServ model is characterized by resource reservation. Before
data is transmitted, applications must set up paths and reserve resources along the path. The
basic target of the evolution of IntServ is to support various applications with different levels of
QoS within the TCP/IP (Transport Control Protocol/Internet Protocol) architecture. But IntServ
implementation requires RSVP (Resources Reservation Protocol) signaling and resource allocations
at every network element along the path. This imposes a bound on its incorporation for the entire
Internet backbone.
The DiffServ model is currently being standardized to overcome the above scalability issue, and
to accommodate the various service guarantees required for time critical applications. The DiffServ
model utilizes six bits in the TOS (Type of Service) field of the IP header to mark a packet for
being eligible for a particular forwarding behavior. The model does not require significant changes
to the existing infrastructure, and does not need many additional protocols. Therefore, with the
implementation of IntServ for small WAN networks and DiffServ for the Internet backbone, the
present TCP/IP traffic can meet the present day demands of real time and other quality required
traffic. Combining IntServ and DiffServ has been proposed by IETF in [3] [4] as one of the possible
NASA/TM—2001-210904 10

solutions to overcome the scalability problem.
To combine the advantages of DiffServ (good scalability in the backbone) and IntServ (per
flow QoS guarantee), a mapping from IntServ traffic flows to DiffServ classes has to be performed.
Some preliminary work has been carried out in this area. Authors in [5] present a concept for the
integration of both IntServ and DiffServ, and describe a prototype implementation using commercial
routers. However, they don’t present any numerical results. Authors in [6] present results to
determine performance differences between IntServ and DiffServ, as well as some characteristics
about their combined use.
The objective of this paper is to investigate the end to end QoS that can be achieved when
IntServ runs over the DiffServ network in the next generation Internet. Our approach is to add
a mapping function to the edge DiffServ router so that the traffic flows coming from IntServ
domain can be appropriately mapped into the corresponding Behavior Aggregates of DiffServ, and
then marked with the appropriate DSCP (Differentiated Service Code Point) for routing in the
DiffServ domain. We show that, without making any significant changes to the IntServ or DiffServ
infrastructure and without any additional protocols or signaling, it is possible to provide QoS to
IntServ applications when IntServ runs over a DiffServ network.
The significance of this work is that end-to-end QoS over heterogeneous networks could be
possible if the DiffServ backbone is used to connect IntServ subnetworks in the next generation
Internet. The main contributions of this paper can be summarized as follows:
• Propose a mapping function to run IntServ over the DiffServ backbone.
• Show that QoS can be achieved by end IntServ applications when running over DiffServ
backbone in the next generation Internet.
The rest of this paper is organized as follows. In Sections 2 and 3, we briefly present the
NASA/TM—2001-210904 11

main features of IntServ and DiffServ, respectively. In Section 4, we describe our approach for the
mapping from IntServ to DiffServ and the simulation configuration to test the effectiveness of our
approach. In Section 5, we analyze our simulation results to show that QoS can be provided to end
applications in the IntServ domain. Concluding remarks are finally given in Section 6.
2 Integrated Services
The Integrated Services (IntServ) model [1] characterized by resource reservation defines a set
of extensions to the traditional best effort model with the goal of providing end-to-end QoS to
applications. This architecture needs some explicit signaling mechanism to convey information to
routers so that they can provide requested services to flows that require them. RSVP is one of the
most widely known example of such a signaling mechanism. We will describe this mechanism in
details in Section 2.2. In addition to the best effort service, the integrated services model provides
two service levels as follows.
• Guaranteed service [7] for applications requiring firm bounds on end-to-end datagram queue-
ing delays.
• Controlled-load service [8] for applications requiring services closely equivalent to that pro-
vided to uncontrolled best effort traffic under unloaded (lightly loaded) network conditions.
We will discuss them in Sections 2.3 and 2.4, respectively.
2.1 Components of Integrated Services
The basic framework of integrated services [4] is implemented by four components: the signaling
protocol (e.g., RSVP), the admission control routine, the classifier and the packet scheduler. In this
model, applications must set up paths and reserve resources before transmitting their data. Network
NASA/TM—2001-210904 12

path
resv
data
resvtear
pathtear
Sender Router1 Router2 Receiver
Figure 1: RSVP signaling for resource reservation.
elements will apply admission control to those requests. In addition, traffic control mechanisms on
the network element are configured to ensure that each admitted flow receives the service requested
in strict isolation from other traffic. When a router receives a packet, the classifier will perform
a MF (multifield) classification and put the packet in a specific queue. The packet scheduler will
then schedule the packet according to its QoS requirements.
2.2 RSVP Signaling
RSVP is a signaling protocol to reserve network resources for applications. Figure 1 illustrates
the setup and teardown procedures of PSVP protocol. The sender sends a PATH message to
the receiver specifying the characteristic of the required traffic. Every intermediate router along
the path forwards the PATH message to the next hop determined by the routing protocol. If
the receiver agrees the advertised flow, it sends a RESV message, which is forwarded hop by hop
via RSVP capable routers towards the sender of the PATH message. Every intermediate router
along the path may reject or accept the request. If the request is accepted, resources are allocated,
and RESV message is forwarded. If the request is rejected, the router will send an RESV-ERR
message back to the sender of the RESV message.
If the sender gets theRESV message, it means resources are reserved and data can be transmit-
ted. To terminate a reservation, a RESV-TEAR message is transmitted to remove the resource
NASA/TM—2001-210904 13

allocation and a PATH-TEAR message is sent to delete the path states in every router along the
path.
2.3 Guaranteed Service
Guaranteed service guarantees that datagrams will arrive within the guaranteed delivery time and
will not be discarded due to queue overflows, provided the flow’s traffic stays within its specified
traffic parameters [7]. The service provides assured level of bandwidth or link capacity for the data
flow. It imposes a strict upper bound on the end-to-end queueing delay as data flows through the
network. The packets encounter no queueing delay as long as they conform to the flow specifications.
It means packets cannot be dropped due to buffer overflow and they are always guaranteed the
required buffer space. The delay bound is usually large enough even to accommodate cases of long
queueing delays.
2.4 Controlled-load Service
The controlled-load service does not accept or make use of specific target values for control param-
eters such as delay or loss. Instead, acceptance of a request for controlled-load service is defined to
imply a commitment by the network elements to provide the requester with a service closely equiv-
alent to that provided to uncontrolled (best effort) traffic under lightly loaded conditions [8]. The
service aims at providing the same QoS under heavy loads as under unloaded conditions. Though
there is no specified strict bound on delay, it ensures that very high percentage of packets do not
experience delays highly greater than the minimum transit delay due to propagation and router
processing.
NASA/TM—2001-210904 14

3 Differentiated Services
The IntServ/RSVP architecture described in Section 2 can be used to provide QoS to applications.
All the routers are required to be capable of RSVP, admission control, MF classification and packet
scheduling, which needs to maintain all the information for each flow at each router. The above
issues raise scalability concerns in large networks [4]. Because of the difficulty in implementing and
deploying integrated services and RSVP, differentiated services is currently being developed by the
IETF [2].
Differentiated services (DiffServ) is intended to enable the deployment of scalable service dis-
crimination in the Internet without the need for per-flow state and signaling at every hop. The
premise of DiffServ networks is that routers in the core network handle packets from different traffic
streams by forwarding them using different per-hop behaviors (PHBs). The PHB to be applied
is indicated by a DiffServ Codepoint (DSCP) in the IP header of the packet [9]. The advantage
of such a mechanism is that several different traffic streams can be aggregated to one of a small
number of behavior aggregates (BA) which are each forwarded using the same PHB at the router,
thereby simplifying the processing and associated storage [10]. There is no signaling or processing
since QoS (Quality of Service) is invoked on a packet-by-packet basis [10].
The DiffServ architecture is composed of a number of functional elements, including a small set
of per-hop forwarding behaviors, packet classification functions, and traffic conditioning functions
which includes metering, marking, shaping and policing. The functional block diagram of a typical
DiffServ router is shown in Figure 2 [10]. This architecture provides Expedited Forwarding (EF)
service and Assured Forwarding (AF) service in addition to best-effort (BE) service as described
below.
NASA/TM—2001-210904 15

Diffservconfiguration &management
interface
Management
SNMP,COPSetc.
Data in
Ingressinterface
Classify,meter,action,
queueing
Routingcore
Egress interface
Classify,meter,action,
queueing
Data out
QoS agent(optional,
e.g. RSVP)QoS controlmessages
Figure 2: Major functional block diagram of a router.
3.1 Expedited Forwarding (EF)
This service is also been described as Premium Service. The EF service provides a low loss, low
latency, low jitter, assured bandwidth, end-to-end service for customers [11]. Loss, latency and jitter
are due to the queuing experienced by traffic while transiting the network. Therefore, providing
low loss, latency and jitter for some traffic aggregate means there are no queues (or very small
queues) for the traffic aggregate. At every transit node, the aggregate of the EF traffic’s maximum
arrival rate must be less than its configured minimum departure rate so that there is almost no
queuing delay for these premium packets. Packets exceeding the peak rate are shaped by the traffic
conditioners to bring the traffic into conformance.
3.2 Assured Forwarding
This service provides a reliable services for customers, even in times of network congestion. Classi-
fication and policing are first done at the edge routers of the DiffServ network. The assured service
traffic is considered in-profile if the traffic does not exceed the bit rate allocated for the service; oth-
erwise, the excess packets are considered out-of-profile. The in-profile packets should be forwarded
NASA/TM—2001-210904 16

AF11
AF12
AF13
AF21
AF22
AF23
AF31
AF32
AF33
AF41
AF42
AF43
Class 1 Class 2 Class 3 Class 4
Low dropprec
Highdropprec
Mediumdropprec
Figure 3: AF classes with drop precedence levels.
with high probability. However, the out-of-profile packets are not delivered with as high probability
as the traffic that is within the profile. Since the network does not reorder packets that belong to
the same microflow, all packets, irrespective of whether they are in-profile or out-of-profile, are put
into an assured queue to avoid out-of-order delivery.
Assured Forwarding provides the delivery of packets in four independently forwarded AF classes.
Each class is allocated with a configurable minimum amount of buffer space and bandwidth. Each
class is in turn divided into different levels of drop precedence. In the case of network congestion,
the drop precedence determines the relative importance of the packets within the AF class. Figure
3 [12] shows four different AF classes with three levels of drop precedence.
3.3 Best Effort
This is the default service available in DiffServ, and is also deployed by the current Internet. It
does not guarantee any bandwidth to the customers, but can only get the bandwidth available.
Packets are queued when buffers are available and dropped when resources are over committed.
NASA/TM—2001-210904 17

4 Integrated Services over Differentiated Services Networks
In this section, we describe in details the mapping strategy adopted in this paper to connect the
IntServ and DiffServ domains. Simulation configuration that has been used to test the mapping
strategy is described in 4.3 .
4.1 Mapping Considerations for IntServ over DiffServ
In IntServ, resource reservations are made by requesting a service type specified by a set of quan-
titative parameters known as Tspec (Traffic Specification). Each set of parameters determines
an appropriate priority level. When requested services with these priority levels are mapped to
DiffServ domain, some basic requirements should be satisfied.
• PHBs in DiffServ domain must be appropriately selected for each requested service in IntServ
domain.
• The required policing, shaping and marking must be done at the edge router of the DiffServ
domain.
• Taking into account the resource availability in DiffServ domain, admission control must be
implemented for requested traffic in IntServ domain.
4.2 Mapping Function
The mapping function is used to assign an appropriate DSCP to a flow specified by Tspec parameters
in IntServ domain, such that the same QoS could be achieved for IntServ when running over
DiffServ domain. Each packet in the flow from the IntServ domain has a flow ID indicated by the
value of flow-id field in the IP (Internet Protocol) header. The flow ID attributed with the Tspec
parameters is used to determine which flow the packet belongs to. The main constraint is that the
NASA/TM—2001-210904 18

IntServDomain
Map
ping
Fun
ctio
n
DiffServRouter
DiffServPackets
IntServPackets
Figure 4: Mapping function for integrated service over differentiated service.
PHB treatment of packets along the path in the DiffServ domain must approximate the QoS offered
by IntServ itself. In this paper, we satisfy the above requirement by appropriately mapping the
flows coming from IntServ domain into the corresponding Behavior Aggregates, and then marking
the packets with the appropriate DSCP for routing in the DiffServ domain.
To achieve the above goal, we introduce a mapping function at the boundary router in DiffServ
domain as shown in Figure 4. Packets specified by Tspec parameters in IntServ domain are first
mapped to the corresponding PHBs in the DiffServ domain by appropriately assigning a DSCP
according to the mapping function. The packets are then routed in the DiffServ domain where
they receive treatment based on their DSCP code. The packets are grouped to BAs in the DiffServ
domain. Table 1 shows an example mapping function which has been used in our simulation. As an
instance, a flow in IntServ domain specified by r=0.7Mb, b=5000bytes and Flow ID=0 is mapped
to EF PHB (with corresponding DSCP 101110) in DiffServ domain, where r means token bucket
rate and b means token bucket depth.
Table 1: An example mapping function used in our simulation.
Tspec Flow ID PHB DSCPr=0.7 Mb, b=5000 bytes 0 EF 101110r=0.7 Mb, b=5000 bytes 1 EF 101110r=0.5 Mb, b=8000 bytes 2 AF11 001010r=0.5 Mb, b=8000 bytes 3 AF11 001010r=0.5 Mb, b=8000 bytes 4 AF11 001010
NASA/TM—2001-210904 19

DSRouter
DSRouter
5Mb,1ms
2Mb,
0.1
ms
2Mb, 0.1m
s
2Mb, 0.1m
s
2Mb,0.1ms
2Mb,
0.1
ms
2Mb, 0.1m
s
2Mb,
0.1
ms
2Mb,
0.1ms
TwoGuaranteed
serviceSources
ThreeControlled-load
Sources
FiveBest-effortSources
IntServDestinations
IntServSources
0
1
2
4
5
9
0
1
2
4
5
9
Figure 5: Network simulation configuration.
The sender initially specifies its requested service using Tspec. Note that it is possible for
different senders to use the same Tspec. However, they are differentiated by the flow ID. In addition,
it is also possible that different flows can be mapped to the same PHB in DiffServ domain.
4.3 Simulation Configuration
To test the effectiveness of our proposed mapping strategy between IntServ and DiffServ and to
determine the QoS that can be provided to IntServ applications, we carried out simulation using
the ns (Version 2.1b6) simulation tool from Berkeley [13]. The network configuration used in our
simulation is shown in Figure 5.
Ten IntServ sources were used in our simulation, the number of sources generating Guaranteed
services, Controlled-load services and best-effort services were two, three and five respectively. Ten
IntServ sinks served as destinations for the IntServ sources. We set the flow IDs to be the same as
the corresponding source number shown in Figure 5.
NASA/TM—2001-210904 20

EF PQ Queue
AF RIO Queue
BE RED Queue
Figure 6: Queues inside the edge DiffServ router.
All the links in Figure 5 are labeled with a (bandwidth, propagation delay) pair. The mapping
function shown in Table 1 has been integrated into the DiffServ edge router (See Figure 4). CBR
(Constant Bit Rate) traffic was used for all IntServ sources in our simulation so that the relationship
between the bandwidth utilization and bandwidth allocation can be more easily evaluated. Note
that ten admission control modules have been applied to each link between sources and DiffServ
edge routers to guarantee the resource availability within DiffServ domain. To save space, they are
not illustrated in Figure 5. Admission control algorithm was implemented by token bucket with
parameters specified in Table 1.
Inside the DiffServ edge router, EF queue was configured as a simple Priority Queue with Tail
Drop; AF queue was configured as RIO queue and BE queue as a RED [14] queue, which are
shown in Figure 6. The queue weights of EF, AF and BE queues were set to 0.4, 0.4 and 0.2
respectively. Since the bandwidth of the bottleneck link between two DiffServ routers is 5 Mb, the
above scheduling weights implies bandwidth allocations of 2 Mb, 2 Mb and 1 Mb for the EF, AF
and BE links respectively during periods of congestion at the edge router.
5 Simulation Results
In this section, results obtained from our simulation experiments are presented. The criteria used to
evaluate our proposed strategy are first described followed by the explanations of our experimental
NASA/TM—2001-210904 21

and numerical results.
5.1 Performance Criteria
To show the effectiveness of our mapping strategy in providing QoS to end IntServ applications,
we have used goodput, queue size and drop ratio as the performance criteria. In addition, in order
to prove the effectiveness of admission control mechanism, we also measured the non-conformant
ratio (the ratio of non-conformant packets out of in-profile packets). In Section 5.2, we present the
results of measurements of the above quantities from our simulation experiments.
5.2 QoS Obtained by Guaranteed Services
We use the following three simulation cases to determine the QoS obtained by IntServ applications.
As results, Table 2 shows the goodput of each Guaranteed service source for three different cases
described in Section 5.2. Table 3 shows the drop ratio measured at the scheduler for three cases
of the Guaranteed service sources. Table 4 shows the non-conformant ratio for each Guaranteed
service source. Figures 7, 8 and 9 show the queue size for each of the three case, from which the
queuing delay and jitter can be evaluated.
Table 2: Goodput of each Guaranteed service source (Unit: Kb/S)
Tspec Flow ID Case 1 Case 2 Case 3r=0.7 Mb, b=5000 bytes 0 699.8250 699.8039 459.8790r=0.7 Mb, b=5000 bytes 1 699.8039 699.6359 1540.1400
Table 3: Drop ratio of Guaranteed service traffic.
Type of traffic Case 1 Case 2 Case 3Guaranteed service Traffic 0.000000 0.000000 0.258934
NASA/TM—2001-210904 22

Table 4: The non-conformant ratio for each Guaranteed service source
Tspec Flow ID Case 1 Case 2 Case 3r=0.7 Mb, b=5000 bytes 0 0.00026 0.00026 0.00026r=0.7 Mb, b=5000 bytes 1 0.00026 0.22258 0.00040
5.2.1 Case 1: No congestion; no excessive traffic
The traffic generated by Guaranteed service sources (source 0 and source 1) were set to 0.7 Mb and
0.7 Mb, respectively. In this case, the traffic rate is equal to the bucket rate (0.7 Mb, shown in
Table 1), which means there should not be any significant excessive IntServ traffic. According to
the network configuration described in Section 4.3, two Guaranteed service sources generate 1.4 Mb
traffic which is less than the corresponding scheduled link bandwidth for Guaranteed service (EF in
DiffServ domain) traffic (2Mb). Under this scenario, there should not be any significant congestion
at the edge DiffServ router.
Case 1 is an ideal case. As seen in Table 2, the goodput is almost equal to the corresponding
source rate. From Table 3, since there is no significant congestion, the drop ratio of each type
of sources is zero. Table 4 shows the performance of admission control mechanism. Since there
is no excessive traffic in this case, the non-conformant ratio is almost zero. Figure 7 shows the
queuing performance of each queue. Because this is an ideal case, the size of each queue is very
small. Though the three queues have almost the same average size, we observe that the BE queue
of IntServ (mapping to BE queue in DiffServ domain, according to the mapping function) has the
largest jitter.
5.2.2 Case 2: No congestion; Guaranteed service source 1 generates excessive traffic
The traffic generated by Guaranteed service sources (source 0 and source 1) were set to 0.7 Mb and
0.9 Mb, respectively. In this case, the traffic rate of source 1 is greater than its corresponding bucket
NASA/TM—2001-210904 23

QueueSizeVS.Time
CL(AF11)q.tr
BE(BE)q.tr
GL(EF)q.tr
QueueSize
Time
0.0000
0.5000
1.0000
1.5000
2.0000
2.5000
3.0000
3.5000
4.0000
4.5000
5.0000
0.0000 20.0000 40.0000 60.0000 80.0000 100.0000
Figure 7: Queue size plots for Case 1.
rate (0.7 Mb, shown in Table 1), which means source 1 generates excessive IntServ traffic. According
to the network configuration described in Section 4.3, two Guaranteed service sources generate 1.6
Mb traffic which is less than the corresponding scheduled link bandwidth for Guaranteed service
(EF in DiffServ domain) traffic (2Mb). Under this scenario, there should not be any significant
congestion at the edge DiffServ router.
In case 2, from Table 2, the goodput of source 0 is equal to its source rate. However, the
goodput of source 1 is equal to the corresponding token rate, 0.7 Mb, rather than its source rate,
0.9 Mb. Table 3 shows that the drop ratio of Guaranteed service is 0. The reason is that, in this
case, there is no congestion for Guaranteed service traffic. Table 4 indicates how the admission
control mechanism works. As seen in this table, the non-conformant packets ratio of source 1 is
increased, compared to case 1. It is because source 1 generates excessive traffic in this case. From
Figure 8, we find that the average queue size of the best effort queue is far greater than the other
NASA/TM—2001-210904 24

QueueSizeVS.Time
CL(AF11)q.tr
BE(BE)q.tr
GL(EF)q.tr
QueueSize
Time
0.0000
0.5000
1.0000
1.5000
2.0000
2.5000
3.0000
3.5000
4.0000
4.5000
5.0000
0.0000 20.0000 40.0000 60.0000 80.0000 100.0000
Figure 8: Queue size plots for Case 2.
two types of sources. In addition, the jitter of best effort traffic is also greater than the other
two types of sources. The Guaranteed service traffic has the smallest average queue size and the
smallest jitter. In addition, compared with Figure 7, the upper bound of Guaranteed service queue
is guaranteed, though the source 1 generates more traffic than what it has reserved. This well
satisfies requirements from [7].
5.2.3 Case 3: Guaranteed service gets into congestion; no excessive traffic
The traffic generated by Guaranteed service sources (source 0 and source 1) were set to 0.7 Mb
and 2 Mb, respectively. To simulate a congested environment, we set the token rate of source
1 to 2 Mb also. In this case, the traffic rate of source 1 is equal to its corresponding bucket
rate (2 Mb), which means there is no significant excessive IntServ traffic. According to the network
configuration described in Section 4.3, two Guaranteed service sources generate 2.7 Mb traffic which
NASA/TM—2001-210904 25

QueueSizeVS.Time
CL(AF11)q.tr
BE(BE)q.tr
GL(EF)q.tr
QueueSize
Time
0.0000
0.5000
1.0000
1.5000
2.0000
2.5000
3.0000
3.5000
4.0000
4.5000
5.0000
5.5000
6.0000
6.5000
7.0000
7.5000
8.0000
8.5000
9.0000
9.5000
10.0000
0.0000 20.0000 40.0000 60.0000 80.0000 100.0000
Figure 9: Queue size plots for Case 3.
is greater than the corresponding scheduled link bandwidth for Guaranteed service (EF in DiffServ
domain) traffic (2Mb). Under this scenario, Guaranteed service traffic gets into congestion at the
edge DiffServ router.
Case 3 is used to evaluate our mapping function under congested environments. As expected, we
find the drop ratio (measured at scheduler) of Guaranteed service traffic is increased, and the total
goodput of Guaranteed service is limited by the output link bandwidth assigned by the scheduler
(2Mb), instead of 2.7 Mb. Since there is no excessive traffic, from Table 4, the no-conformant
packets ratio of both of the Guaranteed service sources are closed to 0. From Figure 9, since we
increase the token rate of one of the Guaranteed service source (source 1), the upper bound of
Guaranteed service is increased, which is reasonable. In addition, the Guaranteed service queue still
has the smallest jitter.
NASA/TM—2001-210904 26

5.3 QoS Obtained by Controlled-load Services
Because of the similarity between the results of Guaranteed service and Controlled-load service, all
our descriptions in Section 5.2 are focused on Guaranteed service. We only give out results for
Controlled-load service without detailed explanations.
We use case 2 described in Section 5.2.2 as an example. As described in Section 4.3, we used
three Controlled-load service sources in our simulation: sources 2, 3 and 4. The token bucket
parameters are shown in Table 1. We set the source rate of sources 2 and 4 to 0.5 Mb, 0.5 Mb,
respectively, and set the rate of source 3 to 0.7 Mb (greater than its token rate, 0.5 Mb). Therefore,
source 3 generates excessive traffic. The total Controlled-load service traffic is 1.7 Mb, which is less
than the scheduled link bandwidth; therefore, there should not be any significant congestion.
Table 5 shows the goodput of each Controlled-load source. Table 6 shows the drop ratio of
Controlled-load service measured at scheduler. Table 7 shows the non-conformant ratio. Figure 10
shows the queue size of this case. Note that though the non-conformant ratio of source 3 is much
higher that the other two (shown in Table 7), the goodput of source3 (shown in Table 5) is equal to
its source rate (0.7 Mb). It is because the non-conformant packets are degraded and then forwarded,
which is one of the forwarding schemes for non-conformant packets proposed by [8].
Table 5: Goodput of each Controlled-load service source (Unit: Kb/S)
Tspec Flow ID Case 2r=0.5 Mb, b=8000 bytes 2 499.9889r=0.5 Mb, b=8000 bytes 3 700.0140r=0.5 Mb, b=8000 bytes 4 499.9889
Table 6: Drop ratio of Controlled-load service traffic.
Type of traffic Case 2Controlled-load Traffic 0.000000
NASA/TM—2001-210904 27

Table 7: The non-conformant ratio for each Controlled-load service source
Tspec Flow ID Case 2r=0.5 Mb, b=8000 bytes 2 0.00000r=0.5 Mb, b=8000 bytes 3 0.28593r=0.5 Mb, b=8000 bytes 4 0.00000
QueueSizeVS.Time
CL(AF11)q.tr
BE(BE)q.tr
GL(EF)q.tr
QueueSize
Time
0.0000
0.5000
1.0000
1.5000
2.0000
2.5000
3.0000
3.5000
4.0000
4.5000
5.0000
0.0000 20.0000 40.0000 60.0000 80.0000 100.0000
Figure 10: Queue size plots.
5.4 Observations
From the above results, we can arrive at the following observations:
• The upper bound of queueing delay of Guaranteed service is guaranteed. In addition, Guaran-
teed service always has the smallest jitter without being affected by other traffic flows, though
[7] says it does not attempt to minimize the jitter. This well satisfies requirements from [7].
• The Controlled-load service has the smaller jitter and queue size than the best effort traffic.
Furthermore, non-conformant packets are degraded and then forwarded, which is proved by
NASA/TM—2001-210904 28

our simulation. This well satisfies requirements from [8].
We therefore, conclude that the QoS requirements of IntServ can be successfully achieved when
IntServ traffic is mapped to the DiffServ domain in next generation Internet.
6 Conclusion
In this paper, we have proposed DiffServ as the backbone network to interconnect IntServ sub-
networks. We have designed a mapping function to map traffic flows coming from IntServ with
different priorities to the corresponding PHBs in the DiffServ domain.
The proposed scheme has been studied in detail using simulation. It has been found that the
QoS requirements of IntServ can be achieved when IntServ subnetworks run over DiffServ. We
have illustrated our scheme by mapping IntServ traffic of three different priorities to the three
service classes of DiffServ. The ability of our scheme to provide QoS to end IntServ applications
has been demonstrated by measuring the drop ratio, goodput, non-conformant ratio and queue
size. We found that the upper bound of queueing delay of Guaranteed service is guaranteed. In
addition, Guaranteed service always has the smallest jitter without being affected by other traffic
flows, though [7] says it does not attempt to minimize the jitter. The Controlled-load service has
the smaller jitter and queue size than the best effort traffic. Furthermore, non-conformant packets
are degraded and then forwarded, which is proved by our simulation.
Acknowledgements
The authors thank NASA Glenn Research Center for support of this project. Jyotsna Chitri carried
out some initial work on this project.
NASA/TM—2001-210904 29

References
[1] R. Braden, D. Clark, and S. Shenker, “Integrated services in the internet architecture: an
overview.” RFC 1633, June 1994.
[2] S. Blake, D. Black, M. Carlson, E. Davies, Z. Wang, and W. Weiss, “An architecture for
differentiated services.” RFC 2475, December 1998.
[3] J. Wroclawski and A. Charny, “Integrated service mapping for differentiated services net-
works.” draft-ietf-issll-ds-map-00.txt, March 2000.
[4] Y. Bernet, R. Yavatkar, P. Ford, F. Baker, L. Zhang, M. Speer, R. Braden, B. Davie, J.
Wroclawski, and E. Felstaine, “A framework for integrated services operation over diffserv
networks.” draft-ietf-issll-diffserv-rsvp-04.txt, March 2000.
[5] R. Balmer, F. Baumgarter, and T. Braun, “A concept for RSVP over diffserv,” Proc. Nineth
ICCCN’2000, Las Vagas, NV, October 2000.
[6] J. Harju and P. Kivimaki, “Co-operation and comparison of diffserv and intserv: Performance
measurements,” Proc. 25th Conference on Local Computer Networks, Tampa, FL, pp. 177–186,
November 2000.
[7] S. Shenker, C. Partridge, and R. Guerin, “Specification of guaranteed quality of service.” RFC
2212, September 1997.
[8] J. Wroclawski, “Specification of the controlled-load network element service.” RFC 2211,
September 1997.
[9] K. Nichols, S.Blake, F. Baker, and D.Black, “Definition of the differentiated services field
(DS field) in the IPv4 and IPv6 headers.” RFC 2474, December 1998.
NASA/TM—2001-210904 30

[10] Y. Bernet, S. Blake, D. Grossman, and A. Smith, “An informal management model for diffserv
routers.” draft-ietf-diffserv-model-04.txt, July 2000.
[11] V. Jacobson, K. Nichols, and K. Poduri, “An expedited forwarding PHB.” RFC 2598, June
1999.
[12] J. Heinanen, F. Baker, W. Weiss, and J. Wroclawski, “Assured forwarding PHB group.” RFC
2597, June 1999.
[13] VINT Project U.C. Berkeley/LBNL, “ns v2.1b6: Network simulator.” http://www-
mash.cs.berkeley.edu/ns/, January 2000.
[14] S. Floyd and V. Jacobson, “Random early detection gateways for congestion avoidance,”
IEEE/ACM Transactions on Networking, vol. 1, no. 4, pp. 397–413, August 1993.
NASA/TM—2001-210904 31


Achieving QoS for Aeronautical Telecommunication Networksover Differentiated Services 1
Haowei Bai and Mohammed Atiquzzaman 2
Department of Electrical and Computer EngineeringThe University of Dayton, Dayton, Ohio 45469-0226
E-mail: [email protected], [email protected] Ivancic
NASA Glenn Research Center21000 Brookpark Rd. MS 54-8,
Cleveland, OH 44135
Abstract
Aeronautical Telecommunication Network (ATN) has been developed by the InternationalCivil Aviation Organization to integrate Air-Ground and Ground-Ground data communicationfor aeronautical applications into a single network serving Air Traffic Control and AeronauticalOperational Communications [1]. To carry time critical information required for aeronauti-cal applications, ATN provides different Quality of Services (QoS) to applications. ATN hastherefore, been designed as a standalone network which implies building an expensive separatenetwork for ATN. However, the cost of operating ATN can be reduced if it can be run overa public network such as the Internet. Although the current Internet does not provide QoS,the next generation Internet is expected to provide QoS to applications. The objective of thispaper is to investigate the possibility of providing QoS to ATN applications when it is run overthe next generation Internet. Differentiated Services (DiffServ), one of the protocols proposedfor the next generation Internet, will allow network service providers to offer different QoS tocustomers. Out results show that it is possible to provide QoS to ATN applications when theyrun over a DiffServ backbone.
1 Introduction
The International Civil Aviation Organization (ICAO) has developed the Aeronautical Telecom-munication Network (ATN) as a commercial infrastructure to integrate Air-Ground and Ground-Ground data communication into a single network to serve air traffic control and aeronauticaloperational communications [1]. One of the objectives of ATN internetwork is to accommodate dif-ferent Quality of Service (QoS) required by ATSC (Air Traffic Services Communication) and AINSC(Aeronautical Industry Service Communication) applications, and the organizational policies forinterconnection and routing specified by each participating organization. In the ATN, priority hasthe essential role of ensuring that high priority safety related and time critical data are not delayedby low priority non-safety data, especially when the network is overloaded with low priority data.
The time critical information carried by ATN and the QoS required by ATN applications has ledto the development of the ATN as an expensive independent network. The largest public network,the Internet, only offers point-to-point best-effort service to the users and hence is not suitable forcarrying time critical ATN traffic. However, the rapid commercialization of the Internet has givenrise to demands for QoS over the Internet.
QoS is generally implemented by different classes of service contracts for different users. Aservice class may provide low-delay and low-jitter services for customers who are willing to pay
1The work reported in this project was supported by NASA grant no. NAG3-23182The second author is currently with the School of Computer Science, University of Oklahoma, Norman, OK
73072, Tel: (405) 325 8077, email: [email protected]
NASA/TM—2001-210904 33

a premium price to run high-quality applications, such as, real-time multimedia. Another serviceclass may provide predictable services for customers who are willing to pay for reliability. Finally,the best-effort service provided by current Internet will remain for those customers who need onlyconnectivity.
The Internet Engineering Task Force (IETF) has proposed a few models to meet the demandfor QoS. Notable among them are the Integrated Services (IntServ) model [2] and DifferentiatedServices (DiffServ) [3] model. The IntServ model is characterized by resource reservation; beforedata is transmitted, applications must set up paths and reserve resources along the path. Thisgives rise to scalability issues in the core routers of large networks. The DiffServ model is currentlybeing standardized to overcome the above scalability issue, and to accommodate the various serviceguarantees required for time critical applications. The DiffServ model utilizes six bits in the TOS(Type of Service) field of the IP header to mark a packet for being eligible for a particular forwardingbehavior. It The model does not require significant changes to the existing infrastructure, and doesnot need too many additional protocols.
A significant cost saving can be achieved if the ATN protocol could be run over the next gen-eration Internet protocol as shown in Figure 1. In this paper, we are interested in developing aframework to run ATN over the next generation Internet. This requires appropriate mapping ofparameters at the edge routers between the two networks. The objective of this paper is to investi-gate the QoS that can be achieved when ATN runs over the DiffServ network in the next generationInternet. Based on the similarity between an IP packet and an ATN packet, our approach is toadd a mapping function to the edge DiffServ router so that the traffic flows coming from ATN canbe appropriately mapped into the corresponding Behavior Aggregates of DiffServ, and then markedwith the appropriate DSCP (Differentiated Service Code Point) for routing in DiffServ domain.We show that, without making any significant changes to the ATN or DiffServ infrastructure andwithout any additional protocols or signaling, it is possible to provide QoS to ATN applicationswhen ATN runs over a DiffServ network.
The significance of this work is that considerable cost savings could be possible if the nextgeneration Internet backbone can be used to connect ATN subnetworks. The main contributionsof this paper can be summarized as follows:
• Propose a framework to run ATN over the DiffServ network.
• Show that QoS can be achieved by end ATN applications when run over the next generationInternet.
The rest of this paper is organized as follows. In Sections 2 and 3, we briefly present themain features of ATN and DiffServ, respectively. In Section 4, we describe our approach for theinterconnection of ATN and DiffServ and the simulation configuration to test the effectiveness ofour approach. In Section 5, we analyze our simulation results to show that QoS can be providedto end applications in the ATN domain. Concluding remarks are finally given in Section 6.
2 Aeronautical Telecommunication Network (ATN)
In the early 1980s, the International Civil Aviation Organization (ICAO ) recognized the increasinglimitations of the present air navigation systems and the need for improvements to take civil aviationinto the 21st century. The need for changes in the current global air navigation system is due totwo principal factors:
• The present and growing air traffic demand which the current system will be unable to cope.
NASA/TM—2001-210904 34

NextGeneration
Internet
ATN
ATNDS Edge Router
DSEdgeRouter
Air-GroundCommunication
Air-GroundCommunication
Ground-GroundCommunication
Figure 1: Interconnection between ATN and Differentiated Services.
• The need for global consistency in the provisioning of air traffic services during the progressiontowards a seamless air traffic management system.
The above factors gave rise to the concept of the Aeronautical Telecommunication Network (ATN) [4].ATN is both a ground-based network providing communications between ground-based users,
and an air-ground network providing communications between airborne and ground users. It wasalways intended that ATN should be built on existing technologies instead of inventing new ap-proaches. The Internet approach was seen as the most suitable approach, and was therefore selectedas the basis for the ATN. ATN is made up of End Systems, Intermediate Systems, ground-groundsubnetworks and air-ground subnetworks as shown in Figure 1.
2.1 Priority in ATN
The ATN has been designed to provide a high reliability/availability network by ensuring thatthere is no single point of failure, and by permitting the availability of multiple alternative routesto the same destination with dynamic switching between alternatives. Every ATN user data isgiven a relative priority on the network in order to ensure that low priority data does not impedethe flow of high priority data. The purpose of priority is to signal the relative importance and(or) precedence of data, such that when a decision has to be made as to which data to act first,or when contention for access to shared resources has to be resolved, the decision or outcomecan be determined unambiguously and in line with user requirements both within and betweenapplications.
Priority in ATN is signaled separately by the application in the transport layer, network layer,and in ATN subnetworks, which gives rise to Transport Priority, Network Priority and SubnetPriority [5]. Network priority is used to manage the access to network resources. During periods ofhigh network utilization, higher priority NPDUs (Network Protocol Data Units) may therefore beexpected to be more likely to reach their destination (i.e. be less likely to be discarded by a congestedrouter), and to have a lower transit delay (i.e. be more likely to be selected for transmission froman outgoing queue) than lower priority packets. In this paper, we focus on network priority which
NASA/TM—2001-210904 35

Data
Network Layer
Length Indicator
Version/Protocol ID
Lifetime
SP MS E/R
Type
Segment Length
Checksum
Destination Address Length Indicator
Destination Address
Source Address Length Indicator
Source Address
Segment Offset
Total Length
Options
Data Unit Identifier
ATN PacketIP Packet
Version Field
Internet Header
Type of service
Total Length
Identification
0 DF MF
Fragment Offset
Time to Live
Protocol
Header checksum
Source Address
Destination address
Options Field
Data
Priority
0 0 0 0 Priority
1110 high1101110010111010100110000111011001010100001100100001-low0000-normal
Figure 2: Similarity between an IP packet and an ATN packet
determines the sharing of limited network resources.
2.2 ATN packet format
Figure 2 shows the correspondence between the fields of an IP packet header and the network layerpacket header of ATN. It is seen that the fields of IP and ATN packets carry similar information,and thus can almost be mapped to each other. This provides the possibility for mapping ATNto DiffServ (which uses the IP packet header except for the Type of Service byte) to achieve therequired QoS when they are interconnected.
The NPDU header of an ATN packet contains an option part including an 8-bit field namedPriority which indicates the relative priority of the NPDU [1]. The values 0000 0001 through0000 1110 are to be used to indicate the priority in an increasing order. The value 0000 0000indicates normal priority.
3 Differentiated Services
Differentiated services (Diffserv) is intended to enable the deployment of scalable service discrimi-nation in the Internet without the need for per-flow state and signaling at every hop. The premiseof Diffserv networks is that routers in the core network handle packets from different traffic streamsby forwarding them using different per-hop behaviors (PHBs). The PHB to be applied is indicatedby a Diffserv Codepoint (DSCP) in the IP header of the packet [6]. The advantage of such amechanism is that several different traffic streams can be aggregated to one of a small number ofbehavior aggregates (BA) which are each forwarded using the same PHB at the router, therebysimplifying the processing and associated storage [7]. There is no signaling or processing since QoS(Quality of Service) is invoked on a packet-by-packet basis [7].
NASA/TM—2001-210904 36

Diffservconfiguration &management
interface
Management
SNMP,COPSetc.
Data in
Ingressinterface
Classify,meter,action,
queueing
Routingcore
Egress interface
Classify,meter,action,
queueing
Data out
QoS agent(optional,
e.g. RSVP)QoS controlmessages
Figure 3: Major functional block diagram of a router.
The Diffserv architecture is composed of a number of functional elements, including a small setof per-hop forwarding behaviors, packet classification functions, and traffic conditioning functionswhich includes metering, marking, shaping and policing. The functional block diagram of a typicalDiffserv router is shown in Figure 3 [7]. This architecture provides Expedited Forwarding (EF)service and Assured Forwarding (AF) service in addition to best-effort (BE) service as describedbelow.
3.1 Expedited Forwarding (EF)
This service is also been described as Premium Service. The EF service provides a low loss, lowlatency, low jitter, assured bandwidth, end-to-end service for customers [8]. Loss, latency and jitterare due to the queuing experienced by traffic while transiting the network. Therefore, providinglow loss, latency and jitter for some traffic aggregate means there are no queues (or very smallqueues) for the traffic aggregate. At every transit node, the aggregate of the EF traffic’s maximumarrival rate must be less than its configured minimum departure rate so that there is almost noqueuing delay for these premium packets. Packets exceeding the peak rate are shaped by the trafficconditioners to bring the traffic into conformance.
3.2 Assured Forwarding
This service provides a reliable services for customers, even in times of network congestion. Classi-fication and policing are first done at the edge routers of the DiffServ network. The assured servicetraffic is considered in-profile if the traffic does not exceed the bit rate allocated for the service; oth-erwise, the excess packets are considered out-of-profile. The in-profile packets should be forwardedwith high probability. However, the out-of-profile packets are not delivered with as high probabilityas the traffic that is within the profile. Since the network does not reorder packets that belong tothe same microflow, all packets, irrespective of whether they are in-profile or out-of-profile, are putinto an assured queue to avoid out-of-order delivery.
Assured Forwarding provides the delivery of packets in four independently forwarded AF classes.Each class is allocated with a configurable minimum amount of buffer space and bandwidth. Each
NASA/TM—2001-210904 37

AF11
AF12
AF13
AF21
AF22
AF23
AF31
AF32
AF33
AF41
AF42
AF43
Class 1 Class 2 Class 3 Class 4
Low dropprec
Highdropprec
Mediumdropprec
Figure 4: AF classes with drop precedence levels
class is in turn divided into different levels of drop precedence. In the case of network congestion,the drop precedence determines the relative importance of the packets within the AF class. Figure4 [9] shows four different AF classes with three levels of drop precedence.
3.3 Best Effort
This is the default service available in DiffServ, and is also deployed by the current Internet. Itdoes not guarantee any bandwidth to the customers, but can only get the bandwidth available.Packets are queued when buffers are available and dropped when resources are over committed.
4 ATN over Differentiated Services
In this section, we describe in detail the mapping strategy adopted in this paper to connect theATN and DS domains followed by the simulation configuration we have used to test the mapping.
4.1 Mapping Function
Our goal is to use differentiated services to achieve QoS for ATN to integrate Air/Ground andGround/Ground data communications into a global Internet serving Air Traffic Control (ATC) andAeronautical Operations Communications (AOC). The main constraint is that the PHB treatmentof packets along the path in the DiffServ domain must approximate the QoS offered in the ATNnetwork. In this paper, we satisfy the above requirement by appropriately mapping the trafficcoming from ATN into the corresponding Behavior Aggregates, and then marking the packets withthe appropriate DSCP for routing in the DiffServ domain.
To achieve the above goal, we introduce a mapping function at the boundary router betweenthe ATN and DiffServ domain as shown in Figure 5. Packets with different priorities from theATN domain are first mapped to the corresponding PHBs in the DiffServ domain by appropriatelyassigning a DSCP according to the mapping function. The packets are then routed in the DiffServdomain where they receive treatment based on their DSCP code. The packets are grouped to BAsin the DiffServ domain. Table 1 shows an example mapping function which has been used in oursimulation.
NASA/TM—2001-210904 38

ATNDomain
Map
ping
Fun
ctio
n
DS Router
DS PacketsATN Packets
Figure 5: Mapping function for ATN over Differentiated Service.
Table 1: An example mapping function used in our simulation.
ATN Priority Code Priority PHB DSCP0000 0000 Normal BE 0000000000 0111 Medium AF11 0010100000 1110 High EF 101110
4.2 Simulation Configuration
To test the effectiveness of our proposed mapping strategy between ATN and DiffServ and todetermine the QoS that can be provided to ATN applications, we carried out simulation usingthe ns (Version 2.1b6) simulation tool from Berkeley [10]. The network configuration used in oursimulation is shown in Figure 6.
Ten ATN sources were used in our simulation, the number of sources generating high, mediumand normal priority packets were two, three and five respectively. Ten ATN sinks served as desti-nations for the ATN sources.
All the links in Figure 6 are labeled with a (bandwidth, propagation delay) pair. For the purposeof ATN over Diffserv, the mapping function shown in Table 1 has been integrated into the edgeDiffServ router. CBR (Constant Bit Rate) traffic was used for all ATN sources in our simulationso that the relationship between the bandwidth utilization and bandwidth allocation can be moreeasily evaluated.
Inside the DiffServ router, EF queue was configured as a simple Priority Queue with TailDrop. AF queue was configured as RIO queue and BE queue as a RED [11] queue. The queueweights of EF, AF and BE queues were set to 0.4, 0.4 and 0.2 respectively. Since the bandwidthof the bottleneck link between two DiffServ routers is 5 Mb, the above scheduling weights impliesbandwidth allocations of 2 Mb, 2 Mb and 1 Mb for the EF, AF and BE links respectively duringperiods of congestion at the edge router.
5 Simulation Results
In this section, results obtained from our simulation experiments are presented. The criteria usedto evaluate our proposed strategy are described followed by the description of our experiments andnumerical results.
NASA/TM—2001-210904 39

DSRouter
DSRouter
5Mb,1ms
2Mb,
0.1
ms
2Mb, 0.1m
s
2Mb, 0.1m
s
2Mb,0.1ms
2Mb,
0.1
ms
2Mb, 0.1m
s
2Mb,
0.1
ms
2Mb,
0.1ms
2 ATNSources
withPriorityCode:
0000 1110
3 ATNSources
withPriorityCode:
0000 0111
5 ATNSources
withPriorityCode:
0000 0000
ATN SinksATN Sources
0
1
2
4
5
9
0
1
2
4
5
9
Figure 6: Network configuration
5.1 Performance Criteria
To show the effectiveness of our mapping strategy in providing QoS to end ATN applications, wehave used goodput, queue size and drop ratio as the performance criteria. In the next section, wepresent the results of measurements of the above quantities from our simulation experiments.
5.2 Simulation Cases
We use the following four simulation cases to determine the QoS obtained by ATN sources.
• Case 1: No congestion: The traffic generated by the each high, medium and normalpriority sources were set to 1 Mb, 0.666 Mb and 0.2 Mb respectively. According to the networkconfiguration described in Section 4.2, there are two, three and five sources generating high,medium and normal priority traffic of 2Mb, 2Mb and 1Mb respectively. The amount oftraffic of different priority are equal to the corresponding output link bandwidth assigned byscheduler described in Section 4.2. Under this scenario, there should not be any significantcongestion at the edge DiffServ router because the sum of the traffic from the sources is equalto the bandwidth of the bottleneck link.
• Case 2: Normal priority traffic gets into congestion: The traffic generated by theeach high, medium and normal priority sources were set to 1 Mb, 0.666 Mb and 0.6 Mbrespectively. According to the network configuration described in Section 4.2, there are two,three and five sources generating high, medium and normal priority traffic of 2Mb, 2Mband 3Mb respectively. The amount of traffic of high and medium priority are still equalto the corresponding output link bandwidth assigned by scheduler described in Section 4.2.However, the amount of traffic of normal priority is greater than its corresponding output
NASA/TM—2001-210904 40

link bandwidth. Under this scenario, the normal priority traffic gets into congestion at theedge Diffserv router.
• Case 3: Medium priority traffic gets into congestion: The traffic generated by theeach high, medium and normal priority sources were set to 1Mb, 1.333 Mb and 0.2 Mbrespectively. According to the network configuration described in Section 4.2, there are two,three and five sources generating high, medium and normal priority traffic of 2Mb, 4Mband 1Mb respectively. The amount of traffic of high and normal priority are still equal tothe corresponding output link bandwidth assigned by scheduler described in Section 4.2.However, the amount of traffic of medium priority is greater than its corresponding outputlink bandwidth. Under this scenario, the medium priority traffic gets into congestion at theedge Diffserv router.
• Case 4: Both medium and normal priority traffics get into congestion: The trafficgenerated by the each high, medium and normal priority sources were set to 1Mb, 1.333 Mband 0.6 Mb respectively. According to the network configuration described in Section 4.2,there are two, three and five sources generating high, medium and normal priority trafficof 2Mb, 4Mb and 3Mb respectively. The amount of traffic of high priority is still equalto the corresponding output link bandwidth assigned by scheduler described in Section 4.2.However, the amount of traffic of both medium and normal priority are greater than theircorresponding output link bandwidth. Under this scenario, both medium and normal prioritytraffics get into congestion at the edge Diffserv router.
5.3 Numerical Results
Table 2 shows the goodput of each ATN source for four different cases described in Section 5.2.Table 3 shows the drop ratio measured at the scheduler for four cases of the three different typesof ATN sources. Figures 7, 8, 9 and 10 show the queue size for each of the four case (from Case 1to Case 4), from which the queuing delay and jitter can be evaluated.
Table 2: Goodput of each ATN source (Unit: Kb/S)
Sources Case 1 Case 2 Case 3 Case 4High priority Sources Source 0 999.9990 999.9990 999.9990 999.9990
Source 1 999.9990 999.9990 999.9990 999.9990Source 2 666.6660 666.6660 668.2409 668.4719
Medium priority Sources Source 3 666.6660 666.6660 667.3379 667.5270Source 4 666.6660 666.6660 664.4189 663.9990Source 5 200.0039 199.6469 200.0039 199.4790Source 6 200.0039 201.8520 200.0039 201.9780
Normal priority Sources Source 7 200.0039 202.4190 200.0039 201.6840Source 8 199.9830 199.8779 199.9830 200.4660Source 9 200.0039 196.2030 200.0039 196.3920
Case 1 is an ideal case. Each type of source (high, medium and normal priority sources)generates traffic at the rate equal to the bandwidth assigned by the scheduler. Therefore, there isno significant network congestion at the edge Diffserv router. As seen in Table 2, the goodput ofeach source is almost the same as its traffic generation rate. From Table 3, the drop ratio of each
NASA/TM—2001-210904 41

Table 3: Drop ratio of ATN traffic.
Type of traffic Case 1 Case 2 Case 3 Case 4High priority Traffic 0.000000 0.000000 0.000000 0.000000
Medium priority Traffic 0.000000 0.000000 0.499817 0.499834Normal priority Traffic 0.000000 0.665638 0.000000 0.665616
QueueSizeVS.Time
0111(AF)q.tr
0000(BE)q.tr
1110(EF)q.tr
QueueSize
Time
0.0000
0.5000
1.0000
1.5000
2.0000
2.5000
3.0000
3.5000
4.0000
4.5000
5.0000
0.0000 20.0000 40.0000 60.0000 80.0000 100.0000
Figure 7: Queue size plots for Case 1
type of sources is zero. Figure 7 shows the queuing performance of each queue. Because this is anideal case, the size of each queue is very small. Though the three queues have almost the sameaverage size, we observe that the normal priority queue (mapping to BE queue, according to themapping function) has the largest jitter. delay).
In case 2, we increased the traffic generation rate of normal priority sources, keeping the ratesof the other two types of traffic unchanged. The traffic generating rate of each normal prioritysource is set to 0.6Mb. In this case, the normal priority traffic gets congested. As shown by Table3, the drop ratio of normal priority traffic is greatly increased. However, drop ratio for the othertwo sources still remain at zero. As seen in Table 2, the goodput of normal priority traffic for eachsource is only about 0.2Mb, instead of the traffic generation rate of 0.6Mb. The reason is that thetotal available output bandwidth of normal priority traffic has been assigned to 1Mb by scheduler.From Figure 8, we find that the average queue size of the normal priority queue is far greater thanthe other two types of sources. In addition, the jitter of normal priority traffic is also greater thanthe other two types of sources. The high priority traffic has the smallest average queue size andthe smallest jitter.
Case 3 is very similar to case 2. The only difference is that the medium priority traffic, ratherthan normal priority traffic, gets into congestion. As expected, we find the drop ratio of medium
NASA/TM—2001-210904 42

QueueSizeVS.Time
0111(AF)q.tr
0000(BE)q.tr
1110(EF)q.tr
QueueSize
Time
0.0000
10.0000
20.0000
30.0000
40.0000
50.0000
60.0000
70.0000
80.0000
90.0000
100.0000
110.0000
120.0000
130.0000
140.0000
150.0000
160.0000
170.0000
180.0000
190.0000
200.0000
0.0000 20.0000 40.0000 60.0000 80.0000 100.0000
Figure 8: Queue size plots for Case 2.
priority traffic is increased with other two traffic types remaining at zero, and the goodput is alsolimited by the output link bandwidth assigned by the scheduler (which is 2Mb). From Figure 9,we find that both the jitter and the average queue size of medium priority traffic are far greaterthan the other two traffic types. The high priority traffic has the smallest average queue size andthe smallest jitter.
In Case 4, we increased the traffic generation rates of both medium and normal priority sources.Both of them get into network congestion in this case. We find from Table 3 that the drop ratioof high priority traffic remains at zero, and drop ratios of both medium priority traffic and normalpriority traffic are greatly increased. Furthermore, the drop ratio of normal priority traffic is greaterthan that of medium priority traffic. As shown by Table 2, the goodput of both the medium andnormal priority traffic are limited by their link bandwidths allocated by scheduler. From Figure10, we see that the normal priority traffic has both the biggest jitter and biggest average queuesize. We can also find that the high priority traffic has both the smallest jitter and smallest averagequeue size.
From the above results, we can arrive at the following observations:
• The high priority traffic always has the smallest jitter, the smallest average queue size and thesmallest drop ratio without being affected by the performance of other traffic. In other words,the high priority traffic receives the highest priority, which satisfies the priority requirementsof ATN.
• The medium priority traffic has smaller drop ratio, jitter and queue size than the normalpriority traffic, even in the presence of network congestion. This also satisfies the priorityrequirements of ATN.
We therefore, conclude that the priority requirements of ATN can be successfully achieved whenATN traffic is mapped to the DiffServ domain in next generation Internet.
NASA/TM—2001-210904 43

QueueSizeVS.Time
0111(AF)q.tr
0000(BE)q.tr
1110(EF)q.tr
QueueSize
Time
0.0000
5.0000
10.0000
15.0000
20.0000
25.0000
30.0000
35.0000
40.0000
45.0000
0.0000 20.0000 40.0000 60.0000 80.0000 100.0000
Figure 9: Queue size plots for Case 3
QueueSizeVS.Time
0111(AF)q.tr
0000(BE)q.tr
1110(EF)q.tr
QueueSize
Time
0.0000
10.0000
20.0000
30.0000
40.0000
50.0000
60.0000
70.0000
80.0000
90.0000
100.0000
110.0000
120.0000
130.0000
140.0000
150.0000
160.0000
170.0000
180.0000
190.0000
200.0000
0.0000 20.0000 40.0000 60.0000 80.0000 100.0000
Figure 10: Queue size plots for Case 4
NASA/TM—2001-210904 44

6 Conclusion
In this paper, we have proposed DiffServ as the backbone network to interconnect ATN subnetworks.We have designed a mapping function to map traffic flows coming from ATN with different priorities(indicated by the priority field in ATN packet header) to the corresponding PHBs in the DiffServdomain.
The proposed scheme has been studied in detail using simulation. It has been found that theQoS requirements of ATN can be achieved when ATN runs over DiffServ. We have illustrated ourscheme by mapping ATN traffic of three different priorities to the three service classes of DiffServ.The ability of our scheme to provide QoS to end ATN applications has been demonstrated bymeasuring the drop ratio, goodput and queue size. We found that the high priority ATN traffic hasthe smallest jitter, the smallest average queue size and the smallest drop ratio, and is unaffectedby the performance of other traffic. Moreover, the medium priority ATN traffic has a smaller dropratio, jitter and queue size than the normal traffic, even in the presence of network congestion.
Acknowledgements
The authors thank NASA for support of this project. Faruque Ahamed carried out some initialwork on this project.
References
[1] ATNP, “ATN SARPs - 2nd edition.” Final Editor’s drafts of the ATN SARPs, December 1999.
[2] R. Braden, D. Clark, and S. Shenker, “Integrated services in the internet architecture: anoverview.” RFC 1633, June 1994.
[3] S. Blake, D. Black, M. Carlson, E. Davies, Z. Wang, and W. Weiss, “An architecture fordifferentiated services.” RFC 2475, December 1998.
[4] ATNP, “Comprehensive ATN manual (CAMAL).” Final Editor’s drafts of the ATN GuidanceMaterial, January 1999.
[5] H. Hof, “Change proposal for improved text on the ATN priority architecture.”ATNP/WG2/WP174, October 1995.
[6] K. Nichols, S.Blake, F. Baker, and D.Black, “Definition of the differentiated services field(DS field) in the IPv4 and IPv6 headers.” RFC 2474, December 1998.
[7] Y. Bernet, S. Blake, D. Grossman, and A. Smith, “An informal management model for diffservrouters.” draft-ietf-diffserv-model-04.txt, July 2000.
[8] V. Jacobson, K. Nichols, and K. Poduri, “An expedited forwarding PHB.” RFC 2598, June1999.
[9] J. Heinanen, F. Baker, W. Weiss, and J. Wroclawski, “Assured forwarding PHB group.” RFC2597, June 1999.
[10] VINT Project U.C. Berkeley/LBNL, “ns v2.1b6: Network simulator.” http://www-mash.cs.berkeley.edu/ns/, January 2000.
NASA/TM—2001-210904 45

[11] S. Floyd and V. Jacobson, “Random early detection gateways for congestion avoidance,”IEEE/ACM Transactions on Networking, vol. 1, no. 4, pp. 397–413, August 1993.
NASA/TM—2001-210904 46

Achieving QoS for TCP traffic in Satellite Networks with Differentiated Services∗
Arjan Durresi1, Sastri Kota2, Mukul Goyal1, Raj Jain3, Venkata Bharani1
1Department of Computer and Information Science, The Ohio State University,2015 Neil Ave, Columbus, OH 43210-1277, USA
Tel: 614-688-5610, Fax: 614-292-2911, Email: {durresi, mukul, bharani}@cis.ohio-state.edu
2Lockheed Martin60 East Tasman Avenue MS: C2135
San Jose CA 95134, USATel: 408-456-6300/408- 473-5782, Email: [email protected]
3Nayna Networks, Inc.157 Topaz St., Milpitas, CA 95035, USA
Tel: 408-956-8000X309, Fax: 408-956-8730, Email: [email protected]
Satellite networks play an indispensable role in providing global Internet access and electronic
connectivity. To achieve such a global communications, provisioning of quality of service (QoS)
within the advanced satellite systems is the main requirement. One of the key mechanisms of
implementing the quality of service is traffic management. Traffic management becomes a crucial
factor in the case of satellite network because of the limited availability of their resources.
Currently, Internet Protocol (IP) only has minimal traffic management capabilities and provides
best effort services. In this paper, we presented a broadband satellite network QoS model and
simulated performance results. In particular, we discussed the TCP flow aggregates performance
for their good behavior in the presence of competing UDP flow aggregates in the same assured
forwarding. We identified several factors that affect the performance in the mixed environments
and quantified their effects using a full factorial design of experiment methodology.
Correspondence address: Dr. Arjan Durresi, Department of Computer and Information Science, The Ohio State University, 2015 Neil Ave, Columbus, OH 43210, USATel: 614-688-5610, Fax: 614-292-2911, Email: [email protected]
∗ This research was sponsored in part by grants from NASA Glenn Research Center, Cleveland, and OAI, Cleveland,Ohio
NASA/TM—2001-210904 47

1. INTRODUCTION
The increasing worldwide demand for more bandwidth and Internet access is creating new
opportunities for the deployment of global next generation satellite networks. Today it is clear that
satellite networks will be a significant player in the digital revolution, and will specially benefit
from on-board digital processing and switching, as well as other such technological advances as
emerging digital compression, narrow spot beams for frequency reuse, digital intersatellite links,
advanced link access methods and multicast technologies. Many new satellite communication
systems have been planned and are under development including at Ka, Q/V-bands [7]. Some of
the key design issues for satellite networks include efficient resource management schemes and
QoS architectures.
However, satellite systems have several inherent constraints. The resources of the satellite
communication network, especially the satellite and the Earth station, are expensive and typically
have low redundancy; these must be robust and be used efficiently. The large delays in
geostationary Earth orbit (GEO) systems and delay variations in low Earth orbit (LEO) systems
affect both real-time and non-real-time applications. In an acknowledgement and time-out-based
congestion control mechanism (like TCP), performance is inherently related to the delay-bandwidth
product of the connection. Moreover, TCP round-trip time (RTT) measurements are sensitive to
delay variations that may cause false timeouts and retransmissions. As a result, the congestion
control issues for broadband satellite networks are somewhat different from those of low-latency
terrestrial networks. Both interoperability issues as well as performance issues need to be
addressed before a transport-layer protocol like TCP can satisfactorily work over long-latency
satellite IP ATM networks.
48NASA/TM—2001-210904

There has been an increased interest in developing Differentiated Services (DS) architecture for
provisioning IP QoS over satellite networks. DS aims to provide scalable service differentiation in
the Internet that can be used to permit differentiated pricing of Internet service [1]. This
differentiation may either be quantitative or relative. DS is scalable as traffic classification and
conditioning is performed only at network boundary nodes. The service to be received by a traffic
is marked as a code point in the DS field in the IPv4 or IPv6 header. The DS code point in the
header of an IP packet is used to determine the Per-Hop Behavior (PHB), i.e. the forwarding
treatment it will receive at a network node. Currently, formal specification is available for two
PHBs - Assured Forwarding [4] and Expedited Forwarding [5]. In Expedited Forwarding, a transit
node uses policing and shaping mechanisms to ensure that the maximum arrival rate of a traffic
aggregate is less than its minimum departure rate. At each transit node, the minimum departure
rate of a traffic aggregate should be configurable and independent of other traffic at the node. Such
a per-hop behavior results in minimum delay and jitter and can be used to provide an end-to-end
`Virtual Leased Line' type of service.
In Assured Forwarding (AF), IP packets are classified as belonging to one of four traffic classes. IP
packets assigned to different traffic classes are forwarded independent of each other. Each traffic
class is assigned a minimum configurable amount of resources (link bandwidth and buffer space).
Resources not being currently used by another PHB or an AF traffic class can optionally be used by
remaining classes. Within a traffic class, a packet is assigned one of three levels of drop
precedence (green, yellow, red). In case of congestion, an AF-compliant DS node drops low
precedence (red) packets in preference to higher precedence (green, yellow) packets.
49NASA/TM—2001-210904

In this paper, we describe a wide range of simulations, varying several factors to identify the
significant ones influencing fair allocation of excess satellite network resources among congestion
sensitive and insensitive flows. The factors that we studied in Section 2 include a) number of drop
precedence required (one, two, or three), b) percentage of reserved (highest drop precedence)
traffic, c) buffer management (Tail drop or Random Early Drop with different parameters), and d)
traffic types (TCP aggregates, UDP aggregates). Section 3 describes the simulation configuration
and parameters and experimental design techniques. Section 4 describes Analysis Of Variation
(ANOVA) technique. Simulation results for TCP and UDP, for reserve rate utilization and fairness
are also given. Section 5 summarizes the study’s conclusions.
2. QOS FRAME WORK
The key factors that affect the satellite network performance are those relating to bandwidth
management, buffer management, traffic types and their treatment, and network configuration.
Band width management relates to the algorithms and parameters that affect service (PHB) given to
a particular aggregate. In particular, the number of drop precedence (one, two, or three) and the
level of reserved traffic were identified as the key factors in this analysis.
Buffer management relates to the method of selecting packets to be dropped when the buffers are
full. Two commonly used methods are tail drop and random early drop (RED). Several variations
of RED are possible in case of multiple drop precedence. These variations are described in Section
3.
50NASA/TM—2001-210904

Two traffic types that we considered are TCP and UDP aggregates. TCP and UDP were separated
out because of their different response to packet losses. In particular, we were concerned that if
excess TCP and excess UDP were both given the same treatment, TCP flows will reduce their rates
on packet drops while UDP flows will not change and get the entire excess bandwidth. The
analysis shows that this is in fact the case and that it is important to give a better treatment to excess
TCP than excess UDP.
In this paper, we used a simple network configuration which was chosen in consultation with other
researchers interested in assured forwarding. This is a simple configuration, which we believe,
provides most insight in to the issues and on the other hand will be typical of a GEO satellite
network.
We have addressed the following QoS issues in our simulation study:
• Three drop precedence (green, yellow, and red) help clearly distinguish between congestion
sensitive and insensitive flows.
• The reserved bandwidth should not be overbooked, that is, the sum should be less than the
bottleneck link capacity. If the network operates close to its capacity, three levels of drop
precedence are redundant as there is not much excess bandwidth to be shared.
• The excess congestion sensitive (TCP) packets should be marked as yellow while the excess
congestion insensitive (UDP) packets should be marked as red.
• The RED parameters have significant effect on the performance. The optimal setting of RED
parameters is an area for further research.
51NASA/TM—2001-210904

2.1 Buffer Management Classifications
Buffer management techniques help identify which packets should be dropped when the queues
exceed a certain threshold. It is possible to place packets in one queue or multiple queues
depending upon their color or flow type. For the threshold, it is possible to keep a single threshold
on packets in all queues or to keep multiple thresholds. Thus, the accounting (queues) could be
single or multiple and the threshold could be single or multiple. These choices lead to four classes
of buffer management techniques:
1. Single Accounting, Single Threshold (SAST)
2. Single Accounting, Multiple Threshold (SAMT)
3. Multiple Accounting, Single Threshold (MAST)
4. Multiple Accounting, Multiple Threshold (MAMT)
Random Early Discard (RED) is a well known and now commonly implemented packet drop
policy. It has been shown that RED performs better and provides better fairness than the tail drop
policy. In RED, the drop probability of a packet depends on the average queue length which is an
exponential average of instantaneous queue length at the time of the packet's arrival [3]. The drop
probability increases linearly from 0 to max_p as average queue length increases from min_th to
max_th. With packets of multiple colors, one can calculate average queue length in many ways and
have multiple sets of drop thresholds for packets of different colors. In general, with multiple
52NASA/TM—2001-210904

colors, RED policy can be implemented as a variant of one of four general categories: SAST,
SAMT, MAST, and MAMT.
Single Average Single Threshold RED has a single average queue length and same min_th and
max_th thresholds for packets of all colors. Such a policy does not distinguish between packets of
different colors and can also be called color blind RED. In Single Average Multiple Thresholds
RED, average queue length is based on total number of packets in the queue irrespective of their
color. However, packets of different colors have different drop thresholds. For example, if
maximum queue size is 60 packets, the drop thresholds for green, yellow and red packets can be
{40/60, 20/40, 0/10}. In these simulations, we used Single Average Multiple Thresholds RED.
In Multiple Average Single/Multiple Threshold RED, average queue length for packets of different
colors is calculated differently. For example, average queue length for a color can be calculated
using number of packets in the queue with same or better color [2]. In such a scheme, average
queue length for green, yellow and red packets will be calculated using number of green, yellow +
green, red + yellow + green packets in the queue respectively. Another possible scheme is where
average queue length for a color is calculated using number of packets of that color in the queue
[8]. In such a case, average queue length for green, yellow and red packets will be calculated using
number of green, yellow and red packets in the queue respectively. Multiple Average Single
Threshold RED will have same drop thresholds for packets of all colors whereas Multiple Average
Multiple Threshold RED will have different drop thresholds for packets of different colors.
53NASA/TM—2001-210904

3. SIMULATION CONFIGURATION AND PARAMETERS
Figure 1 shows the network configuration for simulations. The configuration consists of customers
1 through 10 sending data over the link between Routers 1, 2 and using the same AF traffic class.
Router 1 is located in a satellite ground station. Router 2 is located in a GEO satellite and Router 3
is located in destination ground station. Traffic is one-dimensional with only ACKs coming back
from the other side. Customers 1 through 9 carry an aggregated traffic coming from 5 Reno TCP
sources each. Customer 10 gets its traffic from a single UDP source sending data at a rate of 1.28
Mbps. Common configuration parameters are detailed in Tables 1 and 2. All TCP and UDP
packets are marked green at the source before being 'recolored' by a traffic conditioner at the
customer site. The traffic conditioner consists of two 'leaky' buckets (green and yellow) that mark
packets according to their token generation rates (called reserved/green and yellow rate). In two-
color simulations, yellow rate of all customers is set to zero. Thus, in two-color simulations, both
UDP and TCP packets will be colored either green or red. In three-color simulations, customer 10
(the UDP customer) always has a yellow rate of 0. Thus, in three-color simulations, TCP packets
coming from customers 1 through 9 can be colored green, yellow or red and UDP packets coming
from customer 10 will be colored green or red. All the traffic coming to Router 1 passes through a
Random Early Drop (RED) queue. The RED policy implemented at Router 1 can be classified as
Single Average Multiple Threshold RED as explained in Section 3.
We have used NS simulator version 2.1b4a [9] for these simulations. The code has been modified
to implement the traffic conditioner and multi-color RED (RED_n).
54NASA/TM—2001-210904

3.1 Experimental Design
In this study, we performed full factorial simulations involving many factors, which are listen inTables 3 and 4 for two-color simulations and in Tables 5, 6 for three-color simulations:
• Green Traffic Rates: Green traffic rate is the token generation rate of green bucket in the traffic
conditioner. We have experimented with green rates of 12.8, 25.6, 38.4 and 76.8 kbps per
customer. These rates correspond to a total of 8.5%, 17.1%, 25.6% and 51.2% of network
capacity (1.5 Mbps). In order to understand the effect of green traffic rate, we also conduct
simulations with green rates of 102.4, 128, 153.6 and 179.2 kbps for two-color cases. These
rates correspond to 68.3%, 85.3%, 102.4% and 119.5% of network capacity respectively. In last
two cases, we have oversubscribed the available network bandwidth. The Green rates used and
the simulations sets are shown in Tables 3 and 5 for two and three-color simulations
respectively.
• Green Bucket Size: 1, 2, 4, 8, 16 and 32 packets of 576 bytes each, shown in Tables 4 and 6.
• Yellow Traffic Rate (only for three-color simulations, Table 6): Yellow traffic rate is the token
generation rate of yellow bucket in the traffic conditioner. We have experimented with yellow
rates of 12.8 and 128 kbps per customer. These rates correspond to 7.7% and 77% of total
capacity (1.5 Mbps) respectively. We used a high yellow rate of 128 kbps so that all excess
(out of green rate) TCP packets are colored yellow and thus can be distinguished from excess
UDP packets that are colored red.
• Yellow Bucket Size (only for three-color simulations, Table 6): 1, 2, 4, 8, 16, 32 packets of 576
bytes each.
55NASA/TM—2001-210904

• Maximum Drop Probability: Maximum drop probability values used in the simulations are
listed in Tables 4 and 6.
• Drop Thresholds for red colored packets: The network resources allocated to red colored
packets and hence the fairness results depend on the drop thresholds for red packets. We
experimented with different values of drop thresholds for red colored packets so as to achieve
close to best fairness possible. Drop thresholds for green packets have been fixed at {40,60}
for both two and three-color simulations. For three-color simulations, yellow packet drop
thresholds are {20,40}. Drop threshols are listed in Tables 4 and 6.
In these simulations, size of all queues is 60 packets of 576 bytes each. The queue weight used to
calculate RED average queue length is 0.002. For easy reference, we have given an identification
number to each simulation (Tables 3 and 5). The simulation results are analyzed using ANOVA
techniques [6] briefly described in Section 8.
3.2 Performance Metrics
Simulation results have been evaluated based on utilization of reserved rates by the customers and
the fairness achieved in allocation of excess bandwidth among different customers.
Utilization of reserved rate by a customer is measured as the ratio of green throughput of the
customer and the reserved rate. Green throughput of a customer is determined by the number of
green colored packets received at the traffic destination(s). Since in these simulations, the drop
56NASA/TM—2001-210904

thresholds for green packets are kept very high in the RED queue at Router 1, chances of a green
packet getting dropped are minimal and ideally green throughput of a customer should
equal its reserved rate.
The fairness in allocation of excess bandwidth among n customers sharing a link can be computed
using the following formula [6]:
Where xi is the excess throughput of the ith customer. Excess throughput of a customer is
determined by the number of yellow and red packets received at the traffic destination(s).
4. SIMULATION RESULTS
Simulation results of two and three-color simulations are shown in Figures 2 and 3, where a
simulation is identified by its Simulation ID listed in Tables 3 and 5. Figures 2a and 2b show the
fairness achieved in allocation of excess bandwidth among ten customers for each of the two and
three-color simulations respectively. It is clear from figure 2a that fairness is not good in two-color
simulations. With three colors, there is a wide variation in fairness results with best results being
close to 1. Fairness is zero in some of the two-color simulations. In these simulations, total
reserved traffic uses all the bandwidth and there is no excess bandwidth available to share. Also,
there is a wide variation in reserved rate utilization by customers in two and three-color
simulations.
( )( )∑
∑×
= 2
2
i
i
xn
xIndexFairness
57NASA/TM—2001-210904

Figure 3 shows the reserved rate utilization by TCP and UDP customers. For TCP customers
shown in Figures 3a and 3c, we have plotted the average reserved rate utilization in each
simulation. In some cases, reserved rate utilization is slightly more than one. This is because token
buckets are initially full which results in all packets getting green color in the beginning. Figures
3b and 3d show that UDP customers have good reserved rate utilization in almost all cases. In
contrast, TCP customers show a wide variation in reserved rate utilization.
In order to determine the influence of different simulation factors on the reserved rate utilization
and fairness achieved in excess bandwidth distribution, we analyze simulation results statistically
using Analysis of Variation (ANOVA) technique. Section 4.1 gives a brief introduction to
ANOVA technique used in the analysis. In later sections, we present the results of statistical
analysis of two and three-color simulations, in Sections 4.2 and 4.3.
4.1 Analysis Of Variation (ANOVA) Technique
The results of a simulation are affected by the values (or levels) of simulation factors (e.g. green
rate) and the interactions between levels of different factors (e.g. green rate and green bucket size).
The simulation factors and their levels used in this simulation study are listed in Tables 3, 4, 5 and
6. Analysis of Variation of simulation results is a statistical technique used to quantify these
effects. In this section, we present a brief account of Analysis of Variation technique. More details
can be found in [6].
58NASA/TM—2001-210904

Analysis of Variation involves calculating the Total Variation in simulation results around the
Overall Mean and doing Allocation of Variation to contributing factors and their interactions.
Following steps describe the calculations:
1. Calculate the Overall Mean of all the values.
2. Calculate the individual effect of each level a of factor A, called the Main Effect of a:
Main Effecta = Meana - Overall Mean
where, Main Effecta is the main effect of level a of factor A, Meana is the mean of all results
with a as the value for factor A.
The main effects are calculated for each level of each factor.
3. Calculate the First Order Interaction between levels a and b of two factors A and B respectively
for all such pairs:
Interactiona,b = Meana,b - (Overall Mean + Main Effecta + Main Effectb)
where, Interactiona,b is the interaction between levels a and b of factors A and B respectively,
Meana,b is mean of all results with a and b as values for factors A and B, Main Effecta and Main
Effectb are main effects of levels a and b respectively.
4. Calculate the Total Variation as shown below:
Total Variation = ∑(result2) - (Num_Sims) × (Overall Mean2)
where, ∑(result2) is the sum of squares of all individual results and Num_Sims is total number
of simulations.
59NASA/TM—2001-210904

5. The next step is the Allocation of Variation to individual main effects and first order
interactions. To calculate the variation caused by a factor A, we take the sum of squares of the
main effects of all levels of A and multiply this sum with the number of experiments conducted
with each level of A. To calculate the variation caused by first order interaction between two
factors A and B, we take the sum of squares of all the first-order interactions between levels of
A and B and multiply this sum with the number of experiments conducted with each
combination of levels of A and B. We calculate the allocation of variation for each factor and
first order interaction between every pair of factors.
4.2 ANOVA Analysis for Reserved Rate Utilization
Table 7 shows the Allocation of Variation to contributing factors for reserved rate utilization. As
shown in Figures 3b and 3d, reserved rate utilization of UDP customers is almost always good for
both two and three-color simulations. However, in spite of very low probability of a green packet
getting dropped in the network, TCP customers are not able to fully utilize their reserved rate in all
cases. The little variation in reserved rate utilization for UDP customers is explained largely by
bucket size. Large bucket size means that more packets will get green color in the beginning of the
simulation when green bucket is full. Green rate and interaction between green rate and bucket size
explain a substantial part of the variation. This is because the definition of rate utilization metric
has reserved rate in denominator. Thus, the part of the utilization coming from initially full bucket
gets more weight for low reserved rate than for high reserved rates. Also, in two-color simulations
for reserved rates 153.6 kbps and 179.2 kbps, the network is oversubscribed and hence in some
cases UDP customer has a reserved rate utilization lower than one. For TCP customers, green
60NASA/TM—2001-210904

bucket size is the main factor in determining reserved rate utilization. TCP traffic, because of its
bursty nature, is not able to fully utilize its reserved rate unless bucket size is sufficiently high. In
our simulations, UDP customer sends data at a uniform rate of 1.28 Mbps and hence is able to fully
utilize its reserved rate even when bucket size is low. However, TCP customers can have very poor
utilization of reserved rate if bucket size is not sufficient. The minimum size of the leaky bucket
required to fully utilize the token generation rate depends on the burstiness of the traffic.
4.3 ANOVA Analysis for Fairness
Fairness results shown in Figure 2a indicate that fairness in allocation of excess network bandwidth
is very poor in two-color simulations. With two colors, excess traffic of TCP as well as UDP
customers is marked red and hence is given same treatment in the network. Congestion sensitive
TCP flows reduce their data rate in response to congestion created by UDP flow. However, UDP
flow keeps on sending data at the same rate as before. Thus, UDP flow gets most of the excess
bandwidth and the fairness is poor. In three-color simulations, fairness results vary widely with
fairness being good in many cases. Table 8 shows the important factors influencing fairness in
three-color simulations as determined by ANOVA analysis. Yellow rate is the most important
factor in determining fairness in three-color simulations. With three colors, excess TCP traffic can
be colored yellow and thus distinguished from excess UDP traffic, which is colored red. Network
can protect congestion sensitive TCP traffic from congestion insensitive UDP traffic by giving
better treatment to yellow packets than to red packets. Treatment given to yellow and red packets
in the RED queues depends on RED parameters (drop thresholds and max drop probability values)
for yellow and red packets. Fairness can be achieved by coloring excess TCP packets as yellow
61NASA/TM—2001-210904

and setting the RED parameter values for packets of different colors correctly. In these
simulations, we experiment with yellow rates of 12.8 kbps and 128 kbps. With a yellow rate of
12.8 kbps, only a fraction of excess TCP packets can be colored yellow at the traffic conditioner
and thus resulting fairness in excess bandwidth distribution is not good. However with a yellow
rate of 128 kbps, all excess TCP packets are colored yellow and good fairness is achieved with
correct setting of RED parameters. Yellow bucket size also explains a substantial portion of
variation in fairness results for three-color simulations. This is because bursty TCP traffic can fully
utilize its yellow rate only if yellow bucket size is sufficiently high. The interaction between
yellow rate and yellow bucket size for three-color fairness results is because of the fact that
minimum size of the yellow bucket required for fully utilizing the yellow rate increases with yellow
rate.
It is evident that three colors are required to enable TCP flows get a fair share of excess network
resources. Excess TCP and UDP packets should be colored differently and network should treat
them in such a manner so as to achieve fairness. Also, size of token buckets should be sufficiently
high so that bursty TCP traffic can fully utilize the token generation rates.
5. CONCLUSIONS
One of the goals of deploying multiple drop precedence levels in an Assured Forwarding traffic
class on a satellite network is to ensure that all customers achieve their reserved rate and a fair
share of excess bandwidth. In this paper, we analyzed the impact of various factors affecting the
performance of assured forwarding. The key conclusions are:
62NASA/TM—2001-210904
• The key performance parameter is the level of green (reserved) traffic. The combined reserved
rate for all customers should be less than the network capacity. Network should be configured
in such a manner so that in-profile traffic (colored green) does not suffer any packet loss and is
successfully delivered to the destination.
• If the reserved traffic is overbooked, so that there is little excess capacity, two drop precedence
give the same performance as three.
• The fair allocation of excess network bandwidth can be achieved only by giving different
treatment to out-of-profile traffic of congestion sensitive and insensitive flows. The reason is
that congestion sensitive flows reduce their data rate on detecting congestion however
congestion insensitive flows keep on sending data as before. Thus, in order to prevent
congestion insensitive flows from taking advantage of reduced data rate of congestion sensitive
flows in case of congestion, excess congestion insensitive traffic should get much harsher
treatment from the network than excess congestion sensitive traffic. Hence, it is important that
excess congestion sensitive and insensitive traffic is colored differently so that network can
distinguish between them. Clearly, three colors or levels of drop precedence are required for
this purpose.
• Classifiers have to distinguish between TCP and UDP packets in order to meaningfully utilize
the three drop precedence.
• RED parameters and implementations have significant impact on the performance. Further
work is required for recommendations on proper setting of RED parameters.
63NASA/TM—2001-210904

6. REFERENCES
[1] S. Blake, D. Black, M. Carlson, E. Davies, Z. Wang, W. Weiss, An Architecture for
Differentiated Services, RFC 2475, December 1998.
[2] D. Clark, W. Fang, Explicit Allocation of Best Effort Packet Delivery Service, IEEE/ACM
Transactions on Networking, August 1998: Vol. 6, No.4, pp. 349-361.
[3] S. Floyd, V. Jacobson, Random Early Detection Gateways for Congestion Avoidance,
IEEE/ACM Transactions on Networking, 1(4): 397-413, August 1993.
[4] J. Heinanen, F. Baker, W. Weiss, J. Wroclawski, Assured Forwarding PHB Group, RFC 2597,
June 1999. [3] V. Jacobson, K. Nichols, K. Poduri, An Expedited Forwarding PHB, RFC 2598,
June 1999.
[5] V. Jacobson, K. Nichols, K. Poduri, An Expedited Forwarding PHB, RFC 2598, June 1999.
[6] R. Jain, The Art of Computer Systems Performance Analysis: Techniques for Experimental
Design, Simulation and Modeling, New York, John Wiley and Sons Inc., 1991.
[7] S. Kota, “Multimedia Satellite Networks: Issues and Challenges,” Proc. SPIE International
Symposium on Voice, Video, and Data Communications, Boston, Nov 1-5, 1998.
[8] N. Seddigh, B. Nandy, P. Pieda, Study of TCP and UDP Interactions for the AF PHB, Internet
Draft - Work in Progress, draft-nsbnpp-diffserv-tcpudpaf-00.pdf, June 1999.
[9] NS Simulator, Version 2.1, Available from http://www-mash.cs.berkeley.edu/ns.
64NASA/TM—2001-210904

Table 1: General Configuration Parameters used in Simulation
Simulation Time 100 secondsTCP Window 64 packetsIP Packet Size 576 bytesUDP Rate 1.28MbpsMaximum queue size (for all queues) 60 packets
Table 2: Link Parameters used in Simulations
Link between UDP/TCPs and Customers:Link Bandwidth 10 Mbps
Drop Policy DropTail
One way Delay 1 microsecond
One way Delay 125 milliseconds
Drop Policy DropTail
Link Bandwidth 1.5 Mbps
Link between Customers (Sinks) and Router 1 (Router 3):
Link between Router 2 and Router 3:Drop Policy From Router 2 to Router 1 DropTail
Link Bandwidth 1.5 Mbps
Drop Policy From Router 1 to Router 2 RED_n
One way Delay 5 microseconds
One way Delay 125 milliseconds
Drop Policy DropTail
Link Bandwidth 1.5 MbpsLink between Router 1 and Router 2:
Table 3: Two-color Simulation Sets and their Green Rate
Simulation ID Green Rate [kbps]
1401-1544 179.2
1-144 12.8
1201-1344 153.6
201-344 25.6
1001-1144 128
401-544 38.4
801-944 102.4601-744 76.8
65NASA/TM—2001-210904

Table 4: Parameters, which combinations are used in each Set of two-color Simulations
Max Drop Drop Probability{Green, Red}
{0.1, 0.1}, {0.1, 0.5}, {0.1, 1}, {0.5, 1}, {0.5, 1}, {1, 1}
Drop Thresholds{Green, Red}
{40/60, 0/10}, {40/60, 0/20}, {40/60, 0/5}, {40/60, 20/40}
Green Bucket(in Packets)
1, 2, 4, 8, 16, 32
Table 5: Three-color Simulation Sets and their Green Rate
Simulation ID Green Rate [kbps]
3001-3720 76.8
1-720 12.8
2001-2720 38.41001-1720 25.6
Table 6: Parameters, which combinations are used in each Set of three-color Simulations
Max Drop Drop Probability{Green, Yellow, Red}
{0.1, 0.5, 1}, {0.1, 1, 1}, {0.5, 0.5, 1}, {0.5, 1, 1}, {1, 1, 1}
Yellow bucket Size(in packets)
1, 2, 4, 8, 16, 32
Drop Thresholds{Green, Yellow, Red}
{40/60, 20/40, 0/10}, {40/60, 20/40, 0/20}
Green bucket Size(in packets)
1, 2, 4, 8, 16, 32
Yellow Rate[kbps]
12.8, 128
66NASA/TM—2001-210904

Table 7: Main Factors Influencing Reserved Rate Utilization Results
Allocation of Variation (in %age)Factor/Interaction In two-color Simulations In three-color Simulations
TCP UDP TCP UDPGreen Rate 8.86% 31.55% 2.21% 20.41%Green Bucket Size 86.22% 42.29% 95.25% 62.45%Green Rate -Green Bucket Size 4.45% 25.35% 1.96% 17.11%
Table 8: Main Factors Influencing Fairness Results in three-color Simulations
Factor/Interaction Allocation of Variation (in %age)
and Yellow Bucket Size 26.49
Yellow Rate 41.36
Interaction between Yellow RateYellow Bucket Size 28.96
67NASA/TM—2001-210904

5
4
3
2
1
9
8
7
6
10
TCP
UDP
10 Mbps, 1 microsecond
1.5 Mbps, 5 microseconds
1.5 Mbps,125 milliseconds
SINKS
ROUTER 1
ROUTER 2
ROUTER 3
SATELLITE
1.5 Mbps,125 milliseconds
Figure 1. Simulation Configuration
68NASA/TM—2001-210904

Figure 2a. Simulation Results: Fairness achieved in two-color Simulations with Different Reserved
Rates
Fairness in Two-Color Simulations
0
0.02
0.04
0.06
0.08
0.1
0.12
0.14
0.16
0.18
0.2
0 200 400 600 800 1000 1200 1400 1600 1800
Simulations ID
Fai
rnes
s In
dex
12800
25600
38400
76800
102400
128000
153600
179200
69NASA/TM—2001-210904

Figure 2b. Simulation Results: Fairness achieved in Three-Color Simulations with different
Reserved Rates
Fairness in Three-Color Simulations
0
0.2
0.4
0.6
0.8
1
1.2
0 500 1000 1500 2000 2500 3000 3500 4000
Simulation ID
Fai
rnes
s In
dex
12800
25600
38400
76800
70NASA/TM—2001-210904

Figure 3a. Reserved Rate Utilization by TCP Customers in two-color Simulations
Reserved Rate Utilization by TCP Customers in Two-Color Simulations
0
0.2
0.4
0.6
0.8
1
1.2
0 200 400 600 800 1000 1200 1400 1600 1800
Simulation ID
Ave
rag
e N
orm
aliz
ed R
eser
ved
Th
roug
hput
12800
25600
38400
76800
102400
128000
153600
179200
71NASA/TM—2001-210904

Figure 3b. Reserved Rate Utilization by UDP Customers in two-color Simulations
Reserved Rate Utilization by UDP Customers in Two-Color Simulations
0
0.2
0.4
0.6
0.8
1
1.2
0 200 400 600 800 1000 1200 1400 1600 1800
Simulation ID
Ave
rag
e N
orm
aliz
ed R
eser
ved
Th
rou
gh
pu
t
12800
25600
38400
76800
102400
128000
153600
179200
72NASA/TM—2001-210904

Figure 3c. Reserved Rate Utilization by TCP Customers in three-color Simulations
Reserved Rate Utilization by TCP Customers in Three-Color Simulations
0
0.2
0.4
0.6
0.8
1
1.2
0 500 1000 1500 2000 2500 3000 3500 4000
Simulation ID
Ave
rag
e N
orm
aliz
ed R
eser
ved
Th
rou
gh
pu
t
2800
25600
38400
76800
73NASA/TM—2001-210904

Figure 3d. Reserved Rate Utilization by UTP Customers in three-color Simulations
Reserved Rate Utilization by UDP Customers in Three-Color Simulations
0.96
0.98
1
1.02
1.04
1.06
1.08
1.1
1.12
0 500 1000 1500 2000 2500 3000 3500 4000
Simulation ID
Ave
rag
e N
orm
aliz
ed R
eser
ved
Th
rou
gh
pu
t
12800
25600
38400
76800
74NASA/TM—2001-210904

Improving Explicit Congestion Notification with the Mark-Front Strategy�
Chunlei Liu Raj JainDepartment of Computer and Information Science Chief Technology Officer, Nayna Networks, Inc.
The Ohio State University, Columbus, OH 43210-1277 157 Topaz St, Milpitas, CA 95035
[email protected] [email protected]
Abstract
Delivering congestion signals is essential to the performance of networks. Current TCP/IP networks use packetlosses to signal congestion. Packet losses not only reduces TCP performance, but also adds large delay. ExplicitCongestion Notification (ECN) delivers a faster indication of congestion and has better performance. However,current ECN implementations mark the packet from the tail of the queue. In this paper, we propose the mark-frontstrategy to send an even faster congestion signal. We show that mark-front strategy reduces buffer size requirement,improves link efficiency and provides better fairness among users. Simulation results that verify our analysis are alsopresented.
Keywords:Explicit Congestion Notification, mark-front, congestion control, buffer size requirement, fairness.
1 Introduction
Delivering congestion signals is essential to the performance of computer networks. In TCP/IP, congestion signalsfrom the network are used by the source to determine the load. When a packet is acknowledged, the source increasesits window size. When a congestion signal is received, its window size is reduced [1, 2].
TCP/IP uses two methods to deliver congestion signals. The first method is timeout. When the source sends a packet,it starts a retransmission timer. If it does not receive an acknowledgment within a certain time, it assumes congestionhas happened in the network and the packet has been lost. Timeout is the slowest congestion signal because of thesource has to wait a long time for the retransmission timer to expire.
The second method is loss detection. In this method, the receiver sends a duplicate ACK immediately on reception ofeach out-of-sequence packet. The source interprets the reception of three duplicate acknowledgments as a congestionpacket loss. Loss detection can avoid the long wait of timeout.
Both timeout and loss detection use packet losses as congestion signals. Packet losses not only increase the trafficin the network, but also add large transfer delay. The Explicit Congestion Notification (ECN) proposed in [3, 4]provides a light-weight mechanism for routers to send a direct indication of congestion to the source. It makes use oftwo experimental bits in the IP header and two experimental bits in the TCP header. When the average queue lengthexceeds a threshold, the incoming packet is marked ascongestion experiencedwith a probability calculated from theaverage queue length. When the marked packet is received, the receiver marks the acknowledgment using anECN-Echobit in the TCP header to send congestion notification back to the source. Upon receiving the ECN-Echo, thesource halves its congestion window to help alleviate the congestion.
Many authors have pointed out that marking provides more information about the congestion state than packet drop-ping [5, 6], and ECN has been proven to be a better way to deliver congestion signal and exhibits a better performance[4, 5, 7].�
This research was sponsored in part by grants from Nokia Corporation, Burlington, Massachusetts and NASA Glenn Research Center, Cleve-land, Ohio.
NASA/TM—2001-210904 75

In most ECN implementations, when congestion happens, the congested router marks the incoming packet that justentered the queue. When the buffer is full or when a packet needs to be dropped as in Random Early Detection (RED),some implementations, such as thenssimulator [8], have the “drop from front” option as suggested by Yin [9] andLakshman [10]. A brief discussion of drop from front in RED can be found in [11]. However, for packet marking,these implementations still pick the incoming packet and not the front packet. We call this policy “mark-tail”.
In this paper, we propose a simple marking mechanism — the “mark-front” strategy. This strategy marks a packetwhen the packet is going to leave the queue and the queue length is greater than the pre-determined threshold. Themark-front strategy is different from the current mark-tail policy in two ways. First, since the router marks the packetat the time when it is sent, and not at the time when the packet is received, a more up-to-date congestion signal iscarried by the marked packet. Second, since the router marks the packet in the front of the queue and not the incomingpacket, congestion signals do not undergo the queueing delay as the data packets. In this way, a faster congestionfeedback is delivered to the source.
The implementation of this strategy is extremely simple. One only needs to move the marking action from the enqueueprocedure to the dequeue procedure and choose the packet leaving the queue in stead of the packet entering the queue.
We justify the mark-front strategy by studying its benefits. We find that, by providing faster congestion signals, mark-front strategy reduces the buffer size requirement at the routers; it avoids packet losses and thus improves the linkefficiency when the buffer size in routers is limited. Our simulations also show that mark-front strategy improves thefairness among old and new users, and alleviates TCP’s discrimination against connections with large round trip time.
The mark-front strategy differs from the “drop from front” option in that when packets are dropped, only implicitcongestion feedback can be inferred from timeout or duplicate ACKs; when packets are marked, explicit and fastercongestion feedback is delivered to the source.
Gibbons and Kelly [6] suggested a number of mechanisms for packet marking, such as “marking all the packets inthe queue at the time of a packet loss”, “marking every packet leaving the queue from the time of a packet loss untilthe queue becomes empty”, and “marking packets randomly as they leave the queue with a probability so that laterpackets will not be lost.” Our mark-front strategy differs from these marking mechanisms in that it is a simple markingrule that faithfully reflects the up-to-date congestion status, while the mechanisms suggested by Gibbons and Kellyeither do not reflect the correct congestion status, or need sophisticated probability calculation about which no soundalgorithm is known.
It is worth mentioning that mark-front strategy is as effective in high speed networks as in low speed networks.Lakshman and Madhow [12] showed that the amount of drop-tail switches should be at least two to three times thebandwidth-delay product of the network in order for TCP to achieve decent performance and to avoid losses in theslow start phase. Our analysis in section 4.3 reveals that in the steady-state congestion avoidance phase, the queuesize fluctuates from empty to one bandwidth-delay product. So the queueing delay experienced by packets whencongestion happens is comparable to the fixed round-trip time.1 Therefore, the mark-front strategy can save as muchas a fixed round-trip time in congestion signal delay, independent of the link speed.
We should also mention that the mark-front strategy applies to both wired and wireless networks. When the routerthreshold is properly set, the coherence between consecutive packets can be used to distinguish packet losses due towireless transmission error from packet losses due to congestion. This result will be reported elsewhere.
This paper is organized as follows. In section 2 we describe the assumptions for our analysis. Dynamics of queuegrowth with TCP window control is studied in section 3. In section 4, we compare the buffer size requirements ofmark-front and mark-tail strategies. In section 5, we explain why mark-front is fairer than mark-tail. The simulationresults that verify our conclusions are presented in section 6. In section 7, we remove the assumptions made to facilitatethe analysis, and apply the mark-front strategy to the RED algorithm. Simulation results show that mark-front has theadvantages over mark-tail as revealed by the analysis.
1The fixed round-trip time is the round-trip time under light load, i.e., without queueing delay.
76NASA/TM—2001-210904

2 Assumptions
ECN is used together with TCP congestion control mechanisms like slow start and congestion avoidance [2]. When theacknowledgment is not marked, the source follows existing TCP algorithms to send data and increase the congestionwindow. Upon the receipt of an ECN-Echo, the source halves its congestion window and reduces the slow startthreshold. In the case of a packet loss, the source follows the TCP algorithm to reduce the window and retransmit thelost packet.
ECN delivers congestion signals by setting thecongestion experiencedbit, but determining when to set the bit dependson the congestion detection policy. In [3], ECN is proposed to be used with average queue length and RED. Their goalis to avoid sending congestion signals caused by transient traffic and to desynchronize sender windows [13, 14]. Inthis paper, to allow analytical modeling, we assume a simplified congestion detection criterion: when theactual queuelengthis smaller than the threshold, the incoming packet will not be marked; when theactual queue lengthexceedsthe threshold, the incoming packet will be marked.
We also make the following assumptions. (1) Receiver windows are large enough so the bottleneck is in the network.(2) Senders always have data to send and will send as many packets as their windows allow. (3) There is only onebottleneck link that causes queue buildup. (4) Receivers acknowledge every packet received and there are no delayedacknowledgments. (5) There is no ACK compression [15]. (6) The queue length is measured in packets and all packetshave the same size.
3 Queue Dynamics with TCP Window Control
In this section, we study the relationship between the window size at the source and the queue size at the congestedrouter. The purpose is to show the difference between mark-tail and mark-front strategies. Our analysis is made on oneconnection, but with small modifications, it can also apply to multiple connection case. Simulation results of multipleconnections and connections with different round trip time will be presented in section 6.
In a path with one connection, the only bottleneck is the first link with the lowest rate in the entire route. In case ofcongestion, queue builds up only at the router before the bottleneck link. The following lemma is obvious.
Lemma 1 If the data rate of the bottleneck link is�
packets per second, then the downstream packet inter-arrivaltime and the ack inter-arrival time on the reverse link can not be shorter than��� � seconds. If the bottleneck linkis fully-loaded (i.e., no idling), then the downstream packet inter-arrival time and the ack inter-arrival time on thereverse link are��� � seconds.
Denote the source window size at time� as ����� , then we have
Theorem 1 Consider a path with only one connection and only one bottleneck link. Let the fixed round trip time be seconds, the bottleneck link rate be�
packets per second, and the propagation and transmission time between thesource and bottleneck router be��� . If the bottleneck link has been busy for at least seconds, and a packet just arrivedat the congested router at time� , then the queue length at the congested router is
� ���������������� � ��� ��� (1)
Proof Consider the packet that just arrived at the congested router at time� . It was sent by the source at time������� .At that time, the number of packets on the path and outstanding acks on the reverse link was������������� . By time � , ��� �acks are received by the source. All packets between the source and the router have entered the congested router orhave been sent downstream. As shown in Figure 1, the pipe length from the congested router to the receiver, and thenback to the source is ����� . The number of downstream packets and outstanding acks are� � ���!� � . The rest of the���"��� � � unacknowledged packets are still in the congested router. So the queue length is
� �����#�$�������� � ���%� � � �&� ��� � � � ���������� � �"� �'� (2)
77NASA/TM—2001-210904

ReceiverSender routerP
T
t
t
p
p
total number of packets and acks r time downstream from the router = rd
r-t p
Figure 1: Calculation of the queue length
This finishes the proof.
Notice that in this theorem, we did not use the number of packets between the source and the congested router toestimate the queue length, because the packets downstream from the congested router and the acks on the reverse linkare equally spaced, but the packets between the source and the congested router may not be.
The analysis in this theorem is based on the assumptions in section 2. The conclusion applies to both slow start andcongestion avoidance phases. In order for equation (1) to hold, the router must have been congested for at least seconds.
4 Buffer Size Requirement and Threshold Setting
When ECN signals are used for congestion control, the network can achieve zero packet loss. When acknowledgmentsare not marked, the source gradually increase the window size. Upon the receipt of an ECN-Echo, the source halvesits congestion window to reduce the congestion.
In this section, we analyze the buffer size requirement for both mark-tail and mark-front strategies. The result alsoincludes an analysis on how to set the threshold.
4.1 Mark-Tail Strategy
Suppose( was the packet that increased the queue length over the threshold) , and it was sent from the source at time*,+ and arrived at the congested router at time� + . Its acknowledgment, which was an ECN-echo, arrived at the sourceat time *.- and the window was reduced at the same time. We also assume that the last packet before the windowreduction was sent at time*!/- and arrived at the congested router at time� /- .
In order to use Theorem 1, we need to consider two cases separately: when) is large and when) is small, comparedto � .
Case 1 If ) is reasonably large (about � ) such that the buildup of a queue of size) needs time, the assumption inTheorem 1 is satisfied, we have
)0� � ��� + �1�&��� + �����2��� � ���� *,+ ��� ��3 (3)
so�� *4+ ����) 5 �'� (4)
Since the time elapse between* + and * - is one RTT, if packet( were not marked, the congestion window wouldincrease to6.�� * + � . Since( was marked, the congestion window before receiving the ECN-Echo was
��� *!/- ���76.�� * + ���8�9��6'��):5 � ���8� � (5)
78NASA/TM—2001-210904

When the last packet sent under this window reached the router at time� /- , the queue length was
� �� /- �#�$�� * /- ��� � �76.��� *,+ ���8�;� � �062) 5 � �8� � (6)
Upon the receipt of ECN-Echo, the congestion window was halved. The source can not send any more packets beforehalf of the packets are acknowledged. So6.)<5 � �8� is the maximum queue length.
Case 2 If ) is small, � is an overestimate of the number of downstream packets and acks on the reverse link.
��� *,+ �1�&):5 number of downstream packets and acks=8):5 ��� (7)
Therefore, � �� /- ���$��� *!/- �"� � �>�?6.��� * + ���@���"� � =$6A�) 5 � ���@�;� � �06.)<5 � �@� � (8)
So, in both cases,6.)<5 � �@� is an upper bound of queue length that can be reached in slow start phase.
Theorem 2 In a TCP connection with ECN congestion control, if the fixed round trip time is seconds, the bottlenecklink rate is
�packets per second, and the bottleneck router uses threshold) for congestion detection, then the maximum
queue length can be reached in slow start phase is less than or equal to62) 5 � �8� .As shown by equation (6), when) is large, the bound6.)@5 � �$� can be reached with equality. When) is small,6.)&5 � �0� is just an upper bound. Since the queue length in congestion avoidance phase is smaller, this bound isactually the buffer size requirement.
4.2 Mark-Front Strategy
Suppose( was the packet that increased the queue length over the threshold) , and it was sent from the source at time* + and arrived at the congested router at time� + . The router marked the packet(CB that stood in the front of the queue.The acknowledgment of(CB , which was an ECN-echo, arrived at the source at time* - and the window was reducedat the same time. We also suppose the last packet before the window reduction was sent at time* /- and arrived at thecongested router at time� /- .
Consider two cases separately: when) is large and when) is small.
Case 1 If ) is reasonably large (about � ) such that the buildup of a queue of size) needs time, the assumption inTheorem 1 is satisfied. We have
)0� � ��� + �1�&��� + ��� � ��� � ���� * + ��� ��3 (9)
so�� * + ����) 5 �'� (10)
In slow start phase, the source increases the congestion window by one for every acknowledgment it receives. If theacknowledgment of( was received at the source without the congestion indication, the congestion window would bedoubled to
62�� *,+ ����6A�):5 � � �However, when the acknowledgment of( B arrived,)���� acknowledgments corresponding to packets prior to( werestill on the way. So the window size at time*!/- was
�� *!/- ���76.�� *4+ �"�&��)&�@�����8�D��)<5:6 ��� (11)
79NASA/TM—2001-210904

When the last packet sent under this window reached the router at time� /- , the queue length was
� ��� /- ���$�� * /- ��� � �&):5@6 � � � �$)<5 �'� (12)
Upon the receipt of ECN-Echo, congestion window is halved. The source can not send any more packets before halfof the packets are acknowledged. So)<5 � is the maximum queue length.
Case 2 If ) is small, � is an overestimate of the number of downstream packets and acks on the reverse link.
��� * + �1�&):5 number of downstream packets and acks=8):5 ��� (13)
Therefore, � ��� /- �1�&�� *2/- ��� � �E��6.�� * + �"��)9�"� � =&6'��)<5 � ����)@� � ��):5 ��� (14)
So, in both cases,)<5 � is an upper bound of queue length that can be reached in the slow start phase.
Theorem 3 In a TCP connection with ECN congestion control, if the fixed round trip time is seconds, the bottlenecklink rate is
�packets per second, and the bottleneck router uses threshold) for congestion detection, then the maximum
queue length that can be reached in slow start phase is less than or equal to)<5 � .Again, when) is large, equation (12) shows the bound)F5 � is tight. Since the queue length in congestion avoidancephase is smaller, this bound is actually the buffer size requirement.
Theorem 2 and 3 estimate the buffer size requirement for zero-loss ECN congestion control.
4.3 Threshold Setting
In the congestion avoidance phase, congestion window increases roughly by one in every RTT. Assuming mark-tailstrategy is used, using the same timing variables as in the previous subsections, we have
�� * + ��� � �� + �G5 � ��):5 ��� (15)
The congestion window increases roughly by one in an RTT,
�� *!/- ���$)<5 � 5$� � (16)
When the last packet sent before the window reduction arrived at the router, it saw a queue length of):5�� :� �� /- �#�&��� *!/- ��� � ��) 5�� � (17)
Upon the receipt of the ECN-Echo, the window was halved:
�� * - ���H�):5 � 5$���I�26 � (18)
The source may not be able to send packets immediately after* - . After some packets were acknowledged, the halvedwindow allowed new packets to be sent. The first packet sent under the new window saw a queue length of
� ��� - ���$�� * - ��� � �>��)<5 � 5$���I�!6J� � �>��)&� � 5$���I�!6 � (19)
The congestion window was fixed for an RTT and then began to increase. So� �� - � was the minimum queue length in
a cycle.
In summary, in the congestion avoidance phase, the maximum queue length is)@50� and the minimum queue lengthis �)8� � 5��K�L�26 .
80NASA/TM—2001-210904
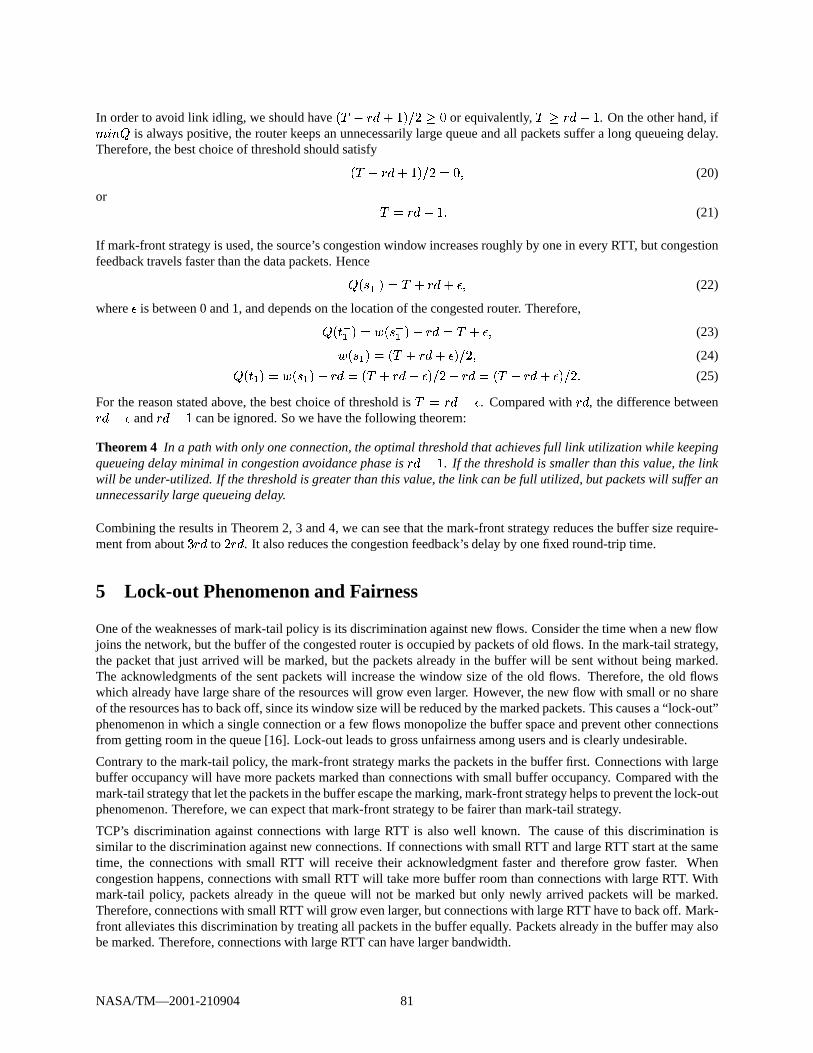
In order to avoid link idling, we should have��)&� � 50�K�L�26NM�O or equivalently,)HM � �&� . On the other hand, ifPRQ�S � is always positive, the router keeps an unnecessarily large queue and all packets suffer a long queueing delay.Therefore, the best choice of threshold should satisfy
��)&� � 5��K�I�!6C��O 3 (20)
or)�� � �@� � (21)
If mark-front strategy is used, the source’s congestion window increases roughly by one in every RTT, but congestionfeedback travels faster than the data packets. Hence� � *!/- ���$)<5 � 5:T 3 (22)
whereT is between 0 and 1, and depends on the location of the congested router. Therefore,� ��� /- �#�&�� *!/- ��� � �&):5:T 3 (23)
�� * - �#�H�)<5 � 5:TU�I�!6 3 (24)� �� - ������ *.- ��� � �H�)<5 � 5:TU�I�!6J� � �>��)&� � 5<TU�L�26 � (25)
For the reason stated above, the best choice of threshold is)V� � �:T . Compared with � , the difference between � ��T and � �8� can be ignored. So we have the following theorem:
Theorem 4 In a path with only one connection, the optimal threshold that achieves full link utilization while keepingqueueing delay minimal in congestion avoidance phase is � �$� . If the threshold is smaller than this value, the linkwill be under-utilized. If the threshold is greater than this value, the link can be full utilized, but packets will suffer anunnecessarily large queueing delay.
Combining the results in Theorem 2, 3 and 4, we can see that the mark-front strategy reduces the buffer size require-ment from aboutW � to 6 � . It also reduces the congestion feedback’s delay by one fixed round-trip time.
5 Lock-out Phenomenon and Fairness
One of the weaknesses of mark-tail policy is its discrimination against new flows. Consider the time when a new flowjoins the network, but the buffer of the congested router is occupied by packets of old flows. In the mark-tail strategy,the packet that just arrived will be marked, but the packets already in the buffer will be sent without being marked.The acknowledgments of the sent packets will increase the window size of the old flows. Therefore, the old flowswhich already have large share of the resources will grow even larger. However, the new flow with small or no shareof the resources has to back off, since its window size will be reduced by the marked packets. This causes a “lock-out”phenomenon in which a single connection or a few flows monopolize the buffer space and prevent other connectionsfrom getting room in the queue [16]. Lock-out leads to gross unfairness among users and is clearly undesirable.
Contrary to the mark-tail policy, the mark-front strategy marks the packets in the buffer first. Connections with largebuffer occupancy will have more packets marked than connections with small buffer occupancy. Compared with themark-tail strategy that let the packets in the buffer escape the marking, mark-front strategy helps to prevent the lock-outphenomenon. Therefore, we can expect that mark-front strategy to be fairer than mark-tail strategy.
TCP’s discrimination against connections with large RTT is also well known. The cause of this discrimination issimilar to the discrimination against new connections. If connections with small RTT and large RTT start at the sametime, the connections with small RTT will receive their acknowledgment faster and therefore grow faster. Whencongestion happens, connections with small RTT will take more buffer room than connections with large RTT. Withmark-tail policy, packets already in the queue will not be marked but only newly arrived packets will be marked.Therefore, connections with small RTT will grow even larger, but connections with large RTT have to back off. Mark-front alleviates this discrimination by treating all packets in the buffer equally. Packets already in the buffer may alsobe marked. Therefore, connections with large RTT can have larger bandwidth.
81NASA/TM—2001-210904

r1 r2 10Mb, 4ms1.5Mb, 20ms
10Mb, 2ms
sm
s2
s1 d1
d2
dm
Figure 2: Simulation model.
6 Simulation Results
In order to compare the mark-front and mark-tail strategies, we performed a set of simulations with theS�* simulator[8]. We modified the RED algorithm inS�* simulator to deterministically mark the packets when the real queuelength exceeds the threshold. The basic simulation model is shown in Figure 2. A number of sources* - 3 *KX 34�,�4�Y3 *,Zare connected to the router - by 10 Mbps links, router - is connected to ,X by a 1.5 Mbps link, and destinations� - 3I� X 34�4�,�Y3I� Z are connected to KX by 10 Mbps links. The link speeds are chosen so that congestion will only happenat the router - , where mark-tail and mark-front strategies are tested.
With the basic configuration shown in Figure 2, the fixed round trip time, including the propagation time and thetransmission time at the routers, is 59 ms. Changing the propagation delay between router - and ,X from 20 ms to 40ms gives an RTT of 99 ms. Changing the propagation delays between the sources and router - gives us configurationsof different RTT. An FTP application runs on each source. Reno TCP and ECN are used for congestion control. Thedata packet size, including all headers, is 1000 bytes and the acknowledgment packet size is 40 bytes.
With the basic configuration,
� �$O � O�[!\^]%� � [^]��,O�_ bits �H���,O!`a6 � [ bytes bH��� packets
In our simulations, the routers perform mark-tail or mark-front. The results for both strategies are compared.
6.1 Simulation Scenarios
In order to show the difference between mark-front and mark-tail strategies, we designed the following simulationscenarios based on the basic simulation model described in Figure 2. If not specified, all connections have an RTT of59 ms, start at 0 second and stop at the 10th second.
1. One connection.
2. Two connections with the same RTT.
3. Two overlapping connections with the same RTT, but the first connection starts at 0 second and stops at the 9thsecond, the second connection starts at the first second and stops at the 10th second.
4. Two connections with RTT equal to 59 and 157 ms respectively.
5. Two connections with same RTT, but the buffer size at the congested router is limited to 25 packets.
6. Five connections with the same RTT.
7. Five connections with RRT of 59, 67, 137, 157 and 257 ms respectively.
8. Five connections with the same RTT, but the buffer size at the congested router is limited to 25 packets.
82NASA/TM—2001-210904

Scenarios 1, 4, 6 and 7 are mainly designed for testing the buffer size requirement. Scenarios 1, 3, 4, 6, 7, 8 are forlink efficiency, and scenarios 2, 3, 4, 5, 6, 7 are for fairness among users.
6.2 Metrics
We use three metrics to compare the two strategies. The first metric is thebuffer size requirementfor zero losscongestion control. This is the maximum queue size that can be built up at the router in the slow start phase before thecongestion signal takes effect at the congested router. If the buffer size is greater or equal to this value, no packet losswill happen. This metric is measured as the maximum queue length in the entire simulation.
The second metric,link efficiency, is calculated from the number of acknowledged packets (not counting the retrans-missions) divided by the possible number of packets that can be transmitted during the simulated time. Because of theslow start phase and possible link idling after the window reduction, the link efficiency is always smaller than 1. Linkefficiency should be measured with long simulation time to minimize the effect of the initial transient state. We trieddifferent simulation times from 5 seconds to 100 seconds. The results for 10 seconds show the essential features of thestrategy, without much difference from the results for 100 seconds. So the simulation results presented in this paperare based on 10-second simulations.
The third metric,fairnessindex, is calculated according to the formula in [17]. IfP connections share the bandwidth,and ced is the number of acknowledged packets of connectionQ , then thefairnessindex is calculated as:
fhg Qi �SGj�*�* � ��kZdml - c�di� XP k Zdnl - c Xd (26)
fairness index is often close to 1, in our graphs, we draw theo S fhg Qi �SGj.*K* index:
o S fhg Qi �SGj.*�* �H�;� fhg Q� �SGj.*�* � (27)
The performance of ECN depends on the selection of the threshold value. In our results, all three metrics are drawnfor different values of threshold.
6.3 Buffer Size Requirement
Figure 3 shows the buffer size requirement for mark-tail and mark-front. The measured maximum queue lengths areshown with “p ” and “ q ”. The corresponding theoretical estimates from Theorem 2 and 3 are shown with dashed andsolid lines. In Figure 3(b) and 3(d), where the connections have different RTT, the theoretical estimate is calculatedfrom the smallest RTT.
From the simulation, we find that for connections with the same RTT, the theoretical estimate of buffer size requirementis accurate. When threshold) is small, the buffer size requirement is an upper bound, when)rM � , the upper boundis tight. For connections with different RTT, the estimate given by the largest RTT is an upper bound, but is usually anover estimate. The estimate given by the smallest RTT is a closer approximation.
6.4 Link Efficiency
Figure 4 shows the link efficiency for various scenarios. In all cases, the efficiency increases with the threshold, untilthe threshold is about � , where the link reaches almost full utilization. Small threshold results in low link utilizationbecause it generates congestion signals even when the router is not really congested. Unnecessary window reductionactions taken by the source lead to link idling. The link efficiency results in Figure 4 verify the choice of thresholdstated in Theorem 4.
In the unlimited buffer cases (a), (b), (d), (e), the difference between mark-tail and mark-front is small. However,when the buffer size is limited as in cases (c) and (f), mark-front has much better link efficiency. This is becausewhen congestion happens, mark-front strategy provides a faster congestion feedback than mark-tail. Faster congestion
83NASA/TM—2001-210904

0
10
20
30
40
50
60
70
80
0 5 10 15 20 25 30
Buf
fer
size
req
uire
men
t
s
Threshold
Mark Front theoreticalMark Tail theoretical
Mark Front simulationMark Tail simulation
(a) One single connection
0
10
20
30
40
50
60
70
80
0 5 10 15 20 25 30
Buf
fer
size
req
uire
men
t
s
Threshold
Mark Front theoreticalMark Tail theoretical
Mark Front simulationMark Tail simulation
(b) Two connections with different RTT
0
10
20
30
40
50
60
70
80
0 5 10 15 20 25 30
Buf
fer
size
req
uire
men
t
s
Threshold
Mark Front theoreticalMark Tail theoretical
Mark Front simulationMark Tail simulation
(c) Five connections with same RTT
0
10
20
30
40
50
60
70
80
0 5 10 15 20 25 30
Buf
fer
size
req
uire
men
t
s
Threshold
Mark Front theoreticalMark Tail theoretical
Mark Front simulationMark Tail simulation
(d) Five connections with different RTT
Figure 3: Buffer size requirement in various scenarios
feedback prevents the source from sending more packets that will be dropped at the congested router. Multiple dropscause source timeout and idling at the bottleneck link, and thus the low utilization. This explains the drop of linkefficiency in Figure 4 (c) and (f) when the threshold exceeds about 10 packets for mark-tail and about 20 packets inmark-front.
6.5 Fairness
Scenarios 2, 3, 4, 5, 6, 7 are designed to test the scenario of the two marking strategies. Figure 5 shows lock-outphenomenon and alleviation by mark-front strategy. With the mark-tail strategy, old connections occupy the bufferand lock-out new connections. Although the two connections in scenario 3 have the same time span, the number of theacknowledged packets in the first connection is much larger than that of the second connection, Figure 5(a). In scenario4, the connection with large RTT (157 ms) starts at the same time as the connection with small RTT (59 ms), but theconnection with small RTT grows faster, takes over a large portion of the buffer room and locks out the connectionwith large RTT. Of all of the bandwidth, only 6.49% is allocated to the connection with large RTT. Mark-front strategyalleviates the discrimination against large RTT by marking packets already in the buffer. Simulation results show thatmark-front strategy improves the portion of bandwidth allocated to connection with large RTT from 6.49% to 21.35%.
Figure 6 shows the unfairness index for the mark-tail and the mark-front strategies. In Figure 6(a), the two connections
84NASA/TM—2001-210904

0.82
0.84
0.86
0.88
0.9
0.92
0.94
0.96
0.98
1
0 5 10 15 20 25
Link
effi
cien
cy
t
Threshold
Mark FrontMark Tail
(a) One single connection
0.8
0.82
0.84
0.86
0.88
0.9
0.92
0.94
0.96
0.98
1
0 5 10 15 20 25
Link
effi
cien
cy
t
Threshold
Mark FrontMark Tail
(b) Two overlapping connections
0.82
0.84
0.86
0.88
0.9
0.92
0.94
0.96
0.98
1
0 5 10 15 20 25
Link
effi
cien
cy
t
Threshold
Mark FrontMark Tail
(c) Two same connections, limited buffer
0.86
0.88
0.9
0.92
0.94
0.96
0.98
1
0 5 10 15 20 25
Link
effi
cien
cy
t
Threshold
Mark FrontMark Tail
(d) Five connections with same RTT
0.5
0.55
0.6
0.65
0.7
0.75
0.8
0.85
0.9
0.95
1
0 5 10 15 20 25
Link
effi
cien
cy
t
Threshold
Mark FrontMark Tail
(e) Five connections with different RTT
0.86
0.88
0.9
0.92
0.94
0.96
0.98
1
0 5 10 15 20 25
Link
effi
cien
cy
t
Threshold
Mark FrontMark Tail
(f) Five same connections, limited buffer
Figure 4: Link efficiency in various scenarios
85NASA/TM—2001-210904

200
400
600
800
1000
1200
1400
1600
0 10 20 30 40 50 60 70
Ack
now
ledg
ed p
acke
ts
u
Threshold
mark-front, 1st conn mark-front, 2nd conn
mark-tail, 1st connmark-tail, 2nd conn
(a) Two overlapping connections
0
200
400
600
800
1000
1200
1400
1600
1800
0 10 20 30 40 50 60 70
Ack
now
ledg
ed p
acke
ts
u
Threshold
mark-front, small rttmark-front, large rtt
mark-tail, small rttmark-tail, large rtt
(b) Two connections with different RTT
Figure 5: Lock-out phenomenon and alleviation by mark-front strategy
have the same configuration. Which connection receives more packets than the other is not deterministic, so theunfairness index seems random. But in general, mark-front has smaller unfairness index than mark-tail.
In Figure 6(b), the two connections are different: the first connection starts first and takes the buffer room. Althoughthe two connections have the same time span, if mark-tail strategy is used, the second connection is locked out bythe first and therefore receives fewer packets. Mark-front avoids this lock-out phenomenon. The results show thatthe unfairness index of mark-front is much smaller than that of mark-tail. In addition, as the threshold increases, theunfairness index of mark-tail increases, but the mark-front remains roughly the same, regardless of the threshold.
Figure 6(c) shows the difference on connections with different RTT. With mark-tail strategy, the connections withsmall RTT grow faster and therefore locked out the connections with large RTT. Since mark-front strategy does nothave the lock-out problem, the discrimination against connections with large RTT is alleviated. The difference of thetwo strategies is obvious when the threshold is large.
Figure 6(e) shows the unfairness index when the router buffer size is limited. In this scenario, when the buffer is full,the router drops the the packet in the front of the queue. Whenever a packet is sent, the router checks whether thecurrent queue size is larger than the threshold. If yes, the packet is marked. The figure shows that mark-front is fairerthan mark-tail.
Similar results for five connections are shown in Figure 6(d) and 6(f).
7 Apply to RED
The analytical and simulation results obtained in previous sections are based on the simplified congestion detectionmodel that a packet leaving a router is marked if the actual queue size of the router exceeds the threshold. However,RED uses a different congestion detection criterion. First, RED uses average queue size instead of the actual queuesize. Second, a packet is not marked deterministically, but with a probability calculated from the average queue size.
In this section, we apply the mark-front strategy to the RED algorithm and compare the results with the mark-tailstrategy. Because of the difficulty in analyzing RED mathematically, the comparison is carried out by simulationsonly.
RED algorithm needs four parameters: queue weight� , minimum threshold��v Z dnw , maximum threshold��v Z;xUy andmaximum marking probabilityz Z;xUy . Although determining the best RED parameters is out of the scope of this paper,we have tested several hundred of combinations. In almost all these combinations, mark-front has better performancethan mark-tail in terms of buffer size requirement, link efficiency and fairness.
86NASA/TM—2001-210904

0
0.05
0.1
0.15
0.2
0.25
0.3
0.35
0.4
0.45
0.5
0 10 20 30 40 50 60 70
Unf
airn
ess
Threshold
Mark FrontMark Tail
(a) Two same connections
0
0.05
0.1
0.15
0.2
0.25
0.3
0.35
0.4
0.45
0.5
0 10 20 30 40 50 60 70
Unf
airn
ess
Threshold
Mark FrontMark Tail
(b) Two overlapping connections
0
0.05
0.1
0.15
0.2
0.25
0.3
0.35
0.4
0.45
0.5
0 10 20 30 40 50 60 70
Unf
airn
ess
Threshold
Mark FrontMark Tail
(c) Two connections with different RTT
0
0.05
0.1
0.15
0.2
0.25
0.3
0.35
0.4
0.45
0.5
0 10 20 30 40 50 60 70
Unf
airn
ess
Threshold
Mark FrontMark Tail
(d) Five same connections
0
0.05
0.1
0.15
0.2
0.25
0.3
0.35
0.4
0.45
0.5
0 5 10 15 20 25
Unf
airn
ess
Threshold
Mark FrontMark Tail
(e) Five same connections, limited buffer
0
0.05
0.1
0.15
0.2
0.25
0.3
0.35
0.4
0.45
0.5
0 10 20 30 40 50 60 70
Unf
airn
ess
Threshold
Mark FrontMark Tail
(f) Five connections with different RTT
Figure 6: Unfairness in various scenarios
87NASA/TM—2001-210904

0
50
100
150
200
250
300
350
0 10 20 30 40 50 60 70
Buf
fer
size
req
uire
men
t
s
Threshold
Mark FrontMark Tail
(a) w=0.002
0
20
40
60
80
100
120
140
160
180
0 10 20 30 40 50 60 70
Buf
fer
size
req
uire
men
t
s
Threshold
Mark FrontMark Tail
(b) w=0.02
0
20
40
60
80
100
120
140
160
0 10 20 30 40 50 60 70
Buf
fer
size
req
uire
men
t
s
Threshold
Mark FrontMark Tail
(c) w=0.2
0
20
40
60
80
100
120
140
0 10 20 30 40 50 60 70
Buf
fer
size
req
uire
men
t
s
Threshold
Mark FrontMark Tail
(d) w=1
Figure 7: Buffer size requirement for different queue weight,z Z;xUy ��O � �
Instead of presenting individual parameter combinations for all scenarios, we focus on one scenario and present theresults for a range of parameter values. The simulation scenario is the scenario 3 of two overlapping connectionsdescribed in section 6.1. Based on the recommendations in [13], we vary the queue weight� for four values: 0.002,0.02, 0.2 and 1, vary��v Z dmw from 1 to 70, fix ��v Z{xYy as 6.��v Z dmw , and fix z Z;xUy as 0.1.
Figure 7 shows the buffer size requirement for both strategies with different queue weight. In all cases, mark-frontstrategy requires smaller buffer size than the mark-tail. The results also show that queue weight� is a major factoraffecting the buffer size requirement. Smaller queue weight requires larger buffer. When the actual queue size is used(corresponding to�0�H� ), RED requires the minimum buffer size.
Figure 8 shows the link efficiency. For almost all values of threshold, mark-front provides better link efficiency thanmark-tail. Contrary to the common belief, the actual queue size (Figure 8(d)) is no worse than the average queue size(Figure 8(a)) in achieving higher link efficiency.
The queue size trace at the congested router shown in Figure 9 provides some explanation for the smaller buffersize requirement and higher efficiency of mark-front strategy. When congestion happens, mark-front delivers fastercongestion feedback than mark-tail so that the sources can stop sending packets earlier. In Figure 9(a), with mark-tailsignal, the queue size stops increasing at 1.98 second. With mark-front signal, the queue size stops increasing at 1.64second. Therefore mark-front strategy needs smaller buffer.
88NASA/TM—2001-210904

0.55
0.6
0.65
0.7
0.75
0.8
0.85
0.9
0.95
1
0 10 20 30 40 50 60 70
Link
effi
cien
cy
t
Threshold
Mark FrontMark Tail
(a) w=0.002
0.6
0.65
0.7
0.75
0.8
0.85
0.9
0.95
1
0 10 20 30 40 50 60 70
Link
effi
cien
cy
t
Threshold
Mark FrontMark Tail
(b) w=0.02
0.7
0.75
0.8
0.85
0.9
0.95
1
0 10 20 30 40 50 60 70
Link
effi
cien
cy
t
Threshold
Mark FrontMark Tail
(c) w=0.2
0.7
0.75
0.8
0.85
0.9
0.95
1
0 10 20 30 40 50 60 70
Link
effi
cien
cy
t
Threshold
Mark FrontMark Tail
(d) w=1
Figure 8: Link efficiency for different queue weight,z Z;xUy ��O � �
On the other hand, when congestion is gone, mark-tail is slow in reporting the change of congestion status. Packetsleaving the router still carry the congestion information set at the time when they entered the queue. Even if the queueis empty, these packets still tell the sources that the router is congested. This out-dated congestion information isresponsible for the link idling around 6th second and 12th second in Figure 9(a). As a comparison, in Figure 9(b), thesame packets carry more up-to-date congestion information to tell the sources that the router is no longer congested,so the sources send more packets in time. Thus mark-front signal helps to avoid link idling and improve the efficiency.
Figure 10 shows the unfairness index. Both mark-front and mark-tail have big oscillations in the unfairness index whenthe threshold changes. These oscillations are caused by the randomness of how many packets of each connection getmarked in the bursty TCP slow start phase. Changing the threshold value can significantly change the number ofmarked packets of each connection. In spite of the randomness, in most cases mark-front is fairer than mark-tail.
8 Conclusion
In this paper we analyze the mark-front strategy used in Explicit Congestion Notification (ECN). Instead of markingthe packet from the tail of the queue, this strategy marks the packet in the front of the queue and thus delivers fastercongestion signals to the source. Compared with the mark-tail policy, mark-front strategy has three advantages. First,
89NASA/TM—2001-210904

0
50
100
150
200
250
300
350
0 5 10 15 20 25 30
queu
e si
ze|
time
actual queue sizeaverage queue size
(a) Mark tail
0
50
100
150
200
250
300
0 5 10 15 20 25 30
queu
e si
ze|
time
actual queue sizeaverage queue size
(b) Mark front
Figure 9: Change of queue size at the congested router,�7��O � O�O�6 3 ��v Z dnw��r}.O 3 ��v Z;xUy �E�4~�O 3 z Z{xYy �0O � �
0
0.05
0.1
0.15
0.2
0.25
0.3
0.35
0.4
0.45
0.5
0 10 20 30 40 50 60 70
Unf
airn
ess
Threshold
Mark FrontMark Tail
(a) w=0.002
0
0.05
0.1
0.15
0.2
0.25
0.3
0.35
0.4
0.45
0 10 20 30 40 50 60 70
Unf
airn
ess
Threshold
Mark FrontMark Tail
(b) w=0.02
0
0.05
0.1
0.15
0.2
0.25
0.3
0.35
0.4
0.45
0 10 20 30 40 50 60 70
Unf
airn
ess
Threshold
Mark FrontMark Tail
(c) w=0.2
0
0.05
0.1
0.15
0.2
0.25
0.3
0.35
0.4
0.45
0.5
0 10 20 30 40 50 60 70
Unf
airn
ess
Threshold
Mark FrontMark Tail
(d) w=1
Figure 10: Unfairness for different queue weight,z Z{xYy �$O � �
90NASA/TM—2001-210904

it reduces the buffer size requirement at the routers. Second, it provides more up-to-date congestion information to helpthe source adjust its window in time to avoid packet losses and link idling, and thus improves the link efficiency. Third,it improves the fairness among old and new users, and helps to alleviate TCP’s discrimination against connections withlarge round trip time.
With a simplified model, we analyze the buffer size requirement for both mark-front and mark-tail strategies. Linkefficiency, fairness and more complicated scenarios are tested with simulations. The results show that mark-frontstrategy achieves better performance than the current mark-tail policy. We also apply the mark-front strategy to theRED algorithm. Simulations show that mark-front strategy used with RED has similar advantages over mark-tail.
Based on the analysis and the simulations, we conclude that mark-front is an easy-to-implement improvement thatprovides a better congestion control that helps TCP to achieve smaller buffer size requirement, higher link efficiencyand better fairness among users.
References
[1] V. Jacobson, Congestion avoidance and control,Proc. ACM SIGCOMM’88, pp. 314-329, 1988.
[2] W. Stevens, TCP slow start, congestion avoidance, fast retransmit, and fast recovery algorithms,RFC 2001,January 1997.
[3] K. Ramakrishnan and S. Floyd, A proposal to add Explicit Congestion Notification (ECN) to IP,RFC 2481,January 1999.
[4] S. Floyd, TCP and explicit congestion notification,ACM Computer Communication Review, V. 24 N. 5, p. 10-23,October 1994.
[5] J. H. Salim, U. Ahmed, Performance Evaluation of Explicit Congestion Notification (ECN) in IP Networks,Internet Draft draft-hadi-jhsua-ecnperf-01.txt, March 2000.
[6] R. J. Gibbens and F. P. Kelly, Resource pricing and the evolution of congestion control, Automatica 35, 1999.
[7] C. Chen, H. Krishnan, S. Leung, N. Tang, Implementing Explicit Congestion Notification (ECN) in TCP forIPv6, available at http://www.cs.ucla.edu/˜ tang/papers/ECNpaper.ps, Dec. 1997.
[8] UCB/LBNL/VINT Network Simulator - ns (version 2), http://www-mash.CS.Berkeley.EDU/ns/.
[9] N. Yin and M. G. Hluchyj, Implication of dropping packets from the front of a queue,7-th ITC, Copenhagen,Denmark, Oct 1990.
[10] T. V. Lakshman, A. Neidhardt and T. J. Ott, The drop from front strategy in TCP and in TCP over ATM,Info-com96, 1996.
[11] S. Floyd, RED with drop from front, email discussion on the end2end mailing list,ftp://ftp.ee.lbl.gov/email/sf.98mar11.txt, March 1998.
[12] T. V. Laksman and U. Madhow. Performance Analysis of window-based flow control using TCP/IP: the effectof high bandwidth-delay products and random loss, inProceedings of High Performance Networking, V. IFIPTC6/WG6.4 Fifth International Conference, Vol C, pp 135-149, June 1994.
[13] S. Floyd and V. Jacobson, Random early detection gateways for congestion avoidance,IEEE/ACM Transactionson Networking, Vol. 1, No. 4, pp. 397-413, August 1993.
[14] S. Blake, D. Black, M. Carlson, E. Davies, Z. Wang and W. Weiss, An architecture for differentiated services,,RFC 2475, December 1998.
[15] L. Zhang, S. Shenker, and D. D. Clark, Observations and dynamics of a congestion control algorithm: the effectsof two-way traffic,Proc. ACM SIGCOMM ’91, pages 133-147, 1991.
91NASA/TM—2001-210904

[16] B. Braden et al, Recommendations on Queue Management and Congestion Avoidance in the Internet,RFC 2309,April 1998.
[17] R. Jain,The Art of Computer System Performance Analysis, John Wiley and Sons Inc., 1991.
Chunlei Liu received his M.Sc degree in Computational Mathematics from Wuhan University, China in 1991. Hereceived his M.Sc degrees in Applied Mathematics and Computer and Information Science from Ohio State Universityin 1997. He is now a PhD candidate in Department of Computer and Information Science at Ohio State University.His research interests include congestion control, quality of service, wireless networks and network telephony. He isa student member of IEEE and IEEE Communications Society.
Raj Jain is the cofounder and CTO of Nayna Networks, Inc - an optical systems company. Prior to this he was aProfessor of Computer and Information Science at The Ohio State University in Columbus, Ohio. He is a Fellowof IEEE, a Fellow of ACM and a member of Internet Society, Optical Society of America, Society of Photo-OpticalInstrumentation Engineers (SPIE), and Fiber Optic Association. He is on the Editorial Boards of Computer Networks:The International Journal of Computer and Telecommunications Networking, Computer Communications (UK), Jour-nal of High Speed Networks (USA), and Mobile Networks and Applications. Raj Jain is on the Board of Directorsof MED-I-PRO Systems, LLC, Pamona, CA, and MDeLink, Inc. of Columbus, OH. He is on the Board of TechnicalAdvisors to Amber Networks, Santa Clara, CA. Previously, he was also on the Board of Advisors to Nexabit NetworksWestboro, MA, which was recently acquired by Lucent Corporation. He is also a consultant to several networkingcompanies. For further information and publications, please see http://www.cis.ohio-state.edu/� jain/.
92NASA/TM—2001-210904

Delivering Faster Congestion Feedback with the Mark-Front Strategy�
Chunlei Liu Raj Jain
Department of Computer and Information Science
The Ohio State University, Columbus, OH 43210-1277, USA
email:�cliu, jain� @cis.ohio-state.edu
Abstract
Computer networks use congestion feedback from therouters and destinations to control the transmission load.Delivering timely congestion feedback is essential to theperformance of networks. Reaction to the congestion canbe more effective if faster feedback is provided. CurrentTCP/IP networks use timeout, duplicate ACKs and ex-plicit congestion notification (ECN) to deliver the con-gestion feedback, each provides a faster feedback thanthe previous method. In this paper, we propose a mark-front strategy that delivers an even faster congestion feed-back. With analytical and simulation results, we show thatmark-front strategy reduces buffer size requirement, im-proves link efficiency and provides better fairness amongusers.
Keywords:Explicit Congestion Notification, mark-front,congestion control, buffer size requirement, fairness.
1 Introduction
Computer networks use congestion feedback from therouters and destinations to control the transmission load.When the feedback is “not congested”, the source slowlyincreases the transmission window. When the feedbackis “congested”, the source reduces its window to alleviatethe congestion [1]. Delivering timely congestion feedbackis essential to the performance of networks. The faster thefeedback is, the more effective the reaction to congestioncan be.
TCP/IP networks uses three methods — timeout, dupli-cate ACKs and ECN — to deliver congestion feedback.
In 1984, Jain [2] proposed to use timeout as an indicatorof congestion. When a packet is sent, the source startsa retransmission timer. If the acknowledgment is not re-ceived within a certain period of time, the source assumescongestion has happened and the packet has been lost be-cause of the congestion. The lost packet is retransmitted�This research was sponsored in part by NSF Award #9809018 and
NASA Glen Research Center.
and the source’s congestion window is reduced. Since ithas to wait for the timer to expire, timeout turns out to bethe slowest feedback.
With duplicate ACKs, the receiver sends an acknowledg-ment after the reception of a packet. If a packet is notreceived but its subsequent packet arrives, the ACK forthe subsequent packet is a duplicate ACK. TCP source in-terprets the reception of three duplicate ACKs as an in-dication of packet loss. Duplicate ACKs avoid the longwait for the retransmission timer to expire, and therefore,delivers a faster feedback than timeout.
Both timeout and duplicate ACKs methods send conges-tion feedback at the cost of packet losses, which not onlyincrease the traffic in the network, but also add large trans-fer delay. Studies [3, 4, 5, 6, 7] show that the throughput ofthe TCP connection is limited by packet loss probability.
The congestion feedbacks from timeout and duplicateACKs are implicit because they are inferred by the net-works. In timeout method, incorrect timeout value maycause erroneous inference at the source. In duplicateACKs method, all layers must send the packets in order. Ifsome links have selective local link-layer retransmission,like those used in wireless links to combat transmission er-rors, the packets are not delivered in order. The inferenceof congestion from duplicate ACKs us no longer valid.
Ramakrishnan and Jain’s work in [8], which has been pop-ularly called theDECbit scheme, uses a single bit in thenetwork layer header to signal the congestion. The Ex-plicit Congestion Notification (ECN) [9, 10], motivated bythe DECbit scheme, provides a mechanism for intermedi-ate routers to send early congestion feedback to the sourcebefore actual packet losses happen. The routers monitortheir queue length. If the queue length exceeds a thresh-old, the router marks theCongestion Experiencedbit inthe IP header. Upon the reception of a marked packet, thereceiver marks theECN-Echobit in the TCP header of theacknowledgment to send the congestion feedback back tothe source. In this way, ECN delivers an even faster con-gestion feedback explicitly set by the routers.
In most ECN implementations, when congestion happens,the congested router marks the incoming packet. When
93NASA/TM—2001-210904

the buffer is full or when a packet needs to be droppedas in Random Early Detection (RED), some implementa-tions have the “drop from front” option to drop packetsfrom the front of the queue, as suggested in Yin [12] andLakshman [13]. However, none of these implementationsmark the packet from the front of the queue.
In this paper, we propose the “mark-front” strategy. Whena packet is sent from a router, the router checks whether itsqueue length is greater than the pre-determined threshold.If yes, the packet is marked and sent to the next router.The mark-front strategy differs from the current “mark-tail” policy in two ways. First, the router marks the packetin the front of the queue and not the incoming packet, sothe congestion signal does not undergo the queueing delayas the data packets. Second, the router marks the packetat the time when it is sent, and not at the time when thepacket is received. In this way, a more up-to-date conges-tion feedback is given to the source.
The mark-front strategy also differs from the “drop fromfront” option, because when packets are dropped, only im-plicit congestion feedback can be inferred from timeout orduplicate ACKs. When packets are marked, explicit andfaster congestion feedback is sent to the source.
Our study finds that, by providing faster congestion feed-back, mark-front strategy reduces the buffer size require-ment at the routers; it avoids packet losses and thus im-proves the link efficiency when the buffer size in routers islimited. Our simulations also show that mark-front strat-egy improves the fairness among old and new users, andalleviates TCP’s discrimination against connections withlarge round trip times.
This paper is organized as follows. In section 2 we de-scribe the assumptions for our analysis. Dynamics ofqueue growth with TCP window control is studied in sec-tion 3. In section 4, we compare the buffer size require-ment of mark-front and mark-tail strategies. In section 5,we explain why mark-front is fairer than mark-tail. In sec-tion 6, the simulation results that verify our conclusionsare presented.
2 Assumptions
In [9], ECN is proposed to be used with average queuelength and RED. The purpose of average queue length isto avoid sending congestion signals caused by bursty traf-fic, and the purpose of RED is to desynchronize senderwindows [14, 15] so that the router can have a smallerqueue. Because average queue length and RED are diffi-cult to analyzed mathematically, in this paper we assumea simplified congestion detection criterion: when theac-tual queue lengthis smaller than the threshold, the in-
coming packet will not be marked; when theactual queuelengthexceeds the threshold, the incoming packet will bemarked.
We also make the following assumptions. (1) Receiverwindows are large enough so the bottleneck is in the net-work. (2) Senders always have data to send. (3) Thereis only one bottleneck link that causes queue buildup. (4)Receivers acknowledge every packet received and thereare no delayed acknowledgments. (5) The queue length ismeasured in packets and all packets have the same size.
3 Queue Dynamics
In this section, we study the relationship between the win-dow size at the source and the queue size at the congestedrouter. The analysis is made on one connection, simula-tion results of multiple connections will be presented insection 6.
Under the assumption of one bottleneck, when congestionhappens, packets pile up only at the bottleneck router. Thefollowing lemma is obvious.
Lemma 1 If the data rate of the bottleneck link is� pack-ets per second, then the inter-arrival time of downstreampackets and ACKs for this connection can not be shorterthan ����� seconds. If the bottleneck link is fully-loaded,then the inter-arrival time is���� seconds.
Denote the source window size at time as � ���� , then wehave
Theorem 1 Consider a transmission path with only onebottleneck link. Suppose the fixed round trip time is� sec-onds, the bottleneck link rate is� packets per second, andthe propagation between the source and bottleneck routeris �� . If the bottleneck link has been busy for at least�seconds, and a packet arrives at the congested router attime , then the queue length at the congested router is
� �������� ����� � ��������� (1)
Proof Consider the packet that arrives at the congestedrouter at time . It was sent by the source at time ��� . At that time, the number of packets on the forwardpath and outstanding ACKs on the reverse path was� ��!���"� . By time , ��� ACKs are received by the source. Allpackets between the source and the router have entered thecongested router or have been sent downstream. As shownin Figure 1, the pipe length from the congested router tothe receiver, and back to the source is�#�$ � . The numberof downstream packets and outstanding ACKs are���%� � �&� . The rest of the�'��(�) � � unacknowledged packetsare still in the congested router. So the queue length is
94NASA/TM—2001-210904

ReceiverSender routerP
T
t
t
p
p
total number of packets and acks r time downstream from the router = rd
r-t p
Figure 1: Calculation of the queue length
� ����(�*� ��"� ��"�"� �����+���,� ��-�&�'��� ��-� ��-�"� ����� (2)
This finishes the proof.
Notice that in this theorem, we did not use the numberof packets between the source and the congested routerto estimate the queue length, because the packets down-stream from the congested router and the ACKs on thereverse path are equally spaced, but the packets betweenthe source and the congested router may not be.
4 Buffer Size Requirement
ECN feedback can be used to achieve zero-loss conges-tion control. If routers have enough buffer space and thethreshold value is properly set, the source can control thequeue length by adjusting its window size based on theECN feedback. The buffer size requirement will be themaximum queue size that can be reached before the win-dow reduction takes effect. In this section, we use The-orem 1 to study the buffer size requirement of mark-tailand mark-front strategies.
4.1 Mark-Tail Strategy
Suppose. is the packet that increased the queue lengthover the threshold/ , and it was sent from the source attime 021 and arrived at the congested router at time31 . Itsacknowledgment, which was an ECN-echo, arrived at thesource at time0�4 and the window was reduced at the sametime. We also assume that the last packet before the win-dow reduction was sent at time054 and arrived at the con-gested router at time 54 .
If / is reasonably large (about��� ) such that the buildup ofa queue of size/ needs� time, the assumption in Theorem1 is satisfied, we have
/�� � �� 1 �6�7� �� 1 �����������8��� �90 1 ��������� (3)
If / is small,��� is an overestimate of the number of down-stream packets and ACKs on the reverse path. So
� ��0:1��<;=/?>@���!� (4)
Since the time elapse between0:1 and 0 4 is one RTT, ifpacket. were not marked, the congestion window wouldincrease toA� �90 1 � . Because. was marked, when theECN-Echo is received, the congestion window was
� �90 54 ���BA��'�90 1 ���=�C;=A!��/)>@���D���=�-� (5)
When the last packet sent under this window reached therouter at time 54 , the queue length was
� ��E54 �6�7� ��054 �������%;7A/?>@���F�=�-� (6)
Upon the receipt of ECN-Echo, the congestion windowwas halved. The source can not send any more packetsbefore half of the packets are acknowledged. SoA�/G>��� �=� is the maximum queue length.
Theorem 2 In a TCP connection with ECN congestioncontrol, if the fixed round trip time is� seconds, the bottle-neck link rate is� packets per second, and the bottleneckrouter uses threshold/ for congestion detection, then themaximum queue length can be reached in slow start phaseis less than or equal toA�/@>?���'�H� .
When / is large, the boundA�/7>*���I�J� is tight. Sincethe queue length in congestion avoidance phase is smaller,this bound is actually the buffer size requirement.
4.2 Mark-Front Strategy
Suppose. is the packet that increased the queue lengthover the threshold/ , and it was sent from the source attime 0:1 and arrived at the congested router at time31 . Therouter marked the packet.CK that stood in the front of thequeue. The acknowledgment of.CK , which was an ECN-echo, arrived at the source at time0�4 and the window was
95NASA/TM—2001-210904

reduced at the same time. We also suppose the last packetbefore the window reduction was sent at time0 54 and ar-rived at the congested router at time 54 .
If / is reasonably large (about��� ) such that the buildup ofa queue of size/ needs� time, the assumption in Theorem1 is satisfied. We have
/�� � �� 1 �6�7� �� 1 �����������8��� �90 1 ��������L (7)
If / is small,��� is an overestimate of the number of down-stream packets and ACKs on the reverse path. So
� �90:1��M;)/)>@����� (8)
In slow start phase, the source increases the congestionwindow by one for every acknowledgment it receives. Ifthere were no congestion, upon the reception of the ac-knowledgment of. , the congestion window would bedoubled toA� �90 1 � . However, when the acknowledgmentof . K arrived, /N��� acknowledgments corresponding topackets prior to. were still on the way. So the windowsize at time0 54 was
� ��0 54 ���JA� �90:1����=��/7�H�����H�C;H/@>HA������ (9)
When the last packet sent under this window reached therouter at timeE54 , the queue length was� ��E54 �6�7� ��054 �������%;H/@>HA����F�����8��/?>@���!� (10)
Upon the receipt of ECN-Echo, congestion window ishalved. The source can not send any more packets be-fore half of the packets are acknowledged. So/7>=��� isthe maximum queue length.
Theorem 3 In a TCP connection with ECN congestioncontrol, if the fixed round trip time is� seconds, the bottle-neck link rate is� packets per second, and the bottleneckrouter uses threshold/ for congestion detection, then themaximum queue length that can be reached in slow startphase is less than or equal to/)>@��� .When / is large, the bound/N>B��� is tight. Since thequeue length in congestion avoidance phase is smaller,this bound is actually the buffer size requirement.
Theorem 2 and 3 estimate the buffer size requirement forzero-loss ECN congestion control. They show that themark-front strategy reduces the buffer size requirement by��� , a bandwidth round trip time product.
5 Fairness
One of the weaknesses of mark-tail policy is its discrimi-nation against new flows. Consider the time when a new
flow joins the network and the buffer of the congestedrouter is occupied by packets of old flows. With the mark-tail strategy, the packet that just arrived will be marked,but the packets already in the buffer will be sent withoutbeing marked. The acknowledgments of the sent packetswill increase the window size of the old flows. Therefore,the old flows that already have large share of the resourceswill grow even larger, but the new flow with small or noshare of the resources has to back off since its windowsize will be reduced by the marked packets. This is calleda “lock-out” phenomenon because a single connection ora few flows monopolize the buffer space and prevent otherconnections from getting room in the queue [16]. Lock-out leads to gross unfairness among users and is clearlyundesirable.
Contrary to the mark-tail policy, the mark-front strategymarks packets already in the buffer. Flows with largebuffer occupancy have higher probability to be marked.Flows with smaller buffer occupancy will less likely to bemarked. Therefore, old flows will back off to give part oftheir buffer room to the new flow. This helps to preventthe lock-out phenomenon. Therefore, mark-front strategyis fairer than mark-tail strategy.
TCP’s discrimination against connections with large RTTsis also well known. The cause of this discriminationis similar to the discrimination against new connections.Connections with small RTTs receives their acknowledg-ment faster and therefore grow faster. Starting at the sametime as connections with large RTTs, connections withsmall RTTs will take larger room in the buffer. With mark-tail policy, packets already in the queue will not be markedbut only newly arrived packets will be marked. Therefore,connections with small RTTs will grow even larger, butconnections with large RTTs have to back off. Mark-frontalleviates this discrimination by treating all packets in thebuffer equally. Packets already in the buffer may also bemarked. Therefore, connections with large RTTs can havelarger bandwidth.
6 Simulation Results
In order to compare the mark-front and mark-tail strate-gies, we performed a set of simulations with theOP0 simu-lator [11].
6.1 Simulation Models
Our simulations are based on the basic simulation modelshown in Figure 2. A number of sources0 4 LQ0SRL:�2�2�:LQ0STare connected to the router� 4 by 10 Mbps links. Router� 4 is connected to�:R by a 1.5 Mbps link. Destinations�D4LU� R L:�2�:�2LU� T are connected to� R by 10 Mbps links. The
96NASA/TM—2001-210904

r1 r2 10Mb, 4ms1.5Mb, 20ms
10Mb, 2ms
sm
s2
s1 d1
d2
dm
Figure 2: Simulation model.
link speeds are chosen so that congestion will only happenat the router��4 , where mark-tail and mark-front strategiesare tested.
With the basic configuration, the fixed round trip time, in-cluding the propagation time and the processing time atthe routers, is 59 ms. Changing the propagation delay be-tween router��4 and � R from 20 ms to 40 ms gives an RTTof 99 ms. Changing the propagation delays between thesources and router��4 gives us configurations of differentRTTs. An FTP application runs on each source. The datapacket size is 1000 bytes and the acknowledgment packetsize is 40 bytes. TCP Reno and ECN are used for conges-tion control.
The following simulation scenarios are designed on thebasic simulation model. In each of the scenarios, if nototherwise specified, all connections have an RTT of 59ms, start at 0 second and stop at the 10th second.
1. One single connection.
2. Two connections with the same RTT, starting andending at the same time.
3. Two connections with the same RTT, but the firstconnection starts at 0 second and stops at the 9th sec-ond, the second connection starts at the first secondand stops at the 10th second.
4. Two connections with RTT equal to 59 and 157 msrespectively.
5. Two connections with same RTT, but the buffer sizeat the congested router is limited to 25 packets.
6. Five connections with the same RTT.
7. Five connections with RRT of 59, 67, 137, 157 and257 ms respectively.
8. Five connections with the same RTT, but the buffersize at the congested router is limited to 25 packets.
Scenarios 1, 4, 6 and 7 are mainly designed for testing thebuffer size requirement. Scenarios 1, 3, 4, 6, 7, 8 are for
link efficiency, and scenarios 2, 3, 4, 5, 6, 7 are for fairnessamong users.
6.2 Metrics
We use three metrics to compare the the results. The firstmetric is thebuffer size requirementfor zero loss conges-tion control, which is the maximum queue size that can bebuilt up at the router in the slow start phase before the con-gestion feedback takes effect. If the buffer size is greateror equal to this value, the network will not suffer packetlosses. The analytical results for one connection are givenin Theorem 2 and 3. Simulations will be used in multiple-connection and different RTT cases.
The second metric,link efficiency, is calculated from thenumber of acknowledged packets and the possible numberof packets that can be transmitted during the simulationtime. There are two reasons that cause the link efficiencyto be lower than full utilization. The first reason is theslow start process. In the slow start phase, the congestionwindow grows from one and remains smaller than the net-work capacity until the last round. So the link is not fullyused in slow start phase. The second reason is low thresh-old. If the congestion detection threshold/ is too small,ECN feedback can cause unnecessary window reductions.Small congestion window leads to link under-utilization.Our experiments are long enough so that the effect of theslow start phase can be minimized.
The third metric,fairnessindex, is calculated according tothe method described in [17]. IfV connections share thebandwidth andW�X is the throughput of connectionY , thefairnessindex is calculated as:
Z\[ Y]��O,^�0S0 � ��_ TXa` 4 WbX�� RVG_ TXa` 4 W RX (11)
When all connections have the same throughput, the fair-ness index is 1. The farther the throughput distribution isaway from the equal distribution, the smaller the fairnessvalue is. Since the fairness index in our results is often
97NASA/TM—2001-210904

0
10
20
30
40
50
60
70
80
0 5 10 15 20 25 30
Buf
fer
size
req
uire
men
t
c
Threshold
Mark Front theoreticalMark Tail theoretical
Mark Front simulationMark Tail simulation
(a) One single connection
0
10
20
30
40
50
60
70
80
0 5 10 15 20 25 30
Buf
fer
size
req
uire
men
t
c
Threshold
Mark Front theoreticalMark Tail theoretical
Mark Front simulationMark Tail simulation
(b) Two connections with differentRTTs
0
10
20
30
40
50
60
70
80
0 5 10 15 20 25 30
Buf
fer
size
req
uire
men
t
c
Threshold
Mark Front theoreticalMark Tail theoretical
Mark Front simulationMark Tail simulation
(c) Five connections with different RTTs
Figure 3: Buffer size requirement in various scenarios
close to 1, in our graphs, we draw thed�O Z\[ Y]��O,^�0�0 index:
d�O Z\[ Y]��O,^�0�0e�f�g� Z\[ Y]��O,^�0�0-L (12)
to better contrast the difference.
The operations of ECN depend on the threshold value/ .In our results, all three metrics are drawn for different val-ues of threshold.
6.3 Results
Figure 3 shows the buffer size requirement for mark-tailand mark-front strategies. The measured maximum queuelengths are shown with “h ” and “ i ”. The correspondinganalytical estimates from Theorem 2 and 3 are shown withdashed and solid lines. Figure 3(a) shows the buffer sizerequirement for one single connection with an RTT of 59ms. Figure 3(b) shows the requirement for two connec-tions with different RTTs. Figure 3(c) shows the require-ment for five connections with different RTTs. When theconnections have different RTTs, the analytical estimateis calculated from the smallest RTT.
From these results, we find that for connections with equalRTTs, the analytical estimate of buffer size requirement isaccurate. When threshold/ is small, the buffer size re-quirement is an upper bound, when/kjl��� , the upperbound is tight. For connections with different RTTs, theestimate given by the largest RTT is an upper bound, but isusually an overestimate. The estimate given by the small-est RTT is a closer approximation.
Figure 4 shows the link efficiency. Results for mark-frontstrategy are drawn with solid line, and results for mark-tail strategy are drawn with dashed line. In most cases,when the router buffer size is large enough, mark-frontand mark-tail have comparable link efficiency, but whenthe threshold is small, mark-front have slightly lower effi-ciency because congestion feedback is sent to the source
faster. For the same value of threshold, faster feedbacktranslates to more window reductions and longer linkidling.
When the router buffer size is small, as in Figure 4(c) andFigure 4(f), mark-front has better link efficiency. This isbecause mark-front sends congestion feedback to sourcefaster, so the source can reduce its window size soonerto avoid packet losses. Without spending time on the re-transmissions, mark-front strategy can improve the linkefficiency.
Figure 5 shows the unfairness. Again, results for mark-front strategy are drawn with solid line, and results formark-tail strategy are drawn with dashed line. In Fig-ure 5(a), the two connections have the same configuration.Which connection receives more packets than the other isnot deterministic, so the unfairness index seems random.However, in general, mark-front is fairer than mark-tail.
In Figure 5(b), the two connections are different: the firstconnection starts first, occupies the buffer room and locksout the second connection. Although they have the sametime span, the second connection receives fewer pack-ets than the first. Mark-front avoids this lock-out phe-nomenon and improves the fairness. In addition, as thethreshold increases, the unfairness index of mark-tail in-creases, but the mark-front remains roughly the same, re-gardless of the threshold. Results for five same connec-tions are shown in Figure 5(d).
Figure 5(c) shows the difference on connections with dif-ferent RTTs. With mark-tail strategy, the connections withsmall RTTs grow faster and therefore locked out the con-nections with large RTTs. Mark-front strategy avoids thelock-out problem and alleviate the discrimination againstconnections with large RTT. The difference of the twostrategies is obvious when the threshold is large. Resultsfor five connections with different RTTs are shown in Fig-ure 5(f).
98NASA/TM—2001-210904

0.82
0.84
0.86
0.88
0.9
0.92
0.94
0.96
0.98
1
0 5 10 15 20 25
Link
effi
cien
cym
Threshold
Mark FrontMark Tail
(a) One single connection
0.8
0.82
0.84
0.86
0.88
0.9
0.92
0.94
0.96
0.98
1
0 5 10 15 20 25
Link
effi
cien
cym
Threshold
Mark FrontMark Tail
(b) Two overlapping connections
0.82
0.84
0.86
0.88
0.9
0.92
0.94
0.96
0.98
1
0 5 10 15 20 25
Link
effi
cien
cym
Threshold
Mark FrontMark Tail
(c) Two same connections, limited buffer
0.86
0.88
0.9
0.92
0.94
0.96
0.98
1
0 5 10 15 20 25
Link
effi
cien
cym
Threshold
Mark FrontMark Tail
(d) Five connections with same RTT
0.5
0.55
0.6
0.65
0.7
0.75
0.8
0.85
0.9
0.95
1
0 5 10 15 20 25
Link
effi
cien
cym
Threshold
Mark FrontMark Tail
(e) Five connections with differentRTTs
0.86
0.88
0.9
0.92
0.94
0.96
0.98
1
0 5 10 15 20 25
Link
effi
cien
cym
Threshold
Mark FrontMark Tail
(f) Five same connections, limited buffer
Figure 4: Link efficiency in various scenarios
0
0.05
0.1
0.15
0.2
0.25
0.3
0.35
0.4
0.45
0.5
0 10 20 30 40 50 60 70
Unf
airn
ess
Threshold
Mark FrontMark Tail
(a) Two same connections
0
0.05
0.1
0.15
0.2
0.25
0.3
0.35
0.4
0.45
0.5
0 10 20 30 40 50 60 70
Unf
airn
ess
Threshold
Mark FrontMark Tail
(b) Two overlapping connections
0
0.05
0.1
0.15
0.2
0.25
0.3
0.35
0.4
0.45
0.5
0 10 20 30 40 50 60 70
Unf
airn
ess
Threshold
Mark FrontMark Tail
(c) Two connections with different RTTs
0
0.05
0.1
0.15
0.2
0.25
0.3
0.35
0.4
0.45
0.5
0 10 20 30 40 50 60 70
Unf
airn
ess
Threshold
Mark FrontMark Tail
(d) Five same connections
0
0.05
0.1
0.15
0.2
0.25
0.3
0.35
0.4
0.45
0.5
0 5 10 15 20 25
Unf
airn
ess
Threshold
Mark FrontMark Tail
(e) Five same connections, limitedbuffer
0
0.05
0.1
0.15
0.2
0.25
0.3
0.35
0.4
0.45
0.5
0 10 20 30 40 50 60 70
Unf
airn
ess
Threshold
Mark FrontMark Tail
(f) Five connections with different RTTs
Figure 5: Unfairness in various scenarios
99NASA/TM—2001-210904

Figure 5(e) shows the unfairness when the router buffersize is limited. In this scenario, the mark-tail strategymarks the incoming packet when the queue length exceedsthe threshold, and drops the incoming packet when thebuffer is full. The mark-front strategy, on the other hand,marks and drops the packets from the front of the queuewhen necessary. The results show mark-front strategy isfairer than mark-tail.
7 Conclusion
In this paper we study the mark-front strategy used inECN. Instead of marking the packet from the tail of thequeue, this strategy marks the packet in the front of thequeue and thus delivers faster congestion feedback to thesource. Our study reveals mark-front’s three advantagesover mark-tail policy. First, it reduces the buffer size re-quirement at the routers. Second, when the buffer size islimited, it reduces packet losses and improves the link effi-ciency. Third, it improves the fairness among old and newusers, and helps to alleviate TCP’s discrimination againstconnections with large round trip times.
With a simplified model, we analyze the buffer size re-quirement for both mark-front and mark-tail strategies.Link efficiency, fairness and more complicated scenar-ios are tested with simulations. The results show thatmark-front strategy has better performance than the cur-rent mark-tail policy.
References
[1] W. Stevens, TCP slow start, congestion avoidance,fast retransmit, and fast recovery algorithms,RFC2001, January 1997.
[2] R. Jain, A Timeout-Based Congestion ControlScheme for Window Flow-Controlled Networks,IEEE Journal on Selected Areas in Communications,Vol. SAC-4, No. 7, pp. 1162-1167, October 1986.
[3] S. Floyd, Connections with multiple congestiongateways in packet-switched networks: part 1:one-way traffic,Computer Communication Review,21(5), October 1991.
[4] T. V. Lakshman, U. Madhow, Performance analysisof window-based flow control using TCP/IP: effectof high bandwidth-delay products and random loss,IFIP Transactions C: Communication Systems, C-26, pp.135-149, 1994.
[5] M. Mathis, J. Semke, J. Mahdavi, T. Ott, The macro-scopic behavior of the TCP congestion avoidance al-gorithm,Computer Communication Review, volume27, number3, July 1997.
[6] T. Ott, J. Kemperman, and M. Mathis, The sta-tionary behavior of ideal TCP congestion avoid-ance, ftp://ftp.bellcore.com/pub/tjo/TCPwindow.ps,August 1996.
[7] J. Padhye, V. Firoiu, D. Towsley, J. Kurose, Model-ing TCP throughput: a simple model and its empir-ical validation,Computer Communication Review,28(4), pp. 303-314, 1998.
[8] K. Ramakrishnan and R. Jain, A binary feedbackscheme for congestion avoidance in computer net-works , ACM Transactions on Computer Systems,Vol. 8, No. 2, pp. 158-181, May 1990.
[9] K. Ramakrishnan and S. Floyd, A proposal to addExplicit Congestion Notification (ECN) to IP,RFC2481, January 1999.
[10] S. Floyd, TCP and explicit congestion notification,ACM Computer Communication Review, V. 24 N. 5,pp. 10-23, October 1994.
[11] UCB/LBNL/VINT Network Simulator - ns (version2), http://www-mash.CS.Berkeley.EDU/ns/.
[12] N. Yin and M. G. Hluchyj, Implication of droppingpackets from the front of a queue, 7-th ITC, Copen-hagen, Denmark, Oct 1990.
[13] T. V. Lakshman, A. Neidhardt and T. J. Ott, The dropfrom front strategy in TCP and in TCP over ATM,Infocom96, 1996.
[14] S. Floyd and V. Jacobson, Random early detec-tion gateways for congestion avoidance,IEEE/ACMTransactions on Networking, Vol. 1, No. 4, pp. 397-413, August 1993.
[15] S. Blake, D. Black, M. Carlson, E. Davies, Z. Wangand W. Weiss, An architecture for differentiated ser-vices,,RFC 2475, December 1998.
[16] B. Braden et al, Recommendations on Queue Man-agement and Congestion Avoidance in the Internet,RFC 2309, April 1998.
[17] R. Jain,The Art of Computer System PerformanceAnalysis, John Wiley and Sons Inc., 1991.
All our papers and ATM Forum contributions are availablethrough http://www.cis.ohio-state.edu/˜ jain/
100NASA/TM—2001-210904

Moh
amm
ed A
tiquz
zam
an, U
nive
rsity
of D
ayto
n,E
mai
l: at
iq@
iee
e.o
rg
QoS
for
Rea
l Tim
e A
pplic
atio
ns o
ver
Nex
t Gen
erat
ion
Dat
a N
etw
orks
Pro
ject
Sta
tus
Rep
ort:
Par
t 1
June
2, 2
000
http
://w
ww
.en
gr.u
dayt
on.e
du/fa
culty
/mat
iquz
z/P
res/
QoS
.pd
f
Uni
vers
ity o
f D
ayto
nM
oh
amm
ed A
tiq
uzz
aman
Jyo
tsn
a C
hit
riF
aru
qu
e A
ham
edH
ongj
unS
uH
aow
ei B
ai
Ohi
o S
tate
Uni
vers
ityR
aj J
ain
Muk
ul G
oyal
Bha
rani
Cha
dava
laA
rind
amP
aul
Chu
n Le
i Liu
Wei
Sun
Ari
anD
urre
si
NA
SA
Gle
nnW
ill Iv
anci
c
NASA/TM—2001-210904 101

Moh
amm
ed A
tiquz
zam
an, U
nive
rsity
of D
ayto
n,E
mai
l: at
iq@
iee
e.o
rg
Out
line
of T
alk
nP
rese
nt s
tate
of t
he I
nter
ent.
nQ
oS a
ppro
ache
s to
futu
re d
ata
netw
orks
. n
Res
earc
h Is
sues
.n
Pro
gres
s to
dat
e:�
Task
1:
DS
ove
r A
TM�
Task
2:
IS o
ver
DS
�Ta
sk 3
: A
TN�
Task
4:
Sat
ellit
e ne
twor
ks�
Task
5:
MP
LS
nC
oncl
usio
ns.
NASA/TM—2001-210904 102

Moh
amm
ed A
tiquz
zam
an, U
nive
rsity
of D
ayto
n,E
mai
l: at
iq@
iee
e.o
rgCur
rent
Inte
rnet
nTC
P/IP
glu
es to
geth
er a
ll th
e co
mpu
ters
in th
e In
tern
et.
nTC
P/IP
was
des
igne
d fo
r te
rres
tria
l net
wor
ks.
nTC
P/IP
doe
s no
t�
offe
r Q
oS t
o re
al t
ime
appl
icat
ions
, or
�pe
rfor
m w
ell i
n lo
ng d
elay
ban
dwid
th n
etw
orks
.
NASA/TM—2001-210904 103

Moh
amm
ed A
tiquz
zam
an, U
nive
rsity
of D
ayto
n,E
mai
l: at
iq@
iee
e.o
rg
Eff
orts
to p
rovi
de Q
oS in
Inte
rnet
nIn
tegr
ated
Ser
vice
s (IS
)n
Diff
eren
tiate
d S
ervi
ces
(Diff
Ser
v)n
Exp
licit
Con
gest
ion
Not
ifica
tion
(EC
N)
nM
ultip
roto
col L
abel
Sw
itchi
ng (
MP
LS)
nA
sync
hron
ous
Tran
sfer
Mod
e (A
TM)
NASA/TM—2001-210904 104

Moh
amm
ed A
tiquz
zam
an, U
nive
rsity
of D
ayto
n,E
mai
l: at
iq@
iee
e.o
rg
Inte
grat
ed S
ervi
ces
nR
SV
P to
res
erve
res
ourc
es d
urin
g co
nnec
tion
setu
p.n
End
-to
-end
QoS
gua
rant
ees.
nA
rou
ter
has
to k
eep
info
rmat
ion
abou
t all
conn
ectio
ns
pass
ing
thro
ugh
the
rout
er.
nG
ives
ris
e to
sca
labi
lity
prob
lem
in th
e co
re r
oute
rs.
NASA/TM—2001-210904 105

Moh
amm
ed A
tiquz
zam
an, U
nive
rsity
of D
ayto
n,E
mai
l: at
iq@
iee
e.o
rgRS
VP
Sig
nalin
g
Rou
ter1
Rou
ter1
Rou
ter2
Rou
ter2
Send
erR
ecei
ver
PA
TH
mes
sage
RE
SV m
essa
ge
DA
TA
NASA/TM—2001-210904 106

Moh
amm
ed A
tiquz
zam
an, U
nive
rsity
of D
ayto
n,E
mai
l: at
iq@
iee
e.o
rgRS
VP
Sig
nalin
g
nR
eser
ves
a po
rtio
n of
link
ban
dwid
th in
eac
h ro
uter
nTh
e se
nder
sen
ds a
PA
TH m
essa
ge w
ith r
esou
rce
requ
irem
ents
for
a f
low
. n
Rec
eive
r re
spon
ds w
ith a
RE
SV
mes
sage
nE
ach
rout
er p
roce
sses
the
RE
SV
to r
eser
ve th
e re
quir
ed r
esou
rces
req
uest
ed b
y th
e se
nder
. n
Rou
ters
can
mod
ify th
e Q
oS p
aram
eter
s of
the
RE
SV
m
essa
ge if
eno
ugh
reso
urce
s ar
e n
ot a
vaila
ble
to m
eet
the
requ
irem
ents
.n
Eac
h ro
uter
in th
e en
tire
path
con
firm
s th
e en
d-t
o-e
nd
rese
rvat
ion
for
the
flow
.
NASA/TM—2001-210904 107

Moh
amm
ed A
tiquz
zam
an, U
nive
rsity
of D
ayto
n,E
mai
l: at
iq@
iee
e.o
rg
IS S
ervi
ce C
lass
es
nG
uara
ntee
d Lo
ad S
ervi
ce�
Lo
w e
nd
-to
-end
del
ay, J
itter
, Los
s.�
Hig
hest
pri
ority
ser
vice
.
nC
ontr
olle
d L
oad
Ser
vice
�N
etw
ork
shou
ld f
orw
ard
the
pack
ets
with
que
uing
del
ay
not
grea
ter
than
tha
t ca
used
by
the
traf
fic’s
ow
n bu
rstin
ess
(RFC
247
4).
�P
erfo
rman
ce s
imila
r to
tha
t of
an
unlo
aded
net
wor
k.�
Traf
fic s
peci
ficat
ions
from
the
Tspe
c.
nB
est E
ffor
t
NASA/TM—2001-210904 108

Moh
amm
ed A
tiquz
zam
an, U
nive
rsity
of D
ayto
n,E
mai
l: at
iq@
iee
e.o
rg
Diff
eren
tiate
d S
ervi
ces
nS
imila
r tr
affic
are
gro
uped
into
cla
sses
.n
Res
ourc
es r
eser
ved
for
clas
ses.
nQ
oS p
rovi
ded
to c
lass
es.
�Q
oS t
o in
divi
dual
con
nect
ions
is a
n op
en r
esea
rch
issu
e.
nQ
oS m
aint
aine
d by
:�
Cla
ssifi
catio
n�
Traf
fic p
olic
ing
úM
eter
ing,
dro
ppin
g, t
aggi
ng�
Traf
fic s
hapi
ng
nP
er H
op B
ehav
ior
(PH
B)
�S
peci
fies
QoS
rec
eive
d by
pac
kets
i.e.
how
pac
kets
are
tr
eate
d by
the
rou
ters
.
NASA/TM—2001-210904 109

Moh
amm
ed A
tiquz
zam
an, U
nive
rsity
of D
ayto
n,E
mai
l: at
iq@
iee
e.o
rg
Asy
nchr
onou
s Tr
ansf
er M
ode
nS
tron
g Q
oS g
uara
ntee
s; s
uita
ble
for
real
tim
e ap
plic
atio
ns.
nH
igh
cost
pro
hibi
ts u
se a
t the
edg
e ne
twor
k or
to th
e de
skto
p.n
Cur
rent
ly u
sed
at th
e co
re o
f the
Inte
rnet
.
NASA/TM—2001-210904 110

Moh
amm
ed A
tiquz
zam
an, U
nive
rsity
of D
ayto
n,E
mai
l: at
iq@
iee
e.o
rg
Nex
t Gen
erat
ion
Inte
rnet
nR
oute
rs a
t the
edg
e ne
twor
k w
ill n
ot n
eed
to c
arry
too
man
y co
nnec
tions
�IS
can
be
used
at
the
edge
net
wor
k.
nC
ore
netw
ork
need
s to
car
ry lo
t of
con
nect
ions
. �
Com
bina
tion
of D
S, A
TM a
nd M
PLS
at
the
core
.
nS
atel
lite/
Wir
eles
s lin
ks
�R
emot
e co
nnec
tivity
and
mob
ility
.
NASA/TM—2001-210904 111

Moh
amm
ed A
tiquz
zam
an, U
nive
rsity
of D
ayto
n,E
mai
l: at
iq@
iee
e.o
rgRes
earc
h Is
sues
nS
ervi
ce m
appi
ng b
etw
een
netw
orks
.n
Loss
and
del
ay g
uara
ntee
s.n
Inte
rope
rabi
lity
amon
g ed
ge a
nd c
ore
tech
nolo
gies
.n
Inte
rope
rabi
lity
with
Aer
onau
tical
Tel
ecom
mun
icat
ions
N
etw
ork
(ATN
).n
Ope
ratio
n in
sat
ellit
e en
viro
nmen
t hav
ing
high
del
ay
and
loss
.
NASA/TM—2001-210904 112

Moh
amm
ed A
tiquz
zam
an, U
nive
rsity
of D
ayto
n,E
mai
l: at
iq@
iee
e.o
rg
Task
1
Prio
ritiz
ed E
arly
P
acke
t Dis
card
NASA/TM—2001-210904 113

Moh
amm
ed A
tiquz
zam
an, U
nive
rsity
of D
ayto
n,E
mai
l: at
iq@
iee
e.o
rg
Asy
nchr
onou
s Tr
ansf
er M
ode
(ATM
)
nS
ervi
ce C
lass
es�
Con
stan
t B
its R
ate
(CB
R)
�A
vaila
ble
Bit
Rat
e (A
BR
)�
Uns
peci
fied
Bit
Rat
e (U
BR
)
nC
LP in
cel
l hea
der
�D
eter
min
es lo
ss p
rior
ity o
f pac
kets
NASA/TM—2001-210904 114

Moh
amm
ed A
tiquz
zam
an, U
nive
rsity
of D
ayto
n,E
mai
l: at
iq@
iee
e.o
rg
Diff
eren
tiate
d S
ervi
ces
Dat
a P
acke
t
Voi
ce P
acke
t
nS
ervi
ce C
lass
es�
Pre
miu
m S
ervi
ce:
emul
ates
leas
ed li
ne�
Ass
ured
Ser
vice
�B
est
Eff
ort
Ser
vice
nV
ario
us le
vels
of d
rop
prec
eden
ce.
�N
eed
to b
e m
appe
d to
ATM
whe
n ru
nnin
g D
S o
ver
ATM
.�
Cou
ld b
e po
ssib
le m
appe
d to
the
CLP
bit
of A
TM c
ell
head
er.
NASA/TM—2001-210904 115

Moh
amm
ed A
tiquz
zam
an, U
nive
rsity
of D
ayto
n,E
mai
l: at
iq@
iee
e.o
rg
DS
ove
r A
TM
nP
ossi
ble
Ser
vice
Map
ping
s�
Pre
miu
m S
ervi
ce à
ATM
CB
R s
ervi
ce.
�A
ssur
ed S
ervi
ce à
ATM
UB
R s
ervi
ce w
ith C
LP=0
�B
est E
ffor
t à
ATM
UB
R s
ervi
ce w
ith C
LP=1
nD
S p
acke
ts a
re b
roke
n do
wn
into
cel
ls a
t the
DS
-ATM
ga
tew
ay�
Dro
p pr
eced
ence
map
ped
to C
LP b
it
nB
uffe
r M
anag
emen
t at
ATM
sw
itche
s�
Par
tial P
acke
t Dis
card
(PP
D)
�E
arly
Pac
ket
Dis
card
(E
PD
)
NASA/TM—2001-210904 116

Moh
amm
ed A
tiquz
zam
an, U
nive
rsity
of D
ayto
n,E
mai
l: at
iq@
iee
e.o
rg
Pri
oriti
zed
EP
D
nD
S s
ervi
ce c
lass
es c
an u
se th
e C
LP b
it of
ATM
cel
l he
ader
to p
rovi
de s
ervi
ce d
iffer
entia
tion.
nE
PD
doe
s no
t con
side
r th
e pr
iori
ty o
f cel
ls.
nP
rior
itize
d E
PD
can
be
used
to p
rovi
de s
ervi
ce
disc
rim
inat
ion.
nTw
o th
resh
olds
are
use
d to
dro
p ce
lls d
epen
ding
on
the
CLP
bit.
NASA/TM—2001-210904 117

Moh
amm
ed A
tiquz
zam
an, U
nive
rsity
of D
ayto
n,E
mai
l: at
iq@
iee
e.o
rg
Buf
fer
Man
agem
ent S
chem
es
nE
PD
nP
EP
D
0N
µλ
TH
TLT
0N
µλ
•QL
< T
Acc
ept a
ll pa
cket
s.
•T ≤
QL
< N
Dis
card
all
new
inco
min
g pa
cket
s.
•QL
≥N •D
isca
rd a
ll.
•QL
<LT
Acc
ept a
ll pa
cket
s.
•LT
≤Q
L <
HT
Dis
card
all
new
low
prio
rity
pack
ets.
•HT
≤Q
L <
N
Dis
card
all
new
pac
kets
QL
≥N •D
isca
rd a
ll pa
cket
s
NASA/TM—2001-210904 118
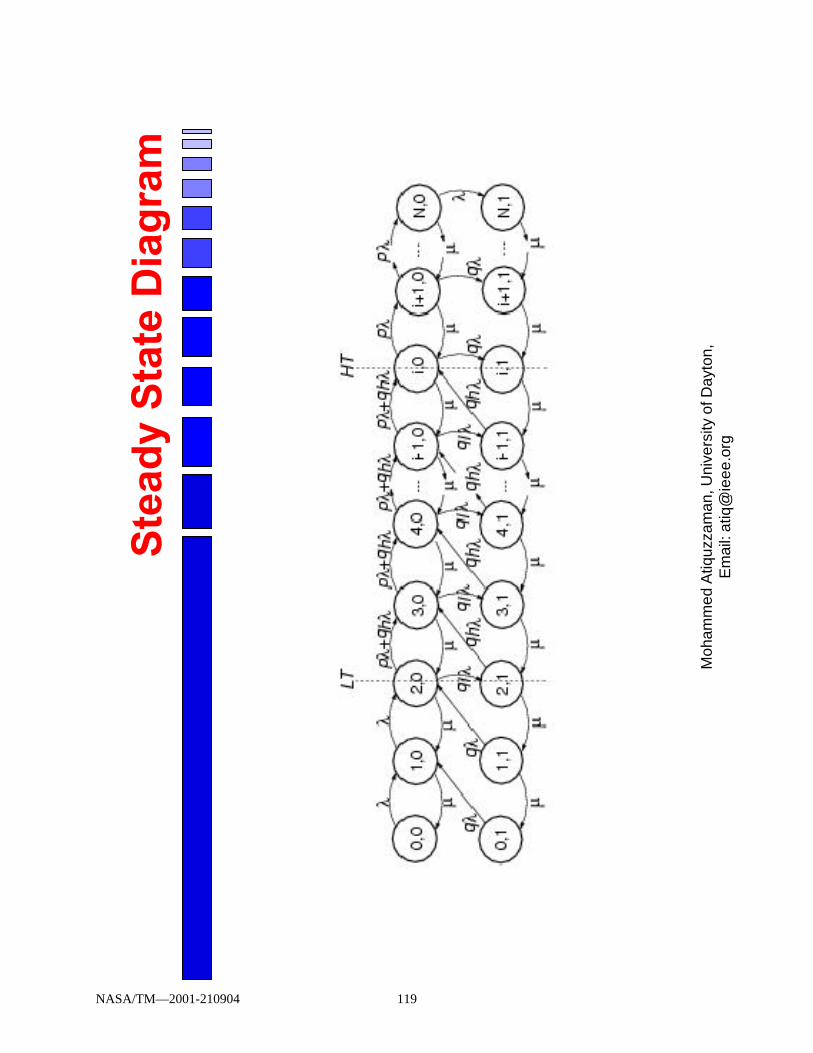
Moh
amm
ed A
tiquz
zam
an, U
nive
rsity
of D
ayto
n,E
mai
l: at
iq@
iee
e.o
rg
Ste
ady
Sta
te D
iagr
am
NASA/TM—2001-210904 119

Moh
amm
ed A
tiquz
zam
an, U
nive
rsity
of D
ayto
n,E
mai
l: at
iq@
iee
e.o
rg
Ste
ady
Sta
te E
quat
ions
∑ =
+
+
+−
+−
−+
−
−+
−
=+
<<
=+
<≤
+−
=+
<≤
+==
=+
<<
+=
+≤
<+
++
=+
≤≤
++
=+
==
N ii
i
ii
ii
i
ii
i
NN
NN
ii
i
ii
ii
ii
ii P
P
LTi
PP
q
HT
iLT
PP
hq
Pqh
Ni
HT
PP
qP
PP
Pp
P
Ni
HT
PP
pP
HT
iLT
Pqh
PP
qhp
PLT
iP
qP
PP
PP
q
PP 0
1,0,
1,11,
1,10,
1,
1,10,
1,
0,1,
0,10,
0,10,1
0,
1,10,1
0,10,
1,10,1
0,10,
1,11,0
0,10,0
1)
(
0)
(
)1(
)(
)(
)(
)(
)(
1)
(
µλ
µµ
λλ
µ
µλ
µλ
µλ
µλ
µλ
µλ
λµ
λλ
µλ
λµ
λµ
λµ
λµ
λ
NASA/TM—2001-210904 120

Moh
amm
ed A
tiquz
zam
an, U
nive
rsity
of D
ayto
n,E
mai
l: at
iq@
iee
e.o
rg
Goo
dput
∑∞ ==
=
∑∞ ==
==
=
1n
)1n,
nP(
1n
)1,1
n,nP
(
UW
UV
W
hG
NASA/TM—2001-210904 121

Moh
amm
ed A
tiquz
zam
an, U
nive
rsity
of D
ayto
n,E
mai
l: at
iq@
iee
e.o
rgQu
eue
Occ
up
ancy
Sim
ulat
ion:
N=1
20, L
T=6
0, H
T=80
, h=0
.5, q
=1/6
.
020
4060
801
00
120
0
0.0
1
0.0
2
0.0
3
0.0
4
0.0
5
0.0
6
0.0
7
Queue le
ngth
ProbabilityS
imu
latio
n,lo
ad
1.0
Mo
de
l,lo
ad
1.0
Sim
ula
tion
,loa
d 1
.4M
od
el,l
oa
d 1
.4S
imu
latio
n,lo
ad
1.8
Mo
de
l,lo
ad
1.8
Sim
ula
tion
,loa
d 2
.2M
od
el,l
oa
d 2
.2
NASA/TM—2001-210904 122

Moh
amm
ed A
tiquz
zam
an, U
nive
rsity
of D
ayto
n,E
mai
l: at
iq@
iee
e.o
rg
Go
od
pu
tver
sus
load
for
h=0
.5
0.8
11
.21
.41
.61
.82
2.2
0
0.1
0.2
0.3
0.4
0.5
0.6
0.7
0.8
0.91
Load
Goodput
G f
or s
imul
atio
nG
for
mod
elG
H f
or s
imul
atio
nG
H f
or m
odel
GL
for
sim
ulat
ion
GL
for
mod
el
Sim
ulat
ion:
N=1
20, L
T=60
, HT=
80, q
=1/6
.
NASA/TM—2001-210904 123

Moh
amm
ed A
tiquz
zam
an, U
nive
rsity
of D
ayto
n,E
mai
l: at
iq@
iee
e.o
rg
Go
od
pu
tver
sus
load
for
h=0
.2, 0
.5, 0
.8
0.8
11.
21
.41.
61.
82
2.2
0
0.1
0.2
0.3
0.4
0.5
0.6
0.7
0.8
0.91
Load
Googput
G f
or 0
.2G
for
0.5
G f
or 0
.8G
H f
or 0
.2G
H f
or 0
.5G
H f
or 0
.8G
L fo
r 0.
2G
L fo
r 0.
5G
L fo
r 0.
8
Sim
ulat
ion:
N=1
20, L
T=60
, HT=
80, q
=1/6
.
NASA/TM—2001-210904 124

Moh
amm
ed A
tiquz
zam
an, U
nive
rsity
of D
ayto
n,E
mai
l: at
iq@
iee
e.o
rg
Go
od
pu
tfo
r h
igh
pri
ori
ty v
s. H
T
6070
8090
100
110
120
0.4
0.5
0.6
0.7
0.8
0.91
Hig
h T
hres
hold
,HT
Googput for high priority
GH
for
h=
0.2
GH
for
h=
0.4
GH
for
h=
0.6
GH
for
h=
0.7
GH
for
h=
0.8
GH
for
h=
1.0
Sim
ulat
ion:
LT=
60, q
=1/6
NASA/TM—2001-210904 125

Moh
amm
ed A
tiquz
zam
an, U
nive
rsity
of D
ayto
n,E
mai
l: at
iq@
iee
e.o
rg
Go
od
pu
tof h
igh
pri
ori
ty v
s. h
00
.10
.20.
30.
40.
50
.60
.70.
80.
91
0.4
0.5
0.6
0.7
0.8
0.91
Pro
babi
lity
of h
igh
prio
rity
mes
sage
s,h
Googput for high priority
GH
for
load
=1.
2 H
T=
80G
H f
or lo
ad=
1.6
HT
=80
GH
for
load
=2.
0 H
T=
80G
H fo
r lo
ad=
1.6
HT
=10
0G
H fo
r lo
ad=
1.6
HT
=12
0
Sim
ulat
ion:
LT=
60
NASA/TM—2001-210904 126

Moh
amm
ed A
tiquz
zam
an, U
nive
rsity
of D
ayto
n,E
mai
l: at
iq@
iee
e.o
rg
Go
od
pu
tfo
r h
igh
pri
ori
ty v
ersu
s L
T
102
030
40
5060
7080
0.6
0.6
5
0.7
0.7
5
0.8
0.8
5
0.9
0.9
51
Low
Thr
esho
ld,
LT
Googput for high priority
GH
for
h=
0.2
GH
for
h=
0.4
GH
for
h=
0.6
GH
for
h=
0.7
GH
for
h=
0.8
GH
for
h=
1.0
Sim
ulat
ion:
N=1
20, H
T=80
, loa
d=1.
6, q
=1/6
.
NASA/TM—2001-210904 127

Moh
amm
ed A
tiquz
zam
an, U
nive
rsity
of D
ayto
n,E
mai
l: at
iq@
iee
e.o
rg
OP
NE
T S
imul
atio
n C
onfig
urat
ion
PE
PD
app
lied
NASA/TM—2001-210904 128

Moh
amm
ed A
tiquz
zam
an, U
nive
rsity
of D
ayto
n,E
mai
l: at
iq@
iee
e.o
rg
DS
-ATM
Pro
toco
l Sta
ck
nA
AL
Laye
r m
arks
the
End
of
Pac
ket.
nA
TM_l
ayer
cha
nges
the
CLP
bit
depe
ndin
g on
the
pack
et o
f th
e D
S s
ervi
ce.
NASA/TM—2001-210904 129

Moh
amm
ed A
tiquz
zam
an, U
nive
rsity
of D
ayto
n,E
mai
l: at
iq@
iee
e.o
rg
ATM
Sw
itch
Nod
e
nS
uppo
rt s
ervi
ce
diff
eren
tiatio
n in
the
ATM
sw
itch
buff
er.
nC
hang
e th
e bu
ffer
m
anag
emen
t sch
eme
in th
e A
TM_s
witc
h pr
oces
s to
P
rior
itize
d E
PD
.
NASA/TM—2001-210904 130

Moh
amm
ed A
tiquz
zam
an, U
nive
rsity
of D
ayto
n,E
mai
l: at
iq@
iee
e.o
rg
ATM
_Sw
itch
Pro
cess
Impl
emen
ts th
e P
EP
D b
uffe
r m
anag
emen
t to
supp
ort s
ervi
ce d
iffer
entia
tion.
NASA/TM—2001-210904 131

Moh
amm
ed A
tiquz
zam
an, U
nive
rsity
of D
ayto
n,E
mai
l: at
iq@
iee
e.o
rg
Task
2
Map
ping
of
IS o
ver
DS
NASA/TM—2001-210904 132

Moh
amm
ed A
tiquz
zam
an, U
nive
rsity
of D
ayto
n,E
mai
l: at
iq@
iee
e.o
rg
Traf
fic e
nter
ing
DS
dom
ain
Pack
et o
f siz
e P
ente
ring
DS
dom
ain
at b
ound
ary
node
Che
ck fo
r DS
fiel
d of
th
e pa
cket
AF/
EF
Che
ckin
g fo
r buf
fer
spac
e of
Q2
Che
ckin
g fo
r bu
ffer
sp
ace
of Q
1
EF
AF
I
nser
t int
o th
e E
F qu
eue
Dis
card
the
EF
inco
min
g pa
cket
Inse
rt in
to A
F qu
eue
If b
uffe
r oc
cupa
ncof
Dis
card
the
AF
inco
min
g pa
cket
Pu
sh e
noug
h E
F pa
cket
s T
o m
ake
spac
e fo
r A
F Pa
c
No
No
Yes
Yes
Yes
In/O
ut-o
f-pr
ofile
Yes
Sh
apin
g
No
NASA/TM—2001-210904 133

Moh
amm
ed A
tiquz
zam
an, U
nive
rsity
of D
ayto
n,E
mai
l: at
iq@
iee
e.o
rg
Diff
eren
tiate
d S
ervi
ces
nC
lass
ifica
tion:
Bas
ed o
n IP
hea
der
field
cla
ssifi
es in
to
BA
to r
ecei
ve p
artic
ular
per
hop
beh
avio
r (P
HB
)n
Met
erin
g: M
easu
ring
the
traf
fic a
gain
st to
ken
buck
et to
ch
eck
for
reso
urce
con
sum
ptio
nn
Sha
ping
: Tre
atm
ent o
f out
-of-
prof
ile tr
affic
by
plac
ing
it in
a b
uffe
r.n
Dro
pp
ing:
No
n-c
onfo
rman
t tra
ffic
can
be
drop
ped
for
cong
estio
n av
oida
nce
nA
dmis
sion
Con
trol
: Lim
iting
the
amou
nt o
f tra
ffic
ac
cord
ing
to th
e re
sour
ces
in th
e D
S d
omai
n.�
Impl
icit
Adm
issi
on C
ontr
ol:
Per
form
ed a
t ea
ch r
oute
r�
Exp
licit
Adm
issi
on C
ontr
ol :
Dyn
amic
res
ourc
e al
loca
tion
by a
cen
tral
ized
ban
dwid
th b
roke
r
NASA/TM—2001-210904 134

Moh
amm
ed A
tiquz
zam
an, U
nive
rsity
of D
ayto
n,E
mai
l: at
iq@
iee
e.o
rg
Var
ious
PH
B’s
nE
xped
ited
Forw
ardi
ng(E
F P
HB
)n
Ass
ured
For
war
ding
(AF
PH
B)
nB
est
Eff
ort
(Def
ault)
NASA/TM—2001-210904 135

Que
ue Im
plem
enta
tion
(RE
D)
Inco
min
g
Min
imum
Thr
esho
ld
Max
imum
T
hres
hold
RE
D R
egio
n
Pack
et D
rop
Prob
abili
ty
Que
ue S
ize
NASA/TM—2001-210904 136

Moh
amm
ed A
tiquz
zam
an, U
nive
rsity
of D
ayto
n,E
mai
l: at
iq@
iee
e.o
rg
QoS
Spe
cific
atio
ns
nB
andw
idth
: n
Late
ncy:
n
Jitt
er:
nLo
ss:
NASA/TM—2001-210904 137

Moh
amm
ed A
tiquz
zam
an, U
nive
rsity
of D
ayto
n,E
mai
l: at
iq@
iee
e.o
rg
Ser
vice
Map
ping
from
IS-D
S
nP
rovi
de d
iffer
ent l
evel
s of
ser
vice
diff
eren
tiatio
n.n
Pro
vide
QoS
to m
ultim
edia
and
mul
ticas
t app
licat
ions
.n
Sca
labi
lity
in te
rms
of r
esou
rce
allo
catio
n.n
Ther
e is
no
over
hea
d du
e to
per
flow
sta
te
mai
nten
ance
at
each
rou
ter.
nFo
rwar
ding
at
each
rou
ter
acco
rdin
g to
the
DS
CP
cod
e.n
PH
B’s
alo
ng th
e pa
th p
rovi
de a
sch
edul
ing
resu
lt ap
prox
imat
ing
the
QoS
req
uire
men
ts a
nd r
esul
ts in
ISIn
tegr
ated
Serv
ice
Dif
fere
ntia
ted
Serv
ice
Gua
rant
eed
Loa
dE
xped
ite F
orw
ardi
ng
Con
trol
led
Loa
dA
ssur
ed F
orw
ardi
ng
Bes
t eff
ort
Def
ault
best
eff
ort
NASA/TM—2001-210904 138

Moh
amm
ed A
tiquz
zam
an, U
nive
rsity
of D
ayto
n,E
mai
l: at
iq@
iee
e.o
rgDS
func
tiona
lity
nP
er H
op b
ehav
ior
(PH
B)
nB
ehav
ior
Agg
rega
te (
BA
)n
Diff
eren
tiate
d S
ervi
ces
Cod
e P
oint
(DS
CP
)
12
34
56
78
DS
field
CU
TO
S B
yte
NASA/TM—2001-210904 139

Moh
amm
ed A
tiquz
zam
an, U
nive
rsity
of D
ayto
n,E
mai
l: at
iq@
iee
e.o
rg
Gua
rant
eed
load
-E
F P
HB
nG
uara
ntee
d tr
affic
per
form
ance
can
be
met
eff
ectiv
ely
usin
g th
e E
F P
HB
with
pro
per
polic
ing
and
shap
ing
func
tions
.n
Sha
ping
Del
ay
nQ
ueui
ng D
elay
nP
acke
ts in
the
Sch
edul
er
NASA/TM—2001-210904 140

Moh
amm
ed A
tiquz
zam
an, U
nive
rsity
of D
ayto
n,E
mai
l: at
iq@
iee
e.o
rg
Con
trol
led
Load
-A
F P
HB
nC
lass
ified
into
del
ay c
lass
es b
ased
on
the
B/R
rat
io o
f Ts
pec
for
each
del
ay c
lass
; A
ggre
gate
Tsp
ec is
con
stru
cted
for
all
the
adm
itted
tra
ffic
.n
For
each
del
ay c
lass
, pol
ice
the
traf
fic a
gain
st a
tok
en b
ucke
t de
rive
d ab
ove.
nS
ize
of th
e qu
eue
is s
et to
lim
it th
e qu
euin
g d
elay
of A
F re
quir
emen
t.n
RIO
dro
ppin
g pa
ram
eter
s ar
e se
t ac
cord
ing
to t
he d
rop
prec
eden
ce o
f th
e A
F cl
ass.
nA
F in
stan
ce s
ervi
ce r
ate
is s
et t
o ba
ndw
idth
suf
ficie
nt
enou
gh t
o m
eet
the
dela
y an
d lo
ss r
equi
rem
ents
of
the
CL
traf
fic.
nB
andw
idth
dis
trib
uted
bet
wee
n A
F an
d B
E t
o pr
even
t th
e B
F fr
om s
tarv
atio
n.n
Sch
edul
ing
done
with
WFQ
(Wei
ghte
d Fa
ir Q
ueui
ng) o
r W
RR
(W
eigh
ted
Rou
nd R
obin
)
NASA/TM—2001-210904 141

Moh
amm
ed A
tiquz
zam
an, U
nive
rsity
of D
ayto
n,E
mai
l: at
iq@
iee
e.o
rg
Traf
fic C
ondi
tioni
ng a
t DS
B
ound
ary
BA
C
lass
ifier
Met
erM
arke
r
Dro
pper
Sha
per
Met
erM
arke
r
Dro
pper
Mar
ker
S c h e d u l e r
BE
Que
ue-R
ED
AF
Que
ue-R
IO
EF
Que
ue-P
Q
Out
put
Lin
kS
hape
r
Sha
per
Met
er
Dro
pper
NASA/TM—2001-210904 142

Moh
amm
ed A
tiquz
zam
an, U
nive
rsity
of D
ayto
n,E
mai
l: at
iq@
iee
e.o
rg
Map
ping
Tab
le fo
r IS
-to-
DS
Flo
w Id
T S
pec
Par
amet
ers
1R
= 4
00P
= 5
00B
= 7
002
R =
450
P =
550
B =
750
3R
= 5
00P
= 6
00B
= 8
004
R =
550
P =
650
B =
850
5R
= 6
00P
= 7
00B
= 9
006
R =
650
P =
750
B =
950
7R
= 7
00P
= 8
00B
= 1
000
8R
= 7
50P
= 8
50B
= 1
050
9R
= 8
00P
= 9
00B
= 1
100
10
R =
850
P =
950
B =
115
0
PH
BD
SC
P
AF
11
OO
1O1O
AF
32
O11
1OO
AF
41
1OO
O1O
EFO
OO
1OO
NASA/TM—2001-210904 143

Moh
amm
ed A
tiquz
zam
an, U
nive
rsity
of D
ayto
n,E
mai
l: at
iq@
iee
e.o
rg
Map
ping
of I
S to
DS
nTs
pec
para
met
ers
indi
catin
g re
sour
ce r
eser
vatio
n ta
ken
from
RS
VP
sig
nalin
g.n
Tabl
e en
try
cont
ains
Tsp
ec p
aram
eter
s, fl
ow ID
s, P
HB
gr
oups
and
DS
CP
val
ues.
nM
easu
res
actu
al tr
affic
flow
rat
e ag
ains
t a to
ken
buck
et
acco
rdin
g to
the
initi
al s
tore
d ta
ble
entr
y.n
If th
e tr
affic
is in
-pro
file
with
the
requ
este
d re
serv
atio
n,
it cl
assi
fies
the
pack
et a
nd m
arks
it w
ith th
e av
aila
ble
DS
CP
, whi
ch c
an a
ppro
xim
atel
y as
sure
the
requ
este
d Q
oS.
nTh
e ou
t-of
pro
file
traf
fic is
sto
red
in a
buf
fer
and
shap
ed to
be
in c
onfo
rman
ce w
ith th
e re
ques
ted
traf
fic
prof
ile.
NASA/TM—2001-210904 144

Moh
amm
ed A
tiquz
zam
an, U
nive
rsity
of D
ayto
n,E
mai
l: at
iq@
iee
e.o
rg
Map
ping
of I
S to
DS
(con
td.)
nP
acke
ts a
re f
orw
arde
d in
the
DS
dom
ain
acco
rdin
g to
th
e D
SC
P v
alue
and
the
PH
B g
roup
.n
The
forw
ardi
ng tr
eatm
ent i
s ba
sica
lly c
once
rned
with
th
e qu
eue
man
agem
ent p
olic
y an
d th
e pr
iori
ty o
f ba
ndw
idth
allo
catio
n; th
ese
ensu
re th
e re
quir
ed
min
imum
que
uing
del
ay, l
ow ji
tter
and
max
imum
th
roug
hput
.n
Dep
endi
ng o
n th
e im
plem
enta
tions
of t
heP
HB
’sin
side
th
e ne
twor
k, q
ueue
man
agem
ent c
ould
be
RE
D, W
RE
D,
PQ
, WFQ
.
NASA/TM—2001-210904 145

Moh
amm
ed A
tiquz
zam
an, U
nive
rsity
of D
ayto
n,E
mai
l: at
iq@
iee
e.o
rg
IS-D
S S
imul
atio
n C
onfig
urat
ion
Rou
ter1
Rou
ter2
EF
Sou
rces
1 -
5
AF
Sou
rces
6 -
12
BE
Sou
rces
13
-2
0
EF
Sin
ks
AF
Sin
ks
BE
Sin
ks
NASA/TM—2001-210904 146

Moh
amm
ed A
tiquz
zam
an, U
nive
rsity
of D
ayto
n,E
mai
l: at
iq@
iee
e.o
rg
Task
3
Inte
rope
rabi
lity
with
A
eron
autic
al
Tel
ecom
mun
icat
ions
N
etw
orks
(A
TN
)
NASA/TM—2001-210904 147

Moh
amm
ed A
tiquz
zam
an, U
nive
rsity
of D
ayto
n,E
mai
l: at
iq@
iee
e.o
rgOve
rvie
w o
f ATN
nA
eron
autic
al T
elec
omm
unic
atio
ns N
etw
ork.
nS
uppo
rtin
g da
ta li
nk b
ased
ATC
app
licat
ion
& A
OC
.n
Inte
grat
ing
Air
/Gro
und
& G
roun
d/G
roun
d da
ta
com
mun
icat
ions
net
wor
k in
to a
glo
bal i
nter
net s
ervi
ng
ATC
& A
OC
.n
Intr
oduc
ing
a ne
w p
arad
igm
of A
TC b
ased
on
data
link
ra
ther
tha
n vo
ice
com
mun
icat
ions
.n
Ope
ratin
g in
a d
iffer
ent e
nvir
onm
ent w
ith d
iffer
ent d
ata
com
mun
icat
ion
serv
ice
prov
ider
.n
Sup
port
ing
the
inte
rcon
nect
ion
ofE
ss&
Iss
usin
g a
vari
ety
ofsu
bnet
wor
kty
pes.
NASA/TM—2001-210904 148

Moh
amm
ed A
tiquz
zam
an, U
nive
rsity
of D
ayto
n,E
mai
l: at
iq@
iee
e.o
rgPur
pose
of A
TN
nU
sing
the
exis
ting
infr
astr
uctu
re.
nH
igh
avai
labi
lity.
nM
obile
Com
mun
icat
ions
.n
Pri
oriti
zed
end
-to
-end
res
ourc
e m
anag
emen
t.n
Sca
labi
lity.
nP
olic
y ba
sed
rout
ing.
nFu
ture
pro
ofin
g
NASA/TM—2001-210904 149

Moh
amm
ed A
tiquz
zam
an, U
nive
rsity
of D
ayto
n,E
mai
l: at
iq@
iee
e.o
rg
QoS
of A
TN
nP
rior
ityn
Tran
sit D
elay
nE
rror
Pro
babi
lity
nC
ost
nS
ecur
ityn
Rel
iabi
lity
NASA/TM—2001-210904 150

Moh
amm
ed A
tiquz
zam
an, U
nive
rsity
of D
ayto
n,E
mai
l: at
iq@
iee
e.o
rg
Mod
el o
f Tra
nspo
rt L
ayer
NASA/TM—2001-210904 151

Moh
amm
ed A
tiquz
zam
an, U
nive
rsity
of D
ayto
n,E
mai
l: at
iq@
iee
e.o
rg
Str
uctu
re o
f TP
DU
NASA/TM—2001-210904 152

Moh
amm
ed A
tiquz
zam
an, U
nive
rsity
of D
ayto
n,E
mai
l: at
iq@
iee
e.o
rg
Var
iabl
e Fi
elds
of T
PD
U h
eade
r
NASA/TM—2001-210904 153

Moh
amm
ed A
tiquz
zam
an, U
nive
rsity
of D
ayto
n,
Com
pari
son
of A
TN &
IP P
acke
ts
NASA/TM—2001-210904 154

Opt
ions
Fie
ld o
f ATN
Pac
ket
NASA/TM—2001-210904 155

Moh
amm
ed A
tiquz
zam
an, U
nive
rsity
of D
ayto
n,E
mai
l: at
iq@
iee
e.o
rg
Opt
ions
Fie
ld o
f ATN
(con
td.)
NASA/TM—2001-210904 156

Moh
amm
ed A
tiquz
zam
an, U
nive
rsity
of D
ayto
n,E
mai
l: ie
ee
TPD
U &
NP
DU
Pri
ority
Tra
nsla
tion
NASA/TM—2001-210904 157

Moh
amm
ed A
tiquz
zam
an, U
nive
rsity
of D
ayto
n,E
mai
l: at
iq@
iee
e.o
rg
Con
clus
ions
nTa
sks
are
prog
ress
ing
wel
l and
as
plan
ned.
nM
odel
ing
of P
rior
itize
d E
PD
has
bee
n co
mpl
eted
.n
OP
NE
T si
mul
atio
n of
Pri
oriti
zed
EP
D to
be
cont
inue
d.n
ns s
imul
atio
n of
IS o
ver
DS
to b
e co
ntin
ued.
nA
TN o
ver
DS
map
ping
to b
e st
arte
d.
NASA/TM—2001-210904 158

Raj
Jai
nT
he O
hio
Stat
e U
nive
rsity
QoS
QoS
for
Rea
l Tim
e f
or R
eal T
ime
App
licat
ions
ove
r N
ext
App
licat
ions
ove
r N
ext
Gen
erat
ion
Dat
a N
etw
orks
:G
ener
atio
n D
ata
Net
wor
ks:
Pro
ject
Sta
tus
Rep
ort
Par
t II
Pro
ject
Sta
tus
Rep
ort
Par
t II
Raj
Jai
nT
he O
hio
Stat
e U
nive
rsity
Col
umbu
s, O
H 4
3210
jain
@ci
s.oh
io-s
tate
.edu
The
se s
lides
are
ava
ilabl
e at
http
://w
ww
.cis
.ohi
o-st
ate.
edu/
~jai
n/ta
lks/
nasa
_at0
.htm
NASA/TM—2001-210904 159

Raj
Jai
nT
he O
hio
Stat
e U
nive
rsity
Ove
rvie
wO
verv
iew
qT
ask
4: E
xplic
it co
nges
tion
notif
icat
ion
-im
prov
emen
ts
qT
ask
5: C
ircu
it em
ulat
ion
usin
g M
PLS
qA
ckno
wle
dgem
ent:
The
rese
arch
repo
rted
her
e w
asco
nduc
ted
by C
hun
Lei
Liu
, Wei
Sun
, and
Dr.
Ari
anD
urre
si.
NASA/TM—2001-210904 160

Raj
Jai
nT
he O
hio
Stat
e U
nive
rsity
Tas
k 4:
Buf
fer
Man
agem
ent
usin
g E
CN
Tas
k 4:
Buf
fer
Man
agem
ent
usin
g E
CN
qE
xplic
it C
onge
stio
n N
otif
icat
ion
qSt
anda
rdiz
ed in
RFC
248
1, e
xpec
ted
to b
e w
idel
yim
plem
ente
d so
on.
qT
wo
bits
in IP
hea
der:
Con
gest
ion
Exp
erie
nced
, EC
NC
apab
le T
rans
port
qT
wo
bits
in T
CP
head
er: E
CN
Ech
o, C
onge
stio
nW
indo
w R
educ
ed
Des
tinat
ion
Des
tinat
ion
Sour
ceSo
urce
NASA/TM—2001-210904 161

Raj
Jai
nT
he O
hio
Stat
e U
nive
rsity
RE
D M
arki
ng a
nd D
ropp
ing
RE
D M
arki
ng a
nd D
ropp
ing
qN
o st
anda
rd a
ctio
n sp
ecif
ied
qO
ne p
ossi
bilit
y is
to ra
ndom
ly m
ark
at lo
wer
cong
estio
n le
vels
. Ran
dom
Ear
ly D
etec
tion
(RE
D)
mar
king
inst
ead
of d
ropp
ing.
mar
king
prob
abili
tyqu
eue
size
no a
ctio
nm
arki
ngdr
oppi
ng
pmax
th_m
inth
_max
NASA/TM—2001-210904 162

Raj
Jai
nT
he O
hio
Stat
e U
nive
rsity
Sim
ulat
ion
Mod
elSi
mul
atio
n M
odel
TC
P se
nder
sT
CP
rece
iver
s
rout
erro
uter
NASA/TM—2001-210904 163

Raj
Jai
nT
he O
hio
Stat
e U
nive
rsity
Thr
esho
ld &
Buf
fer
Req
uire
men
tT
hres
hold
& B
uffe
r R
equi
rem
ent
qIn
ord
er to
ach
ieve
full
link
utili
zatio
n an
d ze
ro p
acke
tlo
ss, E
CN
rout
ers
shou
ldm
have
a b
uffe
r siz
e of
thre
e tim
es th
e ba
ndw
idth
dela
y pr
oduc
t;m
set t
he th
resh
old
as 1
/3 o
f the
buf
fer s
ize;
qA
ny s
mal
ler b
uffe
r siz
e w
ill re
sult
in p
acke
t los
s.q
Any
sm
alle
r thr
esho
ld w
ill re
sult
in li
nk id
ling.
qA
ny la
rger
thre
shol
d w
ill re
sult
in u
nnec
essa
ry d
elay
.
NASA/TM—2001-210904 164
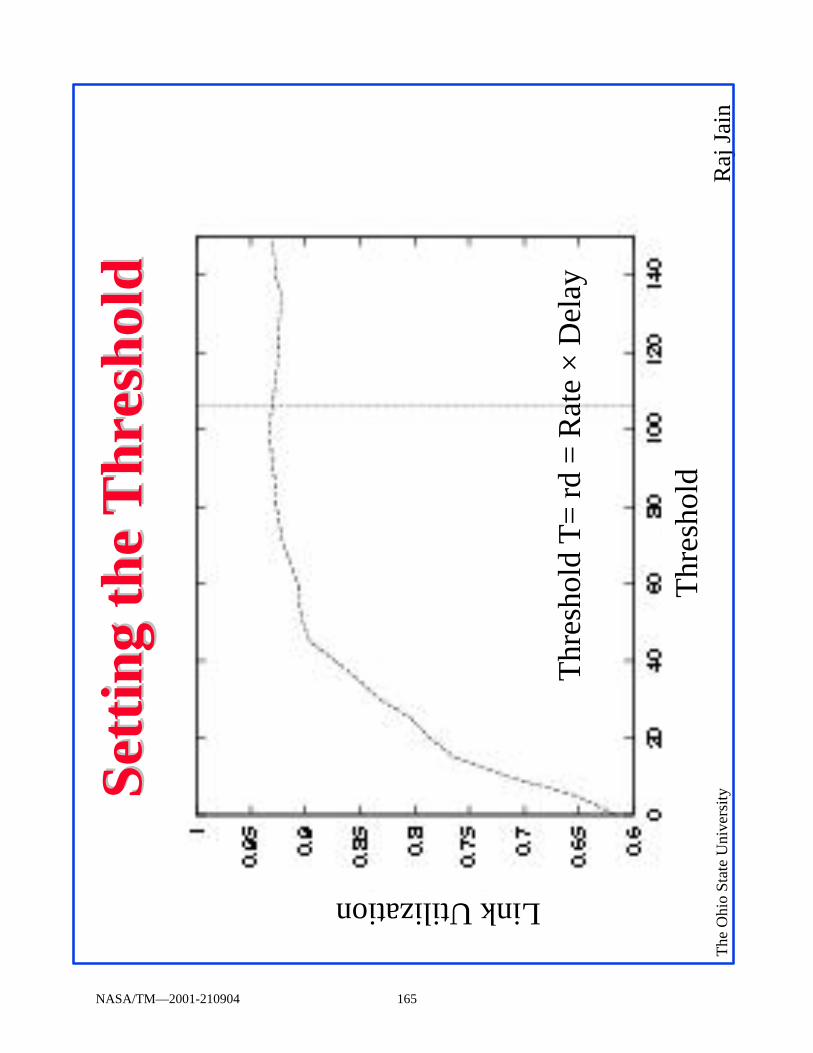
Raj
Jai
nT
he O
hio
Stat
e U
nive
rsitySe
ttin
g th
e T
hres
hold
Sett
ing
the
Thr
esho
ld
Thr
esho
ld
Thr
esho
ld T
= rd
= R
ate
× D
elay
Link Utilization
NASA/TM—2001-210904 165

Raj
Jai
nT
he O
hio
Stat
e U
nive
rsity
Buf
fer
Req
uire
men
t fo
r N
o L
oss
Buf
fer
Req
uire
men
t fo
r N
o L
oss
Thr
esho
ldtheo
retic
alsi
mul
atio
n
•
ECN buffer size requirement
NASA/TM—2001-210904 166

Raj
Jai
nT
he O
hio
Stat
e U
nive
rsityPro
blem
wit
h M
ark
Tai
lP
robl
em w
ith
Mar
k T
ail
qC
urre
nt E
CN
mar
ks p
acke
ts a
t the
tail
of th
e qu
eue:
mC
onge
stio
n si
gnal
s su
ffer
the
sam
e de
lay
as d
ata;
mW
hen
cong
estio
n is
mor
e se
vere
, the
EC
N s
igna
l is
less
use
ful;
mFl
ows
arri
ving
whe
n bu
ffer
s ar
e em
pty
may
get
mor
e th
roug
hput
⇒ u
nfai
rnes
s.
Mar
k T
ail
NASA/TM—2001-210904 167

Raj
Jai
nT
he O
hio
Stat
e U
nive
rsityP
ropo
sal:
Mar
k F
ront
Pro
posa
l: M
ark
Fro
nt
qSi
mul
atio
n A
naly
sis
has
show
n th
at m
ark-
fron
tst
rate
gym
Red
uces
the
buff
er s
ize
requ
irem
ent,
mIn
crea
ses
link
effi
cien
cy,
mA
void
s lo
ck-i
n ph
enom
enon
and
impr
oves
fair
ness
,m
Alle
viat
es T
CP’
s di
scri
min
atio
n ag
ain
larg
e R
TT
s.
Mar
k T
ail
Mar
k Fr
ont
NASA/TM—2001-210904 168

Raj
Jai
nT
he O
hio
Stat
e U
nive
rsity
Buf
fer
Req
uire
men
tB
uffe
r R
equi
rem
ent
Thr
esho
ld
Mar
k F
ront
the
oret
ical
Mar
k T
ail t
heor
etic
al
Mar
k F
ront
sim
ulat
ion
•
Mar
k T
ail s
imul
atio
n
∆∆
Buffer size requirement
Fron
t
Tai
l
Tai
l
qO
ur th
eore
tical
bou
nd is
tigh
t whe
n th
resh
old
> rd
qM
ark
Fron
t req
uire
s le
ss b
uffe
r
Fron
t
NASA/TM—2001-210904 169

Raj
Jai
nT
he O
hio
Stat
e U
nive
rsity
Lin
k E
ffic
ienc
yL
ink
Eff
icie
ncy
Thr
esho
ld
Link Efficiency
qM
ark-
Fron
t im
prov
es th
e lin
k ef
fici
ency
for t
he s
ame
thre
shol
d.
Fron
t
Tai
l
NASA/TM—2001-210904 170

Raj
Jai
nT
he O
hio
Stat
e U
nive
rsity
Unf
airn
ess
Unf
airn
ess
Thr
esho
ld
Tai
l
Fron
t
Unfairness
qM
ark-
Fron
t im
prov
es fa
irne
ss
NASA/TM—2001-210904 171

Raj
Jai
nT
he O
hio
Stat
e U
nive
rsity
Tas
k 4:
Sum
mar
y of
Res
ults
Tas
k 4:
Sum
mar
y of
Res
ults
qM
ark-
fron
t str
ateg
ym
Red
uces
the
buff
er s
ize
requ
irem
ent,
mIn
crea
ses
link
effi
cien
cy,
mA
void
s lo
ck-i
n ph
enom
enon
and
impr
oves
fair
ness
qT
his
is s
peci
ally
impo
rtan
t for
long
-ban
dwid
th d
elay
prod
uct n
etw
orks
Mar
k T
ail
Mar
k Fr
ont
NASA/TM—2001-210904 172

Raj
Jai
nT
he O
hio
Stat
e U
nive
rsity
Tas
k 5:
IP
Cir
cuit
Em
ulat
ion
Tas
k 5:
IP
Cir
cuit
Em
ulat
ion
qPr
oble
m S
tate
men
tq
App
licab
ility
NASA/TM—2001-210904 173

Raj
Jai
nT
he O
hio
Stat
e U
nive
rsity
Tel
ecom
mun
icat
ions
Tod
ayT
elec
omm
unic
atio
ns T
oday
qL
ease
d lin
es a
re a
maj
or s
ourc
e of
reve
nue
for c
arri
ers
qB
oth
voic
e an
d da
ta c
usto
mer
s us
e le
ased
line
s
Car
rier
Net
wor
k(T
DM
, T1/
T3/
SON
ET
ba
sed)
Ent
erpr
ise
Net
wor
ksIP
bas
ed
Ent
erpr
ise
Net
wor
ksIP
bas
ed
T1
Lin
kT
1 L
ink
NASA/TM—2001-210904 174

Raj
Jai
nT
he O
hio
Stat
e U
nive
rsity
Tel
ecom
mun
icat
ions
Tom
orro
wT
elec
omm
unic
atio
ns T
omor
row
qC
arri
ers
are
switc
hing
to A
TM
qA
TM
is n
ot b
eing
ado
pted
in th
e en
terp
rise
.⇒
The
re is
a p
ress
ure
on c
arri
ers
to p
rovi
de n
ativ
e IP
serv
ices
Car
rier
Net
wor
k(A
TM
+ S
ome
TD
M)
Ent
erpr
ise
Net
wor
ksIP
bas
ed
Ent
erpr
ise
Net
wor
ksIP
bas
ed
AT
MA
TM
NASA/TM—2001-210904 175

Raj
Jai
nT
he O
hio
Stat
e U
nive
rsity
Tel
ecom
mun
icat
ions
Fut
ure
Tel
ecom
mun
icat
ions
Fut
ure
qC
arri
ers
will
sw
itch
to IP
rout
ers
and
switc
hes
qM
PLS
will
pro
vide
the
glue
to c
onne
ct A
TM
and
IPeq
uipm
ent.
(MPL
S w
orks
with
bot
h te
chno
logi
es)
qIt
is im
port
ant t
o pr
ovid
e le
ased
line
ser
vice
s to
cust
omer
s on
bot
h A
TM
and
IP b
ased
equ
ipm
ent
Car
rier
Net
wor
k(I
P an
d A
TM
)
Ent
erpr
ise
Net
wor
ksIP
bas
ed
Ent
erpr
ise
Net
wor
ksIP
bas
ed
IPIP
NASA/TM—2001-210904 176

Raj
Jai
nT
he O
hio
Stat
e U
nive
rsity
CB
R o
ver
IPC
BR
ove
r IP
qD
efin
ition
of C
BR
is n
ot tr
ivia
lq
In th
e T
DM
wor
ld: C
BR
= F
ixed
bits
/sec
qIn
AT
M w
orld
: Cel
ls a
re fi
xed
size
but
can
arr
ive
slig
htly
at d
iffe
rent
tim
e⇒
CB
R =
Sm
all C
DV
T (C
ell d
elay
var
iatio
nT
oler
ance
)q
In IP
: Pac
kets
are
of d
iffe
rent
siz
e an
d bu
rsty
Tim
e
Byt
es
TD
MIP
NASA/TM—2001-210904 177

Raj
Jai
nT
he O
hio
Stat
e U
nive
rsity
CB
R o
ver
IP (
CB
R o
ver
IP (
cont
cont
))
qC
BR
is d
efin
ed b
y lim
its o
n bu
rstin
ess
and
rate
qH
ow m
uch
vari
atio
n fr
om th
e st
raig
ht li
ne is
ok?
qW
hat t
hese
lim
its a
re a
nd h
ow to
bes
t spe
cify
them
isth
e fi
rst p
robl
em in
this
pro
ject
. The
sol
utio
n ha
sm
any
requ
irem
ents
as
indi
cate
d ne
xt (i
nclu
ding
aggr
egat
ion
for m
ultip
le s
ourc
es).
qT
radi
tiona
l met
hods
suc
h as
leak
y bu
cket
or t
oken
buck
et a
re n
ot a
dditi
ve a
nd n
ot g
ood
for h
ighl
y bu
rsty
data
traf
fic
(ok
for s
light
ly b
urst
y vo
ice
traf
fic)
NASA/TM—2001-210904 178

Raj
Jai
nT
he O
hio
Stat
e U
nive
rsity
Agg
rega
tion
Agg
rega
tion
qH
ow to
com
bine
mul
tiple
CB
R s
ourc
es?
CB
R s
ourc
e 1
CB
R s
ourc
e 2
1+2
NASA/TM—2001-210904 179

Raj
Jai
nT
he O
hio
Stat
e U
nive
rsity
Agg
rega
tion
of
VB
R S
ourc
esA
ggre
gati
on o
f V
BR
Sou
rces
qH
ow to
com
bine
mul
tiple
VB
R s
ourc
es?
VB
R s
ourc
e 1
VB
R s
ourc
e 2
1+2
NASA/TM—2001-210904 180

Raj
Jai
nT
he O
hio
Stat
e U
nive
rsity
Opt
imiz
ed S
olut
ion
Opt
imiz
ed S
olut
ion
Rat
e
Bur
st
•Fin
d th
e be
st ru
les
how
to m
ultip
lex
diff
eren
t IP
traf
fics
NASA/TM—2001-210904 181

Raj
Jai
nT
he O
hio
Stat
e U
nive
rsity
Cur
rent
Wor
k St
atus
Cur
rent
Wor
k St
atus
qU
sing
Lea
ky B
ucke
t Mod
el to
do
sim
ulat
ion
qFi
nd th
e op
timiz
ed m
ultip
lexi
ng s
olut
ion
for d
iffe
rent
inpu
t tra
ffic
s sc
enar
ios
mFo
r exa
mpl
e: M
ultip
lexi
ng v
oice
ove
r IP
qW
ill w
ork
on D
-BIN
D/H
-BIN
D m
odel
late
r on
qSt
udy
to p
ropo
se b
ette
r mod
el
NASA/TM—2001-210904 182

Raj
Jai
nT
he O
hio
Stat
e U
nive
rsity
Sum
mar
ySu
mm
ary
1. E
xplic
it co
nges
tion
notif
icat
ion
can
be im
prov
ed w
ithm
ark
fron
t str
ateg
y2.
Cir
cuit
emul
atio
n re
quir
es b
ette
r mod
els
for t
raff
icsp
ecif
icat
ion
NASA/TM—2001-210904 183


Moh
amm
ed A
tiquz
zam
an, U
nive
rsity
of D
ayto
n,Em
ail:
atiq
@ie
ee.o
rg
QoS
for R
eal T
ime
App
licat
ions
ove
r Nex
t G
ener
atio
n D
ata
Net
wor
ksFi
nal P
roje
ct P
rese
ntat
ion
Dec
embe
r 8, 2
000
http
://w
ww
.eng
r.uda
yton
.edu
/facu
lty/m
atiq
uzz/
Pres
/QoS
-fina
l.pdf
Uni
vers
ity o
f Day
ton
Moh
amm
ed A
tiquz
zam
an (P
I)H
aow
ei B
aiH
ongj
unSu
Jyot
sna
Chi
triFa
ruqu
e Ah
amed
NAS
A G
lenn
Will
Ivan
cic
NASA/TM—2001-210904 185

Moh
amm
ed A
tiquz
zam
an, U
nive
rsity
of D
ayto
n,Em
ail:
atiq
@ie
ee.o
rg
Prog
ress
of t
he ta
sks
�Pr
ogre
ss to
dat
e:�
Task
1: Q
oS in
Inte
grat
ed S
ervi
ces
over
Diff
Serv
ne
twor
ks (U
D)
�Ta
sk 2
: Int
erco
nnec
ting
ATN
with
the
next
gen
erat
ion
Inte
rnet
(UD
)�
Task
3: Q
oS in
Diff
Serv
ove
r ATM
(UD
)�
Task
4: I
mpr
ovin
g Ex
plic
it C
onge
stio
n N
otifi
catio
n w
ith
the
Mar
k-Fr
ont S
trate
gy (O
SU)
�Ta
sk 5
: Mul
tiple
VBR
ove
r VBR
(OSU
)�
Task
6: A
chie
ving
QoS
for T
CP
traffi
c in
Sat
ellit
e N
etw
orks
with
Diff
eren
tiate
d Se
rvic
es (O
SU)
�C
oncl
usio
ns
NASA/TM—2001-210904 186

Moh
amm
ed A
tiquz
zam
an, U
nive
rsity
of D
ayto
n,Em
ail:
atiq
@ie
ee.o
rg
Task
1
QoS
in In
tegr
ated
Ser
vice
sov
er D
iffSe
rv n
etw
orks
NASA/TM—2001-210904 187

Moh
amm
ed A
tiquz
zam
an, U
nive
rsity
of D
ayto
n,Em
ail:
atiq
@ie
ee.o
rgInte
grat
ed S
ervi
ces
�In
tSer
v is
one
of m
odel
s pr
opos
ed b
y IE
TF to
mee
t the
de
man
d fo
r end
-to-e
nd Q
oS o
ver h
eter
ogen
eous
net
wor
ks.
�Th
e In
tSer
v m
odel
is c
hara
cter
ized
by
reso
urce
re
serv
atio
n.
�In
tSer
v im
plem
enta
tion
requ
ires
RSV
P (R
esou
rce
Res
erva
tion
Prot
ocol
) sig
nalin
g an
d re
sour
ce a
lloca
tions
at
ever
y ne
twor
k el
emen
t alo
ng th
e pa
th.
�Al
l the
net
wor
k el
emen
ts m
ust b
e R
SVP-
enab
le.
�Sc
alab
ility
prob
lem
bec
omes
a b
ound
on
its im
plem
enta
tion
for t
he e
ntire
Inte
rnet
.
NASA/TM—2001-210904 188

Moh
amm
ed A
tiquz
zam
an, U
nive
rsity
of D
ayto
n,Em
ail:
atiq
@ie
ee.o
rg
Diff
eren
tiate
d Se
rvic
es
�D
iffSe
rv is
cur
rent
ly b
eing
sta
ndar
dize
d to
ove
rcom
e th
e
scal
abilit
y is
sue
of In
tSer
v.
�Th
is m
odel
doe
s no
t req
uire
sig
nific
ant c
hang
es to
the
exis
ting
infra
stru
ctur
e, a
nd d
oes
not n
eed
man
y ad
ditio
nal
prot
ocol
s.
�Be
caus
e it
is b
ased
on
the
proc
essi
ng o
f agg
rega
ted
flow
s (c
lass
es),
Diff
Serv
doe
s no
t con
side
r the
nee
d of
end
ap
plic
atio
ns.
NASA/TM—2001-210904 189

Moh
amm
ed A
tiquz
zam
an, U
nive
rsity
of D
ayto
n,Em
ail:
atiq
@ie
ee.o
rgIntS
erv
vs. D
iffSe
rv
�Ad
vant
age
of In
tSer
v: a
pplic
atio
n or
ient
ed.
�D
isad
vant
age
of In
tSer
v: s
cala
bilit
y pr
oble
m.
�Ad
vant
age
of D
iffSe
rv: e
nabl
es s
cala
bilit
y ac
ross
larg
e ne
twor
ks.
�D
isad
vant
age
of D
iffSe
rv: d
oes
not c
onsi
der t
he Q
oS
requ
irem
ents
of e
nd u
sers
.
NASA/TM—2001-210904 190

Moh
amm
ed A
tiquz
zam
an, U
nive
rsity
of D
ayto
n,Em
ail:
atiq
@ie
ee.o
rgProb
lem
Sta
tem
ent
�W
ith th
e im
plem
enta
tion
of In
tSer
v fo
r sm
all W
AN n
etw
orks
an
d D
iffSe
rv fo
r the
Inte
rnet
bac
kbon
e, c
ombi
ning
the
adva
ntag
es o
f Int
Serv
and
Diff
Serv
, can
TC
P/IP
traf
fic m
eet
the
QoS
dem
ands
?
�C
an Q
oS b
e pr
ovid
ed to
end
app
licat
ions
?
NASA/TM—2001-210904 191

Moh
amm
ed A
tiquz
zam
an, U
nive
rsity
of D
ayto
n,Em
ail:
atiq
@ie
ee.o
rg
Obj
ectiv
e
�To
inve
stig
ate
the
POSS
IBIL
ITY
of p
rovi
ding
end
-to-e
nd
QoS
whe
n In
tSer
v ru
ns o
ver D
iffSe
rv b
ackb
one
in th
e ne
xt
gene
ratio
n In
tern
et.
�To
pro
pose
a M
APPI
NG
FU
NC
TIO
Nto
run
IntS
erv
over
th
e D
iffSe
rv b
ackb
one.
�To
sho
w th
e SI
MU
LATI
ON
RES
ULT
Sus
ed to
pro
ve th
at
QoS
can
be
achi
eved
by
end
IntS
erv
appl
icat
ions
whe
n ru
nnin
g ov
er D
iffSe
rv b
ackb
one
in th
e ne
xt g
ener
atio
n In
tern
et.
NASA/TM—2001-210904 192

Moh
amm
ed A
tiquz
zam
an, U
nive
rsity
of D
ayto
n,Em
ail:
atiq
@ie
ee.o
rg
Poss
ibili
ty o
f End
-to-e
nd Q
oS
�To
sup
port
the
end-
to-e
nd Q
oS m
odel
, the
IntS
erv
arch
itect
ure
mus
t be
supp
orte
d ov
er a
wid
e va
riety
of
diffe
rent
type
s of
net
wor
k el
emen
ts.
�In
this
con
text
, a n
etw
ork
that
sup
ports
Diff
Serv
may
be
view
ed a
s a
netw
ork
back
bone
.
�C
ombi
ning
IntS
erv
and
Diff
Serv
has
bee
n pr
opos
ed b
y IE
TF a
s on
e of
the
poss
ible
sol
utio
ns to
ach
ieve
end
-to-e
nd
QoS
in th
e ne
xt g
ener
atio
n In
tern
et.
NASA/TM—2001-210904 193

Moh
amm
ed A
tiquz
zam
an, U
nive
rsity
of D
ayto
n,Em
ail:
atiq
@ie
ee.o
rg
Poss
ibili
ty o
f End
-to-e
nd Q
oS
(Con
tinue
d)
�O
bvio
usly
, a m
appi
ng fu
nctio
n fro
m In
tSer
v flo
ws
to
Diff
Serv
cla
sses
has
to b
e de
velo
ped.
NASA/TM—2001-210904 194

Moh
amm
ed A
tiquz
zam
an, U
nive
rsity
of D
ayto
n,Em
ail:
atiq
@ie
ee.o
rg
Req
uire
men
ts o
f Int
Serv
Ser
vice
s
�Th
e ob
ject
ive
of G
uara
ntee
d Se
rvic
e: to
ach
ieve
a b
ound
ed
dela
y, w
hich
mea
ns it
doe
s no
t con
trol t
he m
inim
al o
r av
erag
e de
lay
of d
atag
ram
, mer
ely
the
max
imal
del
ay.
�Th
e ob
ject
ive
of C
ontro
lled-
load
Ser
vice
: to
achi
eve
little
or
no d
elay
as
that
pro
vide
d to
bes
t-effo
rt tra
ffic
unde
r lig
htly
lo
aded
con
ditio
ns.
�D
elay
: fix
ed d
elay
(suc
h as
tran
smis
sion
del
ay) &
que
uing
de
lay.
�Fi
xed
dela
yis
a p
rope
rty o
f cho
sen
path
; que
uing
del
ayis
pr
imar
ily a
func
tion
of to
ken
buck
etan
d da
ta ra
te.
NASA/TM—2001-210904 195

Moh
amm
ed A
tiquz
zam
an, U
nive
rsity
of D
ayto
n,Em
ail:
atiq
@ie
ee.o
rg
Tspe
c
�Ts
pec:
acc
ordi
ng to
RFC
221
2 (G
uara
ntee
d se
rvic
e) a
nd
RFC
221
1 (C
ontro
lled-
load
ser
vice
), Ts
pec
take
s th
e fo
rm
of: �
a to
ken
buck
et s
peci
ficat
ion,
i.e.
, bu
cket
rate
(r) a
nd b
ucke
t de
pth
(b),
and
�a
peak
rate
(p),
a m
inim
um p
olic
ed u
nit (
m) a
nd a
max
imum
data
gram
size
(M).
Buc
ket D
epth
b
Inco
min
g T
oken
r
(tok
en/S
ec)
Inco
min
gT
raffi
cP
NASA/TM—2001-210904 196

Moh
amm
ed A
tiquz
zam
an, U
nive
rsity
of D
ayto
n,Em
ail:
atiq
@ie
ee.o
rg
Res
ourc
e R
eser
vatio
n
�In
IntS
erv,
reso
urce
rese
rvat
ion
are
mad
e by
requ
estin
g a
serv
ice
type
spe
cifie
d by
a s
et o
f qua
ntita
tive
para
met
ers
know
n as
Tspe
c(T
raffi
c Sp
ecifi
catio
n).
�Ea
ch s
et o
f par
amet
ers
dete
rmin
es a
n ap
prop
riate
prio
rity
leve
l.
NASA/TM—2001-210904 197

Moh
amm
ed A
tiquz
zam
an, U
nive
rsity
of D
ayto
n,Em
ail:
atiq
@ie
ee.o
rg
Map
ping
Con
side
ratio
ns
�PH
Bsin
Diff
Serv
dom
ain
mus
t be
appr
opria
tely
sel
ecte
d fo
r ea
ch re
ques
ted
serv
ice
in In
tSer
v do
mai
n.
�Th
e re
quire
d po
licin
g, s
hapi
ng a
nd m
arki
ng m
ust b
e do
ne
at th
e ed
ge ro
uter
of t
he D
iffSe
rv d
omai
n.
�Ta
king
into
acc
ount
the
reso
urce
ava
ilabi
lity
in D
iffSe
rv
dom
ain,
adm
issi
on c
ontro
l mus
t be
impl
emen
ted
for
requ
este
d tra
ffic
in In
tSer
v do
mai
n.
NASA/TM—2001-210904 198

Moh
amm
ed A
tiquz
zam
an, U
nive
rsity
of D
ayto
n,Em
ail:
atiq
@ie
ee.o
rg
Prop
osed
IntS
erv
to D
iffSe
rv M
appi
ng
�In
this
stu
dy, w
e pr
opos
e to
map
�G
uara
ntee
d se
rvic
eto
EF
PHB
and
�C
ontr
olle
d-lo
adse
rvic
e to
AF
PHBs
.
NASA/TM—2001-210904 199

Moh
amm
ed A
tiquz
zam
an, U
nive
rsity
of D
ayto
n,Em
ail:
atiq
@ie
ee.o
rgMap
ping
Fun
ctio
n
�M
appi
ng fu
nctio
n: a
func
tion
whi
ch is
use
d to
ass
ign
an
appr
opria
te D
SCP
(Diff
Serv
Cod
epoi
nt) t
o a
flow
spe
cifie
d by
Tspe
cpa
ram
eter
s in
IntS
erv
dom
ain.
�Th
e M
appi
ng fu
nctio
n sh
ould
ens
ure
that
the
requ
ired
QoS
co
uld
be a
chie
ved
for I
ntSe
rv w
hen
runn
ing
over
Diff
Serv
do
mai
n.
NASA/TM—2001-210904 200

Moh
amm
ed A
tiquz
zam
an, U
nive
rsity
of D
ayto
n,Em
ail:
atiq
@ie
ee.o
rg
Map
ping
Fun
ctio
n (C
ontin
ued)
�Ea
ch p
acke
t in
the
flow
from
the
IntS
erv
dom
ain
has
a flo
w
IDin
dica
ted
by th
e va
lue
of fl
ow-id
fiel
d in
the
IP h
eade
r.
04
816
2431
Ver
sT
Cla
ssP
aylo
ad L
engt
hN
ext H
eade
rH
op L
imit
Sou
rce
Add
ress
Des
tinat
ion
Add
ress
Flo
w ID
40-o
ctet
IPv6
bas
e he
ader
NASA/TM—2001-210904 201

Moh
amm
ed A
tiquz
zam
an, U
nive
rsity
of D
ayto
n,Em
ail:
atiq
@ie
ee.o
rg
Map
ping
Fun
ctio
n (C
ontin
ued)
�Th
e flo
w ID
attr
ibut
ed w
ith th
eTs
pec
para
met
ers
is u
sed
to
dete
rmin
e w
hich
flow
the
pack
et b
elon
gs to
.
�It
is p
ossi
ble
for d
iffer
ent s
ende
rs to
use
the
sam
eTs
pec
para
met
ers
to re
ques
t ser
vice
. How
ever
, the
y ar
e di
ffere
ntia
ted
by th
e flo
w ID
. Flo
w ID
is u
niqu
e.
�It
is a
lso
poss
ible
that
diff
eren
t flo
ws
can
be m
appe
d to
the
sam
e PH
B in
the
Diff
Serv
dom
ain.
NASA/TM—2001-210904 202

Moh
amm
ed A
tiquz
zam
an, U
nive
rsity
of D
ayto
n,Em
ail:
atiq
@ie
ee.o
rg
An
Exam
ple
Map
ping
Fun
ctio
n
�An
exa
mpl
e m
appi
ng fu
nctio
n us
ed in
our
sim
ulat
ion
0010
10AF
114
r=0.
5 M
b, b
=800
0 by
tes
0010
10AF
113
r=0.
5 M
b, b
=800
0 by
tes
0010
10AF
112
r=0.
5 M
b, b
=800
0 by
tes
1011
10EF
1r=
0.7
Mb,
b=5
000
byte
s10
1110
EF0
r=0.
7 M
b,b=
5000
byt
esD
SCP
PHB
Flow
IDTs
pec
NASA/TM—2001-210904 203

Moh
amm
ed A
tiquz
zam
an, U
nive
rsity
of D
ayto
n,Em
ail:
atiq
@ie
ee.o
rg
How
Doe
s th
e M
appi
ng F
unct
ion
Wor
k?
�Pa
cket
s sp
ecifi
ed b
yTs
pec
para
met
ers
and
Flow
ID a
re
first
map
ped
to th
e co
rresp
ondi
ngPH
Bsin
the
Diff
Serv
do
mai
n by
app
ropr
iate
ly a
ssig
ning
a D
SCP
acco
rdin
g to
th
e m
appi
ng fu
nctio
n.
�Pa
cket
s ar
e th
en ro
uted
in th
e D
iffSe
rv d
omai
n w
here
they
re
ceiv
e tre
atm
ents
bas
ed o
n th
eir D
SCP
code
.
NASA/TM—2001-210904 204

Moh
amm
ed A
tiquz
zam
an, U
nive
rsity
of D
ayto
n,Em
ail:
atiq
@ie
ee.o
rg
Sim
ulat
ion
Con
figur
atio
ns
�Si
mul
atio
n to
ol: B
erke
ley
nsV2
.1b6
�Si
mul
atio
n co
nfig
urat
ion. DS
Route
rD
SR
oute
r5M
b,1
ms
2Mb, 0.1ms
2Mb, 0.1ms
2Mb,
0.1
ms
2M
b,
0.1
ms
2Mb, 0.1ms
2Mb, 0.1ms
2Mb, 0.1ms
2Mb,
0.1m
s
Tw
oG
ua
ran
tee
dse
rvic
eS
ou
rce
s
Th
ree
Co
ntr
olle
d-lo
ad
So
urc
es
Fiv
eB
est-
eff
ort
So
urc
es
IntS
erv
Destinations
IntS
erv
Sourc
es
0 1 2 4 5 9
0 1 2 4 5 9
NASA/TM—2001-210904 205

Moh
amm
ed A
tiquz
zam
an, U
nive
rsity
of D
ayto
n,Em
ail:
atiq
@ie
ee.o
rg
�W
e in
tegr
ated
the
map
ping
func
tion
into
the
edge
Diff
Serv
ro
uter
. Sim
ulat
ion
Con
figur
atio
n (C
ontin
ued)
Que
uein
g
MF
Cla
ssifi
erM
arke
rM
appi
ngF
unct
ion
Tra
ffic
Con
ditio
ner
Tra
ffic
Met
er
Ingr
ess
Rou
ter
Cor
eR
oute
r
BA
Cla
ssifi
erA
dmis
sion
Con
trol
NASA/TM—2001-210904 206

Moh
amm
ed A
tiquz
zam
an, U
nive
rsity
of D
ayto
n,Em
ail:
atiq
@ie
ee.o
rg
Sim
ulat
ion
Con
figur
atio
ns (C
ontin
ued)
�C
onfig
urat
ion
of q
ueue
s in
side
the
core
Diff
Serv
rout
er.
�Si
nce
the
band
wid
th o
f bot
tlene
ck li
nk is
5M
b, th
e ab
ove
sche
dulin
g w
eigh
t im
plie
s ba
ndw
idth
of
�EF
: 2M
b�
AF: 2
Mb
�BE
: 1M
b
0.2
RED
BE
Que
ue0.
4R
IOAF
Que
ue0.
4PQ
-Tai
l dro
pEF
Que
ue
Sche
dule
r w
eigh
tQ
ueue
Typ
e
NASA/TM—2001-210904 207

Moh
amm
ed A
tiquz
zam
an, U
nive
rsity
of D
ayto
n,Em
ail:
atiq
@ie
ee.o
rg
Perf
orm
ance
Crit
eria
�G
oodp
utof
eac
h In
tSer
v so
urce
.
�Q
ueue
siz
e of
eac
h qu
eue
in th
e D
iffSe
rv c
ore
rout
er.
�D
rop
ratio
at s
ched
uler
.
�N
on-c
onfo
rman
t rat
io: t
he ra
tio o
f non
-con
form
ant
pack
ets
as c
ompa
red
to in
-pro
file
pack
ets.
NASA/TM—2001-210904 208

Moh
amm
ed A
tiquz
zam
an, U
nive
rsity
of D
ayto
n,Em
ail:
atiq
@ie
ee.o
rg
�C
ase
1: N
o co
nges
tion;
no
exce
ssiv
e tr
affic
.
�Tw
o G
uara
ntee
d se
rvic
e so
urce
s ge
nera
te 1
.4M
b tra
ffic
whi
ch is
less
than
the
sche
dule
d ba
ndw
idth
(2M
b)
N
o co
nges
tion.
�So
urce
rate
is e
qual
to th
e bu
cket
rate
No
exce
ssiv
e tr
affic
.QoS
Obt
aine
d by
Gua
rant
eed
Serv
ice:
C
ase
1
0.7M
b0.
7Mb
Sour
ce
Rat
e
0.7M
b0.
7Mb
Toke
n R
ateR
esou
rce
Res
erva
tion
5000
byte
s50
00by
tes
Buc
ket
Dep
th
Gua
rant
eed
Serv
ice
Gua
rant
eed
Serv
ice
Sour
ce T
ype
10
Sour
ce
NO
.
NASA/TM—2001-210904 209

Moh
amm
ed A
tiquz
zam
an, U
nive
rsity
of D
ayto
n,Em
ail:
atiq
@ie
ee.o
rg
Goo
dput
of G
uara
ntee
d Se
rvic
e:
Cas
e 1
�Si
mul
atio
n re
sults
of C
ase
1:G
oodp
utof
eac
h G
uara
ntee
d Se
rvic
e so
urce
.
�O
bser
vatio
n:th
e go
odpu
tof e
ach
sour
ce is
alm
ost e
qual
to
the
corre
spon
ding
sou
rce
rate
.
699.
801
169
9.82
00
Cas
e 1
(Kb/
S)Fl
ow
IDSo
urce
N
o.
NASA/TM—2001-210904 210

Moh
amm
ed A
tiquz
zam
an, U
nive
rsity
of D
ayto
n,Em
ail:
atiq
@ie
ee.o
rg
Dro
p R
atio
of G
uara
ntee
d Se
rvic
e:
Cas
e 1
�Si
mul
atio
n re
sults
of C
ase
1: D
rop
ratio
of
Gua
rant
eed
Serv
ice
traf
fic (m
easu
red
at s
ched
uler
).
�O
bser
vatio
n:si
nce
ther
e is
no
sign
ifica
nt c
onge
stio
n, th
e dr
op ra
tio is
zer
o.
0.00
Gua
rant
eed
Serv
ice
Cas
e 1
Type
of t
raffi
c
NASA/TM—2001-210904 211

Moh
amm
ed A
tiquz
zam
an, U
nive
rsity
of D
ayto
n,Em
ail:
atiq
@ie
ee.o
rg
Non
-con
form
ant R
atio
of G
uara
ntee
d Se
rvic
e: C
ase
1
�Si
mul
atio
n re
sults
of C
ase
1: n
on-c
onfo
rman
t rat
io o
f ea
ch G
uara
ntee
d Se
rvic
e so
urce
.
�O
bser
vatio
ns:s
ince
ther
e is
no
exce
ssiv
e tra
ffic,
the
non-
conf
orm
ant r
atio
is z
ero.
0.00
11
0.00
00
Cas
e 1
Flow
ID
Sour
ce
No.
NASA/TM—2001-210904 212

Moh
amm
ed A
tiquz
zam
an, U
nive
rsity
of D
ayto
n,Em
ail:
atiq
@ie
ee.o
rg
Que
ue S
ize
Plot
: Cas
e 1
Qu
eueS
izeV
S.T
ime
CL
(AF
11
)q.t
r
BE
(BE
)q.t
r
GL
(EF
)q.t
r
Qu
eueS
ize
Tim
e
0.0
000
0.5
000
1.0
000
1.5
000
2.0
000
2.5
000
3.0
000
3.5
000
4.0
000
4.5
000
5.0
000
0.0
00
02
0.0
00
04
0.0
00
06
0.0
00
08
0.0
00
01
00.0
00
0
NASA/TM—2001-210904 213

Moh
amm
ed A
tiquz
zam
an, U
nive
rsity
of D
ayto
n,Em
ail:
atiq
@ie
ee.o
rg
Que
ue S
ize
Plot
: Cas
e 1
(Con
tinue
d)
�O
bser
vatio
ns:
�Si
nce
Cas
e 1
is a
n id
eal c
ase,
the
size
of e
ach
queu
e is
ve
ry s
mal
l.
�BE
que
ue h
as th
e la
rges
t jitt
er.
NASA/TM—2001-210904 214

Moh
amm
ed A
tiquz
zam
an, U
nive
rsity
of D
ayto
n,Em
ail:
atiq
@ie
ee.o
rg
�C
ase
2: N
o co
nges
tion;
sou
rce
1 ge
nera
tes
exce
ssiv
e tr
affic
.
�Tw
o G
uara
ntee
d se
rvic
e so
urce
s ge
nera
te 1
.6M
b tra
ffic
whi
ch is
less
than
the
sche
dule
d ba
ndw
idth
(2M
b)
N
o co
nges
tion.
�So
urce
rate
of s
ourc
e 1
(0.9
Mb)
is g
reat
er th
an th
e bu
cket
ra
te (0
.7M
b)
So
urce
1 g
ener
ates
exc
essi
ve tr
affic
.
QoS
Obt
aine
d by
Gua
rant
eed
Serv
ice:
C
ase
2
0.9M
b0.
7Mb
Sour
ce
Rat
e
0.7M
b0.
7Mb
Toke
n R
ateR
esou
rce
Res
erva
tion
5000
byte
s50
00by
tes
Buc
ket
Dep
th
Gua
rant
eed
Serv
ice
Gua
rant
eed
Serv
ice
Sour
ce T
ype
10
Sour
ce
NO
.
NASA/TM—2001-210904 215

Moh
amm
ed A
tiquz
zam
an, U
nive
rsity
of D
ayto
n,Em
ail:
atiq
@ie
ee.o
rg
Goo
dput
of G
uara
ntee
d Se
rvic
e:C
ase
2
�Si
mul
atio
n re
sults
of C
ase
2: G
oodp
utof
eac
h G
uara
ntee
d Se
rvic
e so
urce
.
�O
bser
vatio
ns:t
he g
oodp
utof
sou
rce
0 is
alm
ost e
qual
to
the
corre
spon
ding
sou
rce
rate
; how
ever
, the
goo
dput
of
sour
ce 1
is e
qual
to it
s to
ken
rate
, 0.7
Mb,
inst
ead
of it
s so
urce
rate
, 0.9
Mb.
699.
6469
9.80
11
699.
8069
9.83
00
Cas
e 2
(Kb/
S)C
ase
1 (K
b/S)
Flow
ID
Sour
ce
No.
NASA/TM—2001-210904 216

Moh
amm
ed A
tiquz
zam
an, U
nive
rsity
of D
ayto
n,Em
ail:
atiq
@ie
ee.o
rg
Dro
p R
atio
of G
uara
ntee
d Se
rvic
e:C
ase
2
�Si
mul
atio
n re
sults
of C
ase
2: D
rop
ratio
of
Gua
rant
eed
Serv
ice
traf
fic (m
easu
red
at s
ched
uler
).
�O
bser
vatio
n:si
nce
ther
e is
no
sign
ifica
nt c
onge
stio
n, th
e dr
op ra
tio is
zer
o.
0.00
0.00
Gua
rant
eed
Serv
ice
Cas
e 2
Cas
e 1
Type
of t
raffi
c
NASA/TM—2001-210904 217

Moh
amm
ed A
tiquz
zam
an, U
nive
rsity
of D
ayto
n,Em
ail:
atiq
@ie
ee.o
rg
Non
-con
form
ant R
atio
Gua
rant
eed
Serv
ice:
Cas
e 2
�Si
mul
atio
n re
sults
of C
ase
2: n
on-c
onfo
rman
t rat
io o
f ea
ch G
uara
ntee
d Se
rvic
e so
urce
.
�O
bser
vatio
n:si
nce
sour
ce 1
gen
erat
es e
xces
sive
traf
fic,
its n
on-c
onfo
rman
t rat
io is
incr
ease
d, c
ompa
red
to C
ase
1.
0.22
0.00
11
0.00
0.00
00
Cas
e 2
Cas
e 1
Flow
ID
Sour
ce
No.
NASA/TM—2001-210904 218

Moh
amm
ed A
tiquz
zam
an, U
nive
rsity
of D
ayto
n,Em
ail:
atiq
@ie
ee.o
rg
Que
ue S
ize
Plot
: Cas
e 2
Qu
eueS
izeV
S.T
ime
CL
(AF
11)q
.tr
BE
(BE
)q.t
r
GL
(EF
)q.t
r
Qu
eueS
ize
Tim
e
0.0
00
0
0.5
00
0
1.0
00
0
1.5
00
0
2.0
00
0
2.5
00
0
3.0
00
0
3.5
00
0
4.0
00
0
4.5
00
0
5.0
00
0
0.0
00
020.0
000
40.0
000
60.0
000
80.0
000
100.0
000
NASA/TM—2001-210904 219

Moh
amm
ed A
tiquz
zam
an, U
nive
rsity
of D
ayto
n,Em
ail:
atiq
@ie
ee.o
rg
Que
ue S
ize
Plot
: Cas
e 2
(Con
tinue
d)
�O
bser
vatio
ns:
�In
this
cas
e, B
E qu
eue
has
the
larg
est s
ize
and
jitte
r;
�G
uara
ntee
d se
rvic
e qu
eue
has
the
smal
lest
siz
e an
d jit
ter.
�In
add
ition
, com
pare
d w
ith C
ase
1, th
e up
per b
ound
of
Gua
rant
eed
queu
e si
ze is
gua
rant
eed.
NASA/TM—2001-210904 220

Moh
amm
ed A
tiquz
zam
an, U
nive
rsity
of D
ayto
n,Em
ail:
atiq
@ie
ee.o
rg
�C
ase
3: G
uara
ntee
d se
rvic
e ge
ts in
to c
onge
stio
n; n
o ex
cess
ive
traf
fic---
-eva
luat
ion
unde
r con
gest
ion.
�Tw
o G
uara
ntee
d se
rvic
e so
urce
s ge
nera
te 2
.7M
b tra
ffic
whi
ch is
gre
ater
than
the
sche
dule
d ba
ndw
idth
(2M
b)
Gua
rant
eed
serv
ice
gets
into
con
gest
ion.
�So
urce
rate
is e
qual
to th
e bu
cket
rate
No
exce
ssiv
e tr
affic
.QoS
Obt
aine
d by
Gua
rant
eed
Serv
ice:
C
ase
3
2Mb
0.7M
b
Sour
ce
Rat
e
2Mb
0.7M
b
Toke
n R
ateR
esou
rce
Res
erva
tion
5000
byte
s50
00by
tes
Buc
ket
Dep
th
Gua
rant
eed
Serv
ice
Gua
rant
eed
Serv
ice
Sour
ce T
ype
10
Sour
ce
NO
.
NASA/TM—2001-210904 221

Moh
amm
ed A
tiquz
zam
an, U
nive
rsity
of D
ayto
n,Em
ail:
atiq
@ie
ee.o
rg
Goo
dput
of G
uara
ntee
d Se
rvic
e:
Cas
e 3
�Si
mul
atio
n re
sults
of C
ase
3: G
oodp
utof
eac
h G
uara
ntee
d Se
rvic
e so
urce
.
�O
bser
vatio
n:th
e to
talg
oodp
utof
two
sour
ces
is li
mite
d by
th
e sc
hedu
led
band
wid
th, 2
Mb,
inst
ead
of 2
.7M
b.
1540
.140
069
9.63
5969
9.80
391
145
9.87
9069
9.80
3969
9.82
500
0
Cas
e 3
(Kb/
S)C
ase
2 (K
b/S)
Cas
e 1
(Kb/
S)Fl
ow
IDSo
urce
N
o.
NASA/TM—2001-210904 222

Moh
amm
ed A
tiquz
zam
an, U
nive
rsity
of D
ayto
n,Em
ail:
atiq
@ie
ee.o
rg
Dro
p R
atio
of G
uara
ntee
d Se
rvic
e:
Cas
e 3
�Si
mul
atio
n re
sults
of C
ase
3: D
rop
ratio
of
Gua
rant
eed
Serv
ice
traf
fic (m
easu
red
at s
ched
uler
).
�O
bser
vatio
n:th
e dr
op ra
tio is
incr
ease
d.
0.26
0.00
0.00
Gua
rant
eed
Serv
ice
Cas
e 3
Cas
e 2
Cas
e 1
Type
of t
raffi
c
NASA/TM—2001-210904 223

Moh
amm
ed A
tiquz
zam
an, U
nive
rsity
of D
ayto
n,Em
ail:
atiq
@ie
ee.o
rg
Non
-con
form
ant R
atio
of
Gua
rant
eed
Serv
ice:
Cas
e 3
�Si
mul
atio
n re
sults
of C
ase
3: n
on-c
onfo
rman
t rat
io o
f ea
ch G
uara
ntee
d Se
rvic
e so
urce
.
�O
bser
vatio
ns:s
ince
ther
e is
no
exce
ssiv
e tra
ffic,
the
non-
conf
orm
ant r
atio
is z
ero.
0.00
0.22
0.00
11
0.00
0.00
0.00
00
Cas
e 3
Cas
e 2
Cas
e 1
Flow
ID
Sour
ce
No.
NASA/TM—2001-210904 224

Moh
amm
ed A
tiquz
zam
an, U
nive
rsity
of D
ayto
n,Em
ail:
atiq
@ie
ee.o
rg
Que
ue S
ize
Plot
: Cas
e 3
Qu
eueS
izeV
S.T
ime
CL
(AF
11
)q.t
r
BE
(BE
)q.t
r
GL
(EF
)q.t
r
QueueS
ize
Tim
e
0.0
000
0.5
000
1.0
000
1.5
000
2.0
000
2.5
000
3.0
000
3.5
000
4.0
000
4.5
000
5.0
000
5.5
000
6.0
000
6.5
000
7.0
000
7.5
000
8.0
000
8.5
000
9.0
000
9.5
000
10.0
000
0.0
000
20.0
000
40.0
000
60.0
000
80.0
000
100.0
000
NASA/TM—2001-210904 225

Moh
amm
ed A
tiquz
zam
an, U
nive
rsity
of D
ayto
n,Em
ail:
atiq
@ie
ee.o
rg
Que
ue S
ize
Plot
: Cas
e 3
(Con
tinue
d)
�O
bser
vatio
ns:s
ince
we
incr
ease
d th
e so
urce
rate
and
to
ken
rate
of s
ourc
e 1
in o
rder
to m
ake
Gua
rant
eed
serv
ice
cong
este
d, it
is re
ason
able
that
the
uppe
r bou
nd o
f G
uara
ntee
d se
rvic
e qu
eue
size
is in
crea
sed.
NASA/TM—2001-210904 226

Moh
amm
ed A
tiquz
zam
an, U
nive
rsity
of D
ayto
n,Em
ail:
atiq
@ie
ee.o
rg
�N
o co
nges
tion;
sou
rce
3 ge
nera
tes
exce
ssiv
e tr
affic
. (S
imila
r to
Cas
e 2
of G
uara
ntee
d Se
rvic
e)
�To
tal s
ourc
e ra
te is
1.7
Mb,
less
than
the
sche
dule
d ba
ndw
idth
(2M
b)
N
o co
nges
tion.
�So
urce
rate
of s
ourc
e 3
(0.7
Mb)
is g
reat
er th
an it
s bu
cket
ra
te (0
.5M
b)
S
ourc
e 3
gene
rate
s ex
cess
ive
traf
fic.
QoS
Obt
aine
d by
C
ontr
olle
d-lo
ad S
ervi
ce
8000
byte
s0.
5Mb
0.7M
bC
ontro
lled-
load
Ser
vice
380
00by
tes
0.5M
b0.
5Mb
Con
trolle
d-lo
ad S
ervi
ce4
0.5M
b
Sour
ce
Rat
e
0.5M
b
Toke
n R
ateR
esou
rce
Res
erva
tion
8000
byte
s
Buc
ket
Dep
th
Con
trolle
d-lo
ad S
ervi
ce
Sour
ce T
ype
2
Sour
ce
NO
.
NASA/TM—2001-210904 227

Moh
amm
ed A
tiquz
zam
an, U
nive
rsity
of D
ayto
n,Em
ail:
atiq
@ie
ee.o
rg
Goo
dput
of C
ontr
olle
d-lo
ad S
ervi
ce
�Si
mul
atio
n re
sults
: Goo
dput
of e
ach
Gua
rant
eed
Serv
ice
sour
ce.
�O
bser
vatio
ns:t
hego
odpu
tof e
ach
sour
ce i
s al
mos
t equ
al
to th
e co
rresp
ondi
ng s
ourc
e ra
te, w
hich
is d
iffer
ent f
rom
C
ase
2 of
Gua
rant
eed
serv
ice.
�Th
is is
bec
ause
the
non-
conf
orm
ant p
acke
ts a
re d
egra
ded
and
then
forw
arde
d. (P
ropo
sed
as o
ne o
f the
forw
ardi
ng
sche
me
for n
on-c
onfo
rman
t pac
kets
by
RFC
2211
)
700.
0140
33
499.
9889
44
499.
9889
22
Goo
dput
(Kb/
S)Fl
ow
IDSo
urce
N
o.
NASA/TM—2001-210904 228

Moh
amm
ed A
tiquz
zam
an, U
nive
rsity
of D
ayto
n,Em
ail:
atiq
@ie
ee.o
rg
Dro
p R
atio
of C
ontr
olle
d-lo
ad S
ervi
ce
�Si
mul
atio
n re
sults
: Dro
p ra
tio o
f G
uara
ntee
d Se
rvic
e tr
affic
(mea
sure
d at
sch
edul
er).
�O
bser
vatio
ns:s
ince
ther
e is
no
sign
ifica
nt c
onge
stio
n, th
e dr
op ra
tio is
zer
o.
0.00
00C
ontro
lled-
load
Ser
vice
Dro
p ra
tioTy
pe o
f tra
ffic
NASA/TM—2001-210904 229

Moh
amm
ed A
tiquz
zam
an, U
nive
rsity
of D
ayto
n,Em
ail:
atiq
@ie
ee.o
rg
Non
-con
form
ant R
atio
of
Con
trol
led-
load
Ser
vice
�Si
mul
atio
n re
sults
: non
-con
form
ant r
atio
of e
ach
Gua
rant
eed
Serv
ice
sour
ce.
�O
bser
vatio
ns:s
ince
sour
ce 3
gen
erat
es e
xces
sive
traf
fic,
its n
on-c
onfo
rman
t rat
io is
muc
h hi
gher
than
oth
er tw
o’s.
0.28
593
33
0.00
000
44
0.00
000
22
Non
-con
form
ant
Rat
ioFl
ow
IDSo
urce
N
o.
NASA/TM—2001-210904 230

Moh
amm
ed A
tiquz
zam
an, U
nive
rsity
of D
ayto
n,Em
ail:
atiq
@ie
ee.o
rg
Que
ue S
ize
Plot
Qu
eueS
izeV
S.T
ime
CL
(AF
11
)q.t
r
BE
(BE
)q.t
r
GL
(EF
)q.t
r
Qu
eu
eS
ize
Tim
e
0.0
00
0
0.5
00
0
1.0
00
0
1.5
00
0
2.0
00
0
2.5
00
0
3.0
00
0
3.5
00
0
4.0
00
0
4.5
00
0
5.0
00
0
0.0
00
02
0.0
00
04
0.0
00
06
0.0
00
08
0.0
00
01
00
.00
00
NASA/TM—2001-210904 231

Moh
amm
ed A
tiquz
zam
an, U
nive
rsity
of D
ayto
n,Em
ail:
atiq
@ie
ee.o
rg
Obs
erva
tions
�Th
e up
per b
ound
of q
ueui
ng d
elay
of G
uara
ntee
d Se
rvic
e is
gua
rant
eed.
In a
dditi
on, i
t alw
ays
has
the
smal
lest
jitte
r w
ithou
t bei
ng a
ffect
ed b
y ot
her t
raffi
c flo
ws.
�Th
e co
ntro
lled-
load
Ser
vice
has
the
smal
ler j
itter
and
qu
eue
size
than
the
best
effo
rt tra
ffic.
The
non
-con
form
ant
pack
ets
are
degr
aded
and
then
forw
arde
d.
NASA/TM—2001-210904 232

Moh
amm
ed A
tiquz
zam
an, U
nive
rsity
of D
ayto
n,Em
ail:
atiq
@ie
ee.o
rg
Con
clus
ion
�W
e ha
ve s
how
n th
at th
e en
d-to
-end
QoS
requ
irem
ents
of
IntS
erv
appl
icat
ions
can
be
succ
essf
ully
ach
ieve
d w
hen
IntS
erv
traf
fic is
map
ped
to th
e D
iffSe
rv d
omai
n in
the
next
gen
erat
ion
Inte
rnet
.
NASA/TM—2001-210904 233

Moh
amm
ed A
tiquz
zam
an, U
nive
rsity
of D
ayto
n,Em
ail:
atiq
@ie
ee.o
rg
Task
2
Inte
rcon
nect
ing
ATN
with
N
ext G
ener
atio
n In
tern
et
NASA/TM—2001-210904 234

Moh
amm
ed A
tiquz
zam
an, U
nive
rsity
of D
ayto
n,Em
ail:
atiq
@ie
ee.o
rg
QoS
Req
uire
men
ts o
f ATN
�To
car
ry ti
me
criti
cal i
nfor
mat
ion
requ
ired
for a
eron
autic
al
appl
icat
ions
, ATN
pro
vide
s di
ffere
nt Q
oS to
app
licat
ions
.
�In
the
ATN
, prio
rity
has
the
esse
ntia
l rol
e of
ens
urin
g th
at
high
prio
rity
safe
ty re
late
d an
d tim
e cr
itica
l dat
a ar
e no
t de
laye
d by
low
prio
rity
non-
safe
ty d
ata,
esp
ecia
lly w
hen
the
netw
ork
is o
verlo
aded
with
low
prio
rity
data
.
�Th
e tim
e cr
itica
l inf
orm
atio
n ca
rried
by
ATN
and
the
QoS
re
quire
d by
ATN
app
licat
ions
has
led
to th
e de
velo
pmen
t of
the
ATN
as
an e
xpen
sive
inde
pend
entn
etw
ork.
NASA/TM—2001-210904 235

Moh
amm
ed A
tiquz
zam
an, U
nive
rsity
of D
ayto
n,Em
ail:
atiq
@ie
ee.o
rg
ATN
& D
iffSe
rv
�Th
e la
rges
t pub
lic n
etw
ork,
Inte
rnet
, onl
y of
fers
bes
t-effo
rt se
rvic
e to
use
rs a
nd h
ence
is n
ot s
uita
ble
for c
arry
ing
time
criti
cal A
TN tr
affic
.
�Th
e ra
pid
com
mer
cial
izat
ion
of th
e In
tern
et h
as g
iven
rise
to
dem
ands
for Q
oS o
ver t
he In
tern
et.
�D
iffSe
rvha
s be
en p
ropo
sed
by IE
TF a
s on
e of
mod
els
to
mee
t the
dem
and
for Q
oS.
NASA/TM—2001-210904 236

Moh
amm
ed A
tiquz
zam
an, U
nive
rsity
of D
ayto
n,Em
ail:
atiq
@ie
ee.o
rg
Obj
ectiv
e
�To
inve
stig
ate
the
POSS
IBIL
ITY
of p
rovi
ding
QoS
to A
TN
appl
icat
ions
whe
n it
runs
ove
r Diff
Serv
bac
kbon
e in
the
next
gen
erat
ion
Inte
rnet
.
�To
pro
pose
a M
APPI
NG
FU
NC
TIO
Nto
run
ATN
ove
r the
D
iffSe
rv b
ackb
one.
�To
sho
w th
e SI
MU
LATI
ON
RES
ULT
Sus
ed to
pro
ve th
at
QoS
can
be
achi
eved
by
end
ATN
app
licat
ions
whe
n ru
nnin
g ov
er D
iffSe
rv b
ackb
one
in th
e ne
xt g
ener
atio
n In
tern
et.
NASA/TM—2001-210904 237

Moh
amm
ed A
tiquz
zam
an, U
nive
rsity
of D
ayto
n,Em
ail:
atiq
@ie
ee.o
rg
Sign
ifica
nce
�C
onsi
dera
ble
cost
sav
ings
cou
ld b
e po
ssib
leif
the
next
ge
nera
tion
Inte
rnet
bac
kbon
e ca
n be
use
d to
con
nect
ATN
su
bnet
wor
ks.
Ne
xt
Ge
ne
ratio
nIn
tern
et
AT
N
AT
ND
S E
dge R
oute
r
DS
Edge
Route
r
Air-G
round
Com
munic
ation
Air-G
round
Com
munic
ation
Gro
un
d-G
rou
nd
Co
mm
un
ica
tio
n
NASA/TM—2001-210904 238

Moh
amm
ed A
tiquz
zam
an, U
nive
rsity
of D
ayto
n,Em
ail:
atiq
@ie
ee.o
rg
Poss
ibili
ty o
f ATN
ove
r Diff
Serv
�Th
e D
iffSe
rv m
odel
util
izes
six
bits
in th
eTO
S(T
ype
of
Serv
ice)
fiel
d of
the
IP h
eade
r to
mar
k a
pack
et fo
r bei
ng
elig
ible
for a
par
ticul
ar fo
rwar
ding
beh
avio
r.
�Th
e N
PDU
(Net
wor
k Pr
otoc
ol D
ata
Uni
t) he
ader
of a
n AT
N
pack
et c
onta
ins
an o
ptio
n pa
rt in
clud
ing
an 8
-bit
field
na
med
Prio
rity
whi
ch in
dica
tes
the
rela
tive
prio
rity
of th
e N
PDU
.
�Th
e va
lue
0000
000
0in
dica
tes
norm
al p
riorit
y; th
e va
lues
00
00 0
001
thro
ugh
0000
111
0in
dica
te th
e pr
iorit
y in
an
incr
easi
ng o
rder
.
NASA/TM—2001-210904 239

Moh
amm
ed A
tiquz
zam
an, U
nive
rsity
of D
ayto
n,Em
ail:
atiq
@ie
ee.o
rg
Poss
ibili
ty o
f ATN
ove
r Diff
Serv
(C
ontin
ued)
�Th
e si
mila
rity
betw
een
an A
TN p
acke
t and
an
IP p
acke
t, sh
own
belo
w, p
rovi
des
the
poss
ibili
tyfo
r map
ping
ATN
to
Diff
Serv
to a
chie
ve th
e re
quire
d Q
oS w
hen
they
are
in
terc
onne
cted
.
Dat
a
Net
wor
k L
ayer
Len
gth
Indi
cato
r
Ver
sion
/Pro
toco
l ID
Lif
etim
e
SP
MS
E/R
Typ
e
Seg
men
t L
engt
h
Che
cksu
m
Des
tina
tion
Add
ress
L
engt
h In
dica
tor
Des
tina
tion
Add
ress
Sou
rce
Add
ress
Len
gth
Indi
cato
r
Sou
rce
Add
ress
Seg
men
t O
ffse
t
Tot
al L
engt
h
Opt
ions
Dat
a U
nit
Iden
tifi
er
AT
N P
acke
tIP
Pac
ket
Ver
sion
Fie
ld
Inte
rnet
Hea
der
Typ
e of
ser
vice
Tot
al L
engt
h
Iden
tifi
cati
on
0
D
F
MF
Fra
gmen
t O
ffse
t
Tim
e to
Liv
e
P
roto
col
Hea
der
chec
ksum
Sou
rce
Add
ress
Des
tina
tion
add
ress
Opt
ions
Fie
ld
Dat
a
Pri
orit
y
0 0
0 0
Pri
orit
y
1110
hig
h11
0111
0010
1110
1010
0110
0001
1101
1001
0101
0000
1100
1000
01-l
ow00
00-n
orm
al
NASA/TM—2001-210904 240

Moh
amm
ed A
tiquz
zam
an, U
nive
rsity
of D
ayto
n,Em
ail:
atiq
@ie
ee.o
rg
Map
ping
Con
side
ratio
n
�Th
e PH
B tre
atm
ent o
f pac
kets
alo
ng th
e pa
th in
the
Diff
Serv
dom
ain
mus
t app
roxi
mat
e th
e Q
oS o
ffere
d in
the
ATN
net
wor
k.
NASA/TM—2001-210904 241

Moh
amm
ed A
tiquz
zam
an, U
nive
rsity
of D
ayto
n,Em
ail:
atiq
@ie
ee.o
rgMap
ping
Fun
ctio
n
�W
e m
ap th
e no
rmal
prio
rity
(indi
cate
d by
Prio
rity
field
in
NPD
U) i
n AT
N d
omai
n to
BE
PHB
in D
iffSe
rv d
omai
n;
�M
ap th
e hi
gh p
riorit
yin
ATN
dom
ain
to E
FPH
B in
D
iffSe
rv d
omai
n;
�M
ap th
e m
ediu
m p
riorit
ies
in A
TN d
omai
n to
the
corre
spon
ding
cla
sses
of A
FPH
Bs in
Diff
Serv
dom
ain.
NASA/TM—2001-210904 242

Moh
amm
ed A
tiquz
zam
an, U
nive
rsity
of D
ayto
n,Em
ail:
atiq
@ie
ee.o
rg
An
Exam
ple
Map
ping
Fun
ctio
n
�An
exa
mpl
e m
appi
ng fu
nctio
n us
ed in
our
sim
ulat
ion
1011
10EF
Hig
h00
0011
1000
1010
AF11
Med
ium
0000
011
100
0000
BEN
orm
al00
00 0
000
DSC
PPH
BPr
iorit
yA
TN P
riorit
y C
ode
NASA/TM—2001-210904 243

Moh
amm
ed A
tiquz
zam
an, U
nive
rsity
of D
ayto
n,Em
ail:
atiq
@ie
ee.o
rg
Sim
ulat
ion
Con
figur
atio
ns
�Si
mul
atio
n to
ol: B
erke
ley
nsV2
.1b6
�Si
mul
atio
n co
nfig
urat
ion. D
SR
oute
rD
SR
oute
r5M
b,1
ms
2Mb, 0.1ms
2Mb, 0.1ms
2Mb,
0.1ms
2M
b,
0.1
ms
2Mb, 0.1ms
2Mb, 0.1ms
2Mb, 0.1ms
2Mb,
0.1m
s
2 A
TN
Sourc
es
with
Priority
Code:
0000 1
110
3 A
TN
Sourc
es
with
Priority
Code:
0000 0
111
5 A
TN
Sourc
es
with
Priority
Code:
0000 0
000
AT
N S
inks
AT
N S
ou
rce
s
0 1 2 4 5 9
0 1 2 4 5 9
NASA/TM—2001-210904 244

Moh
amm
ed A
tiquz
zam
an, U
nive
rsity
of D
ayto
n,Em
ail:
atiq
@ie
ee.o
rg
Sim
ulat
ion
Con
figur
atio
ns (C
ontin
ued)
�W
e in
tegr
ated
the
map
ping
func
tion
into
the
edge
Diff
Serv
ro
uter
. (R
ecal
l)
Qu
eu
ein
g
MF
Cla
ssifi
er
Ma
rke
rM
ap
pin
gF
un
ctio
nT
raff
icC
on
diti
on
er
Tra
ffic
Me
ter
Ing
ress
Ro
ute
rC
ore
Ro
ute
r
BA
Cla
ssifi
er
NASA/TM—2001-210904 245

Moh
amm
ed A
tiquz
zam
an, U
nive
rsity
of D
ayto
n,Em
ail:
atiq
@ie
ee.o
rg
�Ta
ble
belo
w s
how
s th
e co
nfig
urat
ion
of q
ueue
s in
side
the
core
Diff
Serv
rout
er.
Sinc
e th
e ba
ndw
idth
of b
ottle
neck
link
is 5
Mb,
the
abov
e sc
hedu
ling
wei
ght i
mpl
ies
band
wid
th o
f�
EF: 2
Mb
�AF
: 2M
b�
BE: 1
Mb
Sim
ulat
ion
Con
figur
atio
ns (C
ontin
ued)
0.2
RED
BE
Que
ue0.
4R
IOAF
Que
ue0.
4PQ
-Tai
l dro
pEF
Que
ueQ
ueue
wei
ght
Que
ue T
ype
NASA/TM—2001-210904 246

Moh
amm
ed A
tiquz
zam
an, U
nive
rsity
of D
ayto
n,Em
ail:
atiq
@ie
ee.o
rg
Perf
orm
ance
Crit
eria
�G
oodp
utof
eac
h AT
N s
ourc
e.
�Q
ueue
siz
e of
eac
h qu
eue.
�D
rop
ratio
at s
ched
uler
.
NASA/TM—2001-210904 247

Moh
amm
ed A
tiquz
zam
an, U
nive
rsity
of D
ayto
n,Em
ail:
atiq
@ie
ee.o
rg
�C
ase
1: N
o co
nges
tion.
�Th
e am
ount
of t
raffi
c w
ith d
iffer
ent p
riorit
ies
are
equa
l to
the
corre
spon
ding
sch
edul
ed li
nk b
andw
idth
N
o co
nges
tion.QoS
Obt
aine
d by
ATN
App
licat
ions
: C
ase
1
0.66
6Mb
Med
ium
Prio
rity
2, 3
, 41M
bH
igh
Prio
rity
0, 1
0.2M
b
Sour
ce
Rat
e
Nor
mal
Prio
rity
Sour
ce T
ype
5,6,
7,8,
9
Sour
ce
NO
.
NASA/TM—2001-210904 248

Moh
amm
ed A
tiquz
zam
an, U
nive
rsity
of D
ayto
n,Em
ail:
atiq
@ie
ee.o
rg
Goo
dput
of A
TN A
pplic
atio
ns:
Cas
e 1
�R
esul
ts o
f Cas
e 1:
Goo
dput
of e
ach
ATN
sou
rce. 19
9.48
200.
0019
9.65
200.
00Sr
c 5
Nor
mal
201.
9820
0.00
201.
8520
0.00
Src
620
1.68
200.
0020
2.42
200.
00Sr
c 7
200.
467
199.
9819
9.88
199.
98Sr
c 8
196.
3920
0.00
196.
2020
0.00
Src
9
668.
4766
8.24
666.
6666
6.66
Src
266
7.53
667.
3466
6.66
666.
66Sr
c 3
999.
9999
9.99
999.
9999
9.99
Src
0
663.
9966
4.42
666.
6666
6.66
Src
4M
ediu
m
999.
99
Cas
e 3
(Kb/
S)
999.
99
Cas
e 4
(Kb/
S)So
urce
Prio
rity
999.
9999
9.99
Src
1H
igh
Cas
e 2
(Kb/
S)C
ase
1 (K
b/S)
NASA/TM—2001-210904 249

Moh
amm
ed A
tiquz
zam
an, U
nive
rsity
of D
ayto
n,Em
ail:
atiq
@ie
ee.o
rg
Dro
p R
atio
of A
TN A
pplic
atio
ns: C
ase
1
�Si
mul
atio
n re
sults
of C
ase
1: D
rop
ratio
of
ATN
traf
fic
(mea
sure
d at
sch
edul
er).
�O
bser
vatio
ns:s
ince
ther
e is
no
sign
ifica
nt c
onge
stio
n, th
e dr
op ra
tio is
zer
o.
0.00
0.00
0.00
0.00
Hig
h Pr
iorit
y Tr
affic
0.49
0.49
0.00
0.00
Med
ium
Prio
rity
Traf
fic
0.00
Cas
e 3
0.67
Cas
e 4
0.67
0.00
Nor
mal
Prio
rity
Traf
fic
Cas
e 2
Cas
e 1
Type
of t
raffi
c
NASA/TM—2001-210904 250

Moh
amm
ed A
tiquz
zam
an, U
nive
rsity
of D
ayto
n,Em
ail:
atiq
@ie
ee.o
rg
Que
ue S
ize
Plot
: Cas
e 1
Qu
eu
eS
izeV
S.T
ime
01
11
(AF
)q.t
r
00
00
(BE
)q.t
r
11
10
(EF
)q.t
r
Queu
eS
ize
Tim
e
0.0
00
0
0.5
00
0
1.0
00
0
1.5
00
0
2.0
00
0
2.5
00
0
3.0
00
0
3.5
00
0
4.0
00
0
4.5
00
0
5.0
00
0
0.0
00
02
0.0
00
04
0.0
00
06
0.0
00
08
0.0
00
01
00
.00
00
NASA/TM—2001-210904 251

Moh
amm
ed A
tiquz
zam
an, U
nive
rsity
of D
ayto
n,Em
ail:
atiq
@ie
ee.o
rg
Que
ue S
ize
Plot
: Cas
e 1
(Con
tinue
d)
�O
bser
vatio
ns:s
ince
Cas
e 1
is a
idea
l cas
e, th
e av
erag
e si
ze o
f eac
h qu
eue
is v
ery
smal
l. BE
que
ue h
as th
e la
rges
t jit
ter.
NASA/TM—2001-210904 252

Moh
amm
ed A
tiquz
zam
an, U
nive
rsity
of D
ayto
n,Em
ail:
atiq
@ie
ee.o
rg
�C
ase
2: N
orm
al P
riorit
y tr
affic
get
s in
toco
nges
tion.
�Th
e am
ount
of t
raffi
c w
ith N
orm
al P
riorit
y (3
Mb)
is g
reat
er
than
the
corre
spon
ding
sch
edul
ed li
nk b
andw
idth
(1 M
b)
Nor
mal
Prio
rity
traf
fic g
ets
into
cong
estio
n.
QoS
Obt
aine
d by
ATN
App
licat
ions
: C
ase
2
0.66
6Mb
Med
ium
Prio
rity
2, 3
, 41M
bH
igh
Prio
rity
0, 1
0.6M
b
Sour
ce
Rat
e
Nor
mal
Prio
rity
Sour
ce T
ype
5,6,
7,8,
9
Sour
ce
NO
.
NASA/TM—2001-210904 253

Moh
amm
ed A
tiquz
zam
an, U
nive
rsity
of D
ayto
n,Em
ail:
atiq
@ie
ee.o
rg
Goo
dput
of A
TN A
pplic
atio
ns: C
ase
2
�R
esul
ts o
f Cas
e 2:
Goo
dput
of e
ach
ATN
sou
rce. 199.
4790
200.
0039
199.
6469
200.
0039
Src
5
Nor
mal
201.
9780
200.
0039
201.
8520
200.
0039
Src
620
1.68
4020
0.00
3920
2.41
9020
0.00
39Sr
c 7
200.
4660
199.
9830
199.
8779
199.
9830
Src
819
6.39
2020
0.00
3919
6.20
3020
0.00
39Sr
c 9
668.
4719
668.
2409
666.
6660
666.
6660
Src
266
7.52
7066
7.33
7966
6.66
6066
6.66
60Sr
c 3
999.
9990
999.
9990
999.
9990
999.
9990
Src
0
663.
9990
664.
4189
666.
6660
666.
6660
Src
4M
ediu
m
999.
9990
Cas
e 3
(Kb/
S)
999.
9990
Cas
e 4
(Kb/
S)So
urce
s
999.
9990
999.
9990
Src
1H
igh
Cas
e 2
(Kb/
S)C
ase
1 (K
b/S)
NASA/TM—2001-210904 254

Moh
amm
ed A
tiquz
zam
an, U
nive
rsity
of D
ayto
n,Em
ail:
atiq
@ie
ee.o
rg
Dro
p R
atio
of A
TN A
pplic
atio
ns: C
ase
2
�Si
mul
atio
n re
sults
of C
ase
2: D
rop
ratio
of
ATN
traf
fic
(mea
sure
d at
sch
edul
er).
�O
bser
vatio
ns:t
he d
rop
ratio
of N
orm
al P
riorit
y tra
ffic
is
incr
ease
d.
0.00
000
0.00
000
0.00
000
0.00
000
Hig
h Pr
iorit
y Tr
affic
0.49
982
0.49
982
0.00
000
0.00
000
Med
ium
Prio
rity
Traf
fic
0.00
000
Cas
e 3
0.66
562
Cas
e 4
0.66
564
0.00
000
Nor
mal
Prio
rity
Traf
fic
Cas
e 2
Cas
e 1
Type
of t
raffi
c
NASA/TM—2001-210904 255

Moh
amm
ed A
tiquz
zam
an, U
nive
rsity
of D
ayto
n,Em
ail:
atiq
@ie
ee.o
rg
Que
ue S
ize
Plot
: Cas
e 2
Qu
eueS
izeV
S.T
ime
01
11
(AF
)q.t
r
00
00
(BE
)q.t
r
11
10
(EF
)q.t
r
Qu
eueS
ize
Tim
e
0.0
00
0
10
.00
00
20
.00
00
30
.00
00
40
.00
00
50
.00
00
60
.00
00
70
.00
00
80
.00
00
90
.00
00
10
0.0
00
0
11
0.0
00
0
12
0.0
00
0
13
0.0
00
0
14
0.0
00
0
15
0.0
00
0
16
0.0
00
0
17
0.0
00
0
18
0.0
00
0
19
0.0
00
0
20
0.0
00
0
0.0
00
02
0.0
00
04
0.0
00
06
0.0
00
08
0.0
00
01
00
.00
00
NASA/TM—2001-210904 256

Moh
amm
ed A
tiquz
zam
an, U
nive
rsity
of D
ayto
n,Em
ail:
atiq
@ie
ee.o
rg
Que
ue S
ize
Plot
: Cas
e 2
(Con
tinue
d)
�O
bser
vatio
ns:
�In
this
cas
e, th
e hi
gh p
riorit
y tra
ffic
has
the
smal
lest
av
erag
e qu
eue
size
and
jitte
r;
�Th
e no
rmal
prio
rity
traffi
c ha
s th
e bi
gges
t ave
rage
qu
eue
size
and
jitte
r.
NASA/TM—2001-210904 257

Moh
amm
ed A
tiquz
zam
an, U
nive
rsity
of D
ayto
n,Em
ail:
atiq
@ie
ee.o
rg
�C
ase
3: M
ediu
m P
riorit
y tr
affic
get
s in
toco
nges
tion.
�Th
e am
ount
of t
raffi
c w
ith M
ediu
m P
riorit
y (4
Mb)
is g
reat
er
than
the
corre
spon
ding
sch
edul
ed li
nk b
andw
idth
(2 M
b)
Med
ium
Prio
rity
traf
fic g
ets
into
cong
estio
n.
QoS
Obt
aine
d by
ATN
App
licat
ions
: C
ase
3
1.33
3Mb
Med
ium
Prio
rity
2, 3
, 41M
bH
igh
Prio
rity
0, 1
0.2M
b
Sour
ce
Rat
e
Nor
mal
Prio
rity
Sour
ce T
ype
5,6,
7,8,
9
Sour
ce
NO
.
NASA/TM—2001-210904 258

Moh
amm
ed A
tiquz
zam
an, U
nive
rsity
of D
ayto
n,Em
ail:
atiq
@ie
ee.o
rg
Goo
dput
of A
TN A
pplic
atio
ns: C
ase
3
�R
esul
ts o
f Cas
e 3:
Goo
dput
of e
ach
ATN
sou
rce. 199.
4790
200.
0039
199.
6469
200.
0039
Src
5
Nor
mal
201.
9780
200.
0039
201.
8520
200.
0039
Src
620
1.68
4020
0.00
3920
2.41
9020
0.00
39Sr
c 7
200.
4660
199.
9830
199.
8779
199.
9830
Src
819
6.39
2020
0.00
3919
6.20
3020
0.00
39Sr
c 9
668.
4719
668.
2409
666.
6660
666.
6660
Src
266
7.52
7066
7.33
7966
6.66
6066
6.66
60Sr
c 3
999.
9990
999.
9990
999.
9990
999.
9990
Src
0
663.
9990
664.
4189
666.
6660
666.
6660
Src
4M
ediu
m
999.
9990
Cas
e 3
(Kb/
S)
999.
9990
Cas
e 4
(Kb/
S)So
urce
s
999.
9990
999.
9990
Src
1H
igh
Cas
e 2
(Kb/
S)C
ase
1 (K
b/S)
NASA/TM—2001-210904 259

Moh
amm
ed A
tiquz
zam
an, U
nive
rsity
of D
ayto
n,Em
ail:
atiq
@ie
ee.o
rg
Dro
p R
atio
of A
TN A
pplic
atio
ns: C
ase
3
�Si
mul
atio
n re
sults
of C
ase
3: D
rop
ratio
of
ATN
traf
fic
(mea
sure
d at
sch
edul
er).
�O
bser
vatio
ns:t
he d
rop
ratio
of M
ediu
m P
riorit
y tra
ffic
is
incr
ease
d.
0.00
000
0.00
000
0.00
000
0.00
000
Hig
h Pr
iorit
y Tr
affic
0.49
982
0.49
982
0.00
000
0.00
000
Med
ium
Prio
rity
Traf
fic
0.00
000
Cas
e 3
0.66
562
Cas
e 4
0.66
564
0.00
000
Nor
mal
Prio
rity
Traf
fic
Cas
e 2
Cas
e 1
Type
of t
raffi
c
NASA/TM—2001-210904 260

Moh
amm
ed A
tiquz
zam
an, U
nive
rsity
of D
ayto
n,Em
ail:
atiq
@ie
ee.o
rg
Que
ue S
ize
Plot
: Cas
e 3
Qu
eueS
izeV
S.T
ime
0111(A
F)q
.tr
0000(B
E)q
.tr
1110(E
F)q
.tr
Queu
eSiz
e
Tim
e
0.0
000
5.0
000
10.0
000
15.0
000
20.0
000
25.0
000
30.0
000
35.0
000
40.0
000
45.0
000
0.0
000
20.0
000
40.0
000
60.0
000
80.0
000
100.0
00
0
NASA/TM—2001-210904 261

Moh
amm
ed A
tiquz
zam
an, U
nive
rsity
of D
ayto
n,Em
ail:
atiq
@ie
ee.o
rg
Que
ue S
ize
Plot
: Cas
e 3
(Con
tinue
d)
�O
bser
vatio
ns:
�Th
e hi
gh p
riorit
y tra
ffic
has
the
smal
lest
ave
rage
que
ue
size
and
jitte
r.
�N
ote
that
bot
h th
e qu
eue
size
and
jitte
r of m
ediu
m
prio
rity
traffi
c ar
e gr
eate
r tha
n th
e ot
her t
wo’
s.
NASA/TM—2001-210904 262

Moh
amm
ed A
tiquz
zam
an, U
nive
rsity
of D
ayto
n,Em
ail:
atiq
@ie
ee.o
rg
�C
ase
4: B
oth
Med
ium
and
Nor
mal
Prio
rity
traf
fic g
ets
into
cong
estio
n.
�Th
e am
ount
of t
raffi
c w
ith b
oth
Med
ium
(4M
b) a
nd N
orm
al
Prio
rity
(3M
b) is
gre
ater
than
the
corre
spon
ding
sch
edul
ed
link
band
wid
th (2
Mb,
1M
b)
B
oth
Med
ium
and
Nor
mal
Pr
iorit
y tr
affic
get
s in
toco
nges
tion.
QoS
Obt
aine
d by
ATN
App
licat
ions
: C
ase
4
1.33
3Mb
Med
ium
Prio
rity
2, 3
, 41M
bH
igh
Prio
rity
0, 1
0.6M
b
Sour
ce
Rat
e
Nor
mal
Prio
rity
Sour
ce T
ype
5,6,
7,8,
9
Sour
ce
NO
.
NASA/TM—2001-210904 263

Moh
amm
ed A
tiquz
zam
an, U
nive
rsity
of D
ayto
n,Em
ail:
atiq
@ie
ee.o
rg
Goo
dput
of A
TN A
pplic
atio
ns: C
ase
4
�R
esul
ts o
f Cas
e 4:
Goo
dput
of e
ach
ATN
sou
rce. 199.
4790
200.
0039
199.
6469
200.
0039
Src
5
Nor
mal
201.
9780
200.
0039
201.
8520
200.
0039
Src
620
1.68
4020
0.00
3920
2.41
9020
0.00
39Sr
c 7
200.
4660
199.
9830
199.
8779
199.
9830
Src
819
6.39
2020
0.00
3919
6.20
3020
0.00
39Sr
c 9
668.
4719
668.
2409
666.
6660
666.
6660
Src
266
7.52
7066
7.33
7966
6.66
6066
6.66
60Sr
c 3
999.
9990
999.
9990
999.
9990
999.
9990
Src
0
663.
9990
664.
4189
666.
6660
666.
6660
Src
4M
ediu
m
999.
9990
Cas
e 3
(Kb/
S)
999.
9990
Cas
e 4
(Kb/
S)So
urce
s
999.
9990
999.
9990
Src
1H
igh
Cas
e 2
(Kb/
S)C
ase
1 (K
b/S)
NASA/TM—2001-210904 264

Moh
amm
ed A
tiquz
zam
an, U
nive
rsity
of D
ayto
n,Em
ail:
atiq
@ie
ee.o
rg
Dro
p R
atio
of A
TN A
pplic
atio
ns: C
ase
4
�Si
mul
atio
n re
sults
of C
ase
4: D
rop
ratio
of
ATN
traf
fic
(mea
sure
d at
sch
edul
er).
�O
bser
vatio
ns:t
he d
rop
ratio
of b
oth
Med
ium
and
Nor
mal
Pr
iorit
y tra
ffic
are
incr
ease
d.
0.00
000
0.00
000
0.00
000
0.00
000
Hig
h Pr
iorit
y Tr
affic
0.49
982
0.49
982
0.00
000
0.00
000
Med
ium
Prio
rity
Traf
fic
0.00
000
Cas
e 3
0.66
562
Cas
e 4
0.66
564
0.00
000
Nor
mal
Prio
rity
Traf
fic
Cas
e 2
Cas
e 1
Type
of t
raffi
c
NASA/TM—2001-210904 265

Moh
amm
ed A
tiquz
zam
an, U
nive
rsity
of D
ayto
n,Em
ail:
atiq
@ie
ee.o
rg
Que
ue S
ize
Plot
: Cas
e 4
Qu
eueS
izeV
S.T
ime
0111(A
F)q
.tr
0000(B
E)q
.tr
1110(E
F)q
.tr
Qu
eueS
ize
Tim
e
0.0
00
0
10
.00
00
20
.00
00
30
.00
00
40
.00
00
50
.00
00
60
.00
00
70
.00
00
80
.00
00
90
.00
00
10
0.0
00
0
11
0.0
00
0
12
0.0
00
0
13
0.0
00
0
14
0.0
00
0
15
0.0
00
0
16
0.0
00
0
17
0.0
00
0
18
0.0
00
0
19
0.0
00
0
20
0.0
00
0
0.0
00
02
0.0
00
04
0.0
00
06
0.0
00
08
0.0
00
01
00
.00
00
NASA/TM—2001-210904 266

Moh
amm
ed A
tiquz
zam
an, U
nive
rsity
of D
ayto
n,Em
ail:
atiq
@ie
ee.o
rg
Que
ue S
ize
Plot
: Cas
e 4
�O
bser
vatio
ns:
�In
this
cas
e, th
e hi
gh p
riorit
y tra
ffic
has
the
smal
lest
av
erag
e qu
eue
size
and
jitte
r;
�Th
e no
rmal
prio
rity
traffi
c ha
s th
e bi
gges
t ave
rage
qu
eue
size
and
jitte
r.
NASA/TM—2001-210904 267
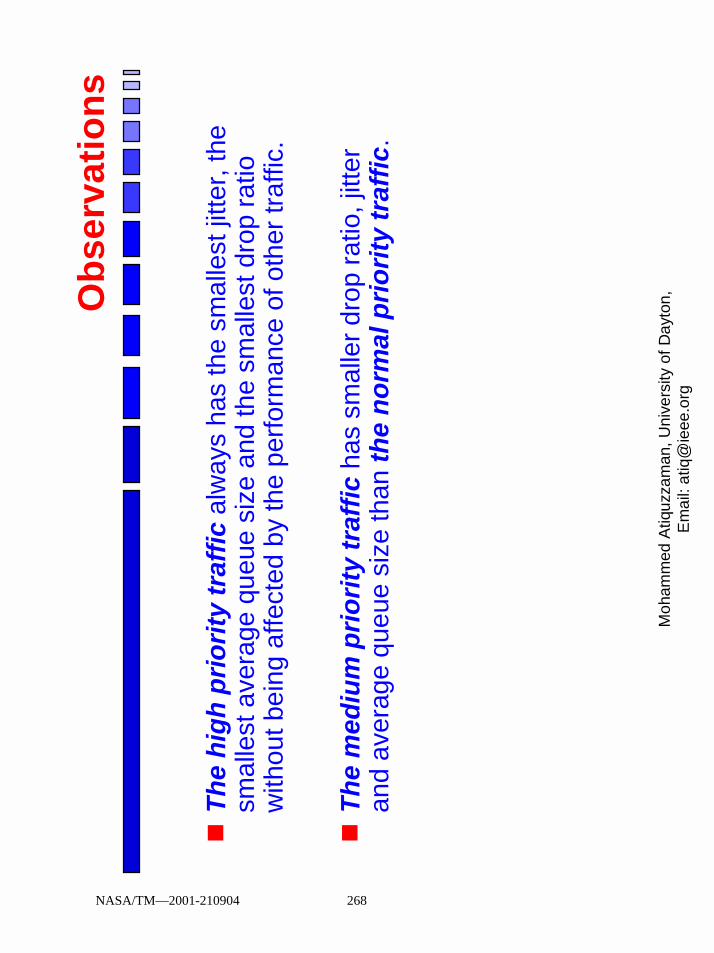
Moh
amm
ed A
tiquz
zam
an, U
nive
rsity
of D
ayto
n,Em
ail:
atiq
@ie
ee.o
rg
Obs
erva
tions
�Th
e hi
gh p
riorit
y tr
affic
alw
ays
has
the
smal
lest
jitte
r, th
e sm
alle
st a
vera
ge q
ueue
siz
e an
d th
e sm
alle
st d
rop
ratio
w
ithou
t bei
ng a
ffect
ed b
y th
e pe
rform
ance
of o
ther
traf
fic.
�Th
e m
ediu
m p
riorit
y tr
affic
has
smal
ler d
rop
ratio
, jitt
er
and
aver
age
queu
e si
ze th
an th
e no
rmal
prio
rity
traf
fic.
NASA/TM—2001-210904 268

Moh
amm
ed A
tiquz
zam
an, U
nive
rsity
of D
ayto
n,Em
ail:
atiq
@ie
ee.o
rg
Con
clus
ion
�Th
e hi
gh p
riorit
y tra
ffic
rece
ives
the
high
est p
riorit
y; th
e m
ediu
m p
riorit
y tra
ffic
rece
ives
hig
her p
riorit
y th
an n
orm
al
prio
rity
traffi
c.
�Ac
cord
ing
to o
ur s
imul
atio
n, th
e Q
oS re
quire
men
ts o
f ATN
ap
plic
atio
ns c
an b
e su
cces
sful
ly a
chie
ved
whe
n AT
N tr
affic
is
map
ped
to th
e D
iffSe
rv d
omai
n in
the
next
gen
erat
ion
Inte
rnet
.
NASA/TM—2001-210904 269

Moh
amm
ed A
tiquz
zam
an, U
nive
rsity
of D
ayto
n,Em
ail:
atiq
@ie
ee.o
rg
Task
3
QoS
in D
iffSe
rv
over
ATM
NASA/TM—2001-210904 270

Moh
amm
ed A
tiquz
zam
an, U
nive
rsity
of D
ayto
n,Em
ail:
atiq
@ie
ee.o
rg
Prio
ritiz
ed E
PD
�D
S se
rvic
e cl
asse
s ca
n us
e th
e C
LP b
it of
ATM
cel
l hea
der
to p
rovi
de s
ervi
ce d
iffer
entia
tion.
�EP
D d
oes
not c
onsi
der t
he p
riorit
y of
cel
ls.
�Pr
iorit
ized
EPD
can
be
used
to p
rovi
de s
ervi
ce
disc
rimin
atio
n.�
Two
thre
shol
ds a
re u
sed
to d
rop
cells
dep
endi
ng o
n th
e C
LP b
it.
NASA/TM—2001-210904 271

Moh
amm
ed A
tiquz
zam
an, U
nive
rsity
of D
ayto
n,Em
ail:
atiq
@ie
ee.o
rg
Buf
fer M
anag
emen
t Sch
emes
�EP
D�
PEPD
0N
µλ
TH
TLT
0N
µλ
•QL
< T Ac
cept
all
pack
ets.
•T ≤
QL
< N
Dis
card
all
new
inco
min
g pa
cket
s.
•QL
≥N •D
isca
rd a
ll.
•QL
<LT Ac
cept
all
pack
ets.
•LT
≤Q
L <
HT
Dis
card
all
new
low
prio
rity
pack
ets.
•HT
≤Q
L <
N
Dis
card
all
new
pac
kets
QL
≥N •D
isca
rd a
ll pa
cket
s
NASA/TM—2001-210904 272

Moh
amm
ed A
tiquz
zam
an, U
nive
rsity
of D
ayto
n,Em
ail:
atiq
@ie
ee.o
rg
OPN
ET S
imul
atio
n C
onfig
urat
ion
PEPD
app
lied
NASA/TM—2001-210904 273

Moh
amm
ed A
tiquz
zam
an, U
nive
rsity
of D
ayto
n,Em
ail:
atiq
@ie
ee.o
rg
DS-
ATM
Pro
toco
l Sta
ck
�AA
L La
yer m
arks
the
End
of P
acke
t.
�AT
M_l
ayer
cha
nges
the
CLP
bit
depe
ndin
g on
the
pack
et o
f the
DS
serv
ice.
NASA/TM—2001-210904 274

Moh
amm
ed A
tiquz
zam
an, U
nive
rsity
of D
ayto
n,Em
ail:
atiq
@ie
ee.o
rg
ATM
Sw
itch
Nod
e
�Su
ppor
t ser
vice
di
ffere
ntia
tion
in th
e AT
M
switc
h bu
ffer.
�C
hang
e th
e bu
ffer
man
agem
ent s
chem
e in
th
e AT
M_s
witc
h pr
oces
s to
Prio
ritiz
ed E
PD.
NASA/TM—2001-210904 275

Moh
amm
ed A
tiquz
zam
an, U
nive
rsity
of D
ayto
n,Em
ail:
atiq
@ie
ee.o
rg
ATM
_Sw
itch
Proc
ess
Impl
emen
ts th
e PE
PD b
uffe
r man
agem
ent t
o su
ppor
t ser
vice
diff
eren
tiatio
n.
NASA/TM—2001-210904 276

Moh
amm
ed A
tiquz
zam
an, U
nive
rsity
of D
ayto
n,Em
ail:
atiq
@ie
ee.o
rg
Sour
ce R
ates
NASA/TM—2001-210904 277

Moh
amm
ed A
tiquz
zam
an, U
nive
rsity
of D
ayto
n,Em
ail:
atiq
@ie
ee.o
rg
Cel
l Dro
ppin
g
NASA/TM—2001-210904 278

Moh
amm
ed A
tiquz
zam
an, U
nive
rsity
of D
ayto
n,Em
ail:
atiq
@ie
ee.o
rg
Thro
ughp
ut
NASA/TM—2001-210904 279

Moh
amm
ed A
tiquz
zam
an, U
nive
rsity
of D
ayto
n,Em
ail:
atiq
@ie
ee.o
rgQue
ue O
ccup
ancy
NASA/TM—2001-210904 280

Moh
amm
ed A
tiquz
zam
an, U
nive
rsity
of D
ayto
n,Em
ail:
atiq
@ie
ee.o
rg
Con
clus
ion
�Pr
iorit
ized
EPD
can
prov
ide
diffe
rent
ial t
reat
men
t to
pack
ets
in a
n AT
M c
ore
netw
ork.
�O
VER
ALL:
The
task
s ha
ve b
een
com
plet
ed s
ucce
ssfu
lly.
�Th
anks
to N
ASA
for t
he s
uppo
rt of
this
pro
ject
.
NASA/TM—2001-210904 281


Arj
an D
urre
siT
he O
hio
Stat
e U
nive
rsity
QoS
QoS
for
Rea
l Tim
e A
pplic
atio
ns
for
Rea
l Tim
e A
pplic
atio
ns
over
Nex
t Gen
erat
ion
Dat
a ov
er N
ext G
ener
atio
n D
ata
Net
wor
ksN
etw
orks
Dr.
Arj
an D
urre
si
The
Ohi
o St
ate
Uni
vers
ityC
olum
bus,
OH
432
10du
rres
i@ci
s.oh
io-s
tate
.edu
The
se s
lides
are
ava
ilabl
e at
http
://w
ww
.cis
.ohi
o-st
ate.
edu/
~dur
resi
/talk
s/na
sa1.
htm
NASA/TM—2001-210904 283

Arj
an D
urre
siT
he O
hio
Stat
e U
nive
rsity
Ove
rvie
wO
verv
iew
!T
ask
4: Im
prov
ing
Exp
licit
Con
gest
ion
Not
ific
atio
n w
ith th
e M
ark-
Fron
t Str
ateg
y
!T
ask
5: M
ultip
lexi
ng V
BR
ove
r VB
R
!T
ask
6: A
chie
ving
QoS
for T
CP
traf
fic
in S
atel
lite
Net
wor
ks w
ith D
iffe
rent
iate
d Se
rvic
es
NASA/TM—2001-210904 284

Arj
an D
urre
siT
he O
hio
Stat
e U
nive
rsity
Tas
k 4:
Buf
fer
Man
agem
ent u
sing
EC
NT
ask
4: B
uffe
r M
anag
emen
t usi
ng E
CN
!E
xplic
it C
onge
stio
n N
otif
icat
ion
!St
anda
rdiz
ed in
RFC
248
1, e
xpec
ted
to b
e w
idel
y im
plem
ente
d so
on.
!T
wo
bits
in IP
hea
der:
Con
gest
ion
Exp
erie
nced
, EC
N
Cap
able
Tra
nspo
rt!
Tw
o bi
ts in
TC
P he
ader
: EC
N E
cho,
Con
gest
ion
Win
dow
Red
uced
Des
tinat
ion
Des
tinat
ion
Sour
ceSo
urce
NASA/TM—2001-210904 285

Arj
an D
urre
siT
he O
hio
Stat
e U
nive
rsity
RE
D M
arki
ng a
nd D
ropp
ing
RE
D M
arki
ng a
nd D
ropp
ing
!N
o st
anda
rd a
ctio
n sp
ecif
ied
!O
ne p
ossi
bilit
y is
to ra
ndom
ly m
ark
at lo
wer
co
nges
tion
leve
ls. R
ando
m E
arly
Det
ectio
n (R
ED
) m
arki
ng in
stea
d of
dro
ppin
g.m
arki
ngpr
obab
ility
queu
e si
ze
no a
ctio
nm
arki
ngdr
oppi
ng
pmax
back
th_m
inth
_max
NASA/TM—2001-210904 286

Arj
an D
urre
siT
he O
hio
Stat
e U
nive
rsity
Sim
ulat
ion
Mod
elSi
mul
atio
n M
odel
TC
P se
nder
sT
CP
rece
iver
s
rout
erro
uter
NASA/TM—2001-210904 287

Arj
an D
urre
siT
he O
hio
Stat
e U
nive
rsity
Thr
esho
ld &
Buf
fer
Req
uire
men
tT
hres
hold
& B
uffe
r R
equi
rem
ent
!In
ord
er to
ach
ieve
full
link
utili
zatio
n an
d ze
ro p
acke
t lo
ss, E
CN
rout
ers
shou
ld!
have
a b
uffe
r siz
e of
thre
e tim
es th
e ba
ndw
idth
de
lay
prod
uct;
!se
t the
thre
shol
d as
1/3
of t
he b
uffe
r siz
e;!
Any
sm
alle
r buf
fer s
ize
will
resu
lt in
pac
ket l
oss.
!A
ny s
mal
ler t
hres
hold
will
resu
lt in
link
idlin
g.!
Any
larg
er th
resh
old
will
resu
lt in
unn
eces
sary
del
ay.
NASA/TM—2001-210904 288

Arj
an D
urre
siT
he O
hio
Stat
e U
nive
rsitySe
ttin
g th
e T
hres
hold
Sett
ing
the
Thr
esho
ld
Thr
esho
ld
T=
rd
Link Utilization
NASA/TM—2001-210904 289

Arj
an D
urre
siT
he O
hio
Stat
e U
nive
rsity
Buf
fer
Req
uire
men
t for
No
Los
sB
uffe
r R
equi
rem
ent f
or N
o L
oss
Thr
esho
ldtheo
retic
alsi
mul
atio
n
�
ECN buffer size requirement
NASA/TM—2001-210904 290

Arj
an D
urre
siT
he O
hio
Stat
e U
nive
rsityPro
blem
wit
h M
ark
Tai
lP
robl
em w
ith
Mar
k T
ail
!C
urre
nt E
CN
mar
ks p
acke
ts a
t the
tail
of th
e qu
eue:
!co
nges
tion
sign
als
suff
er th
e sa
me
dela
y as
dat
a;!
whe
n co
nges
tion
is m
ore
seve
re, t
he E
CN
sig
nal i
s le
ss u
sefu
l;!
Flow
s ar
rivi
ng w
hen
buff
ers
are
empt
y m
ay g
et
mor
e th
roug
hput
⇒un
fair
ness
.
Mar
k T
ail
NASA/TM—2001-210904 291

Arj
an D
urre
siT
he O
hio
Stat
e U
nive
rsityP
ropo
sal:
Mar
k F
ront
Pro
posa
l: M
ark
Fro
nt
!Si
mul
atio
n A
naly
sis
has
show
n th
at m
ark-
fron
t st
rate
gy!
redu
ces
the
buff
er s
ize
requ
irem
ent,
from
3rd
to 2
rd!
incr
ease
s lin
k ef
fici
ency
,!
avoi
ds lo
ck-i
n ph
enom
enon
and
impr
oves
fair
ness
,!
alle
viat
es T
CP’
s di
scri
min
atio
n ag
ain
larg
e R
TT
s.
Mar
k T
ail
Mar
k Fr
ont
NASA/TM—2001-210904 292

Arj
an D
urre
siT
he O
hio
Stat
e U
nive
rsity
Buf
fer
Req
uire
men
tB
uffe
r R
equi
rem
ent
Thr
esho
ld
Mar
k F
ront
theo
reti
cal
Mar
k T
ail t
heor
etic
al
Mar
k F
ront
sim
ulat
ion
�
Mar
k T
ail s
imul
atio
n
∆ ∆∆∆
Buffer size requirement
Fron
t
Tai
l
Tai
l
!O
ur th
eore
tical
bou
nd is
tigh
t whe
n th
resh
old
>rd
!M
ark
Fron
t req
uire
s le
ss b
uffe
r
Fron
t
NASA/TM—2001-210904 293

Arj
an D
urre
siT
he O
hio
Stat
e U
nive
rsity
Lin
k E
ffic
ienc
yL
ink
Eff
icie
ncy
Thr
esho
ld
Link Efficiency
!M
ark-
Fron
t im
prov
es th
e lin
k ef
fici
ency
for t
he s
ame
thre
shol
d
Fron
t
Tai
l
NASA/TM—2001-210904 294

Arj
an D
urre
siT
he O
hio
Stat
e U
nive
rsity
Unf
airn
ess
Unf
airn
ess
Thr
esho
ld
Tai
l
Fron
t
Unfairness
!M
ark-
Fron
t im
prov
es fa
irne
ss
NASA/TM—2001-210904 295

Arj
an D
urre
siT
he O
hio
Stat
e U
nive
rsity
Tas
k 4:
Sum
mar
y of
Res
ults
Tas
k 4:
Sum
mar
y of
Res
ults
!M
ark-
fron
t str
ateg
y!
redu
ces
the
buff
er s
ize
requ
irem
ent,
!in
crea
ses
link
effi
cien
cy,
!av
oids
lock
-in
phen
omen
on a
nd im
prov
es fa
irne
ss!
Thi
s is
spe
cial
ly im
port
ant f
or lo
ng-b
andw
idth
del
ay
prod
uct n
etw
orks
Mar
k T
ail
Mar
k Fr
ont
NASA/TM—2001-210904 296

Arj
an D
urre
siT
he O
hio
Stat
e U
nive
rsity
Tas
k 5:
Mul
tipl
exin
gT
ask
5: M
ulti
plex
ing
!In
tern
et is
bec
omin
g th
e ne
w in
fras
truc
ture
for
tele
com
mun
icat
ions
.!
Eve
ryth
ing
over
IP a
nd IP
ove
r eve
ryth
ing
!IP
has
to p
rovi
de o
ne k
ey fu
nctio
n: D
ecom
posi
tion
of
high
-cap
acity
cha
nnel
s in
to h
iera
rchi
cally
ord
ered
su
b-ch
anne
ls
!O
r how
to b
uild
a m
ultip
lexi
ng n
ode?
x 1 x n
yA
B
NASA/TM—2001-210904 297

Arj
an D
urre
siT
he O
hio
Stat
e U
nive
rsity
Mul
tipl
exin
g (c
ont.)
Mul
tipl
exin
g (c
ont.)
!R
eal-
time
or h
igh
QoS
traf
fics
incl
ude
voic
e ov
er IP
, vi
rtua
l lea
sed
line,
vid
eo o
ver I
P et
c.!
Goa
l and
Obj
ectiv
es:
!Pr
ovid
e th
e ne
eded
QoS
!
Hig
h ne
twor
k re
sour
ce u
tiliz
atio
n or
mul
tiple
ga
in!
“Sim
ple”
sol
utio
ns to
be
depl
oyed
ext
ensi
vely
in
prac
tice
NASA/TM—2001-210904 298

Arj
an D
urre
siT
he O
hio
Stat
e U
nive
rsity
Pro
blem
sP
robl
ems
!H
ow to
cha
ract
eriz
e IP
traf
fic
to b
e ag
greg
ated
:!
Dif
fere
nt m
odel
s an
d pa
ram
eter
s!
Mod
els
shou
ld b
e “p
ract
ical
” i.e
. ea
sy to
be
used
by
app
licat
ions
!H
ow to
cha
ract
eriz
e th
e ou
tput
traf
fic
!Pr
ovid
e m
ultip
lexi
ng ru
les:
bal
anci
ng Q
oS fo
r the
ag
greg
ates
and
mul
tiple
gai
n: fi
nd a
n op
timiz
ed
solu
tions
!Se
lect
the
appr
opri
ate
sche
dulin
g m
echa
nism
NASA/TM—2001-210904 299

Arj
an D
urre
siT
he O
hio
Stat
e U
nive
rsity
Opt
imiz
ed S
olut
ion
Opt
imiz
ed S
olut
ion
Rat
e
Bur
st
•Fin
d th
e be
st ru
les
how
to m
ultip
lex
diff
eren
t IP
traf
fics
NASA/TM—2001-210904 300

Arj
an D
urre
siT
he O
hio
Stat
e U
nive
rsity
How
to c
hara
cter
ize
IP tr
affi
c H
ow to
cha
ract
eriz
e IP
traf
fic
flow
sfl
ows
!E
nvel
ope-
Bas
ed m
etho
ds to
spe
cify
the
traf
fic,
bot
h de
term
inis
tical
ly o
r sto
chas
tical
ly!
Lea
ky B
ucke
t Mod
el!
Usi
ng L
eaky
Buc
ket M
odel
to d
o si
mul
atio
n!
D-B
IND
/H-B
IND
Mod
el
NASA/TM—2001-210904 301

Arj
an D
urre
siT
he O
hio
Stat
e U
nive
rsity
Env
elop
e C
once
pts
Env
elop
e C
once
pts
!E
(t) >
= A
[s, s
+t],
for a
ll t >
0, a
nd s
> 0
!E
mpi
rica
l Env
elop
e is
the
tight
est e
nvel
ope
for a
gi
ven
traf
fic
!D
efin
ition
: Let
A(t
) be
the
arri
ving
traf
fic,
then
E
(t) =
max
s>0
A[s
, s+t
], fo
r all
t > 0
is th
e E
mpi
rica
l Env
elop
e of
A(t
). A
[t1,
t2]
repr
esen
ts th
e am
ount
of t
raff
ic a
rriv
es d
urin
g in
terv
al [t
1, t2
]!
Mat
hem
atic
al to
ol: N
etw
ork
Cal
culu
s to
do
enve
lope
ba
sed
deri
vatio
n an
d an
alys
is
NASA/TM—2001-210904 302

Arj
an D
urre
siT
he O
hio
Stat
e U
nive
rsity
Lea
ky B
ucke
t Mod
elL
eaky
Buc
ket M
odel
!M
ost r
esea
rch
wor
k us
es t
his
mod
el to
cha
ract
eriz
e th
e ar
rivi
ng tr
affi
c!
E(t
) = b
+ r*
t, b
is th
e bu
cket
siz
e, a
nd r
is th
e le
akin
g ra
te!
E(t
) >=
A[s
, s+t
], w
here
A(t
) is
the
arri
ving
traf
fic
!M
ultip
le L
eaky
Buc
ket M
odel
!E
*(t)
= m
in1<
=I<=
n{b i
+ r i*
t}
NASA/TM—2001-210904 303

Arj
an D
urre
siT
he O
hio
Stat
e U
nive
rsityDD-- B
IND
/HB
IND
/H-- B
IND
Mod
elB
IND
Mod
el!
Prop
osed
by
Edw
ard
Kni
ghtly
and
Hui
Zha
ng!
With
the
D-B
IND
mod
el, s
ourc
es c
hara
cter
ize
thei
r tr
affi
c to
the
netw
ork
via
mul
tiple
rate
-int
erva
l pa
irs,
(Rk,
I k),
whe
re th
e ra
teR
k, is
a b
ound
ing
or
wor
st-c
ase
rate
ove
r eve
ry in
terv
al o
f len
gth
I k. W
ith P
ra
te-i
nter
val p
airs
, the
mod
el p
aram
eter
izes
a p
iece
-w
ise
linea
r con
stra
int f
unct
ion
with
P li
near
seg
men
ts
give
n by
E(t
) = (R
k*I k
-Rk-
1*I k
-1)(
t-I k
)/(I
k-I
k-1)
+ R
k*I k
, Ik-
1<
t <=
I kw
ith I 0
= 0;
NASA/TM—2001-210904 304

Arj
an D
urre
siT
he O
hio
Stat
e U
nive
rsity
DD-- B
IND
/HB
IND
/H-- B
IND
Mod
el (
BIN
D M
odel
(C
ont
Con
t .).)
!Si
mul
atio
ns h
ave
show
ed th
at, P
, the
num
ber o
f pai
rs
need
s no
t to
be to
o la
rge.
P=4
is g
ood.
!B
ette
r per
form
ance
than
Lea
ky B
ucke
t Mod
el!
Bet
ter d
escr
ibe
the
corr
elat
ion
stru
ctur
e an
d bu
rstin
ess
prop
ertie
s fo
r a g
iven
traf
fic(
Vid
eo, e
tc)
!D
raw
back
s:!
Lar
ger n
umbe
r of p
aram
eter
s to
cha
ract
eriz
e th
e tr
affi
c!
Unr
ealis
tic to
let u
sers
to a
ccur
atel
y sp
ecif
y su
ch
para
met
ers,
nee
d so
me
on-l
ine
traf
fic
mea
sure
men
t
NASA/TM—2001-210904 305

Arj
an D
urre
siT
he O
hio
Stat
e U
nive
rsity
DD-- B
IND
/HB
IND
/H-- B
IND
Mod
el (
BIN
D M
odel
(co
ntco
nt.).)
!M
ultip
le L
eaky
Buc
ket M
odel
is a
spe
cial
cas
e of
D-
BIN
D!
H-B
IND
ext
ends
D-B
IND
!It
use
s D
-BIN
D to
cha
ract
eriz
e tr
affi
c, a
nd a
chie
ves
stat
istic
al m
ultip
lexi
ng
NASA/TM—2001-210904 306

Arj
an D
urre
siT
he O
hio
Stat
e U
nive
rsity
How
to g
et c
hara
cter
isti
cs o
f H
ow to
get
cha
ract
eris
tics
of
aggr
egat
es o
f sev
eral
IP
flow
sag
greg
ates
of s
ever
al I
P fl
ows
!D
eter
min
istic
App
roac
hes
!St
ocas
tic/S
tatis
tical
App
roac
hes
NASA/TM—2001-210904 307

Arj
an D
urre
siT
he O
hio
Stat
e U
nive
rsity
Det
erm
inis
tic
App
roac
hes
Det
erm
inis
tic
App
roac
hes
!C
onsi
der w
orst
cas
e!
Prov
ide
100%
QoS
gua
rant
ees
!D
raw
back
:!
was
te n
etw
ork
reso
urce
!ba
ndw
idth
util
izat
ion
is lo
w(u
nder
50%
with
D-
BIN
D)
NASA/TM—2001-210904 308

Arj
an D
urre
siT
he O
hio
Stat
e U
nive
rsity
Stoc
asti
cSt
ocas
tic /
Stat
isti
cal A
ppro
ache
s/S
tati
stic
al A
ppro
ache
s
!N
o 10
0% g
uara
ntee
!Pr
obab
ilist
ic g
uara
ntee
. For
exa
mpl
e, to
gua
rant
ee
pack
et lo
ss ra
te is
sm
alle
r tha
n 10
-6.
!B
ette
r net
wor
k ut
iliza
tion.
NASA/TM—2001-210904 309

Arj
an D
urre
siT
he O
hio
Stat
e U
nive
rsity
Stoc
asti
cSt
ocas
tic /
Stat
isti
cal A
ppro
ache
s /S
tati
stic
al A
ppro
ache
s (( C
ont
Con
t .).)
!C
onne
ctio
n A
dmis
sion
Con
trol
Alg
orith
ms
for
stat
istic
al Q
oS.
!A
vera
ge/P
eak
Rat
e co
mbi
nato
rics
!A
dditi
ve E
ffec
tive
Ban
dwid
ths
!L
oss
Cur
ve!
Max
imum
Var
ianc
e A
ppro
ache
s!
Ref
ined
Eff
ectiv
e B
andw
idth
s an
d L
arge
Dev
iatio
ns!
Mea
sure
men
t bas
ed a
lgor
ithm
s.!
Enf
orce
able
sta
tistic
al s
ervi
ce!
Alg
orith
ms
for s
peci
al-p
urpo
se s
yste
m(v
ideo
on
dem
and)
NASA/TM—2001-210904 310

Arj
an D
urre
siT
he O
hio
Stat
e U
nive
rsity
CB
R
CB
R v
svs. V
BR
. VB
R!
IP C
BR
: Sim
ple
mul
tiple
rule
s, P
rovi
de g
uara
ntee
fo
r QoS
, No
mul
tiple
gai
n!
IP V
BR
, Mor
e co
mpl
ex m
ultip
lexi
ng ru
les,
G
uara
ntee
s fo
r QoS
dep
end
on m
ultip
lexi
ng ru
les,
M
ore
mul
tiple
gai
n:!
With
CB
R o
verb
ooki
ng is
per
form
ed b
y bu
rst
abso
rptio
n at
the
mul
tiple
xer.
!W
ith V
BR
it is
pos
sibl
e to
let b
urst
go
thro
ugh
the
mul
tiple
xera
nd c
ount
on
stat
istic
al m
ultip
lexi
ng
insi
de th
e ne
twor
k, w
here
the
num
ber o
f co
nnec
tions
and
the
trun
k bi
t rat
es a
re la
rger
NASA/TM—2001-210904 311

Arj
an D
urre
siT
he O
hio
Stat
e U
nive
rsity
Out
put
Out
put
--C
BR
C
BR
!
Eff
ectiv
e B
andw
idth
:T
he q
ueue
with
con
stan
t rat
e C
gu
aran
tees
a d
elay
bou
nd D
to
a fl
ow w
ith a
rriv
al c
urve
αif
C ≥
e D(α
) whe
re:
e D(α
) = s
up α
(s)/
(s+D
) for
s ≥
0!
Exa
mpl
e: F
or IE
TF
traf
fic
spec
ific
atio
n:e D
=max
{M/D
, r, p
, (1-
(D-M
/p)/
(x+D
))}
whe
re x
= (b
-M)/
(p-r
)!∑
e D(α
i) -e
D(∑
α i) i
s no
n st
atis
tical
mul
tiple
gai
n
-D
arri
val
curv
e
t
bits
Slop
e =
eD
arri
val
curv
e
-Dt
bits
Slop
e =
eD
M
br
NASA/TM—2001-210904 312

Arj
an D
urre
siT
he O
hio
Stat
e U
nive
rsity
Out
put
Out
put
--C
BR
(C
BR
(co
ntco
nt.).)
!E
quiv
alen
t cap
acity
Bou
nd th
e bu
ffer
B:
C ≥
f B(α
)= s
up (α
(s)-
B)/
s; s
≥0
!A
gain
: fB(α
) ≤∑
f Bi(α
i)
!A
lso
give
n a
pred
icte
d tr
affi
c w
e c
an fi
nd th
e op
timal
V
BR
par
amet
ers
that
can
car
ry th
e tr
affi
c.
B
arri
val
curv
e
t
bits
Slop
e =
f B
NASA/TM—2001-210904 313

Arj
an D
urre
siT
he O
hio
Stat
e U
nive
rsity
Out
put
Out
put
--V
BR
VB
R!
For σ
(t) =
min
(Pt,
St+B
)P:
Pea
k ra
te, S
: sus
tain
able
rate
,B
: bur
st to
lera
nce
{ !Fr
om (1
)=>
P ≥
P 0=
e D(α
) !
Usi
ng a
VB
R tr
unk
rath
er th
an a
CB
R is
all
bene
fit
sinc
e, b
y de
fini
tion
of e
ffec
tive
band
wid
th, t
he C
BR
ha
s at
leas
t a ra
te P
0
!W
e ca
n al
so o
ptim
ize
S an
d B
.
-D
arri
val
curv
e
t
bits
PS
B+S
D
(1) (
s+D
)P ≥
α(s)
(2
) (s+
D)S
+B ≥
α(s)
NASA/TM—2001-210904 314

Arj
an D
urre
siT
he O
hio
Stat
e U
nive
rsity
Out
put
Out
put
--V
BR
VB
R!
Giv
en a
pre
dict
ed tr
affi
c w
e ca
n fi
nd th
e op
timal
VB
R
para
met
ers
that
can
car
ry th
e tr
affi
c.!
A n
umbe
r of f
low
s, w
ith a
n ag
greg
ated
cur
ve α
, is
mul
tiple
xed
into
a V
BR
trun
k!
The
VB
R tr
unk
is v
iew
ed a
s a
sing
le s
trea
m b
y do
wns
trea
m n
odes
and
is c
onst
rain
ed b
y an
arr
ival
cu
rve
σ.!
If th
e co
nstr
aint
at t
he m
ultip
lexo
r is
to g
uara
ntee
a
max
imum
del
ay D
:!
σ(s
+ D
)≥
α(s)
for s
≥0
NASA/TM—2001-210904 315

Arj
an D
urre
siT
he O
hio
Stat
e U
nive
rsity
CB
RC
BR
Mul
tipl
exor
Mul
tipl
exor
!E
ach
sour
ce is
leak
y bu
cket
re
gula
ted:
toke
n ra
te ρ
, tok
en s
ize
σan
d th
e pe
ak ra
te P
!
We
can
calc
ulat
e qu
eue
leng
th.
!W
e ca
n bu
ild th
e op
timal
Buf
fer/
Ban
dwid
th c
urve
Sour
ce 1
Sour
ce N
C
B
ΣKjρ j
ΣKjP j
C
B
ΣKjσ
j
NASA/TM—2001-210904 316

Arj
an D
urre
siT
he O
hio
Stat
e U
nive
rsity
CB
RC
BR
Mul
tipl
exor
Mul
tipl
exor
K1
K1
K2
K2
!T
he im
pact
of b
urst
ines
s w
hen
hete
roge
neou
s so
urce
s ar
e m
ultip
lexe
d C
=45M
bps,
ρ1=
ρ2=
0.1
5, P
1=1.
5,
P 2=6
, T
on1>
>Ton
2
!St
atis
tical
ser
vice
with
eve
n sm
all l
oss
prob
abili
ty
incr
ease
s th
e m
ultip
lexi
ng g
ain.
NASA/TM—2001-210904 317

Arj
an D
urre
siT
he O
hio
Stat
e U
nive
rsity
VB
R
VB
R M
ulti
plex
or
Mul
tipl
exor
!
Adv
anta
ges
of u
sing
VB
R tr
unks
:!
Mor
e st
atis
tical
mul
tiple
gai
n th
an C
BR
!W
ith C
BR
ove
rboo
king
is p
erfo
rmed
by
burs
t ab
sorp
tion
at th
e m
ultip
lexe
r.!
With
VB
R it
is p
ossi
ble
to le
t bur
st g
o th
roug
h th
e m
ultip
lexe
r and
cou
nt o
n st
atis
tical
mul
tiple
in
side
the
netw
ork,
whe
re th
e nu
mbe
r of
conn
ectio
ns a
nd th
e tr
unk
bit r
ates
are
larg
er.
NASA/TM—2001-210904 318

Arj
an D
urre
siT
he O
hio
Stat
e U
nive
rsity
VB
RV
BR
Mul
tipl
exor
Mul
tipl
exor
Figu
re s
how
s th
e ad
vant
age
of s
tatis
tical
mul
tiple
Mea
n ra
te M
bps
Num
ber
of
conn
ectio
ns.
Los
s pr
ob. =
10 -9
, Pe
ak=1
15M
bps,
M
(sus
tain
ed)=
Peak
/1.5
, B
(bus
t tol
eran
ce)=
5Mb,
X
(buf
fer)
=10M
bIn
put V
BR
flow
s:p=
2 M
bps,
b=0
.5M
bm
= 0
to p
Stat
istic
al m
ux. Los
sles
s m
ux.
NASA/TM—2001-210904 319

Arj
an D
urre
siT
he O
hio
Stat
e U
nive
rsityC
onne
ctio
n G
roup
ing
Con
nect
ion
Gro
upin
g
!C
ompa
re th
ree
type
of m
ultip
lexi
ng:
!1)
No
conn
ectio
n gr
oupi
ng!
2) C
onne
ctio
ns g
roup
ed a
s C
BR
trun
ks!
3) C
onne
ctio
ns g
roup
ed a
s V
BR
trun
ks
A
B
Req
uest
[P, M
, B]
Ava
ilabl
e [P
1, M
1, B
1]
CB
R
CB
RN
1)
CB
R
VB
RR
xYC
BR
RC
BR
VB
RR
xYV
BR
R
2)3)
NASA/TM—2001-210904 320

Arj
an D
urre
siT
he O
hio
Stat
e U
nive
rsity
VB
RV
BR
Mul
tipl
exor
Mul
tipl
exor
N. c
onn.
Rat
io P
/M
1) a
nd s
econ
d st
age
of
2) a
nd 3
):P
= 11
5Mbp
sX
=10M
bSm
alle
r nod
e in
2):
P=11
.5M
bps
X=1
Mb
Smal
ler n
ode
in 3
):P=
11.5
Mbp
sB
=0.0
5 M
B,X
=1M
bIn
put:
p=0.
2Mbp
sb=
0.05
Mea
n ra
te m
=0.0
5Pe
rfor
man
ce o
f VB
R o
ver V
BR
traf
fic
aggr
egat
ion
can
sign
ific
antly
exc
eed
the
perf
orm
ance
of C
BR
agg
rega
tion
3
1
2
NASA/TM—2001-210904 321

Arj
an D
urre
siT
he O
hio
Stat
e U
nive
rsity
VB
RV
BR
Mul
tipl
exor
Mul
tipl
exor
N. c
onn.
Rat
io P
/M
Mea
n ra
te m
=0. 1
3 2
1
NASA/TM—2001-210904 322

Arj
an D
urre
siT
he O
hio
Stat
e U
nive
rsity
Tas
k 5:
Sum
mar
yT
ask
5: S
umm
ary
!W
hy IP
mul
tiple
?!
Mod
els
for i
nput
and
out
put f
low
s an
d m
ultip
lexi
ng
rule
s: fi
nd a
n op
timiz
ed s
olut
ion
!L
eaky
Buc
ket M
odel
!D
-BIN
D/H
-BIN
D M
odel
!D
eter
min
istic
App
roac
hes
!St
ocas
tic/S
tatis
tical
App
roac
hes
!V
BR
ove
r VB
R b
ette
r tha
n C
BR
ove
r CB
R!
Sim
ulat
ions
usi
ng L
eaky
Buc
ket M
odel
NASA/TM—2001-210904 323

Arj
an D
urre
siT
he O
hio
Stat
e U
nive
rsity
Tas
k 6:
Stu
dy o
f Ass
ured
T
ask
6: S
tudy
of A
ssur
ed
For
war
ding
in S
atel
lite
Net
wor
ksF
orw
ardi
ng in
Sat
ellit
e N
etw
orks
!K
ey V
aria
bles
!B
uffe
r Man
agem
ent C
lass
ific
atio
n: T
ypes
of R
ED
!T
raff
ic T
ypes
and
Tre
atm
ent
!L
evel
of R
eser
ved
Tra
ffic
!T
wo
vs T
hree
: Bes
t Res
ults
!Su
mm
ary
NASA/TM—2001-210904 324

Arj
an D
urre
siT
he O
hio
Stat
e U
nive
rsity
Firs
t Cla
ss
Coa
ch C
lass
Key
Var
iabl
esK
ey V
aria
bles
Bus
ines
s C
lass
NASA/TM—2001-210904 325

Arj
an D
urre
siT
he O
hio
Stat
e U
nive
rsityD
iffe
rent
iate
d Se
rvic
esD
iffe
rent
iate
d Se
rvic
es
!D
iffS
erv
to s
tand
ardi
ze IP
v4 T
oS b
yte’
s fi
rst s
ix b
its!
Pack
ets
gets
mar
ked
at n
etw
ork
ingr
ess
Mar
king
⇒tr
eatm
ent (
beha
vior
) in
rest
of t
he n
etSi
x bi
ts ⇒
64 d
iffe
rent
per
-hop
beh
avio
rs (P
HB
)
Hdr
Len
Ver
Tot
Len
4b4b
8b16
bT
ype
of S
ervi
ce (T
oS)
∫d/
dx⇒
NASA/TM—2001-210904 326

Arj
an D
urre
siT
he O
hio
Stat
e U
nive
rsity
Dif
fSer
v (C
ont)
Dif
fSer
v (C
ont)
!Pe
r-ho
p be
havi
or =
% o
f lin
k ba
ndw
idth
, Pri
ority
!Se
rvic
es: E
nd-t
o-en
d. V
oice
, Vid
eo, .
..
!T
rans
port
: Del
iver
y, E
xpre
ss D
eliv
ery,
...B
est e
ffor
t, co
ntro
lled
load
, gua
rant
eed
serv
ice
!D
S gr
oup
will
not
dev
elop
ser
vice
sT
hey
will
sta
ndar
dize
“Pe
r-H
op B
ehav
iors
”!
Mar
king
bas
ed o
n st
atic
“Se
rvic
e L
evel
Agr
eem
ents
” (S
LA
s). A
void
sig
nalin
g.
NASA/TM—2001-210904 327

Arj
an D
urre
siT
he O
hio
Stat
e U
nive
rsityE
xped
ited
For
war
ding
Exp
edit
ed F
orw
ardi
ng!
Als
o kn
own
as “
Prem
ium
Ser
vice
”!
Vir
tual
leas
ed li
ne!
Sim
ilar t
o C
BR
!G
uara
ntee
d m
inim
um s
ervi
ce ra
te!
Polic
ed: A
rriv
al ra
te <
Min
imum
Ser
vice
Rat
e!
Not
aff
ecte
d by
oth
er d
ata
PHB
s ⇒
Hig
hest
dat
a pr
iori
ty (i
f pri
ority
que
uein
g)!
Cod
e po
int:
101
110
NASA/TM—2001-210904 328

Arj
an D
urre
siT
he O
hio
Stat
e U
nive
rsity
Ass
ured
For
war
ding
Ass
ured
For
war
ding
!PH
B G
roup
!Fo
ur C
lass
es: N
o pa
rtic
ular
ord
erin
g !
Sim
ilar t
onr
t-V
BR
/AB
R/G
FR
NASA/TM—2001-210904 329

Arj
an D
urre
siT
he O
hio
Stat
e U
nive
rsity
Key
Var
iabl
esK
ey V
aria
bles
!B
andw
idth
Man
agem
ent:
!N
umbe
r of c
olor
s: O
ne, T
wo,
or T
hree
!Pe
rcen
tage
of g
reen
(res
erve
d) tr
affi
c: L
ow, h
igh,
ov
ersu
bscr
ibed
!B
uffe
r M
anag
emen
t:!
Tai
l dro
p or
RE
D!
RE
D p
aram
eter
s, im
plem
enta
tions
!T
raff
ic T
ypes
and
thei
r tr
eatm
ent:
!C
onge
stio
n Se
nsiti
vity
: TC
P vs
UD
P!
Exc
ess
TC
P vs
Exc
ess
UD
P !
Net
wor
k C
onfi
gura
tion
:O
ur g
oal i
s to
iden
tify
resu
lts th
at a
pply
to a
ll co
nfig
s.
NASA/TM—2001-210904 330

Arj
an D
urre
siT
he O
hio
Stat
e U
nive
rsity
Buf
fer
Man
agem
ent
Buf
fer
Man
agem
ent
Cla
ssif
icat
ion
Cla
ssif
icat
ion
!A
ccou
ntin
g (q
ueue
d pa
cket
s):
Per-
colo
r, pe
r-V
C, p
er-f
low
, or G
loba
lM
ultip
le o
r Sin
gle
!T
hres
hold
: Sin
gle
or M
ultip
le!
Four
Typ
es:
!Si
ngle
Acc
ount
ing,
Sin
gle
thre
shol
d (S
AST
)!
Sing
le A
ccou
ntin
g, M
ultip
le th
resh
old
(SA
MT
)!
Mul
tiple
Acc
ount
ing,
Sin
gle
thre
shol
d (M
AST
)!
Mul
tiple
Acc
ount
ing,
Mul
tiple
thre
shol
d (M
AM
T)
NASA/TM—2001-210904 331

Arj
an D
urre
siT
he O
hio
Stat
e U
nive
rsity
Typ
es o
f RE
DT
ypes
of R
ED
Tot
al Q
ueue
Tot
al Q
ueue
P(D
rop)
P(D
rop)
!Si
ngle
Acc
ount
ing
Sing
le T
hres
hold
(SA
ST):
Col
or-b
lind
Ran
dom
Ear
ly D
isca
rd (R
ED
)
!Si
ngle
Acc
ount
ing
Mul
tiple
Thr
esho
ld (S
AM
T):
Col
or-A
war
e R
ED
as
impl
emen
ted
in s
ome
prod
ucts
Use
d in
pre
sent
di
ffse
rv-u
naw
are
rout
ers
Use
d in
this
stu
dy
NASA/TM—2001-210904 332

Arj
an D
urre
siT
he O
hio
Stat
e U
nive
rsity
Typ
es o
f RE
D (C
ont)
Typ
es o
f RE
D (C
ont)
P(D
rop)
P(D
rop)
!M
ultip
le A
ccou
ntin
g Si
ngle
Thr
esho
ld (M
AST
):
!M
ultip
le A
ccou
ntin
g M
ultip
le T
hres
hold
(MA
MT
):G
, G+Y
, G+Y
+R Q
ueue
R, Y
, G Q
ueue
Use
d in
our
pr
evio
us s
tudy
Con
clus
ion:
Mor
e C
ompl
exity
⇒M
ore
Fair
ness
NASA/TM—2001-210904 333

Arj
an D
urre
siT
he O
hio
Stat
e U
nive
rsity
Tra
ffic
Typ
es a
nd T
reat
men
tT
raff
ic T
ypes
and
Tre
atm
ent
!B
oth
TC
P an
d U
DP
get t
heir
rese
rved
(gre
en) r
ates
!E
xces
s T
CP
com
pete
s w
ith e
xces
s U
DP
!U
DP
is a
ggre
ssiv
e ⇒
UD
P ta
kes
over
all
the
exce
ss b
andw
idth
⇒G
ive
exce
ss T
CP
bette
r tre
atm
ent t
han
exce
ss U
DP
Res
erve
dE
xces
s
TC
P
Res
erve
dE
xces
sR
eser
ved
Exc
ess
Res
erve
dE
xces
s
UD
PT
CP
UD
P2-
Col
or3-
Col
or
NASA/TM—2001-210904 334

Arj
an D
urre
siT
he O
hio
Stat
e U
nive
rsityT
wo
Dro
p P
rece
denc
esT
wo
Dro
p P
rece
denc
es
!A
ll pa
cket
s up
to C
IR a
re m
arke
d G
reen
!O
verf
low
ed p
acke
ts a
re m
arke
d R
ed
Gre
enR
ed
TC
P/U
DP
Com
mitt
edIn
form
atio
nR
ate
(CIR
)
Com
mitt
edB
urst
Size
(CB
S)
NASA/TM—2001-210904 335

Arj
an D
urre
siT
he O
hio
Stat
e U
nive
rsity
Gre
enY
ello
wR
ed
Thr
ee D
rop
Pre
cede
nces
Thr
ee D
rop
Pre
cede
nces
!T
oken
s in
Gre
en, Y
ello
w b
ucke
ts a
re g
ener
ated
in
depe
nden
tly.
!Pa
ram
eter
s: T
oken
gen
erat
ion
rate
and
Buc
ket S
ize
for
Gre
en a
nd Y
ello
w b
ucke
ts!
Col
or A
war
e ⇒
Exc
ess
pack
ets
over
flow
to n
ext c
olor
NASA/TM—2001-210904 336

Arj
an D
urre
siT
he O
hio
Stat
e U
nive
rsity
Lev
el o
f Res
erve
d T
raff
icL
evel
of R
eser
ved
Tra
ffic
!Pe
rcen
tage
of r
eser
ved
(gre
en) t
raff
ic is
the
mos
t im
port
ant p
aram
eter
!If
the
gree
n tr
affi
c is
hig
h⇒
No
or li
ttle
exce
ss c
apac
ity⇒
Tw
o or
thre
e co
lors
per
form
sim
ilarl
y!
If th
e gr
een
traf
fic
is lo
w⇒
Lot
s of
exc
ess
capa
city
⇒B
ehav
ior o
f TC
P vs
UD
P im
pact
s w
ho g
ets
exce
ss⇒
Nee
d 3
colo
rs +
Nee
d to
giv
e ex
cess
TC
P ye
llow
+
Nee
d to
giv
e ex
cess
UD
P re
d co
lors
NASA/TM—2001-210904 337

Arj
an D
urre
siT
he O
hio
Stat
e U
nive
rsity
Sim
ulat
ion
Con
figu
rati
onSi
mul
atio
n C
onfi
gura
tion
UD
P
1 2 9 10
R_1
R_2
Snk_
1
Snk_
46
TC
P_1
TC
P_5
1 µs
10 M
bps
5 µs
1.5
Mbp
s25
0 m
s1.
5 M
bps
5 µs
1.5
Mbp
s
Cus
tom
er
Sate
llite
NASA/TM—2001-210904 338

Arj
an D
urre
siT
he O
hio
Stat
e U
nive
rsity
Lin
k P
aram
eter
sL
ink
Par
amet
ers
Lin
kB
/WL
ink
Del
ayL
ink
Polic
yB
etw
een
TC
P/U
DP
&C
usto
mer
i10
Mbp
s1
µsD
ropT
ail
From
Cus
tom
er i
to R
11.
5 M
bps
5 µs
Dro
pTai
lw
mar
ker
From
R1
to C
usto
mer
i1.
5 M
bps
5 µs
Dro
pTai
l
From
R1
to R
21.
5 M
bps
250
µsR
ED
_n
From
R2
to R
11.
5 M
bps
250
µsD
ropT
ail
Bet
wee
n R
2 an
d si
nk i
1.5
Mbp
s5
µsD
ropT
ail
NASA/TM—2001-210904 339

Arj
an D
urre
siT
he O
hio
Stat
e U
nive
rsitySi
mul
atio
n P
aram
eter
sSi
mul
atio
n P
aram
eter
s!
Sing
leA
ccou
ntin
gM
ultip
leT
hres
hold
RE
D!
RE
D Q
ueue
Wei
ght f
or A
ll C
olor
s: w
= 0
.002
Qav
g=
(1-w
)Qav
g+
w Q
!
Max
imum
Que
ue L
engt
h (F
or A
ll Q
ueue
s): 6
0 pa
cket
s!
TC
P fl
avor
: Ren
o !
TC
P M
axim
um W
indo
w: 6
4 pa
cket
s!
TC
P Pa
cket
Siz
e: 5
76 b
ytes
!U
DP
Pack
et S
ize:
576
byt
es!
UD
P D
ata
Rat
e: 1
.28M
bps
NASA/TM—2001-210904 340

Arj
an D
urre
siT
he O
hio
Stat
e U
nive
rsityTw
o C
olor
Sim
ulat
ions
Tw
o C
olor
Sim
ulat
ions
Sim
ulat
ion
Con
figu
ratio
n
1 T
hrou
gh11
52
Gre
enT
oken
Gen
erat
ion
Rat
e[k
bps]
12.8
,25
.6,
38.4
,76
.8,
102.
4,12
8,15
3.6,
179.
2
Gre
enT
oken
Buc
ket
Size
(in
Pack
ets)
1, 2, 4,
8,
16,
32
Max
imum
Dro
pPr
obab
ility
{Gre
en,
Red
}
{0.1
,0.1
}{0
.1,0
.5}
{0.1
,1}
{0.5
,0.5
}{0
.5,1
}{1
,1}
Dro
pT
hres
hold
s{G
reen
, Red
}
{40/
60,0
/10}
{40/
60,0
/20}
{40/
60,0
/5}
{40/
60,2
0/40
}
NASA/TM—2001-210904 341

Arj
an D
urre
siT
he O
hio
Stat
e U
nive
rsityThr
ee C
olor
Sim
ulat
ions
Thr
ee C
olor
Sim
ulat
ions
Sim
ulat
ion
Con
fig.
1 T
hrou
gh28
80
Gre
enT
oken
Gen
er.
Rat
e[k
bps]
12.8
,25
.6,
38.4
,76
.8
Gre
enT
oken
Buc
ket
Size
inPa
cket
s
1, 2, 4, 8, 16,
32
Yel
low
Tok
enB
ucke
t Siz
ein
Pack
ets
1, 2, 4, 8, 16,
32
Max
Dro
pPr
obab
ility
{Gre
en,
Yel
low
,R
ed}
{0.1
,0.5
,1}
{0.1
,1,1
}{0
.5,0
.5,1
}{0
.5,1
,1}
{1,1
,1}
Dro
pT
hres
hold
s {G
reen
,Y
ello
w,
Red
}
{40/
60,2
0/40
, 0/1
0}{4
0/60
,20/
40, 0
/20}
Yel
low
Tok
enG
ener
. R
ate
[kbp
s]
128,
12.8
NASA/TM—2001-210904 342

Arj
an D
urre
siT
he O
hio
Stat
e U
nive
rsity
Fai
rnes
s In
dex
Fai
rnes
s In
dex
!M
easu
red
Thr
ough
put:
(T1,
T2,
..., T
n)!
Use
any
cri
teri
on (e
.g.,
max
-min
opt
imal
ity) t
o fi
nd
the
Fair
Thr
ough
put (
O1,
O2,
..., O
n)!
Nor
mal
ized
Thr
ough
put:
x i=
Ti/O
i
Fair
ness
Inde
x =
(Σx i
)2
nΣx i
2
Exa
mpl
e: 5
0/50
, 30/
10, 5
0/10
⇒1,
3, 5
Fair
ness
Inde
x =
(1+3
+5)2
3(12 +
32 +52 )
=92
3(1+
9+25
)=
0.81
NASA/TM—2001-210904 343

Arj
an D
urre
siT
he O
hio
Stat
e U
nive
rsity
Fai
rnes
s In
dex
- 2
colo
rs
0
0.02
0.04
0.06
0.080.1
0.12
0.14
0.16
0.180.2
020
040
060
080
010
0012
0014
0016
0018
00
Sim
ulat
ion
ID
Fairness Index
Ser
ies1
Ser
ies2
Ser
ies3
Ser
ies4
Ser
ies5
Ser
ies6
Ser
ies7
Ser
ies8
NASA/TM—2001-210904 344

Arj
an D
urre
siT
he O
hio
Stat
e U
nive
rsity
Fai
rnes
s In
dex
- 3
colo
rs
0
0.2
0.4
0.6
0.81
1.2
050
010
0015
0020
0025
0030
0035
0040
00
Sim
ulat
ion
ID
Fairness Index
Ser
ies1
Ser
ies2
Ser
ies3
Ser
ies4
NASA/TM—2001-210904 345

Arj
an D
urre
siT
he O
hio
Stat
e U
nive
rsity
AN
OV
AA
NO
VA
!A
naly
sis
of V
aria
nce
(AN
OV
A) -
Stat
istic
al to
ol!
Mos
t Im
port
ant F
acto
rs A
ffec
ting
Fair
ness
and
T
hrou
ghpu
t:!
Wha
t % o
f the
Var
iatio
n is
exp
lain
ed b
y G
reen
(Y
ello
w) r
ate?
!W
hat %
of t
he V
aria
tion
is e
xpla
ined
by
Buc
ket
Size
?!
Wha
t % o
f the
Var
iatio
n is
exp
lain
ed th
e In
tera
ctio
n be
twee
n G
reen
(Yel
low
) Rat
e an
d B
ucke
t Siz
e
NASA/TM—2001-210904 346

Arj
an D
urre
siT
he O
hio
Stat
e U
nive
rsity
AN
OV
A F
or 2
Col
or S
imul
atio
nsA
NO
VA
For
2 C
olor
Sim
ulat
ions
!M
ost I
mpo
rtan
t Fac
tors
Aff
ectin
g Fa
irne
ss:
!G
reen
Rat
e (E
xpla
ins
65.6
% o
f the
Var
iatio
n)!
Buc
ket S
ize
(Exp
lain
s 19
.2%
of t
he V
aria
tion)
!In
tera
ctio
n be
twee
n G
reen
Rat
e an
d B
ucke
t Siz
e (E
xpla
ins
14.8
% o
f the
Var
iatio
n)
NASA/TM—2001-210904 347

Arj
an D
urre
siT
he O
hio
Stat
e U
nive
rsity
AN
OV
A F
or 3
Col
or S
imul
atio
nsA
NO
VA
For
3 C
olor
Sim
ulat
ions
!M
ost I
mpo
rtan
t Fac
tors
Aff
ectin
g Fa
irne
ss:
!Y
ello
w R
ate
(Exp
lain
s 41
.36%
of t
he V
aria
tion)
!Y
ello
w B
ucke
t Siz
e (E
xpla
ins
28.9
6% o
f the
V
aria
tion)
!In
tera
ctio
n B
etw
een
Yel
low
Rat
e A
nd Y
ello
w
Buc
ket S
ize
(Exp
lain
s 26
.49%
of t
he V
aria
tion)
NASA/TM—2001-210904 348

Arj
an D
urre
siT
he O
hio
Stat
e U
nive
rsity
Res
erva
tion
Fair
ness
1 0.5
10%
50%
100%
0.1
Tw
o co
lors
Thr
ee c
olor
s
Tw
o vs
Thr
ee: B
est R
esul
tsT
wo
vs T
hree
: Bes
t Res
ults
NASA/TM—2001-210904 349
Arj
an D
urre
siT
he O
hio
Stat
e U
nive
rsity
Tas
k 6:
Sum
mar
yT
ask
6: S
umm
ary
1. T
he k
ey p
erfo
rman
ce p
aram
eter
is th
e le
vel o
f gre
en
(res
erve
d) tr
affi
c2.
If re
serv
ed tr
affi
c le
vel i
s hi
gh o
r if t
here
is a
ny
over
book
ing,
two
and
thre
e co
lors
giv
e th
e sa
me
thro
ughp
ut a
nd fa
irne
ss3.
If th
e re
serv
ed tr
affi
c is
low
, thr
ee c
olor
s gi
ve b
ette
r fa
irne
ss th
an tw
o co
lors
4. C
lass
ifie
rs h
ave
to d
istin
guis
h T
CP
and
UD
P:R
eser
ved
TC
P/U
DP ⇒
Gre
en, E
xces
s T
CP ⇒
Yel
low
, E
xces
s U
DP ⇒
Red
5.
RE
D p
aram
eter
s an
d im
plem
enta
tions
hav
e si
gnif
ican
t im
pact
.
NASA/TM—2001-210904 350

This publication is available from the NASA Center for AeroSpace Information, 301–621–0390.
REPORT DOCUMENTATION PAGE
2. REPORT DATE
19. SECURITY CLASSIFICATION OF ABSTRACT
18. SECURITY CLASSIFICATION OF THIS PAGE
Public reporting burden for this collection of information is estimated to average 1 hour per response, including the time for reviewing instructions, searching existing data sources,gathering and maintaining the data needed, and completing and reviewing the collection of information. Send comments regarding this burden estimate or any other aspect of thiscollection of information, including suggestions for reducing this burden, to Washington Headquarters Services, Directorate for Information Operations and Reports, 1215 JeffersonDavis Highway, Suite 1204, Arlington, VA 22202-4302, and to the Office of Management and Budget, Paperwork Reduction Project (0704-0188), Washington, DC 20503.
NSN 7540-01-280-5500 Standard Form 298 (Rev. 2-89)Prescribed by ANSI Std. Z39-18298-102
Form Approved
OMB No. 0704-0188
12b. DISTRIBUTION CODE
8. PERFORMING ORGANIZATION REPORT NUMBER
5. FUNDING NUMBERS
3. REPORT TYPE AND DATES COVERED
4. TITLE AND SUBTITLE
6. AUTHOR(S)
7. PERFORMING ORGANIZATION NAME(S) AND ADDRESS(ES)
11. SUPPLEMENTARY NOTES
12a. DISTRIBUTION/AVAILABILITY STATEMENT
13. ABSTRACT (Maximum 200 words)
14. SUBJECT TERMS
17. SECURITY CLASSIFICATION OF REPORT
16. PRICE CODE
15. NUMBER OF PAGES
20. LIMITATION OF ABSTRACT
Unclassified Unclassified
Technical Memorandum
Unclassified
National Aeronautics and Space AdministrationJohn H. Glenn Research Center at Lewis FieldCleveland, Ohio 44135–3191
1. AGENCY USE ONLY (Leave blank)
10. SPONSORING/MONITORING AGENCY REPORT NUMBER
9. SPONSORING/MONITORING AGENCY NAME(S) AND ADDRESS(ES)
National Aeronautics and Space AdministrationWashington, DC 20546–0001
Available electronically at http://gltrs.grc.nasa.gov/GLTRS
May 2001
NASA TM—2001-210904
E–12781
WU–322–20–2A–00
357Quality of service; Protocols; TCP; ATM; Differentiated services; Internet
Unclassified -UnlimitedSubject Categories: 17 and 04 Distribution: Nonstandard
William Ivancic, Mohammed Atiquzzaman, Haowei Bai, Hongjun Su, Raj Jain,Arjan Durresi, Mukyl Goyal, Venkata Bharani, Chunlei Liu, and Sastri Kota
Quality of Service for Real-Time Applications Over Next GenerationData Networks
William Ivancic, NASA Glenn Research Center; Mohammed Atiquzzaman, Haowei Bai, and Hongjun Su, University ofDayton, Dayton, Ohio 45469; Raj Jain, Arjan Durresi, Mukyl Goyal, Venkata Bharani, and Chunlei Liu, Ohio StateUniversity, Columbus, Ohio 43210; and Sastri Kota, Lockheed Martin, San Jose, California 95134. Contents werereproduced from the best available copy as provided by the authors. Responsible person, William Ivancic, organizationcode 5610, 216–433–3494.
This project, which started on January 1, 2000, was funded by NASA Glenn Research Center for duration of one year.The deliverables of the project included the following tasks: Study of QoS mapping between the edge and core networksenvisioned in the Next Generation networks will provide us with the QoS guarantees that can be obtained from nextgeneration networks. Buffer management techniques to provide strict guarantees to real-time end-to-end applicationsthrough preferential treatment to packets belonging to real-time applications. In particular, use of ECN to help reduce theloss on high bandwidth-delay product satellite networks needs to be studied. Effect of Prioritized Packet Discard toincrease goodput of the network and reduce the buffering requirements in the ATM switches. Provision of new IP circuitemulation services over Satellite IP backbones using MPLS will be studied. Determine the architecture and requirementsfor internetworking ATN and the Next Generation Internet for real-time applications.