quality of delaware river water at trenton, new jersey of delaware river water at trenton, new...
TRANSCRIPT

Quality ofDelaware River Water atTrenton, New Jersey
GEOLOGICAL SURVEY WATER-SUPPLY PAPER 1779-X
Prepared in cooperation with the Commonwealth of Pennsylvania Department of Forests and Waters and with the City of Philadelphia Water Department


Quality ofDelaware River Water atTrenton, New JerseyBy LEO T. McCARTHY, JR., and WALTER B. KEIGHTON
CONTRIBUTIONS TO THE HYDROLOGY OF THE UNITED STATES
GEOLOGICAL SURVEY WATER-SUPPLY PAPER 1779-X
Prepared in cooperation with the Commonwealth of Pennsylvania Department of Forests and Waters and with the City of Philadelphia Water Department
UNITED STATES GOVERNMENT PRINTING OFFICE, WASHINGTON : 1964

UNITED STATES DEPARTMENT OF THE INTERIOR
STEWART L. UDALL, Secretary
GEOLOGICAL SURVEY
Thomas B. Nolan, Director
The U.S. Geological Survey Library catalog card for this publication appears after page X51.
For sale by the Superintendent of Documents, U.S. Government Printing Office Washington, D.C. 20402

CONTENTS
PageAbstract________________________________________________________ XIIntroduction. _____________________________________________________ 2
Prior studies,______-___-_-___-_-___-_--_----_-------__------__ 2Acknowledgments ___--_-_________---_________---_---_-__--_-__ 3Records of data--__-_-------_-_--------_-------__------------- 4
The river basin_________________________________________________ 5Physical features____-___---____-_-_____-_____-_____--_________ 7Climate._________._________________________________ 7
Water quality and the environment.___________--__-__-___--_-__-__-- 10Headwater tributaries and reservoirs-___-_______-__________-____- 10Lehigh River_______________________________________________ 19Trenton water a mixture_____________________-________________ 20
Typical water quality at Trenton__________________________________ 21Estimates of water quality________________________________________ 25Fluctuations in water quality.-_____________________________________ 26
Effect of streamflow___-_----_--------_--------______________ 26Source of water_____________________________________________ 29Precipitation and air temperature_____________________________ 30Extent of variation in concentrations__________________________ 32Water temperature._____________________________________ 33Quantities of solids carried by the river________________________ 35
Trends in water quality.______-__--__-__-_-----___-_____--_________ 37Water use._________________________________________ 38Concentration of dissolved solids._______________________________ 38Reservoirs. ___ ______________ __________ 41Augmentation of low flows_____ _______________________________ 45
Estimates of natural discharge___ ___________________ 46Estimates of projected discharge, 1965-66____________________ 48
Oxidation of wastes-_____----_----____-_---_-----___--___-____- 49Summary_______________________________________________________ 49Selected references _________-_-_-_____-______--__-__-_-____-_____ 50
ILLUSTEATIONS
Page PLATE 1. Map showing the Delaware River basin________________ In pocketFIGURE 1. Physiographic provinces, Delaware River basin__________ X6
2. Composition of water, Delaware River and selected tributaries,1945-61____________________________ 21
3. Relation of dissolved-solids concentration to specific con ductance, Delaware River at Trenton, 1945-61_______ 25
4. Hardness of water and concentrations of sulfate and bicar bonate ions as related to specific conductance, Delaware River at Trenton, 1945-61___________________ 27
in

IV CONTENTS
PageFIGURE 5. Concentrations of calcium, magnesium, sodium plus potassium,
and chloride as related to specific conductance, Delaware River at Trenton, 1945-61___________________ X27
6. Annual mean dissolved-solids concentration, Delaware Riverat Trenton, 1945-61. ____. _________________ 28
7. Relation of dissolved-solids concentration to streamflow, Del aware River at Trenton, 1945-60________________ 28
8. Mean monthly water discharge and dissolved solids concentra tion, Delaware River at Trenton, 1945-61.___...___ 29
9. Monthly average of daily maximum and minimum watertemperatures, Delaware River at Trenton, 1945-61 _______ 34
10. Water discharge and loads of dissolved and suspended solids,Delaware River at Trenton, 1950-61____________ 36
11. Average monthly precipitation at Port Jervis, Allentown, and Trenton, and monthly mean discharge and dissolved- solids concentration, Delaware River at Trenton 1945-61__ 39
12. Cumulative dissolved solids and cumulative discharge, Dela ware River at Trenton, 1945-61______________________ 40
13. Trend in dissolved-solids concentration, Delaware River atTrenton, 1945-61__________________________ 41
TABLES
Page TABLE 1. Principal tributary streams of Delaware River above Trenton. X10
2. Chemical analyses of the Delaware River and its tributaries atlow flow, 1949-61___________________________ 12
3. Chemical quality of tributaries, Delaware River upstreamfrom Trenton, 1945-61______________________ 18
4. Typical composition of Delaware River water at Trenton__ 215. Chemical quality of Delaware River from Riegelsville, N.J., to
Trenton, October 30-31, 1956___________________ 236. Chemical quality of Delaware River from Belvidere, N.J., to
Trenton, July 26, 1962_______________._____ 247. Maximum and minimum values and frequency distribution of
published composite analyses, Delaware River at Trenton, October 1944-September 1961__________________ 32
8. Typical frequency distribution of dissolved-solids concentra tions in Delaware River at Trenton, 1945-61 _____________ 35
9. Dissolved-solids loads, Delaware River at Trenton, 1945-61 __ 3510. Discharge-weighted average dissolved-solids concentrations,
Delaware River at Trenton, 1945-61_________ ____ 4211. Discharge of Delaware River at Trenton, by 4-year periods,
1945-60_______________________________ 4212. Reservoirs in Delaware River basin above Trenton. _________ 4313. Observed and estimated discharge and dissolved solids, Dela
ware River at Trenton, based on hydrologic data, October 1961-Octobe- 1962._________________________ 46

CONTRIBUTIONS TO THE HYDROLOGY OF THE UNITED STATES
QUALITY OF DELAWARE RIVER WATER AT TRENTON, NEW JERSEY
By LEO T. MCCARTHY, Jr., and WALTER B. KEIGHTON
ABSTRACT
Water in the Delaware River at Trenton, N.J., is a mixture of several types water from the mountainous headwater region, water from the coal-mining regions, and water from the limestone valleys. The quantities of these types of water, in relation to the total quantity of water at Trenton, vary with changes in season and reservoir releases.
The chemical quality of the water during the 17-year period 1945-61 was excellent, and the water was suitable for most uses after little or no treatment. The average concentration of dissolved solids was 86 ppm (parts per million), and 90 percent of the time it ranged from 57 to 126 ppm. Usually the pH of the water was close to 7.0 (considered to be a neutral point neither acid nor alka line) . The hardness was less than 86 ppm 95 percent of the time. The general composition of the dissolved-solids content, in terms of equivalents, is 28 percent calcium, 14 percent magnesium, 8 percent sodium plus potassium, 43 percent bicarbonate plus sulfate, 5 percent chloride, and 2 percent nitrate. Concentra tions of minerals in the river water are lowest during March, April and May (median concentration of dissolved solids, 66 ppm) and are highest during August and September (median, 107 ppm).
Each year an average of 880,000 tons of dissolved solids and 932,000 tons of suspended solids are carried past Trenton by the Delaware River. The greatest monthly loads of dissolved solids are in March and April, and the smallest are from July to October. Suspended-solids loads are greater when the streamflow is high but small the rest of the time. Concentration of suspended solids exceeds 100 ppm only 5 percent of the time.
The headwaters in the Delaware River basin are the source of water of excel lent quality. Much of this water is stored in reservoirs, and when released during August and September, it improves the quality of the water at Trenton. These releases to augment low flow have the effect of narrowing the range of concentrations of dissolved constitutents. In 1952 and 1962, 6 and 19 percent, respectively, of the drainage area above Trenton was regulated by reservoirs. After proposed construction, 60 percent will be regulated by 1975. Thus, it may be that the high concentrations of dissolved constituents observed in the 1945-61 period will not occur again.
XI

X2 CONTRIBUTIONS TO THE HYDROLOGY OF THE UNITED STATES
It is probable that the water quality observed during the period 1945-61 (dissolved solids 57-126 ppm 90 percent of the time, pH close to 7.0, hardness less than 86 ppm 95 percent of the time) is representative of what can be ex pected in the future, for a variety of hydrologic conditions were experienced in the 17-year period.
INTRODUCTION
The Delaware Eiver is important to 23 million people in four States, for the economy of the area depends in part on the water potential of the river. Although the quantity is significant, the quality of the water determines its value for domestic and industrial uses. There fore, any comprehensive plan for management of the basin's water must be concerned with the quality as well as the quantity. The pur pose of this report is to describe the chemical quality of the Delaware Eiver water at Trenton; to identify the hydrologic, geologic, and cultural factors that are responsible for variations in the quality; and to speculate on possible future changes in the water quality.
Trenton is the farthest downstream point at which the water of the Delaware Eiver has continuously been gaged. Below Trenton the river is tidal, and the fresh water mixes with salty ocean water. Analyses of water at Trenton reflect changes in water quality in the upstream part of the basin. These analyses also characterize the in flow of water and its principal constituents, including sediment as well as dissolved minerals, into the tidal estuary. Tidal mixing, upstream as well as downstream velocities, numerous effluents from municipali ties and industries along both banks, and other factors make analysis of water quality in the tidal estuary very complex.
The U.S. Geological Survey has measured streamflow at Trenton continuously since October 1912 and has collected and analyzed water samples since October 1944. During the IT years from October 1944; through September 1961, over 6,200 daily samples have been collected, of which 534: composites have been analyzed. In this report the results of these analyses are summarized, and both the typical water quality and the extent of variation from the typical are described. The environment which causes these changes is also discussed, and the effects on water quality that are caused by drought, flood, reservoir operation, streamflow regulation, and population increase are indi cated. Plans have been initiated to develop the water resources of the basin more fully through the construction of reservoirs. The facts given in this report will be helpful to the orderly management of the basin's water resources.
PRIOR STUDIES
Several comprehensive studies of the Delaware Kiver basin have been made, but, in general, they have reported little on water quality
QUALITY, DELAWARE EWER WATER, TRENTON, N.J. X3
in the fresh-water part of the basin. In 1933 the U.S. Army Corps of Engineers completed the so-called 308 report. This report dealt with navigation, hydroelectric power, flood control, irrigation, and water supply; but it gave no recommendations for the development of the water resources. The Committee on Public Works of the U.S. Senate directed in April 1950 that the 308 report be reviewed by the Corps of Engineers to determine the extent to which updating was necessary.
Subsequently, two hydrologic events occurred in the Delaware River basin that gave impetus to the review of this report. In August 1955 a disastrous flood caused a loss of more than 100 lives and caused prop erty damage in excess of $100 million. In 1957 an intense 6-month drought affected the quality of water in the tidal part of the river, and the salinity front moved upstream to Philadelphia. These events emphasized the need for a more comprehensive study of the water resources of the Delaware basin.
To help them carry out the Congressional directive, the Corps of Engineers established the Delaware River Basin Survey Coordinating Committee, which included representatives from Federal agencies and from the States of New York, Pennsylvania, New Jersey, and Dela ware, as well as the cities of New York and Philadelphia. Specific assignments were delegated to various Federal, State, and city agencies for certain studies to be included in the corps' comprehensive report. The coordinating committee periodically reviewed the progress of the agencies' studies and worked in close cooperation with the corps' Valley Report Group, which was responsible for reviewing, preparing, editing, and publishing the finished report. The results of the inves tigation were published in 1960 in the "Report on the Comprehensive Survey of the Water Resources of the Delaware River Basin," herein after referred to as the "comprehensive report."
Volume 1 of that report summarizes the significant features of the survey and presents a long-range plan for the development of the water resources of the Delaware River basin. In 25 appendixes, the corps and the cooperating agencies discuss in detail flood control, navigation, geology, hydroelectric power, recreation, fish and wildlife, water sup ply, and present and estimated future demands on the water resources of the basin to the year 2010. Much information about the flow and water quality at Trenton is given in the report and appendixes.
ACKNOWLEDGMENTS
The quality-of-water investigations of the Delaware River basin above Trenton have principally been centered around the main stem Delaware River and its tributaries in Pennsylvania. Cooperative funds for the project were furnished by the Pennsylvania Department of Commerce from October 1944 to September 1954 and from October
X4 CONTRIBUTIONS TO THE HYDROLOGY OF THE UNITED STATES
1956 to September 1958; by the Pennsylvania Department of Forests and Waters from October 1958 to 1963; and, for the chemical-quality sampling station at Trenton, by the Philadelphia Water Department since October 1954. Since October 1961, cooperative funds for inves tigating the chemical quality of New Jersey tributaries have been fur nished by four agencies of the State of New Jersey. Chemical-quality investigations were conducted under the general supervision of W. F. White, Jr., district chemist 1944-52, and N. H. Beamer, district chem ist 1952-64, Water Eesources Division, U.S. Geological Survey.
The results for 1944^51 were published by the Pennsylvania Depart ment of Commerce State Planning Board, and the Pennsylvania Department of Forests and Waters (1947, 1951,1953). Some of the data on water quality at Trenton were discussed by Durf or and Keigh- ton (1954) and by Durf or and Anderson (1963). Parker and others (1964) dealt comprehensively with the geology and hydrology of the basin, the chemical quality of the ground water and surface water, and the water-supply problems of the basin.
The Delaware Eiver Master has provided records of streamflow regulation and reservoir operation, and has assisted in the collection of water samples in the upper basin since 1954.
RECORDS OF DATA
Much of the information summarized in this report has been pub lished in tabular form in Geological Survey Water-Supply Papers. A compilation of streamflow records through September 1950 was published in Water-Supply Paper 1302. The following list updates the compilation through 1960:
Water-Supply Papers containing streamflow measurements for Delaware Riverat Trenton, N.J.
Year 1951 ____ _ ______1952 __ ____ __ __1953 _ _ __________1954 __ _ __ _ _1955 _ __ ____ ______
WSP __ __ 1202__ _ 1232__ _ 1272__ __ 1332- __ 1382
Year 1956 _ __1957 _ ____ __ ___1958 _ ____ _ _ _1959 __ _ _ ________1960 _ _ __
WSP ._ __ 1432. __ 1502
15521622
_ _ 1702
Surface-water records for the 1961 water year appear in "Surface Water Eecords of Pennsylvania, 1961," available from U.S. Geologi cal Survey, Harrisburg, Pa.; "Surface Water Eecords of New Jer sey, 1961," available from U.S. Geological Survey, Trenton, N.J.; and "Surface Water Eecords of New York, 1961," available from U.S. Geological Survey, Albany, N.Y.
Water-quality data for the Delaware Eiver at Trenton, N.J., have been published in the following Water-Supply Papers:

QUALITY, DELAWARE RIVER WATER, TRENTON, N.J. X5
Water-Supply Papers containing chemical-quality, temperature, and sediment data, for Delaware River at Trenton, N.J.
1945.Year
1953- _________ _-_.1954__ _________ ___.
1956__ _________ ---.1957- ___________ .1958- ________ - _ -1959- ______ -
WSP . _____ 1290______ 1350______ 1400______ 1450. ___ 1520.__.__ 1571. ___ 1641. ___ 1742
Year WSP________________ 1030__________________ 1050_______________________ 1102
1948-_______________ 11321949________________ 11621950.________________ 11861951-________________ 11971952-________________ 1250
THE RIVER BASIN
The Delaware Kiver rises as the East Branch Delaware Kiver and the West Branch Delaware River; both drain the western slopes of the Catskill Mountains in New York State (pi. 1). The main stem of the river is formed by the confluence of these branches below Hancock, N.Y., whence it flows southward about 200 miles to the head of tidewater at Trenton, N.J.
A small section of the West Branch Delaware River and the main stem form the boundary between New York and Pennsylvania for approximately 84 miles. From the tristate point below Port Jervis, N.Y., to Trenton, N. J., the river forms the boundary between Pennsyl vania and New jersey for approximately 131 miles. At Trenton the Delaware River has a drainage area of 6,780 square miles 2,362 in New York, 3,278 in Pennsylvania, and 1,140 in New Jersey.
The Delaware River drains two major physiographic divisions the Appalachian Highlands and the Atlantic Plain (fig. 1). Between them is a narrow strip of land called the Fall Line, or more appropri ately the Fall Zone. In the basin this zone is manifested by the char acteristic change from the consolidated hard rocks of the Piedmont province to the unconsolidated sedimentary deposits of the Coastal Plain province. At Trenton the river drops about 8 feet as it passes over the Fall Zone to the head of tidewater in the Delaware estuary.
The stream-gaging and water-quality sampling station on the river at Trenton is at the Calhoun Street bridge between Morrisville, Pa., and Trenton. This bridge is approximately 1 mile above the head of tidewater at the upstream edge of the Fall Zone. In the 1-mile stretch the river passes over a series of rock ledges known as Trenton Falls. Therefore, at Trenton the river drains entirely from the hard-rock area of the Appalachian Highlands division. The drainage area at Trenton is 53 percent of the total drainage area of the basin.
735-912 64 2

X6 CONTRIBUTIONS TO THE HYDROLOGY OF THE UNITED STATES
NEW YORK. J^Hancoci PENNSYLVANIA^
*5*V. . ^ Trento C UA\ ^
5 0 5 10 15 20 25 30 MI LE
FIGUEK 1. Physiographic provinces, Delaware River basin.

QUALITY, DELAWARE RIVER WATER, TRENTON, N.J. X7
PHYSICAL FEATURES
The headwaters of the Delaware Eiver are in the Catskill Moun tains of New York, as part of the Appalachian Plateau province. In the Catskill Mountains, summits are generally 2,500-3,500 feet above sea level, though a few peaks are above 4,000 feet. The Pocono Mountains, farther south, are less rugged and have few sum mits as high as 2,000 feet above sea level. The exposed rock is coarse hard sandstone that resists erosion and dissolution. The area was once glaciated and has many lakes and swamps. Heavily forested, it is primarily an agricultural and recreational area and has a sparse population. Except for intermittent local conditions, there are no serious water-pollution problems in this area.
The Delaware River enters the Valley and Eidge province below Port Jervis, where the sedimentary rocks are folded and meta morphosed. Uplift and erosion have left a series of parallel valleys and ridges. The river flows parallel to the valleys and ridges until it cuts through the Kittatinny or Blue Mountain Eidge at the Dela ware Water Gap.
The Lehigh Eiver, a major tributary to the Delaware, also rises in the Appalachian Plateau province, and it cuts through the Blue Mountain Eidge at Lehigh Gap into the rolling agricultural land of the Great Valley, a part of the Valley and Eidge province. Some tributaries in the Appalachian Plateau province drain anthracite- coal regions. The Lehigh Eiver, at its confluence with the Delaware Eiver at Easton, Pa., which is 51 miles upstream from Trenton, drains an area of 1,364 square miles, one-fifth of the drainage area of the Delaware Eiver at Trenton.
From Easton the Delaware Eiver flows about 18 miles through the Eeading Prong of the New England province and then enters the Triassic Lowlands of the Piedmont province. The Triassic rocks are mostly sandstone, shale, and conglomerate, but they also contain some limestone, granite, and serpentine. All these rocks are relatively soft and, compared to the resistant rocks of the Appalachian Plateau province, are easily eroded and dissolved.
CLIMATE
The climate of the Delaware Eiver basin is mild, and abundant precipitation is well distributed throughout the year. The storm tracks usually move across the basin from the south and southwest in a north or northeasterly direction. The moisture-laden winds are deflected by the mountains; consequently, the average annual precipi tation is greater in the mountainous northern part of the basin than in the hilly region just north of Trenton. For example, the average
X8 CONTRIBUTIONS TO THE HYDROLOGY OF THE UNITED STATES
annual precipitation in New York, east of the Pepacton Reservoir, is 60 inches, but it is only 42 inches in Bethlehem, Pa. Over large areas of the basin, the average annual precipitation is 42-46 inches; about 50 percent occurs in the growing season, May to September. The average annual snowfall ranges from 20-25 inches in the lower basin to 60-70 inches in the upper basin north of Stroudsburg, Pa.
Runoff, the quantity of precipitated water carried away by stream- flow, ranges generally from 15 to 29 inches annually, although locally it has been as high as 42 inches. In most of the basin, runoff is greatest in March and April because the accumulated winter snows melt as air temperatures rise. In the growing season, ground water is taken up by the roots of plants and evaporated to the atmosphere by transpiration. As the ground-water table falls, hydraulic discharge to the streams decreases; and in August and September, runoff gen erally is at a minimum. Although 40-50 percent of the precipitation occurs in the growing season, only 26-31 percent (34 percent at Palmerton, Pa.) of the mean annual runoff occurs in the same May to September season. This information was given in detail by Hely, Nordenson, and others, (1961).
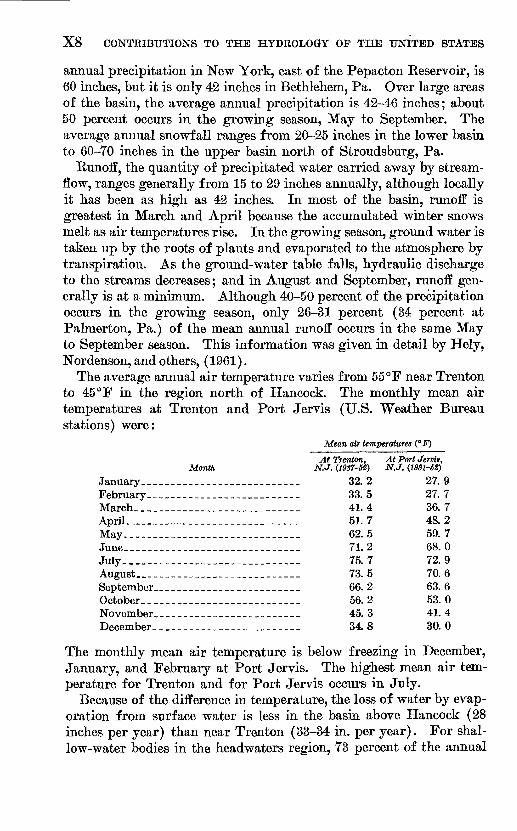
The average annual air temperature varies from 55°F near Trenton to 45 °F in the region north of Hancock. The monthly mean air temperatures at Trenton and Port Jervis (U.S. Weather Bureau stations) were:
Mean air temperatures (°F)
At Trenton, At Port Jervis, Month N.J. (1937-52) N.J. (19S1-52)
January___________________ 32.2 27.9February__________________ 33.5 27.7March____________________ 41.4 36.7April ___-_-__..____..___________ 51.7 48.2May...____-----___-___---_-__-- 62.5 59.7June--.___---__.____-_- -__ 71.2 68.0July.__--___--___--___-_-----_ 75.7 72.9August____________________ 73.5 70.6September_________________ 66.2 63.6October_______________________ 56.2 53.0November_________________________ 45.3 41.4December. __-____.._____._.__-__ 348 30.0
The monthly mean air temperature is below freezing in December, January, and February at Port Jervis. The highest mean air tem perature for Trenton and for Port Jervis occurs in July.
Because of the difference in temperature, the loss of water by evap oration from surface water is less in the basin above Hancock (28 inches per year) than near Trenton (33-34 in. per year). For shal low-water bodies in the headwaters region, 73 percent of the annual
QUALITY, DELAWARE RIVER WATER, TRENTON, N.J. X9
evaporation occurs in the growing season, whereas at Trenton only 68 percent occurs then. For deep-water bodies the May to September evaporation is less than for shallow-water bodies. Water is lost by evaporation from the land surface as well as from free water sur faces. Growing plants absorb water through their roots and evap orate it from their leaves; the process is known as transpiration. The total water loss, evapotranspiration, is determined by subtracting the average annual runoff from the average annual precipitation. The mean annual water loss in the headwaters region is from 18 to 19 inches and it increases to 20 inches at Stroudsburg and to 27 inches at Trenton.
Precipitation is greatest in the northern part of the basin, especially as snow. Water loss is less here due to the cooler temperatures. The runoff, or net water crop, varies from 15 to 42 inches per year. Although there is slightly more precipitation in the summer from heavy summer storms, precipitation is distributed rather uniformly throughout the year. Kunoff, however, is more variable. The larg est fraction of the annual runoff occurs in March and April, and it decreases during the summer months to a minimum in the autumn and winter.
There appears to be no long-term trend in precipitation and prob ably none in runoff. Hely, Nordenson, and others (1961) found that, for an average of precipitation at Albany, New York City, and Phila delphia for 130 years, "no continuing trend, either upward or down ward, is evident, although short-term trends, up to about 30 years, are apparent"; and they found that, for 49 years at Port Jervis, the runoff shows "no continuing trend upward or downward."
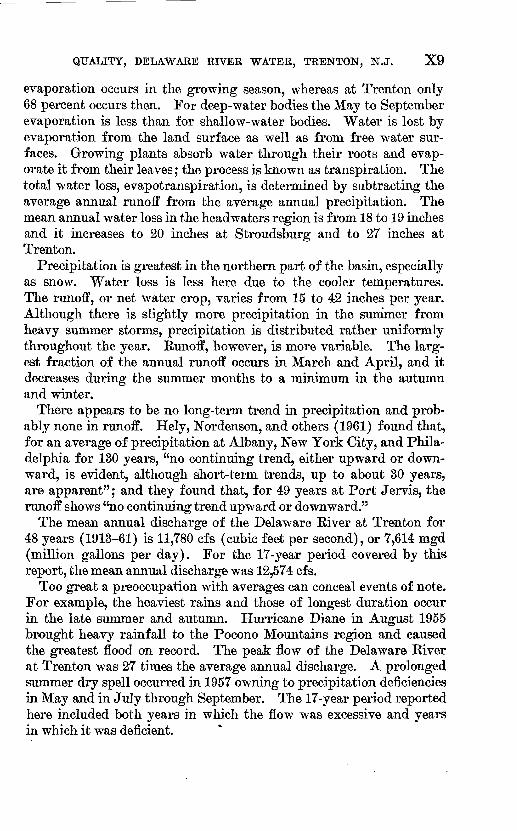
The mean annual discharge of the Delaware Kiver at Trenton for 48 years (1913-61) is 11,780 cfs (cubic feet per second), or 7,614 mgd (million gallons per day). For the 17-year period covered by this report, the mean annual discharge was 12,574 cfs.
Too great a preoccupation with averages can conceal events of note. For example, the heaviest rains and those of longest duration occur in the late summer and autumn. Hurricane Diane in August 1955 brought heavy rainfall to the Pocono Mountains region and caused the greatest flood on record. The peak flow of the Delaware Eiver at Trenton was 27 times the average annual discharge. A prolonged summer dry spell occurred in 1957 owning to precipitation deficiencies in May and in July through September. The 17-year period reported here included both years in which the flow was excessive and years in which it was deficient.

X10 CONTRIBUTIONS TO THE HYDROLOGY OF THE UNITED STATES
WATER QUALITY AND THE ENVIRONMENT
Earn or snow falling on the Delaware Eiver basin may reach the river at Trenton by a variety of paths. Precipitation from a moun tain thunderstorm may run off rapidly to the streams. A more gentle rain on a flatter, more permeable part of the basin may soak into the ground and flow slowly underground to a streambed. In its slow passage through the ground, it will dissolve minerals and will probably reach the stream more concentrated in dissolved solids than direct runoff would be. Furthermore, the rocks and soils in some parts of the basin are more easily dissolved than in other parts. Thus, the chemical quality of the water depends upon the path by which it reaches the Delaware River or its tributaries.
HEADWATER TRIBUTARIES AND RESERVOIRS
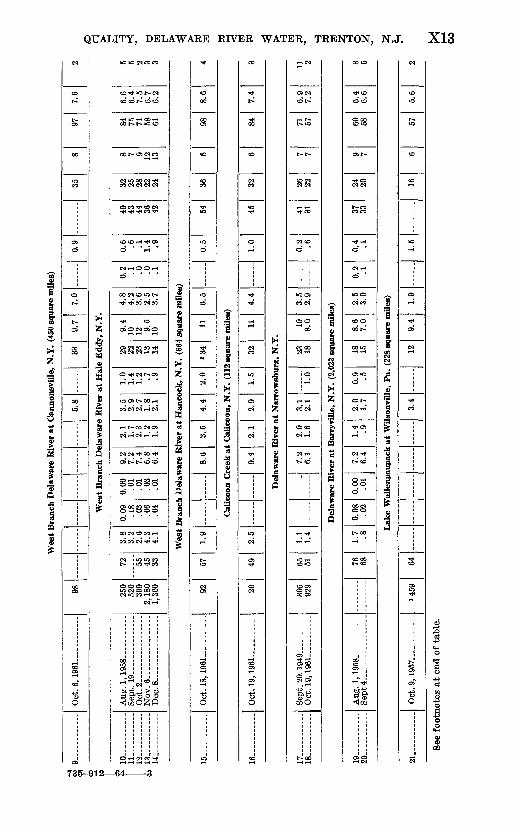
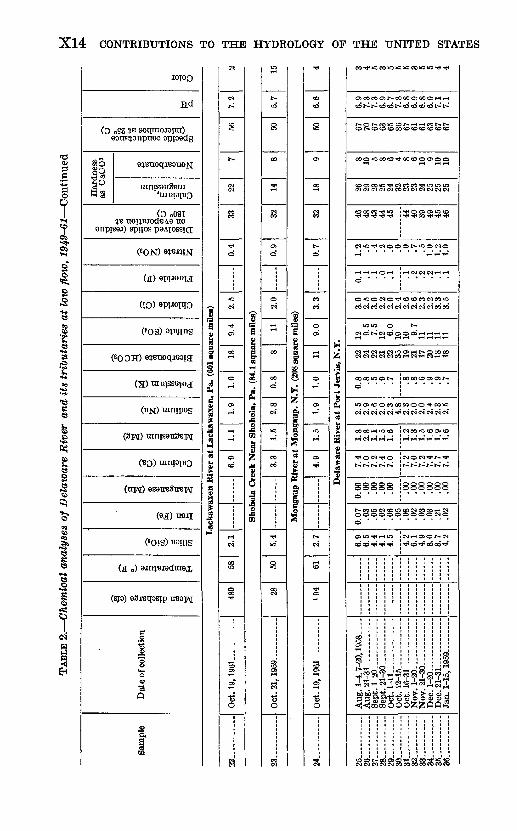
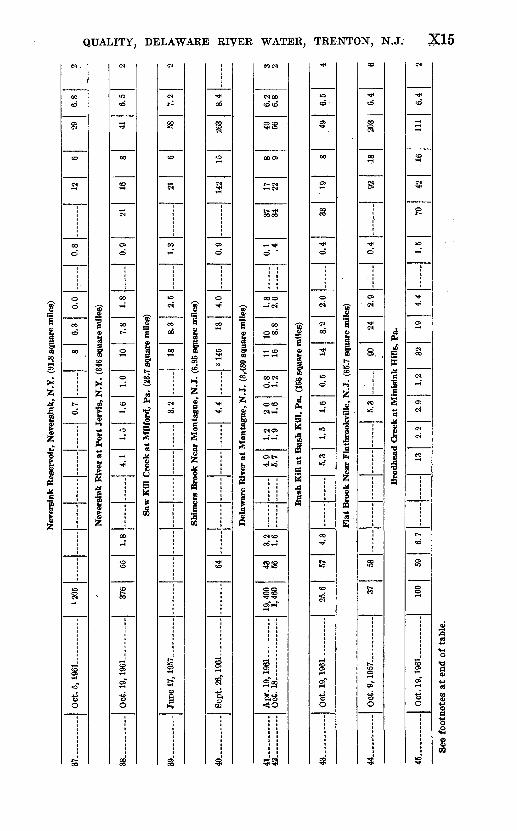
The principal streams tributary to the Delaware Eiver are given in table 1. These streams have a total drainage area of 5,558.2 square miles, which accounts for 82 percent of the drainage area at Tren ton. Chemical analyses of water samples from most of these streams are summarized in table 3, and detailed analyses are shown in table 2. Many of the samples were taken in the autumn during low base flow, when the streams contained a high proportion of ground-water dis-
TABLE 1. Principal tributary streams of Delaware River above Trenton, N.J.
Total drainage Stream area (sy mi) Physiographic province
East Branch Delaware 840 Appalachian Plateau.River.
West Branch Delaware 664 Do.River.
Equinunk Creek________ 57.7 Do.CaUicoon Creek. _.____... 112 Do.Lackawaxen River______ 601 Do.
Shohola Creek. _ _. ____ 84. 1 Do.Mongaup River. _________ 203 Do.Neversink River________ 346 Do.BushKill______--_------- 156 Do.Flat Brook._____________ 65. 7 Valley and Ridge.
Brodhead Creek._________ 287 Appalachian Plateau, Valley and Ridge.Paulins Kill.. _..___.__ 177 Valley and Ridge.Pequest River. __________ 153 Valley and Ridge, New England Upland.Martins Creek___________ 46. 7 Valley and Ridge.Bushkill Creek___ _ ___ 74. 8 Do.
Lehigh River__________ 1, 364 Appalachian Plateau, Valley and Ridge.Pohatcong Creek___-_____ 56.2 New England Upland.Musconetcong River._____ 158 Do.Tohickon Creek._____ 112 Piedmont.
QUALITY, DELAWARE RIVER WATER, TRENTON, N.J. XI1
charge. The water therefore had a higher concentration of dissolved solids than it has at other times of the year. The dry-weather stream- flow of late summer and early autumn contains a greater proportion of water which has been in contact with rocks for a long time and is therefore more highly mineralized. Consequently, when flows are low, the concentration of dissolved solids is generally greater than when flows are high.
The quality of the water from the East Branch Delaware River is excellent. The dissolved-solids concentration, 27-33 ppm (parts per million), and hardness, 17-22 ppm, are both low. For the eight samples collected, the pH ranged from 6.4 to 7.4, and the concentra tion of silica ranged from 1.8 to 2.9 ppm; that of chloride, from 1.0 to 2.7 ppm; and that of nitrate, from 0.2 to 1.9 ppm. The moun tain slopes in this area are steep, and runoff from rain quickly reaches the streams. Soil cover on the rocky ground is thin, so that little water sinks into the ground to be stored. The water consequently does not dissolve much of the rock and soil. Also, a large part of the precipitation falls as snow, which later melts and may run off rapidly over the ground to the streams. The popu lation density is low, and there is a minimum of industrial and sewage pollution. It is to be expected, therefore, that the water of the East Branch Delaware River would have a low concentration of dissolved solids.
The West Branch Delaware River also drains the western slope of the Catskill Mountains. Chemical analyses of water from the West Branch show somewhat higher dissolved-solids content (36-54 ppm), greater hardness (22-36 ppm), and greater variability in composi tion than the East Branch. Generally the dissolved-solids concen tration is greatest at low rates of streamflow and smallest at high rates of flow. For example, the dissolved-solids concentration for the Delaware River at Trenton (fig. 8) is greatest in July through October, when the water discharge is lowest. In a large reservoir, large quantities of low-concentration water mix with small quantities of high-concentration water. For this reason, the effluent from the reservoir is less variable than the inflow. Thus, the existence of the Pepacton Reservoir on the East Branch and the absence of a reservoir on the West Branch explain the greater variability in chemical quality of water from the West Branch. The Cannonsville Reser voir in now under construction on the West Branch, and completion is scheduled for 1964-65. When operation begins, the quality of water in this reservoir is expected to be much like that in the Pepac ton Reservoir, and the variability in quality of the water at Hancock is expected to be even less than it is now.

(X
03_
_O
O 35
1
£
toCO
i!
!!
O5"*
,_,
O5
^
Cnt
l-t
O
t-t 00
00 00
to10
i1
,_,*-
gto to
~a
Cnto
~a>*-
to
jjf
B
1
2
3» 3'J*
Bff
'*<
"3o m g
i.I
^I Oi Cn ^ CO
s?ss& o <j rt ^.ot) ooa"^
CO |-i CO
io
t ' (-*
tsco jog^I
Oil 1to i i
to to to to t->Oi Cjl CO CO 00
0
toS WO5O3
oooooo h-i O t-> t-» t-»
CnosOSCnOSO5 OlI^OSlI^
h-1 H-1
oo -*a io ~a *->
to l-'U il^Cn
0OSWOSh-iOO
OCOCOt-CO
coeoopoeo COO Cn^
10^101010
cnwaoo
ofOl-1*-* tO
,_!
-JCn tOW to
CO tO CO CO COf* -a »-» t-» os
I^l^l0l_>b0oooo>-'~ah-'
SPPooo
SSSSS:OS Oi OS OS OS
Cn to CO Cn <I
s
!&ofrS58
?Hs"21 '*
to
og^3»
I
1
>-* H^
<I
00
,_,
O
^00
00
~a
>*-CO
05
~a
CO
W
?
15?<p Pi»i5.5is-*+'><
-^
1ii
I ?i1
M^- 0So
00
at
00
4»
^
0
,_,CO
g
00
Cn
O>
to
1
W
IS-ft1
§
f?5 1£g- a
|7~Z
K
^
S
§fl>
g. s*
OQ
"S.<s
d8- <po
8
! f
Mean discharge (cfs)
Temperature (°F)
Silica (SiO3)
Iron (Fe)
Manganese (Mn)
Bicarbonate (HCOs)
Sulfate (SO4)
Chloride (Cl)
Fluoride (F)
Nitrate (NO3)
Dissolved solids (residue on evaporation at 180° C)
Calcium, g M magnesium jo
Noncarbonate o§
Specific conductance (micromhos at 25° C)
pH
Color
^
to1Q^
i~w i& *§
o
cr b co <a <p 9«J
a 1
|- ^1 §'f ^p s8 -s S" «* d *
s t 1 ?i 1§
S5
§^ O8h-* ^ fc~
rs
saivis aaiusui am, JLO iooionaiB: am, oil
Wes
t B
ranc
h D
elaw
are
Riv
er a
t C
anno
nsvi
lle,
N.Y
. (4
50 s
quar
e m
iles)
9
Oct
. 6, 1
96
1....
985.
833
9.7
7.0
0.9
358
977.
62
/r>W
est
Bra
nch
Del
awar
e R
iver
at
Hal
e E
ddy,
N.Y
. P
10
.11.... ...
....
12
13
14
Aug
. 1,
1958
.
Sep
t. 19
_ -
Oct.
2
Nov
. 6
_D
ec. 8
- ..
. ...
250
520
399
2,18
0 1,
300
72~~
~55~
45
33
3.8
3.2
2.6
4.3
4.1
0.09
.1
8 .0
3 .0
6 .0
4
0.00
.0
1 .0
1 .0
3 .0
1
9.2
7.2
7.4
6.8
6.4
2.1
1.7
2.3
1.2
1.9
3.5
2.9
2.7
1.8
2.1
1.0
1.4
1.2 .7
.9
29
22
23
13
14
9.4
10
12 9.5
10
4.8
4.2
3.6
2.5
3.7
0.2 .1
.0
.0
.1
0.6 .6
.1
1.4 .9
49
43
44
36
42
32 25
28
22
24
8 7 9 12
13
84
75
71
58
61
6.6
6.4
7.5
6.7
6.2
jITY,
DELloirawmm
>
Wes
t B
ranc
h D
elaw
are
Riv
er a
t H
anco
ck,
N.Y
. (6
64 s
quar
e m
iles
) ^
15.
Oct
. 18,
1961.-
.
9257
1.9
8.6
3.5
4.4
2.0
234
116.
50.
554
365
988.
64
H wC
alic
oon
Cre
ek a
t C
alic
oon,
N.Y
. (1
12 s
quar
e m
iles
) M
16.
- -
Oct
. 19
, 1961..
.,.
20
492.
59.
42.
12.
91.
532
114.
41.
045
326
847.
4H
3
» -* <!
Del
awar
e R
iver
at
Nar
row
sbur
g, N
.Y.
> rt
1718 "
Sep
t. 2
0. 1
949
Oct
. 19
, 1961
305
929
65
511.
1 1.
47.
26.
12.
01.
63.
12.
11.
023 18
10
8.0
3.5
2.9
0.2 .6
41
3126
22
7 771
57
6.9
7.2
H
11
»
2 - H JT
)D
elaw
are
Riv
er a
t B
arry
vill
e, N
.Y.
(2,0
23 s
quar
e m
iles
) gj v
19.
20
-
Aug
. 1,1
958
.
Sep
t4..
76
681.
7 .80.
08
.02
0.00
.0
17.
2 6.
41.
4 .92.
0 1.
70.
9 .518 15
8.6
7.0
2.5
3.0
0.2 .1
0.4 .1
37
3324
20
?60
58
6.4
6.6
3 o
5 *
Lak
e W
alle
npau
pack
at
Wil
son v
ille
, P
a. (
228
squa
re m
iles
) %
...........
C-.
91O
ct.
9, 1
957....
1459
643.
412
9.4
1.9
1.5
166
575.
62
See
foot
note
s at
end
of
tabl
e.
rN I-*
CO
TABL
E 2.
Che
mic
al a
naly
ses
of D
elaw
are
Riv
er a
nd i
ts t
ribu
tari
es a
t lo
w fl
ow,
1949-6
1 C
ontin
ued
Sam
ple
Dat
e of
col
lect
ion
I *~* n discharge
03 V S
-v w iperatu
re (°
O S- 03 .ss a O
CH :ganese
(M
i S 03
'3'
o a" _2 ^
o
"So nesium
(M *? 03
"o? a _2 1
'
ssium
(K) a -s
o o rbonate
(H «
o CO. S
iride
(Cl)
^ o
S <a o _g
O g i3 2
ID 'M ^ a
»lved
solids evaporati
o: )°C)
Ȥ
S
O
Har
dnes
sas
CaC
Os
a it 0
earbonate a o
O
1«
03 iflc
condud icromho
s a:
So
ft CO
M a
0 O
Lac
kaw
axen
Riv
er a
t L
acka
wax
en,
Pa.
(60
1 sq
uare
mile
s)
O9
Oct
. 19
, 19
61
_
48
058
2.1
6.9
1.1
1.9
1.0
189.
42.
50.
433
227
567.
2
Shoh
ola
Cre
ek N
ear
Shoh
ola,
Pa.
(84
.1 s
quar
e m
iles)
23
Oct
. 21
, 19
59__
. __
.
2850
5.4
3.3
1.5
20
0.8
811
2.0
0.9
3214
850
5.7
If
Mon
gaup
Riv
er a
t M
onga
up, N
.Y.
(208
squ
are
mile
s)
24
Oct
. 19
, 1961. _
-19
461
2.7
4.9
1.5
1.9
1.0
119.
03.
30.
732
189
506.
64
Del
awar
e R
iver
at
Por
t Je
rvis
, N.Y
.
25. __ . _ ..
26. ____
27
28
29 ___
30
31. -
32 _ .
33
34. _ - ..
...
35. _
36
Aug.
1-4, 7-
20, 19
58.
Aug.
21-31. ___ ..
. Se
pt. 1-20..
.... ..
..Se
pt. 21-30.. _ . __
Oct. 1-11 .
Oct. 12-
15. ____ -
Oct. 16-31
Nov.
1-20
Nov.
21-
30-.
Dec.
1-20
Dec.
21-31 ___
Jan. 1-1
5, 1959
--
--
........
....
..
....
..
_. _ _
::::::
6.9
6.5
4.4
4.1
4.5
4.2
6.1
4.9
8.0
3.7
4.2
0.07
.03
.05
.02
.06
.05
.08
.02
.03
.03
.21
.02
0.00
.0
0 .0
0.0
0 .0
0
.00
.00
.00
.00
.00
.00
7.4
7.0
7.2
7.4
7.0
7.2
7.0
7.2
7.4
7.7
7.4
1.8
2.8
1.1
1.5
1.6
1.2
1.3
1.5
1.6
1.9
1.6
2.5
2.9
2.6
2.0
2.3
4.8
2.3
2.0
2.0
2.4
2.3
2.5
08 8 5 9 7 8 8 6 9 9 7
22
24
22 21
22 35 19
21
17
20 18
18
12 9.5
7.5
12 6.0
10 10 9.7
11
11 11
11
3.0
2.5
3.0
2.2
2.0
2.4
2.6
2.6
2.3
2.2
3.3
3.5
0.1 .1
.1 .0
.1 .1 .2
.2
.2 .1
.1
1.2 .5
.4 .2
.0 .0 .0
.7
.5
1.0
1.2
1.0
46
48
43 44
45 44
40
39
49 45
46
26
29
23 25
24 32 23
23
24
25 25
25
8 10 5 8 6 4 8 6 10 9 10
10
67
70
67 63
65 86 67
61
61
63 67
67
6.9
7.3
7.3
6.9
6.7
7.8
6.8
6.9
6.8
6.9
7.1
7.1
3 4 5 3 5 5 5 3 5 5 4 4
Nev
ersi
nk R
eser
voir
, Nev
ersi
nk,
N.Y
. (9
1.8
squa
re m
iles)
37
O
ct.
5, 1
961
»205
0.7
86.
30.
00.
812
629
6.8
2
Nev
ersi
nk R
iver
at
Por
t Je
rvis
, N.Y
. (3
46 s
quar
e m
iles)
!8
Oct
. 19
, 1961
376
551.
84.
11.
51.
61.
010
7.8
1.8
0.9
2116
841
6.5
2
Saw
Kill
Cre
ek a
t M
ilfor
d, P
a. (
23.7
squ
are
mile
s)
39Ju
ne 1
7, 1
957. .
.. .
3.2
is8.
32.
51.
321
658
7.2
2
Shim
ers
Bro
ok N
ear
Mon
tagu
e, N
. J.
(6.9
5 sq
uare
mile
s)
40
Sep
t. 26
, 19
61
644,
431
4518
4.0
0.9
142
1526
38
4
Del
awar
e R
iver
at
Mon
tagu
e, N
. J.
(3,4
80 s
quar
e m
iles)
41 42
__
Apr. 19, 1961-
.-
Oct. 18.. __ - __ -
19,400
1,46
043 56
3.2
1.6
4.9
5.7
1.2
1.9
2.0
1.6
00
1.2
11 1610 8.
81 8
2.6
0.1 .4
37 3417 22
49 566.2
6.8
2
fi>
Bus
h K
ill a
t B
ush
Kill
, P
a. (
156
squa
re m
iles)
13O
ct.
19, 1
961
25.6
574.
35.
31.
51.
60.
514
8.2
2.0
0.4
33'
1049
6,5
Fla
t B
rook
Nea
r F
latb
rook
ville
, N
. J.
(65.
7 sq
uare
mile
s)
44
..
Oct
. 9,
1957
3758
5.3
9024
2.9
0.4
9218
203
fi4
6
Bro
dhea
d C
reek
at
Min
isin
k H
ills
, P
a.
45. _
____ -
Oct
. 19
, 1961
100
596.
713
2.2
2.9
1.2
3219
4.4
1.5
704.
916
111
6.4
See
foot
note
s at
end
of
tabl
e.O
t

X16 CONTRIBUTIONS TO THE HYDROLOGY OF THE UNITED STATES
oI *» 05
I
^
Q
$
§
i
(O 09Z W soqmojaim) ODire^onpnoa ogpadg
ranisanSmn'
(Oo08I ye notj'BJOdBAa no
anpisaj) spnos paApssio;
(8ON) a^J«M
(8 OOH)
(2) raniss^oj;
(ej;) noil
POTS) v*ms
Bus
hkill
Cre
ek a
t E
asto
n, P
a. (
74.8
squ
are
mile
s)
51O
ct.
20, 1961 ..
568.
360
2325
2.8
187
117
1012
362
244
9155
17.
78
Leh
igh
Riv
er a
t E
asto
n, P
a. (
1,36
4 sq
uare
mil
es)
52
53
54
55
Oct
. 3-
10,
1961
... _
...
Oct
. 11-2
0 _
- _
-O
ct. 20_ ..
.O
ct. 2
1-3
1
613
63
7.8
7.8
8.6
7.8
29
34
30
33
11
10
13
12
9.8
9.8 12
12
5.0
6.0
9.0
8.0
78
76
96
86
52
55
59
68
11
12
12
13
13
15
8.3 14
184
192
216
206
118
126
129
132
54
64
50
62
298
316
339
333
7.0
7.0
7.4
7.3
5 3 2 2
Poh
atco
ng C
reek
at
Car
pent
ersv
ille
, N
.J.
(57.
1 sq
uare
mil
es)
56S
ept.
6, 1
961
6914
429
6.0
148
3029
87.
4
Del
awar
e R
iver
at
Rie
gels
vill
e, N
.J.
(6,3
28 s
quar
e m
iles
)
57O
ct.
20, 1
96
1
3,03
062
4.1
186.
76.
82.
858
247.
63.
911
473
2518
27.
34
Mus
cone
tcon
g R
iver
at
Rie
gels
vill
e, N
. J.
(158
squ
are
mil
es)
58O
ct.
20, 1961
7259
8.9
2915
6.8
2.0
135
246.
14.
817
313
424
281
7.4
3
Toh
icko
n C
reek
at
Poi
nt P
leas
ant,
Pa.
(11
2 sq
uare
mil
es)
59O
ct.
30,
1956
... _
__
_ f
2655
7.1
3.9
6843
112.
586
3823
46.
927
Del
awar
e R
iver
at
Tre
nton
, N
J.
(6,7
80 s
quar
e m
iles
)
60
61
62
Oct
. 1-
10, 196
1..
Oct
. 11
-20.
__
Oct
. 2
1-3
0
3,02
9 2,
822
2.89
4
63
63 57
5.0
2.5
2.5
18
18
18
7.5
7.1
7.1
8.8 10
8.
8
2.0
2.2
2.2
64
62
62
28
28
28
7.6
8.0
7.8
4.7
4.3
4.5
118
118
115
76
74 74
24
23
23
193
196
192
7.6
7.8
7.7
3 3 3
1 R
eser
voir
rele
ase.
2 Inc
lude
s 2
ppm
car
bona
te (
CO
s).
8 Inc
lude
s 5
ppm
car
bona
te (
CO
a).
* Inc
lude
s 7
ppm
car
bona
te (
CO
3).

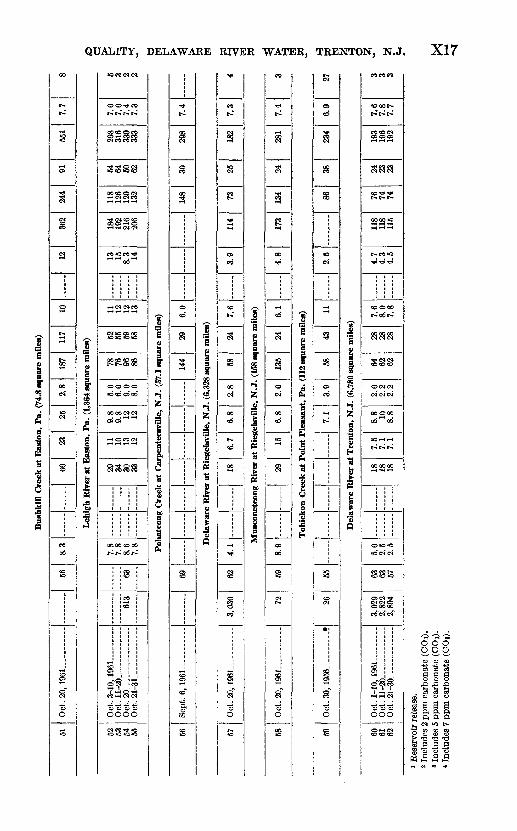
X18 CONTRIBtmONS 'TO THE" HYDROLOGY OF THE UNITED STATES
TABLE 3. Chemical quality of tributaries, Delaware River upstream from Tren ton,, N.J., 1945-61
Stream
East Branch Delaware River.. West Branch Delaware River. Delaware River at Narrows-
burg and Barry ville, N.Y ... Tributaries: CaUicoon Creek
Delaware River at Port Jervis, N.Y. .-_ _ _.
Delaware River at Montague, N.J._._ __._
Tributaries: Neversink River to Flat Brook above Tocks Island _______ ...
Brodhead Creek ...............Tributaries: Cherry Creek to
Delaware River at Belvidere, N.J.. ..................... 1
Lehigh River _ ..............Delaware River at Riegelsville,
N.J.. ............ ...........Pohatcong Creek, Musconet-
Delaware River at Trenton, N.J.. . ___._
Sample !
1-8 9-15
17-20
16, 21-24
25-36
41,42
37-40,43,44
4546-48,
50,51
4952-55
57
56, 58, 59
60-62
Calcium (Ca)
(ppm)
5.6-6.4 6. 4-9. 2
6. 1-7. 2
3. 3-9. 4
7. 0-7. 7
4.9-5.7
13
4ft-fiA
9.029-34
18
18
Magne sium (Mg) (ppm)
0. 7-1. 6 1.2-3.5
.9-2.0
1. 1-2. 1
1.1-2.8
1. 2-1. 9
2.2
11-23
2.610-13
6.7
7. 1-7. 5
Sulfate (SOd
(ppm)
7.8-10 9.4-12
7.0-10
9. 0-11
6.0-12
8.8-10
6.3-24
19
23-117
1052-59
24
24-43
28
Dissolv ed solids (residue
on evap oration at 180°
0)
27-33 36-54
31-41
32-45
39-49
34-37
70
191-362
45184-216
114
115-118
Sard- ness as CaCO3 (Calci
um, mag nesium) (ppm)
17-22 22-36
20-26
14-32
23-32
17-21
12-142
42
120-244
33118-132
73
86-148
74-76
Specific conduct ance (mi- cromhos at 25°C)
43-54 58-98
57-71
50-84
61-86
49-56
29-263
111
233-551
80298-339
182
234-298
192-196
pH
6. 4-7. 4 6.2-8.6
6. 4-7. 2
6. 6-7. 4
6. 7-7. 8
6.2-6.8
6. 2-8. 4
6.4
7.3-8.4
7.27.0-7.4
7.3
6. 9-7. 4
7.6-7.8
i Numbers refer to table 2.
Pepacton Reservoir, completed September 1954, intercepts drain age from 371 square miles of the East Branch; the Cannonsville Reservoir will intercept 450 square miles of the drainage of the West Branch. This 821 square miles is 12 percent of the total drainage area of the Delaware River at Trenton. Releases of water from these reservoirs to augment the flow of the river will further improve the quality of water in the river by diluting the higher concentrations of dissolved solids that normally exist during periods of low flow.
The water in the Delaware River at both Narrowsburg and Barry- ville, N.Y., is much like that in the East Branch Delaware River at both Hancock and Fishs Eddy, N.Y., and like that in Lake Wallen- paupack. Water is released from Lake Wallenpaupack for the pro duction of hydroelectric power. The water of the Mongaup River is also used for the generation of electricity, so the release of water depends solely upon the needs for power. Water from both sources, as well as from other streams in the Appalachian Plateau province, is of excellent quality. The quality of Delaware River water at Port Jervis quite logically reflects a mixture of the waters from the East and West Branches.
The Neversink Reservoir on Neversink River began operation in 1953. Like the Pepacton Reservoir, it is used for water supply by
QUALITY, DELAWARE RIVER WATER, TRENTON, N.J. X19
the city of New York and for augmenting low flows. Water of the Neversink River is lower in dissolved-solids content than is any other water listed in table 2.
From Port Jervis downstream to below Tocks Island, the tribu taries on the Pennsylvania side, such as Saw Kill Creek at Milford and Bush Kill at Bushkill, Pa., drain from the Appalachian Plateau province and have water of the same excellent quality as that found in the upper part of the basin. Tributaries from the New Jersey side, however, drain from the Kittatinny Mountains of the Valley and Ridge province. The high hardness of water of Shimers Brook near Montague, N.J., (142 ppm) and of Flat Brook at Flatbrook- ville, N.J., (92 ppm) is due to calcite dissolved from the valley rocks in parts of the Valley and Ridge province. The water in streams at higher elevation in this province is similar in chemical quality to water found in streams throughout the Appalachian Plateau province.
Paulins Kill and Pequest River also drain the Valley and Ridge province and contribute higher concentrations of dissolved solids and greater hardness than does water of the upstream tributaries. Water in the Delaware River at Belvidere, N.J., consequently contains more dissolved solids than does water at Montague. There are two small tributaries between Belvidere and Easton Martins Creek and Bush- kill Creek. Both drain rolling country in the Valley and Ridge province in Pennsylvania where the underlying rocks are slate and limestone. Dissolved-solids concentrations are higher in the tribu taries in the Valley and Ridge province than they are in the streams in the Appalachian Plateau province because of the kind of rocks through which the water percolates.
LEHIGH RIVER
The Delaware River is joined by the Lehigh River at Easton. The Lehigh River drains 1,364 square miles, or 20 percent of the drainage area of the Delaware River basin at Trenton.
The chemical quality of the headwaters of the Lehigh River is sim ilar to that of water in the upland zone on the Delaware River. From White Haven to Jim Thorpe, Pa., however, most of the tributaries entering the Lehigh River from the west are influenced by acid mine drainage from the anthracite-coal fields. This acid mine water is predominantly a calcium sulfate type. Downstream below Lehigh Gap, most of the tributary inflow to the Lehigh River is a calcium bicarbonate water. At its confluence with the Delaware River, the major dissolved constituents in the Lehigh River are calcium, magne sium, bicarbonate, and sulfate ions.
The Allentown-Bethlehem-Easton area in Pennsylvania is the most populous and industrialized part of the Delaware River basin above

X20 CONTRIBUTIONS TO THE HYDROLOGY OF THE UNITED STATES
Trenton. Its wastes, no doubt, contribute to the dissolved-solids con tent of the Lehigh River and to the Delaware River below the Lehigh. From Belvidere, which is upstream from Easton, to Riegelsville, down stream from Easton, Delaware River water increases more than two fold in dissolved-solids content. There is little further change in the quality of Delaware River water between Riegelsville and Trenton.
TRENTON WATER A MIXTURE
The water at Trenton is a mixture of water from the Appalachian Plateau province, which has a low dissolved-solids concentration (25- 50 ppm) ; water from the Valley and Ridge province and the Piedmont province which has a much higher dissolved-solids concentration (114-362 ppm); and, finally, water from the Lehigh River, which also has a high dissolved-solids concentration (184-216 ppm).
The quality of the Delaware River water at Trenton can be expected to vary with the relative quantities of water from the various parts of the basin. Water that results from heavy rainfall or snowmelt in the northern mountainous part of the basin will be more effective in lower ing the dissolved-solids concentration in the water at Trenton than will water from corresponding rainfall in the middle Lehigh River basin. However, the net result of heavy rainfall in any part of the basin is generally a lowering of dissolved-solids concentration in the water at Trenton.
The composition of the dissolved solids in the water at Trenton also might be expected to vary with the proportions of water from various parts of the basin. It is observed, however, that the dissolved solids in the water at Trenton have a remarkably constant composition be cause most of the water that flows into the Delaware River above Trenton does not differ greatly in composition of dissolved solids. Paulins Kill and Pequest River contain smaller proportions of sulf ate and larger proportions of magnesium and bicarbonate than does the Delaware River water at Montague. However, these two streams to gether supply less than 10 percent of the total water at Trenton, and their effect on the composition of the dissolved solids is not considered significant.
The composition of the dissolved solids in the Delaware River and selected tributaries above Trenton is shown in figure 2. In Delaware River water the percentage of calcium decreases and that of sodium plus potassium increases slightly from Montague to Riegelsville to Trenton. Compared to the main stem of the Delaware River, the Musconetcong River has a greater percentage of magensium; Paulins Kill, the Pequest River, and the Musconetcong River have more bicar bonate and less sulf ate; and Martins Creek, Bush Kill, and the Lehigh River have a larger percentage of sulfate. It should be emphasized

QUALITY, DELAWARE RIVER WATER, TRENTON, N.J. ,X21
50
< 40
<y30
20
10
177 158DRAINAGE AREA (SQUARE 47 75 1364 158
MILES) 3480 6172 6780
X X
DNa + K
Mg
Ca
Cl
S04
HCO,
FIGURE 2.- -Composition of water, Delaware River and selected tributaries, 1945-61. Figures at top of columns give drainage area, in square miles.
that most of the six analyses in figure 2 that form the basis for the comparison represent water at low base flow when the dissolved-solids concentration is about as high as might be expected.
TYPICAL WATER QUALITY AT TRENTON
The Delaware River at Trenton is a mixture of runoff from the Catskill and Pocono Mountains, acid mine drainage from parts of the Lehigh River basin, drainage from limestone formations, and the wastes of Easton, Phillipsburg, Allentown, Bethlehem and their in dustries. Even so, it is remarkably good water: nonacidic, low in hardness, low in dissolved-solids content excellent for most industrial uses and suitable, after treatment, for municipal use.
The yearly average concentration of dissolved solids in Delaware River water at Trenton has varied from 75 to 96 ppm in 17 years. A typical water analysis appears in table 4.
TABI.E 4. Typical composition of Delaware River water at Trenton, N.J.
[Chemical analyses of constituents, in parts per Bullion]
Value Calcium (Ca)__-------------_ 14Magnesium (Mg)____________ 4. 5Sodium+potassium (Na+K)._ 5. 0 Hardness as CaCO3 :
Calcium, magnesium-____ 56Noncarbonate _____---_-- 24
Dissolved solids____________ 86* Carbonate equivalent, 18 ppm.
735-912 64 4
ValueBicarbonate (HCO3) L 37Sulfate (SO4). --------------- 23Chloride (Cl)______----------. 5.0Nitrate (NO3 ) --------------- 3.3Silica (SiO,) _ -- 4.8
__._._ _ _--. 6_______--___---_--_-- 7.1
X22 CONTRIBUTIONS TO THE HYDROLOGY OF THE UNITED STATES
Of 292 samples analyzed for iron, 78 percent contained 0.05 ppm or less. Of 38 analyses for manganese, 60 percent contained 0.00 ppm, and only 3 analyses showed more than 0.03 ppm. Of 232 samples analyzed for fmoride, 80 percent contained 0.1 ppm or less.
For the most part these chemical constituents come from leaching of rock and soil, but some may come from industrial or municipal wastes, and part of the nitrate may come from fertilizers. None are in excessive concentration in the Delaware River. Waters having less than 500 ppm dissolved solids are usually satisfactory for domestic use and for many industrial uses.
Hardness of water, which is chiefly due to calcium and magnesium compounds, is objectionable because these compounds form scale in steam boilers. Roughly half of the hardness in Delaware River water is carbonate, or temporary, hardness, the kind that forms scale that can be removed with acid, and the remainder is noncarbonate, or per manent, hardness. Hard water for washing requires more soap than does soft water because no lather forms until the calcium and mag nesium causing the hardness have been precipitated by the soap. There are various treatments for removing hardness from water. Delaware River water at Trenton, however, is. soft or moderately hard, and for most uses it requires no treatment to remove hardness.
The typical bicarbonate ion concentration of 37 ppm signifies that the water has a low alkalinity, as does most of the surface water of the East. Some of the water at Trenton enters the tributaries as acid mine drainage, but the acidity is neutralized by mixing with alkaline water from downstream tributaries. Some alkalinity is desirable be cause acid water is corrosive to metals. Sulfate comes from acid mine drainage and industrial waste, and much is leached out of the earth minerals.
As none of these dissolved minerals are present in objectionable con centrations, the water is excellent for most uses after simple treat ment. Consequently, the water delivered to the consumer has essenti ally the same quality as the water in the river.
Consider the composition of the dissolved solids in terms of chemi cal equivalents (chemical combining weights). The typical percent age composition of the dissolved solids, by equivalents, is:
Dissolved solids Percent Calcium (Ca)______________ 28Magnesium (Mg)____________ 14Sodium+potassium (Na+K)_. 8
Dissolved solids Percent Sulfate (SOi)-.-------------- 19Chloride (Cl)____________ 5Nitrate (NO3) _________ 2
Bicarbonate (H CO3) _. _ _ _ _ _ _ 24
Thus, the principal ions in solution are calcium, magnesium, bicar bonate, and sulf ate.
QUALITY, DELAWARE RIVER WATER, TRENTON, N.J. X23
The composition of the dissolved solids is independent of the total concentration, except that at the higher concentrations the ratio of bicarbonate to sulf ate is greater than at low concentrations. This is evident from the following comparison of three groups of samples representing three ranges of concentration.
Group
!_______2____________3. ___________
Samples
121612
Specific- conductance
range (micromhos)
81- 90138-143180-202
Average dissolved
solids (ppm)
5685
114
Pei
Ca
292897
centag
Mg
15161 c
e composi
Na+K
7.87. 58.0
tion by ec
HCO 3
212426
luivale
SO 4
231Q16
nts
Cl
4 75 17 7
The ratio of bicarbonate to sulfate increases with increasing bicar bonate concentration from 0.91 to 1.26 to 1.63, but the sum of bicar bonate and sulfate remains nearly constant at 4:2-44 percent.
The analyses reported here are based on once-daily samples taken from the intake of either the Trenton or the Morrisville water plant. Samples collected at the intakes were found to be representative of the river cross section. For each sample collected, the temperature and specific conductance were usually determined. Composites of these daily samples were analyzed for the principal dissolved solids.
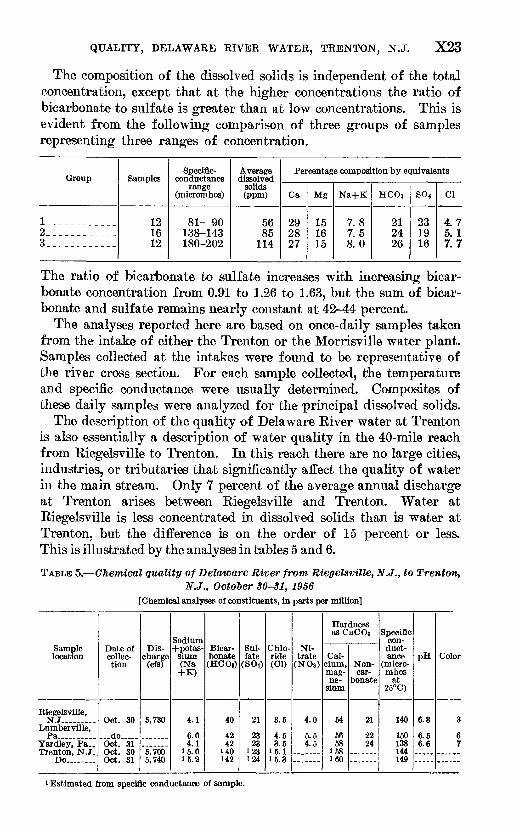
The description of the quality of Delaware River water at Trenton is also essentially a description of water quality in the 40-mile reach from Riegelsville to Trenton. In this reach there are no large cities, industries, or tributaries that significantly affect the quality of water in the main stream. Only 7 percent of the average annual discharge at Trenton arises between Riegelsville and Trenton. Water at Riegelsville is less concentrated in dissolved solids than is water at Trenton, but the difference is on the order of 15 percent or less. This is illustrated by the analyses in tables 5 and 6.
TABLE 5. Chemical quality of Delaware River from Riegelsville, N.J., to Trenton,N.J., October 30-31, 1956
[Chemical analyses of constituents, in parts per million]
Sample location
Riegelsville,N.J.. ....
Lumberville, Pa.. __ ....
Yardley, Pa.. Trenton, N.J.
Do........
Date of collec tion
Oct. 30
...do..... Oct. 31 Oct. 30 Oct. 31
Dis charge
(cfs)
5,730
~5~766"
5,740
Sodium -(-potas
sium (Na +K)
4.1
6.0 4.1
15.0 15.2
Bicar bonate (HOOs)
40
42 42
140 142
Sul fate
(BOO
21
23 23
123 «24
Chlo ride (01)
3.5
4.5 3.5
15.1 15.3
Ni trate
(N03 )
4.0
5.5 4.5
Hardness as CaCOs
Cal cium, mag ne
sium
54
56 58
158160
Non- car
bonate
21
22 24
Specific con duct ance
(micro- mhos
at 25°C)
140
150 138 144 149
pH
6.8
6.5 6.6
Color
3
6 7
i Estimated from specific conductance of sample.

X24 CONTRIBUTIONS TO THE HYDROLOGY OF THE UNITED STATES
cq
® £}*5 Se i > 03
«>
3 ^1
|o °.g 3 c«^° 2M g
. ® ^
si|6«^
ft, IH^-
O o '
g^a ^1°M^CQ
Sloo goM^W
aa-11@PL, M
i R'S1
%h^§'5o" -S ̂ H
§86 d ^i*"0-gg.
§£
<3'Jf.soss
S"o
O
aliltl-?$3 % * a a o§»lgs st>« > -*i
1=1 2 as £ a --- ^Illl?Qi fl 03 M ^ *Oag ^-a^
d _oVs
£ft
'CQ
rH CO t- i-l IN rH
*5OOO^COCOco^to^oooo
Or-HOOOf
Oi-HlNCOCOCO
<M1NCOCOCOCO
O
OCO CO-^ OOO
CO * 5O t- 00 I>
i-t IO IO t^OS 00 rH i-l IN CQ IN <M
OOOO5O<M1< 55 * U5 U5 5O «O
CTKMOOOOIN
0 rH rH CM CM IN
0=0=0=00=50
i-i IN >O "5 "5 >O
oo co r~ co >o o IN co «5 td od 06
0
O= CO CO OO= O rH rH SN rH EN
SoooSo0 ' '
t-^«O<M>Oi-l
O INCOtNtN
COCOU5COCOCO
t-^oooocot-
S OOfNCOOO COOrHIMCQ
<M CO COCO f~ t^ 00 rH to 00 O=O=
rH rHrH T-H rH
>-s
>-, ^
!7 .^m 1"5-
5^3^* -> " Soo^ Q 'S <3-2.2.ra i_MHrtS»«^

QUALITY, DELAWARE RIVER WATER, TRENTON, N.J. X25
ESTIMATES OF WATER QUALITY
The dissolved solids are principally salts which are present as ions in solution, and they increase the ability of the water to conduct an electrical current. The specific electrical conductance of a natural water therefore is a measure of the concentration of dissolved solids in the water. The relation between these two variables in the water of the Delaware River at Trenton is shown in figure 3; dissolved solids ($) , in parts per million, is plotted against specific conductance (K), in micromhos at 25 °C. Therefore, from figure 3 or from the relation
the dissolved-solids concentration can be estimated from the specific conductance.
120
110
100
90 -
QU 80
I 70
60
5080
FIGURE 3.-
100 .120 140 160 180
SPECIFIC CONDUCTANCE, IN MICROMHOS AT 25°C
200
-Relation of dissolved-solids concentration (8) to specific conductance (JO Delaware River at Trenton, N.J., 1945-61.

X26 CONTRIBUTIONS TO THE HYDROLOGY OF THE UNITED STATES
Because the dissolved solids in the Delaware River water at Trenton have substantially constant composition (p. X22), the concentration of some of the ionic constituents may be estimated from the measured specific conductance. Figures 4 and 5, like figure 3, were determined empirically and are useful for estimating concentrations from meas ured specific conductance. These graphs have been used in estimating some of the concentrations in this report. For example, the mean conductance of 6,209 daily samples was 140 micromhos. Using fig ure 3, the average dissolved-solids concentration is estimated to be 86 ppm. This is the concentration given (p. X21) for typical Dela ware River water at Trenton, and it is also the average concentration for 328 analyses. The typical composition of Delaware Kiver water might have been derived from the mean specific conductance of 140 micromhos or from figures 4 and 5. The concentrations in table 4, however, are the median concentrations for the water samples analyzed. They are very nearly equal to those estimated from figures 4 and 5.
FLUCTUATIONS IN WATER QUALITY
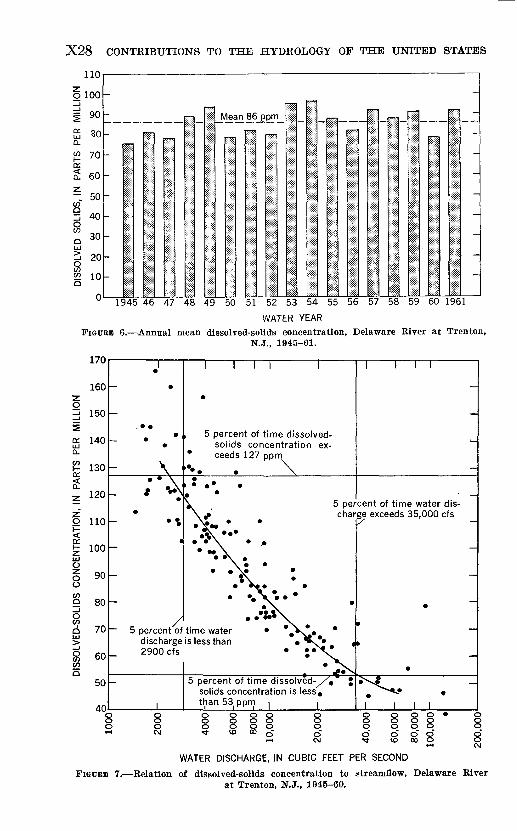
Delaware River water may be described in terms of its typical quality, such as average or median, but it is also useful to know the variation to be expected and the cause of these fluctuations in quality. From 1945 to 1961 the annual mean concentrations of dissolved solids varied from 75 to 96 ppm and averaged 86 ppm, as shown in figure 6.
EFFECT OF STREAMFLOW
Water discharge, or stream flow, is one of the factors that influence the dissolved-solids concentration. In general, as shown in figure 7, the concentration is highest when the discharge is lowest. Although there is a broad relationship between these <two variables, it is also obvious that dissolved-solids concentration cannot be calculated pre cisely from water discharge.
The streamflow varies seasonally, as shown in figure 8. Over 30 percent of the annual runoff usually occurs in March and April as a result of snowmelt and runoff from saturated soils. During this period the mean monthly concentration of dissolved solids in the river water is lowest (fig. 8). As streamflow decreases during the growing season, the concentration of dissolved solids in the river water in creases. Streamflow is lowest and dissolved-solids concentration is highest in August, September, and October.
As the air temperature rises, evaporation of water increases, and the concentration of dissolved solids in the residual water becomes greater. In the growing season, May to September, plants absorb water through their roots and transpire it from their leaves. The

QUALITY, DELAWARE RIVER WATER, TRENTON, N.J. X27
85
z 80 O
=! 75
70
65
60
55
50
45
40
35
30
25
20
30
29
28
27
26
25
24
cc 23 <
22 5
21 <
20
19
18
1780 90 100 110 120 130 140 150 160 170 180 190 200 210
SPECIFIC CONDUCTANCE, IN MICROMHOS AT 25°C
FIGURE 4. Hardness of water and concentrations of sulfate and bicarbonate ions as related to specific conductance, Delaware Eiver at Trenton, N.J., 1945 61.
8.5
8.0
z> g 7.0
P £ s£ a. £ 6.0
2 -z. 5.0 o
22 40 in I 4-" ^ oo Q < -z. 2 <
3.0
2.080 90 100 110 120 130 140 150 160 170 180 190 200 210
SPECIFIC CONDUCTANCE, IN MICROMHOS AT 25°C
FIGURE 5. Concentrations of calcium, magnesium, sodium plus potassium, and chloride as related to specific conductance, Delaware River at Trenton, N.J., 1945-61.
X28 CONTRIBUTIONS TO THE HYDROLOGY OF THE UNITED STATES
11U
o 100_if= 90
£ soQ.
£ 70cc£ 60
- 50 (f>QI] 40
o 30UJi 20J2 10Q
n
_
-
-
-
-
-
_
-
_
1
|
ii
111
KSS
|i|
11
1
if
g
1
11
11
iil
mlii i
mii?ii liIiH': ;:::-:
11
1
::: :'! : :
188
1188
Hi1111
ill
IIill:*;*:
ill:* £
_Meani 86_pp_m_
11
III
11
11
Hi
II
1111
~tf
II
ill
11
illHiillIli:*S:: :
1 ii
n1 ii
Hi
ill
._«.
ilSxJ
vi>§
||i
:i:
1
1: ::|:]:|:
11
iiSi:
ill
lii
II
11
mII::§:£
Iilliigi:
iili
11
11
|:j;:j;
^
1iiiii
11II
^r.
II
11
Isiss;HIli
11:::::': ::
II
11
S:?;
11Itill
lii
illSiiS1111 11IIill
1
11
1 III11: : :-:: : : : :
li
|iSi:
III
11
111
Hi
liii'SS
111
1illii1!
1
Sii:
II
II
ill
11
ill
:ttS:
fi»
ill
HI
ill
HI
1
m;$£
1ill
i|i
1111
11':?:§:
Iii
lii
HiII
IIIiiillillill::;: : ::;
11
:*: : : «H
11i8
11
11
11 i-5:S:
1
Hi
1I1:i?i¥J:
li1P
IP111
-
~ _"
WATER YEARFIGURE 6. Annual mean dissolved-solid's concentration, Delaware Hirer at Trenton,
N.J., 1945-61.
170
160
150
140
130
120
110
100
90
V)Q 80
Q 70LJ
O 60C/3 Q
50
40
i r
5 percent of time dissolved- solids concentration ex ceeds 127 ppm
\ \
5 percent of time water dis charge exceeds 35,000 cfs
5 percent of time water discharge is less than 2900 cfs
5 percent of time dissolved-/ solids concentration is less. than 53 ppm |______i I I I
8 000o o o o" o o"<& 00 O
WATER DISCHARGE, IN CUBIC FEET PER SECOND
FIGURE 7. Relation of dissolred-solids concentration to streamflow, Delaware Eirerat Trenton, N.J., 1945-60.

QUALITY, DELAWARE RIVER WATER, TRENTON, N.J. X29
I I 1 I I I I
Oct Nov Dec Jan Feb Mar Apr May June July Aug Sept
FIGURE 8. Mean monthly water discharge and dissolved-solids concentration, Delaware River at Trenton, N.J., 1945-61.
remaining soil water seeps downward and dissolves more material as it passes through the soil and rock. Eventually, the ground water discharges into surface streams and thereby supplies the base flow.
SOUBCE OF WATEB
Another factor which contributes to the seasonal change in quality of Delaware River water at Trenton is the proportion of the stream- flow at Trenton that originates in various parts of the basin. Earlier (p. XI1) it was noted that water from the Appalachian Plateau province ranged in dissolved-solids concentration from 27 to 54 ppm, whereas water from the Lehigh River or from the Great Valley (table 3) contained 184 to 362 ppm dissolved solids.
The relation of quality of water at Trenton to source is illustrated by data for four summer periods:
Period and year (July,, Aug., Sept.)
1949. ___.___..___. ____._.___.1953. ___. _ _ ___ ... __ .___1954_. ___ __ __ ___________1957__._ __ ____ .... ____ .
Average water dis charge at
Trenton (cfc)
3,047 2,971 2,468 2,393
Dissolved- solids concen tration (ppm)
119 135 128 113
Percent of streamflow
From Delaware River at
Montague
39 40 41 64
From Lehigh River
29 29 29 22
Summer streamflow during each of these years was low. The high est concentration of dissolved solids might have been expected in 1957, the year of lowest summer flow, but the quality was better in 1957 than in the other 3 years because of the larger proportion of excellent
X30 CONTRIBUTIONS TO THE HYDROLOGY OF THE UNITED STATES
water from the northern part of the basin above Montague. This water was released from reservoirs in the Appalachian Plateau prov ince to augment low flows.
Even when the dissolved-solids concentration is low, the source of the water influences its quality at Trenton. The lowest monthly aver age dissolved-solids concentration recorded for the Delaware River at Trenton was 49 ppm in March 1945. The average concentration in April 1958 was 53 ppm although the water discharge was 6 percent greater. However, 66 percent of the water discharge at Trenton came from upland sources in March 1945 as compared to only 58 percent from upland sources in April 1958. The difference in the proportion of high-quality water accounts for the difference in dissolved-solids concentration. The lowest daily dissolved-solids concentration at Trenton was 34 ppm on March 19, 1945.
PRECIPITATION AND AIR TEMPERATURE
Although the origin of water in the Delaware River basin is precipi tation, no simple relationship exists between the amount of precipita tion and the rate of streamflow. For a given rainfall, the amount of water that will become streamflow depends upon where and when the rain falls. Precipitation over the basin is greatest in spring and summer, but streamflow is greatest during the late winter and spring. The following table shows the average seasonal values for precipitation and air temperature in the basin and the average seasonal values for discharge and dissolved-solids concentration of the river at Trenton, October 1944-September 1960:
Mean air Dissolved-tempera- solids con-
ture i centration Precipi-Seasons Months (°F) (ppm) tation* Discharge >
Winter____ December-February.-._ 31.3 79 21.4 28.2Spring.__._. March-May___._.._. 50.1 67 27.1 40.4Summer____ June-August_______ 71.9 99 28.6 15.9Autumn_______ September-November_ 54.5 101 22.9 15.5
i Average of temperatures at Port Jervis, Allentown, and Trenton. 8 Percent of average annual.
The contrast between seasonal precipitation and seasonal stream- flow is illustrated by comparing the variables for spring and summer. Although the amount of precipitation is almost the same in spring and summer, that of spring yields about 40 percent of the average annual discharge, whereas that of summer yields only 16 percent.
The average winter temperature for most of the basin is below freezing. Much of the precipitation on the upper basin during the winter months is snowfall, which accumulates. When the ground thaws, it becomes saturated with water. In the early spring, as the air temperature rises, the snow cover melts. Because the ground is
QUALITY, DELAWARE EIVER WATER, TRENTON, N.J. X31
saturated, the snowmelt, together with the spring rains, runs off to the streams and increases streamflow.
In the early spring, temperatures are not high enough to cause rapid evaporation from the land surfaces, vegetation at the beginning of the growing season makes only minimal demands for water, and trans piration by plants is small. The peak of the growing season in the basin corresponds to the seasonal rise in temperatures and increased hours of daylight, so increased evapotranspiration results. These factors cause the spring discharge of the Delaware River at Trenton to be more than two and a half times the summer discharge although approximately equal amounts of precipitation occur in the two seasons. The concentration of dissolved solids is greatest in summer and au tumn, when the water discharge is least.
As a further illustration, consider the period of January to March 1945. The following table shows the departures from the 16-year averages of total precipitation and air temperature for January, Feb ruary, and March at three stations:
Month (1945)
January. ___ ____ ___February. _____ _____March _ ________ ___
Port Jervis
Precipita tion
(inches)
+ 1.59 + 1. 10 -1.22
Tempera ture (°F)
-7.7 -.7
+9.9
Allentown
Precipita tion
(inches)
-0.48 -.09
-1. 18
Tempera ture (°F)
-9.6 -2.1+ 9.7
Trenton
Precipita tion
(inches)
-0.34 -.23
-2.57
Tempera ture (°F)
-7.6_ 7
+ 10! 2
In January and February 1945, the average monthly air tempera ture at the three stations was below average. Precipitation was below normal for the period January to March 1945 over most of the basin, but it was above normal in the upland zone. Because of the sub- freezing weather, most of this precipitation occurred as snowfall that accumulated on the ground. Therefore, streamflow of the Delaware River was below normal for these two months 69 and 66 percent of the 16-year average.
In the following month, March, the temperature rose, and snow melted. Although precipitation was below normal, the average monthly water discharge at Trenton rose to 37,100 cf s, or 175 percent of the average March discharge for the 16-year period. Since much of this discharge was snowmelt, the water quality was excellent. As was previously noted, the dissolved-solids concentration for March 1945 was only 49 ppm, the lowest monthly average of the 16-year period.

X32 CONTRIBUTIONS TO THE HYDROLOGY OF THE UNITED STATES
EXTENT OF VARIATION IN CONCENTRATIONS
The concentrations of dissolved solids have been discussed in terms of average values for different years, seasons, and months. It is also desirable to know how much the concentrations may be expected to vary from their averages. Table 7 shows not only the maximum and minimum values experienced but also the frequency with which speci fied concentrations are equaled or exceeded. For example, 75 percent of the samples were either neutral (pH=7.0) or alkaline. An industry requiring water that has hardness no greater than 50 ppm could deter mine from the table that treatment would probably be needed about half the time. An industry that could tolerate 15 ppm silica could know that the water at Trenton would be satisfactory 99 percent of the time. Table 6 shows that, generally, concentrations of any dis solved constituent are within 50 percent of the median about 80 percent of the time. About half the time the concentrations are within 25 percent of the median. The specific conductance of daily samples varies more than that of composite samples. The range for daily samples extends further into the low concentrations than does the range for composite samples. Except for the 10 percent of samples having the lowest concentrations, the distribution of concentrations is ap proximately the same for daily and for composite samples.
TABLE 7. Maximum and minimum values and frequency distribution of published composite analyses, Delaware River at Trenton, N.J. October 1944~September 1961
[Chemical analyses of constituents, in parts per million]
Characteristic
Specific conductance (mi- cromhos at 25°C):
Composite samples... Dissolved solids (residue
on evaporation at 180° C). pH__,_______.______._____Color _ . ________ ...Silica (SiO 2).. __ __
Sodium and potassium (Na+K)... ..........
Bicarbonate (HCOa) ...... Sulfate (SOO _ . _ __Chloride (Cl)_._.____..___Nitrate (NOa).. _ .Hardness as CaCOs:
Num ber ofanal yses
6,209534
328 533523330306306
464531 531487518
467465
Maximum
400329
1560 7
3028259.8
4180 9948
8 n
14273
Value
1
251255
1397 ft
2512238.5
1369 38146.5
10046
equale
5
212213
1267.7
158.5
91
7.4
9.462 3210
15 9
Sfi
35
dor ex
10
194196
1167.5
117.1
196.8
8.258 308.34 7
7632
ceeded
25
165165
102 7.485.6
175.7
6.748 276.54.0
6528
byinc
50
134134
86 7.164.8
144.5
5.037 235.03.3
5624
iicated
75
109110
70 7.043.6
113.4
3.528 203.62.6
4421
percei
90
9296
61 fi s32.89.32.8
2.223183.02.1
3616
it of ar
95
8389
57 6.722.38.72.6
1.621172.61.8
3414
talyses
99
7078
52 6.421.88.01.8
1.018 151.91.3
3010
Minimum
5068
44 5.911.37.61.3
.215 121.0.8
256
Occasionally, high concentrations occur for 1 or 2 days that cannot be explained in terms of natural changes. They probably stem from pollution. Three examples are shown:
QUALITY, DELAWARE RIVER WATER, TRENTON, N.J. X33
Specific conduct ance (micromhos
Date (1969) at25°C) Streamflow (c/s)
Sept. 3.__.__.______________...__ 199 9,7004_.__.__-___._.._________.._____._ 382 11,7005____.__________.___________ 267 7,300
14_____________._______-____-___-. 182 4,24015____________________________ 360 3,72016_______._______.________________ 191 3,200
Oct. 30__._'___-__-__________________ 108 9,44031__--_._____-._______-__--.____ 339 8,500
Nov. l__________________--_____________.____- 115 8,050
The maximum specific conductance of 400 micromhos shown in table 7 probably reflects pollution. It greatly exceeded the conduct ance measured on the preceding and following days:
Specific conduct ance (micromhos
Date (1969) at25°C) Streamflow (c/s)
Jan. 23________________________________ 158 50,00024______________________________ 400 39,60025_________--_._________________ 82 21,80026 .----_._--_____--____-._______- 155 16,10027__.-_-__-_____._______________ 97 13,800
Variations in concentration are often related to the seasons. The concentrations of the minerals dissolved in the water are usually greater in the late summer than in the spring. Therefore, an addi tional frequency table is presented: the upper half of table 8 shows the frequency with which concentrations exceeded specified values in March, April, and May, and the lower half gives similar information for August and September. In March to May the medium concen tration of dissolved solids was 66 ppm; in August to September it was 167 ppm. In March to May the dissolved-solids concentration was less than 76 ppm 75 percent of the time; from August to September it exceeded 78 ppm 90 percent of the time.
WATER TEMPERATURE
The temperature of Delaware River water at Trenton has been meas ured continuously since June 1951. Figure 9 shows the seasonal varia tion of water temperatures. The changes in water temperature are similar to the changes in air temperature (p. X8) except that the monthly average of daily maximum water temperatures for June to October is 5°-6°F higher than the average air temperature. The highest water temperature, 93°F, occurred on June 18, 1957. The minimum of 32 °F was reached on many days from December to March. The daily range of temperature is usually less than 40 °F for the winter period. In July and August the range exceeds 8°F half the time and occasionally exceeds 12°-13°F.
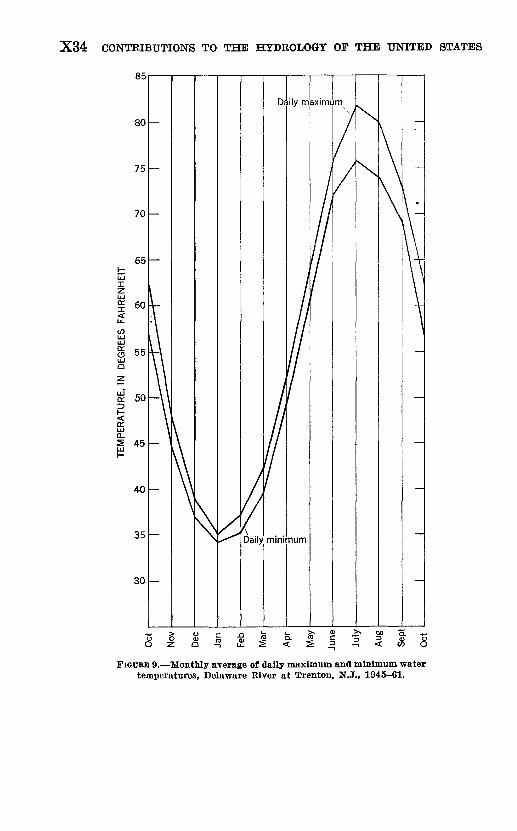
rt a
£
o3
£j
?
tf
II
Oct
Nov
Dec
Jan
Feb
Mar
Apr
May
June
July
Aug
Sep
t
Oct
TEM
PE
RA
TUR
E,
IN
DEG
REE
S FA
HR
EN
HE
IT
oo
?o
m
W

QUALITY, DELAWARE RIVER WATER, TRENTON, N.J. X35
TABLE 8. Typical frequency distribution of dissolved-solids concentrations in Delaware River at Trenton, N.J., 1945-61
Constituent
Marcht April, May Dissolved solids ___________Bicarbonate (HC03) _Sulfate (S04)__, ____________Chloride (Cl) _. ___ _____Nitrate (N03) _. .... Calcium (Ca)_ ______ _____Magnesium (Mg)_ _________Sodium + potassium
(Na+K)______. _________
August, September Dissolved solids __ _____ ___Bicarbonate (HC03) _ _Sulfate (S04) -------____Chloride (Cl)__ __ ____ _ _Nitrate (N03) __ _ __ _ _Calcium (Ca)______________Magnesium (Mg) __ _____ _Sodium + potassium
(Na+K). _______________
Value, In parts per million, equaled or exceeded by indicated percent of samples
5
90 42 24
5. 3 3.3
15 5.2
5.2
145 68 35 12 4.0
8.8
8.8
10
86 39 23 4.9 3.2
14 4. 9
4.9
134 65 32 10 3.8
22 8. 0
8. 0
25
76 33 21 4.2 3. 1
13 4.2
4.3
119 59 29 8.0 3.7
20 7.0
7. 1
50
66 26 19 3.4 2.8
11 3.6
3.6
107 52 27 6.8 3.5
18 6.2
6.3
75
59 24 17 2.9 2.6 9.5 3. 1
3.2
94 44 25 5.6 3.4
. 16 5.4
5.4
90
52 20 16
2. 5 2. 5 8.3 2.7
2.8
78 34 22 4.3 3. 1
13 4.4
4.4
95
48 18 14 2.2 2.2 7.7 2.4
2.4
70 29 20 3.3 2.9
11 3.8
3.5
QUANTITIES OF SOLIDS CARRIED BY THE RIVER
A large quantity of dissolved and suspended solids is carried into the Delaware estuary from the basin above Trenton. The quantity of water and dissolved solids carried each year past Trenton during the period 1950-61 is shown in figure 10. The variation in annual load of dissolved solids is not as great as the variation in the quantity of water passing Trenton each year. This is because the concentration of dis solved solids is lower at high flows than at low flows. The total dissolved-solids load is greater at high flows because of the greater quantity of water. The annual loads of dissolved solids carried by the Delaware River at Trenton from 1945 to 1961 are shown in table 9. The average load of dissolved solids for the 17-year period was
TABLE 9. Dissolved-solids loads, Delaware River at Trenton, N.J., 19^5-61
YearDissolved solids (tons per year)
1945_________________ 928,0001946___________________ 926,2001947__________________ 887,5001948._________________ 905,3001949________________ 809,2001950_.._________________ 737,4001951______________ 989,4001952_____________ 1, 251, 900 1953____________________ 1, 003, 900
YearDissolved solids (tons per year)
1954________________ 672,5001955______- ___- 811,7001956______________ 1, 013, 8001957_.______________ 708,0001958 _---__-___----- 862,3001958___.-___-__-_-_- 754,200I960 .______________ 1, 005, 9001961___.._-----_-_---~ 831,400
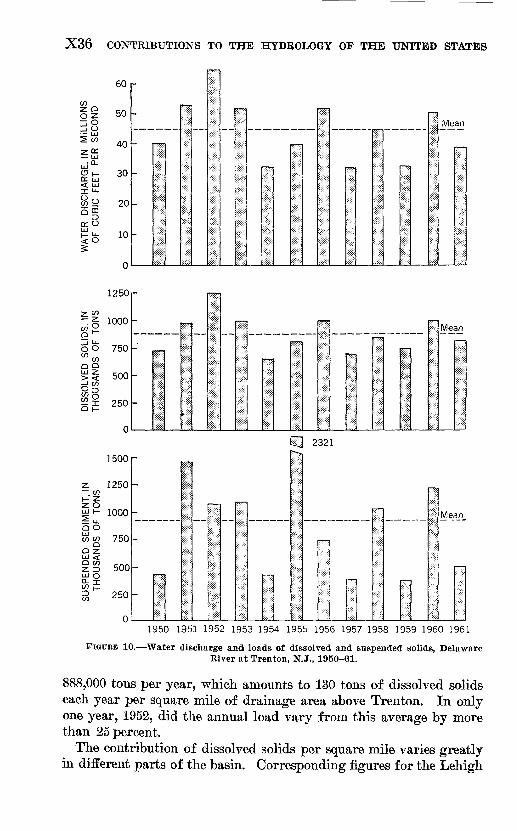
X36 CONTRIBUTIONS TO THE HYDROLOGY OF THE UNITED STATES
60
CO
oi 50^ Rd[^Sy5 40
5S- Q_
LUOH 30 o: LU< LUX "-
coo 20o co
a0:0ss 105
n
-
_
-
-
_
Si
li
i!i?is
II
&: : ':
: ; : : ::: ; : :
IP
11
£
r-n
1
¥: !
||
*$!si:i
li
1.
1
1
1
P;: : Mean
1250
z w-z 1000co'P
900 750^co QQ^i 5000 ^
CO osi 25°0
1500
z 1250~ CO h-"Z
z o ^!- 1000 5 u_QO
SUSPENDED SE THOUSANDS
ro ui M 01 o m
o o o o
-
-
11
ij
i;SS
pl!S:
I
isil
1188H
;i$i
I
iilli
11
ill
;§: ;!;
___
~
||;
11: S
S:iS
:|x:::y
Piii
is
^5
i|1 :
1;: ;
TTT1
plVleani!;
II
H 2321-
-
-
P:
pj IS:
Iin 1!
1
1i:||;
rp na rr
|i Mean_
1950 1951 1952 1953 1954 1955 1956 1957 1958 1959 1960 1961
FIGURE 10. Water discharge and loads of dissolved and suspended solids, Delaware River at Trenton, N.J., 1950-61.
888,000 tons per year, which amounts to 130 tons of dissolved solids each year per square mile of drainage area above Trenton. In only one year, 1952, did the annual load vary from this average by more than 25 percent.
The contribution of dissolved solids per square mile varies greatly in different parts of the basin. Corresponding figures for the Lehigh
QUALITY, DELAWARE RIVER WATER, TRENTON, N.J. X37
River at Catasauqua, Pa., and the Delaware Kiver at Easton, Pa., are 175 and 95 tons per square mile per year, respectively (Parker and others, 1964). The rate of weathering is evidently greater in the coal-mining regions and in the limestone formations of the Great Valley than it is in the Appalachian Highlands. The greatest loads of dissolved solids are generally carried in March and April, and the smallest loads are carried in July to October when the streamflow is lowest. At the rate of 130 tons per square mile per year, it would require several thousand years to degrade the land surface 1 inch as a result of solution.
The annual load of suspended solids for the 12-year period 1950-61 is also plotted in figure 10. The load of suspended solids averages 932,000 tons per year, almost the same as the dissolved-solids load, but there is greater variation in the annual load of suspended solids.
At small rates of discharge, the concentration of suspended sedi ment in the stream water is also low (1-10 ppm). When streamflow increases rapidly, sediment concentration and load may also increase greatly. For example, in July 1955 the daily mean water discharge at Trenton ranged from 1,920 to 3,240 cfs; the mean suspended-sedi ment concentration varied from 2 to 5 ppm; and the total sediment load for the month was only 853 tons. Hurricanes Connie and Diane in August 1955 produced destructive floods that had record high flows along the main stem Delaware River from Port Jervis to Tren ton. On August 19 and 20 the daily mean discharges were 163,000 and 279,000 cfs (on the 20th, maximum discharge reached 329,000 cfs at 6 and 7 a.m., a 43-year record). The mean suspended-solids con centrations on the two days were 1,680 and 1,360 ppm, and suspended- solids loads were 848,000 and 1,087,000 tons, respectively. For just these two days, the suspended-solids load at Trenton was greater than the annual load for any other year from 1950 to 1961.
The suspended-sediment concentration during this period (1950- 61) varied from 1 to 4,100 ppm at Trenton, and the daily load varied from less than 0.5 ton to over 1,000,000 tons daily. Two-thirds of the time, the concentration of suspended sediment was no greater than 15 ppm, and it exceeded 100 ppm only 5 percent of the time.
TRENDS IN WATER QUALITY
Will the quality of water in the Delaware River at Trenton become better or worse? This is a pertinent question, but it cannot be an swered simply. It is not possible, on the basis of data presently avail able, to predict reliably the future trend, but certain factors that affect water quality can be identified. Assuming certain trends in these factors, some generalizations can be made.
X38 CONTRIBUTIONS TO THE HYDROLOGY OF THE UNITED STATES
WATER USE
The water is presently of good quality and is used for municipal and industrial supplies after only minimum treatment. Water use will increase, and quantities of wastes discharged to the river will also increase. If the good quality of the river water is to be maintained, the wastes will need to be treated more effectively than they are at present. Most industrial water used is for cooling, and it is not ex pected that the resulting temperature rise will make the water un satisfactory for additional cooling uses downstream. However, other wastes, inorganic and organic, may degrade the quality of water of the Delaware River at Trenton.
Very little water is presently used for irrigation, but more may be used for this purpose in the future. Irrigation water is partly lost by evaporation and infiltration. It often leaches mineral matter from the soil and thereby causes an increase in the dissolved-solids concentration of the water. Perhaps the use of fertilizers will increase the nitrate concentration in the water, for nitrates are easily leached. A more serious problem is possible contamination by insec ticides, herbicides, detergents, and new industrial chemicals. Some of these contaminants will be destroyed by combination with the oxygen dissolved in the water or by bacterial decomposition. Others will per sist but will be sufficiently diluted by the large volume of water in the stream that they will not be harmful to people or to industry.
These problems are common to most of the surface water in pop ulated areas of the Nation and are not unique to the Delaware River at Trenton. The expected increase in population and industry in the basin will result in an increase in the concentration and the com plexity of the dissolved solids in the river water at Trenton. How ever, it is not anticipated that the increase will have an effect on the chemical quality of the water within the next 25 years.
CONCENTRATION OF DISSOLVED SOLIDS
The monthly mean dissolved-solids concentration and the monthly mean water discharge are plotted in figure 12 for the 17-year period of record. It is evident that the dissolved-solids concentration is usually greater from July to December than it is from January to to June. The lower concentration is associated with greater fresh water flows in the first half of the year. No trend is evident in the plot of figure 11. However, so that the data can be examined more carefully for a trend, the total of dissolved solids since October 1944 is plotted in figure 12 against the total discharge since that date. The ratio of tons of dissolved solids to streamflow is constant from 1944 to 1953, as is shown by the constant slope of the line
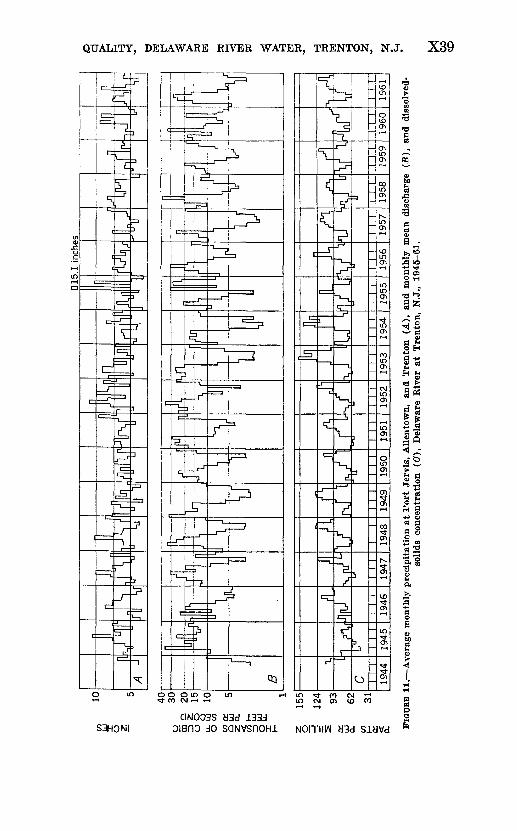
D15
.1 i
nche
s
CJ CD
Q
_ O C
O co
a:
Q
LU
Z
Q.
It
155
124 93 62 31
B 1944
XI
1945
XI
1946
TT
T19
4719
4819
4919
5019
5119
5219
53
FIG
URE
11. A
ver
age
mon
thly
pre
cipi
tati
on a
t P
ort
Jer
vis,
All
ento
wn,
an
d T
rent
on
(A),
and
mon
thly
mea
n di
scha
rge
(B),
and
dis
solv
ed-
soli
ds c
once
ntra
tion
(0
), D
elaw
are
Riv
er a
t T
rent
on,
N.J
., 19
45-6
1.
X CO CD

X40 CONTRIBUTIONS TO THE HYDROLOGY OF THE UNITED STATES
through, the origin and the first nine points. From 1953 to 1961, the slope increases and thus indicates that a greater load of dissolved solids was transported past Trenton per unit volume of water during that period. Before 1953 the rate of transport was about 0.067 ton per cfs per day; after 1953 it increased by about 11 percent to 0.075 ton per cfs per day.
10 20 30 40 50 60 70 80
CUMULATIVE DISCHARGE, IN MILLIONS OF CUBIC FEET PER SECOND-DAYS
FIGURE 12. Cumulative dissolved solids and cumulative discharge, Delaware River atTrenton, N.J., 194,5-61.

QUALITY, DELAWARE RIVER WATER, TRENTON, N.J. X41
The trend toward an increase in dissolved-solids concentration can also be shown by plotting the annual discharge-weighted concentra tions. This is the concentration the water would have if the runoff for an entire year were collected and well mixed. These concentra tions are given in table 10 and plotted in figure 13.
90
60
Discharge-weighted concentration
80
3-year moving average 6 70 '
I I I I I I I1945 1947 1949 1951 1953 1955 1957 1959 1961
WATER YEAR
FIGURE 13. Trend in dissolved-solids concentration, Delaware River at Trenton, N.J.,1945-61.
The heavy line, a 3-year moving average, also illustrates that the concentrations have been increasing in the second half of the 17-year period. However, it cannot be concluded that the water will continue to increase in dissolved-solids concentration. The increase might be related to the operation of two reservoirs (Neversink in 1953 and Pepacton in 1954), to the flood of 1955, or to wastes from an increas ing population and industry. It is probably related to a decrease in the quantity of streamflow at Trenton during the second half of the period, as is shown in table 11. Periods of drought alternate with periods of abundant precipitation, so the annual streamflow can be expected to increase again. When it does, the dissolved-solids con centration will probably decrease.
RESERVOIRS
The daily flow of the Delaware Eiver at Trenton during the last 50 years has ranged from a minimum of 1,220 cfs on September 18-19, 1932, to a maximum of 329,000 cfs on August 20, 1955. At times of
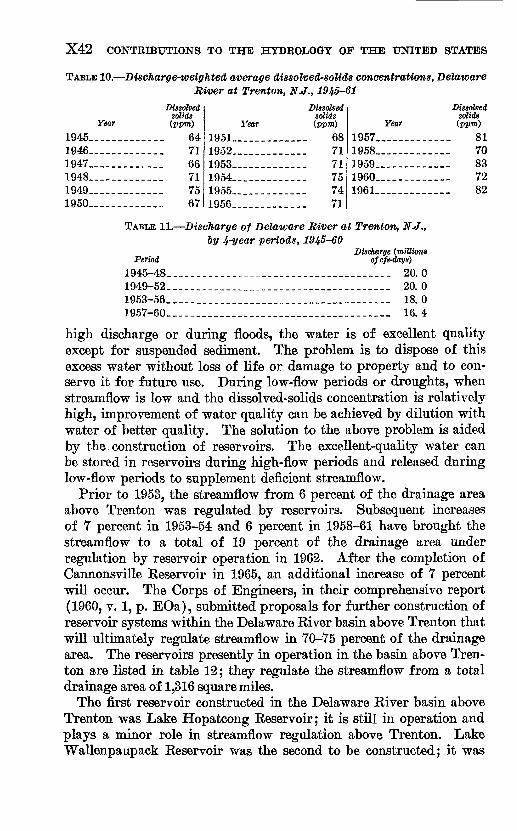
X42 CONTEIBUTIONS TO THE HYDROLOGY OP THE UNITED STATES
TABLE 10. Discharge-weighted average dissolved-solids concentrations, Delaware River at Trenton, NJ., 1945-61
Year 1945_._ ____1946_________1947_________1948_. _______1949. _ _____1950 _ _ _____
Dissolved solids (ppm)
.... 64____ 71-__ 66-.__ 71____ 75__ 67
Year 1951 ___ ___1952 __ _ __1953 __ _ __1 OKA
1955 __ _ __1956____ __ _
Dissolved solids (ppm)
.... 68_.__ 71____ 71____ 75_.__ 74
71
Year 1957________.1958 _____ _1959___ ___ _1960 ____ .__1961 _____ _
Dissolved solids (ppm)
.... 81_._- 70
83__ 72___. 82
TABLE 11. Discharge of Delaware River at Trenton, N.J., ~by It-year periods, 1945-60
Discharge (millions Period ofcfs-days)
1945-48______________________________________ 20. 01949-52.____.___.__.._____.______________ 20. 01953-56________________________________._ 18. 01957-60-_______________________.____ 16. 4
high discharge or during floods, the water is of excellent quality except for suspended sediment. The problem is to dispose of this excess water without loss of life or damage to property and to con serve it for future use. During low-flow periods or droughts, when streamflow is low and the dissolved-solids concentration is relatively high, improvement of water quality can be achieved by dilution with water of better quality. The solution to the above problem is aided by the construction of reservoirs. The excellent-quality water can be stored in reservoirs during high-flow periods and released during low-flow periods to supplement deficient streamflow.
Prior to 1953, the streamflow from 6 percent of the drainage area above Trenton was regulated by reservoirs. Subsequent increases of 7 percent in 1953-54 and 6 percent in 1958-61 have brought the streamflow to a total of 19 percent of the drainage area under regulation by reservoir operation in 1962. After the completion of Cannonsville Eeservoir in 1965, an additional increase of 7 percent will occur. The Corps of Engineers, in their comprehensive report (1960, v. 1, p. EOa), submitted proposals for further construction of reservoir systems within the Delaware Eiver basin above Trenton that will ultimately regulate streamflow in 70-75 percent of the drainage area. The reservoirs presently in operation in the basin above Tren ton are listed in table 12; they regulate the streamflow from a total drainage area of 1,316 square miles.
The first reservoir constructed in the Delaware River basin above Trenton was Lake Hopatcong Eeservoir; it is still in operation and plays a minor role in streamflow regulation above Trenton. Lake Wallenpaupack Reservoir was the second to be constructed; it was
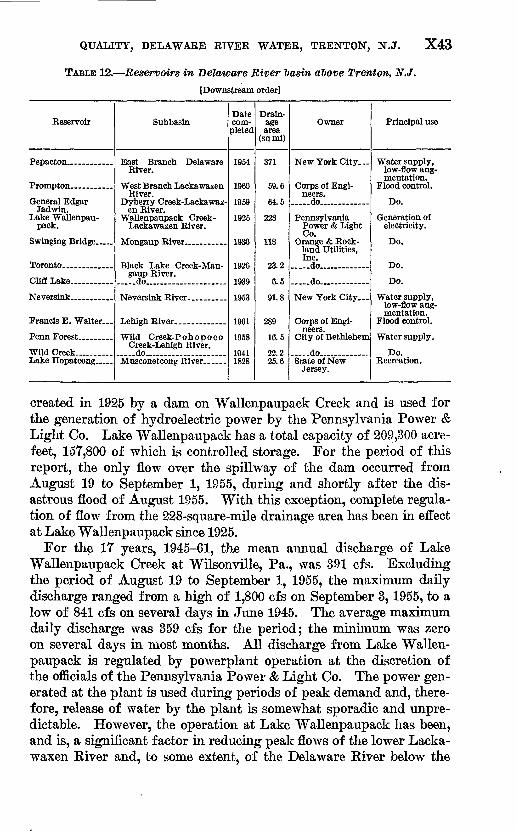
QUALITY, DELAWARE RIVER WATER, TRENTON, N.J. X43
TABLE 12. Reservoirs in Delaware River basin above Trenton, N.J.
[Downstream order]
Reservoir
General EdgarJadwin.
Lake Wallenpau- pack.
Swinging Bridge .....
Toronto.... _________
Cliff Lake.. __ ....
Francis E. Walter...
Penn Forest _________
Wild Creek . ..Lake Hopatcong ...__
Subbasin
River.
River.
en River. Wallenpaupack Creek-
Lackawaxen River.
gaup River.
Creek-Lehigh River. __ do .....................
Date com
pleted
1954
iQfin
1959
1925
1930
1926
1939
1953
1961
1958
19411828
Drain age area
(sqmi)
371
59.6
64.5
228
118
23 2
6.5
Q1 fi
289
16.6
22.225.6
Owner
New York City
neers. -.-do..... .....
Pennsylvania Power & Light Co.
land Utilities, Inc.
.... .do....
.... .do... .
New York City ...
neers.
do_ ~
Jersey.
Principal use
low-flow aug mentation.
Do.
Generation of electricity.
Do.
Do.
Do.
Water supply,low-flow aug mentation.
Flood control.
Water supply.
Do.Recreation.
created in 1925 by a dam on Wallenpaupack Creek and is used for the generation of hydroelectric power by the Pennsylvania Power & Light Co. Lake Wallenpaupack has a total capacity of 209,300 acre- feet, 157,800 of which is controlled storage. For the period of this report, the only flow over the spillway of the dam occurred from August 19 to September 1, 1955, during and shortly after the dis astrous flood of August 1955. With this exception, complete regula tion of flow from the 228-square-mile drainage area has been in effect at Lake Wallenpaupack since 1925.
For the 17 years, 1945-61, the mean annual discharge of Lake Wallenpaupack Creek at Wilsonville, Pa., was 391 cfs. Excluding the period of August 19 to September 1, 1955, the maximum daily discharge ranged from a high of 1,800 cfs on September 3,1955, to a low of 841 cfs on several days in June 1945. The average maximum daily discharge was 359 cfs for the period; the minimum was zero on several days in most months. All discharge from Lake Wallen paupack is regulated by powerplant operation at the discretion of the officials of the Pennsylvania Power & Light Co. The power gen erated at the plant is used during periods of peak demand and, there fore, release of water by the plant is somewhat sporadic and unpre dictable. However, the operation at Lake Wallenpaupack has been, and is, a significant factor in reducing peak flows of the lower Lacka- waxen Kiver and, to some extent, of the Delaware Kiver below the

X44 CONTRIBUTIONS TO THE HYDROLOGY OF THE UNITED STATES
Lackawaxen River. Discharge from the powerplant during low-flow periods has at times augmented natural flow in the main stem of the Delaware River.
The Mongaup River reservoirs in New York were completed prior to 1939. Smaller reservoirs are also operated in the Mongaup River basin for power generation. The integrated operation of the Mon gaup River reservoir system is controlled by the Rio Hydroelectric Plant of Orange and Rockland Utilities, Inc., near Mongaup, N.Y. The Mongaup River drains an area of 208 square miles. The mean annual discharge from 1945 to 1961 was 357 cfs. The flow is com pletely regulated by the Rio Hydroelectric Plant and by upstream reservoirs except during periods of spill from Rio Reservoir.
New York City constructed the Neversink and Pepacton Reservoirs in the Catskill Mountains area of the Delaware River basin to add to the city's water-supply system. Storage in Neversink Reservoir began in June 1953, and in Pepacton Reservoir, in September 1954. These reservoirs intercept the drainage from a combined area of 463 square miles.
New York City is permitted by the amended decree of the U.S. Supreme Court, dated June 7, 1954, to divert 490 mgd (758 cfs) from the Delaware River basin to its water-supply system. However, compensatory releases, as directed by the River Master of the Dela ware River, must be made from Pepacton and Neversink Reservoirs to maintain a minimum basic rate of flow of 1,525 cfs (985.6 mgd) in the Delaware River at Montague, N.J. In addition to maintaining this flow at all times, additional releases are directed during the "seasonal period," which is defined as beginning June 15 of each year and ending not later than the following March 15. The release of this excess quantity is to be made at rates designed to release the entire quantity in 120 days. Releases from Pepacton and Neversink Reser voirs since 1956 have constituted as much as 30-40 percent of the dis charge of the Delaware River at Trenton during some low-flow periods.
New York City's Cannonsville Reservoir, under construction on the West Branch Delaware River, is to be completed in 1964-65. It will control flow from a drainage area of 450 square miles. Upon comple tion of the reservoir, New York City will be authorized to divert 800 mgd (1,238 cfs) from the Delaware River basin. At the same time, the minimum basic rate of flow at the Montague gage will be increased to 1,750 cfs (1,131 mgd). Excess releases during the seasonal period will also be at somewhat greater rates. Because the Cannonsville release works have been designed to have large capacity, it may be
QUALITY, DELAWARE RIVER WATER, TRENTON, N.J. X45
expected that a large proportion of release requirements for Montague may be met by this reservoir.
The three Federal flood-control reservoirs have been completed in the Delaware Eiver basin above Trenton since 1959. They are par ticularly effective in reducing the crest stage and discharge of floods that occur periodically in the basin. Stored water from floods can be released at controlled rates as the flood recedes. Presently (1964) no features for long-term water storage or for low-flow augmentation are included in these flood-control reservoirs other than maintenance of conservation pools for recreational use.
The Penn Forest Reservoir, which is used by the city of Bethlehem for its water supply, is 2.6 miles upstream from Wild Creek Dam.
Wild Creek Reservoir is used for Bethlehem's water supply also. Both of these reservoirs are single-purpose, and have no design fea tures for low-flow augmentation other than small conservation releases.
In their comprehensive report, the Corps of Engineers (1960, v. 1, p. b) recommended "that a plan consisting of 19 major control proj ects and 39 small control projects, at an estimated total construction cost of 591 million dollars, be adopted as a guide to the timed and balanced development of the water resources of the basin." Of the 19 major projects, 12 are proposed for the Delaware Eiven basin above Trenton. The largest and most significant of these major control projects is the Tocks Island Reservoir. This reservoir, on the main stem Delawaa-e Eiver approximately 7 miles above Delaware Water Gap, is proposed for completion by 1975. The multipurpose project will include features for water supply, flood control, production of hydroelectric power, and recreation. The long-term storage of 410,000 acre-feet will provide an extended augmentation of flow of 980 cfs. The stored water will be of excellent quality low in dis solved solids (below 50 ppm) and low in hardness (below 30 ppm). Eelease of the stored water will effectively lower the dissolved-solids content of the tributary water entering the river at points downstream. The drainage area above Tocks Island Eeservoir will be 3,827 square miles, which is 56 percent of the drainage area of the Delaware Eiver at Trenton. Above the Tocks Island project, reservoirs presently in operation or scheduled for completion in the near future will intercept the drainage from an area of approximately 1,500 square miles, or 26 percent of the drainage area at Trenton.
AUGMENTATION OF LOW FLOWS
To evaluate the effects of present and projected reservoir develop ments on the dissolved-solids content of the Delaware Eiver at Tren ton, hydrologic data observed during the 1962 water year have been
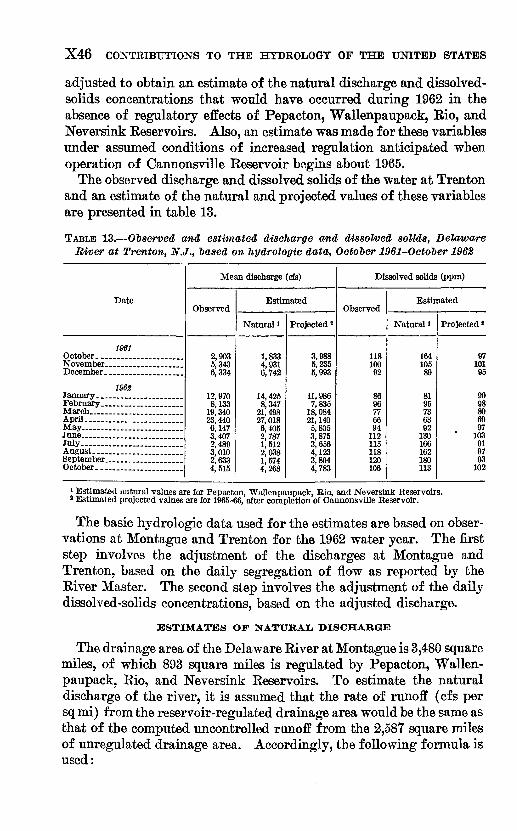
X46 CONTRIBUTIONS TO THE HYDROLOGY OF THE UNITED STATES
adjusted to obtain an estimate of the natural discharge and dissolved- solids concentrations that would have occurred during 1962 in the absence of regulatory effects of Pepacton, Wallenpaupack, Rio, and Neversink Reservoirs. Also, an estimate was made for these variables under assumed conditions of increased regulation anticipated when operation of Cannonsville Reservoir begins about 1965.
The observed discharge and dissolved solids of the water at Trenton and an estimate of the natural and projected values of these variables are presented in table 13.
TABLE 13. Observed and estimated discharge and dissolved solids, Delaware River at Trenton, N.J., based on hydroloffic data, October 1961-October 1962
Date
1961 October. __ __________November __________December. __________
1968
February ___________March __________April _____________May... _____________June ___________ .July.. ...................August ____________September ______October. _________
Mean discharge (cfs)
Observed
2,903 5,343 6,334
12, 970 8,133
19,340 23,440 6,147 3,407 2,489 3,010 2,633 4,515
Estimated
Natural '
1,833 4,931 6,742
14, 425 8,347
21, 498 27,018 6,405 2,787 1,512 2,038 1,574 4,268
Projected s
3,988 5,235 5,993
11, 986 7,835
18,084 21,140 5,805 3,875 3,656 4,123 3,804 4,783
Dissolved solids (ppm)
Observed
118 100 92
86 96 77 66 94
112 115 118 120 106
Estimated
Natural 1
164 105 89
81 95 73 63 92
130 166 162 180 113
Projected *
97 101 95
90 98 80 69 97
103 91 97 93
102
1 Estimated natural values are for Pepacton, Wallenpaupack, Eio, and Neversink Reservoirs.2 Estimated projected values are for 1965-66, after completion of Cannonsville Reservoir.
The basic hydrologic data used for the estimates are based on obser vations at Montague and Trenton for the 1962 water year. The first step involves the adjustment of the discharges at Montague and Trenton, based on the daily segregation of flow as reported by the River Master. The second step involves the adjustment of the daily dissolved-solids concentrations, based on the adjusted discharge.
ESTIMATES OF NATURAL DISCHARGE
The drainage area of the Delaware River at Montague is 3,480 square miles, of which 893 square miles is regulated by Pepacton, Wallen paupack, Rio, and Neversink Reservoirs. To estimate the natural discharge of the river, it is assumed that the rate of runoff (cfs per sq mi) from the reservoir-regulated drainage area would be the same as that of the computed uncontrolled runoff from the 2,587 square miles of unregulated drainage area. Accordingly, the following formula is used:

QUALITY, DELAWAKE RIVER WATER, TRENTON, N.J. X47
Computed uncontrolled runoff (cfs) X 3,480 sqmi (total drainage area)2,587 sq mi (unregulated drainage area)
=cfsX 1.35=estimated natural discharge.When the estimated natural discharge is higher than the observed
discharge at Montague, water is being stored in the reservoirs; con versely, when the estimated natural discharge is lower than the ob served discharge at Montague, stored water is being released from reservoirs at a rate greater than that of the runoff into the reservoirs.
After the estimates of the natural discharge at Montague are ob tained, the assumption is made that the travel time from Montague to Trenton is 2 days for both high and low river stages. The Corps of Engineers (1960, App. M, p. M-64) reported the low-flow travel time as 2.1 days (51 hours). Although the travel time at high flow may be less than 2 days, no significant error is introduced when esti mated discharges are computed on a monthly basis, as in table 13. The differences in the observed and estimated discharge at Montague, after allowing for 2-days travel time, are subtracted algebraically from the observed discharge at Trenton.
When the estimated natural, or rather adjusted, discharges at Tren ton are obtained, the differences between these and the observed dis charges are determined for adjustment of the dissolved-solids concen trations. As shown in table 13, the observed discharges for October and November 1961 and for May to October 1962 were higher than the stor age-adjusted discharges for these months; the reverse is true for the dissolved-solids concentrations. The differences reflect reservoir re leases of stored water for low-flow augmentation. However, from December 1961 to May 1962, the observed discharges were below the adjusted discharges owing to reservoir storage of water; at the same time, the observed dissolved-solids concentrations were higher than the estimated concentrations.
There are certain limitations to this procedure. An error of esti mate occurs during storm periods when the runoff from the drainage area above Montague is variable from location to location. This is particularly true at high elevations where the greatest precipitation generally occurs. Also, during periods of excessive storm runoff, Prompton and Jadwin flood-control reservoirs modify the flow of the Lackawaxen River by storing part of the storm runoff for subsequent release during receding river stage. During fair weather periods in the summer, such as May 1-October 31, 1962, streamflow is low, and the error of estimate in the total discharge is not significant. For instance, if the estimated natural runoff from reservoir-regulated drainage areas is 100 percent low, the error in the estimated natural discharge at Montague would be about 20 percent, and at Trenton, less than 10 percent.
X48 CONTRIBUTIONS TO THE HYDROLOGY OF THE UNITED STATES
ESTIMATES OP PROJECTED DISCHARGE, 1965-66
The esimates of the projected discharge at Trenton were based, like those of natural discharge, on observed discharges at Montague and Trenton for the 1962 water year. The Montague discharge was ad justed to compensate for storage of water in, and release of water from, Cannonsville Reservoir during high- and low-flow periods, respec tively. The purpose of this adjustment was to maintain the following 1961-62 seasonal design rate of flow at Montague: 2,650 cfs for June 15-November 4; 1,750 cfs for November 5-June 15; and 2,650 cf s for June 16-October 16.
In preparing the estimates, New York City's three reservoirs Pepacton, Cannonsville, and Neversink in the Delaware basin were assumed to be operated as a unit on a daily basis for Montague dis charge adjustments from May 30, 1961, to October 30, 1962. It was further assumed that New York City's reservoirs would have a suffi cient storage at all times to maintain the required compensatory re leases to the river. No adjustments were made in the observed releases (reported by the River Master) during 1962 from Wallenpaupack and Rio Reservoirs. Releases in addition to those made during 1962, required to maintain the applicable rates of flow, were considered as being directed from Cannonsville Reservoir. However, observed re leases directed from Pepacton and Neversink Reservoirs were decreased 16 days from July 26,1961, to October 27,1962.
As shown in table 13, the mean annual observed and projected discharges are lower than the mean annual estimated natural dis charge by 24/T cfs and 299 cfs, respectively. In 1961 New York City was allowed to divert water from Pepacton and Neversink Reservoirs at the rate of 490 mgd (759 cfs), but after the completion of Can nonsville Reservoir, the rate will be 800 mgd (1,238 cfs). The equivalent of 369.3 mgd (572 cfs) was diverted between June 1, 1961, and May 31,1962, and 376.6 mgd (583 cfs) was diverted between June 1 and December 9, 1962. Releases from these reservoirs, as directed by the River Master, have been at rates greater than the rates of diversions. However, the releases are seasonal and are only required during low-flow periods. For instance, during the 1962 water year, releases were made on 183 days; on 160 of these days the release rate was higher than the diversion rate of 583 cfs men tioned above. Because a part of the total runoff is diverted from the basin, the observed mean annual discharge is less than the natural discharge. This has been true since September 1955 and will con tinue to be true in the future.
Generally, reservoir operations will effectively narrow the range in the seasonal variations of dissolved-solids concentration in the
QUALITY, DELAWARE RIVER WATER, TRENTON, N.J. X49
water at Trenton. As shown in table 13, the estimated natural dis solved solids had a range of 117 ppm; however, there was a 54- percent decrease in the range during the 1962 water year because of existing reservoir operation. An additional decrease of 17 percent is projected so that the overall reduction will be 71 percent by 1965.
The observed mean annual dissolved-solids concentration for 1962 was 15 percent lower than that of the estimated concentration. On a monthly basis, the observed dissolved-solids concentration, expressed as percent change, range from a maximum increase of 6 percent in January to a decrease of 31 percent in July. The average increase for the 6 storage months December through May was about 4 percent (3 ppm); the average decrease during the 6 low-flow months was about 22 percent (37 ppm).
Under conditions projected to 1965, the dissolved solids will in crease an additional 4 percent (3 ppm) during the high-flow period and decrease an additional 14 percent (17 ppm) during the low- flow period.
OXIDATION OF WASTES
According to the U.S. Public Health Service (1960, p. 150), "* * * in 1956, therefore, the estimated load of 24,000 pounds of BOD (biochemical oxygen demand) per day discharged to the Dela ware River in the reach from Port Jervis to Trenton represents the load from a sewered population almost entirely treated to a degree presently accepted as being the best combination of percent removal of BOD and economy of treatment." The Public Health Service, on the basis of the expected increase in population, estimates that BOD will be twice this load by the year 2010.
Frequent analyses of Delaware River water at Trenton between May and August 1962 showed an average dissolved-oxygen concen tration of 10 ppm. This indicates an unpolluted water. Water containing 10 ppm dissolved oxygen carries 54,000 pounds of dis solved oxygen past Trenton each day for each 1,000 cfs of flow.
SUMMARY
The water of the Delaware River at Trenton is a calcuim bicar bonate and sulf ate type, and it is neither acid nor strongly alkaline. It averages 86 ppm dissolved solids. It is soft to moderately hard: the hardness ranges from 30 to 100 ppm 98 percent of the time. The temperature of the water closely follows the average air tem perature. It is good water satisfactory for many uses without much treatment.
The dissolved-solids concentrations in the water vary, but 80 per cent of the time they are within 50 percent of the average. The

X50 CONTRIBUTIONS TO THE HYDROLOGY OF THE UNITED STATES
concentrations are lowest in March, April, and May (median dis- solved-solids concentration 66 ppm) and are highest in August and September (median 107 ppm) when streamflow is low. Suspended- sediment concentration is relatively high when streamflow is greatest, and it exceeds 100 ppm only 5 percent of the time.
Water from the Appalachian Plateau province above Port Jervis has a lower concentration of dissolved solids generally less than 50 ppm than does water at Trenton. Some of this water is stored in the Pepacton and Neversink Eeservoirs. During the summer months, when streamflow at Trenton is low and concentrations of dissolved solids are highest, water is released from the reservoirs to increase the flow. This water mixes with the harder, more miner alized water from the Lehigh Eiver and from the Valley and Eidge province to improve the water quality at Trenton. The operation of these reservoirs and of others to be constructed is expected to de crease the variability in the chemical quality of the water at Trenton, in that there will be fewer days of high concentrations.
A decrease in annual flow since 1953 has been accompanied by an increase in average annual concentrations of dissolved solids. An increased population in the basin, together with more industrial plants, will probably result in the discharge of more wastes to the river. The biochemical oxygen demand will therefore increase, and dissolved oxygen will be consumed in destroying the wastes. It is hoped that improved waste-treatment methods, combined with aug mentation of low flows, will keep this problem from becoming acute in the river above Trenton.
The yield of dissolved solids in the Delaware Eiver basin above Trenton is 130 tons per square mile per year. An average of 880,000 tons of dissolved solids and approximately the same average quantity of suspended solids are carried past Trenton each year.
SELECTED REFERENCES
Durfor, C. N., and Anderson, P. W., 1963, Chemical quality of surface watersin Pennsylvania: U.S. Geol. Survey Water-Supply Paper 1619-W, 50 p.
Durfor, C. N., and Keighton, W. B., 1954, Chemical characteristics of DelawareRiver water, Trenton, N. J., to Marcus Hook, Pa.: U.S. Geol. Survey Water-Supply Paper 1262, 173 p., 1 pi.
Fenneman, N. M., 1938, Physiography of eastern United States: New York, Mc-Graw-Hill Book Co., 714 p.
Hely, A. G., Nordenson, T. J., and others, 1961, Precipitation, water loss, andrunoff in the Delaware River basin and New Jersey: U.S. Geol. SurveyHydrol. Inv. Atlas HA-11, 11 p., 6 pis.
Parker, G. G., Hely, A. G., Keighton, W. B., Olmsted, F. H., and others, 1964,Water resources of the Delaware River basin: U.S. Geol. Survey Prof. Paper381 (in press).

QUALITY, DELAWARE RIVER WATER, TRENTON, N.J. X51
Pennsylvania Department of Commerce State Planning Board, and Pennsylvania Department of Forests and Waters. Publication 17, 1947, Industrial utility of water in Pennsylvania; chemical character of surface water, 1944 to 1946, 172 p. Publication 23, by W. F. White, Jr., 1951, Chemical character of surface water in Pennsylvania, 1946 to 1949, 169 p. Publication 26, by N. H. Beamer, 1953, Chemical character of surface water in Pennsylvania, 1949 to 1951, 96 p.
U.S. Army Corps of Engineers, 1960 (revised May 1961), Report on the compre hensive survey of the water resources of the Delaware River basin, U.S. Army Engineer District, Philadelphia, Valley Report Group, Russell Morgan, Chief, 11 volumes. Now issued as House Document No. 522, 87th Con gress, 2nd Session, 1962, Delaware River Basin, New York, New Jersey, Pennsylvania, and Delaware, U.S. Government Printing Office, Washington, in 11 volumes.
U.S. Geological Survey, 1963, Report of the River Master of the Delaware River, December 1961-November 1962: 9th Ann. Rept., 91 p.
U.S. Public Health Service, 1960, Municipal and industrial water use and stream quality, in Report on the comprehensive survey of the Delaware River basin: U.S. Army Engineer Dist, Corps of Engineers, App. C, 238 p.
o

The U.S. Geological Survey Library has cataloged this publication as follows:
McCarthy, Leo Thomas, 1925-Quality of Delaware Biver water at Trenton, New Jersey,
by Leo T. McCarthy, Jr., and Walter B. Keighton. Wash ington, U.S. Govt. Print. Off., 1964.
iv, 51 p. maps (1 fold, in pocket) diagrs., tables. 24 cm. (U.S. Geo logical Survey. Water-Supply Paper 1779^-X)
Contributions to the hydrology of the United States.Prepared in cooperation with the Commonwealth of Pennsylvania
Dept. of Forests and Waters and with the Philadelphia Water Dept.(Continued on next card)
McCarthy, Leo Thomas, 1925- Quality of Delaware Eiver water at Trenton, New Jersey. 1964. (Card 2)
Bibliography: p. 50-51.1. Water Analysis. 2. Water Composition. 3. Trenton, N.J.
Water-Supply. I. Keighton, Walter Barker, 1901- joint author. II. Pennsylvania. Dept. of Forests and Waters. III. Philadelphia. Water Dept. IV. Title: Delaware River water at Trenton, New Jersey. (Series)