quality improvement tools for intervention determination presenters: kris hartmann, ms healthcare...
TRANSCRIPT
Quality Improvement Tools for Intervention Determination
Presenters: Kris Hartmann, MSHealthcare Analyst, Performance Improvement Projects
Don Grostic, MSBiostatistician, Performance Improvement Projects

Objectives of the Workshop
2
• To share the latest knowledge on quality improvement tools.
• To address identified opportunities for improvement from prior Florida PIP validations.
• To support current efforts in determining interventions for ongoing PIPs.
• To provide a systematic, step-by-step approach that can be used to select impactful interventions.

Summary of Objectives
3
• To empower you, your team, and your organization to answer the question:
“What changes can we make that will result in improvement?”

Quality Improvement Tools
4
• Team Building• Process Mapping• Failure Modes and Effects Analysis (FMEA)• Pareto Diagram• Failure Mode Priority Ranking

Building a PIP Team
• Including the right people on the PIP team is critical to a successful improvement effort.
• Teams may vary in size and composition. • Team composition should be driven by the PIP topic.
5
Building a PIP Team: Senior Management
A Sponsor from Senior Management:• Is critical to support the PIP team efforts. • Serves to link the PIP team with senior management
and assure alignment with the organizational strategy.
• Provides resources and assists with overcoming organizational barriers on behalf of the team.
• Enables the PIP Team to make the changes necessary to improve the process.
6

Building a PIP Team: Clinical Support
A clinical leader:• Is critical to the PIP team efforts. • Provides insight into the clinical implications of
potential interventions and can anticipate the impact of system changes.
• Should come from the areas of the organization that are relevant to the PIP topic.
7

Building a PIP Team: Analytical Support
Analytical Support: • Should be included from the beginning of the
project. • Provides sound methodology upon which the project
is based. • Ensures that outcomes are accurately measured.
8

Building a PIP Team: Step-by-Step Approach
Steps to develop an effective team:1. Review the PIP topic.2. Consider the process being targeted for
improvement. 3. Include team members who are knowledgeable about
the different levels and steps of the process.4. Include analytical support from the beginning of the
project.
9
Building a PIP Team: Step by Step Approach
5. Identify an executive sponsor who takes responsibility for the success of the project.
6. Consider including partners from external organizations that are part of the process.
10

Process Mapping
11
A process map is:• A quality improvement tool that illustrates how a
current process is being administered.• A global view of all the steps in the current process
to determine where improvement efforts are most needed.
• Most effective if it is documented from the perspective of the person most affected by the overall process, typically the enrollee.

Building A Process Map: Step-by-Step Approach
12
1. Determine the beginning and ending points.2. Involve the individuals responsible for the different
steps of the process.3. Determine 3–5 prominent phases that occur for the
process to work.4. List the activities for each phase of the process.5. Obtain feedback from all team members before
finalizing the process map.
13
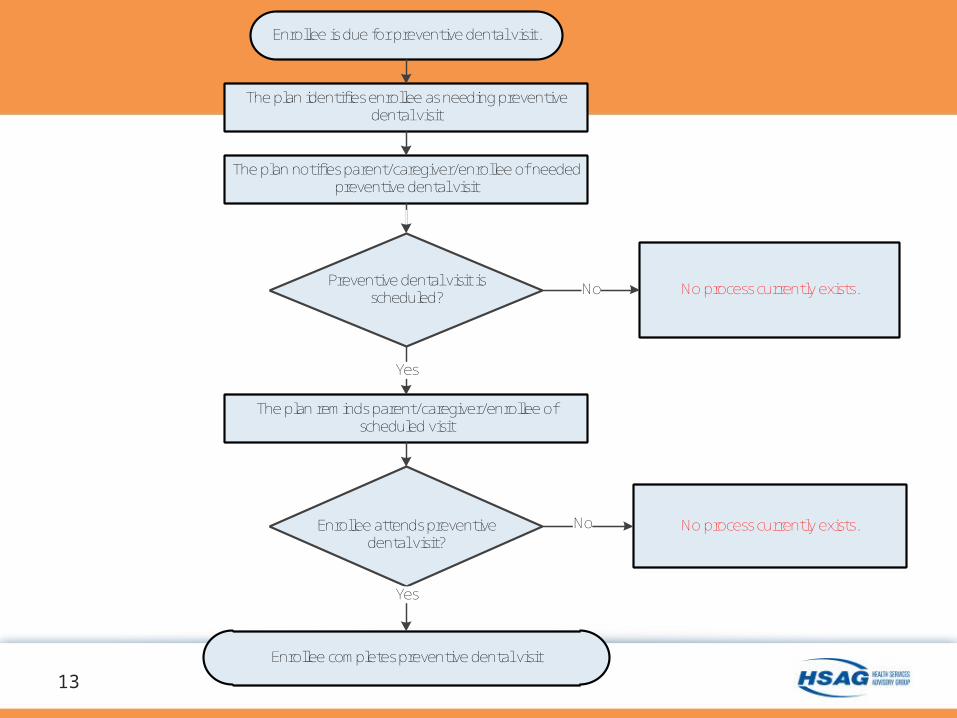
Enrollee is due for preventive dental visit.
The plan identifies enrollee as needing preventive dental visit
Preventive dental visit is scheduled? No process currently exists.
The plan reminds parent/caregiver/enrollee of scheduled visit
Enrollee attends preventive dental visit?
No process currently exists.
Enrollee completes preventive dental visit
Yes
Yes
No
No
The plan notifies parent/caregiver/enrollee of needed preventive dental visit
Questions and Answers
14
Questions on Team Building and Process Mapping

Quality Improvement Tools
15
• Team Building• Process Mapping• Failure Modes and Effects Analysis (FMEA)• Pareto Diagram• Failure Mode Priority Ranking
Presenter:Don Grostic, MSBiostatistician, Performance Improvement Projects
Failure Modes and Effects Analysis
16
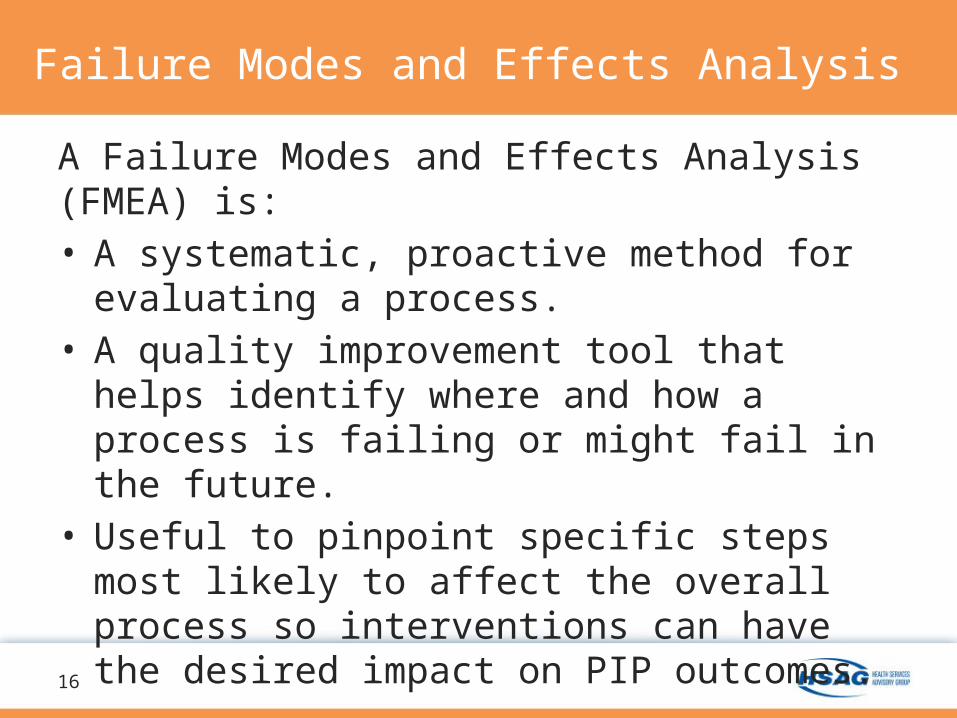
A Failure Modes and Effects Analysis (FMEA) is:• A systematic, proactive method for evaluating a
process.• A quality improvement tool that helps identify where
and how a process is failing or might fail in the future.
• Useful to pinpoint specific steps most likely to affect the overall process so interventions can have the desired impact on PIP outcomes.

Failure Modes and Effects Analysis
17
Failure Modes: What could go wrong?Any scenario that could go wrong (failing now or can go wrong in the future).
Failure Causes: Why would the failure happen?Explanation of why the failure mode would occur; what is the root cause of the failure?
Failure Effects: What is the consequence of the failure? What is the aftermath of the failure?

Steps for Conducting FMEA
18
1. Determine up to three sub-processes from the process map that will have the most impact on improving the PIP outcomes.
2. Include all individuals responsible for the chosen sub-processes.
3. Brainstorm all failure modes that can occur for each sub-process.
Steps for Conducting FMEA
19
4. Brainstorm failure causes and effects for each failure mode.
5. Evaluate the results and determine the priority ranking for each failure mode.
6. Obtain feedback from all individuals before finalizing the FMEA.

Failure Modes and Effects Analysis Priority Ranking
20
• Priority ranking allows for the highest ranked failure modes to take precedence when determining the interventions to be tested.
• The highest priority failure modes are those that have the most leverage on affecting the PIP Outcomes.
• The priority ranking should be based on MCO data and experience.

Pareto Diagram
21
A Pareto diagram is another method to identify specific areas in the overall process that warrant interventions.When to use a Pareto chart:• Analyzing data about the frequency of problems or
causes in a process.• There are many problems or causes and you must
focus on the most significant.• Analyzing broad causes by looking at their specific
components.• Communicating to others about your data.
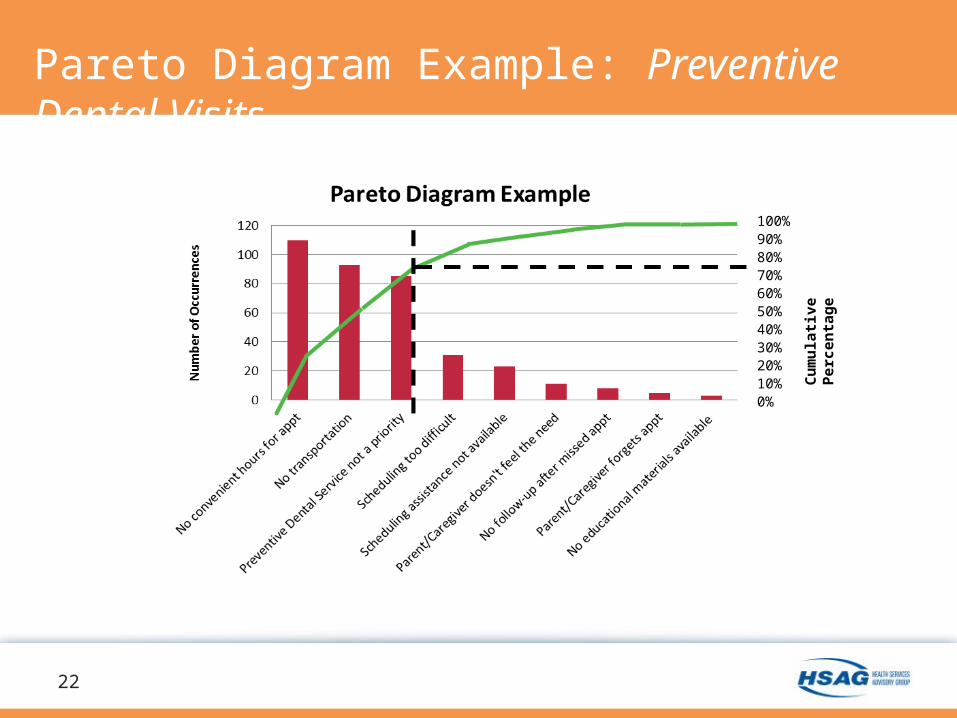
Pareto Diagram Example: Preventive Dental Visits
22
100%90%80%70%60%50%40%30%20%10%0%
Cum
ulati
ve P
erce
ntag
e

Priority Ranking: Risk Priority Number (RPN)
23
The RPN is a numeric assessment of risk or impact of each sub-process.
The RPN has three basic components:• Likelihood that the failure would occur.• Likelihood that the failure would not be detected.• The amount of harm or damage the failure mode may
cause.
Each Component is ranked on a scale of 1 to 5:(Low Risk) 1--------------------------------------5 (High Risk)
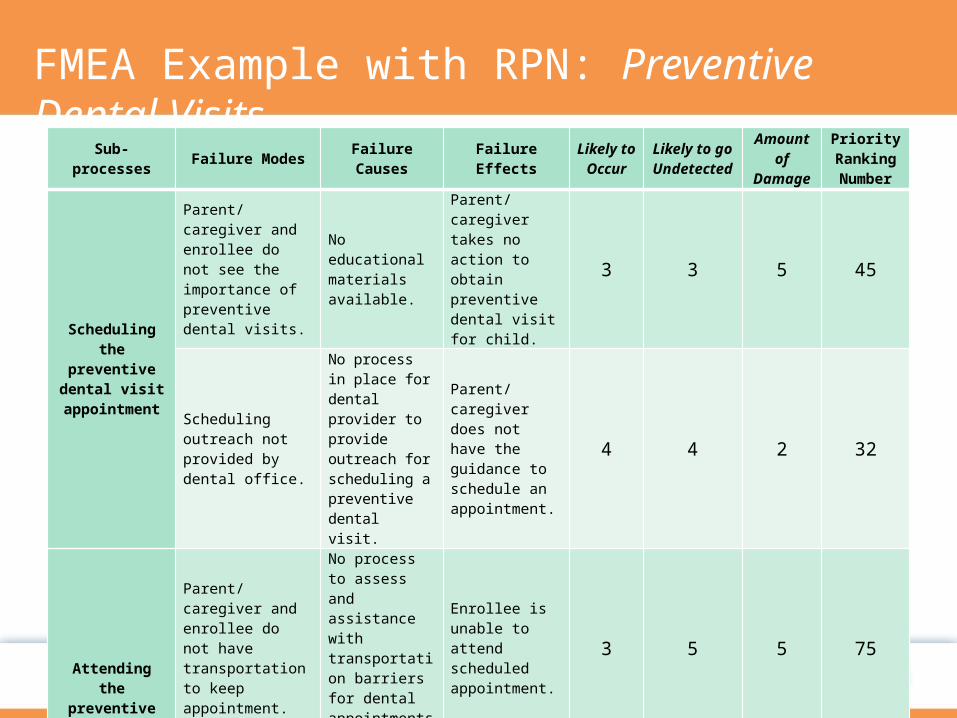
FMEA Example with RPN: Preventive Dental Visits
24
Sub-processes Failure Modes Failure Causes Failure EffectsLikely
to Occur
Likely to go Undetected
Amount of
Damage
Priority Ranking Number
Scheduling the preventive dental visit
appointment
Parent/caregiver and enrollee do not see the importance of preventive dental visits.
No educational materials available.
Parent/caregiver takes no action to obtain preventive dental visit for child.
3 3 5 45
Scheduling outreach not provided by dental office.
No process in place for dental provider to provide outreach for scheduling a preventive dental visit.
Parent/caregiver does not have the guidance to schedule an appointment.
4 4 2 32
Attending the preventive dental visit
appointment
Parent/caregiver and enrollee do not have transportation to keep appointment.
No process to assess and assistance with transportation barriers for dental appointments.
Enrollee is unable to attend scheduled appointment.
3 5 5 75
Dental offices do not offer convenient hours.
Appointment is scheduled at a time that is difficult to attend.
Enrollee is unable to attend scheduled appointment.
4 5 5 100

Failure Mode Ranking Example: Preventive Dental Visits
25
Priority
(Highest to
Lowest)
Priority Ranking
ScoreFailure Modes
1 100 Dental offices do not offer convenient hours.
2 75Parent/caregiver and enrollee do not have transportation to keep appointment.
3 45 Parent/caregiver does not see the importance of preventive dental visits.
4 32 Scheduling outreach not provided by dental office.
Intervention Determination
26
• The ranked failure modes should be used as a guide to determine the interventions to be tested.
• The failure modes with the higher ranking need more attention.

Intervention Determination Example: Preventive Dental Visits
27
Failures Potential Interventions Consideration for Reliability
Dental offices do not offer convenient hours.
Partnering with dental offices to offer Saturday and/or evening preventive dental appointments.
Offering Saturdays and evening appointment times will decrease the difficulty working parents/caregivers may have in attending appointments with their children.
Parent/caregiver and enrollee do not have transportation to keep appointment.
Hosting a mobile dental service van at various locations.
Bringing a mobile dental unit near the enrollee’s residence will reduce the structural transportation barrier that makes it difficult to access preventive dental services.
Parent/caregiver does not see the importance of preventive dental services.
Partnering with pediatrician offices to provide education to parents/caregivers on importance of preventive dental care, recommended frequency of visits.
Messages provided during pediatric well or sick visits will capitalize on the opportunity to provide face-to-face education and help parents/caregivers to understand how dental care fits into the overall health of children.

Questions and Answers
28
Discussion and Breakout Sessions