quality improvement process (qip) - norwich city school ... - 2013 draft.pdf · quality improvement...
TRANSCRIPT

Page 1
Quality Improvement Process (QIP) Strategies to Improve Outcomes for Students with Disabilities
District and Partner Information
District/Building Name:
Norwich Middle School RSE-TASC Project:
DCMO BOCES SEQA Region:
Mid-South Effective Dates for
QIP: 9/13-6/15
District Contact Person:
Iraina Gerchman Special Education School Improvement Specialist
(SESIS) Responsible for QIP: Kimberly Matthews School Year:
2013-2014
Type of Submission: (check one) xx Initial Development of QIP Mid-point Report of Progress – Final Report of Progress –
List Participants and Their Titles
Gerard O’Sullivan, Superintendent Katherine McKeever, Director of Special Programs
Kimberly Matthews, SESIS Iraina Gerchman, Director of Instruction and Staff Development
Scott Ryan, MS Principal Linda Callea, Network Team Member

Page 2
Current Status of District in IDEA Designation Areas
IDEA Designation:
District in Need of Assistance
Current Status
School failed to make AYP for students with disabilities subgroup in 3-8 ELA and Math - Improvement (Year 2) Focused
Summary of Analysis of Need by Impact Area In the sections below identify:
What additional data the team collected and reviewed and why.
How the team determined whether or not to focus on each of the 3 impact areas.
How the Quality Indicators Guides were utilized.
How you assessed the current classroom instructional practices in order to identify the areas of need.
The priority needs the team identified.

Page 3
1. Literacy/Instruction
Leadership Data:
Norwich Middle School 2012 Tripod Survey Teacher Perspective
A.Collective Instructional Efficacy
Teachers in this school have strong skills to deal with student disciplinary problems. 35.7%
Teachers here are confident that they can motivate their students to think and work hard. 64.3%
Teachers here have strong skills to produce meaningful student learning. 71.4%
D.Leadership Instructional Expertise
At least one instructional leader
at this school:
is very knowledgeable about curriculum and effective instructional practices. 53.3%
provides helpful guidance for effective classroom practice. 26.7%
is knowledgeable about assessment practices. 66.7%
E.Leadership Instructional Press
At least one instructional leader
at this school:
makes frequent and systematic visits to my classroom. 26.7%
has high, ambitious goals when working with me to improve instruction. 40.0%
checks to make sure that I try to implement what I learn in professional development. 40.0%
sets high standards for teaching. 66.7%
is willing to provide criticism. 66.7%
F.Leadership Instructional Support
At least one instructional leader
at this school:
gives me helpful feedback after visiting my classroom. 46.7%
communicates effectively when giving me support. 46.7%
G.Quality of Professional Development
Overall my professional
development (PD) experiences this
year have:
been sustained and coherently focused, rather than short term and unrelated. 60%
helped me build new skills that have increased my effectiveness in teaching. 60%
helped me better meet the learning needs of my students. 46.7%
included enough time to think carefully about, try, and evaluate new ideas. 26.7%
included monitoring to see whether or how I used what I learned in PD, to improve teaching. 40%
H. School Cultural Press for Excellence
This school sets high standards for academic performance. 53.3%
The school culture here makes everyone feel obligated to teach well. 46.7%
Teachers here hold one another accountable for working hard. 53.3%
I. Instructional Leadership: Principal Press
The PRINCIPAL at this school:
communicates a clear vision for our school. 60%
actively monitors the quality of teaching at this school. 53.3%
makes sure that professional development addresses priority instructional goals. 53.3%
is willing to have difficult conversations, if the result is to improve teaching and learning. 53.3%
sets clear and measurable school-level goals for progress on instructional outcomes. 60%
J. Instructional Leadership: Principal Support
The PRINCIPAL at this school:
helps teachers figure out how to address particular instructional challenges. 53.3%
visits my class and gives me helpful feedback afterward. 33.3%
supports teachers in their efforts to improve teaching and learning. 60%
K. School-Level Collective Efficacy
When our school decides to do something, we do it successfully. 14.3%
Our school is a very able organization -- we work together very well. 28.6%
The adults at our school face up to challenges and overcome them together. 28.6%
L. Time in Professional Community Activities
We have at least a half our bi-weekly
or weekly to:
look at student work and brainstorm together about how to help students perform more successfully on such work? 38.5%
help another teacher improve his or her teaching? 28.6%
design, discuss or grade common formative assessments? 53.8%
make teaching decisions using student performance data? 53.8%
discuss materials or activities for particular classes or lessons? 78.6%
discuss issues of student behavior or discipline? 92.9%
discuss administrative issues or logistics? 61.5%

Page 4
Instructional Data:
Norwich MS Walkthrough Data 2012-2013 School Year Focus Area
Walkthrough Criteria Baseline Oct/Nov 2012 Nov/Dec 2013 Feb/Mar 2013
ELA Math ELA Math ELA Math ELA Math
Gra
du
al R
ele
ase
of
Re
spo
nsi
bili
ty 3C
The objective of the lesson is written on the board and referenced by teacher
5/8 4/4 4/6 6/6 4/5 6/6 4/6 5/5
4C Teacher models the strategy in sequential steps 5/8 4/4 3/6 4/6 3/5 3/6 3/6 4/5
5A Teacher leads student through step-by-step practice 4/8 3/4 3/6 5/6 4/5 6/6 3/6 4/5
6B Students are able to accurately complete tasks without prompts 1/8 0/4 3/6 3/6 1/5 1/6 2/6 3/5
7B Teacher conducts a short formative assessment of student level of understanding; e.g. exit cards, collects independent work, self-check or peer check of work
4/8 1/4 1/6 3/6 1/5 1/6 1/6 5/5
Stu
de
nt
Enga
gem
en
t 4D Teacher’s instruction ensures high levels of participation by students, e.g. choral responding, question/answer, thumbs-up, white board response
3/8 2/4 2/6 2/6 3/6 4/6 2/6 4/5
4F Students engage in structured activities designed to allow processing; e.g. I-time, think-pair-share, numbered heads, elbow partners, think-jot
2/8 0/4 2/6 1/6 2/6 4/6 3/6 4/5
4H Students are responding to higher order questions; e.g. problem-solving, generalization, evaluative, inferential, application [building /using math models)
3/8 1/4 4/6 3/6 2/6 4/6 2/6 4/5
5G Students work in groups of varying sizes; e.g. individual, pairs, small group, whole group
3/8 2/4 5/6 5/6 5/6 6/6 3/6 4/5
1. For students with disabilities who have difficulty with basic academic skills in reading,
writing and/or math:
a. Staff explicitly teach and/or re-teach necessary reading, writing and/or math skills to
students who have difficulties with basic academic skills. 4 13
b. Staff explicitly teach and/or re-teach necessary reading, writing and/or math strategies,
including the what, why, how and when; e.g. the use of mnemonic aides, self-questioning,
self-monitoring, think-aloud.
4 13
c. Teacher models what effective reading, problem-solving and/or writing looks and
sounds like. 5 13
d. Students have immediate access to text in alternative format(s); i.e., audio, digital, Braille, large print.
0 13
e. There are structured accommodations for reading, writing and/or math tasks such as charts, reference tables, manipulatives, individual work folders and student grouping.
5 13
f. Accommodations to the reading, writing and/or math tasks are used by students who
have difficulties with basic academic skills. 3 13

Page 5
Norwich Middle School 2012 Tripod Survey Student Perspective
Captivate
I like the ways we learn in this class. 64%
(Disagree with) This class does not keep my attention – I get bored. 55%
My teacher makes lessons interesting. 60%
My teacher makes learning enjoyable. 58%
Priority needs identified:
2.5 (Developing): Provide relevant feedback around instructional practice, track teacher progress, and hold administrators and teachers accountable for continuous improvement.
3.5 (Developing): Implement the DDI process to inform instruction and establish individual learning targets for students.
4.2 (Ineffective): Teachers should establish learning targets for all students based on formative and summative assessment data.
4.3 (Developing): Provide professional development to assist teachers to incorporate CCLS instruction that is differentiated and leads to multiple points of access and engagement for all students.
4.4 (Ineffective): Provide professional development and monitoring of implementation for the development of instruction that creates greater student engagement and inquiry.
4.5 (Ineffective): Provide professional development in formative and summative assessment construction, creating rubrics, and using assessments to inform / differentiate instruction. Teachers should have expectations for timely and explicit feedback and students have rubrics to self-assess their own learning. Students with disabilities should participate in participating in ownership of their learning.

Page 6
2. Special Education Programs/Service Delivery
Data collected/reviewed/why. Use of QIs. Assessment of instruction: Instructional Data:
Norwich Middle School Fountas & Pinnell Benchmark Data
2012 QIP Target = 2 Grade Levels of Growth
2012-2013 School Year
SWD Meeting Mid Year Target SWD Meeting End of Year Target
6th Grade 7th Grade 8th Grade 6th Grade 7th Grade 8th Grade
# SWD Meeting QIP Target
1/3 6/15 1/21 0/3 3/16 2/14
% SWD Meeting QIP Target
33% 40% 5% 0% 19% 8%
Total # SWD Meeting QIP Target
8/39 5/33
Total % SWD Meeting QIP Target
21% 15%
Element of the Guided Reading Lesson
2012 – 2013 # Classrooms where Element was Observed
Oct/Nov Dec/Jan March May
Selecting the Text (instructional level for student)
3/3 3/3 6/7 2/6
Introducing the Text (effectively “debugs”)
Beginning May: added criteria of establish purpose for reading and goal of reading )
2/3 1/3 6/7 2/6
Reading the Text (supports student processing)
Beginning May: prompting matches student need 3/3 3/3 5/7 4/6
Discussing and Revisiting the Text (asks questions to check for comp.)
3/3 3/3 3/7 3/6
Teaching for Processing Strategies (explicit instruction in noted processing struggles)
1/3 1/3 3/7 0/6
Extending the Meaning of the Text (opportunity provided)
2/3 2/3 3/7 1/6
Word Work (relevant to student need and text)
1/3 1/3 2/7 1/6

Page 7
Norwich Middle School 2012 Tripod Survey Student Perspective
Clarify My teacher knows when the class understands, and when we do not. 67%
My teacher explains difficult things clearly. 66%
Priority needs identified:
4.2 (Ineffective): Teachers should establish learning targets for all students based on formative and summative assessment data.
5.5 (Ineffective): Review and use a variety of data sources to evaluate, respond to and modify intervention plans to support student academic and social needs. Systematically collect, share data, and modify interventions based on student needs.
Page 8
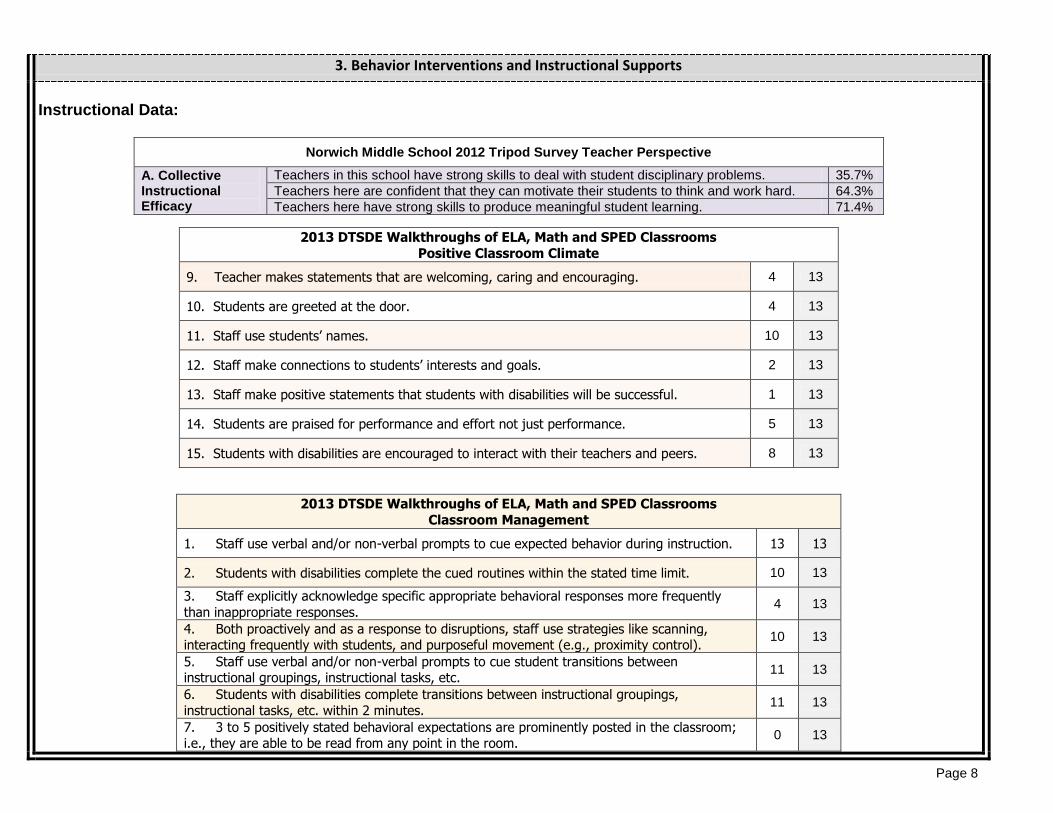
3. Behavior Interventions and Instructional Supports
Instructional Data:
Norwich Middle School 2012 Tripod Survey Teacher Perspective
A. Collective Instructional Efficacy
Teachers in this school have strong skills to deal with student disciplinary problems. 35.7%
Teachers here are confident that they can motivate their students to think and work hard. 64.3%
Teachers here have strong skills to produce meaningful student learning. 71.4%
2013 DTSDE Walkthroughs of ELA, Math and SPED Classrooms
Positive Classroom Climate
9. Teacher makes statements that are welcoming, caring and encouraging. 4 13
10. Students are greeted at the door. 4 13
11. Staff use students’ names. 10 13
12. Staff make connections to students’ interests and goals. 2 13
13. Staff make positive statements that students with disabilities will be successful. 1 13
14. Students are praised for performance and effort not just performance. 5 13
15. Students with disabilities are encouraged to interact with their teachers and peers. 8 13
2013 DTSDE Walkthroughs of ELA, Math and SPED Classrooms
Classroom Management
1. Staff use verbal and/or non-verbal prompts to cue expected behavior during instruction. 13 13
2. Students with disabilities complete the cued routines within the stated time limit. 10 13
3. Staff explicitly acknowledge specific appropriate behavioral responses more frequently
than inappropriate responses. 4 13
4. Both proactively and as a response to disruptions, staff use strategies like scanning, interacting frequently with students, and purposeful movement (e.g., proximity control).
10 13
5. Staff use verbal and/or non-verbal prompts to cue student transitions between instructional groupings, instructional tasks, etc.
11 13
6. Students with disabilities complete transitions between instructional groupings,
instructional tasks, etc. within 2 minutes. 11 13
7. 3 to 5 positively stated behavioral expectations are prominently posted in the classroom; i.e., they are able to be read from any point in the room.
0 13

Page 9
Student Data:
Norwich Middle School 2012 Tripod Survey Student Perspective
Control
(Disagree with) Student behavior in this class makes the teacher angry 37%
My classmates behave the way the teacher wants them to. 34%
Our class stays busy and doesn’t waste time. 45%
Students in this class treat the teacher with respect. 58%
(Disagree with) Student behavior in this class is a problem. 48%
(Disagree with) I hate the way that students behave in this class. 47%
Student behavior in this class is under control. 51%
Captivate
I like the ways we learn in this class. 64%
(Disagree with) This class does not keep my attention – I get bored. 55%
My teacher makes lessons interesting. 60%
My teacher makes learning enjoyable. 58%
Priority needs identified:
1.3: LINKS plan does not include behavioral needs of students and a culture of high expectations is not prevalent for all students
4.4 (Ineffective): Create a culture that is safe and has high expectations for all students.
5.2 (Ineffective): Create a system that has clear expectations for school response to student social and emotional needs. Review data
around student needs and create intervention plans to support positive student behaviors.
5.3: (Ineffective) Create a vision for social and emotional developmental health that leads to a safe environment for the school
community. Share this vision so community members are aware of the expectations, interventions and their respective roles in
supporting this vision.
5.4: (Developing) Develop clear expectations for behavior, based on the code of conduct and behavioral plans. Review behavioral data
and share with the school community.
5.5: (Ineffective) Review and use a variety of data sources (e.g., academic and social) to evaluate, respond and modify behavioral
interventions to support student academic and social needs. Systematically collect, share data, and modify interventions based on
student needs.

Page 10
Quality Improvement Goals
Impact Area: Special Education Programs/Service Delivery Priority Need(s) Addressed:
4.2 (Ineffective): Teachers should establish learning targets for all students based on formative and summative assessment data.
5.5 (Ineffective): Review and use a variety of data sources to evaluate, respond to and modify intervention plans to support student academic and social needs. Systematically collect, share data, and modify interventions based on student needs.
Measurable Goal #1:
By end of the school year 2014-2015, 65% of MS, grades 6-8, students with a disability will demonstrate a weighted student growth percentile (SGP) of 85% or better in both ELA and math [Baseline for 2013-2013: 26/58, or 48%, of students with a disability were at or above 85% SGP for ELA, and 26/56, or 46% of students with a disability were at or above 85% SGP for math].

Page 11
Quality Improvement Objectives and Activities for Goal # 1
Measurable Goal # 1:
By end of the school year 2014-2015, 65% of MS, grades 6-8, students with a disability will demonstrate a weighted student growth percentile (SGP) of 85% or better in both ELA and math [Baseline for 2013-2013: 26/58, or 48%, of students with a disability were at or above 85% SGP for ELA, and 26/56, or 46% of students with a disability were at or above 85% SGP for math].
Measurable and Observable System Objectives for this Goal (How will the System’s Practice/Capacity Change?)
The MS Reading and SPED Teachers will utilize the Guided Reading framework to deliver explicit reading instruction in 100% of resource rooms and reading classrooms with students with disabilities as measured by walkthrough data collected using a rubric and running records every two weeks.
The MS Special Education Teachers will provide remedial math instruction using Guided Math as the framework in 100% of 6th grade AIS Math and math resource rooms as measured by walkthrough data collected using a rubric.
Measurable and Observable Student Objectives for this Goal (How will Student Outcomes Change?)
Grade 6-8 students with a reading disability will demonstrate two grade levels of growth in reading as indicated by Fountas & Pinnell benchmark assessment levels three times/year [Baseline reading skill levels indicate ____].
Grade 6-8 students with math disability will demonstrate two levels of growth on a continuum of math skills measured by curriculum based assessments every 4 weeks [Baseline math skill levels are _____].

Page 12
Activity Supporting Measurable Goal and Objective(s)
Projected Date(s) of Activity
Implementation
SESIS Role in Implementing Each Activity
Implementation Data to be Collected, Schedule
and By Whom
SPECIALLY DESIGNED READING INSTRUCTION
Train teachers in foundational practices for grouping and supporting students with disabilities in guided reading groups
Train teachers to use running record data to set specific lesson goals responsive to individual student needs
Support teacher implementation of guided reading as a gap closing intervention for students with disabilities reading below grade level through: o Pre-lesson observation conferences where student
running records and progress data are reviewed with teachers
o Lesson observations where teacher and student voices are scripted
o Post lesson meetings where positive practices are noted and goals are set for future lessons
October 25 – grouping and supporting SWD in guided reading groups
October 28 – setting individual reading goals to meet needs of SWD
November 1 – develop protocols for collaboration between reading and SPED teachers around guided reading
3 days each month for coaching
Provide professional development in foundational practices in guided reading and using running record data to set and support lesson goals specific to individual learners.
Review reading remediation plans and running record data collaboratively with special education and reading teachers
Provide teacher coaching for 6-8 grade special education and reading teachers 1x/month
Provide follow up training as indicated by coaching data for special education and reading teachers.
Data: Collected when:
Collected by:
SPECIALLY DESIGNED MATH INSTRUCTION
Train 6-8 grade special education teachers in using the Continuum of Math Skills (Joan Miller) as a tool to assess and identify a starting point for math remedial instruction for students with disabilities
6-8 grade special education teachers in guided math practices
Support teacher implementation of guided math as a gap closing intervention for students with disabilities below grade level in math through:
o Pre-lesson observation conferences where student progress data are reviewed with teachers
o Lesson observations where teacher and student voices are scripted
o Post lesson meetings where positive practices are noted and goals are set for future lessons
July 24, 2013 & October 1, 2013 – using the Continuum of Math Skills (Joan Miller) as a tool to assess and identify a starting point for math remedial instruction for students with disabilities
July 25, 2013 - professional development for 6-8 grade special education teachers in guided math practices
2 days each month for coaching
Provide professional development to special education teachers in using the Continuum of Math Skills (Joan Miller) as a tool to assess and identify a starting point for math remedial instruction for students with disabilities
Provide professional development for 6-8 grade special education teachers in guided math practices
Review math remediation plans and assessment data for SWD collaboratively with Special Education teachers 1 x/month
Provide teacher coaching 6-8 grade special education teachers 1 x/each month
Provide follow up training as indicated by coaching data for special education teachers.
Data: Collected when: Collected by:

Page 13
Graphic Summary of QIP Goal, Objective(s) and Activities Alignment
Priority Need(s) 4.2 (Ineffective): Teachers
should establish learning targets for all students based on formative and summative assessment data.
5.5 (Ineffective): Review and use a variety of data sources to evaluate, respond to and modify intervention plans to support student academic and social needs. Systematically collect, share data, and modify interventions based on student needs.
Goal # 1 By end of the school year 2014-2015, 65% of MS, grades 6-8, students with a disability will demonstrate a weighted student growth percentile (SGP) of 85% or better in both ELA and math [Baseline for 2013-2013: 26/58, or 48%, of students with a disability were at or above 85% SGP for ELA, and 26/56, or 46% of students with a disability were at or above 85% SGP for math].
SPECIALLY DESIGNED READING INSTRUCTION
Train teachers in foundational practices for grouping and supporting students with disabilities in guided reading groups
Train teachers to use running record data to set specific lesson goals responsive to individual student needs
Support teacher implementation of guided through: o Pre-lesson observation conferences
where student running records and progress data are reviewed with teachers
o Lesson observations where teacher and student voices are scripted
o Post lesson meetings where positive practices are noted and goals are set for future lessons
System Objective(s) The MS Reading and SPED
Teachers will utilize the Guided Reading framework to deliver explicit reading instruction in 100% of resource rooms and reading classrooms with students with disabilities as measured by walkthrough data collected using a rubric and running records every two weeks.
The MS Special Education Teachers will provide remedial math instruction using Guided Math as the framework in 100% of 6th grade AIS Math and math resource rooms as measured by walkthrough data collected using a rubric.
SWD Objective(s) Grade 6-8 students with a reading
disability will demonstrate two grade levels of growth in reading as indicated by Fountas & Pinnell benchmark assessment levels three times/year.
Grade 6-8 students with math disability will demonstrate two levels of growth on a continuum of math skills measured by curriculum based assessments every 4 weeks.
SPECIALLY DESIGNED MATH INSTRUCTION
Train 6-8 grade special education teachers in using the Continuum of Math Skills (Joan Miller) as a tool to assess and identify a starting point for math remedial instruction for students with disabilities
6-8 grade special education teachers in guided math practices
Support teacher implementation of guided math as a gap closing intervention for students with disabilities below grade level in math through: o Pre-lesson observation conferences
where student progress data are reviewed with teachers
o Lesson observations where teacher and student voices are scripted
o Post lesson meetings where positive practices are noted and goals are set for future lessons

Page 14
Quality Improvement Process Report of Progress Goal # 1 1
Measurable Goal # 1:
By end of the school year 2014-2015, 65% of MS, grades 6-8, students with a disability will demonstrate a weighted student growth percentile (SGP) of 85% or better in both ELA and math [Baseline for 2013-2013: 26/58, or 48%, of students with a disability were at or above 85% SGP for ELA, and 26/56, or 46% of students with a disability were at or above 85% SGP for math].
Actual Status of Measurable Goal as of Report Date:
Students with a Disability with a Weighted Student Growth Percentile ≥85%
Subject Area 2012-2013 2013-2014 2014-2015
Math 26/56
46%
ELA 26/58
45%
Goal Establish Baseline 65% 65%
Measurable and Observable System Objectives for this Goal The MS Reading and SPED Teachers will utilize the
Guided Reading framework to deliver explicit reading instruction in 100% of resource rooms and reading classrooms with students with disabilities as measured by walkthrough data collected using a rubric and running records every two weeks.
The MS Special Education Teachers will provide remedial math instruction using Guided Math as the framework in 100% of 6th grade AIS Math and math resource rooms as measured by walkthrough data collected using a rubric.
Actual Status of Measurable System Objective(s) as of Report Date:
Measurable and Observable Student Objectives for this Goal Grade 6-8 students with a reading disability will
demonstrate two grade levels of growth in reading as indicated by Fountas & Pinnell benchmark assessment levels three times/year.
Grade 6-8 students with math disability will demonstrate two levels of growth on a continuum of math skills measured by curriculum based assessments every 4 weeks.
Actual Status of Measurable Student Objective(s) as of Report Date:
Norwich Middle School # and % of Students with a Disability Meeting Mid-Year, End of Year, and Grade Level Reading Targets
Year 2012-2013 2013-2014 2014-2015
Grade 6 7 8 6 7 8 6 7 8
Mid Year
1/3 6/15 1/21
33% 40% 5%
End of Year
0/11 3/16 2/24
0% 19% 8%
Grade Level
0/11 0%
2/16 13%
2/24 8%
1 Report of Progress pages are to be filled in and submitted at time of progress report, not with initial QIP.

Page 15
Activity Supporting Measurable Goal and Objective(s) Projected Date(s) of Activity
Implementation Actual Date(s) of Completion
SPECIALLY DESIGNED READING INSTRUCTION
Train teachers in foundational practices for grouping and supporting students with disabilities in guided reading groups
Train teachers to use running record data to set specific lesson goals responsive to individual student needs
Support teacher implementation of guided through: o Pre-lesson observation conferences where student
running records and progress data are reviewed with teachers
o Lesson observations where teacher and student voices are scripted
o Post lesson meetings where positive practices are noted and goals are set for future lessons
Professional Development
October 25 – grouping and supporting SWD in guided reading groups
October 28 – setting individual reading goals to meet needs of SWD
November 1 – develop protocols for collaboration between reading and SPED teachers around guided reading
Support (classroom coaching)
November 20-22, 2013
December 9-11, 2013
January 13-15, 2014
February 10-12, 2014
March 3-5, 2014
May 12-14, 2014
Professional Development
October 25 – grouping and supporting SWD in guided reading groups
October 28 – setting individual reading goals to meet needs of SWD
November 1 – develop protocols for collaboration between reading and SPED teachers around guided reading
Support (classroom coaching)

Page 16
Outcomes Based on Implementation Data Collected
Norwich Middle School Guided Reading Lesson Observation Data 2013-14
Element of the Guided Reading Lesson
Number of Classrooms where this Element was Observed
2012-2013 2013-2014 2014-2015
O/N D/J M M N D J F M M
Selecting the Text The teacher chooses a text:
that is at the student’s “just right” or instructional level
offers opportunity to teach and support the processing strategies the student has demonstrated gaps in
3/3 3/3 6/7 2/6
Introducing the Text The teacher:
communicates the lesson goal to students
“debugs” the text so it presents just the right amount of challenge
sets a purpose for the reading
2/3 1/3 6/7 2/6
Reading the Text The teacher:
listens in on each individual student reading
teaches, prompts for, and reinforces effective reading behaviors
The student(s):
read(s) the text accurately and fluently
self corrects decoding and fluency errors
3/3 3/3 5/7 4/6
Discussing and Revisiting the Text The teacher:
prepares and asks comprehension questions to assess student understanding of the text
checks to see if students were able to read for the purpose provided in the introduction
Each student:
shares their thinking
demonstrates understanding of the main ideas of the text
3/3 3/3 3/7 3/6
Teaching for Processing Strategies The teacher: notices and explicitly teaches or re-teaches reading problems which were noted to be problematic during student reading of the text
1/3 1/3 3/7 0/6
Extending the Meaning of the Text (optional) The teacher provides an opportunity for students to extend and deepen their understanding of the text through continued discussion, writing, or another activity
2/3 2/3 3/7 1/6
Word Work (optional) The teacher identifies and teaches a principle of phonics or word solving using the features of the text
1/3 1/3 2/7 1/6

Page 17
Outcomes Based on Implementation Data Collected
Norwich Middle School Progress Monitoring for Reading Levels of Students with a Disability Students
Grade
Baseline Benchmark
December Progress Monitoring
January Progress Monitoring
Mid Year Goal
February Benchmark
March Progress Monitoring
April Progress Monitoring
May Benchmark
End of Year Goal (2 GL Growth)
End of Year Grade Level F
& P Level
1 6 O R U Y
2 6 R U X Y
3 6 K N Q Y
4 6 I L O Y
5 6 M P S Y
6 6 N Q T Y
7 6 I L O Y
8 6 N Q T Y
9 6 M P S Y
10 6 I L O Y
11 6 P S V Y
12 6 K N Q Y
13 6 R U X Y
14 6 G K N Y
15 6 S V X Y
16 6 Q T W Y
17 6 N Q T Y
18 6 O R U Y
19 7 D J M Z
20 7 S V X Z
21 7 Q T W Z
22 8 T W Y Z
23 8 V X Y Z
24 8 R U X Z
25 8 Y Z Z Z
26 8 S V X Z
27 8 U X Y Z
28 8 P S V Z
29 8 S V X Z
30 8 S V X Z
31 8 T W Y Z
32 8 R U X Z
33 8 Q T W Z
34 8 X Z Z Z
35 8 N Q T Z
36 8 R U X Z
37 8 Q? T W Z

Page 18
Activity Supporting Measurable Goal and Objective(s) Projected Date(s) of
Activity Implementation Actual Date(s) of
Completion
SPECIALLY DESIGNED MATH INSTRUCTION
Train 6-8 grade special education teachers in using the Continuum of Math Skills (Joan Miller) as a tool to assess and identify a starting point for math remedial instruction for students with disabilities
Train 6-8 grade special education teachers in guided math practices
Support teacher implementation of guided math as a gap closing intervention for students with disabilities below grade level in math through: o Pre-lesson observation conferences where student progress
data are reviewed with teachers o Lesson observations where teacher and student voices are
scripted o Post lesson meetings where positive practices are noted and
goals are set for future lessons
Professional Development
July 24, 2013 & October 1, 2013 – using the Continuum of Math Skills (Joan Miller) as a tool to assess and identify a starting point for math remedial instruction for students with disabilities
July 25, 2013 - professional development for 6-8 grade special education teachers in guided math practices
Support (classroom coaching)
November 12, 14, 2013
December 11-13, 2013
January 15-17, 2014
February 12-14, 2014
March 5-7, 2014
May 14-16, 2014
Professional Development
July 24, 2013 & October 1, 2013 – using the Continuum of Math Skills (Joan Miller) as a tool to assess and identify a starting point for math remedial instruction for students with disabilities
July 25, 2013 - professional development for 6-8 grade special education teachers in guided math practices
Support (classroom coaching)
November 12, 14, 2013

Page 19
Outcomes Based on Implementation Data Collected

Page 20
Quality Improvement Process Report of Progress Barriers Identified for Measurable Goal # 1 2
Barrier to Implementation of Planned Activities or Achievement of Goal and Objectives
Next Steps and/or Strategies to Address Barriers
2 Delete page if no barriers are identified