quality and acceptability of high selenium beef m.j. marchello animal & range sciences...
Post on 21-Dec-2015
213 views
TRANSCRIPT
Quality and Quality and AcceptabilityAcceptabilityof High Selenium Beefof High Selenium Beef
M.J. MarchelloM.J. Marchello
Animal & Range Sciences Animal & Range Sciences DepartmentDepartment
North Dakota State UniversityNorth Dakota State University

CollaboratorsCollaborators
Dr. Joye M. BondDr. Joye M. Bond
Family and Consumer ScienceFamily and Consumer Science
Minnesota State University, MankatoMinnesota State University, Mankato
Dr. Daniel J. KlenowDr. Daniel J. Klenow
Sociology DepartmentSociology Department
North Dakota State UniversityNorth Dakota State University

IntroductionIntroduction
Selenium essential nutrient with Selenium essential nutrient with multiple health benefitsmultiple health benefits
Primary source – beefPrimary source – beef Selenium content in feed affects Selenium content in feed affects
amount in meat if an organic sourceamount in meat if an organic source Anti-carcinogenic propertiesAnti-carcinogenic properties Antioxidant propertiesAntioxidant properties Maintain a healthy immune systemMaintain a healthy immune system

ObjectivesObjectives
Awareness of selenium attributesAwareness of selenium attributes In-house sensory evaluationIn-house sensory evaluation Consumer sensory evaluationConsumer sensory evaluation

MaterialsMaterials
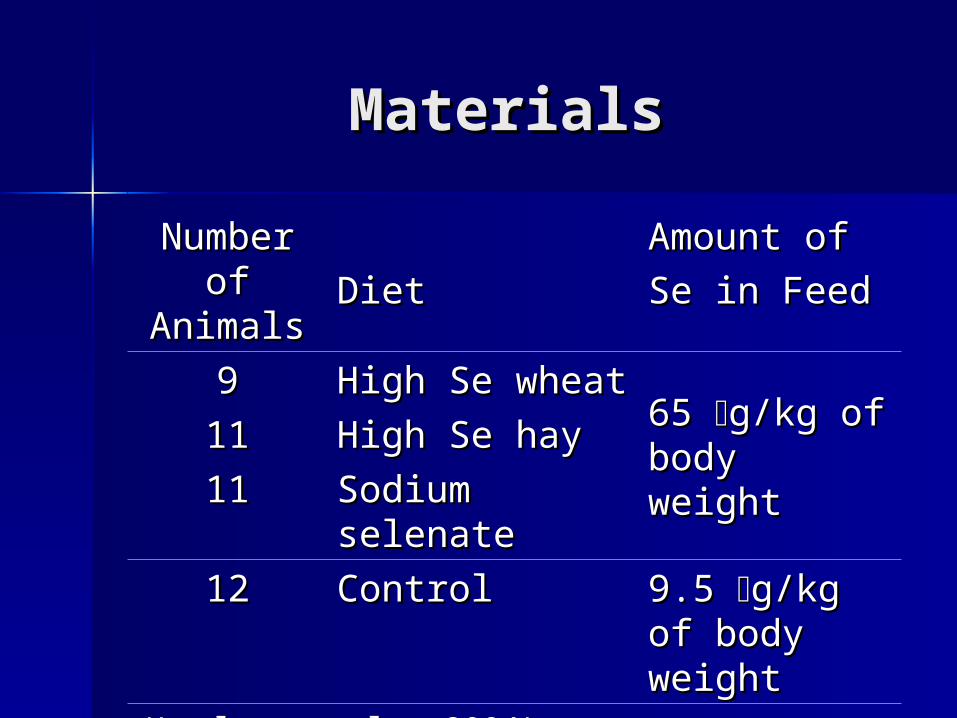
43 crossbred steers stratified by 43 crossbred steers stratified by weight, fed an isonitrogenous and weight, fed an isonitrogenous and isocaloric diet with selenium in the isocaloric diet with selenium in the feedfeed
MaterialsMaterials
Number Number of of
AnimalsAnimalsDietDiet
Amount of Amount of
Se in FeedSe in Feed
99 High Se wheatHigh Se wheat
65 65 g/kg of g/kg of body weightbody weight
1111 High Se hayHigh Se hay
1111 Sodium Sodium selenateselenate
1212 ControlControl 9.5 9.5 g/kg of g/kg of body weightbody weight
(Lawler et al., 2004)(Lawler et al., 2004)
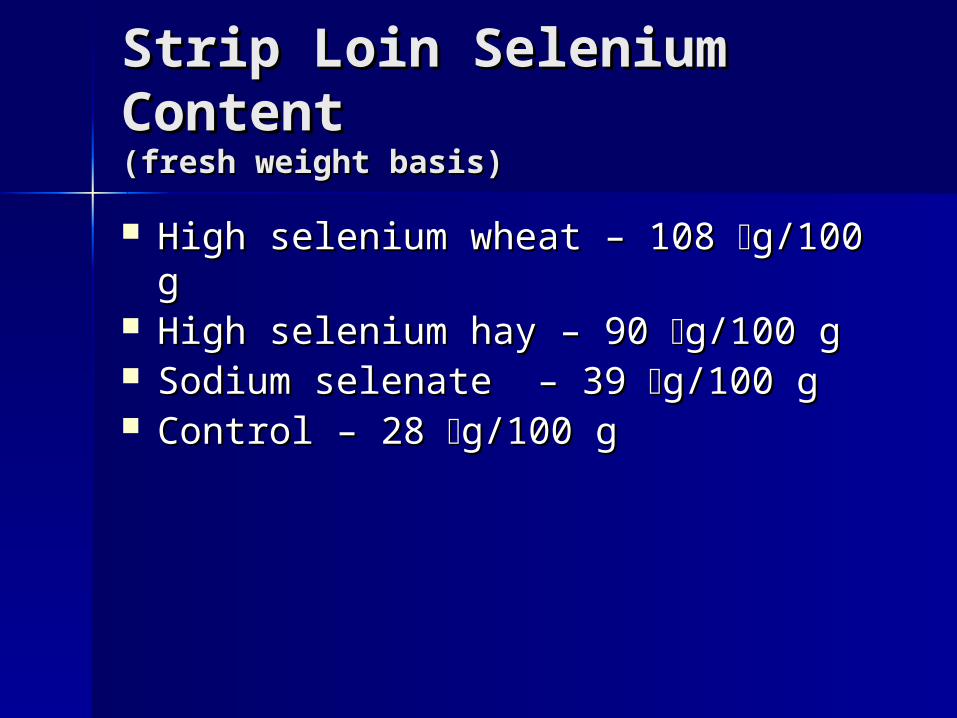
Strip Loin Selenium Strip Loin Selenium ContentContent((fresh weight basis)fresh weight basis)
High selenium wheat High selenium wheat – 108 – 108 g/100 gg/100 g
High selenium hay – 90 High selenium hay – 90 g/100 gg/100 g
Sodium selenate – 39 Sodium selenate – 39 g/100 gg/100 g
Control – 28 Control – 28 g/100 gg/100 g
MethodologyMethodology
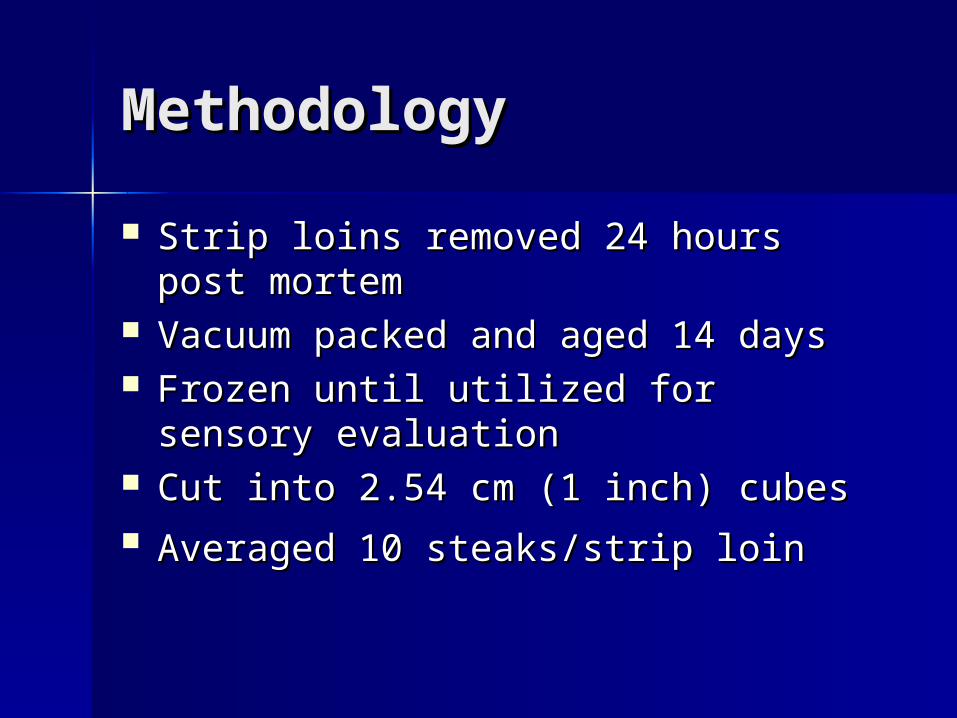
Strip loins removed 24 hours post Strip loins removed 24 hours post mortemmortem
Vacuum packed and aged 14 daysVacuum packed and aged 14 days Frozen until utilized for sensory Frozen until utilized for sensory
evaluationevaluation Cut into 2.54 cm (1 inch) cubesCut into 2.54 cm (1 inch) cubes Averaged 10 steaks/strip loinAveraged 10 steaks/strip loin

Consumer Consumer EvaluationsEvaluations
Participants completed pre-evaluation Participants completed pre-evaluation of selenium fed beefof selenium fed beef
Participants given top loin steakParticipants given top loin steak Participants returned sensory Participants returned sensory
evaluation form after consuming evaluation form after consuming cooked steakcooked steak
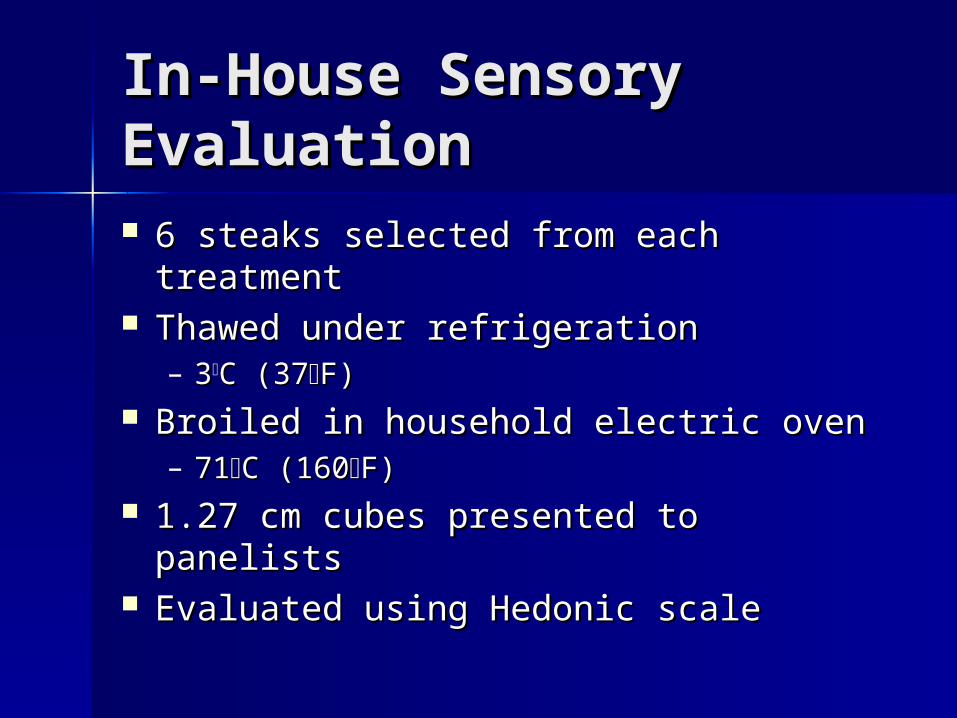
In-House Sensory In-House Sensory EvaluationEvaluation 6 steaks selected from each treatment6 steaks selected from each treatment Thawed under refrigerationThawed under refrigeration
– 33C (37C (37F)F) Broiled in household electric ovenBroiled in household electric oven
– 7171C (160C (160F)F) 1.27 cm cubes presented to panelists1.27 cm cubes presented to panelists Evaluated using Hedonic scaleEvaluated using Hedonic scale
CharacteristicsCharacteristics
Overall LikingOverall Liking TendernessTenderness JuicinessJuiciness FlavorFlavor
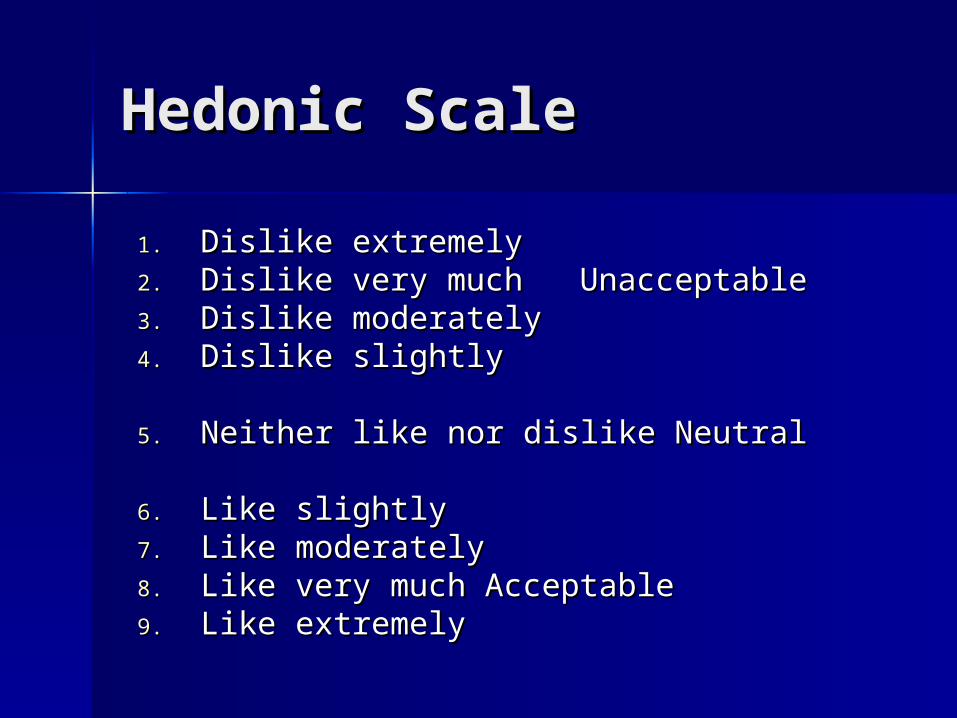
Hedonic ScaleHedonic Scale
1.1. Dislike extremelyDislike extremely2.2. Dislike very muchDislike very muchUnacceptableUnacceptable3.3. Dislike moderatelyDislike moderately4.4. Dislike slightlyDislike slightly
5.5. Neither like nor dislikeNeither like nor dislike NeutralNeutral
6.6. Like slightlyLike slightly7.7. Like moderatelyLike moderately8.8. Like very muchLike very much AcceptableAcceptable9.9. Like extremelyLike extremely

Consumer AwarenessConsumer Awareness
Research indicates that selenium (a Research indicates that selenium (a mineral needed in very small amounts mineral needed in very small amounts in humans) intake may be related to the in humans) intake may be related to the incidence of heart disease and cancer, incidence of heart disease and cancer, probably through its antioxidant probably through its antioxidant functions.functions.
– 32.2% (107) were aware32.2% (107) were aware– 67.8% (225) were not aware67.8% (225) were not aware
Statement
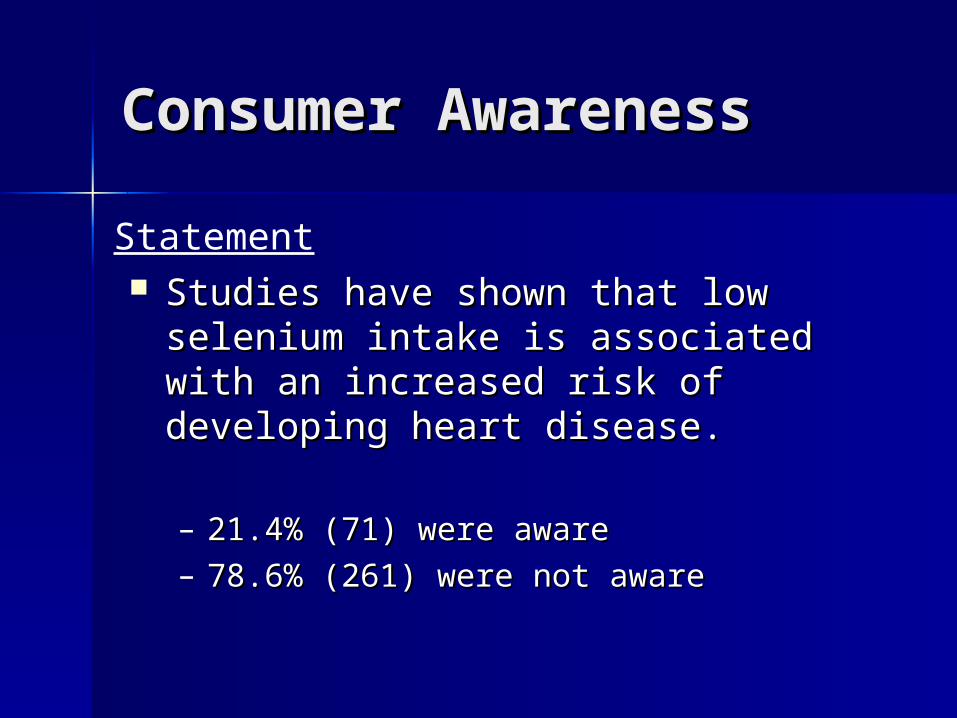
Consumer AwarenessConsumer Awareness
Studies have shown that low Studies have shown that low selenium intake is associated with an selenium intake is associated with an increased risk of developing heart increased risk of developing heart disease.disease.
– 21.4% (71) were aware21.4% (71) were aware– 78.6% (261) were not aware78.6% (261) were not aware
Statement
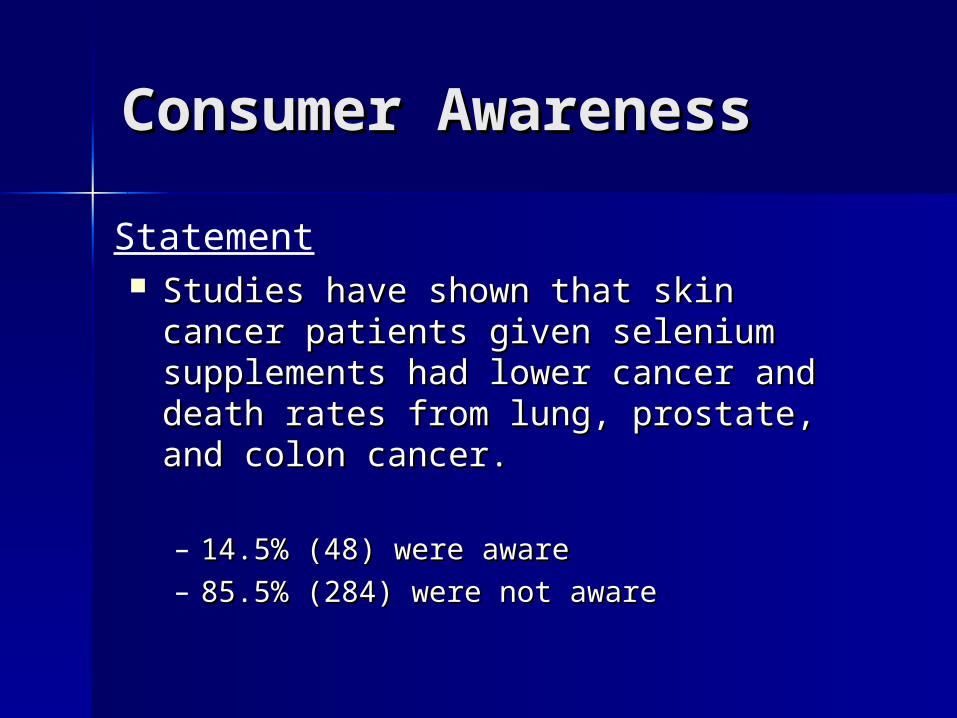
Consumer AwarenessConsumer Awareness
Studies have shown that skin cancer Studies have shown that skin cancer patients given selenium supplements patients given selenium supplements had lower cancer and death rates from had lower cancer and death rates from lung, prostate, and colon cancer.lung, prostate, and colon cancer.
– 14.5% (48) were aware14.5% (48) were aware– 85.5% (284) were not aware85.5% (284) were not aware
Statement
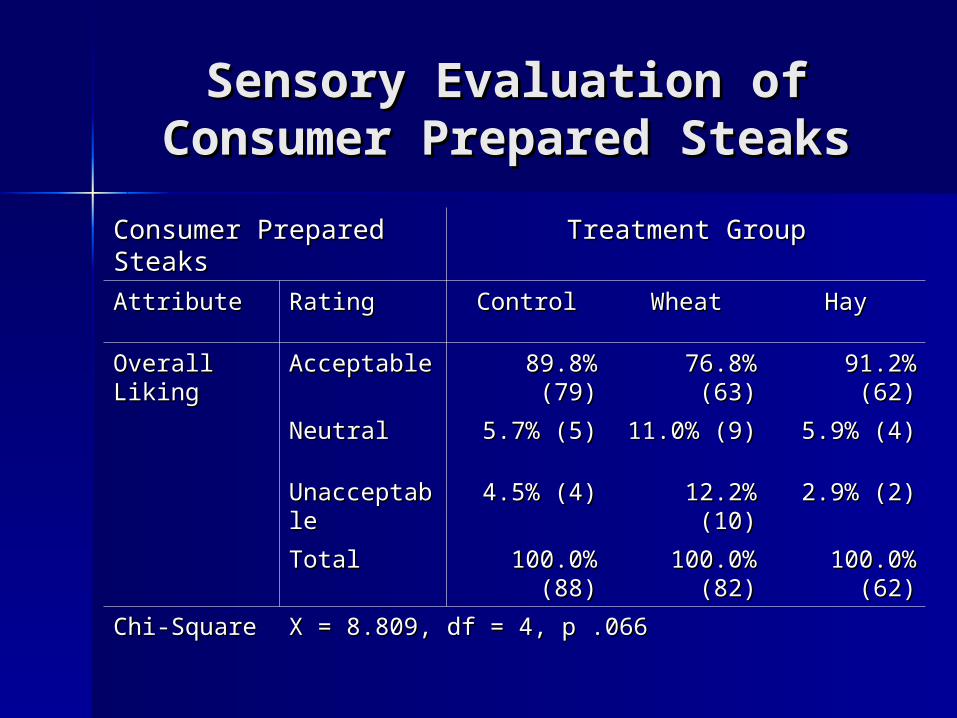
Sensory Evaluation of Sensory Evaluation of Consumer Prepared SteaksConsumer Prepared Steaks
Consumer Prepared Consumer Prepared SteaksSteaks
Treatment GroupTreatment Group
AttributeAttribute RatingRating ControlControl WheatWheat HayHay
Overall Overall LikingLiking
AcceptableAcceptable 89.8% (79)89.8% (79) 76.8% (63)76.8% (63) 91.2% (62)91.2% (62)
NeutralNeutral 5.7% (5)5.7% (5) 11.0% (9)11.0% (9) 5.9% (4)5.9% (4)
UnacceptabUnacceptablele
4.5% (4)4.5% (4) 12.2% (10)12.2% (10) 2.9% (2)2.9% (2)
TotalTotal 100.0% 100.0% (88)(88)
100.0% 100.0% (82)(82)
100.0% 100.0% (62)(62)
Chi-SquareChi-Square X = 8.809, df = 4, p .066X = 8.809, df = 4, p .066
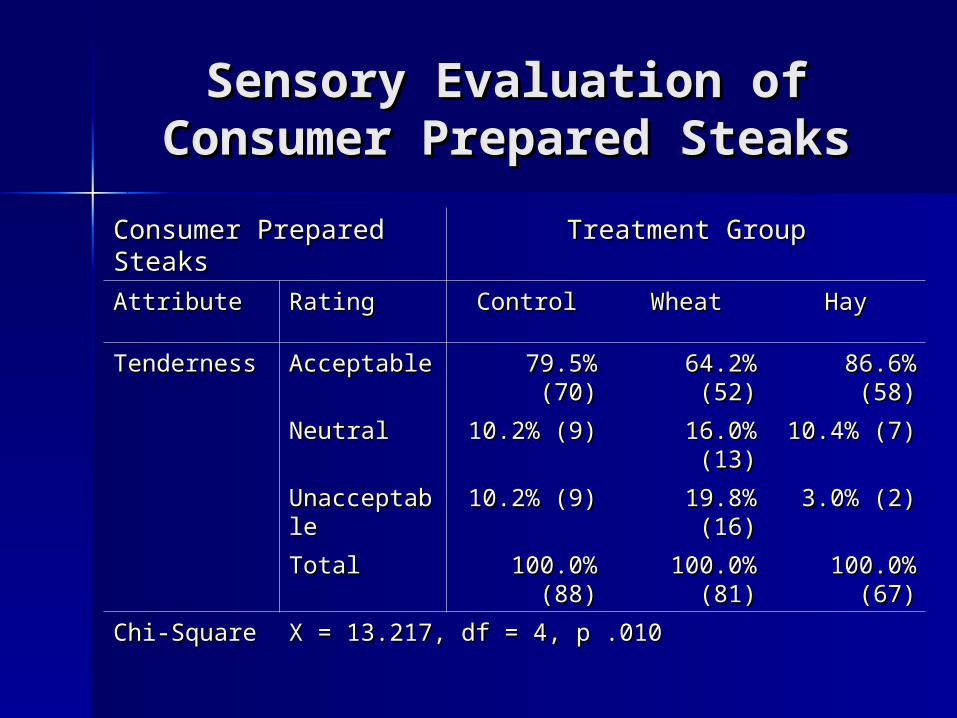
Sensory Evaluation of Sensory Evaluation of Consumer Prepared SteaksConsumer Prepared Steaks
Consumer Prepared Consumer Prepared SteaksSteaks
Treatment GroupTreatment Group
AttributeAttribute RatingRating ControlControl WheatWheat HayHay
TendernessTenderness AcceptableAcceptable 79.5% (70)79.5% (70) 64.2% (52)64.2% (52) 86.6% (58)86.6% (58)
NeutralNeutral 10.2% (9)10.2% (9) 16.0% (13)16.0% (13) 10.4% (7)10.4% (7)
UnacceptabUnacceptablele
10.2% (9)10.2% (9) 19.8% (16)19.8% (16) 3.0% (2)3.0% (2)
TotalTotal 100.0% 100.0% (88)(88)
100.0% 100.0% (81)(81)
100.0% 100.0% (67)(67)
Chi-SquareChi-Square X = 13.217, df = 4, p .010X = 13.217, df = 4, p .010

Sensory Evaluation of Sensory Evaluation of Consumer Prepared SteaksConsumer Prepared Steaks
Consumer Prepared Consumer Prepared SteaksSteaks
Treatment GroupTreatment Group
AttributeAttribute RatingRating ControlControl WheatWheat HayHay
JuicinessJuiciness AcceptableAcceptable 80.7% (71)80.7% (71) 76.5% (62)76.5% (62) 85.3% (58)85.3% (58)
NeutralNeutral 5.7% (5)5.7% (5) 7.4% (6)7.4% (6) 10.3% (7)10.3% (7)
UnacceptabUnacceptablele
13.6% (12)13.6% (12) 16.0% (13)16.0% (13) 4.4% (3)4.4% (3)
TotalTotal 100.0% 100.0% (88)(88)
100.0% 100.0% (81)(81)
100.0% 100.0% (68)(68)
Chi-SquareChi-Square X = 6.063, df = 4, p .195X = 6.063, df = 4, p .195
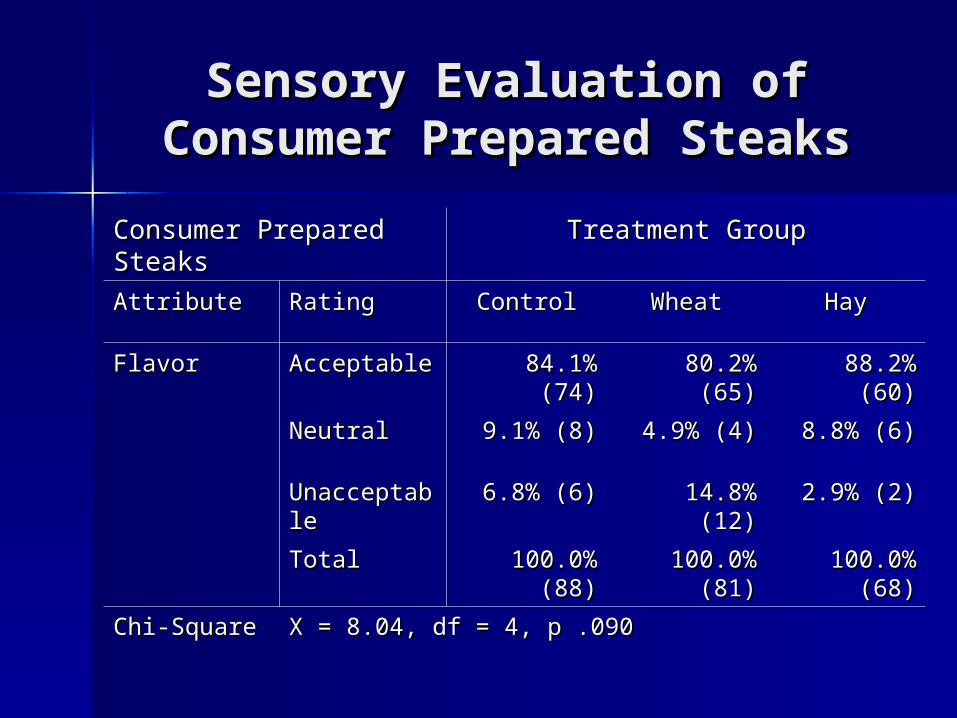
Sensory Evaluation of Sensory Evaluation of Consumer Prepared SteaksConsumer Prepared Steaks
Consumer Prepared Consumer Prepared SteaksSteaks
Treatment GroupTreatment Group
AttributeAttribute RatingRating ControlControl WheatWheat HayHay
FlavorFlavor AcceptableAcceptable 84.1% (74)84.1% (74) 80.2% (65)80.2% (65) 88.2% (60)88.2% (60)
NeutralNeutral 9.1% (8)9.1% (8) 4.9% (4)4.9% (4) 8.8% (6)8.8% (6)
UnacceptabUnacceptablele
6.8% (6)6.8% (6) 14.8% (12)14.8% (12) 2.9% (2)2.9% (2)
TotalTotal 100.0% 100.0% (88)(88)
100.0% 100.0% (81)(81)
100.0% 100.0% (68)(68)
Chi-SquareChi-Square X = 8.04, df = 4, p .090X = 8.04, df = 4, p .090
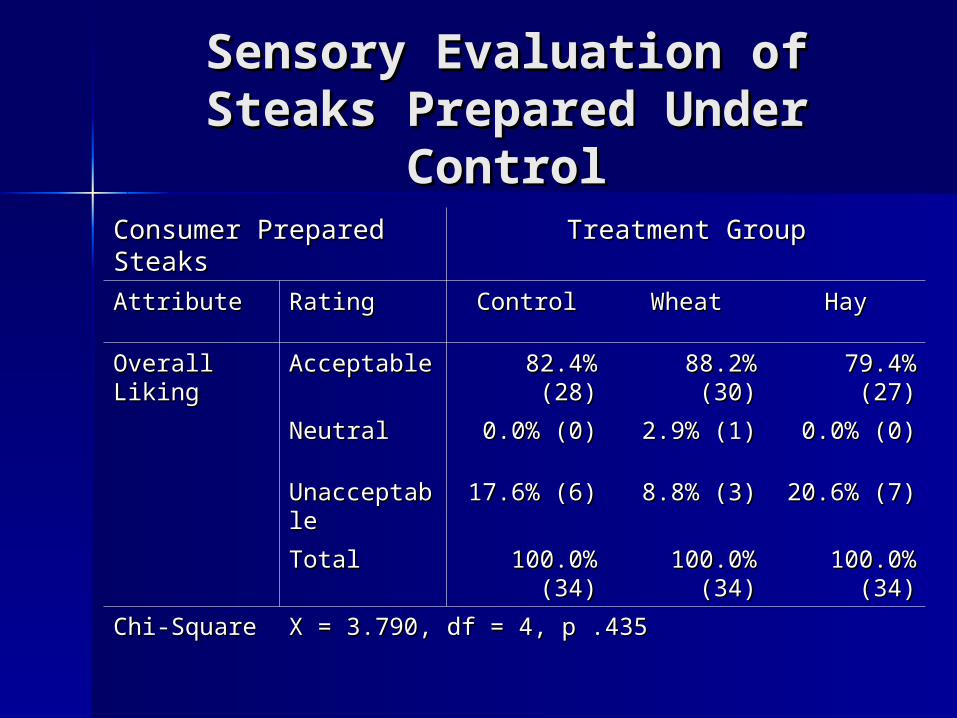
Sensory Evaluation of Sensory Evaluation of Steaks Prepared Under Steaks Prepared Under
ControlControlConsumer Prepared Consumer Prepared SteaksSteaks
Treatment GroupTreatment Group
AttributeAttribute RatingRating ControlControl WheatWheat HayHay
Overall Overall LikingLiking
AcceptableAcceptable 82.4% (28)82.4% (28) 88.2% (30)88.2% (30) 79.4% (27)79.4% (27)
NeutralNeutral 0.0% (0)0.0% (0) 2.9% (1)2.9% (1) 0.0% (0)0.0% (0)
UnacceptabUnacceptablele
17.6% (6)17.6% (6) 8.8% (3)8.8% (3) 20.6% (7)20.6% (7)
TotalTotal 100.0% 100.0% (34)(34)
100.0% 100.0% (34)(34)
100.0% 100.0% (34)(34)
Chi-SquareChi-Square X = 3.790, df = 4, p .435X = 3.790, df = 4, p .435
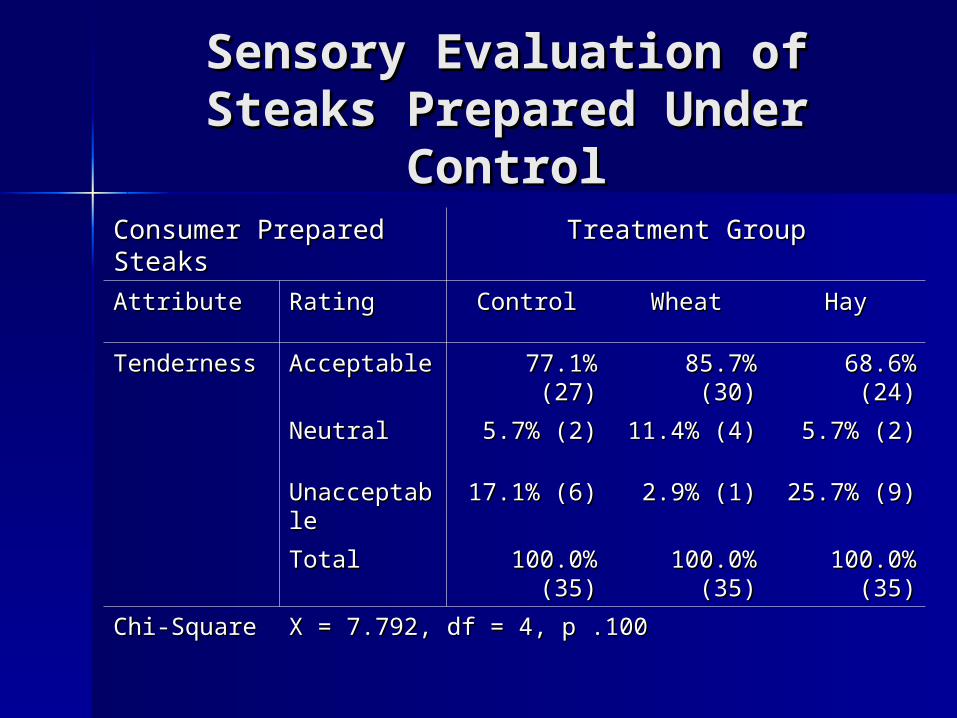
Sensory Evaluation of Sensory Evaluation of Steaks Prepared Under Steaks Prepared Under
ControlControlConsumer Prepared Consumer Prepared SteaksSteaks
Treatment GroupTreatment Group
AttributeAttribute RatingRating ControlControl WheatWheat HayHay
TendernessTenderness AcceptableAcceptable 77.1% (27)77.1% (27) 85.7% (30)85.7% (30) 68.6% (24)68.6% (24)
NeutralNeutral 5.7% (2)5.7% (2) 11.4% (4)11.4% (4) 5.7% (2)5.7% (2)
UnacceptabUnacceptablele
17.1% (6)17.1% (6) 2.9% (1)2.9% (1) 25.7% (9)25.7% (9)
TotalTotal 100.0% 100.0% (35)(35)
100.0% 100.0% (35)(35)
100.0% 100.0% (35)(35)
Chi-SquareChi-Square X = 7.792, df = 4, p .100X = 7.792, df = 4, p .100

Sensory Evaluation of Sensory Evaluation of Steaks Prepared Under Steaks Prepared Under
ControlControlConsumer Prepared Consumer Prepared SteaksSteaks
Treatment GroupTreatment Group
AttributeAttribute RatingRating ControlControl WheatWheat HayHay
JuicinessJuiciness AcceptableAcceptable 60.0% (21)60.0% (21) 88.6% (31)88.6% (31) 71.4% (25)71.4% (25)
NeutralNeutral 25.7% (9)25.7% (9) 8.6% (3)8.6% (3) 11.4% (4)11.4% (4)
UnacceptabUnacceptablele
14.3% (5)14.3% (5) 2.9% (1)2.9% (1) 17.1% (6)17.1% (6)
TotalTotal 100.0% 100.0% (35)(35)
100.0% 100.0% (35)(35)
100.0% 100.0% (35)(35)
Chi-SquareChi-Square X = 9.349, df = 4, p .053X = 9.349, df = 4, p .053

Sensory Evaluation of Sensory Evaluation of Steaks Prepared Under Steaks Prepared Under
ControlControlConsumer Prepared Consumer Prepared SteaksSteaks
Treatment GroupTreatment Group
AttributeAttribute RatingRating ControlControl WheatWheat HayHay
FlavorFlavor AcceptableAcceptable 80.0% (28)80.0% (28) 82.9% (29)82.9% (29) 74.3% (26)74.3% (26)
NeutralNeutral 2.9% (1)2.9% (1) 8.6% (3)8.6% (3) 11.4% (4)11.4% (4)
UnacceptabUnacceptablele
17.1% (6)17.1% (6) 8.6% (3)8.6% (3) 14.3% (5)14.3% (5)
TotalTotal 100.0% 100.0% (35)(35)
100.0% 100.0% (35)(35)
100.0% 100.0% (35)(35)
Chi-SquareChi-Square X = 2.919, df = 4, p .572X = 2.919, df = 4, p .572

Least Square MeansLeast Square Meansof Warner-Bratzlerof Warner-BratzlerPeak Shear ForcePeak Shear Force
TreatmentTreatmentaa
Peak Shear Peak Shear
Force (lbs)Force (lbs) SEMSEM
Control (n = 12)Control (n = 12) 7.397.39bb 0.410.41
Hay (n = 11)Hay (n = 11) 7.987.98bb 0.400.40
Sodium Selenate (n = Sodium Selenate (n = 11)11)
7.997.99bb 0.400.40
Wheat (n = 9)Wheat (n = 9) 7.577.57bb 0.440.44aaThree core samples per treatment steak.Three core samples per treatment steak.bbWithin columns not significantly different (P = 0.6495).Within columns not significantly different (P = 0.6495).
SEM = Standard Error of the Mean.SEM = Standard Error of the Mean.