uas air traffic controller acceptability study 2 ... · uas air traffic controller acceptability...
TRANSCRIPT

November 2015
NASA/TM–2015-218989
UAS Air Traffic Controller Acceptability Study 2: Evaluating Detect and Avoid Technology and Communication Delays in Simulation James R. Comstock, Jr., Rania W. Ghatas, and Maria C. Consiglio Langley Research Center, Hampton, Virginia
James P. Chamberlain
National Institute of Aerospace, Hampton, Virginia
Keith D. Hoffler
Adaptive Aerospace Group, Inc., Hampton, Virginia
https://ntrs.nasa.gov/search.jsp?R=20160000774 2018-07-15T10:38:30+00:00Z
NASA STI Program . . . in Profile
Since its founding, NASA has been dedicated to the advancement of aeronautics and space science. The NASA scientific and technical information (STI) program plays a key part in helping NASA maintain this important role.
The NASA STI program operates under the auspices of the Agency Chief Information Officer. It collects, organizes, provides for archiving, and disseminates NASA’s STI. The NASA STI program provides access to the NTRS Registered and its public interface, the NASA Technical Reports Server, thus providing one of the largest collections of aeronautical and space science STI in the world. Results are published in both non-NASA channels and by NASA in the NASA STI Report Series, which includes the following report types:
TECHNICAL PUBLICATION. Reports of
completed research or a major significant phase of research that present the results of NASA Programs and include extensive data or theoretical analysis. Includes compilations of significant scientific and technical data and information deemed to be of continuing reference value. NASA counter-part of peer-reviewed formal professional papers but has less stringent limitations on manuscript length and extent of graphic presentations.
TECHNICAL MEMORANDUM. Scientific and technical findings that are preliminary or of specialized interest, e.g., quick release reports, working papers, and bibliographies that contain minimal annotation. Does not contain extensive analysis.
CONTRACTOR REPORT. Scientific and technical findings by NASA-sponsored contractors and grantees.
CONFERENCE PUBLICATION. Collected papers from scientific and technical conferences, symposia, seminars, or other meetings sponsored or co-sponsored by NASA.
SPECIAL PUBLICATION. Scientific, technical, or historical information from NASA programs, projects, and missions, often concerned with subjects having substantial public interest.
TECHNICAL TRANSLATION. English-language translations of foreign scientific and technical material pertinent to NASA’s mission.
Specialized services also include organizing and publishing research results, distributing specialized research announcements and feeds, providing information desk and personal search support, and enabling data exchange services.
For more information about the NASA STI program, see the following:
Access the NASA STI program home page at
http://www.sti.nasa.gov
E-mail your question to [email protected]
Phone the NASA STI Information Desk at 757-864-9658
Write to: NASA STI Information Desk Mail Stop 148 NASA Langley Research Center Hampton, VA 23681-2199
National Aeronautics and Space Administration Langley Research Center Hampton, Virginia 23681-2199
November 2015
NASA/TM–2015-218989
UAS Air Traffic Controller Acceptability Study 2: Evaluating Detect and Avoid Technology and Communication Delays in Simulation James R. Comstock, Jr., Rania W. Ghatas, and Maria C. Consiglio Langley Research Center, Hampton, Virginia
James P. Chamberlain
National Institute of Aerospace, Hampton, Virginia
Keith D. Hoffler
Adaptive Aerospace Group, Inc., Hampton, Virginia
Available from:
NASA STI Program / Mail Stop 148 NASA Langley Research Center
Hampton, VA 23681-2199 Fax: 757-864-6500
The use of trademarks or names of manufacturers in this report is for accurate reporting and does not constitute an official endorsement, either expressed or implied, of such products or manufacturers by the National Aeronautics and Space Administration.
iii
Table of Contents
Table of Contents ………………………………………………………………………… iii
Tables ……………………………………………………………………………………. v
Figures …………………………………………………………………………………… v
Symbols and Abbreviations ………………………………………………………………. vi
Abstract …………………………………………………………………………………… 1
Introduction ……………………………………………………………………………….. 1
Approach and Objectives …………………………………………………………………. 2
Research Questions ………………………………………………………………. 2
Methodology ……………………………………………………………………………… 4
Subjects …………………………………………………………………………… 4
Procedure …………………………………………………………………………. 4
Independent Variables ……………………………………………………………. 5
Scenarios ………………………………………………………………………….. 5
Communications, Navigation, and Surveillance Assumptions …………………… 6
Software, Hardware, and Facilities ……………………………………………….. 7
Dependent Variables ……………………………………………………………… 8
Horizontal Miss Distance ………………………………………………… 8
Workload assessment …………………………………………………….. 8
System Performance Metrics ……………………………………………... 8
Post-run questionnaires …………………………………………………… 8
Results ……………………………………………………………………………………… 8
Horizontal Miss Distances Acceptability .………………………………………… 8
Realism of Traffic Density and Workload ………………………………………… 10
Communications Delays and Wind ……………………………………………….. 11
iv
Discussion ………………………………………………………………………………….. 11
References ………………………………………………………………………………….. 14
Acknowledgements ………………………………………………………………………… 14
Appendix A – Workload Ratings by Test Hour ……………...…………………………….. 15
Appendix B – Questionnaire Responses …………………………………………………… 18
Appendix C – Comments regarding Communications Delays …………………………….. 21
v
Tables
Table 1. Independent Variables ………………………………………………………… 5
Table 2. Rating scale used for assessment of Horizontal Miss Distance ………………. 7
Figures
Figure 1. Chart showing Collin County Airport ……………………………………………….. 6
Figure 2. Mean Ratings by encounter distance for Crossings …………………………………. 9
Figure 3. Ratings by HMD (Crossings) ……………………………………………………….. 10
Figure 4. Ratings by HMD (Overtake – OT and Opposite Direction - OD) ………………….. 10
vi
Symbols and Abbreviations
ATC Air Traffic Control ATWIT Air Traffic Workload Input Technique CAS Controller Acceptability Study CFR Code of Federal Regulations CNS Communication, Navigation, and Surveillance CPA Closest Point of Approach DAA Detect and Avoid DFW Dallas Fort-Worth FAA Federal Aviation Administration GCS Ground Control Station HMD Horizontal Miss Distance KTKI Airport Identifier for Collin County Airport (aka McKenny National Airport) MACS Multi Aircraft Control System NAS National Airspace System nmi Nautical Mile OD Opposite Direction (aircraft encounter) OT Overtake (aircraft encounter) RA Resolution Advisory (from TCAS) RTCA Radio Technical Commission for Aeronautics SS Self Separation TCAS Traffic Alert and Collision Avoidance System UA Unmanned Aircraft UAS Unmanned Aircraft System VHF Very High Frequency
1
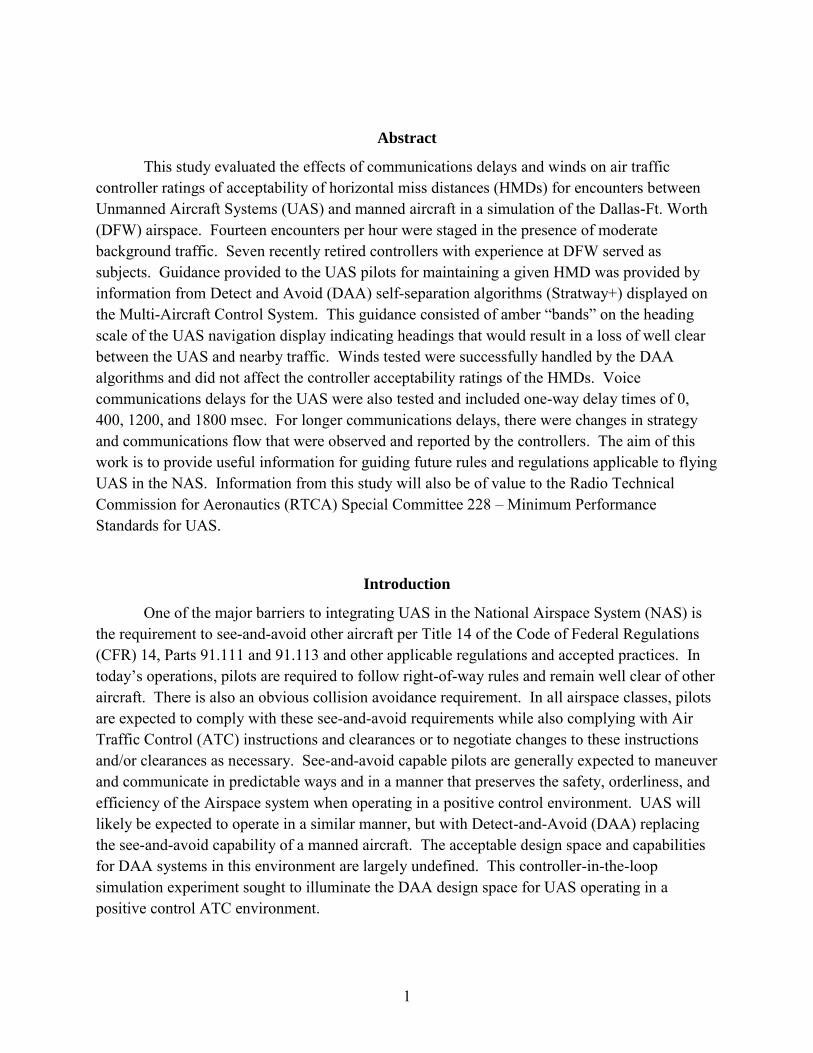
Abstract
This study evaluated the effects of communications delays and winds on air traffic controller ratings of acceptability of horizontal miss distances (HMDs) for encounters between Unmanned Aircraft Systems (UAS) and manned aircraft in a simulation of the Dallas-Ft. Worth (DFW) airspace. Fourteen encounters per hour were staged in the presence of moderate background traffic. Seven recently retired controllers with experience at DFW served as subjects. Guidance provided to the UAS pilots for maintaining a given HMD was provided by information from Detect and Avoid (DAA) self-separation algorithms (Stratway+) displayed on the Multi-Aircraft Control System. This guidance consisted of amber “bands” on the heading scale of the UAS navigation display indicating headings that would result in a loss of well clear between the UAS and nearby traffic. Winds tested were successfully handled by the DAA algorithms and did not affect the controller acceptability ratings of the HMDs. Voice communications delays for the UAS were also tested and included one-way delay times of 0, 400, 1200, and 1800 msec. For longer communications delays, there were changes in strategy and communications flow that were observed and reported by the controllers. The aim of this work is to provide useful information for guiding future rules and regulations applicable to flying UAS in the NAS. Information from this study will also be of value to the Radio Technical Commission for Aeronautics (RTCA) Special Committee 228 – Minimum Performance Standards for UAS.
Introduction
One of the major barriers to integrating UAS in the National Airspace System (NAS) is the requirement to see-and-avoid other aircraft per Title 14 of the Code of Federal Regulations (CFR) 14, Parts 91.111 and 91.113 and other applicable regulations and accepted practices. In today’s operations, pilots are required to follow right-of-way rules and remain well clear of other aircraft. There is also an obvious collision avoidance requirement. In all airspace classes, pilots are expected to comply with these see-and-avoid requirements while also complying with Air Traffic Control (ATC) instructions and clearances or to negotiate changes to these instructions and/or clearances as necessary. See-and-avoid capable pilots are generally expected to maneuver and communicate in predictable ways and in a manner that preserves the safety, orderliness, and efficiency of the Airspace system when operating in a positive control environment. UAS will likely be expected to operate in a similar manner, but with Detect-and-Avoid (DAA) replacing the see-and-avoid capability of a manned aircraft. The acceptable design space and capabilities for DAA systems in this environment are largely undefined. This controller-in-the-loop simulation experiment sought to illuminate the DAA design space for UAS operating in a positive control ATC environment.
2
DAA implementations must be designed in a way that minimizes issuance of Resolution Advisories (RAs) by TCAS (Traffic Alert and Collision Avoidance System) equipment on intruder aircraft. RAs are alerts with recommended vertical escape maneuvers to maintain or increase vertical separation with intruders that are predicted to be collision threats. RAs can be disruptive to the air traffic system and are a last resort maneuver when all other means of separation have failed. The DAA concept evaluated in this experiment was designed to detect encounter geometries that will cause an RA and provide guidance for action that may be taken early enough to avoid an RA.
In addition to avoiding the issuance of TCAS RAs, the DAA should also be designed to prevent the issuance of controller traffic alerts, capture the attention of, or otherwise increase workload or create additional vectoring requirements for ATC. This work attempts to provide guidance for DAA standards for “well clear” (following 14 CFR §91.113) that consider these ATC concerns.
This study is the second in the Controller Acceptability Study (CAS) experiment series and is based largely on CAS-1 experiment design, scenarios, and results (Chamberlain, Consiglio, Comstock, Ghatas, and Muñoz, 2015; and Ghatas, Comstock, Consiglio, Chamberlain, and Hoffler, 2015). The primary goals of this study were to address the impact of communication delays and wind conditions on the execution of Ground Control Station (GCS) self-separation tasks and how acceptable the resulting maneuvers are to Air Traffic Controllers. The communications delays evaluated included four different ATC-pilot voice communication latencies or delays that might be expected in operations of UAS controlled by combinations of ground or satellite communications links. The latencies tested were 0, 400, 1200, and 1800 msec (millisecond) one-way communications delays.
One of the goals of the earlier CAS-1 study was to establish a generally acceptable HMD when there were encounters between DAA-equipped UAS and transponder-equipped manned General Aviation aircraft that were not communicating with ATC. The results of that earlier study indicated that HMDs of 1.0 to 1.5 nautical miles (nmi) appeared to be acceptable for ATC when the traffic encounters are away from the airport vicinity. In that study, HMDs of 0.5, 1.0, 1.5, 2.0, 2.5 and 3.0 nmi were evaluated for encounters that were opposite direction (head-on), overtakes (same direction with UAS faster), and crossings.
Approach and Objectives
The primary focus of this experiment is on quantifying HMD values so that acceptable “well clear” separation distances can be employed in DAA self-separation algorithms. In this simulation study controllers managed a mix of manned and DAA-equipped UAS traffic and provided ratings on acceptability of HMDs when close traffic encounters occurred and also provided workload ratings during the test conditions. Test conditions also included differing spacing parameters in the DAA algorithms leading to different HMDs between the aircraft when
3
they had close encounters as well as varied (by test hour) voice communications delays and two levels of wind conditions (also varied by test hour).
Based on the results of CAS-1, a reduced set of HMDs for traffic encounters was tested and included 0.5, 1.0, and 1.5 nmi. For the scripted traffic encounters used in both of these studies it is important to understand the meaning and differences of two terms, HMD and closest point of approach (CPA). There is an adjustable parameter used in the DAA self-separation algorithms that yields a given HMD if the UAS pilot flies just at the edge of the guidance “bands.” The UAS pilots, who were part of the research team, would fly at the edge of this guidance yielding the desired HMD for that encounter (0.5, 1.0, or 1.5 nmi), so that controllers could evaluate that distance. Simulator data would yield the actual CPA during the encounter as a check to insure that the desired HMD was obtained. The controller would look at the miss on the radar scope and evaluate the acceptability of that HMD as he or she saw it.
CPA had a second meaning in the study as the scripted encounters had a designed scripted CPA if no pilot action took place. For example, both overtake and opposite direction encounters had a scripted CPA of zero, meaning that if no pilot action occurred then they would essentially hit each other. Because of the DAA guidance, the UAS pilot would make a request to ATC to maneuver and then pilot action occurred resulting in an actual CPA generally very close to the HMD. In the case of crossing encounters the CPA/ HMD relationship was more complex. If the scripted CPA was the same as the HMD, then no pilot maneuver was required and the two aircraft would pass at the HMD (equal to scripted CPA). In that case no maneuver was required even if ATC called that traffic (the UAS pilot would respond with “traffic detected” or say that the traffic was “no factor” based on the DAA guidance). If the scripted CPA was smaller than the HMD, then the DAA guidance would result in the UAS pilot contacting ATC if time and radio frequency congestion permitted and requesting a maneuver. The crossing scripted encounters were designed such that the UAS usually passed in front of the VFR intruder to insure tight control over passing distances so that ATC could rate the acceptability of those distances. Real-world use of a DAA system would yield maneuvers in front of or behind the intruding traffic depending on the geometry and other factors, as there would not be a scripted miss distance.
In the earlier CAS-1 study, crossing scripted CPAs of 1.5 nmi or less were designed to require no maneuver by the UAS to maintain the desired HMD. In this study, there were instances of crossing geometries of both 1.0 and 1.5 nmi that required maneuvers and concomitant communications with ATC. The minimum crossing geometry scripted CPA was 0.5 nmi. All opposite direction (head-on) encounters and overtaking encounters required communications with ATC and maneuvering to achieve the desired HMD.
The following research questions were proposed which drove the experiment design:
A. Given wind and communications delay conditions, were DAA self-separation (SS) maneuvers too small/too late, resulting in issuance of traffic safety alerts or controller perceptions of unsafe conditions?

4
B. Given wind and communications delay conditions, were DAA SS maneuvers too large (excessive “well clear” distances), resulting in behavior the controller would not expect and/or disruptions to traffic flow?
C. Given wind and communications delay conditions, were there acceptable, in terms of ATC ratings, workload, and closest point of approach data, DAA miss distances that can be applied to the development of future DAA algorithms?
D. Do communications delays for the UAS in the airspace result in an impact on the Air Traffic Controllers communications flow? Are the delays disruptive in terms of transmissions being “stepped-on” (simultaneous transmissions by several aircraft), and/or are additional repeats of information required with delays.
Methodology
Subjects
Seven recently retired Air Traffic Controllers with experience at the Dallas-Ft. Worth (DFW) East-side facility performed traffic separation tasks for the scenarios developed. Each of the controllers was the sole controller for the simulated DFW East side environment over two days of testing. They were in communications with other controllers who handled handoffs to and from the subject controller’s airspace. Most of the controllers were currently instructors in the training center at DFW. Controllers who participated in CAS-1, about four months earlier, were eligible to serve in the present study.
Procedure
The traffic scenarios were designed so that there were 14 UAS traffic encounters per hour and there were a total of six test hours split over two days. Training and the first three hours of testing occurred on day 1, with the remaining three hours of testing on day 2. The UAS were controlled by two pseudo-pilots each having access to GCS displays showing the DAA self-separation guidance information in real-time. Background traffic, to maintain the environment and workload close to that of actual DFW traffic, was controlled by pseudo-pilots at two additional pilot stations. The controller managed the manned and unmanned traffic which were all flying in the same airspace (DFW East side) and communicating with ATC by simulated VHF radio communications. Communications with the UAS were handled in the same way as manned aircraft communications with the exception of the communications delays, which to the controller sounded as if the aircraft was taking a longer than normal time to respond to ATC. UAS traffic encounters were between the UAS and VFR traffic that was transponding, but not communicating with ATC. Additional traffic in the controller’s airspace consisted of about 45 aircraft per hour which were IFR and VFR manned aircraft performing takeoffs, landings, or overflights transiting the airspace and communicating with the controller.
5
Independent Variables
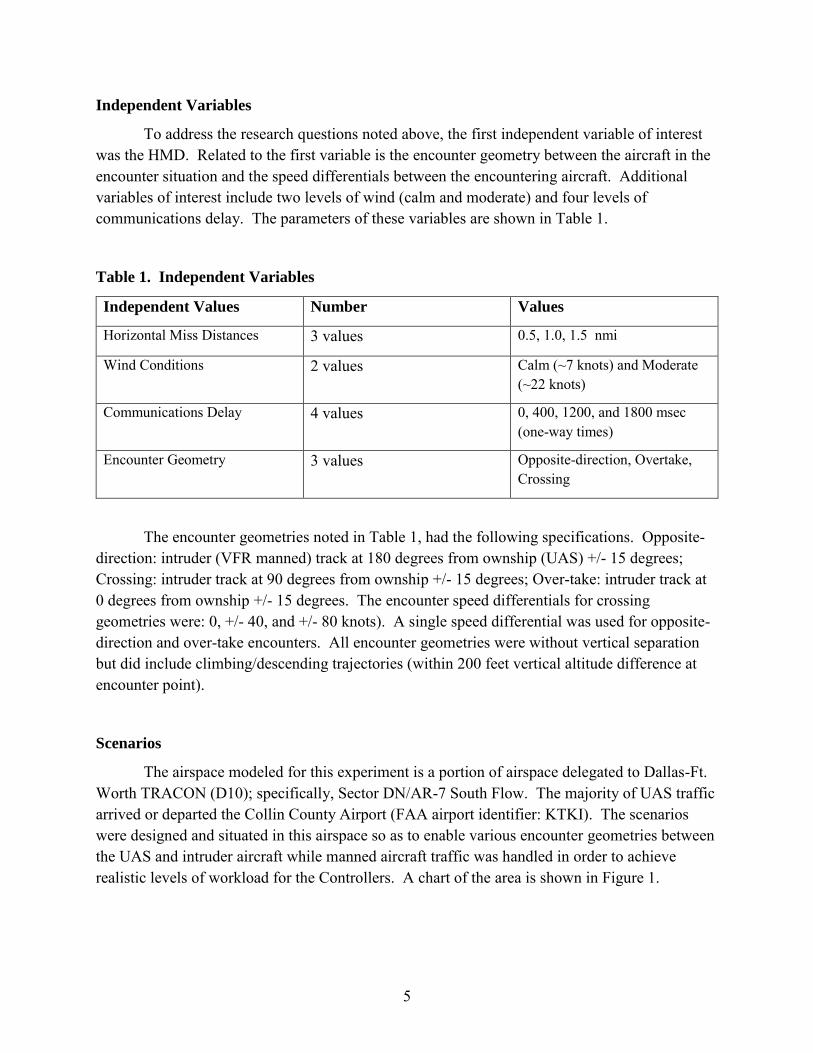
To address the research questions noted above, the first independent variable of interest was the HMD. Related to the first variable is the encounter geometry between the aircraft in the encounter situation and the speed differentials between the encountering aircraft. Additional variables of interest include two levels of wind (calm and moderate) and four levels of communications delay. The parameters of these variables are shown in Table 1.
Table 1. Independent Variables
Independent Values Number Values
Horizontal Miss Distances 3 values 0.5, 1.0, 1.5 nmi
Wind Conditions 2 values Calm (~7 knots) and Moderate (~22 knots)
Communications Delay 4 values 0, 400, 1200, and 1800 msec (one-way times)
Encounter Geometry 3 values Opposite-direction, Overtake, Crossing
The encounter geometries noted in Table 1, had the following specifications. Opposite-direction: intruder (VFR manned) track at 180 degrees from ownship (UAS) +/- 15 degrees; Crossing: intruder track at 90 degrees from ownship +/- 15 degrees; Over-take: intruder track at 0 degrees from ownship +/- 15 degrees. The encounter speed differentials for crossing geometries were: 0, +/- 40, and +/- 80 knots). A single speed differential was used for opposite-direction and over-take encounters. All encounter geometries were without vertical separation but did include climbing/descending trajectories (within 200 feet vertical altitude difference at encounter point).
Scenarios
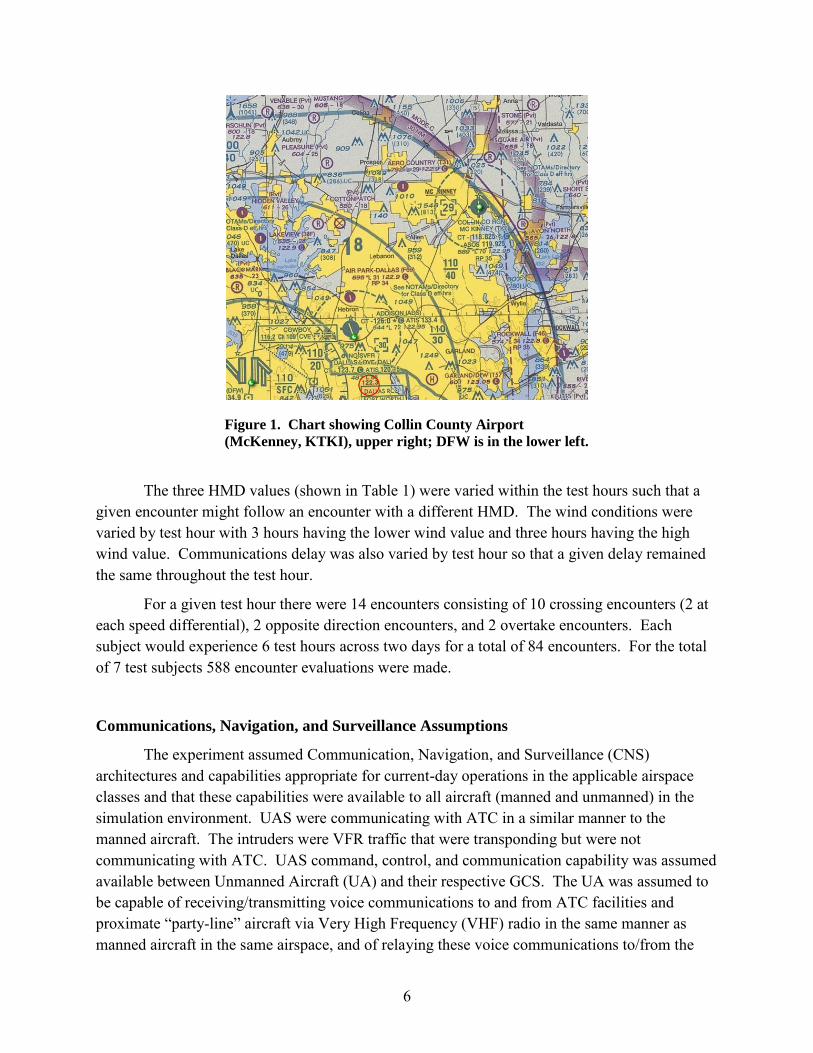
The airspace modeled for this experiment is a portion of airspace delegated to Dallas-Ft. Worth TRACON (D10); specifically, Sector DN/AR-7 South Flow. The majority of UAS traffic arrived or departed the Collin County Airport (FAA airport identifier: KTKI). The scenarios were designed and situated in this airspace so as to enable various encounter geometries between the UAS and intruder aircraft while manned aircraft traffic was handled in order to achieve realistic levels of workload for the Controllers. A chart of the area is shown in Figure 1.
6
The three HMD values (shown in Table 1) were varied within the test hours such that a given encounter might follow an encounter with a different HMD. The wind conditions were varied by test hour with 3 hours having the lower wind value and three hours having the high wind value. Communications delay was also varied by test hour so that a given delay remained the same throughout the test hour.
For a given test hour there were 14 encounters consisting of 10 crossing encounters (2 at each speed differential), 2 opposite direction encounters, and 2 overtake encounters. Each subject would experience 6 test hours across two days for a total of 84 encounters. For the total of 7 test subjects 588 encounter evaluations were made.
Communications, Navigation, and Surveillance Assumptions
The experiment assumed Communication, Navigation, and Surveillance (CNS) architectures and capabilities appropriate for current-day operations in the applicable airspace classes and that these capabilities were available to all aircraft (manned and unmanned) in the simulation environment. UAS were communicating with ATC in a similar manner to the manned aircraft. The intruders were VFR traffic that were transponding but were not communicating with ATC. UAS command, control, and communication capability was assumed available between Unmanned Aircraft (UA) and their respective GCS. The UA was assumed to be capable of receiving/transmitting voice communications to and from ATC facilities and proximate “party-line” aircraft via Very High Frequency (VHF) radio in the same manner as manned aircraft in the same airspace, and of relaying these voice communications to/from the
Figure 1. Chart showing Collin County Airport
(McKenney, KTKI), upper right; DFW is in the lower left.
7
GCS pilot via one or more UA-GCS links. It was further assumed that, in addition to the relayed voice communications, the UA-GCS link(s) carried all command/control data between the UAS and GCS. The communications delays were for the voice communications channel only and no delay was introduced for UAS control or position reporting. This study assumed large size UAS (e.g., Predator or Global Hawk class). The UAS GCS pilots were confederate participants (not subjects). It was assumed that surveillance sensors applicable to support DAA were available and functioned without failures.
Software, Hardware, and Facilities
The displays for the UAS and manned aircraft control stations and the ATC displays were driven by modified versions of the MACS (Multi Aircraft Control System) software (Prevot, 2002), running on Windows-based computers. Modifications included incorporation of Stratway+ DAA algorithms to drive Navigation display “bands” which indicated a range of headings that would result in a loss of well clear with one or more traffic aircraft. These displays provided the information which guided UAS pilots to make requests for maneuvers in the encounter scenarios. Details of the appearance of the Navigation display “bands” can be found in the CAS-1 report (Chamberlain et. al., 2015). Information on the DAA algorithms may be found in Hagen, Butler, and Maddalon, 2011, and Muñoz, Narkawicz, Chamberlain, Consiglio, and Upchurch, 2014. The study was run in a dedicated laboratory facility housed at Stinger Ghaffarian Technologies (SGT), near the NASA Langley Research Center.
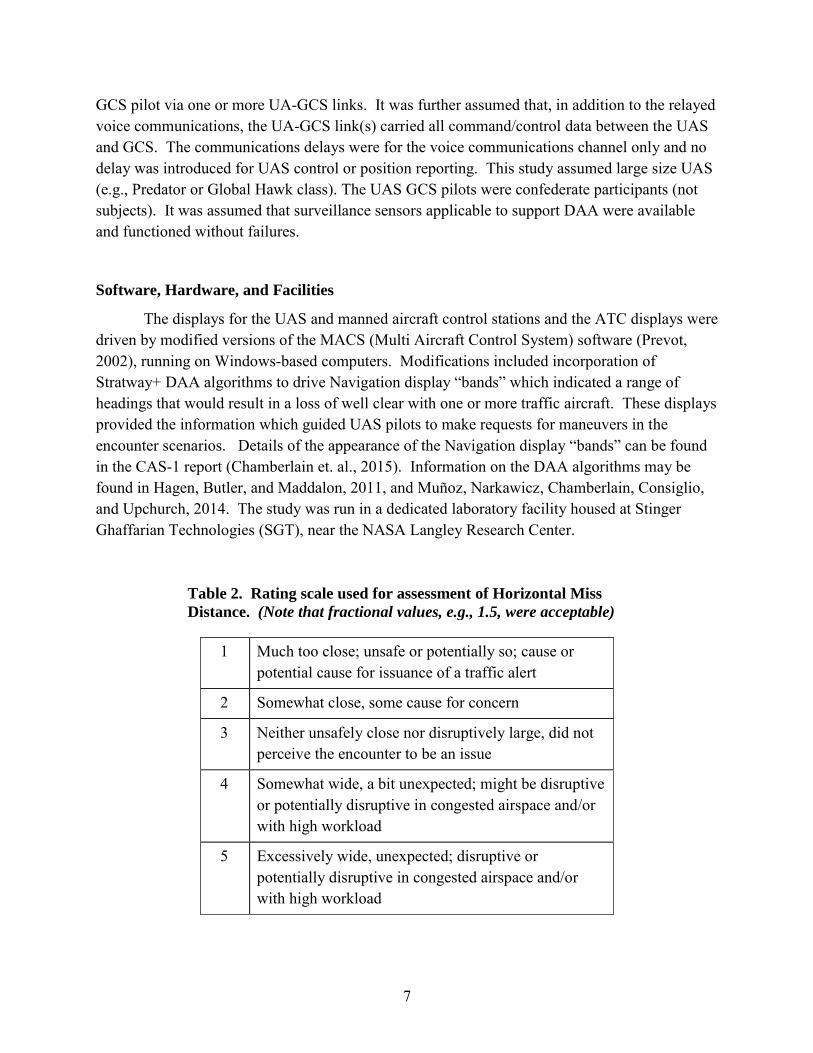
1 Much too close; unsafe or potentially so; cause or potential cause for issuance of a traffic alert
2 Somewhat close, some cause for concern
3 Neither unsafely close nor disruptively large, did not perceive the encounter to be an issue
4 Somewhat wide, a bit unexpected; might be disruptive or potentially disruptive in congested airspace and/or with high workload
5 Excessively wide, unexpected; disruptive or potentially disruptive in congested airspace and/or with high workload
Table 2. Rating scale used for assessment of Horizontal Miss
Distance. (Note that fractional values, e.g., 1.5, were acceptable)
8
Dependent Variables
Horizontal Miss Distance. After each traffic encounter, an ATC subject matter expert seated next to the Controller subject asked: “How was the spacing of that last encounter?” or “How Acceptable was the miss distance in the previous encounter?” Subjects had a copy of the information in Table 2 available to them during the test sessions. They were briefed that fractional responses, such as 1.5 or 3.5, were completely acceptable. If time permitted, an explanation for the rating was asked and noted.
Workload assessment. About every five minutes during each hour long test session, a workload rating was requested. This was done similar to the Air Traffic Workload Input Technique (ATWIT) method of workload assessment (Stein, 1985). A scale with numbers from 1 to 6 was presented at the top of the ATC display and the subject clicked on their selection (one of the numbers 1-6) when prompted (i.e., an aurally presented - through headphones - “Ding” occurred and the rating scale turned yellow). ATC test subjects were briefed on definitions of the 1 to 6 scale during training and also had the scale definitions available during the test sessions. For this study the scale definitions were: 1 - Minimal mental effort required; 2 - Low mental effort required; 3 - Moderate mental effort required; 4 - High mental effort required; 5 - Maximal mental effort required; and 6 - Intense mental effort required.
System Performance Metrics. Data concerning the encounter aircraft separation distances were recorded throughout the period of the encounter and included aircraft-to-aircraft separation distances and time to the closest point of approach (CPA). For the communications time delay conditions, the communications system that permitted incorporating delays also recorded the push to talk status of all parties communicating so that “step-ons” (two stations transmitting at the same time) could be recorded.
Post-run questionnaires. After each one-hour test session, a questionnaire was administered to record ratings and comments on the preceding test session. Specific topics addressed included: 1 – Effects of communications delay; 2 – Realism of traffic density; 3 – Realism of workload; and 4 – Realism of communications rate. Responses to these questions can be found in Appendix B, and comments on communications delay times may be found in Appendix C.
Results
Horizontal Miss Distances Acceptability
Figure 2 shows the mean ratings by the controllers for each of the Horizontal Miss Distances (HMDs) tested for the crossing traffic encounters using scale of Table 2. The scripted CPA, is how close the two aircraft would pass if no maneuver was made. As noted earlier, if HMD was equal to scripted CPA, no maneuver would be called for by the self-separation algorithms, and no communications with ATC to request a maneuver was required. To see if the

9
controller’s rating was affected by whether the UAS had to contact ATC to request a maneuver to maintain the HMD, the encounter geometry was also set up such that the HMD was greater than the scripted CPA for the 1.0 and 1.5 nmi HMDs. In Figure 2, the blue bars indicate situations in which the scripted CPA was 0.5 nmi, which meant to obtain a 1.0 or 1.5 nmi HMD a maneuver was required. The red bars indicate a scripted CPA of 1.0 nmi, so to obtain a 1.5 nmi HMD a maneuver was required. The green bar is a case where both the scripted CPA and HMD were the same so no maneuver was required. As can be seen from Figure 2, the acceptability ratings (bar heights) within a given HMD (1.0 or 2.0 nmi) stay the same regardless of whether a maneuver was required. This meant that controller ratings of HMD acceptability were not affected by whether communications with ATC and a maneuver were required by the UAS, which could have added to their workload.
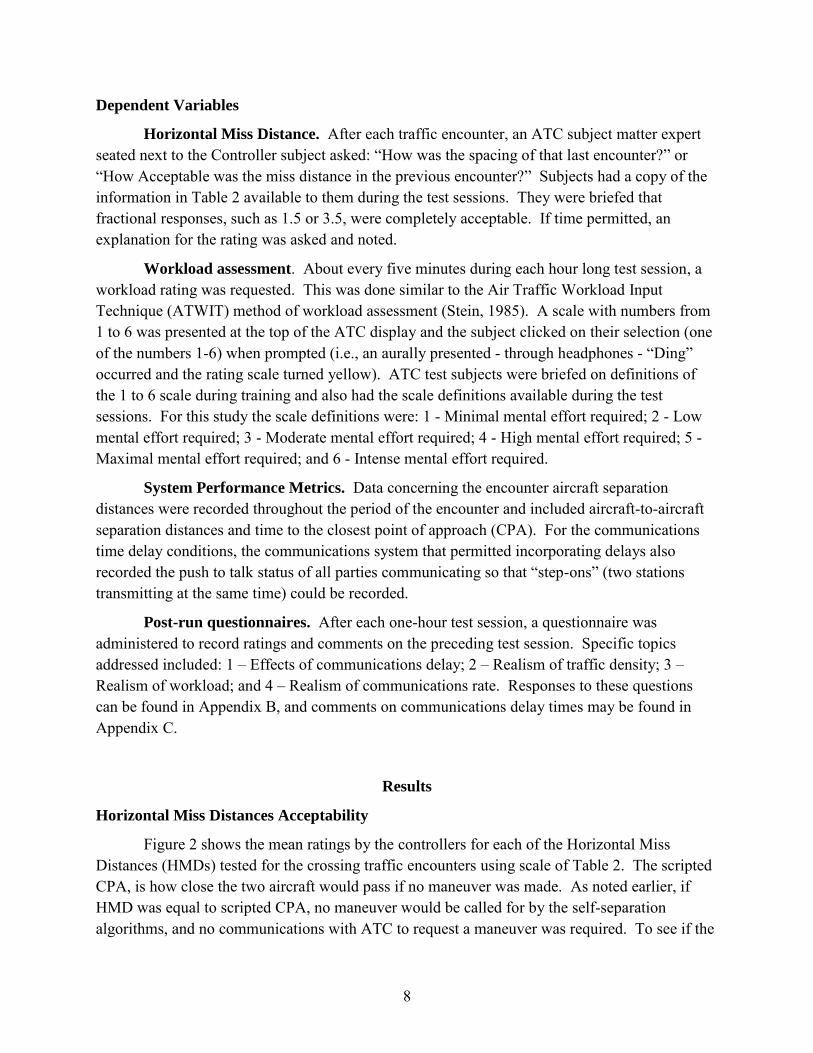
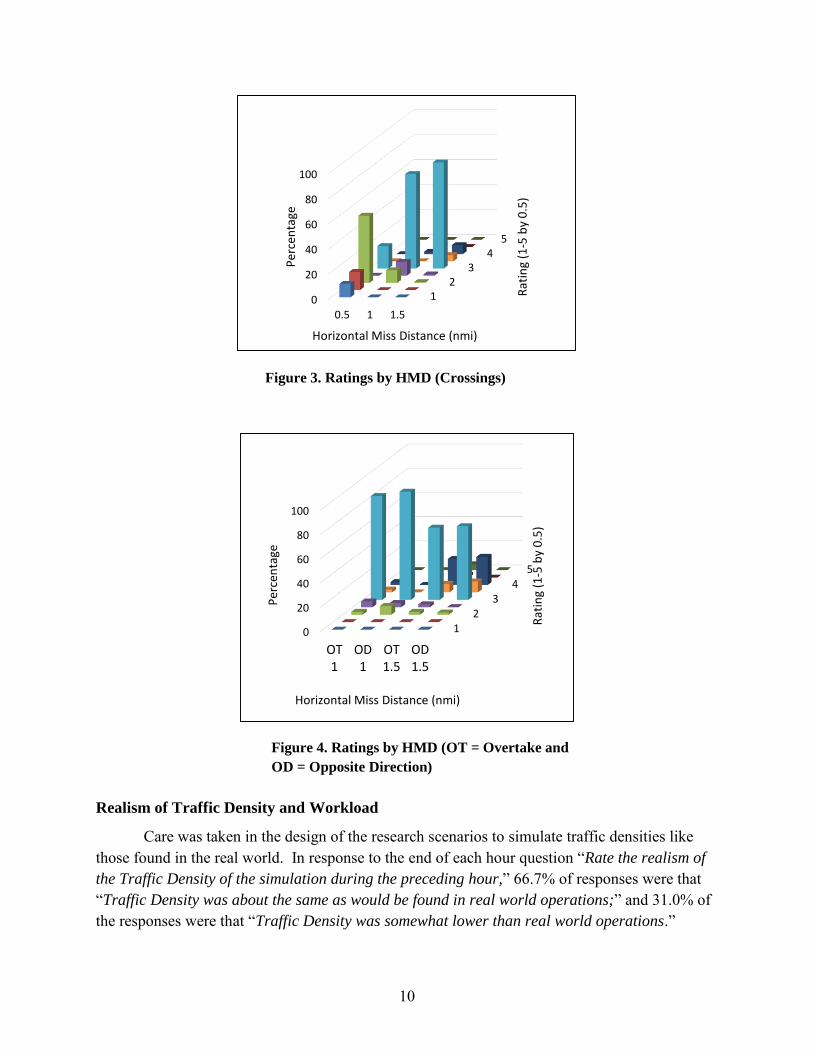
Figure 3 shows the controller rating data for crossing encounters and shows the highest
percentages for a rating of 3 (Neither unsafely close nor disruptively large, did not perceive the
encounter to be an issue), at the 1.0 and 1.5 nmi HMDs. Ratings shifted for the 0.5 nmi HMD indicating greater concern for that miss distance. Figure 4 shows similar rating data for the overtake and opposite direction encounters, all of which required maneuvers to maintain DAA prescribed HMDs, and communications with ATC. The rating scale definitions used are shown in Table 2.
0
1
2
3
4
5
0.5 1.0 1.5
Mea
n R
atin
g b
y A
TC
Horizontal Miss Distance (nmi)
0.5 1.0 1.5
Scripted CPA (nmi)
Figure 2. Mean Ratings by encounter distance for Crossings. Error Bars indicate
+/- 1 Standard Deviation. Rating scale definitions are shown in Table 2.
10
Realism of Traffic Density and Workload
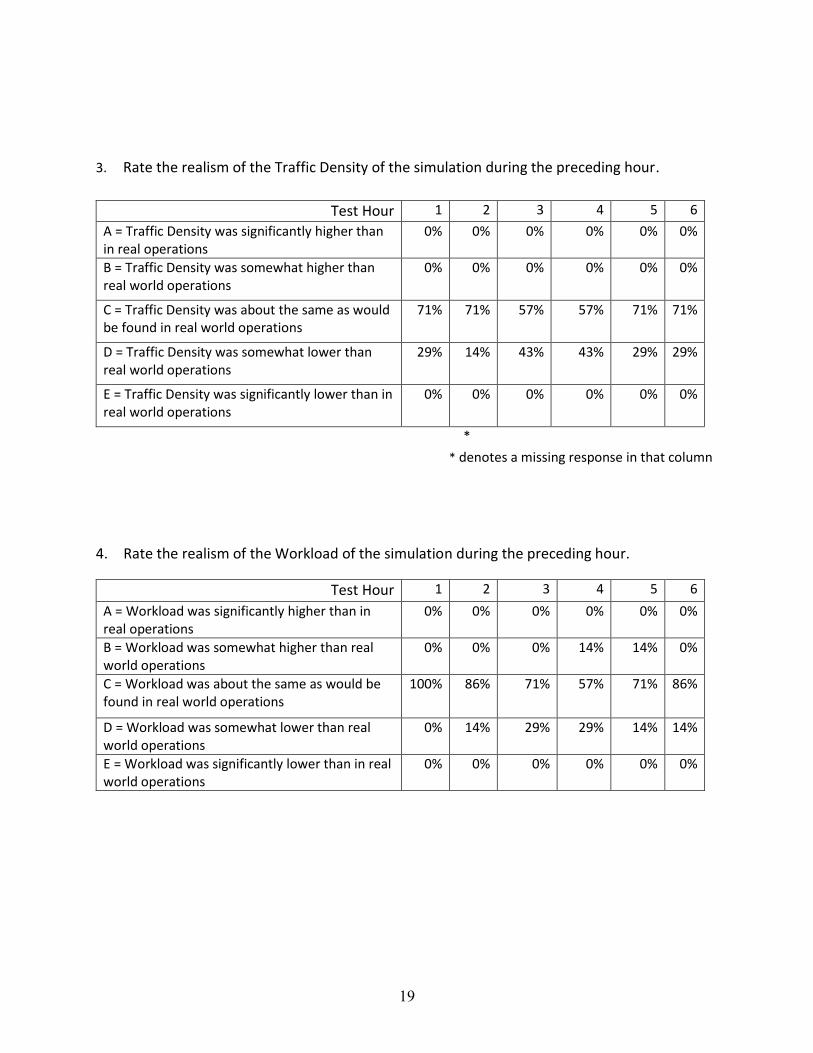
Care was taken in the design of the research scenarios to simulate traffic densities like those found in the real world. In response to the end of each hour question “Rate the realism of
the Traffic Density of the simulation during the preceding hour,” 66.7% of responses were that “Traffic Density was about the same as would be found in real world operations;” and 31.0% of the responses were that “Traffic Density was somewhat lower than real world operations.”
12
34
5
0
20
40
60
80
100
0.5 1 1.5
Rat
ing
(1-5
by
0.5
)
Per
cen
tage
Horizontal Miss Distance (nmi)
12
34
5
0
20
40
60
80
100
OT1
OD1
OT1.5
OD1.5
Rat
ing
(1-5
by
0.5
)
Per
cen
tage
Horizontal Miss Distance (nmi)
Figure 3. Ratings by HMD (Crossings)
Figure 4. Ratings by HMD (OT = Overtake and
OD = Opposite Direction)
11
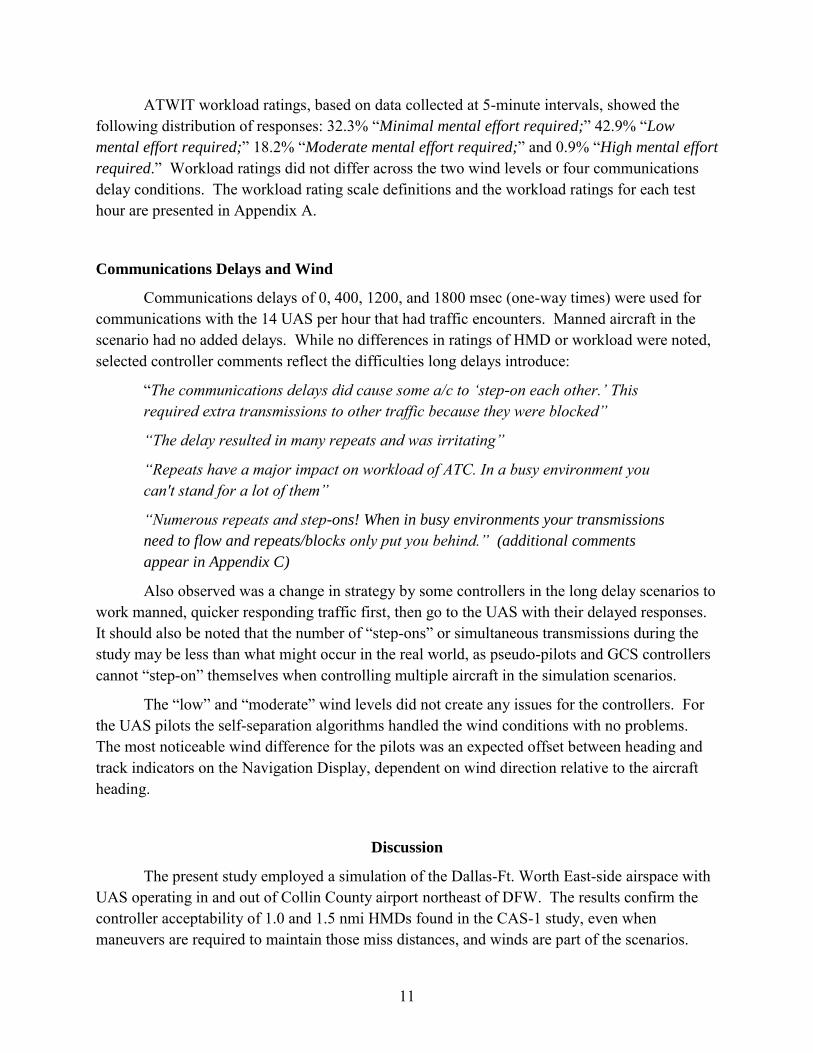
ATWIT workload ratings, based on data collected at 5-minute intervals, showed the following distribution of responses: 32.3% “Minimal mental effort required;” 42.9% “Low
mental effort required;” 18.2% “Moderate mental effort required;” and 0.9% “High mental effort
required.” Workload ratings did not differ across the two wind levels or four communications delay conditions. The workload rating scale definitions and the workload ratings for each test hour are presented in Appendix A.
Communications Delays and Wind
Communications delays of 0, 400, 1200, and 1800 msec (one-way times) were used for communications with the 14 UAS per hour that had traffic encounters. Manned aircraft in the scenario had no added delays. While no differences in ratings of HMD or workload were noted, selected controller comments reflect the difficulties long delays introduce:
“The communications delays did cause some a/c to ‘step-on each other.’ This
required extra transmissions to other traffic because they were blocked”
“The delay resulted in many repeats and was irritating”
“Repeats have a major impact on workload of ATC. In a busy environment you
can't stand for a lot of them”
“Numerous repeats and step-ons! When in busy environments your transmissions
need to flow and repeats/blocks only put you behind.” (additional comments
appear in Appendix C)
Also observed was a change in strategy by some controllers in the long delay scenarios to work manned, quicker responding traffic first, then go to the UAS with their delayed responses. It should also be noted that the number of “step-ons” or simultaneous transmissions during the study may be less than what might occur in the real world, as pseudo-pilots and GCS controllers cannot “step-on” themselves when controlling multiple aircraft in the simulation scenarios.
The “low” and “moderate” wind levels did not create any issues for the controllers. For the UAS pilots the self-separation algorithms handled the wind conditions with no problems. The most noticeable wind difference for the pilots was an expected offset between heading and track indicators on the Navigation Display, dependent on wind direction relative to the aircraft heading.
Discussion
The present study employed a simulation of the Dallas-Ft. Worth East-side airspace with UAS operating in and out of Collin County airport northeast of DFW. The results confirm the controller acceptability of 1.0 and 1.5 nmi HMDs found in the CAS-1 study, even when maneuvers are required to maintain those miss distances, and winds are part of the scenarios.
12
The 7 and 22 knot wind conditions tested were handled by the DAA algorithms without issues and presented no issues for the controllers. Long voice communications delays between the UAS and ATC are identified as a problem in a high traffic-density environment such as this.
The research questions presented earlier are repeated below with comments based on the results of the study.
A. Given wind and communications delay conditions, were DAA self-separation (SS)
maneuvers too small/too late, resulting in issuance of traffic safety alerts or controller
perceptions of unsafe conditions?
The acceptability ratings indicate that the 0.5 nmi HMD was judged to be “much too close” or “somewhat close, some cause for concern” for crossing encounters 78.6% of the time. This contrasts sharply with the crossing HMDs of 1.0 and 1.5 nmi where 75.2 % and 84.6% respectively, rated these encounters acceptable (“Neither unsafely close nor disruptively large”). Encounter HMD ratings were not affected by the communications delay or wind conditions.
B. Given wind and communications delay conditions, were DAA SS maneuvers too large
(excessive “well clear” distances), resulting in behavior the controller would not expect and/or
disruptions to traffic flow?
Given that the largest HMD evaluated in this study was 1.5 nmi, based on findings of the earlier CAS-1 study, it is not surprising that for crossing encounters at 1.5 nmi only 11.9% of the ratings indicated that the HMD was “Somewhat wide.” While not a majority of the ratings, for the 1.5 nmi HMD, for overtake encounters, 35.7% rated these on the “Somewhat wide” end of the scale. Similarly, for opposite direction encounters at 1.5 nmi,, 32.1% rated these on the “Somewhat wide” end of the scale. Based on discussions with the controllers, this is because it is easier to judge the HMD when aircraft are on parallel paths rather than crossing paths, especially when there are speed differences between the aircraft in the crossing scenarios.
C. Given wind and communications delay conditions, were there acceptable, in terms of
ATC ratings, workload, and closest point of approach data, DAA miss distances that can be
applied to the development of future DAA algorithms?
The results of this study agree with those of the CAS-1 study and showed the greatest acceptability ratings for 1.0 and 1.5 nmi HMDs. For crossing maneuvers an 84.6% HMD acceptability rating was found for the 1.5 nmi HMD. Also important to consider for future study is testing to insure the self-separation system maintains “well-clear” boundaries so the collision avoidance systems, such as TCAS, are not activated by self-separation maneuvers. The DAA algorithms handled the wind conditions without any problems for the UAS pilots (research staff) or for the controllers.
D. Do communications delays for the UAS in the airspace result in an impact on the Air
Traffic Controllers communications flow? Are the delays disruptive in terms of transmissions
13
being “stepped-on” (simultaneous transmissions by several aircraft), and/or are additional
repeats of information required with delays.
The communication delays did not affect controller workload ratings or HMD ratings, but based on debriefing comments, the longer delays would have been disruptive if traffic density had been higher. A number of the controllers changed their communications strategy in the longer delay conditions and worked the quick responding manned aircraft first, then going to the UAS with their delayed responses at less frequent intervals.
The present study assumed perfect surveillance systems without positional error or uncertainty. Future studies designed to inform the designers of DAA systems and critical parameters within them need to incorporate sensor uncertainty and sensor effective range as variables of interest. Also of interest are simulation of failure modes, and especially from the ATC perspective, the maneuvers that a UAS would perform in a high traffic density environment if the communications or control link is lost. The aim of this work is to provide useful information for guiding future rules and regulations applicable to flying UAS in the NAS.

14
References
Chamberlain, J. P., Consiglio, M. C., Comstock, J. R., Jr., Ghatas, R. W., and Muñoz, C. (2015). NASA Controller Acceptability Study 1 (CAS-1) Experiment Description and Initial
Observations. NASA/TM-2015-218763, Langley Research Center, Hampton, VA.
Ghatas, R. W., Comstock, Jr., J. R., Consiglio, M. C., Chamberlain, J. P., and Hoffler, K. D., (2015). UAS in the NAS Air Traffic Controller Acceptability Study-1: The Effects of Horizontal Miss Distances on Simulated UAS and Manned Aircraft Encounters. Proceedings of the 18th International Symposium on Aviation Psychology, Dayton, Ohio, May 4-7, 2015.
Hagen, G. E., Butler, R. W., and Maddalon, J. M. (2011). Stratway: A Modular Approach to Strategic Conflict Resolution. Proceedings of the 11th AIAA Aviation Technology,
Integration, and Operations (ATIO) Conference, September 20-22, 2011, Virginia Beach, Virginia.
Muñoz, C., Narkawicz, A., Chamberlain, J., Consiglio, M., and Upchurch, J. (2014). A Family of Well-Clear Boundary Models for the Integration of UAS in the NAS. Proceedings of
the 14th AIAA Aviation Technology, Integration, and Operations (ATIO) Conference, AIAA-2014-2412, Atlanta, Georgia.
Prevot, T. (2002). Exploring the Many Perspectives of Distributed Air Traffic Management: The Multi Aircraft Control System MACS. AAAI HCI-02 Proceedings, 149-154.
Stein, E. S. (1985). Air traffic controller workload: An examination of workload probe. (DOT/FAA/CT-TN84/24). Atlantic City International Airport, NJ: Federal Aviation Administration.
Acknowledgements
The support of the many people involved in the conduct of this study is gratefully appreciated. Thanks are extended to César Muñoz, Anthony Narkawicz, George Hagen and Jason Upchurch of the Safety Critical Avionics Systems Branch at the NASA Langley Research Center for contributions to the development of the Stratway+ self-separation algorithms. Thanks are also extended to contributors participating through the NASA Langley Information Technology Enhanced Services (LITES) contract, including: Pierre Beaudoin, Anna Dehaven, Steve Hylinski, Joel Ilboudo, Kristen Mark, Robb Myer, Gaurev Sharma, Jim Sturdy, Dimitrios Tsakpinis, and Paul Volk as well as other support and management personnel. Thanks are also extended to the tireless efforts of the persons staffing the background traffic pilot stations, the UAS pilot stations, and the ATC adjacent sector/tower consoles.
15
Appendix A – Workload Ratings by Test Hour
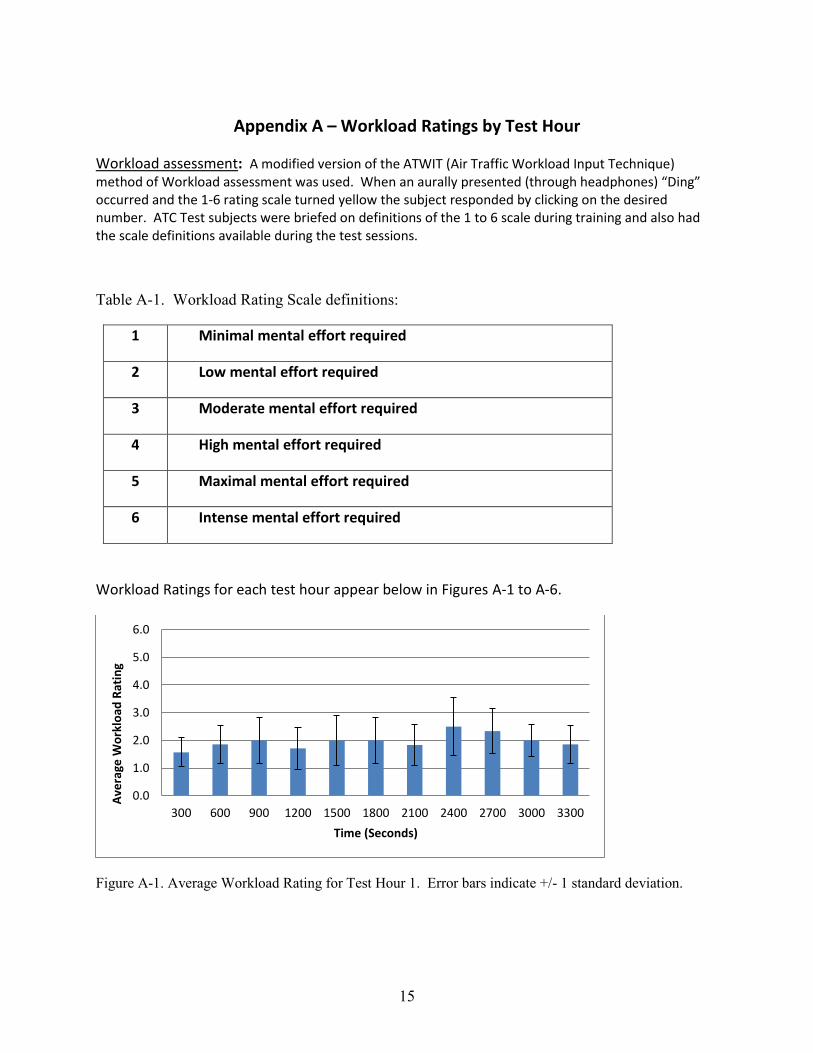
Workload assessment: A modified version of the ATWIT (Air Traffic Workload Input Technique) method of Workload assessment was used. When an aurally presented (through headphones) “Ding” occurred and the 1-6 rating scale turned yellow the subject responded by clicking on the desired number. ATC Test subjects were briefed on definitions of the 1 to 6 scale during training and also had the scale definitions available during the test sessions.
Table A-1. Workload Rating Scale definitions:
1 Minimal mental effort required
2 Low mental effort required
3 Moderate mental effort required
4 High mental effort required
5 Maximal mental effort required
6 Intense mental effort required
Workload Ratings for each test hour appear below in Figures A-1 to A-6.
Figure A-1. Average Workload Rating for Test Hour 1. Error bars indicate +/- 1 standard deviation.
0.0
1.0
2.0
3.0
4.0
5.0
6.0
300 600 900 1200 1500 1800 2100 2400 2700 3000 3300
Ave
rage
Wo
rklo
ad R
atin
g
Time (Seconds)

16
Figure A-2. Average Workload Rating for Test Hour 2. Error bars indicate +/- 1 standard deviation.
Figure A-3. Average Workload Rating for Test Hour 3. Error bars indicate +/- 1 standard deviation.
Figure A-4. Average Workload Rating for Test Hour 4. Error bars indicate +/- 1 standard deviation.
0.0
1.0
2.0
3.0
4.0
5.0
6.0
300 600 900 1200 1500 1800 2100 2400 2700 3000 3300
Ave
rage
Wo
rklo
ad R
atin
g
Time (Seconds)
0.0
1.0
2.0
3.0
4.0
5.0
6.0
300 600 900 1200 1500 1800 2100 2400 2700 3000 3300
Ave
rage
Wo
rklo
ad R
atin
g
Time (Seconds)
0.0
1.0
2.0
3.0
4.0
5.0
6.0
300 600 900 1200 1500 1800 2100 2400 2700 3000 3300
Ave
rage
Wo
rklo
ad R
atin
g
Time (Seconds)
Hour 4 Workload Average
17
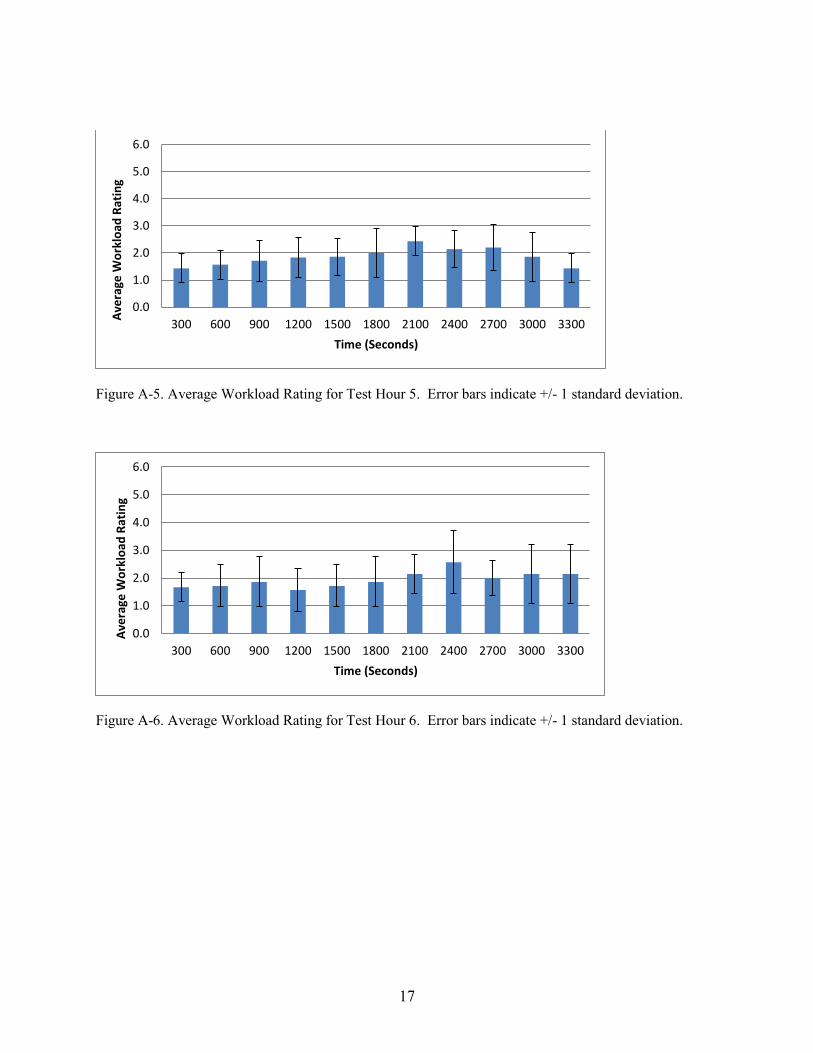
Figure A-5. Average Workload Rating for Test Hour 5. Error bars indicate +/- 1 standard deviation.
Figure A-6. Average Workload Rating for Test Hour 6. Error bars indicate +/- 1 standard deviation.
0.0
1.0
2.0
3.0
4.0
5.0
6.0
300 600 900 1200 1500 1800 2100 2400 2700 3000 3300
Ave
rage
Wo
rklo
ad R
atin
g
Time (Seconds)
0.0
1.0
2.0
3.0
4.0
5.0
6.0
300 600 900 1200 1500 1800 2100 2400 2700 3000 3300
Ave
rage
Wo
rklo
ad R
atin
g
Time (Seconds)

18
Appendix B – Questionnaire Responses
Questions after each 1 hour test session (Responses from 7 ATC controllers)
1. Rate the extent that communications delays with the Unmanned Aircraft affected your
communications overall with BOTH manned and unmanned aircraft.
Test Hour 1 2 3 4 5 6
A = Communications Delay was not a factor during this hour (no noticeable delay)
57% 0% 29% 29% 0% 0%
B = Communications Delay, although noticed, did not impact traffic handling
0% 14% 43% 14% 14% 57%
C = Communications Delays had some effect on communications (more repeats, "step-ons")
43% 57% 29% 29% 71% 29%
D = Communications Delay had a major impact on communications with many more repeats required
0% 29% 0% 29% 14% 14%
E = Communications Delay had such a large effect that the amount of delay observed would not be acceptable in real world operations
0% 0% 0% 0% 0% 0%
2. Rate the extent that communications delays with the Unmanned Aircraft affected your
communications with ONLY the unmanned aircraft.
Test Hour 1 2 3 4 5 6
A = Communications Delay was not a factor during this hour (no noticeable delay)
57% 0% 57% 29% 0% 29%
B = Communications Delay, although noticed, did not impact traffic handling
29% 29% 29% 29% 43% 57%
C = Communications Delays had some effect on communications (more repeats, "step-ons")
14% 57% 14% 29% 43% 0%
D = Communications Delay had a major impact on communications with many more repeats required
0% 14% 0% 14% 14% 14%
E = Communications Delay had such a large effect that the amount of delay observed would not be acceptable in real world operations
0% 0% 0% 0% 0% 0%
19
3. Rate the realism of the Traffic Density of the simulation during the preceding hour.
Test Hour 1 2 3 4 5 6
A = Traffic Density was significantly higher than in real operations
0% 0% 0% 0% 0% 0%
B = Traffic Density was somewhat higher than real world operations
0% 0% 0% 0% 0% 0%
C = Traffic Density was about the same as would be found in real world operations
71% 71% 57% 57% 71% 71%
D = Traffic Density was somewhat lower than real world operations
29% 14% 43% 43% 29% 29%
E = Traffic Density was significantly lower than in real world operations
0% 0% 0% 0% 0% 0%
*
* denotes a missing response in that column
4. Rate the realism of the Workload of the simulation during the preceding hour.
Test Hour 1 2 3 4 5 6
A = Workload was significantly higher than in real operations
0% 0% 0% 0% 0% 0%
B = Workload was somewhat higher than real world operations
0% 0% 0% 14% 14% 0%
C = Workload was about the same as would be found in real world operations
100% 86% 71% 57% 71% 86%
D = Workload was somewhat lower than real world operations
0% 14% 29% 29% 14% 14%
E = Workload was significantly lower than in real world operations
0% 0% 0% 0% 0% 0%
20
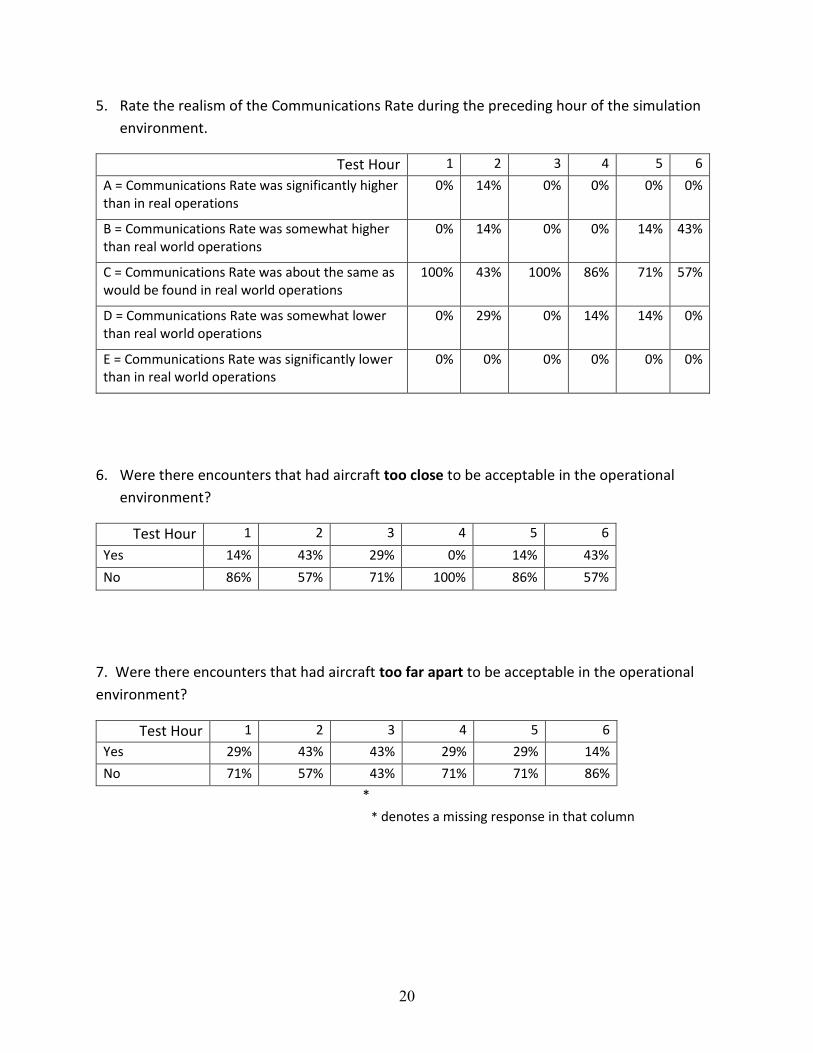
5. Rate the realism of the Communications Rate during the preceding hour of the simulation
environment.
Test Hour 1 2 3 4 5 6
A = Communications Rate was significantly higher than in real operations
0% 14% 0% 0% 0% 0%
B = Communications Rate was somewhat higher than real world operations
0% 14% 0% 0% 14% 43%
C = Communications Rate was about the same as would be found in real world operations
100% 43% 100% 86% 71% 57%
D = Communications Rate was somewhat lower than real world operations
0% 29% 0% 14% 14% 0%
E = Communications Rate was significantly lower than in real world operations
0% 0% 0% 0% 0% 0%
6. Were there encounters that had aircraft too close to be acceptable in the operational
environment?
Test Hour 1 2 3 4 5 6
Yes 14% 43% 29% 0% 14% 43%
No 86% 57% 71% 100% 86% 57%
7. Were there encounters that had aircraft too far apart to be acceptable in the operational
environment?
Test Hour 1 2 3 4 5 6
Yes 29% 43% 43% 29% 29% 14%
No 71% 57% 43% 71% 71% 86%
*
* denotes a missing response in that column
21
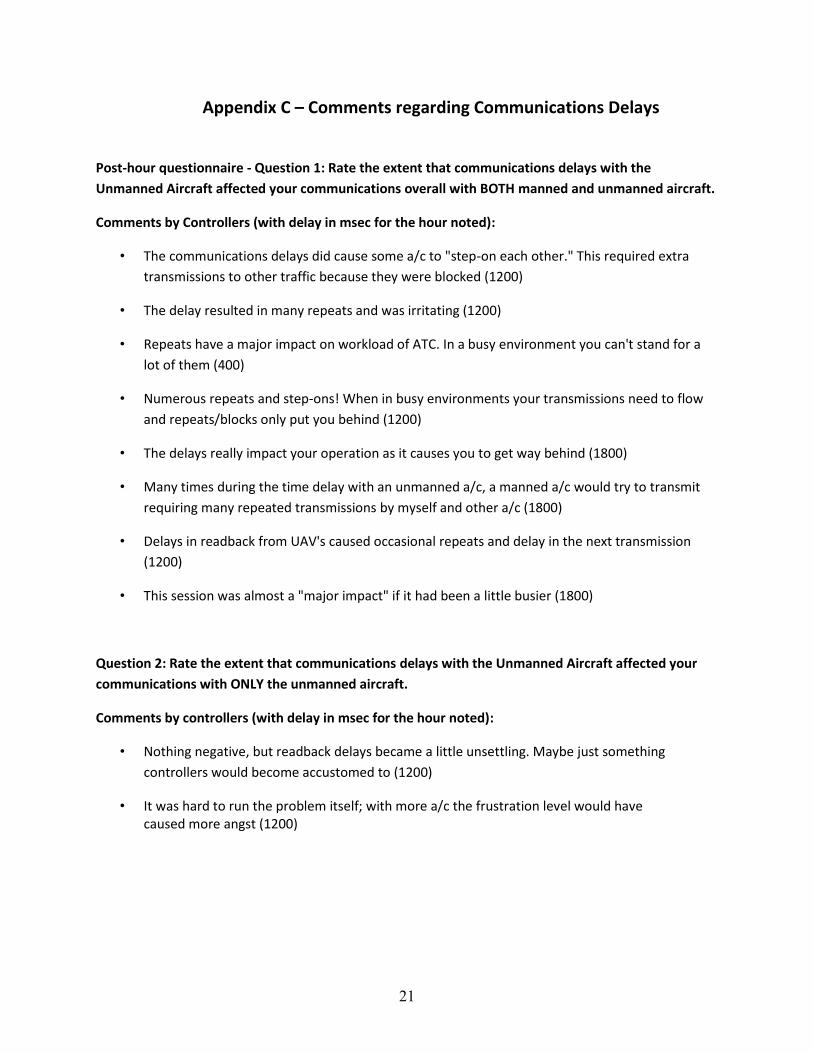
Appendix C – Comments regarding Communications Delays
Post-hour questionnaire - Question 1: Rate the extent that communications delays with the
Unmanned Aircraft affected your communications overall with BOTH manned and unmanned aircraft.
Comments by Controllers (with delay in msec for the hour noted):
• The communications delays did cause some a/c to "step-on each other." This required extra
transmissions to other traffic because they were blocked (1200)
• The delay resulted in many repeats and was irritating (1200)
• Repeats have a major impact on workload of ATC. In a busy environment you can't stand for a
lot of them (400)
• Numerous repeats and step-ons! When in busy environments your transmissions need to flow
and repeats/blocks only put you behind (1200)
• The delays really impact your operation as it causes you to get way behind (1800)
• Many times during the time delay with an unmanned a/c, a manned a/c would try to transmit
requiring many repeated transmissions by myself and other a/c (1800)
• Delays in readback from UAV's caused occasional repeats and delay in the next transmission
(1200)
• This session was almost a "major impact" if it had been a little busier (1800)
Question 2: Rate the extent that communications delays with the Unmanned Aircraft affected your
communications with ONLY the unmanned aircraft.
Comments by controllers (with delay in msec for the hour noted):
• Nothing negative, but readback delays became a little unsettling. Maybe just something
controllers would become accustomed to (1200)
• It was hard to run the problem itself; with more a/c the frustration level would have caused more angst (1200)
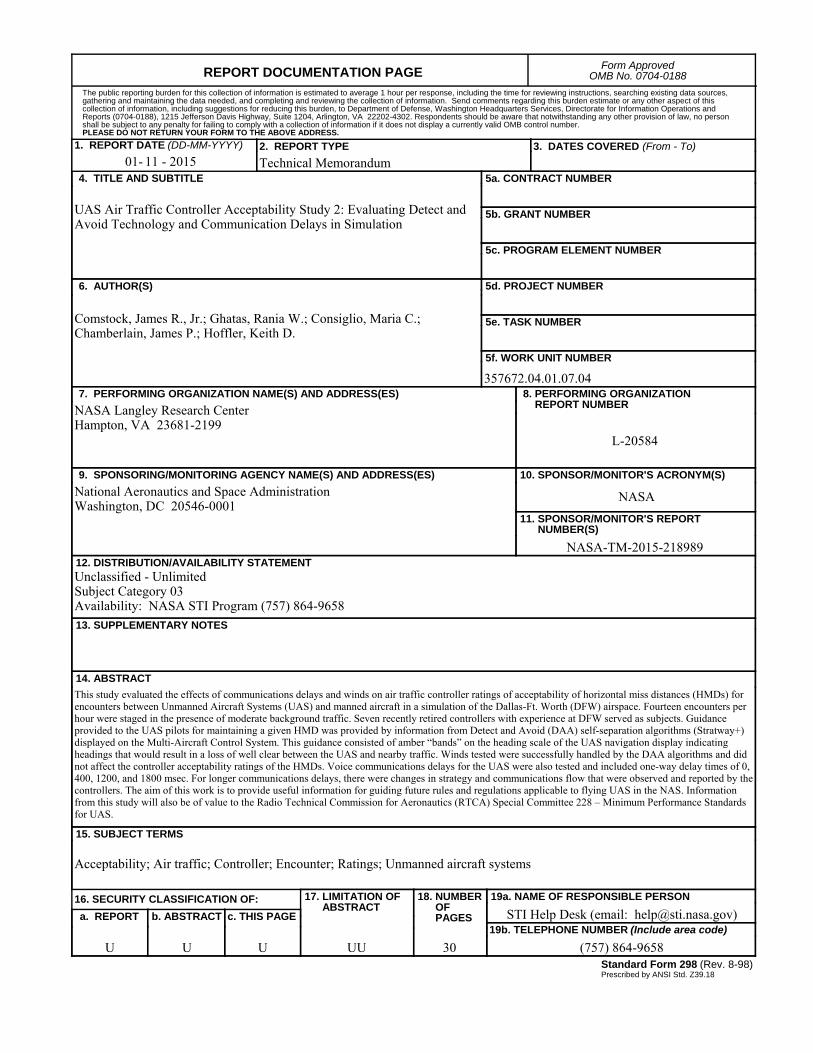
REPORT DOCUMENTATION PAGEForm Approved
OMB No. 0704-0188
2. REPORT TYPE
Technical Memorandum 4. TITLE AND SUBTITLE
UAS Air Traffic Controller Acceptability Study 2: Evaluating Detect and Avoid Technology and Communication Delays in Simulation
5a. CONTRACT NUMBER
6. AUTHOR(S)
Comstock, James R., Jr.; Ghatas, Rania W.; Consiglio, Maria C.; Chamberlain, James P.; Hoffler, Keith D.
7. PERFORMING ORGANIZATION NAME(S) AND ADDRESS(ES)
NASA Langley Research CenterHampton, VA 23681-2199
9. SPONSORING/MONITORING AGENCY NAME(S) AND ADDRESS(ES)
National Aeronautics and Space AdministrationWashington, DC 20546-0001
8. PERFORMING ORGANIZATION REPORT NUMBER
L-20584
10. SPONSOR/MONITOR'S ACRONYM(S)
NASA
13. SUPPLEMENTARY NOTES
12. DISTRIBUTION/AVAILABILITY STATEMENTUnclassified - UnlimitedSubject Category 03Availability: NASA STI Program (757) 864-9658
19a. NAME OF RESPONSIBLE PERSON
STI Help Desk (email: [email protected])
14. ABSTRACT
This study evaluated the effects of communications delays and winds on air traffic controller ratings of acceptability of horizontal miss distances (HMDs) for encounters between Unmanned Aircraft Systems (UAS) and manned aircraft in a simulation of the Dallas-Ft. Worth (DFW) airspace. Fourteen encounters per hour were staged in the presence of moderate background traffic. Seven recently retired controllers with experience at DFW served as subjects. Guidance provided to the UAS pilots for maintaining a given HMD was provided by information from Detect and Avoid (DAA) self-separation algorithms (Stratway+) displayed on the Multi-Aircraft Control System. This guidance consisted of amber “bands” on the heading scale of the UAS navigation display indicating headings that would result in a loss of well clear between the UAS and nearby traffic. Winds tested were successfully handled by the DAA algorithms and did not affect the controller acceptability ratings of the HMDs. Voice communications delays for the UAS were also tested and included one-way delay times of 0, 400, 1200, and 1800 msec. For longer communications delays, there were changes in strategy and communications flow that were observed and reported by the controllers. The aim of this work is to provide useful information for guiding future rules and regulations applicable to flying UAS in the NAS. Information from this study will also be of value to the Radio Technical Commission for Aeronautics (RTCA) Special Committee 228 – Minimum Performance Standards for UAS.
15. SUBJECT TERMS
Acceptability; Air traffic; Controller; Encounter; Ratings; Unmanned aircraft systems
18. NUMBER OF PAGES
3019b. TELEPHONE NUMBER (Include area code)
(757) 864-9658
a. REPORT
U
c. THIS PAGE
U
b. ABSTRACT
U
17. LIMITATION OF ABSTRACT
UU
Prescribed by ANSI Std. Z39.18Standard Form 298 (Rev. 8-98)
3. DATES COVERED (From - To)
5b. GRANT NUMBER
5c. PROGRAM ELEMENT NUMBER
5d. PROJECT NUMBER
5e. TASK NUMBER
5f. WORK UNIT NUMBER
357672.04.01.07.04
11. SPONSOR/MONITOR'S REPORT NUMBER(S)
NASA-TM-2015-218989
16. SECURITY CLASSIFICATION OF:
The public reporting burden for this collection of information is estimated to average 1 hour per response, including the time for reviewing instructions, searching existing data sources, gathering and maintaining the data needed, and completing and reviewing the collection of information. Send comments regarding this burden estimate or any other aspect of this collection of information, including suggestions for reducing this burden, to Department of Defense, Washington Headquarters Services, Directorate for Information Operations and Reports (0704-0188), 1215 Jefferson Davis Highway, Suite 1204, Arlington, VA 22202-4302. Respondents should be aware that notwithstanding any other provision of law, no person shall be subject to any penalty for failing to comply with a collection of information if it does not display a currently valid OMB control number.PLEASE DO NOT RETURN YOUR FORM TO THE ABOVE ADDRESS.
1. REPORT DATE (DD-MM-YYYY)
11 - 201501-