qualcomm centriq 2400 server tco - tirias research · 2018-02-19 · project olympus is a...
TRANSCRIPT
Copyright © 2018 TIRIAS Research. All Rights Reserved
Qualcomm Centriq 2400 Server TCO Methodology & Assumptions
Paul Teich Principal Analyst, TIRIAS Research
February 2018
Series sponsored by Qualcomm Datacenter Technologies (QDT)

Qualcomm Centriq 2400 Server TCO
Methodology & Assumptions Series sponsored by Qualcomm Datacenter Technologies (QDT)
February 2018 Copyright © 2018 TIRIAS Research. All Rights Reserved Page 1
Abstract
This document details the methodology and assumptions used in support of a series of TCO
comparison papers. Each TCO paper highlights notable differences between servers based on the
Qualcomm Centriq 2400 Armv8 instruction set architecture (ISA) system-on-chip (SoC) and the
Intel x86 ISA Xeon Scalable processor for each application tested. This document also describes
the baseline configurations, commonalities, and differences among both architectures’
underlying hardware and software configurations, as well as the testing methodology and
assumptions.
The primary target audiences for the TCO comparison papers are cloud IT datacenters with fixed
rack-level power delivery, such as mid-sized public cloud, managed services, and hosting
datacenters.
Contents
Abstract ........................................................................................................................................... 1
Contents .......................................................................................................................................... 1
Hardware ......................................................................................................................................... 3
Processors ................................................................................................................................... 3
Table 1: Qualcomm Centriq 2400 & Intel Xeon Scalable Processor Specifications .................. 3
Qualcomm Centriq 2400 Processors ..................................................................................... 3
Figure 1: Qualcomm Centriq 2400 Processor (Top & Bottom) ................................................. 3
Figure 2: Qualcomm Centriq 2400 Block Diagram .................................................................... 4
Intel Xeon Scalable Processors ............................................................................................. 4
Configurations ............................................................................................................................ 4
Table 2: Qualcomm Centriq 2400 & Intel Xeon Scalable Configurations ................................. 5
Qualcomm Centriq 2400 Configuration ................................................................................ 6
Figure 3: Qualcomm Centriq 2400 OCM for Project Olympus with NIC ................................. 6
Intel Xeon Scalable Configuration ........................................................................................ 6
Software .......................................................................................................................................... 7
Table 3: Qualcomm Centriq 2400 & Intel Xeon Scalable Software .......................................... 7
Performance Measurement Methodology ....................................................................................... 7
Power Measurement Methodology ................................................................................................. 8
Qualcomm Centriq 2400 Power Measurement ..................................................................... 8
Intel Xeon Scalable Power Measurement ............................................................................. 8

Qualcomm Centriq 2400 Server TCO
Methodology & Assumptions
February 2018 Copyright © 2018 TIRIAS Research. All Rights Reserved Page 2
TIRIAS Research Fairness Assessment .......................................................................................... 8
TCO Methodology .......................................................................................................................... 9
Figure 4: One Dual-Socket Motherboard (HPE DL380 Gen10) .............................................. 10
Figure 5: Two Single-Socket Motherboards (Qualcomm Centriq 2400 REP) ......................... 10
Capital Expense (Capex) .......................................................................................................... 11
Table 4: List Price for Each Component .................................................................................. 11
Table 5: Component Quantities per Chassis TCO Bill of Materials ........................................ 11
Operating Expense (Opex) ........................................................................................................ 12
Power Consumption & Rates .............................................................................................. 12
Table 6: Power Consumption for Each Component in Watts (W) ........................................... 12
Enablement Infrastructure ............................................................................................................. 12
Redis ......................................................................................................................................... 13
Table 7: Redis Client Specifications ......................................................................................... 13
General .......................................................................................................................................... 13
Appendix ....................................................................................................................................... 14
Figure & Table Sources ............................................................................................................ 14
IPMI power measurement script for Qualcomm Centriq 2400 configurations ........................ 14
PCM power measurement process and scripts for Intel Xeon Scalable configurations ........... 14

Qualcomm Centriq 2400 Server TCO
Methodology & Assumptions
February 2018 Copyright © 2018 TIRIAS Research. All Rights Reserved Page 3
Hardware
Processors
Table 1: Qualcomm Centriq 2400 & Intel Xeon Scalable Processor
Specifications
Qualcomm Centriq 2452 Intel Xeon Silver 4110 Intel Xeon Gold 5120
Core Generation Falkor Skylake Skylake
Cores / Threads 46 / 46 8 / 16 14 / 28
Base Speed 2.2 GHz 2.1 GHz 2.2 GHz
All Core Turbo Speed 2.6 GHz 2.4 GHz 2.6 GHz
Last Level Cache 57.5 MB 11 MB 19.25 MB
Process 10 nm 14 nm 14 nm
Specified TDP 120 W 85 W 105 W
Production Date November 2017 July 2017 July 2017
Sources: Qualcomm Datacenter Technologies & TIRIAS Research (See Appendix for notes regarding all Figure & Table sources)
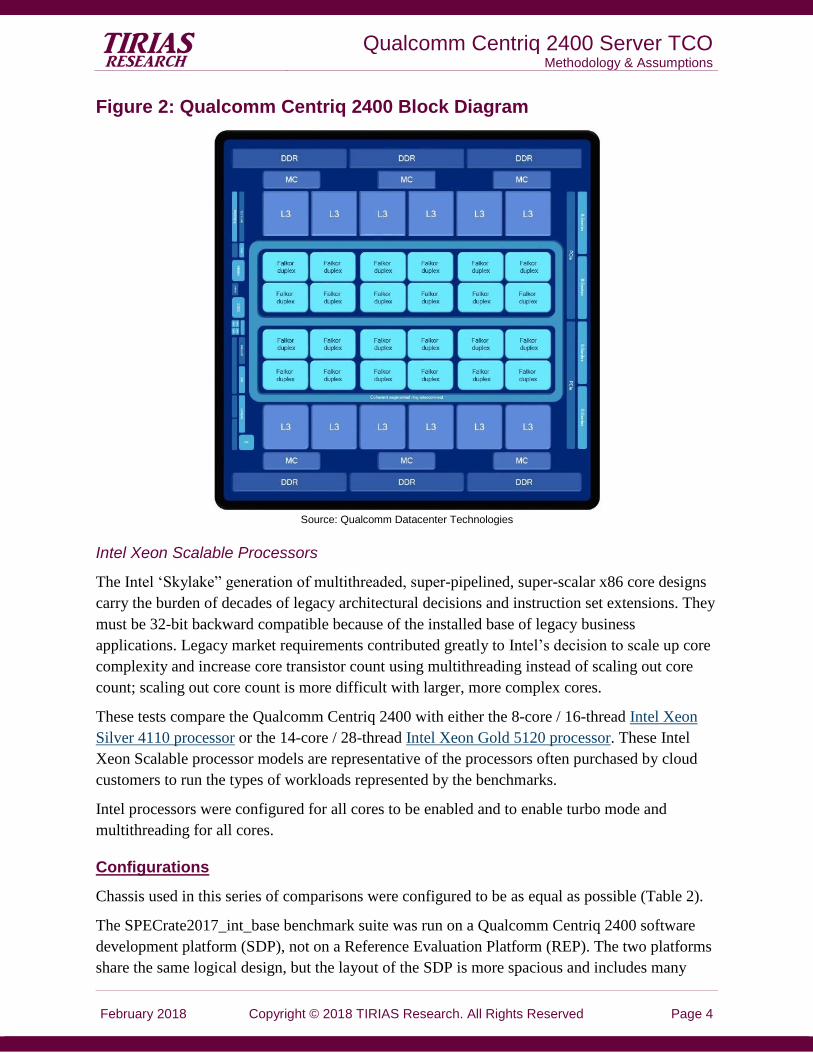
Qualcomm Centriq 2400 Processors
The Qualcomm Datacenter Technologies (QDT) Falkor single-threaded Armv8 core implements
the Armv8 RISC instruction set (AArch64 only, with no native 32-bit instructions) including
advanced floating point with single instruction multiple data (FP/SIMD) extensions. FP/SIMD
was an add-on accelerator called NEON in earlier Arm architectures.
Because the Falkor core is single-threaded, 64-bit only, and is not cluttered with decades of
instruction set extensions, it is a simpler design that uses fewer transistors than mainstream x86
cores. Simpler design and a 10 nanometer manufacturing process result in the ability to design
many more cores into a system-on-chip (SoC).
Figure 1: Qualcomm Centriq 2400 Processor (Top & Bottom)
Source: TIRIAS Research
The Qualcomm Centriq 2400 family of server SoCs includes 48-, 46-, and 40-core variants. A
48-core Qualcomm Centriq 2400 SoC with all good L3 cache (60 MB) was configured to
emulate a 46-core Qualcomm Centriq 2452 with 57.5 MB L3 cache for this series of papers.
Qualcomm Centriq 2400 Server TCO
Methodology & Assumptions
February 2018 Copyright © 2018 TIRIAS Research. All Rights Reserved Page 4
Figure 2: Qualcomm Centriq 2400 Block Diagram
Source: Qualcomm Datacenter Technologies
Intel Xeon Scalable Processors
The Intel ‘Skylake” generation of multithreaded, super-pipelined, super-scalar x86 core designs
carry the burden of decades of legacy architectural decisions and instruction set extensions. They
must be 32-bit backward compatible because of the installed base of legacy business
applications. Legacy market requirements contributed greatly to Intel’s decision to scale up core
complexity and increase core transistor count using multithreading instead of scaling out core
count; scaling out core count is more difficult with larger, more complex cores.
These tests compare the Qualcomm Centriq 2400 with either the 8-core / 16-thread Intel Xeon
Silver 4110 processor or the 14-core / 28-thread Intel Xeon Gold 5120 processor. These Intel
Xeon Scalable processor models are representative of the processors often purchased by cloud
customers to run the types of workloads represented by the benchmarks.
Intel processors were configured for all cores to be enabled and to enable turbo mode and
multithreading for all cores.
Configurations
Chassis used in this series of comparisons were configured to be as equal as possible (Table 2).
The SPECrate2017_int_base benchmark suite was run on a Qualcomm Centriq 2400 software
development platform (SDP), not on a Reference Evaluation Platform (REP). The two platforms
share the same logical design, but the layout of the SDP is more spacious and includes many

Qualcomm Centriq 2400 Server TCO
Methodology & Assumptions
February 2018 Copyright © 2018 TIRIAS Research. All Rights Reserved Page 5
more test points and circuitry for measuring current, voltage, and temperature. QDT considers
SDP performance to conservatively represent REP performance, because the REP design has
gone through many revisions to correct signal integrity and speed path flaws, whereas the SDP
design has remained static. For the purposes of this TCO evaluation, the REP was used to
calculate a TCO for the SPECrate2017_int_base Qualcomm Centriq 2400 estimated results.
Table 2: Qualcomm Centriq 2400 & Intel Xeon Scalable Configurations
Qualcomm Centriq 2400 Configuration Intel Xeon Scalable Configuration
Chassis / Mother- board
Qualcomm Centriq 2400 Software Development
Platform (SDP)
Qualcomm Centriq 2400 Reference Evaluation
Platform (REP)
Supermicro SYS-6029P-WTR (Intel Purley
Platform)
Supermicro SYS-6029P-WTR (Intel Purley
Platform)
Processor 2452 2452 Silver 4110 Gold 5120
Processor Sockets
1 1 2 2
Chipset n/a n/a Intel C621 Intel C621
Firmware QDF2400.FW.2.0.r1-00616-
QDF2400_REL-1 QDF2400.FW.2.0.r1-00651-
QDF2400_REL-1 AMI 1.0a, 6/23/2017 AMI 1.0a, 6/23/2017
Chassis Height
2U 1U 2U 2U
NIC Mellanox ConnectX-4 Lx
1-port 50 GbE SFP28 Intel XL710
2-port 40 GbE QSFP+ Mellanox ConnectX-4 Lx
1-port 50 GbE SFP28 Intel XL710
2-port 40 GbE QSFP+
Memory 32 GB 2667 MHz
Micron 36ASF4G72PZ-2G6D1
32 GB 2667 MHz Micron 36ASF4G72PZ-
2G6D1
32 GB 2400 MHz Micron 36ASF4G72PZ-
2G6H1R
16 GB 2400MHz Samsung
M393A2K40BB2-CTD
SSD Intel SSDSC2BB48
480 GB 6 Gbps SATA Intel SSDSC2BB48
480 GB 6 Gbps SATA Intel SSDSC2BB48
480 GB 6 Gbps SATA Intel SSDSC2BB48
480 GB 6 Gbps SATA
Source: Qualcomm Datacenter Technologies
DDR Memory
• All configurations operate using 1 DIMM per channel timings. For the Supermicro Intel
Xeon Scalable configurations, 2667 MHz DDR was used, but the selected Intel Xeon
Scalable processors’ memory controllers are limited to 2400 Mhz.
• The Qualcomm Centriq 2452 SoC and motherboards have 6 memory channels using 32
GB DIMMs at 2667 MHz for 192 GB total.
• Although the Supermicro 2P Intel Xeon Silver 4110 has 12 memory channels using 32
GB DIMMs for 384 GB total, the HHVM benchmark has fixed memory requirements
and uses less than 192 GB, making it equivalent to the QDT configurations’ 192 GB.
• The Supermicro 2P Intel Xeon Gold 5120 configuration has 12 memory channels. The
Redis tests used 16 GB DIMMs for 192 GB total (equivalent DDR size to the QDT
configurations) and SPEC CPU2017 testing used 32 GB DIMMS for 384 GB total.
Storage
• The same SSD drive was used in all configurations. The SSD is used for both the OS and
user data. All 4 benchmarks are not disk intensive, so additional storage was not needed.
SoC Capabilities
• The Qualcomm Centriq 2400 does not require a chipset, because it is a bootable SoC.

Qualcomm Centriq 2400 Server TCO
Methodology & Assumptions
February 2018 Copyright © 2018 TIRIAS Research. All Rights Reserved Page 6
Networking
• Both the Qualcomm Centriq 2400 REP and the Supermicro Intel Xeon Gold 5120
configurations under test leveraged the same XL710 40 GbE NIC. Only RedisBench used
network connectivity.
Power Management
• Settings were configured for low-latency and high-performance modes.
Qualcomm Centriq 2400 Configuration
QDT started shipping Qualcomm Centriq 2400 processors to customers for revenue in November
2017. HPE announced support for Qualcomm Centriq 2400 and should bring servers to market in
the first half of 2018.
The Qualcomm Centriq 2400 Reference Evaluation Platform (REP) uses the Qualcomm Centriq
2400 Open Compute Motherboard (OCM) for Project Olympus (Revision 0.5; Feb 17, 2017).
Project Olympus is a specification fork of the Open Compute Project (OCP).
QDT used a 48-core Centriq 2460 and disabled two cores and 2.5 MB of L3 cache by using the
UEFI device manager (Modify Shared Variables). Both the UEFI CPU mask and L3 cache mask
fields were modified to emulate a Qualcomm Centriq 2452.
The Qualcomm Centriq 2400 REP uses a single 750 W power supply (non-redundant). QDT
used a single 1150 W power supply (also non-redundant) for two motherboard REP
configurations, but all configurations under test were configured with only one motherboard.
Figure 3: Qualcomm Centriq 2400 OCM for Project Olympus with NIC
Source: TIRIAS Research
Intel Xeon Scalable Configuration
All Intel Xeon Scalable performance and power measurements were taken from two Supermicro
SuperServer 6029P-WTR chassis ordered from Supermicro with the components listed above.

Qualcomm Centriq 2400 Server TCO
Methodology & Assumptions
February 2018 Copyright © 2018 TIRIAS Research. All Rights Reserved Page 7
The motherboard in each chassis had either two Intel Xeon Silver 4110 processors or two Intel
Xeon Gold 5120 processors. This series of TCO comparisons compares dual-socket Xeon
Scalable motherboards to single-socket Qualcomm Centriq 2400 motherboards. TIRIAS
Research extrapolated Qualcomm Centriq 2452 single-socket measurements to estimate
performance and power consumption for two single-socket motherboards in a chassis.
Supermicro’s SuperServer 6029P-WTR ships with dual 1000 W (redundant) power supplies.
Software
Table 3: Qualcomm Centriq 2400 & Intel Xeon Scalable Software
Qualcomm Centriq 2400 Intel Xeon Scalable
Operating System CentOS 7.3 (1611 AltArch) CentOS 7.4 (1708)
Linux Kernel 4.11.0-0918.el7.5925f7b4.aarch64 3.10.0-693.2.2.el7.x86_64
Linux File System CentOS 7.3.1611 CentOS 7.4.1708
Compiler SPEC CPU2017: GCC 7.1.1
Other Benchmarks: 4.8.5 20150623 (Red Hat 4.8.5-16)
SPEC CPU2017: GCC 7.1.0 Other Benchmarks: 4.8.5 20150623
(Red Hat 4.8.5-16)
Source: Qualcomm Datacenter Technologies
The only reason that different OS / kernel versions were used is simply that QDT used the most
current released CentOS distributions for each instruction set evaluated: Qualcomm Centriq 2400
uses AArch64, and Intel Xeon Scalable uses x86.
CentOS defaults are 4K pages for Intel Xeon Scalable and 64K pages for Qualcomm Centriq
2400. All tested configurations (except Redis) used transparent huge pages (THP) set to always.
The HHVM and Redis benchmarks used GCC 4.8.5, because it was included in the CentOS
distribution that was included with the Supermicro configurations purchased. SPEC CPU2017
specifies GCC 7.1.x (Table 3).
QDT updated the kernel used for Centriq 2400 benchmarks to the most current version available
prior to Spectre and Meltdown patches. Likewise, QDT used an unpatched Linux kernel,
distributed with version of CentOS Linux tested, to run the Intel Xeon Scalable benchmarks.
Performance Measurement Methodology
Individual performance benchmarks are described, each in its own paper. Every data point in
each benchmark was measured at least three times. The geometric mean of the runs was used as
the final data point for comparisons.
For Redis testing, QDT used a Mellanox SN2700 32-port 100GbE Open Ethernet Switch
configured for non-blocking connectivity to connect the Supermicro Intel Xeon Silver 4110 and
Intel Xeon Gold 5120 configurations. QDT used an HPE Intel Xeon 2699v4 Redis chassis used
to generate client queries. The negotiated data rate between the chassis and switch was 25 Gbps.
QDT used a Mellanox SN2100 half-width 16-port non-blocking 100 GbE Open Ethernet Switch
to connect the Qualcomm Centriq 2400 REP chassis at negotiated 40 Gbps data rates. The
SN2100 switch connected into the SN2700 switch with a negotiated data rate between the
switches of 100 Gbps.

Qualcomm Centriq 2400 Server TCO
Methodology & Assumptions
February 2018 Copyright © 2018 TIRIAS Research. All Rights Reserved Page 8
The Mellanox SN2100 and SN2700 switches were connected directly to each other via 100 GbE
and are non-blocking, so any other traffic present in the switches would not have affected the
benchmarks. These switches are representative of the types of switches used in cloud
datacenters.
Power Measurement Methodology
Power measurements for all configurations under test were confined to the processor SoC. Power
measurements also excluded memory power consumption.
Power consumption was measured during each performance analysis run. Power measurement
started at the beginning of each sub-benchmark and stopped at the end of each test. The
geometric mean of power runs for each sub-benchmark were used to calculate each sub-
benchmark’s score. The combined power measurement for each benchmark was calculated as the
arithmetic mean of sub-benchmark power measurements.
Intel Xeon Scalable processor power was measured using Intel’s Performance Counter Monitor
(PCM) power utility. This utility reports energy consumed by the Skylake SoC every second.
Qualcomm Centriq 2400 processor power consumption was measured via a script that reads SoC
power from the motherboard baseboard management controller (BMC) over the LAN using the
IPMI sensor data record (SDR) command.
Qualcomm Centriq 2400 and Intel Xeon Scalable power consumption was measured internally
on typical material at room temperature.
Qualcomm Centriq 2400 Power Measurement
The Qualcomm Centriq 2400 OCM for Project Olympus motherboard uses an ASPEED
AST2520 BMC that receives energy consumption samples from the Qualcomm Centriq 2400
SoC. Measurement is performed via sensors measuring voltage and current supplied by voltage
regulators and estimation for other power supply chips.
Intel Xeon Scalable Power Measurement
Intel Xeon Scalable processor complex power consumption was measured using Intel’s PCM
power utility. The Intel C621 PCH (southbridge) power consumption is specified at 15 W but
was estimated at 4 W while running the SPECint_rate2006 benchmark suite (the suite incurs
minimal I/O and network traffic); that figure was used as the typical power consumption for the
Intel C621 PCH.
TIRIAS Research Fairness Assessment
TIRIAS Research evaluated the performance and power measurement methods described above
and found those methods to be a fair basis for comparison of architectures. Each of the TCO
comparison papers describes the specifics for analyzing an individual benchmark.

Qualcomm Centriq 2400 Server TCO
Methodology & Assumptions
February 2018 Copyright © 2018 TIRIAS Research. All Rights Reserved Page 9
For the SPEC CPU2017 and Redis benchmarks, QDT chose to use marginally faster memory in
its own configurations at a significant price premium to the Intel Xeon Scalable configurations.
For Redis, QDT chose to use twice the memory per socket with its motherboard as was
configured in the Intel Xeon Scalable chassis for Redis. These choices favor Intel’s performance
per dollar results.
QDT supplied TIRIAS Research with the raw power and performance measurements used to
create the tables and charts in the TCO comparisons.
TCO Methodology
TIRIAS Research extrapolated the costs, power consumption, and performance of a Qualcomm
Centriq 2400 REP chassis containing one single-socket motherboard to estimate the costs, power
consumption, and performance of the same chassis housing two single-socket motherboards.
• Cost extrapolation: One Qualcomm Centriq 2400 motherboard as tested was multiplied
by two, the cost of a NIC was subtracted ($15 was added for a NIC riser and an OCuLink
connector to share the NIC between the boards), and the chassis configured with one SSD
per motherboard (maintaining one SSD per motherboard for performance equivalence).
• Power extrapolation: Typical power consumption per component was used (Table 6),
along with the measured power for Qualcomm Centriq 2400 SoC and Intel Xeon Scalable
in each benchmark (described in each TCO document).
• Performance extrapolation: Measured performance of one single-socket motherboard
Qualcomm Centriq 2400 REP configuration was doubled for each benchmark (described
in each TCO document). As none of the benchmarks saturated the NIC, this is a
reasonable extrapolation.
The extrapolation for two Qualcomm Centriq 2400 motherboards in a single chassis was used to
normalize TCO comparisons with one dual-socket Intel Xeon Scalable motherboard in a chassis.
TIRIAS Research then scaled the chassis-level comparisons to a rack-level comparison.
TIRIAS Research reduces TCO analysis to a minimum set of variables that highlight useful
differences between products. For server processor TCO calculations, TIRIAS Research reduces
the number of constants that apply to all chassis configurations in the comparison. Because
processors cannot run workloads without the rest of a functioning server, TIRIAS Research:
• Assembled a representative low-volume bill of materials for a functioning server to
obtain capital expense (Capex) estimates (Tables 4 & 5).
• Burdened the measured power consumption by adding estimates of typical power
consumption for the rest of a functioning server chassis’ components to obtain operating
expense (Opex) estimates (Table 6).
The analysis does not extend the TCO estimate beyond evaluating some simple rack-scale
metrics, because assuming fixed power distribution to each rack also assumes use of identical
switch, power distribution, cabling, and rack costs for both Qualcomm Centriq 2400 and Intel

Qualcomm Centriq 2400 Server TCO
Methodology & Assumptions
February 2018 Copyright © 2018 TIRIAS Research. All Rights Reserved Page 10
Xeon Scalable chassis. Given that memory, network, and storage components have fixed power
consumption and costs between all the platforms tested, adding more of them to a comparison
would obscure differences in processor and motherboard pricing and power consumption. These
comparisons use a nominal set of components at low-volume prices (Table 4) to enable realistic
baseline TCO comparisons at chassis and rack levels.
Figure 4: One Dual-Socket Motherboard (HPE DL380 Gen10)
Source: TIRIAS Research
Figure 5: Two Single-Socket Motherboards (Qualcomm Centriq 2400
REP)
‘
Source: TIRIAS Research
The REP chassis (Figure 5) has a longer, cloud form factor chassis than the Supermicro chassis
tested (Figure 4 shows a generic example of a shorter enterprise form factor chassis).

Qualcomm Centriq 2400 Server TCO
Methodology & Assumptions
February 2018 Copyright © 2018 TIRIAS Research. All Rights Reserved Page 11
Capital Expense (Capex)
One-time server acquisition costs are amortized over a three-year refresh cycle.
The analysis does not adjust for datacenter infrastructure and physical provisioning costs, such as
floorspace. These vary widely by region and by size of installation.
This analysis does not assume a discount from low-volume component pricing. If an aggressive
cloud-scale high-volume price discount were used, it might overemphasize the TCO contribution
of power consumption from the point of view of a Tier 2 cloud service provider or hoster.
Table 4: List Price for Each Component
Qualcomm
Centriq 2452 Intel Xeon Silver 4110
Intel Xeon Gold 5120
Processor $1,373 $500 $1,555
Motherboard $460 $763 $763
Chipset n/a $57 $57
NIC – Standard (one motherboard) $180 $180 $180
NIC – Multi-host incl. adapter (two motherboard) $360 n/a n/a
Memory 32 GB $352 / $298† $298 $298
Memory 16 GB n/a n/a $149††
SSD $77 $77 $77
Power supply, fans, etc. $290 $290 $290 †Redis & SPEC CPU2017 configuration: 6 x 32G B RDDR4-2667 DIMMs. HHVM configuration: 6 x 32 GB RDDR4-2400 DIMMs ††Redis
Sources: Qualcomm Datacenter Technologies, Intel, & Others
Table 5: Component Quantities per Chassis TCO Bill of Materials
Qualcomm
Centriq 2452 One Motherboard
Qualcomm Centriq 2452
Two Motherboards Intel Xeon Silver 4110
Intel Xeon Gold 5120
Processor 1 2 2 2
Motherboard 1 2 1 1
Chipset 0 0 1 1
NIC – Standard (one motherboard)
1 n/a 1 1
NIC – Multi-host incl. adapter (two motherboard)
n/a 1 n/a n/a
Memory 32 GB 6 12 12 12
Memory 16 GB n/a n/a n/a 12
SSD 1 2 1 1
Power supply, fans, etc. 1 1 1 1
Source: Qualcomm Datacenter Technologies
Qualcomm Centriq 2400 motherboard costs and component redundancy in a two motherboard
configuration result in a total motherboard cost about 22% higher than the cost of one dual-
socket Intel Xeon Scalable motherboard. While the Qualcomm Centriq 2400 motherboard does
not need the equivalent of Intel's C621 PCH southbridge chip, adding southbridge I/O pins to
Qualcomm Centriq 2400 series processors means that the processor socket has more pins and is
therefore more expensive. The motherboard has more layers to route the dense I/O from the
socket to peripheral chips and sockets, and it requires power management integrated circuits
(PMIC) chips that the Intel Xeon Scalable board does not need. A two motherboard Qualcomm
Centriq 2400 configuration also requires adding a PCIe socket riser to connect a multi-host NIC
and an OCuLink connector to connect the NIC to both boards.

Qualcomm Centriq 2400 Server TCO
Methodology & Assumptions
February 2018 Copyright © 2018 TIRIAS Research. All Rights Reserved Page 12
Benchmarking does not require a full complement of storage drives. All benchmarks load test
data from storage drives but then run tests directly from memory, ignoring any storage drives.
HHVM and Redis are in-memory applications and require little local storage capacity. This
analysis includes a nominal complement of one SSD per motherboard in the TCO calculations to
load configuration cost and power consumption to nominal but realistic levels.
Assumed pricing for memory and flash (low quantity) in 2H2018:
• DDR4 2400 at $9.31 / GB using 16 GB DIMMs
• DDR4 2667 at $11.00 / GB using 32 GB DIMMs (equivalent to DDR4 2400 today)
• M.2 SSD at $0.30 / GB using 256 GB drives
Operating Expense (Opex)
Power Consumption & Rates
• Electricity cost basis of $0.0727 per kilowatt hour (kWh)
o US Department of Energy, US Energy Information Administration, Electricity
Data Browser, Sales of electricity (EIA 826/EIA 861): Average retail price of
electricity, 5.3 Average retail price of electricity to ultimate customers: total by
end use sector, Industrial sector 2017Q3
• Includes electricity costs for every hour of entire three-year TCO period
• Includes estimated PUE of 1.45 as representative of Tier 2 datacenters
• Implements baseline assumptions and equations for calculating the infrastructure cost of
supplying electricity (including financing and depreciation) and for burdening the direct
cost of electricity with PUE and critical load usage as described in James Hamilton’s
Overall Data Center Costs.
Table 6: Power Consumption for Each Component in Watts (W)
Qualcomm Centriq 2400 Intel Xeon Scalable
Specified Typical Specified Typical
Processor 120 Unique per Benchmark 85 / 105 Unique per Benchmark
Chipset n/a n/a 15 4
NIC – Standard 10 6.5 10 6.5
NIC – Multi-host 14 10.5 n/a n/a
Memory DIMM 7.5 3.5 7.5 3.5
SSD 7.5 6 7.5 6
Motherboard, fans, etc. 120 80 225 135
Sources: Qualcomm Datacenter Technologies, Intel, Mellanox, & other manufacturers
TIRIAS Research estimates the power consumption of all the non-processor components as a
burden on the measured processor power consumption to estimate a realistic total power
consumption for each benchmark.
Enablement Infrastructure
Both SparkBench and Redis clients ran CentOS 7.3.1611 with multithreading and turbo mode
enabled, along with low-latency, high-performance processor profile.

Qualcomm Centriq 2400 Server TCO
Methodology & Assumptions
February 2018 Copyright © 2018 TIRIAS Research. All Rights Reserved Page 13
Redis
The Redis client was an HPE DL380 Gen9 with a single Intel Xeon E5-2699v4 (Broadwell
generation) 22-core / 44-thread processor. Table 7 shows configuration details.
A Mellanox ConnectX-4 Lx (40/50GbE Single QSFP28) NIC was used in the DL380 with a
negotiated speed of 25 Gbps to a Mellanox SN2700 switch (described above).
Table 7: Redis Client Specifications
Redis Client
Processor Model Intel Xeon 2699v4 (Broadwell)
Chassis / Motherboard HPE ProLiant DL360 Gen9
Processor Sockets 1
NIC Mellanox ConnectX-4 Lx 1-port 50 GbE SFP28
Memory 8x 32 GB DDR4-2400 2 DIMMs / channel
SSD HP VK0480GFLKH 480 GB
Firmware HPE U32 (8/18/2017)
OS CentOS 7.4.1708
Linux Kernel 3.10.0-693.2.2.el7.x86_64
GCC 4.8.5 20150623 (Red Hat 4.8.5-16)
Source: Qualcomm Datacenter Technologies
General
Where not specified, all other variables are assumed to be equal, for example labor, datacenter
floorspace, business insurance, etc.

Qualcomm Centriq 2400 Server TCO
Methodology & Assumptions
February 2018 Copyright © 2018 TIRIAS Research. All Rights Reserved Page 14
Appendix
Figure & Table Sources
Unless otherwise noted, all Figures and Tables are based on Qualcomm Datacenter Technologies
(QDT) benchmark measurements, Qualcomm Centriq 2400 SoC and motherboard specifications,
public competitive processor, motherboard, and chassis specifications, and TIRIAS Research
calculations and formatting.
IPMI power measurement script for Qualcomm Centriq 2400 configurations
while :; do { sudo ipmitool -I lanplus -H 10.228.208.205 -U admin -P Password1 sdr |
grep "SoC Power"; date; } | tr "\n" " "; echo ""; done
PCM power measurement process and scripts for Intel Xeon Scalable
configurations
Source: git clone https://github.com/opcm/pcm
All commands must be run as sudo
On fresh reboot you must execute the two following commands:
modprobe msr #modprobe is required on Ubuntu, but not CentOs
echo 0 > /proc/sys/kernel/nmi_watchdog
For logging power on simple command line test (as defined by $TEST below) use the following
syntax:
./opt/pcm/pcm.x 1 -nc -csv=$POWER_LOG_FILE.csv -- $TEST
This will log at a 1 second interval, keeping only the socket data, and formatting as a csv to the
file $POWER_LOG_FILE.csv
For logging power on benchmarks that are driven by an external client, start the power logging
process on the configuration under test, run the test, then terminate the logger once the test
concludes.
Before test run:
ssh -f rtpperf-SUT "sudo /opt/pcm/pcm.x 1 -nc -csv=$POWER_LOG_FILE.csv "
After the test completes run:
ssh rtpperf-SUT "sudo pkill pcm.x"

Qualcomm Centriq 2400 Server TCO
Methodology & Assumptions
February 2018 Copyright © 2018 TIRIAS Research. All Rights Reserved Page 15
Copyright © 2018 TIRIAS Research. TIRIAS Research reserves all rights herein.
Reproduction in whole or in part is prohibited without prior written and express permission from TIRIAS
Research.
The information contained in this report was believed to be reliable when written, but is not guaranteed as to its
accuracy or completeness.
Product and company names may be trademarks (™) or registered trademarks (®) of their respective holders.
The contents of this report represent the interpretation and analysis of statistics and information that is either
generally available to the public or released by responsible agencies or individuals.