qgess: estimating carbon dioxide transport and storage … - qgesstransport.pdf · estimating...
TRANSCRIPT

March 2010
March 2010 DOE/NETL-2010/1447
QQUUAALLIITTYY GGUUIIDDEELLIINNEESS FFOORR EENNEERRGGYY SSYYSSTTEEMM SSTTUUDDIIEESS
EEssttiimmaattiinngg CCaarrbboonn DDiiooxxiiddee TTrraannssppoorrtt aanndd SSttoorraaggee CCoossttss

National Energy Technology Laboratory Office of Systems, Analyses, and Planning 2
March 2010
CO2 Transport, Storage & Monitoring Costs Quality Guidelines for Energy Systems Studies
Quality Guidelines for Energy Systems Studies Estimating CO2 Transport, Storage & Monitoring Costs
Background This paper explores the costs associated with geologic sequestration of carbon dioxide (CO2). This cost is often cited at the flat figure of $5-10 per short ton of CO2 removed, but estimates can vary with values as high as $23 per short ton having been published recently [1, 2, 3]. The variability of these costs is due in part to the wide range of transportation and storage options available for CO2 sequestration, but may also relate to the dramatic rise of construction and material costs in the United States which has occurred over the last several years. This paper examines the transportation of CO2 via pipeline to, and storage of that CO2 in, a geologic formation representative of those identified in North America as having storage potential based on data available from the literature.
Approach Geologic sequestration costs were assessed based on the pipeline transport and injection of super-critical CO2 into a geologic reservoir representative of those identified in North America as having storage potential. High pressure (2,200 psig) CO2 is provided by the power plant or energy conversion facility and the cost and energy requirements of compression are assumed by that entity. CO2 is in a super-critical state at this pressure which is desirable for transportation and storage purposes. CO2 exits the pipeline terminus at a pressure of 1,200 psig, and the pipeline diameter was sized for this to be achieved without the need for recompression stages along the pipeline length. This exit pressure specification: (1) ensures that CO2 remains in a supercritical state throughout the length of the pipeline regardless of potential pressure drops due to pipeline elevation change1
; (2) is equivalent to the reservoir pressure – exceeding it after hydrostatic head is accounted for – alleviating the need for recompression at the storage site; and (3) minimizes the pipeline diameter required, and in turn, transport capital cost.
The required pipeline diameter was calculated iteratively by determining the diameter required to achieve a 1,000 psig pressure drop (2,200 psig inlet, 1,200 psig outlet) over the specified pipeline distance, and rounding up to the nearest even sized pipe diameter. The pipeline was sized based on the CO2 output produced by the power plant when it is operating at full capacity (100% utilization factor) rather than the average capacity.
The storage site evaluated is a saline formation at a depth of 4,055 feet (1,236 meters) with a permeability of 22 md and down-hole pressure of 1,220 psig (8.4 MPa) [4].2
This is considered an average storage site and requires roughly one injection well for each 10,300 short tons of CO2 injected per day [4]. An overview of the geologic formation characteristics are shown in Table 1.
Table 1: Deep, Saline Formation Specification [4] Parameter
Units
Average Case
Pressure MPa (psi) 8.4 (1,220) Thickness m (ft) 161 (530) Depth m (ft) 1,236 (4,055) Permeability Md 22 Pipeline Distance km (miles) 80 (50) Injection Rate per Well tonne (short ton) CO2/day 9,360 (10,320)
1 Changes in pipeline elevation can result in pipeline pressure reductions due to head losses, temperature variations or other factors. Therefore a 10% safety margin is maintained to ensure the CO2 supercritical pressure of 1,070 psig is exceeded at all times. 2 “md”, or millidarcy, is a measure of permeability defined as 10-12 Darcy.

National Energy Technology Laboratory Office of Systems, Analyses, and Planning 3
March 2010
CO2 Transport, Storage & Monitoring Costs Quality Guidelines for Energy Systems Studies
Cost Sources & Methodology The cost metrics utilized in this study provide a best estimate of T, S, & M costs for a “typical” sequestration project, and may vary significantly based on variables such as terrain to be crossed by the pipeline, reservoir characteristics, and number of land owners from which sub-surface rights must be acquired. Raw capital and operating costs are derived from detailed cost metrics found in the literature, escalated to June 2007-year dollars using appropriate price indices. These costs were then verified against values quoted by any industrial sources available. Where regulatory uncertainty exists or costs are undefined, such as liability costs and the acquisition of underground pore volume, analogous existing policies were used for representative cost scenarios. The following sections describe the sources and methodology used for each metric. Cost Levelization and Sensitivity Cases Capital costs were levelized over a 30-year period and include both process and project contingency factors. Operating costs were similarly levelized over a 30-year period and a sensitivity analysis was performed to determine the effects of different pipeline lengths on overall and avoided costs as well as the distribution of transport versus storage costs. In several areas, such as Pore Volume Acquisition, Monitoring, and Liability, cost outlays occur over a longer time period, up to 100 years. In these cases a capital fund is established based on the net present value of the cost outlay, and this fund is then levelized as described in the previous paragraph. Following the determination of cost metrics, a range of CO2 sequestration rates and transport distances were assessed to determine cost sensitivity to these parameters. Costs were also assessed in terms of both removed and avoided emissions cost, which requires power plant specific information such as plant efficiency, capacity factor, and emission rates. This paper presents avoided and removed emission costs for both Pulverized Coal (PC) and Integrated Gasification Combined Cycle (IGCC) cases using data from Cases 11 & 12 (Supercritical PC with and without CO2 Capture) and Cases 1 & 2 (GEE Gasifier with and without CO2 Capture) from the Bituminous Baseline Study [5]. Transport Costs CO2 transport costs are broken down into three categories: pipeline costs, related capital expenditures, and O&M costs. Pipeline costs are derived from data published in the Oil and Gas Journal’s (O&GJ) annual Pipeline Economics Report for existing natural gas, oil, and petroleum pipeline project costs from 1991 to 2003. These costs are expected to be analogous to the cost of building a CO2 pipeline, as noted in various studies [4, 6, 7]. The University of California performed a regression analysis to generate the following cost curves from the O&GJ data: (1) Pipeline Materials, (2) Direct Labor, (3) Indirect Costs3
, and (4) Right-of-way acquisition, with each represented as a function of pipeline length and diameter [7].
Related capital expenditures were based on the findings of a previous study funded by DOE/NETL, Carbon Dioxide Sequestration in Saline Formations – Engineering and Economic Assessment [6]. This study utilized a similar basis for pipeline costs (Oil and Gas Journal Pipeline cost data up to the year 2000) but added a CO2 surge tank and pipeline control system to the project. Transport O&M costs were assessed using metrics published in a second DOE/NETL sponsored report entitled Economic Evaluation of CO2 Storage and Sink Enhancement Options [4]. This study was chosen due to the reporting of O&M costs in terms of pipeline length, whereas the other studies mentioned above either (a)
3 Indirect costs are inclusive of surveying, engineering, supervision, contingencies, allowances for funds used during construction, administration and overheads, and regulatory filing fees.

National Energy Technology Laboratory Office of Systems, Analyses, and Planning 4
March 2010
CO2 Transport, Storage & Monitoring Costs Quality Guidelines for Energy Systems Studies
do not report operating costs, or (b) report them in absolute terms for one pipeline, as opposed to as a length- or diameter-based metric. Storage Costs Storage costs were broken down into five categories: (1) Site Screening and Evaluation, (2) Injection Wells, (3) Injection Equipment, (4) O&M Costs, and (5) Pore Volume Acquisition. With the exception of Pore Volume Acquisition, all of the costs were obtained from Economic Evaluation of CO2 Storage and Sink Enhancement Options [4]. These costs include all of the costs associated with determining, developing, and maintaining a CO2 storage location, including site evaluation, well drilling, and the capital equipment required for distributing and injecting CO2. Pore Volume Acquisition costs are the costs associated with acquiring rights to use the sub-surface area where the CO2 will be stored, i.e. the pore space in the geologic formation. These costs were based on recent research by Carnegie Mellon University which examined existing sub-surface rights acquisition as it pertains to natural gas storage [8]. The regulatory uncertainty in this area combined with unknowns regarding the number and type (private or government) of property owners requires a number of “best engineering judgment” decisions to be made, as documented below under Cost Metrics. Liability Protection Liability Protection addresses the fact that if damages are caused by injection and long-term storage of CO2, the injecting party may bear financial liability. Several types of liability protection schemas have been suggested for CO2 storage, including Bonding, Insurance, and Federal Compensation Systems combined with either tort law (as with the Trans-Alaska Pipeline Fund), or with damage caps and preemption, as is used for nuclear energy under the Price Anderson Act [9]. At present, a specific liability regime has yet to be dictated either at a Federal or (to our knowledge) State level. However, certain state governments have enacted legislation which assigns liability to the injecting party, either in perpetuity (Wyoming) or until ten years after the cessation of injection operations, pending reservoir integrity certification, at which time liability is turned over to the state (North Dakota and Louisiana) [10, 11, 12]. In the case of Louisiana, a trust fund of five million dollars is established for each injector over the first ten years (120 months) of injection operations. This fund is then used by the state for CO2 monitoring and, in the event of an at-fault incident, damage payments. This study assumes that a bond must be purchased before injection operations are permitted in order to establish the ability and good will of an injector to address damages where they are deemed liable. A figure of five million dollars was used for the bond based on the Louisiana fund level. This Bond level may be conservative, in that the Louisiana fund covers both liability and monitoring, but that fund also pertains to a certified reservoir where injection operations have ceased, having a reduced risk compared to active operations. This cost may be updated as more specific liability regimes are instituted at the Federal or State levels. The Bond cost was not escalated. Monitoring Costs Monitoring costs were evaluated based on the methodology set forth in the IEA Greenhouse Gas R&D Programme’s Overview of Monitoring Projects for Geologic Storage Projects report [13]. In this scenario, operational monitoring of the CO2 plume occurs over thirty years (during plant operation) and closure monitoring occurs for the following fifty years (for a total of eighty years). Monitoring is via electromagnetic (EM) survey, gravity survey, and periodic seismic survey, EM and gravity surveys are ongoing while seismic survey occurs in years 1, 2, 5, 10, 15, 20, 25, and 30 during the operational period, then in years 40, 50, 60, 70, and 80 after injection ceases.

National Energy Technology Laboratory Office of Systems, Analyses, and Planning 5
March 2010
CO2 Transport, Storage & Monitoring Costs Quality Guidelines for Energy Systems Studies
Cost Metr ics The following sections detail the Transport, Storage, Monitoring, and Liability cost metrics used to determine CO2 sequestration costs for the deep, saline formation described above. The cost escalation indices utilized to bring these metrics to June-2007 year dollars are also described below. Transport Costs The regression analysis performed by the University of California breaks down pipeline costs into four categories: (1) Materials, (2) Labor, (3) Miscellaneous, and (4) Right of Way. The Miscellaneous category is inclusive of costs such as surveying, engineering, supervision, contingencies, allowances, overhead, and filing fees [7]. These cost categories are reported individually as a function of pipeline diameter (in inches) and length (in miles) in Table 2 [7]. The escalated CO2 surge tank and pipeline control system capital costs, as well as the Fixed O&M costs (as a function of pipeline length) are also listed in Table 2. Fixed O&M Costs are reported in terms of dollars per miles of pipeline per year. Storage Costs Storage costs were broken down into five categories: (1) Site Screening and Evaluation, (2) Injection Wells, (3) Injection Equipment, (4) O&M Costs, and (5) Pore Space Acquisition. Additionally, the cost of Liability Protection is also listed here for the sake of simplicity. Several storage costs are evaluated as flat fees, including Site Screening & Evaluation and the Liability Bond required for sequestration to take place. As mentioned in the methodology section above, the site screening and evaluation figure of $4.7 million dollars is derived from Economic Evaluation of CO2 Storage and Sink Enhancement Options [4]. Some sources in
Table 2: Pipeline Cost Breakdown [4, 6, 7]
Cost Type
Units
Cost Pipeline Costs
Materials
$ Diameter (inches),
Length (miles) )960,267.6865.330(85.1$632,64$ 2 +×+×××+ DDL
Labor $
Diameter (inches), Length (miles)
)013,170074,22.343(85.1$627,341$ 2 +×+×××+ DDL
Miscellaneous $
Diameter (inches), Length (miles)
)234,7417,8(58.1$166,150$ +×××+ DL
Right of Way $
Diameter (inches), Length (miles)
)788,29577(20.1$037,48$ +×××+ DL
Other Capital CO2 Surge Tank $ $1,150,636
Pipeline Control System $ $110,632
O&M Fixed O&M $/mile/year $8,632

National Energy Technology Laboratory Office of Systems, Analyses, and Planning 6
March 2010
CO2 Transport, Storage & Monitoring Costs Quality Guidelines for Energy Systems Studies
industry, however, have quoted significantly higher costs for site screening and evaluation, on the magnitude of $100 to $120 million dollars. The higher cost may be reflective of a different criteria utilized in assessing costs, such as a different reservoir size – the reservoir assessed in the higher cost case could be large enough to serve 5 to 7 different injection projects – or uncertainty regarding the success rate in finding a suitable reservoir. Future analyses will examine the sensitivity of overall T, S, and M costs to higher site evaluation costs. Pore Space Acquisition costs are based on acquiring long-term (100-year) lease rights and paying annual rent to land-owners once the CO2 plume has reached their property. Rights are acquired by paying a one-time $500 fee to land-owners before injection begins, as per CMU’s design criteria [8]. When the CO2 plume enters into the area owned by that owner (as determined by annual monitoring), the injector begins paying an annual “rent” of $100 per acre to that owner for the period of up to 100 years from plant start-up [8]. A 3% annual escalation rate is assumed for rental rate over the 100-year rental period [8]. Similar to the CMU study, this study assumes that the plume area will cover rights need to be acquired from 120 landowners, however, a sensitivity analysis found that the overall acquisition costs were not significantly affected by this: increasing the
Table 3: Geologic Storage Costs [4, 8, 11]
Cost Type
Units
Cost Capital
Site Screening and
Evaluation
$ $4,738,488
Injection Wells $/injection well (see formula)1,2,3
depthwelle −×× 0008.0714,240$
Injection Equipment $/injection well (see formula) 2
5.0
#280389,7029,94$
×
×wellsinjectionof
Liability Bond $ $5,000,000 Declining Capital Funds
Pore Space Acquisition $/short ton CO2 $0.334/short ton CO2
O&M
Normal Daily Expenses (Fixed O&M)
$/injection well $11,566
Consumables
(Variable O&M)
$/yr/short ton CO2/day $2,995
Surface Maintenance
(Fixed O&M) see formula
5.0
#280389,7478,23$
×
×wellsinjectionof
Subsurface Maintenance
(Fixed O&M) $/ft-depth/inject. well $7.08
1The units for the “well depth” term in the formula are meters of depth. 2The formulas at right describe the cost per injection well and in each case the number of injection wells should be multiplied the formula in order to determine the overall capital cost. 3The injection well cost is $508,652 per injection well for the 1,236 meter deep geologic reservoir assessed here.

National Energy Technology Laboratory Office of Systems, Analyses, and Planning 7
March 2010
CO2 Transport, Storage & Monitoring Costs Quality Guidelines for Energy Systems Studies
number of owners to 120,000 resulted in a 110% increase in costs and a 1% increase in the overall LCOE of the plant [8]. However, this assumption will be revisited in future work. To ensure that Pore Space Acquisition costs are met after injection ceases, a sinking capital fund is set up to pay for these costs by determining the present value of the costs over the 100-year period (30 years of injection followed by 70 additional years), assuming a 10% discount rate. The size of this fund – as described in Table 3 – is determined by estimating the final size of the underground CO2 plume, based on both the total amount of CO2 injected over the plant lifetime and the reservoir characteristics described in Table 1. After injection, the CO2 plume is assumed to grow by 1% per year [9]. The remaining capital costs are based on the number of injection wells required, which has been calculated to be one injection well for every 10,320 short tons of CO2 injected per day. O&M costs are based on the number of injection wells, the CO2 injection rates, and injection well depth. Monitoring Costs Monitoring costs were evaluated based on the methodology set forth in the IEA Greenhouse Gas R&D Programme’s Overview of Monitoring Projects for Geologic Storage Projects report [13]. In this scenario, operational monitoring of the CO2 plume occurs over thirty years (during plant operation) and closure monitoring occurs for the following fifty years (for a total of eighty years). Monitoring is via electromagnetic (EM) survey, gravity survey, and periodic seismic survey, EM and gravity surveys are ongoing while seismic survey occurs in years 1, 2, 5, 10, 15, 20, 25, and 30 during the operational period, then in years 40, 50, 60, 70, and 80 after injection ceases. Operational and closure monitoring costs are assumed to be proportional to the plume size plus a fixed cost, with closure monitoring costs evaluated at half the value of the operational costs. The CO2 plume is assumed to grow from 18 square kilometers (km2) after the first year to 310 km2 in after the 30th (and final) year of injection. The plume grows by 1% per year thereafter, to a size of 510 km2 after the 80th year [9].The present value of the life-cycle costs is assessed at a 10% discount rate and a capital fund is set up to pay for these costs over the eighty year monitoring cycle. The present value of the capital fund is equivalent to $0.377 per short ton of CO2 to be injected over the operational lifetime of the plant. Cost Escalation Four different cost escalation indices were utilized to escalate costs from the year-dollars they were originally reported in, to June 2007-year dollars. These are the Chemical Engineering Plant Cost Index (CEPI), U.S. Bureau of Labor Statistics (BLS) Producer Price Indices (PPI), Handy-Whitman Index of Public Utility Costs (HWI), and the Gross-Domestic Product (GDP) Chain-type Price Index [14, 15, 16]. Table 4 details which price index was used to escalate each cost metric, as well as the year-dollars the cost was originally reported in. Note that this reporting year is likely to be different that the year the cost estimate is from. Cost Comparisons The capital cost metrics used in this study result in a pipeline cost ranging from $65,000 to $91,000/inch-Diameter/mile for pipeline lengths of 250 and 10 miles (respectively) and 3 to 4 million metric tonnes of CO2 sequestered per year. When project and process contingencies of 30% and 20% (respectively) are taken into account, this range increases to $97,000 to $137,000/inch-Diameter/mile. These costs were compared to contemporary pipeline costs quoted by industry experts such as Kinder-Morgan and Denbury Resources for verification purposes. Table 5 details typical rule-of-thumb costs for various terrains and scenarios as quoted by a representative of Kinder-Morgan at the Spring Coal Fleet Meeting in 2009. As shown, the base NETL cost metric falls midway between the costs quoted for “Flat, Dry” terrain ($50,000/inch-Diameter/mile) and “High Population” or “Marsh, Wetland” terrain ($100,000/inch-Diameter/mile), although the metric is closer to the “High Population” or “Marsh, Wetland” when contingencies are taken into account [17]. These costs were stated to be inclusive of right-of-way (ROW) costs.

National Energy Technology Laboratory Office of Systems, Analyses, and Planning 8
March 2010
CO2 Transport, Storage & Monitoring Costs Quality Guidelines for Energy Systems Studies
Table 4: Summary of Cost Escalation Methodology
Cost Metric
Year-$
Index Utilized Transport Costs
Pipeline Materials 2000 HWI: Steel Distribution Pipe Direct Labor (Pipeline) 2000 HWI: Steel Distribution Pipe Indirect Costs (Pipeline) 2000 BLS: Support Activities for Oil & Gas Operations Right-of-Way (Pipeline) 2000 GDP: Chain-type Price Index CO2 Surge Tank 2000 CEPI: Heat Exchangers & Tanks Pipeline Control System 2000 CEPI: Process Instruments Pipeline O&M (Fixed) 1999 BLS: Support Activities for Oil & Gas Operations
Storage Costs Site Screening/Evaluation 1999 BLS: Drilling Oil & Gas Wells Injection Wells 1999 BLS: Drilling Oil & Gas Wells Injection Equipment 1999 HWI: Steel Distribution Pipe Liability Bond 2008 n/a Pore Space Acquisition 2008 GDP: Chain-type Price Index Normal Daily Expenses (Fixed) 1999 BLS: Support Activities for Oil & Gas Operations Consumables (Variable) 1999 BLS: Support Activities for Oil & Gas Operations Surface Maintenance 1999 BLS: Support Activities for Oil & Gas Operations Subsurface Maintenance 1999 BLS: Support Activities for Oil & Gas Operations
Monitoring Monitoring 2004 BLS: Support Activities for Oil & Gas Operations
Ronald T. Evans of Denbury Resources, Inc. provided a similar outlook, citing pipeline costs as ranging from $55,000/inch-Diameter/mile for a project completed in 2007, $80,000/inch-Diameter/mile for a recently completed pipeline in the Gulf Region (no wetlands or swamps), and $100,000/inch-Diameter/mile for a currently planned pipeline, with route obstacles and terrain issues cited as the reason for the inflated cost of that pipeline [18, 19]. Mr. Evans qualified these figures as escalated due to recent spikes in construction and material costs, quoting pipeline project costs of $30,000/inch-Diameter-mile as recent as 2006 [18, 19]. A second pipeline capital cost comparison was made with metrics published within the 2008 IEA report entitled CO2 Capture and Storage: A key carbon abatement option. This report cites pipeline costs ranging from $22,000/inch-Diameter/mile to $49,000/inch-Diameter/mile (once escalated to December-2006 dollars), between 25% and 66% less than the lowest NETL metric of $65,000/inch-Diameter/mile [20]. The IEA report also presents two sets of flat figure geologic storage costs. The first figure is based on a 2005 Intergovernmental Panel on Climate Change report is similar to the flat figure quoted by other entities, citing
Table 5: Kinder-Morgan Pipeline Cost Metrics [17]
Terrain
Capital Cost
($/inch-Diameter/mile) Flat, Dry $50,000
Mountainous $85,000 Marsh, Wetland $100,000
River $300,000 High Population $100,000
Offshore (150’-200’ depth) $700,000

National Energy Technology Laboratory Office of Systems, Analyses, and Planning 9
March 2010
CO2 Transport, Storage & Monitoring Costs Quality Guidelines for Energy Systems Studies
storage costs ranging from $0.40 to $4.00 per short ton of CO2 removed [20]. This figure is based on sequestration in a saline formation in North America. A second range of costs is also reported, citing CO2 sequestration costs as ranging from $14 to $23 per short ton of CO2 [13]. This range is based on a Monte Carlo analysis of 300 gigatonnes (Gt) of CO2 storage in North America [20]. This analysis is inclusive of all storage options (geologic, enhanced oil recovery, enhanced coal bed methane, etc.), some of which are relatively high cost. This methodology may provide a more accurate cost estimate for large-scale, long-term deployment of CCS, but is a very high estimate for storage options that will be used in the next 50 to 100 years. For example, 300 Gt of storage represents capacity to store CO2 from the next ~150 years of coal generation (2,200 million metric tonnes CO2 per year from coal in 2007, assuming 90% capture from all facilities), meaning that certain high cost reservoirs will not come into play for another 100 or 150 years. This $14 to $23 per short ton estimate was therefore not viewed as a representative comparison to the NETL metric.
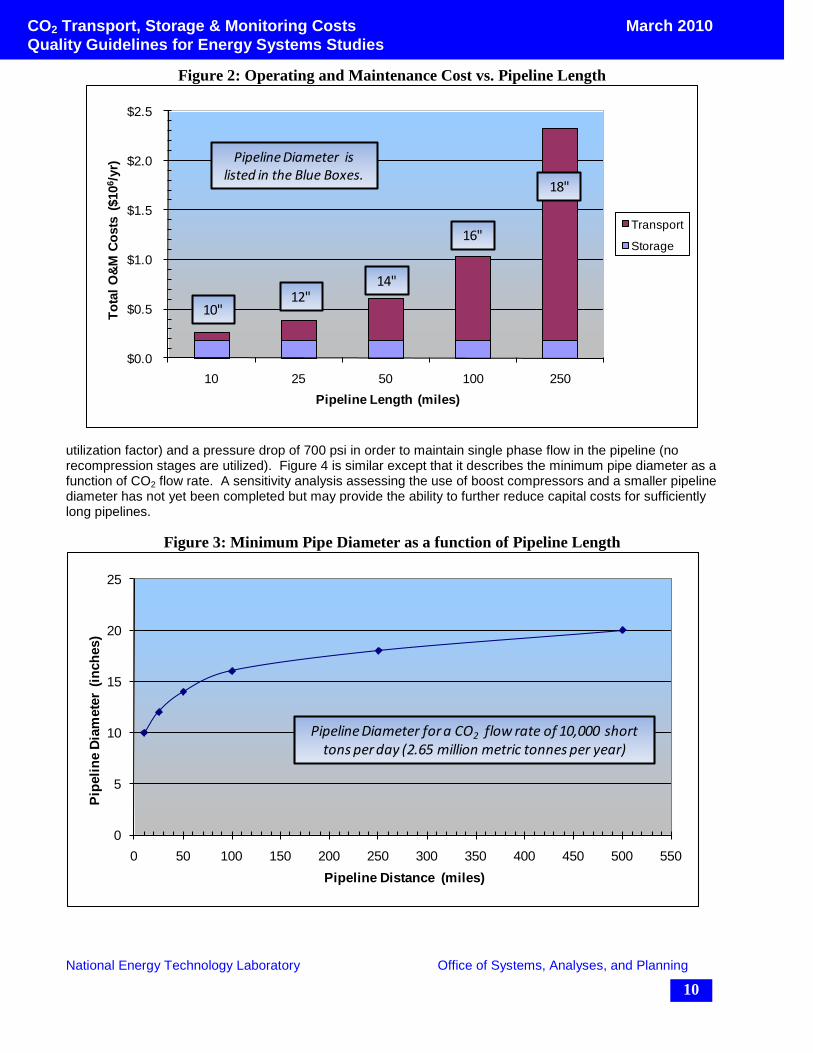
Results Figure 1 describes the capital costs associated with the T&S of 10,000 short tons of CO2 per day (2.65 million metric tonnes per year) for pipelines of varying length. This storage rate requires one injection well and is representative of the CO2 produced by a 380 MWg super-critical pulverized coal power plant, assuming 90% of the CO2 produced by the plant is captured. Figure 2 presents similar information for Fixed, Variable, and total (assuming 100% capacity) operating expenses. In both cases, storage costs remain constant as the CO2 flow rate and reservoir parameters do not change. Also, transport costs – which are dependent on both pipeline length and diameter – constitute the majority of the combined transport and storage costs for pipelines greater than 50 miles in length. The disproportionately high cost of CO2 transport (compared to storage costs) shown in Figures 1 and 2, and the direct dependence of pipeline diameter on the transport capital cost, prompted investigation into the effects of pipeline distance and CO2 flow rate on pipeline diameter. Figure 3 describes the minimum required pipeline diameter as a function of pipeline length, assuming a CO2 flow rate of 10,000 short tons per day (at 100%
Figure 1: Capital Cost vs. Pipeline Length
$0
$100
$200
$300
$400
$500
$600
10 25 50 100 250
Tota
l Pro
ject
Cap
ital
($10
6 )
Pipeline Length (miles)
Monitoring
Transport
Storage
12"14"
16"
18"
Pipeline Diameter is listed in the Blue Boxes.
10"
National Energy Technology Laboratory Office of Systems, Analyses, and Planning 10
March 2010
CO2 Transport, Storage & Monitoring Costs Quality Guidelines for Energy Systems Studies
Figure 2: Operating and Maintenance Cost vs. Pipeline Length
$0.0
$0.5
$1.0
$1.5
$2.0
$2.5
10 25 50 100 250
Tota
l O&M
Cos
ts (
$106
/yr)
Pipeline Length (miles)
Transport
Storage
Pipeline Diameter is listed in the Blue Boxes.
10"12"
14"
16"
18"
utilization factor) and a pressure drop of 700 psi in order to maintain single phase flow in the pipeline (no recompression stages are utilized). Figure 4 is similar except that it describes the minimum pipe diameter as a function of CO2 flow rate. A sensitivity analysis assessing the use of boost compressors and a smaller pipeline diameter has not yet been completed but may provide the ability to further reduce capital costs for sufficiently long pipelines.
Figure 3: Minimum Pipe Diameter as a function of Pipeline Length
0
5
10
15
20
25
0 50 100 150 200 250 300 350 400 450 500 550
Pipe
line
Diam
eter
(in
ches
)
Pipeline Distance (miles)
Pipeline Diameter for a CO2 flow rate of 10,000 short tons per day (2.65 million metric tonnes per year)

National Energy Technology Laboratory Office of Systems, Analyses, and Planning 11
March 2010
CO2 Transport, Storage & Monitoring Costs Quality Guidelines for Energy Systems Studies
Figure 4: Pipe Diameter as a Function of CO2 Flow Rate
0
5
10
15
20
25
- 5,000 10,000 15,000 20,000 25,000 30,000
Pipe
line
Diam
eter
(in
ches
)
CO2 Flowrate (short tons/day)
Pipeline Diameter for a 50 mile long Pipeline
Figures 5 and 6 describe the relationship of T&S costs to the flow rate of CO2. The costs are evaluated for a 50 mile pipeline and a 700 psig CO2 pressure drop over the length of the pipeline. Storage capital costs remain constant up until 10,000 short tons of CO2 per day, above which a second injection well is needed and the cost increases as shown in Figure 5. A third injection well is needed for flow rates above 21,000 short tons per day and the capital requirement increases again for the 25,000 short tons per day flow rate due to an increase in pipeline diameter. Transport capital costs outweigh storage costs for all cases, as expected based on the results shown in Figure 1. Unlike storage capital costs, the operating costs for storage constitute a significant portion of the total annual O&M costs – up to 44% at 25,000 short tons of CO2 per day – as shown in Figure 6. Transport operating costs are constant with flow rate based on a constant pipeline length.
Figure 5: Capital Requirement vs. CO2 Flow Rate
$0
$50
$100
$150
$200
$250
2,500 5,000 10,000 15,000 25,000
Tota
l Pro
ject
Cap
ital
($10
6 )
CO2 Flowrate (short tons/day)
Monitoring
Transport
Storage
Capital Costs for a 50 mile long Pipeline

National Energy Technology Laboratory Office of Systems, Analyses, and Planning 12
March 2010
CO2 Transport, Storage & Monitoring Costs Quality Guidelines for Energy Systems Studies
Figure 6: Operating and Maintenance Cost vs. CO2 Flow Rate
$0.0
$0.1
$0.2
$0.3
$0.4
$0.5
$0.6
$0.7
$0.8
$0.9
2,500 5,000 10,000 15,000 25,000
Tota
l O&M
Cos
ts (
$106
/yr)
CO2 Flowrate (short tons/day)
Transport
Storage
O&M Costs for a 50 mile long Pipeline
Lastly, CO2 avoidance and removal costs associated with T&S were determined for PC and IGCC reference plants found in the Baseline Study.4
Because the CO2 flow rate is defined by the reference plant, costs were determined as a function of pipeline length. Figure 7 shows that T&S avoided costs increase almost linearly with pipeline length and that there is very little difference between the PC and IGCC cases. This is the result of identical pipelines for each case (same distance, identical diameter) with only a change in capacity factor for each case. Figure 8 is similar to Figure 7 and shows the T&S removed emission cost.
Figure 7: Avoided Emission Costs for 550 MW Power Plants vs. Pipeline Length
$0
$10
$20
$30
$40
$50
$60
$70
$80
0 100 200 300 400 500 600
Avoi
ded
Emis
sion
Cos
t ($
/sho
rt t
on C
O2)
Pipeline Length (miles)
IGCC
PC
4 Avoided cost calculations are based upon a levelized cost of electricity reported in Volume 1 of NETL’s Cost and Performance Baseline for Fossil Energy Plants study. Electricity costs are levelized over a 30 year period, utilize a capital charge factor of 0.175, and levelization factors of 1.2022 and 1.1568 for coal costs and general O&M costs, respectively [3].

National Energy Technology Laboratory Office of Systems, Analyses, and Planning 13
March 2010
CO2 Transport, Storage & Monitoring Costs Quality Guidelines for Energy Systems Studies
Addressing our initial topic, we see that our T&S avoided emission cost of $5 to $10 per short ton of CO2 is associated with a pipeline length of 30 to 75 miles for the reference reservoir and our IGCC reference plant, or 50 to 95 miles for our PC reference plant. The T&S removal cost of $5 to $10 per short ton of CO2 is associated with a pipeline length of 40 to 100 miles for an IGCC and 40 to 115 for a PC plant. Both of these ranges apply to the reference reservoir found in Table 1. Figure 8: Removed Emission Costs for 550 MW Power Plants vs. Pipeline Length
$0
$10
$20
$30
$40
$50
$60
0 100 200 300 400 500 600
Rem
oved
Em
issi
on C
ost
($/s
hort
ton
CO2)
Pipeline Length (miles)
IGCC
PC
Conclusions
• T&S avoided emission cost of $5 to $10 per short ton of CO2 is associated with a pipeline length of 30 to 75 miles for our reference IGCC plant and the reference reservoir found in Table 1, or pipeline lengths of 50 to 95 miles for the PC plant.
• T&S removed emission cost of $5 to $10 per short ton of CO2 is associated with a pipeline length of 40
to 100 miles for an IGCC and 40 to 115 for a PC plant. Both of these ranges apply to the reference reservoir found in Table 1.
• Capital costs associated with CO2 storage become negligible compared to the cost of transport (i.e.
pipeline cost) for pipelines of 50 miles or greater in length.
• Transport and storage operating costs are roughly equivalent for a 25 mile pipeline but transport constitutes a much greater portion of operating expenses at longer pipeline lengths.
• Transport capital requirements outweigh storage costs, independent of CO2 flow rate, at a pipeline
length of 50 miles and the reference reservoir.
• Operating expenses associated with storage approach transport operating costs for flow rates of 25,000 short tons of CO2 per day at a 50 mile pipeline length.

National Energy Technology Laboratory Office of Systems, Analyses, and Planning 14
March 2010
CO2 Transport, Storage & Monitoring Costs Quality Guidelines for Energy Systems Studies
Future Work This paper has identified a number of areas for investigation in future work. These include:
• Investigation into the apparent wide variability in site characterization and evaluation costs, including a sensitivity analysis to be performed to determine the sensitivity of overall project costs across the reported range of values.
• Continued research into liability costs and requirements.
• Further evaluation and sensitivity analysis into the number of land-owners pore space rights will have to be acquired from for a given sequestration project.

National Energy Technology Laboratory Office of Systems, Analyses, and Planning 15
March 2010
CO2 Transport, Storage & Monitoring Costs Quality Guidelines for Energy Systems Studies
References 1. CCS GUIDELINES: Guidelines for Carbon Dioxide Capture, Transport, and Storage, World Resources
Institute, Washington DC, 2008. 2. The Future of Coal: Options for a Carbon-Constrained World. J. Katzer, et al, Massachusetts Institute
of Technology, 2007. 3. Ken Hnottavange-Telleen, “CCS: Global Hurdles, Additional Investment and Costs for a CTL Unit,”
World CTL Conference, Washington, DC, March 27th, 2009. 4. Economic Evaluation of CO2 Storage and Sink Enhancement Options, Tennessee Valley Authority,
NETL, EPRI, December 2002. 5. Cost and Performance Baseline for Fossil Energy Plants: Volume 1: Bituminous Coal and Natural Gas
to Electricity. Prepared by Research and Development Solutions, LLC for US DOE/NETL. Pittsburgh, PA, May 2007.
6. Carbon Dioxide Sequestration in Saline Formations – Engineering and Economic Assessment. Prepared by Battelle for US DOE/NETL. Morgantown, WV, July 2001.
7. Using Natural Gas Transmission Pipeline Costs to Estimate Hydrogen Pipeline Costs. N. Parker, Institute of Transportation Studies, University of California, Davis, CA, 2004.
8. Implications of Compensating Property-Owners for Geologic Sequestration of CO2. Gresham, R. L., Apt, J., et. al, Department of Engineering and Public Policy, Carnegie Mellon University, Pittsburgh, PA, 2009.
9. “Climate Change and Carbon Sequestration: Assessing a Liability Regime for Long-Term Storage of Carbon Dioxide”. Klass, A.B., Wilson, E.J., 58 Emory Law Journal 103 (2008).
10. Senate Bill No. 2095, 61st Legislative Assembly of North Dakota, January 6th, 2009. 11. House Bill No. 661, Louisiana House of Representatives Regular Session, 2009. 12. Enrolled Act No. 20 (Original House Bill No. 58), 60th Legislature of the State of Wyoming, General
Session, 2009. 13. Overview of Monitoring Requirements for Geologic Storage Projects. IEA Greenhouse Gas R&D
Programme, Report Number PH4/29, November 2004. 14. Handy-Whitman Index of Public Utility Costs, Gas Transmission and Distribution Pipe Materials
Indexes, February 2008. 15. U.S. Bureau of Labor Statistics Producer Price Index, Support activities for oil and gas operations,
Series Id: PCU213112213112, February 2008. 16. U.S. Bureau of Labor Statistics Producer Price Index, Drilling Oil and Gas Wells, Series
Id: PCU213111213111, February 2008. 17. Jeffrey Layne, “Operating Experience with CO2 Pipelines,” Proceedings of the EPRI Coal Fleet for
Tomorrow: General Technical Meeting, Houston, TX, April 21-23rd, 2009. 18. Statement of Ronald T. Evans of Denbury Resources, Inc., before the U.S. Senate Committee on
Energy and Natural Resources. Hearing on the Policy Aspects of Carbon Capture, Transportation, and Sequestration and Related Bills, S.2323 and S.2144, January 31, 2008. http://energy.senate.gov/public/index.cfm?FuseAction=Hearings.Testimony&Hearing_ID=1672&Witness_ID=4847
19. Personal communication with Ronald T. Evans of Denbury Resources, Inc. December 30th, 2009. 20. CO2 Capture and Storage: A key carbon abatement option, International Energy Agency, Paris France,
2008. 21. “CO2 Flow Modeling and Pipe Diameter Determination”, Jared P. Ciferno, Howard McIlvried, SAIC,
February 2003.

March 2010
Contacts Thomas J. Tarka, P.E. Senior Energy Systems Engineer Office of Systems, Analyses & Planning National Energy Technology Laboratory 626 Cochrans Mill Road P.O. Box 10940 Pittsburgh, PA 15236 412-386-5434 [email protected]
John G. Wimer Director, Systems Division Office of Systems, Analyses & Planning National Energy Technology Laboratory 3601 Collins Ferry Road P.O. Box 880 Morgantown, WV 26507 304-285-4124 [email protected]