qatar‘s ict landscape 2014 - ningapi.ning.com/.../qatarsictlandscapereport2014househ… · ·...
TRANSCRIPT

QATAR‘SICTLANDSCAPE2014Households and Individuals

Qatar’s ICT Landscape 2014 Households and Individuals 1
FO R E WO R D 2
E x E c u t i v E S u m m a Ry 4
B ac kg R O u n D 7
Qata R S E g m E n tat i O n m O D E l 9
ICT IN QATAR 13
i c t D E v i c E P E n E t R at i O n 14
i n t E R n E t cO n n E c t i v i t y 17
i c t u Sag E a n D S P E n D i n g 19
Sat i S Fac t i O n W i t h m O B i l E a n D i n t E R n E t S E Rv i c E S 23
FoCus AReAs 27
S O c i a l n E t WO R k i n g a n D a R a B cO n t E n t O n l i n E 28
O n - l i n E B a n k i n g a n D E - cO m m E R c E 31
E - g Ov E R n m E n t 34
Q - P O St S E Rv i c E S 36
O n l i n E S E c u R i t y a n D P R i vac y 37
n E W S E Rv i c E S 40
cO n c lu S i O n 42
APPeNDIX 45
R E S E a R c h m E t h O D O lO gy 46
g lO SSa Ry 49
D E F i n i t i O n S 50
TABLE OF CONTENTS
Qatar’s ICT Landscape 2014 Households and Individuals2
over the past decade, Qatar has made great strides in building an advanced ict sector
that will benefit all sectors of society. the newly released World Economic Forum’s Global
Technology Report 2014 reaffirms the country’s place as one of the middle East’s—and the
world’s—most “networked ready” nations. the substantial investment in building a world-
class ict infrastructure with the capacity and speed to set the country apart in the region
and around the world is one of the main reasons for Qatar’s success.
as the pages of this report reveal, significant advances continue to be made by households
and individuals on most ict indicators since we started to survey Qatar’s ict landscape in
2008. Broad ict access has been achieved in Qatar, with all segments of the resident popu-
lation having access to internet-enabled ict devices. For the mainstream population, the
penetration of mobile phones and laptops has grown significantly, and ownership of mature
devices such as smartphones and tablets has also increased. the use of basic online services
such as email, internet browsing, and social networking is prevalent across all segments
of society, and people across the education spectrum access social networking, voiP, and
other basic internet services.
in spite of our achievements in such a short period of time, there are still areas where Qatar
can improve—in order to move to the next level of ict maturity. these improvements include
increasing the penetration of newer devices such as smartphones and tablets, particularly
in specific demographic segments like the transient labor population; expanding the use of
advanced online services such as e-commerce, e-banking, and e-government; and improv-
ing mobile broadband penetration to meet the rapidly growing need among consumers in
Qatar to be able to log on to the internet on-the-go “anytime, anywhere.” Qatar is in line
with the global trend of people demanding more mobility in their connectivity options.
FOREWORD
Qatar’s ICT Landscape 2014 Households and Individuals 3
to accomplish this, the ministry of information and communications technology will main-
tain its support of healthy telecom competition as it transitions to an independent telecom-
munications regulatory authority that will encourage and support an open and competitive
ict sector. We will continue to implement our national Broadband Plan to guarantee that
fixed and mobile infrastructures are deployed in the most effective and rapid manner. We
will expand the benefits of broadband not only by providing for and investing in extensive
and high-quality infrastructure but also by increasing the supply of broadband content and
services, which will, in turn, drive usage. We will bolster initiatives related to youth work-
force training and readiness. We will address digital literacy, affordability, quality of service,
awareness, and safety barriers, explicitly targeting 100 percent coverage with speeds of at
least 8 mbps in areas where transient workers live, reflecting Qatar’s ongoing commitment
to diversity and workers’ rights. We will build awareness of Qatar’s new telecommunications
consumer Protection Policy to ensure that consumers know their rights and responsibili-
ties in their dealings with service providers. and we are accelerating Qatar’s e-government
initiatives through a ministry-wide master plan designed to improve and add new e-govern-
ment services and make government more efficient and customer-centric.
this new research not only shows that our current programs and policies are working, it
also offers a blueprint for where we need to go—as well as insight into what we must do to
get there.
Dr. Hessa sultan Al-Jaber
Minister of Information and Communications Technology
Qatar’s ict landscape 2014 households and individuals4
atar’s ICT Landscape 2014: Households
and Individuals examines the ICT access and usage
behaviors and patterns of residents in Qatar. It is based
on an annual study that enables the Ministry of Infor-
mation and Communications Technology (ictQATAR)
to measure progress toward its overall ICT goals, as
well as to frame relevant new policies and programs
and report core ICT indicators to international organi-
zations.
Qatar has made significant advances in ICT develop-
ment over the past decade, and this report dem-
onstrates further progress. The levels of access and
usage of ICT in Qatar are high, with the country ranked
32nd and 26th (among 157 countries) in those cat-
egories, respectively, and an overall ranking of 31, on
the ICT Development Index in ITU’s 2013 Measuring
the Information Society report. Qatar has achieved
mobile subscription phone coverage above 100
percent, and Internet and broadband services are
growing as well. According to the 2013 households
and individuals survey results, 85 percent of the over-
all population in Qatar now has access to the Internet,
compared to 38 percent in 2008. The country is likely
to observe an additional uptick in broadband services
as aggressive plans to establish a robust infrastructure
and new initiatives continue to be implemented.
ExECuTivE SummARy
Specifically, the survey findings indicate that all
segments of Qatar’s resident population have ac-
cess to Internet-enabled ICT devices. While mature
devices including mobile phones are accessed by
nearly 100 percent of the population, newer devices
like smartphones and tablets have yet to penetrate
fully—particularly in segments such as the transient
labor population. In addition, the use of basic online
services such as email, Internet browsing, social
networking, and peer-to-peer file sharing is prevalent
across all segments of society; however, advanced
online services such as e-commerce, online bank-
ing, and transactional e-government services are
employed much more frequently among people with
higher levels of education, as well as among Qataris
and Westerners.
For the mainstream population, ownership of ICT
devices such as mobile phones and laptops has
grown significantly. In 2013, a household in Qatar had
approximately nine mobile phones, on average, com-
pared to nearly four in 2012. Laptop ownership also
increased from 2 to 3.2 laptops per household over
the same time period, while the growth in desktops
has been relatively flat due to the mounting demand
for mobility.

Qatar’s ict landscape 2014 households and individuals 5
Moving forward, the implementation of Qatar’s first
National Broadband Plan, released in 2013 with the
objective to promote broadband infrastructure de-
ployment and market development, should result in an
increase and improvement in broadband services. In
particular, the plan targets the speed and affordability
of both fixed and mobile broadband for consumers
and businesses as challenges to overcome.
In addition, to meet the increasing demand for
faster and more secure networks and with the aim of
boosting overall ICT access, ictQATAR continues to
work with telecommunication operators to build an
advanced FTTH (fiber-to-the-home) network that will
enable universal access to high-speed broadband.
In analyzing the ICT landscape survey results across
households and individuals in Qatar from current and
past years, three themes emerge, all cornerstones of
ICT development in the country.
mOving FROm accESS tO
aDvancED uSagE
The first is the ongoing transition from general ac-
cess to ICT devices and technologies to the use of
advanced online services. Usage of portable devices
such as laptops, tablet computers, and smartphones
among the overall population has increased. As men-
tioned above, mobile phones are now used by nearly
100 percent of the population, while smartphone
penetration stands at 65 percent; the penetration of
laptops also increased from 83 percent in 2012 to 93
percent in 2013. And the penetration of tablets tripled
over the same time period, from 10 percent in 2012 to
29 percent in 2013. Fifty-two percent of Qataris con-
nected to the Internet used a tablet computer in 2013,
compared to just 32 percent in 2012.
On the other hand, ICT usage is currently focused on
basic services, with nearly 100 percent of the overall
population using mobile phones for telephone calls
and SMS. Eighty-three percent of people use the
Internet for email services, and 93 percent of the
Internet users log on to various social networking plat-
forms. However, only 18 percent of the overall population
in Qatar uses Internet banking, with 15 percent
using the Internet for e-commerce. Thus, while the
households and individuals study shows that broad
ICT access has almost been achieved in Qatar, there is
still much room for improvement when it comes to the
sort of advanced usage that will drive future innova-
tion and economic success.
cOnnEctivity On-thE-gO,
anytimE, anyWhERE
The second persistent theme is connectivity on-the-
go. With the increased penetration of mobile phones
and laptops and greater acceptance of mobile
broadband as a medium to connect to the Internet,
the “need to be mobile” is on the rise in Qatar. Eighty-
five percent of the Internet users in Qatar use a laptop
and 71 percent a smartphone to get online. For laptop
use, the preferred mode of connection is wireless
LAN because of the convenience. With the increase
in smartphone penetration, the demand for mobile
broadband has also skyrocketed. According to the
survey, among households connected to the Internet
mobile broadband penetration now stands at 61
percent, compared with fixed broadband connectivity
at 94 percent. Qatar is in line with the global trend of
people demanding more mobility in their connectivity
options. The “on-the-go” usability of today’s devices
allows people to access online services anytime and
from any location, and consumers in Qatar increasing-
ly need and want the ability to log on to the Internet
“anytime, anywhere.”
intERnEt iS FOR EvERyOnE
A common perception is that the Internet is ac-
cessed solely by people with more education, with
less educated people forgoing the use of any online
services.1 However, the data from the households
and individuals survey negates this hypothesis, as the
results clearly show that people across the education
spectrum access social networking, VoIP, and other
basic Internet services. Social networking was, in fact,
used by almost 93 percent of respondents who are
active online.
[While] the households and individuals study shows that broad ICT access has almost been achieved in Qatar, there is still much room for improvement when it comes to the sort of advanced usage that will drive future innovation and economic success.
1 For this study’s analysis, people with secondary-level education or less are classified as “less educated,” while those with education beyond the second-ary level are classified as “more educated.”
Qatar’s ict landscape 2014 households and individuals6
Still, the data does show that as education levels
increase there is a shift toward using advanced online
services, with 22 percent of respondents whose edu-
cation is above the secondary level using e-commerce
in the past 12 months, compared with just 6.2 percent
of those with secondary education or less. In addition,
improvement in education level corresponds to a re-
duction in concerns about online security and threats.
Six aREaS OF in-DEPth StuDy
For the purposes of the households and individuals
survey, six areas of interest were identified for more
in-depth study: social networking, e-commerce, e-
government, online postal services offered by national
provider Q-Post, online privacy and security, and new
online services. The survey results captured the main
trends in each of these focus areas:
n 87% of Internet users access social networking at
least once a month in Qatar, an increase over prior
years.
n Penetration levels in advanced services such as
online banking and e-commerce are low, especially
among non-Westerners, with 44% of those who did
not use such services in the past year reporting that
they are concerned about the security of online por-
tals, 26% worried about having “no control,” and 31%
believing the process is too technical.
n In terms of e-government, the findings show that
55 percent of the overall population is aware of online
services, although only 16 percent used them in the
past year. Qualitative findings suggest that interaction
with the government could be handled more effective-
ly face-to-face rather than online.
n 88% of the population has not used Q-Post in the
past year, while nearly half of those who have not used
it were not aware and not interested in knowing about
Q-Post online services, as people are satisfied using
global private courier services such as DHL and Ara-
mex. Due to widespread negative perceptions about
Q-Post’s dependability, reliability, and convenience,
there is a general lack of awareness and willingness to
learn about Q-Post’s online services.
n 38% of Internet users are concerned about the lack
of privacy online, while 30% are concerned about
using services such as online banking.
n A growing interest in all mobile-based services
emerged from the survey. It’s clear that Qatari resi-
dents are willing to experiment with offerings such as
mobile wallet and mobile money transfer, providing
an opportunity for the development of additional
advanced online services.
challEngES
While it highlights many positive ICT-related devel-
opments, the households and individuals study also
identifies some key barriers to be addressed. For
instance, one of the major impediments to achieving a
true information-based society is the lack of advanced
ICT skills and knowledge among the population. The
digital literacy and IT skills programs that are currently
being implemented by the Ministry should go a long
way toward mitigating this problem.
Mirroring past studies, online security concerns
continue to be a major obstacle to widespread usage.
The continued education of consumers on the various
ways to safeguard themselves against cyber threats—
along with further institutional measures taken by
banks, corporations, the government, and others—
should over time ease such concerns.
Finally, most people in Qatar lack awareness about e-
government services. Better customer experience and
more value-added services, which are being planned
as part of the e-Government 2020 strategy, are likely
to help increase both awareness and usage.

Qatar’s ICT Landscape 2014 Households and Individuals 7
In the last decade, Qatar has been recognized as
a forerunner in ICT development in the region, and is
well on its way to becoming a global leader in this area
as well. Currently, the country leads the Arab world on
the World Economic Forum’s (WEF) 2014 Networked
Readiness Index, and ranks 31st overall out of the 157
countries on International Telecommunication Union’s
(ITU) 2013 ICT Development Index.
Qatar’s economic indicators reflect a strong founda-
tion for future economic growth. According to the
Qatar Statistics Authority (QSA), the real GDP of Qatar
has reached QAR 341 bn as of the end 2012. And the
WEF Global Competitiveness Report 2013 lists Qatar’s
GDP per capita at USD 99,731, one of the highest
in the world, and ranks the country 13th overall out
of 148 countries and first in the region on its Global
Competitiveness Index, reaffirming Qatar’s position as
the most competitive economy in the Middle East.
According to the ITU’s 2013 Measuring the Information
Society report, the country has the highest proportion
of households with a computer in the Middle East at
more than 90 percent, as well as the highest percent-
age of households with Internet access region-wide
at 88 per cent. Qatar’s best score is on the ICT use
sub-index (26th globally), putting it on par with world
ICT leaders.
In order to monitor Qatar’s continuing progress to-
ward becoming a vibrant knowledge-based economy,
in 2013 the Ministry of Information and Communica-
tions Technology (ictQATAR) commissioned Ericsson
ConsumerLab to conduct a large-scale study of ICT
penetration and usage among individuals and house-
holds in Qatar, following similar projects that have
taken place since 2008.
BACKGROuND
This resulting report, Qatar’s ICT Landscape Report
2014: Households and Individuals, focuses on the ICT
penetration, usage patterns, and behavior of residents
of Qatar. The research was divided into two phases:
Phase I was qualitative evaluation to explore current
attitudes toward technology and changes in behavior
as a result of ICT penetration and usage, with the goal
of identifying current drivers of and barriers to usage;
Phase II was quantitative research to augment the
findings of Phase I. A survey was conducted in this
phase, for which 2,207 people were interviewed. (For
further details on methodology, including definitions
of terms, see the Appendix [page 45]).
The population sample chosen for this report is rep-
resentative of the current population in Qatar (age 15
and older), including a mix of genders, nationalities,
ages, and geographic locations. Qatar, like most GCC
countries, has attracted a large number of expatriate
workers in recent years, including a large base of tran-
sient laborers. Further, for the purposes of this study,
the population of Qatar is divided into “mainstream”
and “overall”—with the mainstream population
excluding transient laborers.
In order to get as full a picture of technology usage
in Qatar as possible, the study results were analyzed
on both an individual and a household level, which
accounts for the fact that even if digital devices or
services are available in a home, it does not mean that
each and every individual is using them.
Due to the fact that Qatar’s population is cosmopoli-
tan, and includes people of different nationalities,
cultural beliefs, and attitudes, and varying economic
backgrounds, it is important to understand the needs
Qatar’s ICT Landscape 2014 Households and Individuals8
and expectations of each group individually. There-
fore, one of the main objectives of the households
and individuals study was to segment the population
by values and attitudes toward technology, as well as
current interaction with ICT. To that end, the resident
population of Qatar was divided into 10 segments:
1. young Qataris (15–34)
2. mid-Range adult/Older Qataris (35 and over)
3. Westerners
4. White-collar Expat arabs, technology
interested
5. White-collar Expat arabs, technology neutral
6. White-collar asians, technology interested
7. White-collar asians, technology neutral
8. non-Qataris, Blue collar (non-Shared
accommodation)
9. non-Qataris, Blue collar (Shared
accommodation)
10. transient laborers
The segmentation analysis is a critical tool that enables
ictQATAR to identify specific groups that continue to
lag behind when it comes to ICT access and usage.
It is also helpful when it comes to understanding the
needs of various segments with high exposure to ICT.

Qatar’s ICT Landscape 2014 Households and Individuals 9
QATAR SEGmENTATiON mODEL
The population in Qatar, as of September 2013, is
estimated at approximately 2 million, of which close to
80 percent are men. This is due to the large migrating
workforce, which mainly comprises males. The popula-
tion in Qatar also includes a significant number of expa-
triates, both Arabs and non-Arabs. And the population
is young: 25- to 34-year-olds make up more than a
third of the population. See Figure 1 for a breakdown of
the population by age and gender.
Qatar today is modernizing and making its mark on the
global map while conserving its traditional values at
the same time. The findings of the qualitative research
show a split between the younger and older segments
of the country’s population—younger Qataris are more
accepting of the changes, whereas the older genera-
tion often maintains a more skeptical outlook about
the pace of change. Qataris look to the government to
maintain a balance between the modern and the tra-
ditional ways of life. The age divide is even more pro-
nounced when one looks at the various personal values
and attitudes captured by the qualitative research. The
analysis was done using basic moral parameters, and
included technology-specific aspects, to draw a profile
of the population’s attitudes toward technology.
The research shows that when it comes to values
pertaining to social responsibility, people in Qatar rate
honesty to be the most important. They also want a
society that is humane and conducive to creative ideas.
Interpersonal ties are still very strong, and although
there is an increase in the importance of women in the
society, people prefer the traditional gender roles.
Value systems are reflected in attitudes toward
technology, and Qatar’s residents can be grouped
into four categories. The first group includes people
who prefer having the latest technology at their
disposal as a way of life, boosting their confidence
and self-image. The second group consists of people
Figure 1QATAR’S POPULATION SPLIT, BY AGE AND GENDER
10.2%
4.2%
32.5%
7.3%
Source: Qatar Statistics Authority
20.2%
5.2%
11.7%
2.6%
4.3%
0.9%
0.7%0.2%
15–24 years
25–34 years
35–44 years
MALE
45–54 years
55–64 years
Over 65 years
FEMALE
Qatar’s ICT Landscape 2014 Households and Individuals10
who are content with having access to the Internet at
most times. For these people, developing Internet
skills is of high importance. They are skilled at using
the Internet on their mobiles and enjoy the experience
of being connected with others at all times. Thus, for
them, having a high-speed, reliable connection is
important, and they are willing to pay a premium for
it. The third group is driven primarily by the desire to
have the latest news and updates from around the
world, whenever they choose. For them, knowledge
is the key to being successful, and they need to have
Internet access at all times. The tech skeptics form the
fourth category. They are not willing to spend money
on technology, believe they are able to manage with
what they already have, and are not technologically
proficient.
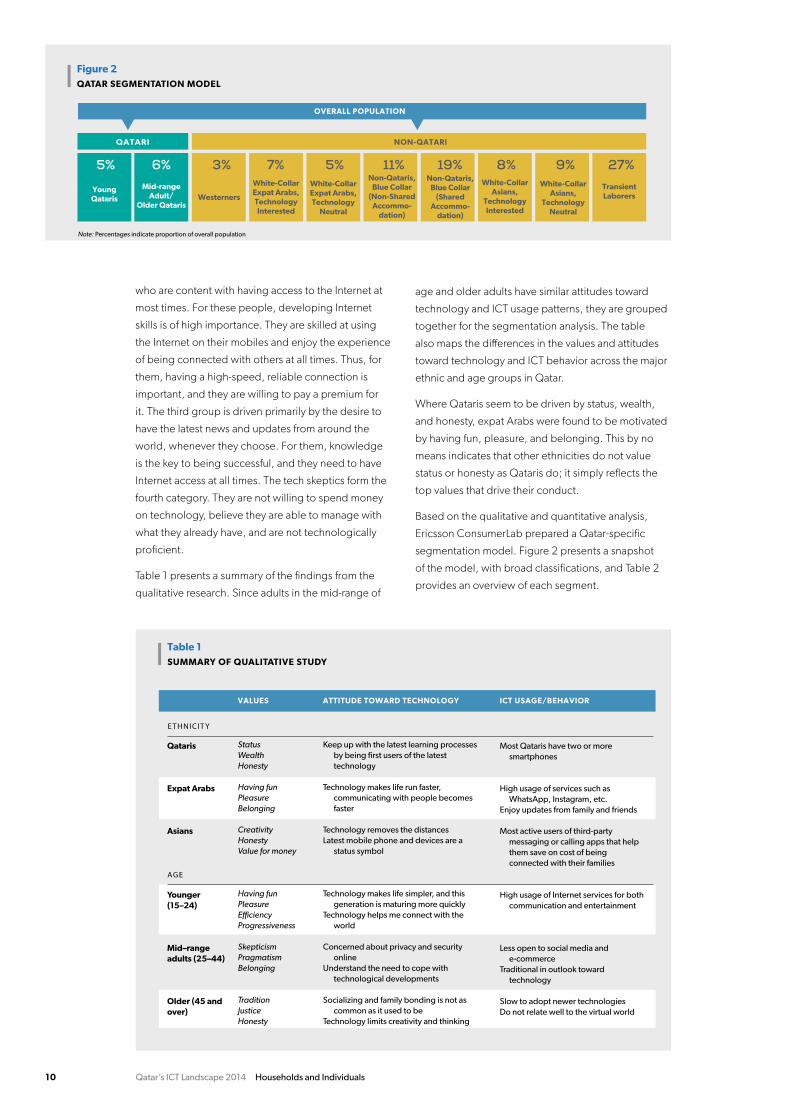
Table 1 presents a summary of the findings from the
qualitative research. Since adults in the mid-range of
age and older adults have similar attitudes toward
technology and ICT usage patterns, they are grouped
together for the segmentation analysis. The table
also maps the differences in the values and attitudes
toward technology and ICT behavior across the major
ethnic and age groups in Qatar.
Where Qataris seem to be driven by status, wealth,
and honesty, expat Arabs were found to be motivated
by having fun, pleasure, and belonging. This by no
means indicates that other ethnicities do not value
status or honesty as Qataris do; it simply reflects the
top values that drive their conduct.
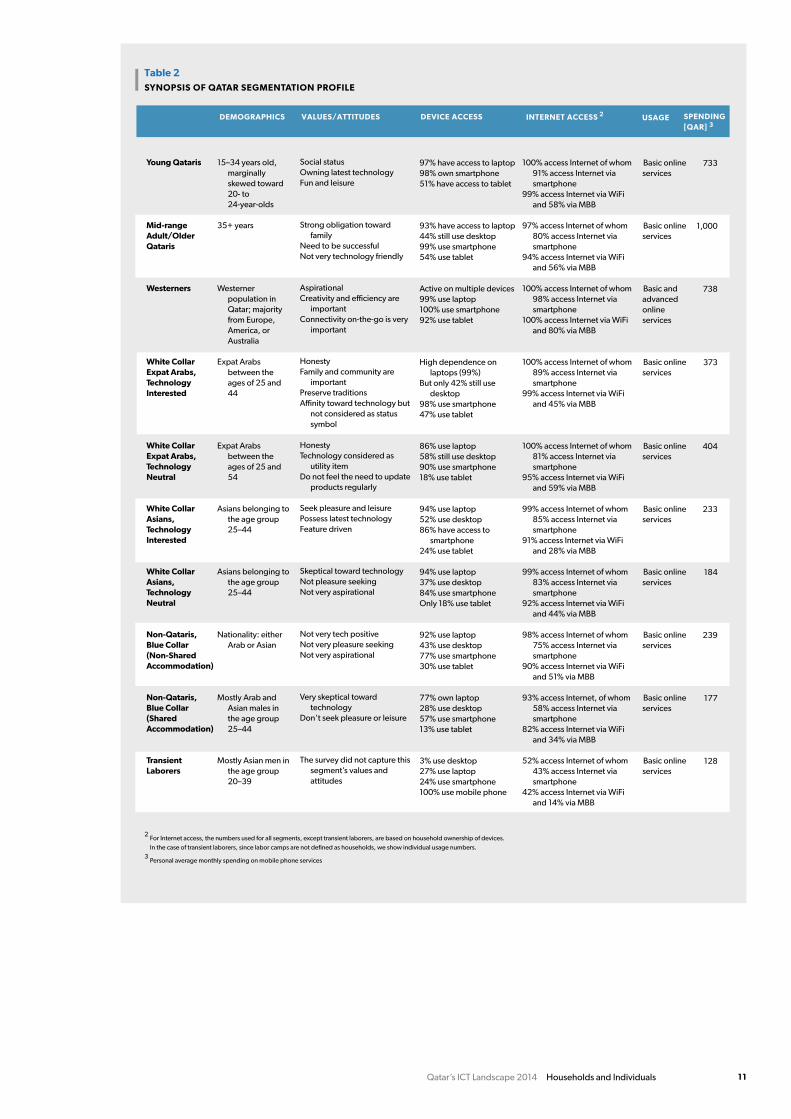
Based on the qualitative and quantitative analysis,
Ericsson ConsumerLab prepared a Qatar-specific
segmentation model. Figure 2 presents a snapshot
of the model, with broad classifications, and Table 2
provides an overview of each segment.
Figure 2QATAR SEGMENTATION MODEL
OVERALL POPULATION
QATARI NON-QATARI
Note: Percentages indicate proportion of overall population
Westerners
5% 6% 3% 7% 5% 11% 19% 8% 9% 27%Transient Laborers
Non-Qataris,Blue Collar
(Non-Shared Accommo-
dation)
White-Collar Asians,
Technology Neutral
White-Collar Asians,
Technology Interested
White-Collar Expat Arabs, Technology
Neutral
White-Collar Expat Arabs, Technology Interested
Mid-range Adult/
Older Qataris
Young Qataris
Non-Qataris, Blue Collar
(Shared Accommo-
dation)
Table 1SUMMARY OF QUALITATIVE STUDY
Most Qataris have two or more smartphones
High usage of services such as WhatsApp, Instagram, etc.
Enjoy updates from family and friends
Most active users of third-party messaging or calling apps that help them save on cost of being connected with their families
High usage of Internet services for both communication and entertainment
Less open to social media and e-commerce
Traditional in outlook toward technology
Slow to adopt newer technologiesDo not relate well to the virtual world
VALUES ATTITUDE TOWARD TECHNOLOGY ICT USAGE/BEHAVIOR
Qataris
Expat Arabs
Asians
Younger (15–24)
Mid–range adults (25–44)
Older (45 and over)
StatusWealth Honesty
Having funPleasureBelonging
Creativity HonestyValue for money
Having funPleasureEfficiency Progressiveness
SkepticismPragmatismBelonging
TraditionJusticeHonesty
Keep up with the latest learning processes by being first users of the latest technology
Technology makes life run faster, communicating with people becomes faster
Technology removes the distancesLatest mobile phone and devices are a
status symbol
Technology makes life simpler, and this generation is maturing more quickly
Technology helps me connect with the world
Concerned about privacy and security online
Understand the need to cope with technological developments
Socializing and family bonding is not as common as it used to be
Technology limits creativity and thinking
ETHNICITY
AGE
Qatar’s ICT Landscape 2014 Households and Individuals 11
Table 2SYNOPSIS OF QATAR SEGMENTATION PROFILE
SPENDING[QAR]
USAGEINTERNET ACCESSDEVICE ACCESS 2
3VALUES/ATTITUDESDEMOGRAPHICS
Young Qataris
Mid-range Adult/Older Qataris
Westerners
White CollarExpat Arabs, Technology Interested
White CollarExpat Arabs, Technology Neutral
White Collar Asians, Technology Interested
White Collar Asians, Technology Neutral
Non-Qataris, Blue Collar (Non-Shared Accommodation)
Non-Qataris, Blue Collar (Shared Accommodation)
Transient Laborers
15–34 years old, marginally skewed toward 20- to 24-year-olds
35+ years
Westerner population in Qatar; majority from Europe, America, or Australia
Expat Arabs between the ages of 25 and 44
Expat Arabs between the ages of 25 and 54
Asians belonging to the age group 25–44
Asians belonging to the age group 25–44
Nationality: either Arab or Asian
Mostly Arab and Asian males in the age group 25–44
Mostly Asian men in the age group 20–39
Social statusOwning latest technologyFun and leisure
Strong obligation toward family
Need to be successfulNot very technology friendly
AspirationalCreativity and efficiency are
importantConnectivity on-the-go is very
important
HonestyFamily and community are
importantPreserve traditions Affinity toward technology but
not considered as status symbol
HonestyTechnology considered as
utility itemDo not feel the need to update
products regularly
Seek pleasure and leisurePossess latest technologyFeature driven
Skeptical toward technologyNot pleasure seekingNot very aspirational
Not very tech positiveNot very pleasure seekingNot very aspirational
Very skeptical toward technology
Don’t seek pleasure or leisure
The survey did not capture this segment’s values and attitudes
97% have access to laptop98% own smartphone51% have access to tablet
93% have access to laptop 44% still use desktop99% use smartphone54% use tablet
Active on multiple devices99% use laptop100% use smartphone92% use tablet
High dependence on laptops (99%)
But only 42% still use desktop
98% use smartphone47% use tablet
86% use laptop 58% still use desktop 90% use smartphone18% use tablet
94% use laptop52% use desktop86% have access to
smartphone24% use tablet
94% use laptop 37% use desktop 84% use smartphone Only 18% use tablet
92% use laptop 43% use desktop 77% use smartphone 30% use tablet
77% own laptop 28% use desktop 57% use smartphone 13% use tablet
3% use desktop27% use laptop 24% use smartphone 100% use mobile phone
100% access Internet of whom91% access Internet via smartphone
99% access Internet via WiFi and 58% via MBB
97% access Internet of whom80% access Internet via smartphone
94% access Internet via WiFi and 56% via MBB
100% access Internet of whom98% access Internet via smartphone
100% access Internet via WiFi and 80% via MBB
100% access Internet of whom 89% access Internet via smartphone
99% access Internet via WiFi and 45% via MBB
100% access Internet of whom81% access Internet via smartphone
95% access Internet via WiFi and 59% via MBB
99% access Internet of whom85% access Internet via smartphone
91% access Internet via WiFi and 28% via MBB
99% access Internet of whom83% access Internet via smartphone
92% access Internet via WiFi and 44% via MBB
98% access Internet of whom75% access Internet via smartphone
90% access Internet via WiFi and 51% via MBB
93% access Internet, of whom58% access Internet via smartphone
82% access Internet via WiFi and 34% via MBB
52% access Internet of whom43% access Internet via smartphone
42% access Internet via WiFi and 14% via MBB
Basic online services
Basic online services
Basic and advanced online services
Basic online services
Basic online services
Basic online services
Basic online services
Basic online services
Basic online services
Basic online services
733
1,000
738
373
404
233
184
239
177
128
For Internet access, the numbers used for all segments, except transient laborers, are based on household ownership of devices. In the case of transient laborers, since labor camps are not defined as households, we show individual usage numbers.
Personal average monthly spending on mobile phone services
2
3

Qatar’s ICT Landscape 2014 Households and Individuals 13
i c t D E v i c E P E n E t R at i O n
i n t E R n E t cO n n E c t i v i t y
i c t u Sag E a n D S P E n D i n g
Sat i S Fac t i O n W i t h m O B i l E a n D i n t E R n E t S E Rv i c E S
iCT iN QATAR
Qatar’s ICT Landscape 2014 Households and Individuals14
iCT DEviCE PENETRATiON
Key Findings
n almost 100% of the population, across a majority of the segments, has access to computers and mobile phones in Qatar, with high penetration of smart-phones across many segments
n 92% of households have a smartphone and 96% have a laptop
n Qatar enjoys higher penetration rates for laptops, smartphones, and tablets when compared with more ict mature economies such as Sweden, and Singapore; korea lags far behind in terms of laptops and tablets, and is equivalent to Qatar in terms of smartphone penetration
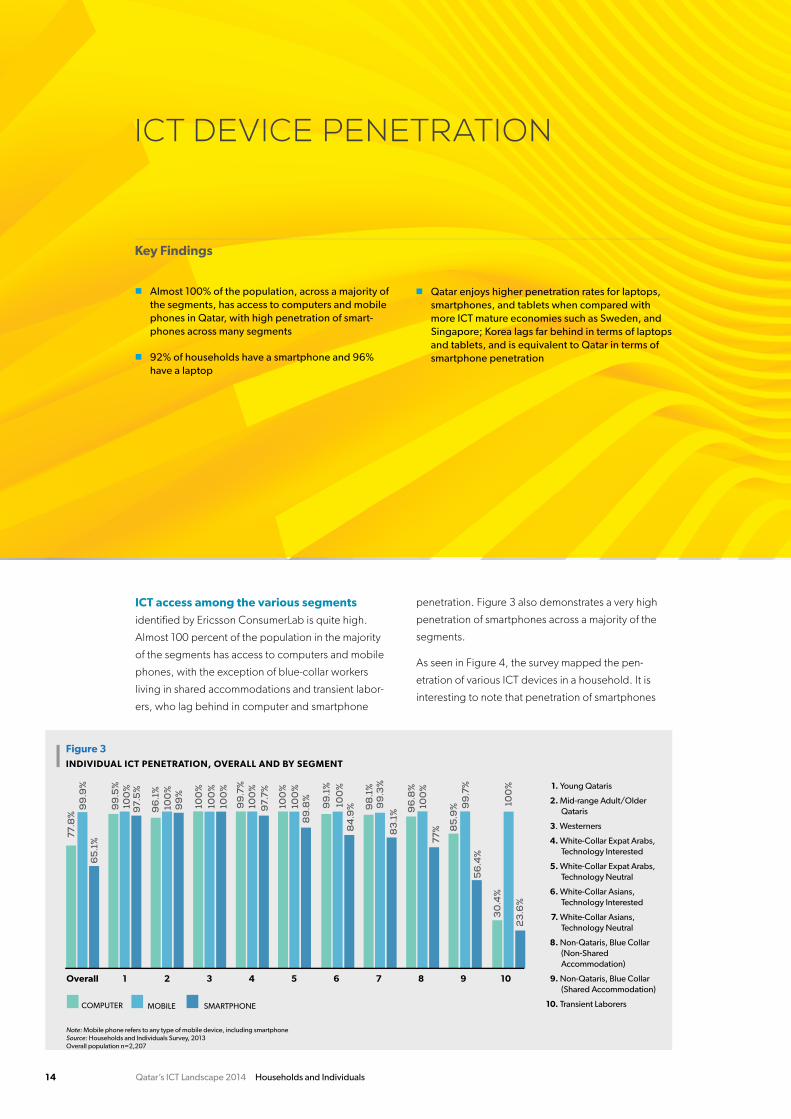
ICT access among the various segments
identified by Ericsson ConsumerLab is quite high.
Almost 100 percent of the population in the majority
of the segments has access to computers and mobile
phones, with the exception of blue-collar workers
living in shared accommodations and transient labor-
ers, who lag behind in computer and smartphone
penetration. Figure 3 also demonstrates a very high
penetration of smartphones across a majority of the
segments.
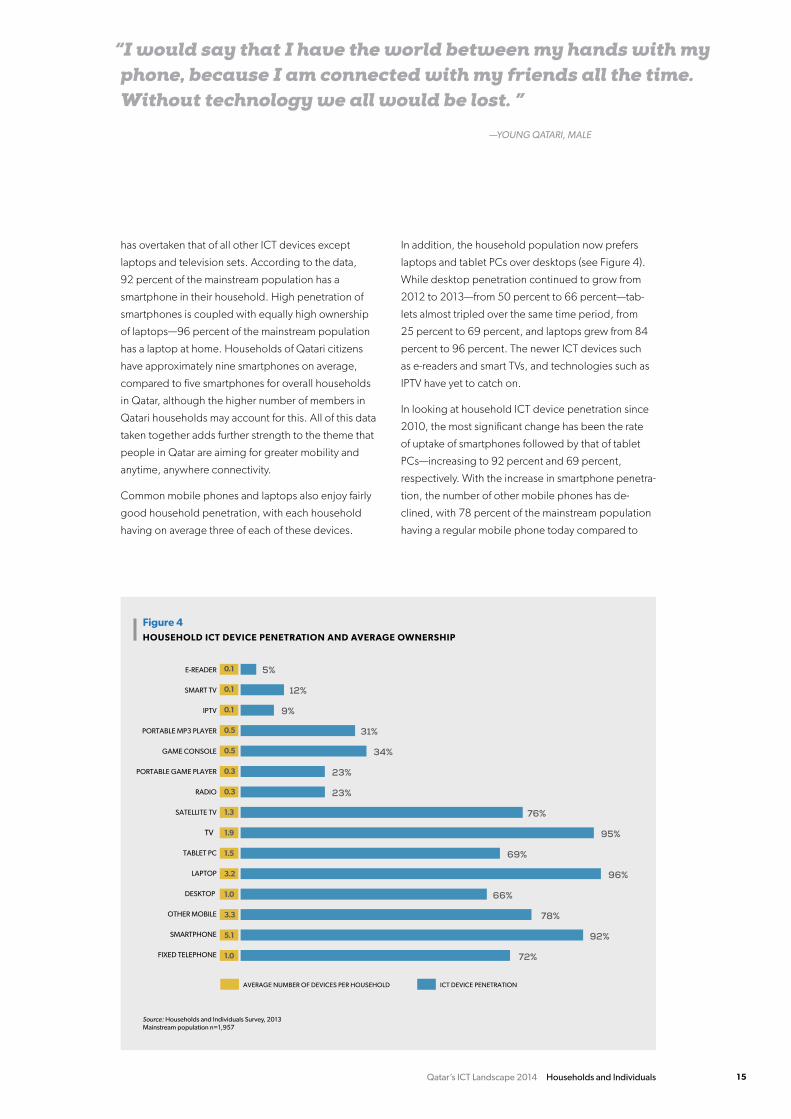
As seen in Figure 4, the survey mapped the pen-
etration of various ICT devices in a household. It is
interesting to note that penetration of smartphones
Figure 3INDIVIDUAL ICT PENETRATION, OVERALL AND BY SEGMENT
77.8
% 9
9.5
%
100
%
99
%
100
%
99
.1%
98
.1%
96
.8%
85
.9%
30
.4%
99
.9%
100
%
100
%
100
%
100
%
99
.3%
100
%
99
.7%
100
%
65
.1%
97.
5%
96
.1%
99
.7%
97.
7%
100
%
100
%
100
%
89
.8%
84
.9%
83
.1%
77%
56
.4%
23
.6%
MOBILE SMARTPHONECOMPUTER
1Overall 2 3 4 5 6 7 8 9 10
1. Young Qataris
2. Mid-range Adult/Older Qataris
3. Westerners
4. White-Collar Expat Arabs, Technology Interested
5. White-Collar Expat Arabs, Technology Neutral
6. White-Collar Asians, Technology Interested
7. White-Collar Asians, Technology Neutral
8. Non-Qataris, Blue Collar (Non-Shared Accommodation)
9. Non-Qataris, Blue Collar (Shared Accommodation)
10. Transient Laborers
Note: Mobile phone refers to any type of mobile device, including smartphoneSource: Households and Individuals Survey, 2013Overall population n=2,207
Qatar’s ICT Landscape 2014 Households and Individuals 15
“I would say that I have the world between my hands with my phone, because I am connected with my friends all the time. Without technology we all would be lost. ” —YOUNG QATARI, MALE
has overtaken that of all other ICT devices except
laptops and television sets. According to the data,
92 percent of the mainstream population has a
smartphone in their household. High penetration of
smartphones is coupled with equally high ownership
of laptops—96 percent of the mainstream population
has a laptop at home. Households of Qatari citizens
have approximately nine smartphones on average,
compared to five smartphones for overall households
in Qatar, although the higher number of members in
Qatari households may account for this. All of this data
taken together adds further strength to the theme that
people in Qatar are aiming for greater mobility and
anytime, anywhere connectivity.
Common mobile phones and laptops also enjoy fairly
good household penetration, with each household
having on average three of each of these devices.
In addition, the household population now prefers
laptops and tablet PCs over desktops (see Figure 4).
While desktop penetration continued to grow from
2012 to 2013—from 50 percent to 66 percent—tab-
lets almost tripled over the same time period, from
25 percent to 69 percent, and laptops grew from 84
percent to 96 percent. The newer ICT devices such
as e-readers and smart TVs, and technologies such as
IPTV have yet to catch on.
In looking at household ICT device penetration since
2010, the most significant change has been the rate
of uptake of smartphones followed by that of tablet
PCs—increasing to 92 percent and 69 percent,
respectively. With the increase in smartphone penetra-
tion, the number of other mobile phones has de-
clined, with 78 percent of the mainstream population
having a regular mobile phone today compared to
Figure 4HOUSEHOLD ICT DEVICE PENETRATION AND AVERAGE OWNERSHIP
E-READER
SMART TV
IPTV
PORTABLE MP3 PLAYER
GAME CONSOLE
PORTABLE GAME PLAYER
RADIO
SATELLITE TV
TV
TABLET PC
LAPTOP
DESKTOP
OTHER MOBILE
SMARTPHONE
FIXED TELEPHONE
0.1
0.1
0.1
0.5
0.5
0.3
0.3
1.3
1.9
1.5
3.2
1.0
3.3
5.1
1.0
AVERAGE NUMBER OF DEVICES PER HOUSEHOLD ICT DEVICE PENETRATION
72%
92%
78%
66%
96%
69%
95%
76%
23%
23%
34%
31%
9%
12%
5%
Source: Households and Individuals Survey, 2013 Mainstream population n=1,957

Qatar’s ICT Landscape 2014 Households and Individuals16
81 percent in 2012. The penetration of fixed tele-
phone lines has been relatively constant even with the
higher penetration of mobile phones.
In further analyzing device ownership, the study
compares household penetration levels of ICT devices
in various countries. Qatar enjoys higher penetration
rates for laptops, smartphones, and tablets compared
with more mature ICT economies such as Sweden
and Singapore, which trail Qatar significantly. Korea
lags far behind in terms of laptops and tablets, and is
equivalent to Qatar in terms of smartphone penetra-
tion. Given the high growth in the Qatar economy
and the speed of development of Qatar’s ICT sector,
higher adoption rates for technologies is not surpris-
ing (see Figure 5).
Figure 6 shows the improvement in the computer
penetration at the individual level in Qatar since
2010. Laptops and tablets have shown a great deal of
growth, while desktops registered a slight decrease.
Laptop penetration has increased to 93 percent and
94 percent in 2013 for the overall and mainstream
populations, respectively. Tablets jumped from ap-
proximately 10 percent to 29 percent from 2012 to
2013 for the overall population, and from 11 percent
to 32 percent for mainstream population during that
same period.
When comparing device ownership by gender in
the mainstream population, penetration levels for
desktops and laptops are almost the same for males
and females. In terms of tablets, penetration levels are
relatively higher for women (42 percent) than men (27
percent).
“I have my iPad, Galaxy, and laptop, which I cannot live without, and each is good for something. For example, I would rather watch a movie on my laptop because the screen is bigger, which makes it more enjoyable.
—YOUNG QATARI
”
FIGURE 6INDIVIDUAL ICT DEVICE PENETRATION, OVERALL VS MAINSTREAM, 2010–2013
35
%
35
%
19%
18
%
50
%
49
%
43
%
39
%
93
%
94
%
10%
11
%
29
%
32
%
87%
8
3%
Note: In 2010 data, tablets are included in the laptop number Source: Households and Individuals Survey, 2010, 2012, 2013Computer users in the overall population, 2010 n=1, 220, 2012 n=1,453, 2013 n=1,941Computer users in the mainstream population, 2010 n=1,184, 2012 n=1,391, 2013 n=1,865
2010 2012 2013
Desktop Laptop Tablet
2010 2012 2013 2010 2012
OVERALL
MAINSTREAM
2013
Figure 5HOUSEHOLD ICT PENETRATION, IN BENCHMARK COUNTRIES
2%
25%
44%
18%
74%
65%
27%
69%
58%
29%
66%
60%
42%
85%
60%
19%
74%
26%
16%
69%
42%
24%
62%
83%
69%
96%
66%
TABLET
LAPTOP COMPUTER
DESKTOP COMPUTER QATARKOREA
SAUDI ARABIAUAE
SINGAPORESWEDEN
UKGERMANY
INDIA
QATARKOREA
SAUDI ARABIAUAE
SINGAPORESWEDEN
UKGERMANY
INDIA
QATARKOREA
SAUDI ARABIAUAE
SINGAPORESWEDEN
UKGERMANY
INDIA
QATARKOREA
SAUDI ARABIAUAE
SINGAPORESWEDEN
UKGERMANY
INDIA
QATARKOREA
SAUDI ARABIAUAE
SINGAPORESWEDEN
UKGERMANY
INDIA
QATARKOREA
SAUDI ARABIAUAE
SINGAPORESWEDEN
UKGERMANY
INDIA
SMART TV
FIXED-LINE TELEPHONE
SMARTPHONE
61%
3%
12%
16% 15%
17% 18%
13% 19%
26% 12%
85% 77%
64% 73%
57% 59%
62% 72%
36%
67% 81%
83% 77%
74% 92% 92%
Sources: Ericsson ConsumerLab Analytical Platform, 2013Data for Qatar— Households and Individuals Survey, 2013Households n=1,957
Qatar’s ICT Landscape 2014 Households and Individuals 17
iNTERNET CONNECTiviTy
n internet penetration for both households and indi-viduals has increased since 2010 to near-universal levels—96% for households and 98% for the main-stream population—in 2013
n Overall, DSl is the most preferred type of internet ac-cess in households, followed by mobile broadband over the phone
n 85% of the overall population uses a laptop and 71% a smartphone to connect to the internet
n 52% of Qatari citizens connect to the internet using a tablet Pc in 2013 compared with 32% in 2012
n WiFi is the preferred mode of connecting to the in-ternet across the various internet-enabled devices used by the population in Qatar, except desktops
Key Findings
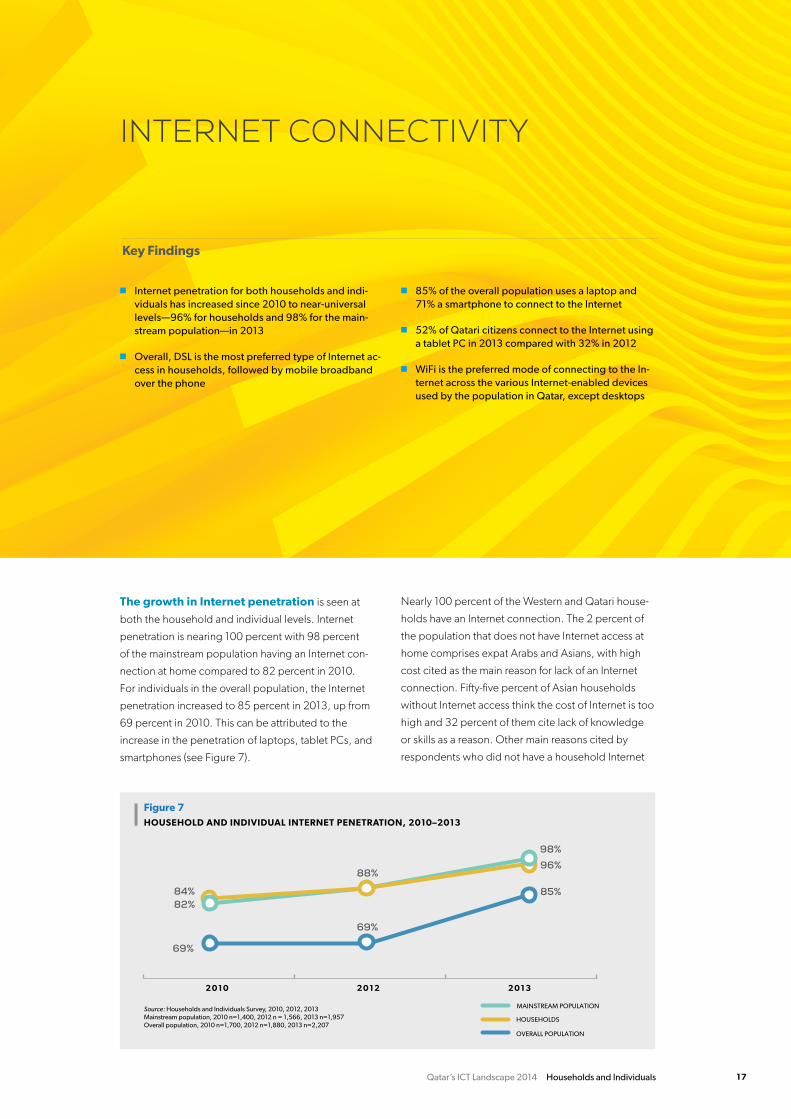
The growth in Internet penetration is seen at
both the household and individual levels. Internet
penetration is nearing 100 percent with 98 percent
of the mainstream population having an Internet con-
nection at home compared to 82 percent in 2010.
For individuals in the overall population, the Internet
penetration increased to 85 percent in 2013, up from
69 percent in 2010. This can be attributed to the
increase in the penetration of laptops, tablet PCs, and
smartphones (see Figure 7).
Nearly 100 percent of the Western and Qatari house-
holds have an Internet connection. The 2 percent of
the population that does not have Internet access at
home comprises expat Arabs and Asians, with high
cost cited as the main reason for lack of an Internet
connection. Fifty-five percent of Asian households
without Internet access think the cost of Internet is too
high and 32 percent of them cite lack of knowledge
or skills as a reason. Other main reasons cited by
respondents who did not have a household Internet
Figure 7HOUSEHOLD AND INDIVIDUAL INTERNET PENETRATION, 2010–2013
Source: Households and Individuals Survey, 2010, 2012, 2013Mainstream population, 2010 n=1,400, 2012 n = 1,566, 2013 n=1,957Overall population, 2010 n=1,700, 2012 n=1,880, 2013 n=2,207
84%
96%
69%
69%
85% 82%
88%
98%
2 0 1 0 2 0 1 2 2 0 1 3
HOUSEHOLDS
OVERALL POPULATION
MAINSTREAM POPULATION
Qatar’s ICT Landscape 2014 Households and Individuals18
connection were the lack of usefulness of the Internet
and lack of knowledge/skills to use the Internet.
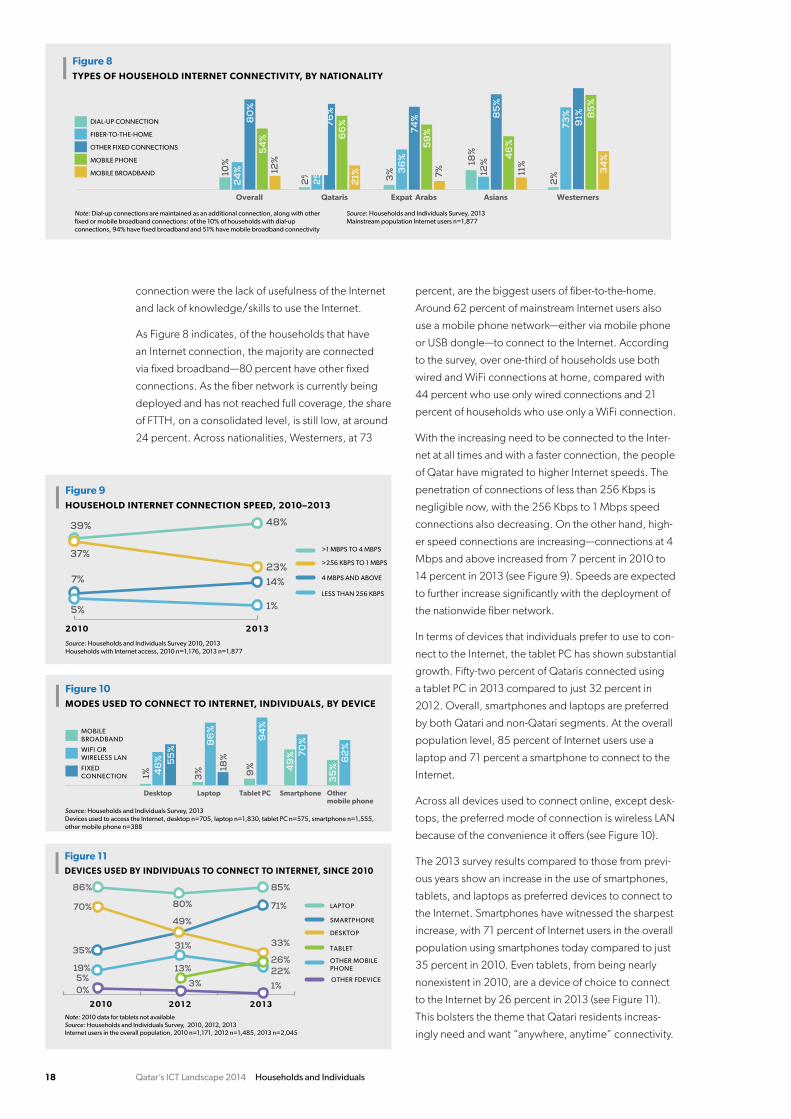
As Figure 8 indicates, of the households that have
an Internet connection, the majority are connected
via fixed broadband—80 percent have other fixed
connections. As the fiber network is currently being
deployed and has not reached full coverage, the share
of FTTH, on a consolidated level, is still low, at around
24 percent. Across nationalities, Westerners, at 73
percent, are the biggest users of fiber-to-the-home.
Around 62 percent of mainstream Internet users also
use a mobile phone network—either via mobile phone
or USB dongle—to connect to the Internet. According
to the survey, over one-third of households use both
wired and WiFi connections at home, compared with
44 percent who use only wired connections and 21
percent of households who use only a WiFi connection.
With the increasing need to be connected to the Inter-
net at all times and with a faster connection, the people
of Qatar have migrated to higher Internet speeds. The
penetration of connections of less than 256 Kbps is
negligible now, with the 256 Kbps to 1 Mbps speed
connections also decreasing. On the other hand, high-
er speed connections are increasing—connections at 4
Mbps and above increased from 7 percent in 2010 to
14 percent in 2013 (see Figure 9). Speeds are expected
to further increase significantly with the deployment of
the nationwide fiber network.
In terms of devices that individuals prefer to use to con-
nect to the Internet, the tablet PC has shown substantial
growth. Fifty-two percent of Qataris connected using
a tablet PC in 2013 compared to just 32 percent in
2012. Overall, smartphones and laptops are preferred
by both Qatari and non-Qatari segments. At the overall
population level, 85 percent of Internet users use a
laptop and 71 percent a smartphone to connect to the
Internet.
Across all devices used to connect online, except desk-
tops, the preferred mode of connection is wireless LAN
because of the convenience it offers (see Figure 10).
The 2013 survey results compared to those from previ-
ous years show an increase in the use of smartphones,
tablets, and laptops as preferred devices to connect to
the Internet. Smartphones have witnessed the sharpest
increase, with 71 percent of Internet users in the overall
population using smartphones today compared to just
35 percent in 2010. Even tablets, from being nearly
nonexistent in 2010, are a device of choice to connect
to the Internet by 26 percent in 2013 (see Figure 11).
This bolsters the theme that Qatari residents increas-
ingly need and want “anywhere, anytime” connectivity.
Figure 8TYPES OF HOUSEHOLD INTERNET CONNECTIVITY, BY NATIONALITY
Note: Dial-up connections are maintained as an additional connection, along with other fixed or mobile broadband connections: of the 10% of households with dial-up connections, 94% have fixed broadband and 51% have mobile broadband connectivity
Source: Households and Individuals Survey, 2013Mainstream population Internet users n=1,877
DIAL-UP CONNECTION
FIBER-TO-THE-HOME
OTHER FIXED CONNECTIONS
MOBILE PHONE
MOBILE BROADBAND 10%
2
4%
8
0%
5
4%
12
%
Overall
2%
2
5%
76
%
66
%
21%
Qataris
3%
36
%
74%
5
9%
7%
Expat Arabs
18%
12
%
85
%
46
%
11%
Asians
2%
73
%
91%
8
5%
3
4%
Westerners
Figure 10MODES USED TO CONNECT TO INTERNET, INDIVIDUALS, BY DEVICE
MOBILE BROADBAND
WIFI OR WIRELESS LAN
FIXED CONNECTION 1%
4
6%
5
5%
Desktop
3%
8
6%
18
%
Laptop
9%
9
4%
Tablet PC
49
% 70
%
Smartphone
35
% 6
2%
Other mobile phone
Source: Households and Individuals Survey, 2013Devices used to access the Internet, desktop n=705, laptop n=1,830, tablet PC n=575, smartphone n=1,555, other mobile phone n=388
5% 3%
70%
86%
80%
85%
71%
33%
26% 22% 1% 0%
13%
35%
49%
19%
31%
Figure 11DEVICES USED BY INDIVIDUALS TO CONNECT TO INTERNET, SINCE 2010
2 0 1 0 2 0 1 3 2 0 1 2
Note: 2010 data for tablets not availableSource: Households and Individuals Survey, 2010, 2012, 2013Internet users in the overall population, 2010 n=1,171, 2012 n=1,485, 2013 n=2,045
DESKTOP
LAPTOP
TABLET
SMARTPHONE
OTHER MOBILEPHONE
OTHER FDEVICE
Figure 9HOUSEHOLD INTERNET CONNECTION SPEED, 2010–2013
2 0 1 0 2 0 1 3
5% 1%
37% 23%
39% 48%
7% 14%
Source: Households and Individuals Survey 2010, 2013Households with Internet access, 2010 n=1,176, 2013 n=1,877
4 MBPS AND ABOVE
LESS THAN 256 KBPS
>1 MBPS TO 4 MBPS
>256 KBPS TO 1 MBPS

Qatar’s ICT Landscape 2014 Households and Individuals 19
iCT uSAGE AND SPENDiNG
n People in Qatar have access to computers mostly from their homes, followed by their workplace and another person’s home; internet access preferences are similar, but people also want “on-the-go” con-nectivity via mobile phone or other mobile device
n 89% of the internet users in Qatar accesses the internet for downloading content (movies, images, music), watching tv or video, or listening to radio or music, and the survey results show a significant uptake of all online activities compared to 2012
n People use their mobile phones mostly for basic services such as phone calls and SmS, but also for browsing the internet, social networking, watching videos, and downloading apps
n Services such as e-commerce, online banking, and e-government are used by a small percentage of the overall population
n Qatari households spend almost three times as much on ict services per month as non-Qatari households
n at the individual level, Qataris spend almost three times as much as non-Qataris on mobile phone service
n average individual monthly spending on mobile phones decreased from QaR 417 in 2010 to QaR 292 in 2013
Key Findings
The overwhelming majority of people have ac-
cess to computers at home. Only 37 percent of 15- to
24-year-olds access computers at an educational insti-
tution. More than 60 percent of the working popula-
tion in Qatar access computers from their place of
work. As with computer access, home is the preferred
location for Internet users—this is valid across all seg-
ments (see Figure 12). The second-most preferred way
of accessing the Internet is through a mobile device.
Fifty-seven percent of the overall users access the
Internet from a place of work, but the trend varies for
individual segments. As with computer usage, Internet
usage at an educational institution is low, with only 37
percent of young Qataris accessing the Internet at an
educational institution (see Figure 13).
Downloading content (movies, images, music), watch-
ing TV or video, or listening to radio or music—
Figure 12LOCATION OF COMPUTER ACCESS, INDIVIDUALS, BY AGE GROUP
Source: Households and Individuals Survey, 2013Computer users in the overall population n=1,941
58
%
39
%
41%
6
2%
13
%
99
%
61%
4
3%
4
5%
4
6%
3
7%
99
%
59
%
38
%
41%
6
6%
6
%
99
%
49
%
33
%
38
%
63
%
11%
9
9%
EDUCATIONALINSTITUTION
WORKPLACE COMMUNITYINTERNET
COMMERCIAL INTERNET
ANOTHER PERSON’S HOME
HOME
Overall computer users 15–24 years 25–44 years Over 44 years
Figure 13LOCATION OF INTERNET ACCESS, INDIVIDUALS
97%
Any place via mobile
phone/mobile device
74%
Home
57%
Workplace
63%
Otherlocation
13%
Educationalinstitution
Overall Internet users
Note: Other location includes community Internet access facility, commercial Internet access facility, and another person’s homeSource: Households and Individuals Survey, 2013Internet users in the overall population n= 2,045
Qatar’s ICT Landscape 2014 Households and Individuals20
“Now, I can easily make contact with Skype, BBM, WhatsApp for minimal cost or free. Technology made our world a smaller place and connected our family and friends 24/7. Also, you know everything, every moment.” —MID-RANGE ADULT ASIAN, FEMALE
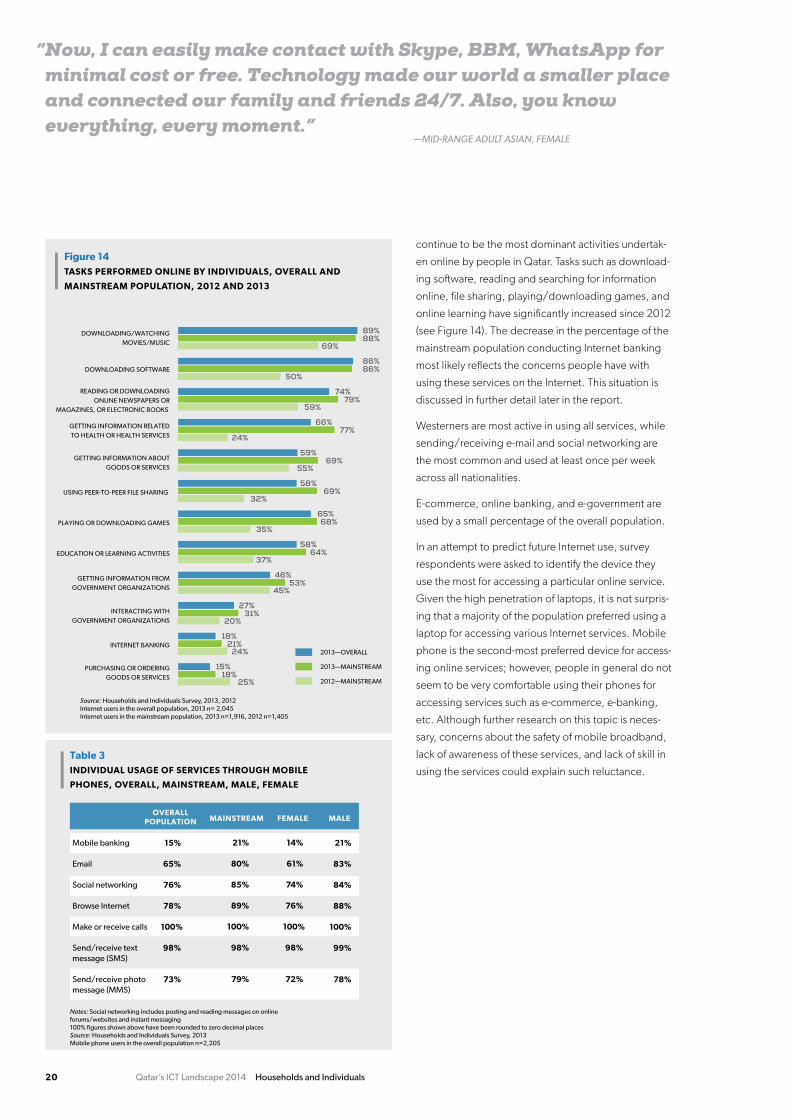
continue to be the most dominant activities undertak-
en online by people in Qatar. Tasks such as download-
ing software, reading and searching for information
online, file sharing, playing/downloading games, and
online learning have significantly increased since 2012
(see Figure 14). The decrease in the percentage of the
mainstream population conducting Internet banking
most likely reflects the concerns people have with
using these services on the Internet. This situation is
discussed in further detail later in the report.
Westerners are most active in using all services, while
sending/receiving e-mail and social networking are
the most common and used at least once per week
across all nationalities.
E-commerce, online banking, and e-government are
used by a small percentage of the overall population.
In an attempt to predict future Internet use, survey
respondents were asked to identify the device they
use the most for accessing a particular online service.
Given the high penetration of laptops, it is not surpris-
ing that a majority of the population preferred using a
laptop for accessing various Internet services. Mobile
phone is the second-most preferred device for access-
ing online services; however, people in general do not
seem to be very comfortable using their phones for
accessing services such as e-commerce, e-banking,
etc. Although further research on this topic is neces-
sary, concerns about the safety of mobile broadband,
lack of awareness of these services, and lack of skill in
using the services could explain such reluctance.
Figure 14TASKS PERFORMED ONLINE BY INDIVIDUALS, OVERALL AND
MAINSTREAM POPULATION, 2012 AND 2013
Source: Households and Individuals Survey, 2013, 2012Internet users in the overall population, 2013 n= 2,045Internet users in the mainstream population, 2013 n=1,916, 2012 n=1,405
69% 88% 89%
50% 86% 86%
59% 79%
74%
24% 77%
66%
55% 69%
59%
32% 69%
58%
35% 68%
65%
37% 64%
58%
45% 53%
46%
20% 31%
27%
24% 21%
18%
25% 18%
15% PURCHASING OR ORDERING GOODS OR SERVICES
INTERNET BANKING
INTERACTING WITH GOVERNMENT ORGANIZATIONS
GETTING INFORMATION FROM GOVERNMENT ORGANIZATIONS
EDUCATION OR LEARNING ACTIVITIES
PLAYING OR DOWNLOADING GAMES
USING PEER-TO-PEER FILE SHARING
GETTING INFORMATION ABOUT GOODS OR SERVICES
GETTING INFORMATION RELATED TO HEALTH OR HEALTH SERVICES
READING OR DOWNLOADING ONLINE NEWSPAPERS OR
MAGAZINES, OR ELECTRONIC BOOKS
DOWNLOADING SOFTWARE
DOWNLOADING/WATCHING MOVIES/MUSIC
2013—OVERALL
2013—MAINSTREAM
2012—MAINSTREAM
Table 3INDIVIDUAL USAGE OF SERVICES THROUGH MOBILE
PHONES, OVERALL, MAINSTREAM, MALE, FEMALE
OVERALLPOPULATION MAINSTREAM MALEFEMALE
Mobile banking
Social networking
Browse Internet
Make or receive calls
Send/receive text message (SMS)
Send/receive photo message (MMS)
15%
65%
76%
78%
100%
98%
73%
21%
80%
85%
89%
100%
98%
79%
14%
61%
74%
76%
100%
98%
72%
21%
83%
84%
88%
100%
99%
78%
Notes: Social networking includes posting and reading messages on online forums/websites and instant messaging100% figures shown above have been rounded to zero decimal placesSource: Households and Individuals Survey, 2013Mobile phone users in the overall population n=2,205
Qatar’s ICT Landscape 2014 Households and Individuals 21
“Before I used to call my family back in Tunisia every two weeks or a month because it is so expensive, now, with Skype I call my family and friends every day.
—MID-RANGE ADULT EXPAT ARAB
”
More women than men access various online activities
through mobile phones. This difference in usage pat-
terns is most obvious for accessing email on mobile
phones, mobile banking, and VoIP. This may be due to
the fact that women in Qatar show equal, if not higher,
penetration of ICT devices such as smartphones and
tablets (see Table 3).
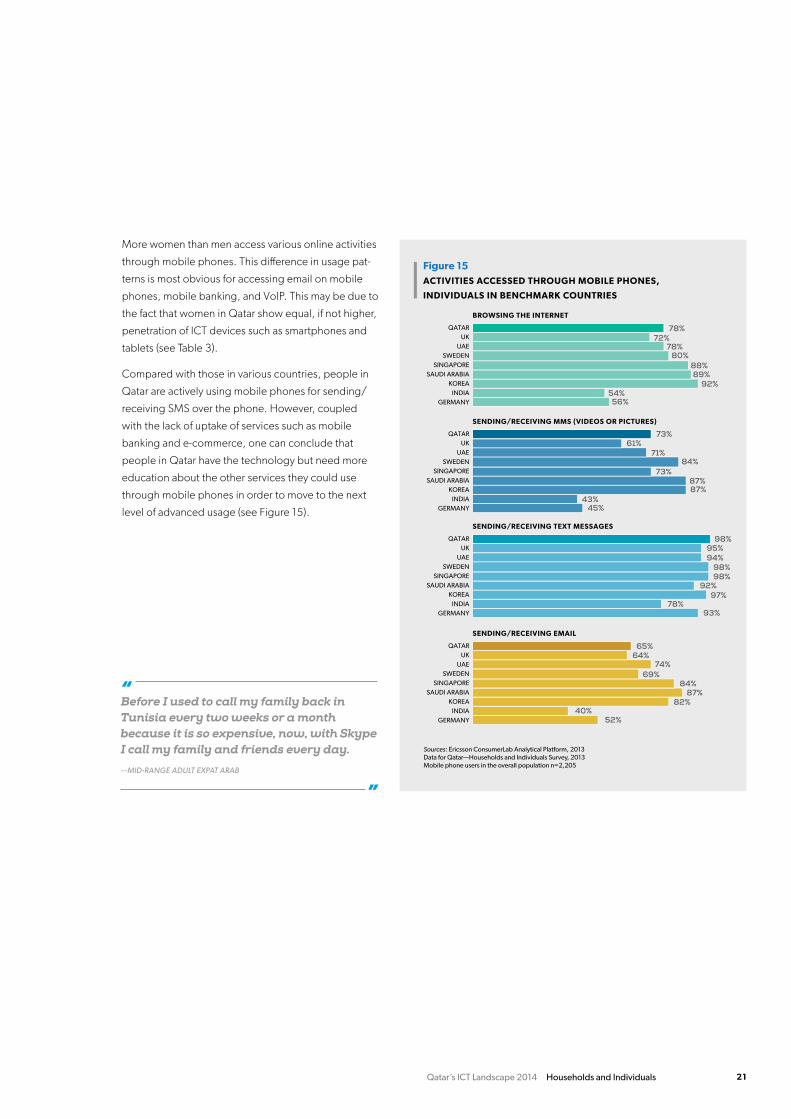
Compared with those in various countries, people in
Qatar are actively using mobile phones for sending/
receiving SMS over the phone. However, coupled
with the lack of uptake of services such as mobile
banking and e-commerce, one can conclude that
people in Qatar have the technology but need more
education about the other services they could use
through mobile phones in order to move to the next
level of advanced usage (see Figure 15).
Figure 15ACTIVITIES ACCESSED THROUGH MOBILE PHONES,
INDIVIDUALS IN BENCHMARK COUNTRIES
BROWSING THE INTERNET
QATARUK
UAESWEDEN
SINGAPORESAUDI ARABIA
KOREAINDIA
GERMANY 56% 54%
92% 89%
88% 80%
78% 72%
78%
SENDING/RECEIVING MMS (VIDEOS OR PICTURES)
QATARUK
UAESWEDEN
SINGAPORESAUDI ARABIA
KOREAINDIA
GERMANY 45% 43%
87% 87%
73% 84%
71% 61%
73%
SENDING/RECEIVING TEXT MESSAGES
QATARUK
UAESWEDEN
SINGAPORESAUDI ARABIA
KOREAINDIA
GERMANY 93% 78%
97% 92%
98% 98%
94% 95%
98%
SENDING/RECEIVING EMAIL
QATARUK
UAESWEDEN
SINGAPORESAUDI ARABIA
KOREAINDIA
GERMANY 52% 40%
82% 87%
84% 69%
74% 64% 65%
Sources: Ericsson ConsumerLab Analytical Platform, 2013Data for Qatar—Households and Individuals Survey, 2013Mobile phone users in the overall population n=2,205
Qatar’s ICT Landscape 2014 Households and Individuals22
TRANSIENT LABORERS
128
MID-RANGE ADULT/OLDER QATARIS
1,000
YOUNG QATARIS
733NON-QATARIS, BLUE COLLAR (SHARED ACCOMMO-DATION)
177
WHITE-COLLAR ASIANS, TECHNOLOGYNEUTRAL
184WHITE-COLLAR ASIANS, TECHNOLOGY INTERESTED
233
NON-QATARIS, BLUE COLLAR (NON-SHARED ACCOMMO-DATION)
239WHITE-COLLAR EXPAT ARABS, TECHNOLOGY INTERESTED
373
WHITE-COLLAR EXPAT ARABS, TECHNOLOGY NEUTRAL
404WESTERNERS
738
Source: Households and Individuals Survey, 2013Mobile phone users in overall population n=2,205
Figure 17AVERAGE MONTHLY INDIVIDUAL SPENDING (QAR) ON MOBILE PHONE SERVICES, BY SEGMENT
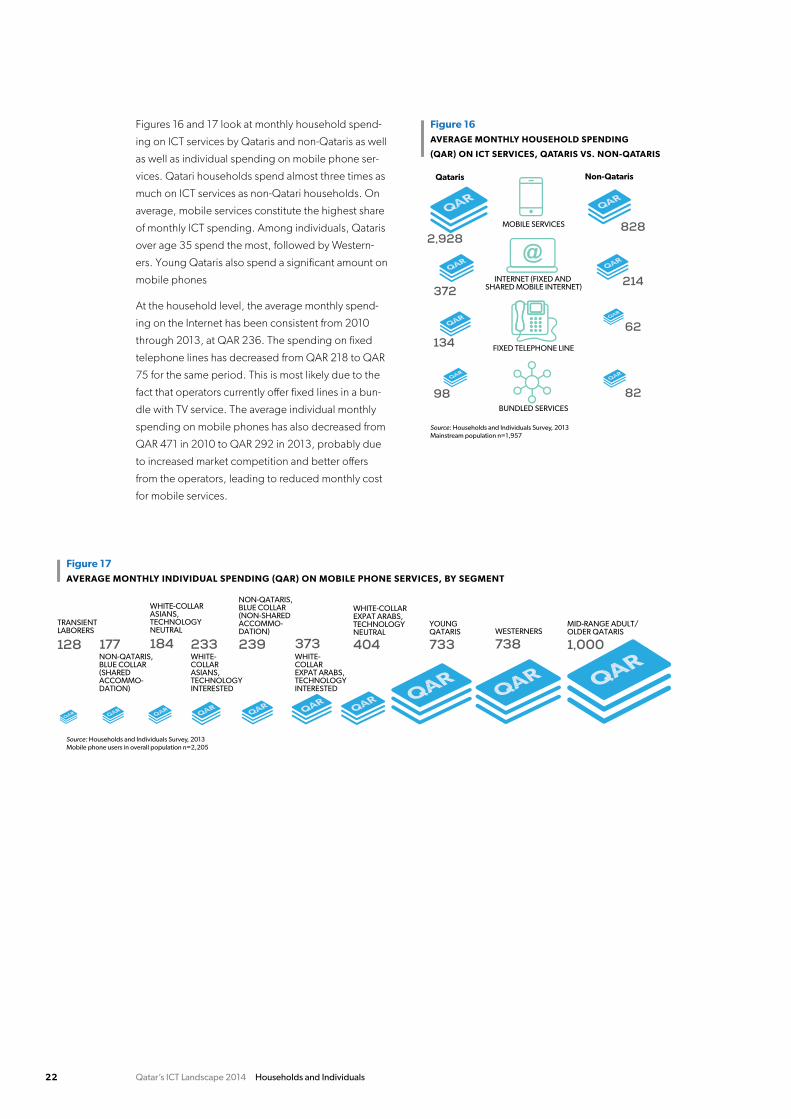
Figures 16 and 17 look at monthly household spend-
ing on ICT services by Qataris and non-Qataris as well
as well as individual spending on mobile phone ser-
vices. Qatari households spend almost three times as
much on ICT services as non-Qatari households. On
average, mobile services constitute the highest share
of monthly ICT spending. Among individuals, Qataris
over age 35 spend the most, followed by Western-
ers. Young Qataris also spend a significant amount on
mobile phones
At the household level, the average monthly spend-
ing on the Internet has been consistent from 2010
through 2013, at QAR 236. The spending on fixed
telephone lines has decreased from QAR 218 to QAR
75 for the same period. This is most likely due to the
fact that operators currently offer fixed lines in a bun-
dle with TV service. The average individual monthly
spending on mobile phones has also decreased from
QAR 471 in 2010 to QAR 292 in 2013, probably due
to increased market competition and better offers
from the operators, leading to reduced monthly cost
for mobile services.
Figure 16AVERAGE MONTHLY HOUSEHOLD SPENDING
(QAR) ON ICT SERVICES, QATARIS VS. NON-QATARIS
Source: Households and Individuals Survey, 2013Mainstream population n=1,957
Qataris Non-Qataris
MOBILE SERVICES
BUNDLED SERVICES
INTERNET (FIXED AND SHARED MOBILE INTERNET)
FIXED TELEPHONE LINE
828
214
62
82
2,928
372
134
98
Qatar’s ICT Landscape 2014 Households and Individuals 23
SATiSFACTiON WiTH mOBiLE AND iNTERNET SERviCES
Key Findings
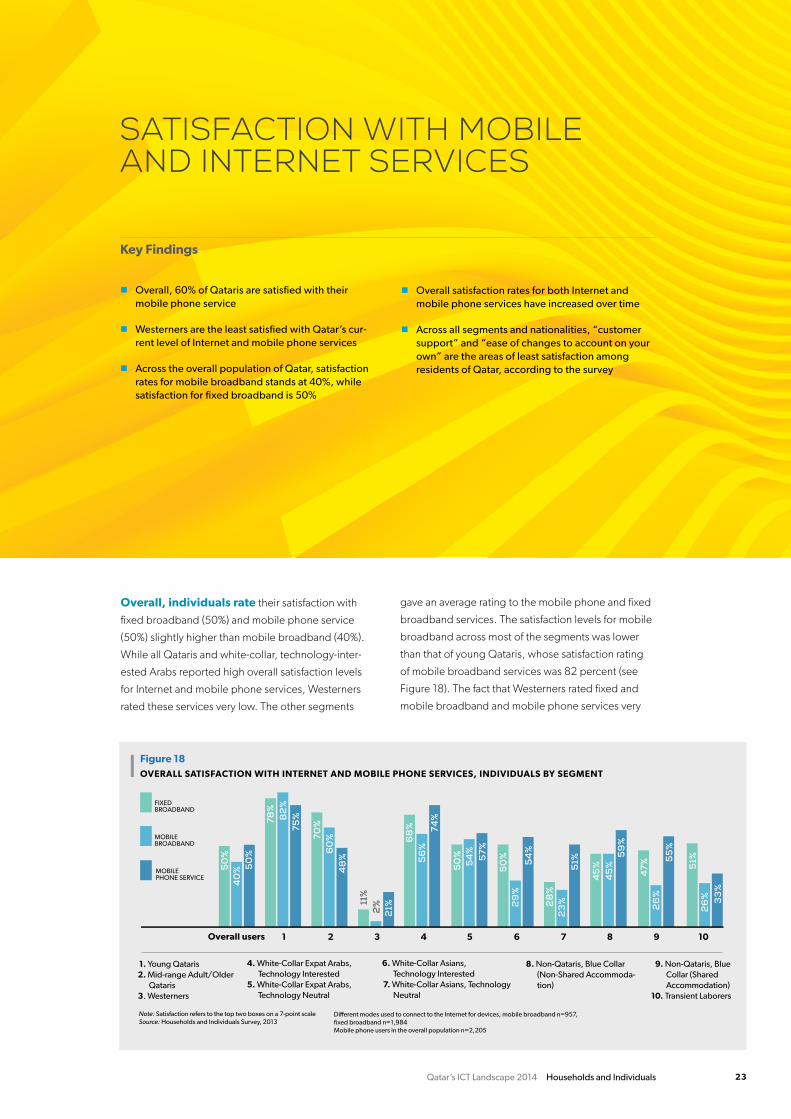
n Overall, 60% of Qataris are satisfied with their mobile phone service
n Westerners are the least satisfied with Qatar’s cur-rent level of internet and mobile phone services
n across the overall population of Qatar, satisfaction rates for mobile broadband stands at 40%, while satisfaction for fixed broadband is 50%
n Overall satisfaction rates for both internet and mobile phone services have increased over time
n across all segments and nationalities, “customer support” and “ease of changes to account on your own” are the areas of least satisfaction among residents of Qatar, according to the survey
overall, individuals rate their satisfaction with
fixed broadband (50%) and mobile phone service
(50%) slightly higher than mobile broadband (40%).
While all Qataris and white-collar, technology-inter-
ested Arabs reported high overall satisfaction levels
for Internet and mobile phone services, Westerners
rated these services very low. The other segments
gave an average rating to the mobile phone and fixed
broadband services. The satisfaction levels for mobile
broadband across most of the segments was lower
than that of young Qataris, whose satisfaction rating
of mobile broadband services was 82 percent (see
Figure 18). The fact that Westerners rated fixed and
mobile broadband and mobile phone services very
Figure 18OVERALL SATISFACTION WITH INTERNET AND MOBILE PHONE SERVICES, INDIVIDUALS BY SEGMENT
50
%
78%
2%
60
%
11%
50
%
50
%
28
%
45
%
47%
40
%
82
%
70%
48
%
54
%
29
%
23
%
45
%
26
%
50
%
75%
21%
56
% 6
8%
74%
57%
54
%
51%
59
%
55
% MOBILE
BROADBAND
MOBILE PHONE SERVICE
FIXED BROADBAND
51%
2
6%
3
3%
1 2 3 4 5 6 7 8 9Overall users 10
Different modes used to connect to the Internet for devices, mobile broadband n=957, fixed broadband n=1,984 Mobile phone users in the overall population n=2,205
Note: Satisfaction refers to the top two boxes on a 7-point scaleSource: Households and Individuals Survey, 2013
1. Young Qataris 2. Mid-range Adult/Older
Qataris 3. Westerners
4. White-Collar Expat Arabs, Technology Interested
5. White-Collar Expat Arabs, Technology Neutral
6. White-Collar Asians, Technology Interested
7. White-Collar Asians, Technology Neutral
8. Non-Qataris, Blue Collar (Non-Shared Accommoda-tion)
9. Non-Qataris, Blue Collar (Shared Accommodation)
10. Transient Laborers
Qatar’s ICT Landscape 2014 Households and Individuals24
low could be due to their experience back home with
better services at competitive pricing due to stiff com-
petition among the various mobile operators. Asians
fall in the middle of the range.
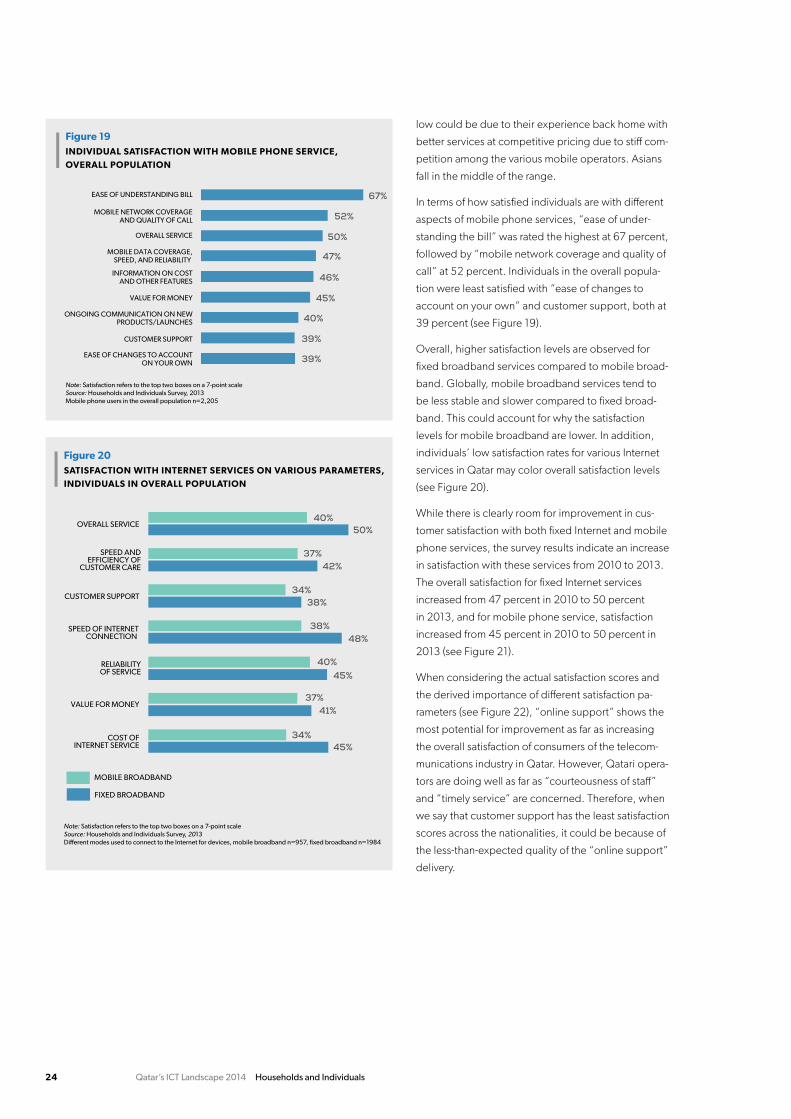
In terms of how satisfied individuals are with different
aspects of mobile phone services, “ease of under-
standing the bill” was rated the highest at 67 percent,
followed by “mobile network coverage and quality of
call” at 52 percent. Individuals in the overall popula-
tion were least satisfied with “ease of changes to
account on your own” and customer support, both at
39 percent (see Figure 19).
Overall, higher satisfaction levels are observed for
fixed broadband services compared to mobile broad-
band. Globally, mobile broadband services tend to
be less stable and slower compared to fixed broad-
band. This could account for why the satisfaction
levels for mobile broadband are lower. In addition,
individuals’ low satisfaction rates for various Internet
services in Qatar may color overall satisfaction levels
(see Figure 20).
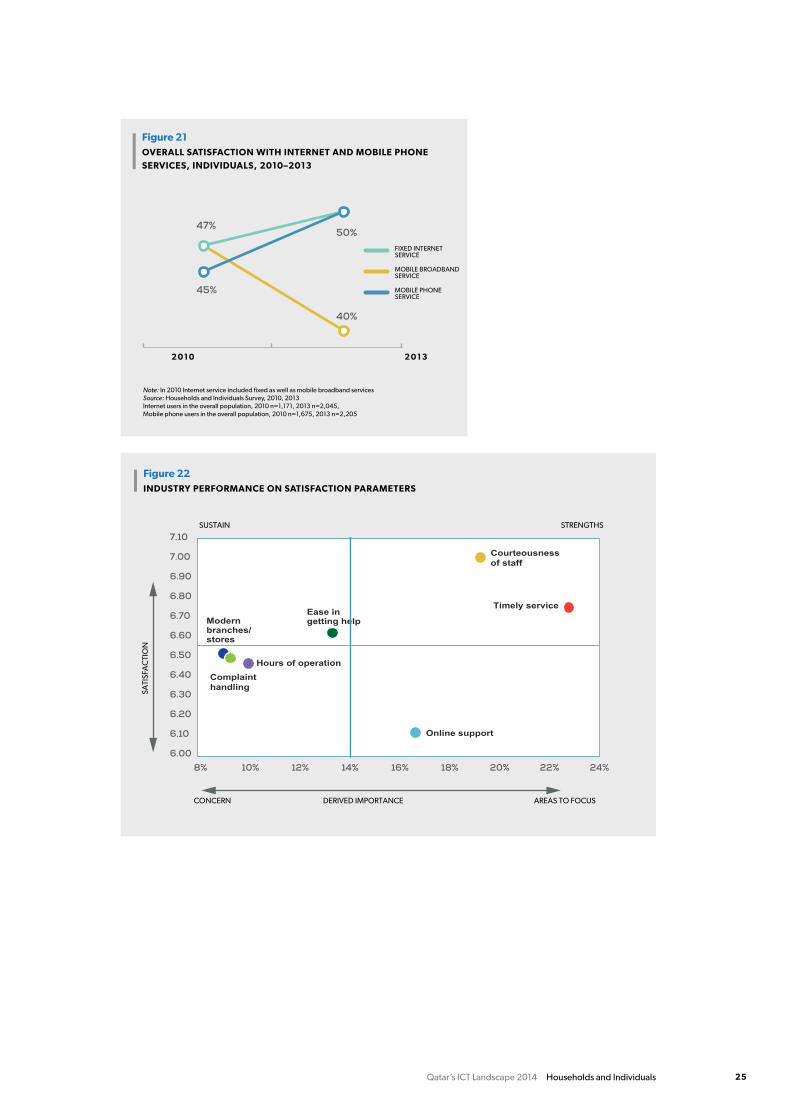
While there is clearly room for improvement in cus-
tomer satisfaction with both fixed Internet and mobile
phone services, the survey results indicate an increase
in satisfaction with these services from 2010 to 2013.
The overall satisfaction for fixed Internet services
increased from 47 percent in 2010 to 50 percent
in 2013, and for mobile phone service, satisfaction
increased from 45 percent in 2010 to 50 percent in
2013 (see Figure 21).
When considering the actual satisfaction scores and
the derived importance of different satisfaction pa-
rameters (see Figure 22), “online support” shows the
most potential for improvement as far as increasing
the overall satisfaction of consumers of the telecom-
munications industry in Qatar. However, Qatari opera-
tors are doing well as far as “courteousness of staff”
and “timely service” are concerned. Therefore, when
we say that customer support has the least satisfaction
scores across the nationalities, it could be because of
the less-than-expected quality of the “online support”
delivery.
Figure 19INDIVIDUAL SATISFACTION WITH MOBILE PHONE SERVICE, OVERALL POPULATION
47%MOBILE DATA COVERAGE,SPEED, AND RELIABILITY
50%OVERALL SERVICE
67%EASE OF UNDERSTANDING BILL
46%INFORMATION ON COSTAND OTHER FEATURES
45%VALUE FOR MONEY
39%CUSTOMER SUPPORT
52%MOBILE NETWORK COVERAGEAND QUALITY OF CALL
40%ONGOING COMMUNICATION ON NEWPRODUCTS/LAUNCHES
39%EASE OF CHANGES TO ACCOUNTON YOUR OWN
Note: Satisfaction refers to the top two boxes on a 7-point scaleSource: Households and Individuals Survey, 2013Mobile phone users in the overall population n=2,205
Figure 20SATISFACTION WITH INTERNET SERVICES ON VARIOUS PARAMETERS, INDIVIDUALS IN OVERALL POPULATION
48% 38%
40% 50%
37% 42%
38% 34%
34% 45%
45% 40%
41% 37%
Note: Satisfaction refers to the top two boxes on a 7-point scaleSource: Households and Individuals Survey, 2013Different modes used to connect to the Internet for devices, mobile broadband n=957, fixed broadband n=1984
COST OF INTERNET SERVICE
VALUE FOR MONEY
RELIABILITYOF SERVICE
SPEED OF INTERNETCONNECTION
CUSTOMER SUPPORT
SPEED ANDEFFICIENCY OF
CUSTOMER CARE
OVERALL SERVICE
MOBILE BROADBAND
FIXED BROADBAND
Qatar’s ICT Landscape 2014 Households and Individuals 25
Modern branches/stores
Ease in getting help
Complaint
handling
Hours of operation
Online support
Courteousness
of staff
Timely service
Figure 22INDUSTRY PERFORMANCE ON SATISFACTION PARAMETERS
SATI
SFA
CTI
ON
DERIVED IMPORTANCE AREAS TO FOCUSCONCERN
6.00
6.10
6.20
6.30
6.40
6.50
6.60
6.70
6.80
6.90
7.00
7.10
8% 10% 12% 14% 16% 18% 20% 22% 24%
SUSTAIN STRENGTHS
Figure 21OVERALL SATISFACTION WITH INTERNET AND MOBILE PHONE SERVICES, INDIVIDUALS, 2010–2013
Note: In 2010 Internet service included fixed as well as mobile broadband servicesSource: Households and Individuals Survey, 2010, 2013Internet users in the overall population, 2010 n=1,171, 2013 n=2,045, Mobile phone users in the overall population, 2010 n=1,675, 2013 n=2,205
2 0 1 0 2 0 1 3
45%
47% 50%
40%
MOBILE BROADBAND SERVICE
MOBILE PHONE SERVICE
FIXED INTERNET SERVICE

Qatar’s ICT Landscape 2014 Households and Individuals26
Qatar’s ICT Landscape 2014 Households and Individuals 27
S O c i a l n E t WO R k i n g a n D a R a B i c cO n t E n t O n l i n E
O n l i n E B a n k i n g a n D E - cO m m E R c E
E - g Ov E R n m E n t
Q - P O St S E Rv i c E S
O n l i n E S E c u R i t y a n D P R i vac y
n E W S E Rv i c E S
FOCuS AREAS
Qatar’s ICT Landscape 2014 Households and Individuals28
SOCiAL NETWORKiNG AND ARABiC CONTENT ONLiNE
n 87% of the internet users in Qatar access social net-working at least once a month, and nearly half access it at least once a day
n 89% of internet users access social networking on their mobile phones
n though logging on to Facebook is nearly universal among internet users, it is also considered “old” by younger demographic groups and perceived to have privacy issues. twitter—with its microblogging status, which makes posts concise and to the point—is considered to be a platform for serious discussions
n Sites such as linkedin are less popular in Qatar. this may be due to cultural attributes of the society—where personal relationships are still highly valued, and the sharing of personal professional information is looked down upon
n the main reason that people in Qatar use online so-cial networking websites is to keep others updated about their lives
n 87% of Qataris and 76% of expat arabs report that “the websites available in arabic are sufficient.” Overall, there has been an increase in the percent-age of arabic speakers in the country who believe that the arabic content is sufficient, from 64 per-cent in 2012 to 79 percent in 2013
n Some respondents mentioned that the requirement of a basic knowledge of English to access uRls could be an impediment to accessing the internet
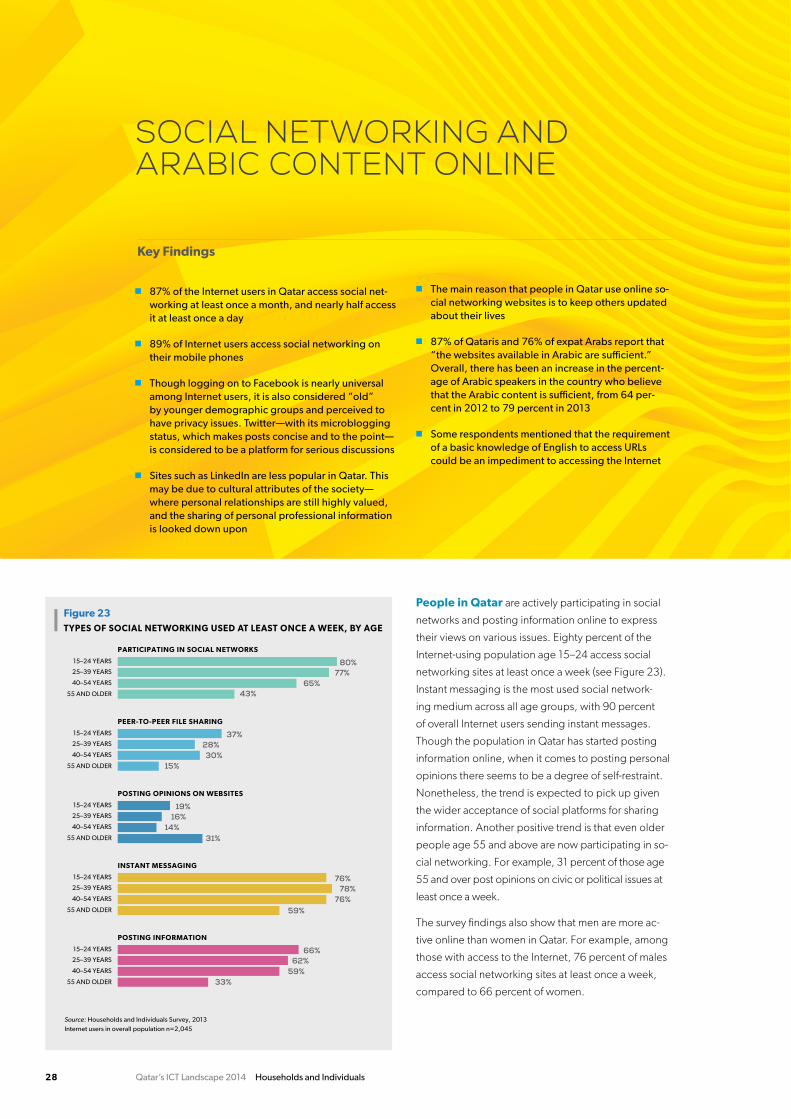
People in Qatar are actively participating in social
networks and posting information online to express
their views on various issues. Eighty percent of the
Internet-using population age 15–24 access social
networking sites at least once a week (see Figure 23).
Instant messaging is the most used social network-
ing medium across all age groups, with 90 percent
of overall Internet users sending instant messages.
Though the population in Qatar has started posting
information online, when it comes to posting personal
opinions there seems to be a degree of self-restraint.
Nonetheless, the trend is expected to pick up given
the wider acceptance of social platforms for sharing
information. Another positive trend is that even older
people age 55 and above are now participating in so-
cial networking. For example, 31 percent of those age
55 and over post opinions on civic or political issues at
least once a week.
The survey findings also show that men are more ac-
tive online than women in Qatar. For example, among
those with access to the Internet, 76 percent of males
access social networking sites at least once a week,
compared to 66 percent of women.
Key Findings
Figure 23TYPES OF SOCIAL NETWORKING USED AT LEAST ONCE A WEEK, BY AGE
15–24 YEARS
25–39 YEARS
40–54 YEARS
55 AND OLDER 43% 65%
77% 80%
PARTICIPATING IN SOCIAL NETWORKS
15–24 YEARS
25–39 YEARS
40–54 YEARS
55 AND OLDER 15% 30%
28% 37%
PEER-TO-PEER FILE SHARING
15–24 YEARS
25–39 YEARS
40–54 YEARS
55 AND OLDER 31% 14%
16% 19%
POSTING OPINIONS ON WEBSITES
15–24 YEARS
25–39 YEARS
40–54 YEARS
55 AND OLDER 59% 76%
78% 76%
INSTANT MESSAGING
15–24 YEARS
25–39 YEARS
40–54 YEARS
55 AND OLDER 33% 59%
62% 66%
POSTING INFORMATION
Source: Households and Individuals Survey, 2013Internet users in overall population n=2,045
Qatar’s ICT Landscape 2014 Households and Individuals 29
Online social platforms are an increasingly popu-
lar medium to stay in touch and updated—when it
comes to both personal affairs and world news. While
younger people use social media to connect with
friends and meet new people, the majority of older
consumers prefer to use social media solely to con-
nect with known friends and family. Nonetheless, this
indicates a willingness to embrace an open and con-
nected environment. The survey points to social media
websites such as Facebook, Twitter, and Instagram as
being immensely popular sources of entertainment for
both Qataris and expats.
When it comes to accessing social networking
through mobile phones, it is interesting to note that
Qatar is ahead of a good number of its peers. Even
countries with mature ICT markets lag behind in the
use of social networking via mobile phones. For
example, 73 percent of the overall population in Qatar
reported that they access social networking sites
through mobiles, compared to just 56 percent in the
UK and 59 percent in Sweden. When it comes to the
use of instant messaging, Saudi Arabia is the leader at
90 percent, followed by Qatar (89%) and Singapore
(85%).
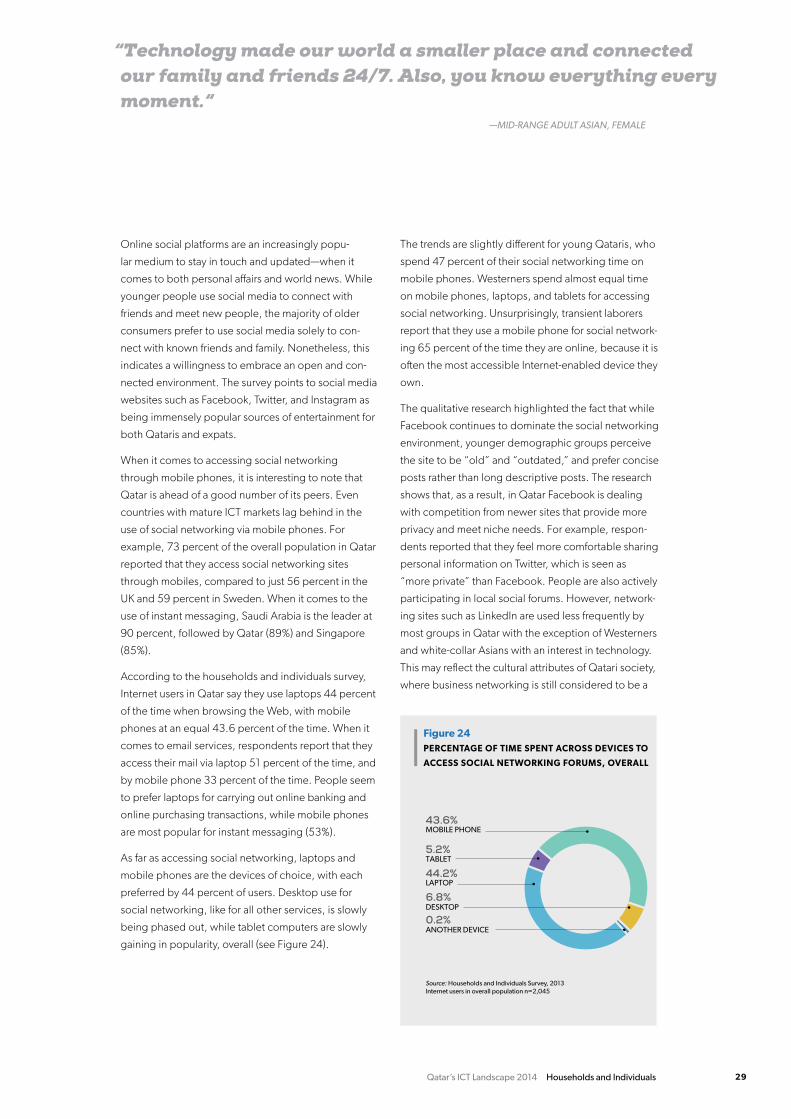
According to the households and individuals survey,
Internet users in Qatar say they use laptops 44 percent
of the time when browsing the Web, with mobile
phones at an equal 43.6 percent of the time. When it
comes to email services, respondents report that they
access their mail via laptop 51 percent of the time, and
by mobile phone 33 percent of the time. People seem
to prefer laptops for carrying out online banking and
online purchasing transactions, while mobile phones
are most popular for instant messaging (53%).
As far as accessing social networking, laptops and
mobile phones are the devices of choice, with each
preferred by 44 percent of users. Desktop use for
social networking, like for all other services, is slowly
being phased out, while tablet computers are slowly
gaining in popularity, overall (see Figure 24).
The trends are slightly different for young Qataris, who
spend 47 percent of their social networking time on
mobile phones. Westerners spend almost equal time
on mobile phones, laptops, and tablets for accessing
social networking. Unsurprisingly, transient laborers
report that they use a mobile phone for social network-
ing 65 percent of the time they are online, because it is
often the most accessible Internet-enabled device they
own.
The qualitative research highlighted the fact that while
Facebook continues to dominate the social networking
environment, younger demographic groups perceive
the site to be “old” and “outdated,” and prefer concise
posts rather than long descriptive posts. The research
shows that, as a result, in Qatar Facebook is dealing
with competition from newer sites that provide more
privacy and meet niche needs. For example, respon-
dents reported that they feel more comfortable sharing
personal information on Twitter, which is seen as
“more private” than Facebook. People are also actively
participating in local social forums. However, network-
ing sites such as LinkedIn are used less frequently by
most groups in Qatar with the exception of Westerners
and white-collar Asians with an interest in technology.
This may reflect the cultural attributes of Qatari society,
where business networking is still considered to be a
“Technology made our world a smaller place and connected our family and friends 24/7. Also, you know everything every moment.“ —MID-RANGE ADULT ASIAN, FEMALE
Figure 24PERCENTAGE OF TIME SPENT ACROSS DEVICES TO
ACCESS SOCIAL NETWORKING FORUMS, OVERALL
5.2%
44.2%
0.2%
43.6%MOBILE PHONE
TABLET
LAPTOP
6.8%DESKTOP
ANOTHER DEVICE
Source: Households and Individuals Survey, 2013Internet users in overall population n=2,045

Qatar’s ICT Landscape 2014 Households and Individuals30
personal, face-to-face space, and the value attributed
to personal relationships is still very high.
According to the households and individuals data,
the majority of males and females in Qatar use online
social networking for updating people about their
lives, fun, and staying updated about others. Social
platforms are also being used to stay updated on
current affairs around the world and to search for infor-
mation. It is interesting to note that at the mainstream
population level, the use of social platforms for edu-
cational studies is limited, with 25 percent of men and
36 percent of women reporting that they use social
networking as part of a work or education program.
The use of social platforms for business networking is
also limited at 26 percent of the overall population, al-
though women use it for this purpose more than men.
In order to gain insight into why people in Qatar
continue to lag behind when it comes to using the In-
ternet to access advanced services, respondents were
asked about their satisfaction levels with the Arabic-
language content that is currently available online.
In the case of Qataris and expat Arabs, both groups
say that they feel there is sufficient Arabic content
online (87% and 76% respectively). (See Figure 25.)
Still, respondents also report that finding and using
that information can be a challenge because a basic
understanding of English is often needed to access
any content online, since URLs are often in English.
Since the overall population of Qatar is a mix of eth-
nicities, the percentage of people in the country who
use the Arabic language fluctuates year to year. None-
theless, the research indicates that between 2010
and 2013 there has been a decrease in the number of
people who feel that there are not enough websites
in Arabic or that Arabic content online is not sufficient,
indicating a growing satisfaction with both the quan-
tity and quality of digital content in the language.
“When I am bored, I look at my phone and enjoy the updates such as pictures, comments, and links that are posted online. Some-times it makes my day!” — YOUNG EXPAT ARAB, FEMALE
Figure 25PERCEPTION REGARDING ARABIC CONTENT ONLINE AMONG ARABIC-SPEAKING COMMUNITY
87%
11% 4% 4% 0.5%
76%
17% 11%
6% 2%
Qataris Expat Arabs
The websites available in Arabic are sufficient
There are not enough websites in Arabic, and the information on these sites is not sufficient
I rely solely on websites in other languages and do not use websites in Arabic
I don’t know/I do not search for such information
I cannot read Arabic and do not use Arabic websites
Source: Households and Individuals Survey, 2013Internet users in overall population n=2,045Qatari Internet users in the overall population n=279Expat Arab Internet users in the overall population n=611
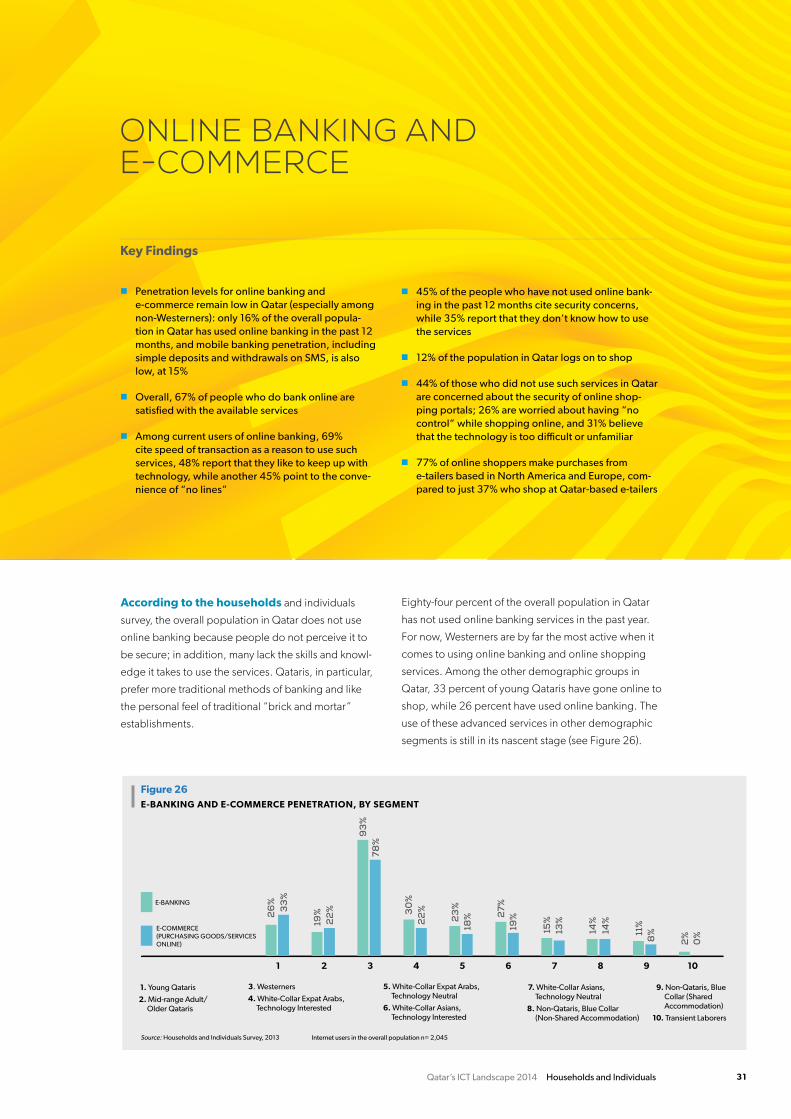
Qatar’s ICT Landscape 2014 Households and Individuals 31
ONLiNE BANKiNG AND E-COmmERCE
Key Findings
n Penetration levels for online banking and e-commerce remain low in Qatar (especially among non-Westerners): only 16% of the overall popula-tion in Qatar has used online banking in the past 12 months, and mobile banking penetration, including simple deposits and withdrawals on SmS, is also low, at 15%
n Overall, 67% of people who do bank online are satisfied with the available services
n among current users of online banking, 69% cite speed of transaction as a reason to use such services, 48% report that they like to keep up with technology, while another 45% point to the conve-nience of “no lines”
n 45% of the people who have not used online bank-ing in the past 12 months cite security concerns, while 35% report that they don’t know how to use the services
n 12% of the population in Qatar logs on to shop
n 44% of those who did not use such services in Qatar are concerned about the security of online shop-ping portals; 26% are worried about having “no control” while shopping online, and 31% believe that the technology is too difficult or unfamiliar
n 77% of online shoppers make purchases from e-tailers based in north america and Europe, com-pared to just 37% who shop at Qatar-based e-tailers
According to the households and individuals
survey, the overall population in Qatar does not use
online banking because people do not perceive it to
be secure; in addition, many lack the skills and knowl-
edge it takes to use the services. Qataris, in particular,
prefer more traditional methods of banking and like
the personal feel of traditional “brick and mortar”
establishments.
Eighty-four percent of the overall population in Qatar
has not used online banking services in the past year.
For now, Westerners are by far the most active when it
comes to using online banking and online shopping
services. Among the other demographic groups in
Qatar, 33 percent of young Qataris have gone online to
shop, while 26 percent have used online banking. The
use of these advanced services in other demographic
segments is still in its nascent stage (see Figure 26).
Figure 26E-BANKING AND E-COMMERCE PENETRATION, BY SEGMENT
E-COMMERCE (PURCHASING GOODS/SERVICES ONLINE)
E-BANKING
26
%
33
%
1
22
%
19%
2
78%
93
%
3
22
%
30
%
4
23
%
18%
5
27%
19
%
6
15%
13
%
7
14%
14
%
8
11%
8
%
9
2%
0
%
10
1. Young Qataris
2. Mid-range Adult/Older Qataris
3. Westerners
4. White-Collar Expat Arabs, Technology Interested
5. White-Collar Expat Arabs, Technology Neutral
6. White-Collar Asians, Technology Interested
7. White-Collar Asians, Technology Neutral
8. Non-Qataris, Blue Collar (Non-Shared Accommodation)
9. Non-Qataris, Blue Collar (Shared Accommodation)
10. Transient Laborers
Source: Households and Individuals Survey, 2013 Internet users in the overall population n= 2,045

Qatar’s ICT Landscape 2014 Households and Individuals32
In comparison to the other countries, Qatar lags be-
hind in the use of mobile phones for accessing bank-
ing services at just 15 percent compared to 75 percent
in Korea and 57 percent in Singapore (see Figure 27).
According to Figure 28, speed is the primary reason
that people in Qatar use online banking; they also
report that they enjoy keeping up with new technolo-
gies. Of those who have used the services, 88 percent
of Qataris are satisfied with the online banking facili-
ties, compared to just 34 percent of Westerners. This
could be due to the fact that Westerners have experi-
enced more evolved services in their home countries,
where online banking has had time to mature. Still,
among the overall population, the satisfaction levels
for online banking jumped from 40 percent in 2010 to
67 percent in 2013.
When it comes to online purchasing, Westerners are
the most comfortable with the idea and do it most fre-
quently. Again, given the level of maturity of many of
their home economies, it may be that they are simply
more aware of how to use these services, and more at
ease with the related security issues.
Among those in the overall population who do make
purchases online, the majority do not buy from online
vendors based in Qatar, opting instead for vendors
based either in America, Europe, or Asia. While the
majority of the population across nationalities prefers
ordering from North America and Europe, a full 69
percent of Asian online shoppers prefer to make pur-
chases from local Qatari websites.
Figure 27PENETRATION OF MOBILE BANKING, IN BENCHMARK COUNTRIES
Sources: Ericsson ConsumerLab Analytical Platform, 2013Data for Qatar—Households and Individuals Survey, 2013Overall population n=2,207
15% 9%
75% 36%
57% 39%
26% 30%
15% QATAR
UK
UAE
SWEDEN
SINGAPORE
SAUDI ARABIA
KOREA
INDIA
GERMANY
44% IT IS NOT SECURE
TOP 3 CONCERNS ABOUT ONLINE BANKING, QATAR, GLOBAL, MIDDLE EAST
37% IT IS NOT SECURE
17% IT IS NOT PRIVATE OR CONFIDENTIAL
20% MY CURRENT BANKING METHODS ARE GOOD ENOUGH
GLOBAL
10% I WOULD PREFER TO SPEAK TO SOMEONE IN PERSON
14% I DON’T HAVE A BANK ACCOUNT
22% IT IS NOT SECURE
MIDDLE EAST
27% I WOULD PREFER TO SPEAK TO SOMEONE IN PERSON
34% I DON’T KNOW HOW TO USE THIS SERVICE
OVERALL POPULATION—QATAR
Notes: Middle East consists of Egypt, UAE, Turkey, and KSA For global and Middle Eastern data, the questions related to online banking were asked of mobile phone users while in Qatar; for Qatar data, the question was asked of Internet users in the overall populationSources: Ericsson ConsumerLab Analytical Platform, 2013Data for Qatar—Households and Individuals Survey, 2013Internet users in overall population n= 2045
24%
10% 29%
26%
21%
22%
36%
23%
30%
36%
38%
48%
37%
44%
79%
39%
24%
35%
41%
42%
36%
45% 48%
47%
32%
70%
69%
EXPAT ARABS
QATARIS
OVERALLQUICK
NEW TECHNOLOGYNO LINES
NO FILLING FORMSSECURITY
MORE CONTROLCAN ACCESS ANYTIME
PRIVACYCOST EFFECTIVE
QUICKNEW TECHNOLOGY
NO LINESNO FILLING FORMS
SECURITYMORE CONTROL
CAN ACCESS ANYTIMEPRIVACY
COST EFFECTIVE
QUICKNEW TECHNOLOGY
NO LINESNO FILLING FORMS
SECURITYMORE CONTROL
CAN ACCESS ANYTIMEPRIVACY
COST EFFECTIVE
QUICKNEW TECHNOLOGY
NO LINESNO FILLING FORMS
SECURITYMORE CONTROL
CAN ACCESS ANYTIMEPRIVACY
COST EFFECTIVE
QUICKNEW TECHNOLOGY
NO LINESNO FILLING FORMS
SECURITYMORE CONTROL
CAN ACCESS ANYTIMEPRIVACY
COST EFFECTIVE
WESTERNERS
ASIANS
39%
50% 74%
64% 42%
69% 56%
57% 64% 65%
29% 19%
39%
46%
65%
31% 27%
47%
Figure 28REASONS FOR USING ONLINE BANKING, BY NATIONALITY
Source: Households and Individuals Survey, 2013Online banking users in overall population n=308
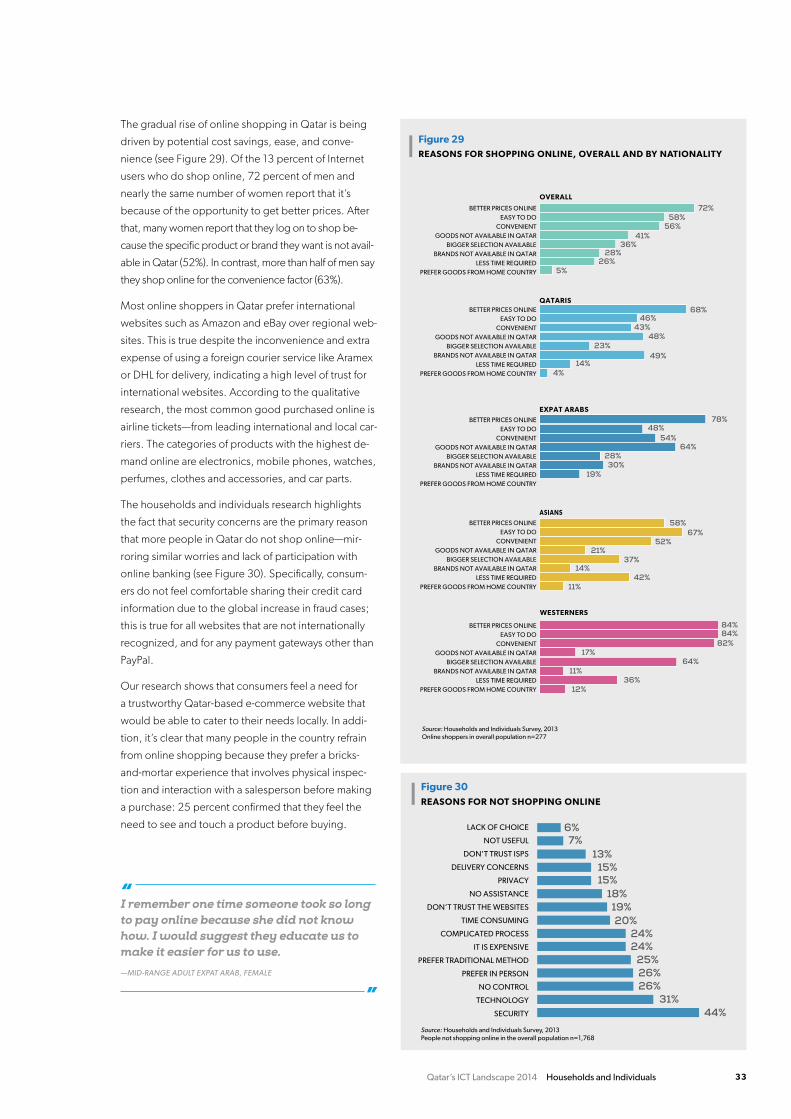
Qatar’s ICT Landscape 2014 Households and Individuals 33
“I remember one time someone took so long to pay online because she did not know how. I would suggest they educate us to make it easier for us to use.
—MID-RANGE ADULT EXPAT ARAB, FEMALE
”
The gradual rise of online shopping in Qatar is being
driven by potential cost savings, ease, and conve-
nience (see Figure 29). Of the 13 percent of Internet
users who do shop online, 72 percent of men and
nearly the same number of women report that it’s
because of the opportunity to get better prices. After
that, many women report that they log on to shop be-
cause the specific product or brand they want is not avail-
able in Qatar (52%). In contrast, more than half of men say
they shop online for the convenience factor (63%).
Most online shoppers in Qatar prefer international
websites such as Amazon and eBay over regional web-
sites. This is true despite the inconvenience and extra
expense of using a foreign courier service like Aramex
or DHL for delivery, indicating a high level of trust for
international websites. According to the qualitative
research, the most common good purchased online is
airline tickets—from leading international and local car-
riers. The categories of products with the highest de-
mand online are electronics, mobile phones, watches,
perfumes, clothes and accessories, and car parts.
The households and individuals research highlights
the fact that security concerns are the primary reason
that more people in Qatar do not shop online—mir-
roring similar worries and lack of participation with
online banking (see Figure 30). Specifically, consum-
ers do not feel comfortable sharing their credit card
information due to the global increase in fraud cases;
this is true for all websites that are not internationally
recognized, and for any payment gateways other than
PayPal.
Our research shows that consumers feel a need for
a trustworthy Qatar-based e-commerce website that
would be able to cater to their needs locally. In addi-
tion, it’s clear that many people in the country refrain
from online shopping because they prefer a bricks-
and-mortar experience that involves physical inspec-
tion and interaction with a salesperson before making
a purchase: 25 percent confirmed that they feel the
need to see and touch a product before buying.
5%
36%
26%
56% 58%
72%
28%
41%
OVERALL
BETTER PRICES ONLINEEASY TO DO
CONVENIENTGOODS NOT AVAILABLE IN QATAR
BIGGER SELECTION AVAILABLEBRANDS NOT AVAILABLE IN QATAR
LESS TIME REQUIREDPREFER GOODS FROM HOME COUNTRY
BETTER PRICES ONLINEEASY TO DO
CONVENIENTGOODS NOT AVAILABLE IN QATAR
BIGGER SELECTION AVAILABLEBRANDS NOT AVAILABLE IN QATAR
LESS TIME REQUIREDPREFER GOODS FROM HOME COUNTRY
BETTER PRICES ONLINEEASY TO DO
CONVENIENTGOODS NOT AVAILABLE IN QATAR
BIGGER SELECTION AVAILABLEBRANDS NOT AVAILABLE IN QATAR
LESS TIME REQUIREDPREFER GOODS FROM HOME COUNTRY
BETTER PRICES ONLINEEASY TO DO
CONVENIENTGOODS NOT AVAILABLE IN QATAR
BIGGER SELECTION AVAILABLEBRANDS NOT AVAILABLE IN QATAR
LESS TIME REQUIREDPREFER GOODS FROM HOME COUNTRY
BETTER PRICES ONLINEEASY TO DO
CONVENIENTGOODS NOT AVAILABLE IN QATAR
BIGGER SELECTION AVAILABLEBRANDS NOT AVAILABLE IN QATAR
LESS TIME REQUIREDPREFER GOODS FROM HOME COUNTRY
4%
23%
14%
43% 48%
46% 68%
49%
QATARIS
28%
19%
48% 54%
78%
30%
64%
EXPAT ARABS
WESTERNERS
12%
64%
36%
82% 84% 84%
11%
17%
ASIANS
37%
11% 42%
58%
21%
67% 52%
14%
Figure 29REASONS FOR SHOPPING ONLINE, OVERALL AND BY NATIONALITY
Source: Households and Individuals Survey, 2013Online shoppers in overall population n=277
Figure 30REASONS FOR NOT SHOPPING ONLINE
24% 24%
25%
26% 26%
31%
20%
44%
18% 19%
15% 15%
13% 7%
6% LACK OF CHOICE
NOT USEFUL
DON’T TRUST ISPS
DELIVERY CONCERNS
PRIVACY
NO ASSISTANCE
DON’T TRUST THE WEBSITES
TIME CONSUMING
COMPLICATED PROCESS
IT IS EXPENSIVE
PREFER TRADITIONAL METHOD
PREFER IN PERSON
NO CONTROL
TECHNOLOGY
SECURITY
Source: Households and Individuals Survey, 2013People not shopping online in the overall population n=1,768
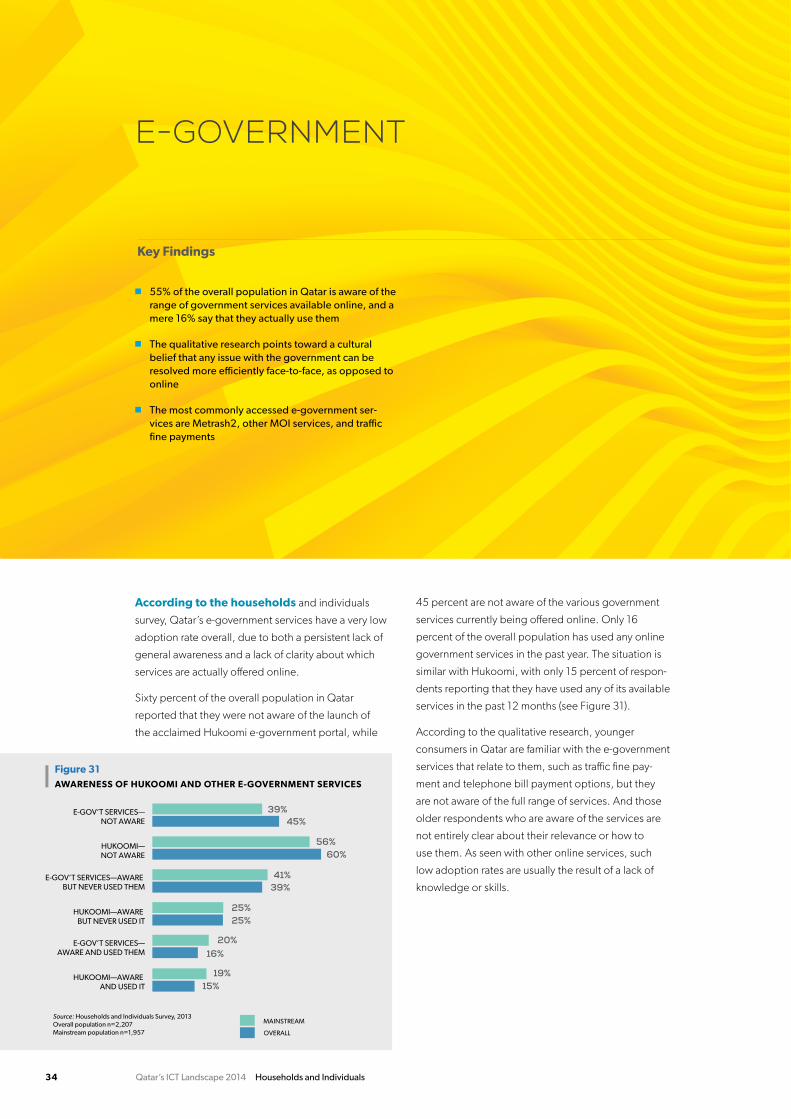
Qatar’s ICT Landscape 2014 Households and Individuals34
E-GOvERNmENT
n 55% of the overall population in Qatar is aware of the range of government services available online, and a mere 16% say that they actually use them
n the qualitative research points toward a cultural belief that any issue with the government can be resolved more efficiently face-to-face, as opposed to online
n the most commonly accessed e-government ser-vices are metrash2, other mOi services, and traffic fine payments
Key Findings
According to the households and individuals
survey, Qatar’s e-government services have a very low
adoption rate overall, due to both a persistent lack of
general awareness and a lack of clarity about which
services are actually offered online.
Sixty percent of the overall population in Qatar
reported that they were not aware of the launch of
the acclaimed Hukoomi e-government portal, while
45 percent are not aware of the various government
services currently being offered online. Only 16
percent of the overall population has used any online
government services in the past year. The situation is
similar with Hukoomi, with only 15 percent of respon-
dents reporting that they have used any of its available
services in the past 12 months (see Figure 31).
According to the qualitative research, younger
consumers in Qatar are familiar with the e-government
services that relate to them, such as traffic fine pay-
ment and telephone bill payment options, but they
are not aware of the full range of services. And those
older respondents who are aware of the services are
not entirely clear about their relevance or how to
use them. As seen with other online services, such
low adoption rates are usually the result of a lack of
knowledge or skills.
Figure 31AWARENESS OF HUKOOMI AND OTHER E-GOVERNMENT SERVICES
Source: Households and Individuals Survey, 2013Overall population n=2,207Mainstream population n=1,957
25% 25%
39% 45%
56% 60%
39% 41%
16% 20%
15% 19% HUKOOMI—AWARE
AND USED IT
MAINSTREAM
OVERALL
E-GOV’T SERVICES—AWARE AND USED THEM
HUKOOMI—AWARE BUT NEVER USED IT
E-GOV’T SERVICES—AWARE BUT NEVER USED THEM
HUKOOMI—NOT AWARE
E-GOV’T SERVICES—NOT AWARE
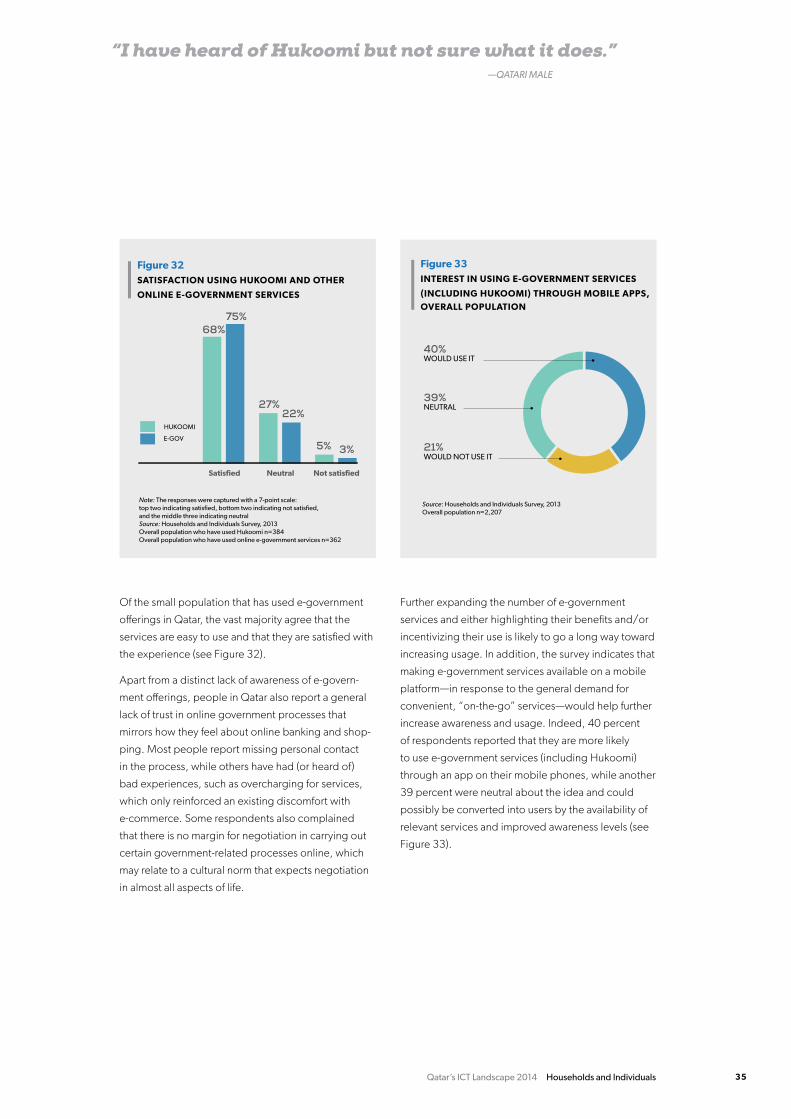
Qatar’s ICT Landscape 2014 Households and Individuals 35
“I have heard of Hukoomi but not sure what it does.” —QATARI MALE
Of the small population that has used e-government
offerings in Qatar, the vast majority agree that the
services are easy to use and that they are satisfied with
the experience (see Figure 32).
Apart from a distinct lack of awareness of e-govern-
ment offerings, people in Qatar also report a general
lack of trust in online government processes that
mirrors how they feel about online banking and shop-
ping. Most people report missing personal contact
in the process, while others have had (or heard of)
bad experiences, such as overcharging for services,
which only reinforced an existing discomfort with
e-commerce. Some respondents also complained
that there is no margin for negotiation in carrying out
certain government-related processes online, which
may relate to a cultural norm that expects negotiation
in almost all aspects of life.
Further expanding the number of e-government
services and either highlighting their benefits and/or
incentivizing their use is likely to go a long way toward
increasing usage. In addition, the survey indicates that
making e-government services available on a mobile
platform—in response to the general demand for
convenient, “on-the-go” services—would help further
increase awareness and usage. Indeed, 40 percent
of respondents reported that they are more likely
to use e-government services (including Hukoomi)
through an app on their mobile phones, while another
39 percent were neutral about the idea and could
possibly be converted into users by the availability of
relevant services and improved awareness levels (see
Figure 33).
Figure 32SATISFACTION USING HUKOOMI AND OTHER
ONLINE E-GOVERNMENT SERVICES
Note: The responses were captured with a 7-point scale: top two indicating satisfied, bottom two indicating not satisfied, and the middle three indicating neutralSource: Households and Individuals Survey, 2013Overall population who have used Hukoomi n=384Overall population who have used online e-government services n=362
75% 68%
22% 27%
3% 5% E-GOV
HUKOOMI
Satisfied Neutral Not satisfied
Figure 33INTEREST IN USING E-GOVERNMENT SERVICES
(INCLUDING HUKOOMI) THROUGH MOBILE APPS,OVERALL POPULATION
Source: Households and Individuals Survey, 2013Overall population n=2,207
21%
39%
40%WOULD USE IT
WOULD NOT USE IT
NEUTRAL
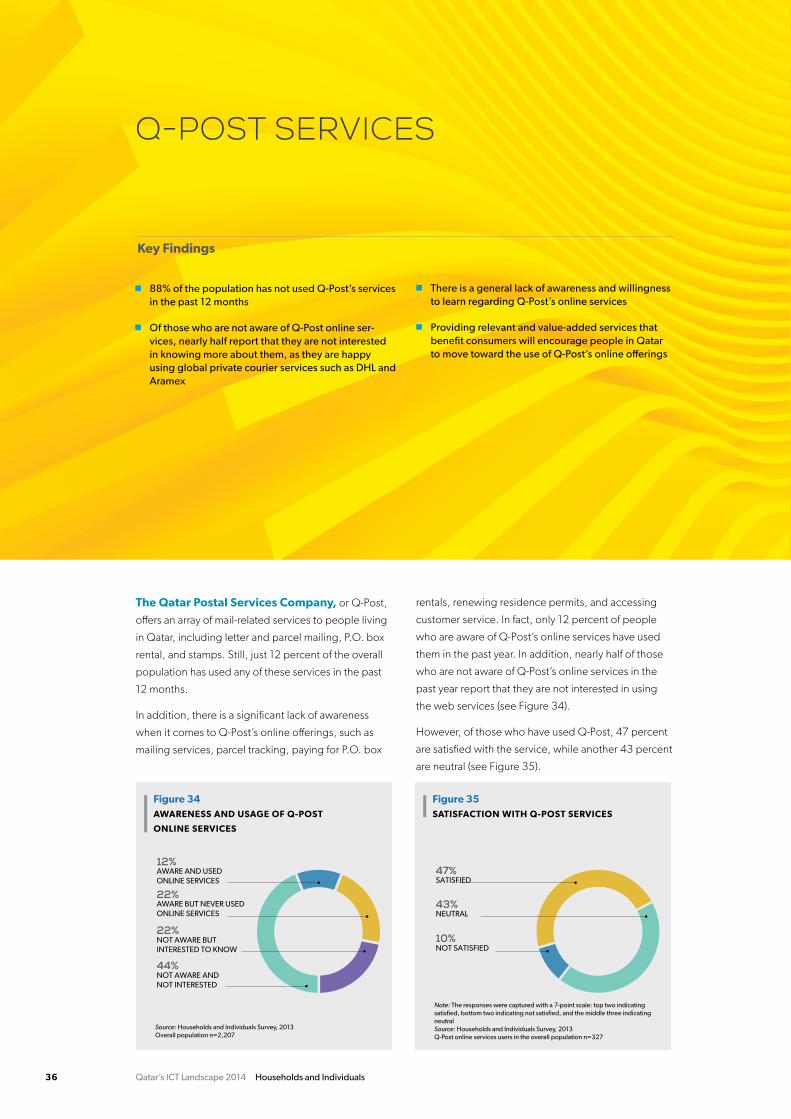
Qatar’s ICT Landscape 2014 Households and Individuals36
Q-POST SERviCES
n 88% of the population has not used Q-Post’s services in the past 12 months
n Of those who are not aware of Q-Post online ser-vices, nearly half report that they are not interested in knowing more about them, as they are happy using global private courier services such as Dhl and aramex
n there is a general lack of awareness and willingness to learn regarding Q-Post’s online services
n Providing relevant and value-added services that benefit consumers will encourage people in Qatar to move toward the use of Q-Post’s online offerings
Key Findings
The Qatar Postal services Company, or Q-Post,
offers an array of mail-related services to people living
in Qatar, including letter and parcel mailing, P.O. box
rental, and stamps. Still, just 12 percent of the overall
population has used any of these services in the past
12 months.
In addition, there is a significant lack of awareness
when it comes to Q-Post’s online offerings, such as
mailing services, parcel tracking, paying for P.O. box
rentals, renewing residence permits, and accessing
customer service. In fact, only 12 percent of people
who are aware of Q-Post’s online services have used
them in the past year. In addition, nearly half of those
who are not aware of Q-Post’s online services in the
past year report that they are not interested in using
the web services (see Figure 34).
However, of those who have used Q-Post, 47 percent
are satisfied with the service, while another 43 percent
are neutral (see Figure 35).
Figure 35SATISFACTION WITH Q-POST SERVICES
Note: The responses were captured with a 7-point scale: top two indicating satisfied, bottom two indicating not satisfied, and the middle three indicating neutralSource: Households and Individuals Survey, 2013 Q-Post online services users in the overall population n=327
10%
43%
47%SATISFIED
NOT SATISFIED
NEUTRAL
Figure 34AWARENESS AND USAGE OF Q-POST
ONLINE SERVICES
Source: Households and Individuals Survey, 2013 Overall population n=2,207
22%
22%
12%AWARE AND USED ONLINE SERVICES
NOT AWARE BUT INTERESTED TO KNOW
44%NOT AWARE AND NOT INTERESTED
AWARE BUT NEVER USED ONLINE SERVICES

Qatar’s ICT Landscape 2014 Households and Individuals 37
ONLiNE SECuRiTy AND PRivACy
n 89% of internet users in Qatar download content
n 46% of respondents report that they have not faced any security issues in the past 12 months, still 42% of internet users in the overall population were con-cerned about viruses and malware while using the internet
n 38% of internet users are concerned about the lack of privacy online, while 30% are concerned about using services such as online banking
n to safeguard children against inappropriate content online, 30% of households with children in Qatar block or filter selected websites, and 23% super-vise the internet use of their children
n People in Qatar expect the government to monitor and control the internet to effectively protect user interests
Key Findings
online security remains a major concern
for people in Qatar—specifically the threat of viruses
and/or malware on the Internet. Privacy and fraud
issues are slightly lesser fears, but are likely to increase
as usage expands from basic activities such as social
networking and file downloading to e-commerce, on-
line banking, and other advanced activities. However,
it is important to note that privacy and fraud remain key
cited reasons for the low adoption of e-commerce and
online banking (see Figure 36).
Typically, women across all ages and ethnic groups
show a higher degree of concern regarding social me-
dia privacy than men, often due to cultural sensitivities
and the rising number of related fraud cases. During
the qualitative research, most people expressed
a view that the government should more actively
promote its anti-cybercrime initiatives in order to cre-
ate increased awareness of issues such as what to do
in the case of social media harassment or fraudulent
misappropriation and use of personal information.
In general, most people in Qatar do not feel safe when
connecting to the Internet using either a mobile phone
or fixed Internet services. Young Qataris along with
mid-range adult/older Qataris and Westerners report
very low levels of confidence in this area. On the
Figure 36CONCERNS WHILE USING INTERNET, OVERALL
Note: The responses were captured with a 7-point scale: top two indicating concerned, bottom two indicating not concerned, and the middle three indicating neutralSource: Households and Individuals Survey, 2013Internet users in overall population n=2,045
42%Viruses/malware
36%Inappropriate content
38%Privacy concerns
30%Usage of services like online banking
35%Abuse of personal information
29%Financial loss
28%Fraudulent card use
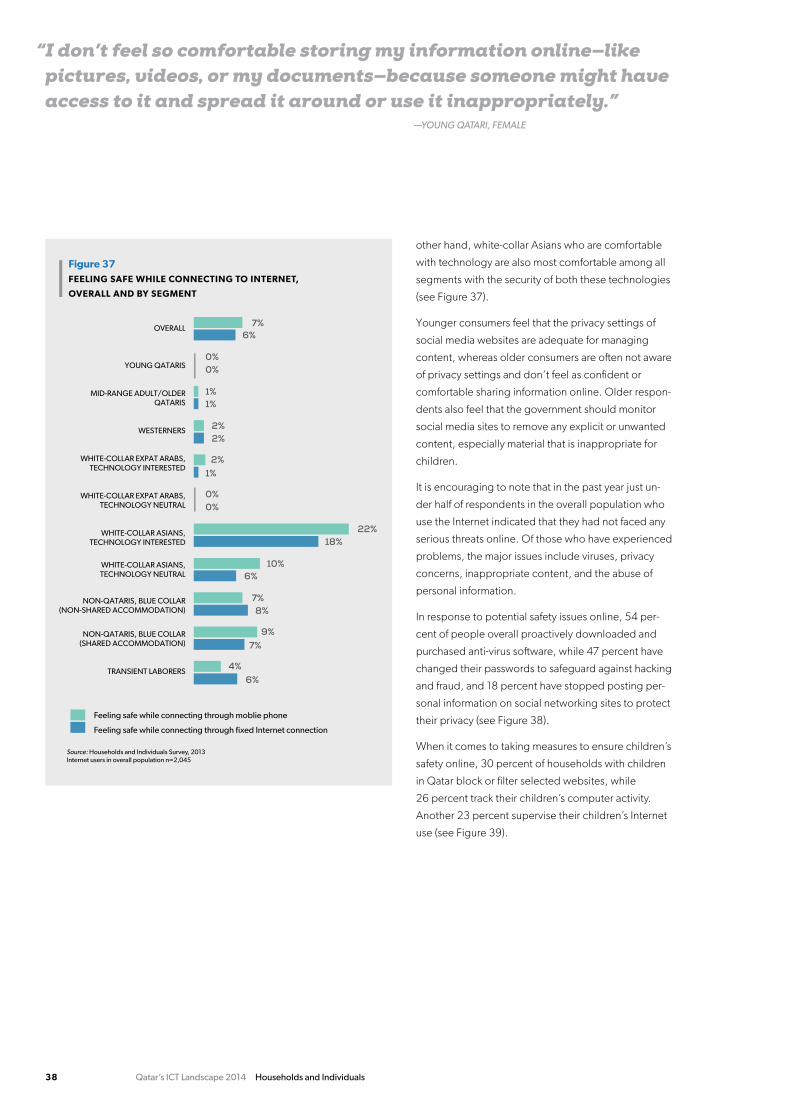
Qatar’s ICT Landscape 2014 Households and Individuals38
“I don’t feel so comfortable storing my information online—like pictures, videos, or my documents—because someone might have access to it and spread it around or use it inappropriately.” —YOUNG QATARI, FEMALE
Figure 37FEELING SAFE WHILE CONNECTING TO INTERNET,
OVERALL AND BY SEGMENT
Source: Households and Individuals Survey, 2013Internet users in overall population n=2,045
2% 2%
7% 6%
0% 0%
1% 1%
1% 2%
0% 0%
Feeling safe while connecting through moblie phone
Feeling safe while connecting through fixed Internet connection
8% 7%
22% 18%
6% 10%
7% 9%
6% 4%
OVERALL
YOUNG QATARIS
MID-RANGE ADULT/OLDER QATARIS
WESTERNERS
WHITE-COLLAR EXPAT ARABS, TECHNOLOGY INTERESTED
WHITE-COLLAR EXPAT ARABS, TECHNOLOGY NEUTRAL
WHITE-COLLAR ASIANS, TECHNOLOGY INTERESTED
WHITE-COLLAR ASIANS, TECHNOLOGY NEUTRAL
NON-QATARIS, BLUE COLLAR (NON-SHARED ACCOMMODATION)
NON-QATARIS, BLUE COLLAR (SHARED ACCOMMODATION)
TRANSIENT LABORERS
other hand, white-collar Asians who are comfortable
with technology are also most comfortable among all
segments with the security of both these technologies
(see Figure 37).
Younger consumers feel that the privacy settings of
social media websites are adequate for managing
content, whereas older consumers are often not aware
of privacy settings and don’t feel as confident or
comfortable sharing information online. Older respon-
dents also feel that the government should monitor
social media sites to remove any explicit or unwanted
content, especially material that is inappropriate for
children.
It is encouraging to note that in the past year just un-
der half of respondents in the overall population who
use the Internet indicated that they had not faced any
serious threats online. Of those who have experienced
problems, the major issues include viruses, privacy
concerns, inappropriate content, and the abuse of
personal information.
In response to potential safety issues online, 54 per-
cent of people overall proactively downloaded and
purchased anti-virus software, while 47 percent have
changed their passwords to safeguard against hacking
and fraud, and 18 percent have stopped posting per-
sonal information on social networking sites to protect
their privacy (see Figure 38).
When it comes to taking measures to ensure children’s
safety online, 30 percent of households with children
in Qatar block or filter selected websites, while
26 percent track their children’s computer activity.
Another 23 percent supervise their children’s Internet
use (see Figure 39).
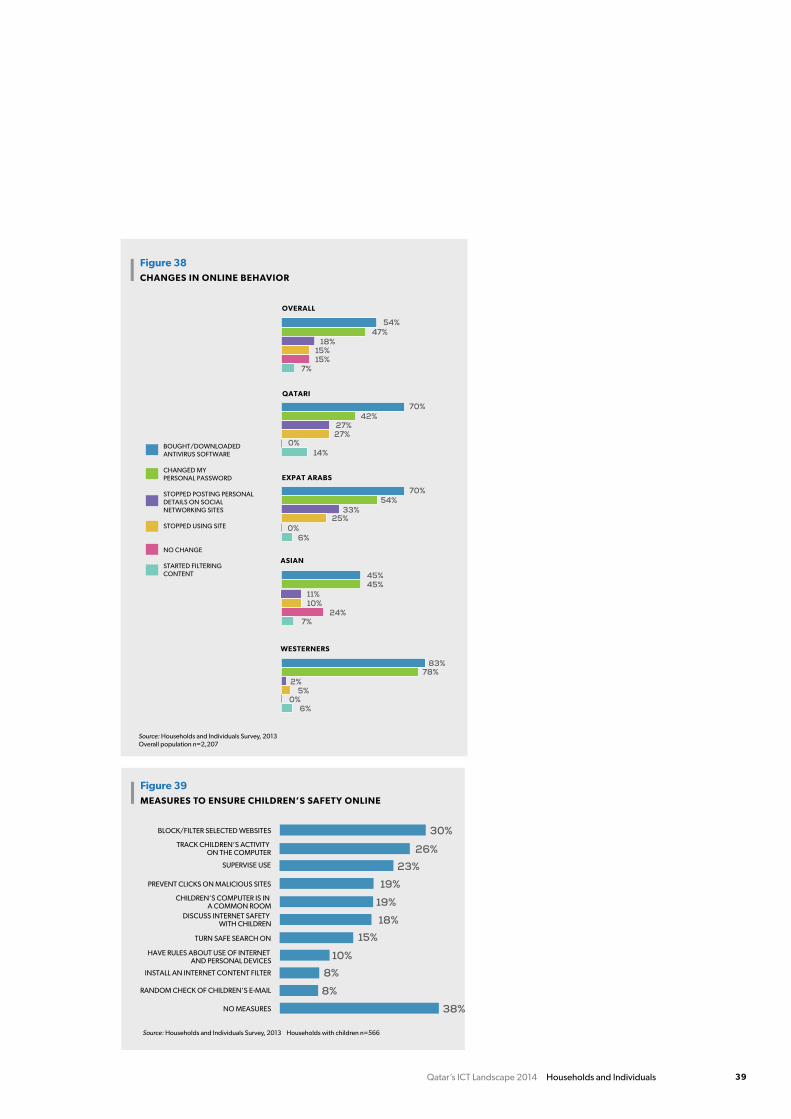
Qatar’s ICT Landscape 2014 Households and Individuals 39
Figure 39MEASURES TO ENSURE CHILDREN’S SAFETY ONLINE
Source: Households and Individuals Survey, 2013 Households with children n=566
23%SUPERVISE USE
19%PREVENT CLICKS ON MALICIOUS SITES
30%BLOCK/FILTER SELECTED WEBSITES
38%NO MEASURES
15%TURN SAFE SEARCH ON
26%TRACK CHILDREN’S ACTIVITY ON THE COMPUTER
18%DISCUSS INTERNET SAFETY WITH CHILDREN
19%CHILDREN’S COMPUTER IS IN A COMMON ROOM
8%RANDOM CHECK OF CHILDREN’S E-MAIL
10%HAVE RULES ABOUT USE OF INTERNET AND PERSONAL DEVICES
8%INSTALL AN INTERNET CONTENT FILTER
BOUGHT/DOWNLOADED ANTIVIRUS SOFTWARE
CHANGED MY PERSONAL PASSWORD
STOPPED POSTING PERSONAL DETAILS ON SOCIAL NETWORKING SITES
STOPPED USING SITE
NO CHANGE
STARTED FILTERING CONTENT
Figure 38CHANGES IN ONLINE BEHAVIOR
Source: Households and Individuals Survey, 2013Overall population n=2,207
OVERALL
QATARI
EXPAT ARABS
ASIAN
WESTERNERS
15%
18%
7%
15%
47% 54%
27%
14%
27%
42% 70%
33%
6%
25%
54% 70%
24%
11%
7%
10%
45% 45%
2%
6%
5%
78% 83%
0%
0%
0%

Qatar’s ICT Landscape 2014 Households and Individuals40
NEW SERviCES
n young Qataris are particularly enthusiastic about the launch of new technology-based services
n 72% of young Qataris reported an interest in mobile wallet; 69% are interested in money transfer via mo-bile; and nearly the same percentage are enthusias-tic about home energy systems and cloud storage
n the overall population is largely neutral about these services
Key Findings
According to the households and individuals
survey, the interest level in new technology-based
services such as mobile wallet, mobile money transfer,
home energy systems, and cloud and virtual storage
vary across different demographic groups in Qatar.
Overall, nearly a third of people in Qatar are interested
in each of these new services, with young Qataris be-
ing the most interested in each service (see Figure 40).
According to the research, there is clearly a divide in
attitudes toward new services among the Qatari and
non-Qatari populations. Qataris show a relatively
higher degree of interest for new services whereas
non-Qataris remain more neutral, overall. Across the
board, young Qataris are most interested in all of the
new services studied, especially mobile-based ones—
a finding that echoes respondents’ interest in mobile
Hukoomi and other e-government services. This area
is worth further investment by ictQATAR, especially
given the country’s high mobile penetration rate.
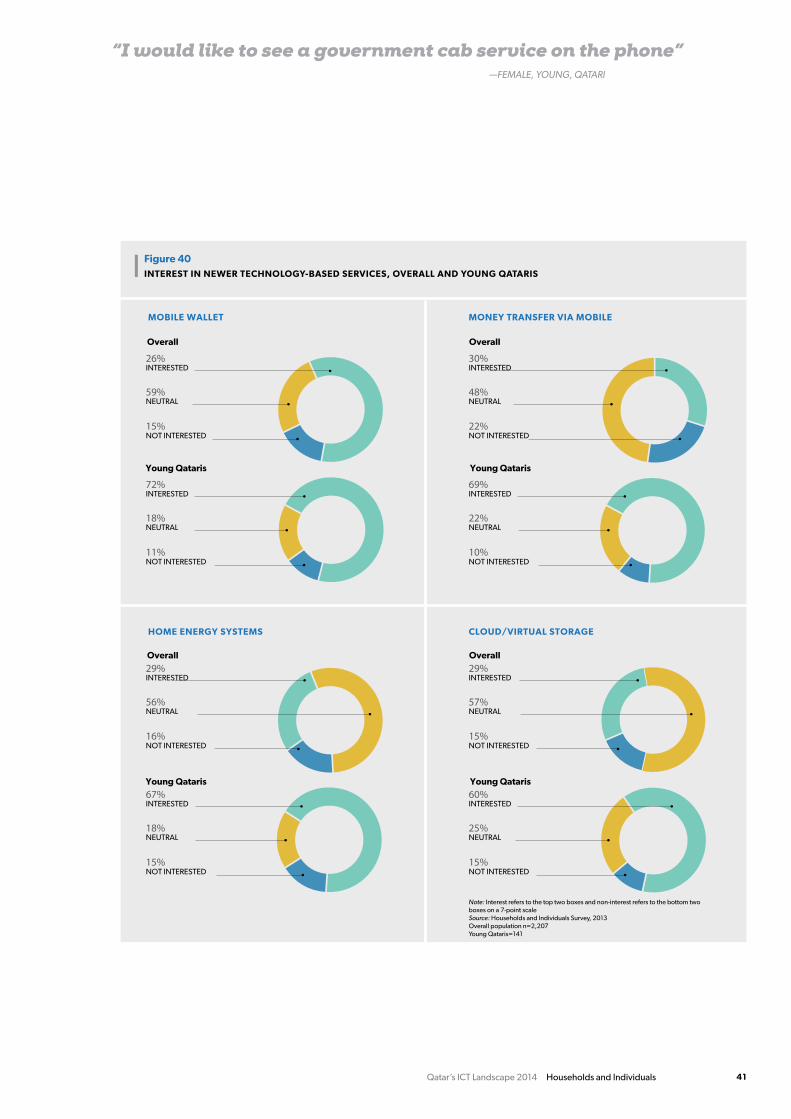
Qatar’s ICT Landscape 2014 Households and Individuals 41
“I would like to see a government cab service on the phone” —FEMALE, YOUNG, QATARI
MOBILE WALLET
Figure 40INTEREST IN NEWER TECHNOLOGY-BASED SERVICES, OVERALL AND YOUNG QATARIS
MONEY TRANSFER VIA MOBILE
HOME ENERGY SYSTEMS CLOUD/VIRTUAL STORAGE
Note: Interest refers to the top two boxes and non-interest refers to the bottom two boxes on a 7-point scaleSource: Households and Individuals Survey, 2013 Overall population n=2,207Young Qataris=141
15%
59%
26%INTERESTED
NOT INTERESTED
NEUTRAL
11%
18%
72%INTERESTED
NOT INTERESTED
NEUTRAL
22%
48%
30%INTERESTED
NOT INTERESTED
NEUTRAL
10%
22%
69%INTERESTED
NOT INTERESTED
NEUTRAL
16%
56%
29%INTERESTED
NOT INTERESTED
NEUTRAL
15%
18%
67%INTERESTED
NOT INTERESTED
NEUTRAL
15%
57%
29%INTERESTED
NOT INTERESTED
NEUTRAL
15%
25%
60%INTERESTED
NOT INTERESTED
NEUTRAL
Overall
Young Qataris
Overall
Young Qataris
Overall
Young Qataris
Overall
Young Qataris
Qatar’s ICT Landscape 2014 Households and Individuals42
CONCLuSiON
atar’s ICT Landscape Report 2014: House-
holds and Individuals highlights many encouraging
developments in Qatar’s ongoing quest to build an
advanced ICT sector that secures a bright future for
Qatar and its people. The research clearly demon-
strates that the country continues to steadily improve
its performance against international benchmarks on
almost every key ICT indicator. This is an important ac-
complishment—and a direct result of the government’s
prioritization of technology and its constant efforts to
both measure and manage gaps in the expansion of
ICT penetration and usage.
The great strides made in recent years in areas such as
usage of ICT devices and Internet penetration indicate
that ictQATAR’s policy initiatives are working, and have
created an environment that encourages the adop-
tion and use of various technologies among residents.
However, there are still areas where Qatar can improve.
While mature devices including mobile phones are
used by nearly 100 percent of the population, newer
devices like smartphones and tablets have yet to
penetrate fully—particularly in specific demographic
segments such as the transient labor population.
In order to continue building an advanced informa-
tion society and a true knowledge-based economy,
Qatar must maintain its focus on building the next-
generation infrastructure that will bring high-quality,
high-speed, affordable broadband to the nation. The
country must also continue to address other barriers
such as high ICT costs, security concerns, and the
need for more advanced ICT knowledge and skills
across all demographic groups.
Indeed, increased ICT education and training for all
in Qatar will not only lead to universal penetration but
will also drive the further adoption of advanced, next-
generation Internet-based services such as e-banking,
e-commerce, and e-government. This, in turn, will
encourage further innovation and success in both the
ICT market and the economy in general.
The nationwide effort underway to accelerate e-
government efforts across Qatar, including offering

Qatar’s ICT Landscape 2014 Households and Individuals 43
new and enhanced end-to-end services, should result
in greater awareness and usage by those who live
and work in Qatar. Ongoing initiatives in this area will
also result in an ever more streamlined, effective, and
transparent government.
Moving forward, it is crucial to focus on the increasing
interest in mobile-based services that emerged from
the households and individuals survey. The demand
for portable Internet-enabled devices and mobile
Internet connections is already growing in Qatar,
throughout the Middle East, and globally, and it is
clear that technology “on the go” is the wave of the
future. This is just one more step on Qatar’s quest to
harness the power of ICT, which will drive innovation
well into the future.

Qatar’s ICT Landscape 2014 Households and Individuals44

Qatar’s ICT Landscape 2014 Households and Individuals 45
R E S E a R c h m E t h O D O lO gy
g lO SSa Ry
D E F i n i t i O n S
APPENDix
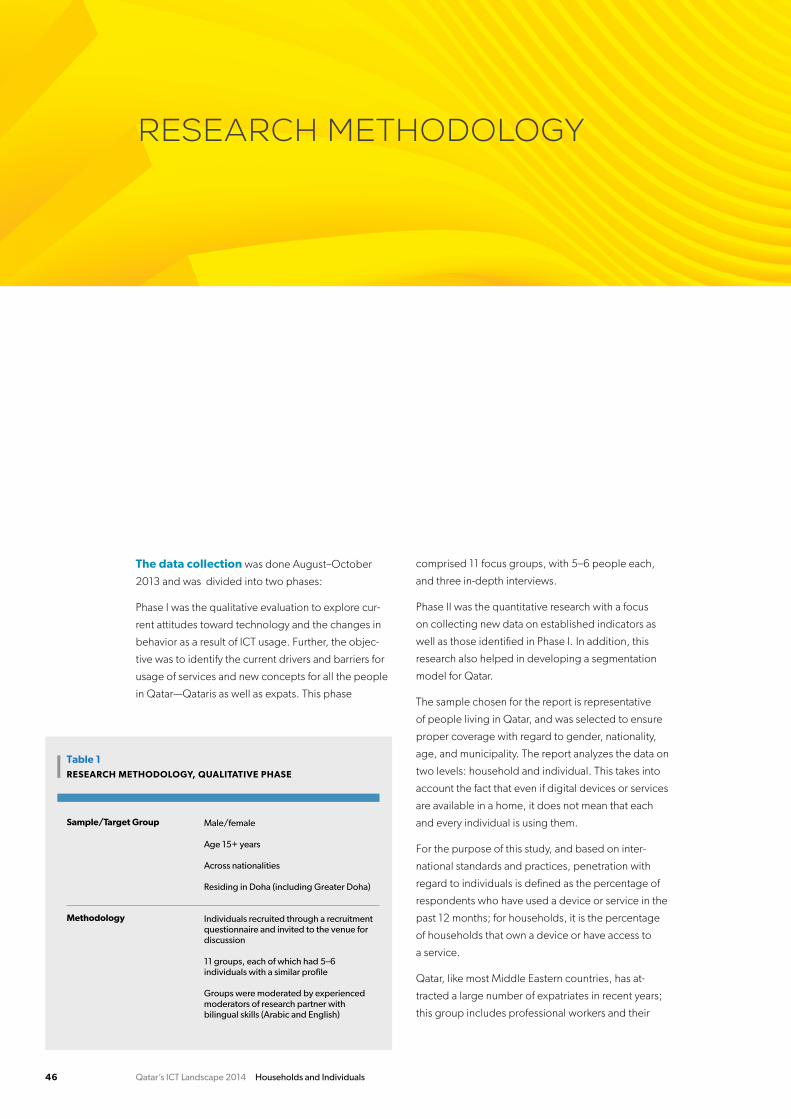
Qatar’s ICT Landscape 2014 Households and Individuals46
RESEARCH mETHODOLOGy
The data collection was done August–October
2013 and was divided into two phases:
Phase I was the qualitative evaluation to explore cur-
rent attitudes toward technology and the changes in
behavior as a result of ICT usage. Further, the objec-
tive was to identify the current drivers and barriers for
usage of services and new concepts for all the people
in Qatar—Qataris as well as expats. This phase
comprised 11 focus groups, with 5–6 people each,
and three in-depth interviews.
Phase II was the quantitative research with a focus
on collecting new data on established indicators as
well as those identified in Phase I. In addition, this
research also helped in developing a segmentation
model for Qatar.
The sample chosen for the report is representative
of people living in Qatar, and was selected to ensure
proper coverage with regard to gender, nationality,
age, and municipality. The report analyzes the data on
two levels: household and individual. This takes into
account the fact that even if digital devices or services
are available in a home, it does not mean that each
and every individual is using them.
For the purpose of this study, and based on inter-
national standards and practices, penetration with
regard to individuals is defined as the percentage of
respondents who have used a device or service in the
past 12 months; for households, it is the percentage
of households that own a device or have access to
a service.
Qatar, like most Middle Eastern countries, has at-
tracted a large number of expatriates in recent years;
this group includes professional workers and their
Table 1RESEARCH METHODOLOGY, QUALITATIVE PHASE
Sample/Target Group
Methodology
Male/female
Age 15+ years
Across nationalities
Residing in Doha (including Greater Doha)
Individuals recruited through a recruitment questionnaire and invited to the venue for discussion
11 groups, each of which had 5–6 individuals with a similar profile
Groups were moderated by experienced moderators of research partner with bilingual skills (Arabic and English)
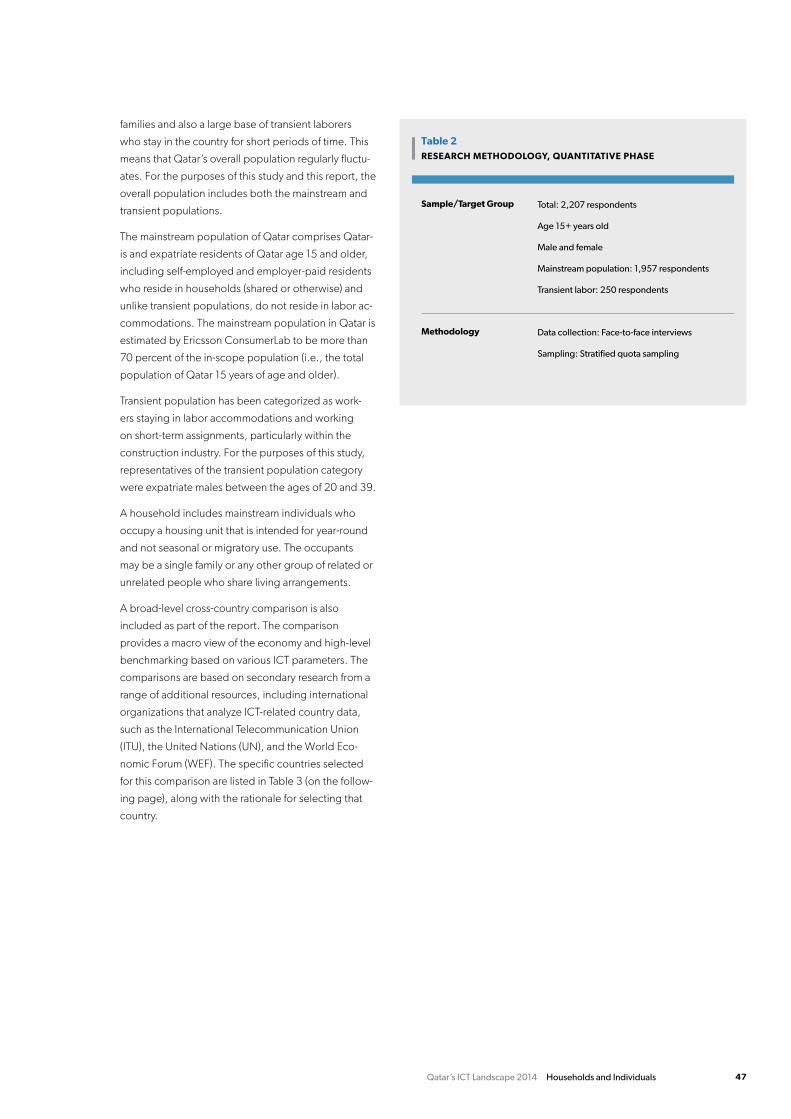
Qatar’s ICT Landscape 2014 Households and Individuals 47
Table 2RESEARCH METHODOLOGY, QUANTITATIVE PHASE
Sample/Target Group
Methodology
Total: 2,207 respondents
Age 15+ years old
Male and female
Mainstream population: 1,957 respondents
Transient labor: 250 respondents
Data collection: Face-to-face interviews
Sampling: Stratified quota sampling
families and also a large base of transient laborers
who stay in the country for short periods of time. This
means that Qatar’s overall population regularly fluctu-
ates. For the purposes of this study and this report, the
overall population includes both the mainstream and
transient populations.
The mainstream population of Qatar comprises Qatar-
is and expatriate residents of Qatar age 15 and older,
including self-employed and employer-paid residents
who reside in households (shared or otherwise) and
unlike transient populations, do not reside in labor ac-
commodations. The mainstream population in Qatar is
estimated by Ericsson ConsumerLab to be more than
70 percent of the in-scope population (i.e., the total
population of Qatar 15 years of age and older).
Transient population has been categorized as work-
ers staying in labor accommodations and working
on short-term assignments, particularly within the
construction industry. For the purposes of this study,
representatives of the transient population category
were expatriate males between the ages of 20 and 39.
A household includes mainstream individuals who
occupy a housing unit that is intended for year-round
and not seasonal or migratory use. The occupants
may be a single family or any other group of related or
unrelated people who share living arrangements.
A broad-level cross-country comparison is also
included as part of the report. The comparison
provides a macro view of the economy and high-level
benchmarking based on various ICT parameters. The
comparisons are based on secondary research from a
range of additional resources, including international
organizations that analyze ICT-related country data,
such as the International Telecommunication Union
(ITU), the United Nations (UN), and the World Eco-
nomic Forum (WEF). The specific countries selected
for this comparison are listed in Table 3 (on the follow-
ing page), along with the rationale for selecting that
country.

Qatar’s ICT Landscape 2014 Households and Individuals48
The NRI rankings are based on the Global Information
Technology Report 2013, sponsored by the World
Economic Forum and INSEAD. The countries chosen
for the overall comparative analysis are mostly from
Qatar’s ICT Landscape 2013: Households and Individ-
uals. The selection criteria included a mix of high-GDP
and high-ICT-penetration states. A developed market
perspective is provided by comparisons with Sweden,
UK, and Germany. Regional (GCC) comparisons are
made with UAE, Bahrain, Kuwait, Oman, and Saudi
Arabia. India, Estonia, and Brazil provide emerging
market comparisons. Singapore, Taiwan, and South
Korea provide insights into developed yet small
Asian countries. Data from prior years’ surveys and
international reports (such as ITU’s 2013 Measuring
the Information Society and WEF’s Global Information
Technology Report 2013) has also been used to arrive
at trend analysis for a few ICT parameters.
Percentages and rates presented in the graphs/tables
of the report are based on weighted data. The “n”
number shows the unweighted base, which repre-
sents the number of people/households interviewed
in the specified group.
Percentages shown in the report are presented up to
one decimal place and may not add up to 100 percent
due to rounding.
Analysis excludes don’t know/refusals unless other-
wise specified.
Table 3RATIONALES FOR BENCHMARKED COUNTRIES
Bahrain
Brazil
Estonia
Germany
India
Kuwait
Oman
Saudi Arabia
Singapore
South Korea
Sweden
Taiwan
UAE
UK
COUNTRY RATIONALENETWORK READINESS INDEX RANK
25
60
22
13
68
62
40
31
2
11
3
10
25
7
Regional comparison (GCC)
Fast-improving emerging economy
Fast improvement in ICT penetration
High GDP (EU)
Emerging economy
Regional comparison (GCC)
Regional comparison (GCC)
Regional comparison (GCC)
High GDP Asian city-state
High ICT penetration
High GDP economy, high NRI rank
High GDP Asian small state
Regional comparison (GCC)
High GDP economy, high ICT penetration
Qatar’s ICT Landscape 2014 Households and Individuals 49
FTTH Fiber-to-the-home
GCC gulf cooperation council
GDP gross Domestic Product
ICT information and communications technology
IPTV internet Protocol television
IT information technology
ITu international telecommunication union
MBB mobile Broadband
MoI the ministry of the interior
NRI networked Readiness index
PC Personal computer
QAR Qatari Riyal
Report, the Qatar’s ICT Landscape 2014: Households and Individuals
survey, the households and individuals Survey, 2013
uAe united arab Emirates
uK united kingdom
GLOSSARy
Qatar’s ict landscape 2014 households and individuals50
DEFiNiTiONS
services, Advanced Advanced online services
such as online banking, e-commerce, transac-
tional, e-government.
services, Basic Basic online services include
browsing, social networking, downloading con-
tent, peer-to-peer file sharing, and e-mail.
Fixed-Line Internet DSL/ADSL/VDSL line-based
connection to the Internet. Dial-up connections,
unless otherwise mentioned are also included as
fixed-line connections.
Mobile Broadband Mobile broadband is the term
for high-speed wireless Internet access through a
portable modem, mobile phone, USB wireless
modem, tablet, or another mobile device.
Blue Collar In the context of the Ericsson Consum-
erLab Segmentation Model, this indicates a
middle-income individual probably working in the
manufacturing industry. This term is used
only for representational purposes.
White Collar In the context of the Ericsson Consu-
merLab Segmentation Model, this indicates an
upper-middle-income individual probably work-
ing in the services industry. This term is used
only for representational purposes.
Mobile Internet Mobile Internet refers to access to
the World Wide Web, that is, by using
browser-based Internet services, from a handheld
mobile device, such as a smartphone,
feature phone, or other mobile device (tablet),
connected to a mobile network or another
wireless network. Technologies used could be
2G, EDGE, 3G, 4G LTE, etc.
Mobile Wallet Also known as m-money. Where
consumers can use their mobile phones to
purchase goods and services. Usually the mobile
phones are linked to the consumer’s bank ac-
counts.
smartphones Apple iOS, BB OS, Android, or
Windows feature phones enabling the user to
connect to the Internet via mobile Internet, and
WiFi through OTT applications.
overall Population Includes all residents of the
state of Qatar across all ethnicities, age-groups
(over 15 years), industries employed in, and
education levels.
Mainstream Population Includes all residents of
the state of Qatar who do not reside in labor
accommodations. This group constitutes more
than 70 percent of the population of Qatar.