q6 dummy thoracic response and diagonal belt interactions
TRANSCRIPT

P. Beillas (+33472142371, [email protected]), A. Soni and M‐C. Chevalier are researchers at the Université de Lyon, F69622, Lyon, France; Université Claude Bernard Lyon 1, Villeurbanne; IFSTTAR, UMR_T9406, LBMC Laboratoire de Biomécanique et Mécanique des Chocs, F69675, Bron. H. Johannsen is researcher at the Accident Research unit of MHH, Carl‐Neuberg‐Str. 1, 30625 Hannover, Germany, G. Müller and J. Holtz are researchers at the TU Berlin, Automotive Engineering, TIB 13.5, Gustav‐Meyer‐Allee 25, 13355 Berlin, Germany.
Abstract Chest deflection could not be correlated with thoracic injury risk in past accident reconstructions
with Q3 and Q6 dummies. The tendency of the diagonal belt to slide towards the neck was cited as one possible
explanation. In this study, two issues were investigated: 1) Kinematics: diagonal belt sliding was assessed in sled
simulations with a 6 YO human model and a Q6 model. Sliding was more pronounced with the Q6 than with the
human model. 2) Chest response: the chest of a physical Q6 was loaded with a belt in various locations. The Q6
upper ribcage was found to be much softer than the chest deflection sensor region which was not observed in
simulations with the human model. The deflection sensor also largely underestimated the deflection when the
belt loading was away from it.
Combined, these results suggest that dummy changes may be required to reduce the amount of belt sliding
and that an upper deflection sensor in the dummy could help assess thoracic loading of the Q6 dummy.
Keywords chest response, diagonal belt, human model, Q6, testing
I. INTRODUCTION
Q dummies are considered or in use in regulation R129 and consumer testing (ADAC, Euro NCAP). They
include a deformable ribcage currently equipped with single (Q1, Q1.5, Q3 and Q6) or dual (Q10) chest
deflection sensors. This chest measurement could be especially meaningful for dummies restrained by the 3‐
point‐belt on boosters (Q3, Q6, Q10) for which thoracic injuries are relatively frequent (e.g. [1]). For Q3 and Q6,
injury risk curves had been proposed in [2] based on a limited set of accident reconstructions. However, with
additional reconstructions and an updated method to calculate the risk curves, it was observed in [3] that chest
deflection was not able to predict the AIS 3+ thoracic injury risk , and the tendency of the diagonal belt to slide
towards the neck and away from the sensor was cited as one possible explanation [3]. Others have observed
similar sliding (e.g. [4‐5]). Illustrations of this phenomenon are provided in Figure 1. Arbogast et al. [6]
suggested that sliding occurred but was less prominent in low severity tests with volunteers than with the Q10.
However, it is unclear if sliding would occur for more strenuous pulses or younger ages. Different hypotheses
could be formulated including the following:
‐ The sliding is not biofidelic and it is caused by specific dummy characteristics that are not present in real
children (kinematics issue).
‐ The sliding is biofidelic, but because of the location of the measurement system (IR‐TRACC) or other
characteristics of the ribcage, the measured displacement is not related to the force applied by the belt to
the ribcage, or to the actual deflection of the ribcage (biofidelity of the chest or measurement issues).
In an attempt to better understand these issues in the absence of actual pediatric test data applicable to
high severity pulses, several approaches were developed in parallel:
1) Kinematics: simulations were performed with a human FE model representing a 6 YO child and a Q6
model. The belt motion and chest deflection were observed in various simulations.
2) Chest deflection measurement and chest characteristics: a Q6 dummy thorax was subjected to direct belt
loading in different configurations and some conditions were reproduced with the human model.
Q6 Dummy Thoracic Response and Diagonal Belt Interactions: Observations based on Dummy Testing and Human and Dummy Simulations
Philippe Beillas, Anurag Soni, Marie‐Christine Chevalier, Heiko Johannsen, Gerd Müller, Johannes Holtz
IRC-14-39 IRCOBI Conference 2014
- 332 -
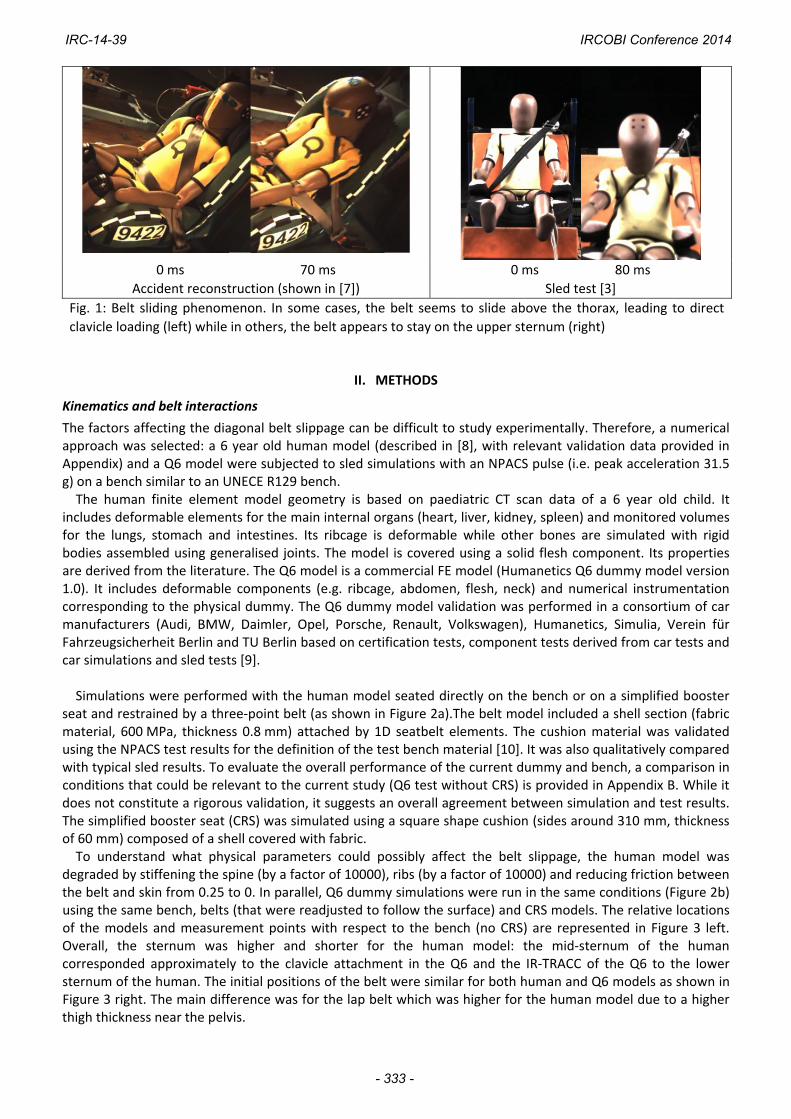
0 ms 70 ms
Accident reconstruction (shown in [7])
0 ms 80 ms
Sled test [3]
Fig. 1: Belt sliding phenomenon. In some cases, the belt seems to slide above the thorax, leading to direct
clavicle loading (left) while in others, the belt appears to stay on the upper sternum (right)
II. METHODS
Kinematics and belt interactions
The factors affecting the diagonal belt slippage can be difficult to study experimentally. Therefore, a numerical approach was selected: a 6 year old human model (described in [8], with relevant validation data provided in Appendix) and a Q6 model were subjected to sled simulations with an NPACS pulse (i.e. peak acceleration 31.5 g) on a bench similar to an UNECE R129 bench. The human finite element model geometry is based on paediatric CT scan data of a 6 year old child. It
includes deformable elements for the main internal organs (heart, liver, kidney, spleen) and monitored volumes for the lungs, stomach and intestines. Its ribcage is deformable while other bones are simulated with rigid bodies assembled using generalised joints. The model is covered using a solid flesh component. Its properties are derived from the literature. The Q6 model is a commercial FE model (Humanetics Q6 dummy model version 1.0). It includes deformable components (e.g. ribcage, abdomen, flesh, neck) and numerical instrumentation corresponding to the physical dummy. The Q6 dummy model validation was performed in a consortium of car manufacturers (Audi, BMW, Daimler, Opel, Porsche, Renault, Volkswagen), Humanetics, Simulia, Verein für Fahrzeugsicherheit Berlin and TU Berlin based on certification tests, component tests derived from car tests and car simulations and sled tests [9]. Simulations were performed with the human model seated directly on the bench or on a simplified booster
seat and restrained by a three‐point belt (as shown in Figure 2a).The belt model included a shell section (fabric material, 600 MPa, thickness 0.8 mm) attached by 1D seatbelt elements. The cushion material was validated using the NPACS test results for the definition of the test bench material [10]. It was also qualitatively compared with typical sled results. To evaluate the overall performance of the current dummy and bench, a comparison in conditions that could be relevant to the current study (Q6 test without CRS) is provided in Appendix B. While it does not constitute a rigorous validation, it suggests an overall agreement between simulation and test results. The simplified booster seat (CRS) was simulated using a square shape cushion (sides around 310 mm, thickness of 60 mm) composed of a shell covered with fabric. To understand what physical parameters could possibly affect the belt slippage, the human model was
degraded by stiffening the spine (by a factor of 10000), ribs (by a factor of 10000) and reducing friction between the belt and skin from 0.25 to 0. In parallel, Q6 dummy simulations were run in the same conditions (Figure 2b) using the same bench, belts (that were readjusted to follow the surface) and CRS models. The relative locations of the models and measurement points with respect to the bench (no CRS) are represented in Figure 3 left. Overall, the sternum was higher and shorter for the human model: the mid‐sternum of the human corresponded approximately to the clavicle attachment in the Q6 and the IR‐TRACC of the Q6 to the lower sternum of the human. The initial positions of the belt were similar for both human and Q6 models as shown in Figure 3 right. The main difference was for the lap belt which was higher for the human model due to a higher thigh thickness near the pelvis.
IRC-14-39 IRCOBI Conference 2014
- 333 -

a) Child model. Chest deflections were measured at
upper, mid and lower sternum (attached to T3, T6 and
T9, respectively) as represented on the right.
b) Q6 dummy model. Chest deflections were
measured at IR‐TRACC and Upper Sternum
(clavicle attachment)
Fig. 2: Initial positions on bench or simplified CRS for human and Q6 models
Fig. 3: comparison between human (left) and Q6 models (right) as seated on the bench. Left: positions and
approximate dimensions (in mm). Right: Overlay with the belts on without CRS and with CRS.
Chest response and deflection measurements
A physical Q6 thorax was subjected to compressions using a belt mounted on a yoke. After removing the head,
neck, upper and lower extremities, the trunk of the dummy was positioned supine on the fixed side of a
material testing machine. The only instrumentation kept was the thorax IR‐TRACC which is used to measure the
chest deflection. A thin aluminum plate was attached to the spine box with double‐sided tape in order to
prevent the contact of the posterior aspect of the deformable ribcage with the table (Figure 4a). A belt
mounted on a 450 mm wide aluminum yoke was used to load the dummy (Figure 4b). For all tests where the
belt was diagonal, a belt (50 mm wide) was attached directly to the extremities of the yoke using a stitched loop
(Figure 4c). However, when the belt was positioned perpendicularly to the spine, this mount did not allow a
good contact due to the shape of the thorax. In these cases, a belt (46 mm wide) was attached to the yoke using
an intermediate ring to allow for rotations (Figure 4d). In both cases, an equivalent belt length (about 470 mm)
was used to avoid overloading the yoke.
IRC-14-39 IRCOBI Conference 2014
- 334 -

a) Aluminum spacer used to prevent direct contact between
the back of the deformable ribcage and the table
c) 50 mm belt attachment used in
diagonal belt loading
b) Example of dummy in initial position
d) 46 mm belt attachment with ring
allowing rotations used in perpendicular
belt loading
Fig. 4: Overview of the test setup. Wooden beads were positioned on the middle of the belt and on the
dummy neck mount to facilitate the measurements
In order to obtain the position of the dummy and belt, and to quantify the chest deflection independently
from the IR‐TRACC, a Nikon Metrology laser scanner mounted on a measuring arm was used to scan the surface
of the belt and part of the dummy. Belt location was quantified on the surface scan by measuring the angle
between the mid‐sternum line and the belt midline, as well as the distance between the belt midline and the IR‐
TRACC. Additionally, the deflection at the attachment screw of the clavicle (location that would correspond to
the Upper Sternum, US) was estimated on the surface scans. Six belt positions were tested from aligned with
the chest sensor to upper edge of the ribcage (Figure 5). The first position (reference) is similar to the position
used in Q6 sled simulations (Figure 2). Three additional diagonal positions were used by translating the belt
towards the shoulder and neck by 22.5, 45 and 70 mm. In the last position, the belt is on the edge of the ribcage
and further translation would lead to direct loading of the clavicle. For the last two positions, the belt was
perpendicular to the spine either aligned with the IR‐TRACC or 40 mm below.
The belt loading was quasi‐static. It was applied by steps of 5 or 10 mm up to a maximum stroke of 30 or
35 mm depending on the position. Steps were maintained to allow for surface scanning of the belt and ribcage
under compression. The IR‐TRACC output was compared with the scan‐based deflection calculated using the
position of the center of the bead positioned on the middle of the belt. The position of the center of the bead
was obtained by sphere fitting (Nikon Focus 10.1 software). The neck attachment was used to verify that the
dummy did not move between steps (sphere and plane fitting).
IRC-14-39 IRCOBI Conference 2014
- 335 -
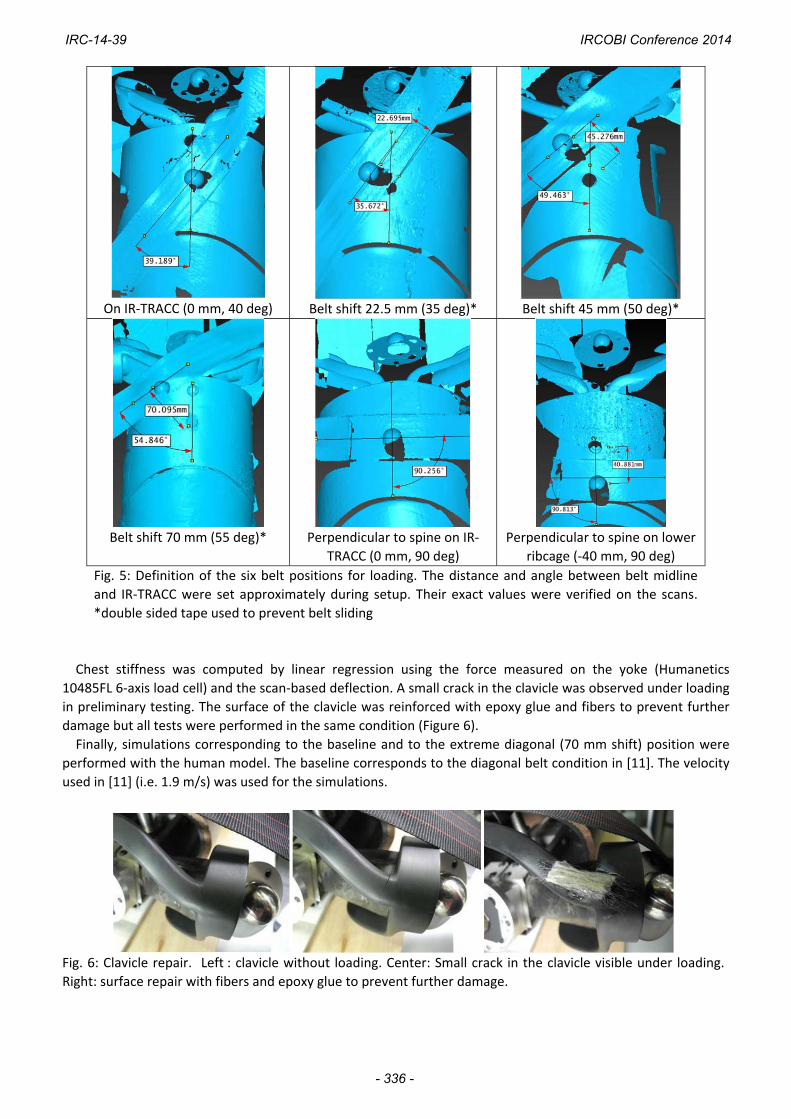
On IR‐TRACC (0 mm, 40 deg)
Belt shift 22.5 mm (35 deg)*
Belt shift 45 mm (50 deg)*
Belt shift 70 mm (55 deg)*
Perpendicular to spine on IR‐
TRACC (0 mm, 90 deg)
Perpendicular to spine on lower
ribcage (‐40 mm, 90 deg)
Fig. 5: Definition of the six belt positions for loading. The distance and angle between belt midline
and IR‐TRACC were set approximately during setup. Their exact values were verified on the scans.
*double sided tape used to prevent belt sliding
Chest stiffness was computed by linear regression using the force measured on the yoke (Humanetics
10485FL 6‐axis load cell) and the scan‐based deflection. A small crack in the clavicle was observed under loading
in preliminary testing. The surface of the clavicle was reinforced with epoxy glue and fibers to prevent further
damage but all tests were performed in the same condition (Figure 6).
Finally, simulations corresponding to the baseline and to the extreme diagonal (70 mm shift) position were
performed with the human model. The baseline corresponds to the diagonal belt condition in [11]. The velocity
used in [11] (i.e. 1.9 m/s) was used for the simulations.
Fig. 6: Clavicle repair. Left : clavicle without loading. Center: Small crack in the clavicle visible under loading.
Right: surface repair with fibers and epoxy glue to prevent further damage.
IRC-14-39 IRCOBI Conference 2014
- 336 -

III. RESULTS
Kinematics and belt interactions
Some belt sliding towards the neck was observed with the human model in the baseline configurations (with
and without CRS, Figure 7). Stiffening the spine and all further modifications resulted in increased belt slippage
in the human model for the baseline configuration without CRS (Figure 7). Lap belt slippage into the abdomen
was visible for the configurations without CRS. The presence of the CRS seemed to prevent this phenomenon
and also resulted in reduced belt slippage in the first modifications (spine, thorax stiffness) but the final
reduction in belt friction led to a larger visible slippage (Figure 7). For the dummy, the presence of the CRS did
not seem to affect the belt kinematics and, both with and without CRS, the belt slipped to the neck as shown in
Figure 8. While for the case without CRS the sliding appeared to be similar for human and Q6 models, the sliding
was more pronounced with the dummy with CRS (lower starting point than without CRS but same final position)
than with the human model (lower starting point but no sliding to the neck).
Chest deflection patterns were different for the human model and Q6. Deflections seemed much higher for
human (Figure 9) than Q6 (Figure 10). Also, for the Q6, the peak deflections were due to chin contact rather
than belt loading (Figure 10) and the local peak that could be attributed to belt loading around 60 ms was only
around 18 mm at most.
In the baseline conditions without CRS, the highest deflection for the human model (Figure 9) was for the
mid sternum (around 40 mm) followed by 27 mm and 33 mm for lower and upper sternum, respectively.
Corresponding values were much lower for the Q6 with 12 mm for the upper sternum location (clavicle
attachment) and 8mm for IR‐TRACC. In the baseline condition with CRS, the highest deflection for the human
model was for the lower sternum (49mm) while other values seemed lower (36 mm and 22 mm in mid and
upper sternum, respectively). For the dummy, the values were also higher than without CRS, with 18 mm at the
upper sternum and 14 mm at the IR‐TRACC. The locations of the maximum deflections seemed in agreement
with belt final locations observed in baseline simulations in Figure 8 for the human model (lower for the case
with CRS) and in Figure 9 for the Q6 (same high position for bench and CRS).
IRC-14-39 IRCOBI Conference 2014
- 337 -

Configuration 1: Model on Bench (no CRS) Configuration 2: Model on CRS
Baseline
Stiffer spine
Stiffer spine and ribs
Stiffer spine and ribs with zero friction
Fig. 7: Comparison of shoulder belt sliding at 70 ms for normal and degraded 6 YO human model
Initial belt positions on bench or on CRS Corresponding belt positions after slippage
Fig. 8: Shoulder belt slippage in the Q6 model
IRC-14-39 IRCOBI Conference 2014
- 338 -

Fig. 9: Chest deflection patterns for the human model on bench (left) or CRS (right), at lower,
mid and upper sternum. (baseline simulations without model changes)
Fig. 10: Chest deflection patterns for the Q6 model on bench or CRS, measured at IR‐TRACC or
Upper Sternum (clavicle attachment). Chin contact (Left, snapshot at 95ms) rather than belt force
seems responsible for the peak chest deflection. Belt force seems to be responsible for the first local
peak.
Chest response and deflection measurements
All tests were performed successfully without further clavicle damage. An illustration of the process with the
compression steps is provided in Figure 11. The force vs. deflection at belt and the IR‐TRACC vs deflection at
belt curves for the six positions are provided in Figure 12. Corresponding regression coefficients as well as the
deflection estimated in the upper sternum and maximum values reached in the tests are provided in Table 1.
Overall, the Q6 chest stiffness was highly location‐dependent, with a factor of 0.42 between belt aligned and
belt at 45 mm from the sensor. In these two positions, IR‐TRACC outputs were 91% and 57% of the scan‐based
deflection at belt, respectively (a perfect coupling would correspond to a value of 100%). In the extreme
position (70 mm, 55 degrees), the ratio decreased to 40%. Overall, the slope between IR‐TRACC and deflection
at belt decreased with the distance between the belt and the IR‐TRACC (as shown in Figure 13), with a loss of
sensitivity of approximately 7% per 10 mm of belt displacement.
Figure 14 compares the human model responses for diagonal belt loading at two extreme belt positions.
Thorax stiffness was similar for both belt positions whether computed using mid‐sternum deflection or
deflection under the belt. Correspondences between deflections computed at the upper sternum are also
proposed in Figure 14.
‐60
‐50
‐40
‐30
‐20
‐10
0
0 20 40 60 80 100 120
Deflection(m
m)
Time (ms)
Upper
Sternum
MidSternum
LowerSternum
Bench
‐60
‐50
‐40
‐30
‐20
‐10
0
0 20 40 60 80 100 120
Deflection(m
m)
Time (ms)
Upper
Sternum
MidSternum
Lower
Sternum
CRS
IRC-14-39 IRCOBI Conference 2014
- 339 -
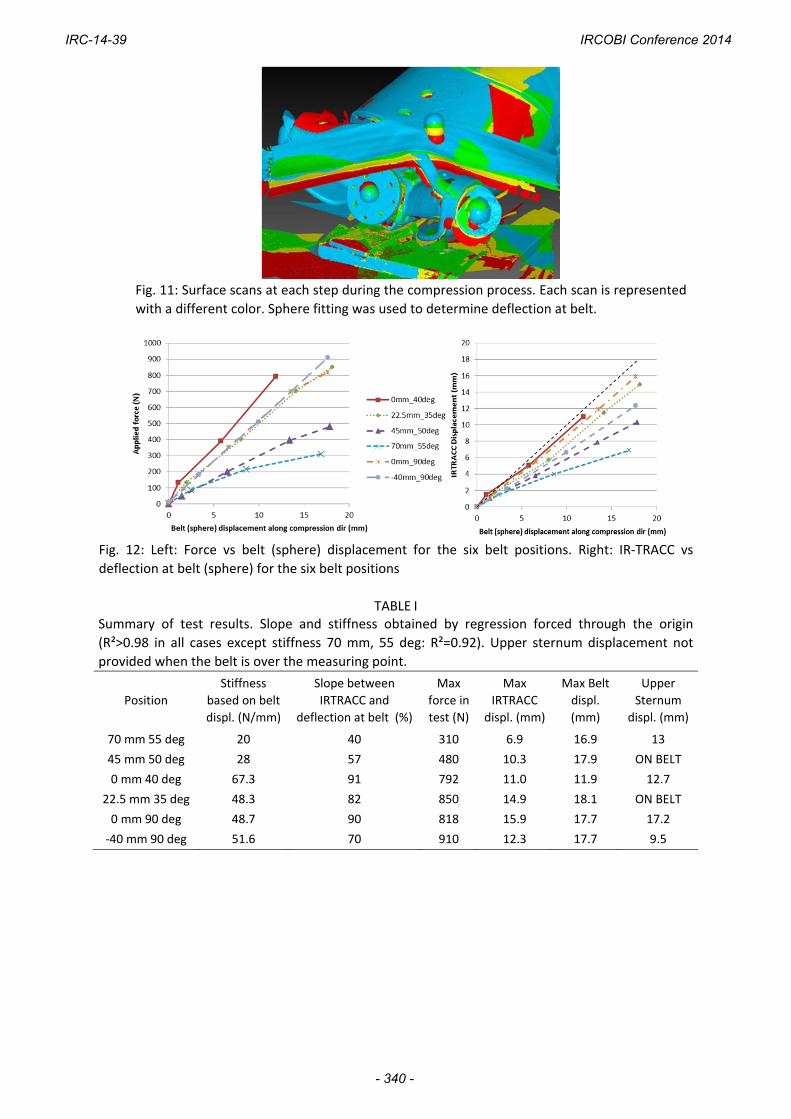
Fig. 11: Surface scans at each step during the compression process. Each scan is represented
with a different color. Sphere fitting was used to determine deflection at belt.
Fig. 12: Left: Force vs belt (sphere) displacement for the six belt positions. Right: IR‐TRACC vs
deflection at belt (sphere) for the six belt positions
TABLE I Summary of test results. Slope and stiffness obtained by regression forced through the origin
(R²>0.98 in all cases except stiffness 70 mm, 55 deg: R²=0.92). Upper sternum displacement not
provided when the belt is over the measuring point.
Position
Stiffness
based on belt
displ. (N/mm)
Slope between
IRTRACC and
deflection at belt (%)
Max
force in
test (N)
Max
IRTRACC
displ. (mm)
Max Belt
displ.
(mm)
Upper
Sternum
displ. (mm)
70 mm 55 deg 20 40 310 6.9 16.9 13
45 mm 50 deg 28 57 480 10.3 17.9 ON BELT
0 mm 40 deg 67.3 91 792 11.0 11.9 12.7
22.5 mm 35 deg 48.3 82 850 14.9 18.1 ON BELT
0 mm 90 deg 48.7 90 818 15.9 17.7 17.2
‐40 mm 90 deg 51.6 70 910 12.3 17.7 9.5
IRC-14-39 IRCOBI Conference 2014
- 340 -

Fig. 13: Slope of IR‐TRACC vs. deflection at belt curves plotted as a function of the
distance between belt and IR‐TRACC (R²=0.95).
Fig. 14: Comparison of thorax stiffness of the 6 yo human model during diagonal belt loading at 1.9 m/s for
baseline and extreme positions corresponding to the reference and 70 mm shift positions for the dummy tests.
IV. DISCUSSION
Regarding the kinematic behavior, the human model seemed more sensitive to the presence of a CRS than
the Q6 model, both for abdominal loading by the lap belt (absent for the dummy and present for the human
without CRS) and the diagonal belt motion. Diagonal belt sliding was more prominent for the Q6 than the
human model with the CRS but seemed similar without. One should be cautious when comparing the belt
slippage without CRS as the abdominal loading by the lap belt in the human model simulations may have
affected the overall kinematics (e.g. allowing further pelvis displacement thereby affecting the trunk position).
When analysing the trunk kinematics for the human model, the forward flexion of the thoracic spine, combined
with the forward motion of the shoulder, the local thorax deformation and the friction seemed to create a
surface in the upper thorax that could oppose the upward motion of the belt.
An illustration of this phenomenon is provided in Figure 15. Considering the possible significance of the
forward motion of the shoulder made possible by the articulated clavicle, it could be desirable to validate to
human model response for that loading mode in the future. In the absence of directly applicable data for
children, range of motion and stiffness based on the adult could be considered (e.g. [12]).
IRC-14-39 IRCOBI Conference 2014
- 341 -

Fig. 15: Left: Top view of the skeleton and belt interactions (top view, case without CRS, at 0 and
76 ms, clavicle, T1 and acromion in red).
In contrast, the belt always slipped and ended in a similar position for the dummy, with or without CRS.
Resulting deflections were very different, with much lower values for the Q6 and different patterns that seem
related to the belt positions and geometrical differences shown in Figure 3. Overall, the maximum deflection
was very sensitive to the measurement location in both human and Q6 models and this should be further
investigated.
Also, while some parameters seemed to affect the slippage in the human (besides CRS), a preliminary study
was conducted on the dummy model to evaluate possible parameter changes but none of the parameters
tested up to now (e.g. neck shield reinforcement, friction, lumbar stiffness) was found to affect significantly the
final belt position or chest deflection. Based on the comparison with the human simulations, more significant
changes (e.g. shoulder and thoracic spine design) may be required to make the kinematic response more similar
to the human model. While it is unclear if the human model represents a valid biofidelic target and whether the
effort on its validation should be continued (e.g. to include tests in Kallieris et al. [13]), the current kinematic
validation and representation of anatomical structures and functions could be already more thorough than its
dummy counterpart.
Regarding the thorax stiffness response, test results showed that the upper thorax of the standard Q6 had a
lower stiffness than the lower thorax. This was not observed in the human simulations. This stiffness differential
could contribute to the belt slippage tendency as, for a given belt force, the thorax resistance becomes lower as
the belt moves upwards. This could be a possible cause for the consistency of the end position of the belt in the
dummy simulations. However, it should be noted that the table top dummy loading was quasi‐static while the
human model loading was performed at 1.9 m/s. This is a limitation for the comparison as the difference of rate
sensitivity between physical dummy and human model is unknown. The analyses of the deflection also suggest
that the measurement at the IR‐TRACC position could lead to a large underestimation of the thoracic deflection
(expanding on the preliminary trend observed on the human model between mid and upper sternum
measurement): overall, the IR‐TRACC seems to loose sensitivity (compared to the actual deflection at the belt)
by about 7% for every 10 mm of belt shift. This may be amplified by the stiffness difference between upper and
lower ribcage (resulting in little deformation of the lower chest). Such loss of sensitivity seems problematic
because belt motion always seems present in dummy tests or simulations and would be difficult to quantify
accurately in sled or vehicle testing. Therefore, independently from the control of belt slippage, a second
measurement of the thorax deflection on an upper sternum location could help mitigate some of the current
issues. It must be noted that moving the IR‐TRACC to a higher location may not be sufficient as loading of the
lower ribcage could occur (e.g. for smaller dummies used with shield systems or in case of misuse with the belt
under the arm) and would not be well captured by a single measurement on the upper sternum. Also, while the
configurations tested seem to cover most cases where the belt remains on the upper thorax of the Q6, the belt
could slip off the ribcage in some cases (as shown in Figure 1 left) and the usefulness of the upper sternum
measurement would then be uncertain. Repeating some of these tests for that loading condition (and verifying
that the clavicle damage had little effect on the dummy response) could be useful in future studies. However, it
is unclear if such slippage off the ribcage would be possible in the human; besides the higher sternum location
IRC-14-39 IRCOBI Conference 2014
- 342 -

observed on the human model in Figure 3, which would need to be confirmed using statistical measurements,
the clavicle is attached to the sternum above the ribs in humans and below in the Q6.
V. CONCLUSIONS
The possible issue of belt sliding in Q dummies was studied using multiple approaches. Sled simulations were
conducted with Q6 and 6 Y.O. human models while the thoracic response to belt loading in various locations
was tested using a physical Q6 dummy and simulated with the human model. The results suggest that (1) sliding
is more prominent in the Q6 dummy than in the human model, (2) the upper ribcage of the dummy is softer
than the region where the deflection sensor is implanted and (3) the deflection sensor largely underestimates
the chest deflection when belt loading is applied to the upper ribcage. Combined, these results suggest that
significant dummy changes may be required to reduce the amount of belt sliding and that an upper deflection
sensor could help mitigate some of the issues. In view of these findings, the implantation of an upper thoracic
chest deflection measurement sensor is being implemented and further investigation of the factors that could
effectively affect belt sliding is being considered.
VI. ACKNOWLEDGEMENT
Part of the work presented in the current study was supported by the French Ministry of Industry and Pays de la Loire Regional Council through the ProEtech Competitive Cluster project. The initial human and bench modeling efforts were funded by EC (Casper Project).
VII. REFERENCES
[1] Beillas P, Alonzo F, Chevalier M‐C, Johannsen H, Renaudin F, Lesire P. Abdominal pressure twin sensors for the Q dummies: from Q3 to Q10. Proceedings of the ICrash Conference, 2012, Milan, Italy.
[2] Wismans J, Waagmeester K, LeClaire M, Hynd D, de Jager K, Palisson A, van Ratingen M, Trosseille X, Qdummies report – advanced child dummies and injury criteria for frontal impact, EEVC Document No. 514, 2008
[3] Johannsen H, Trosseille X, Lesire P, Beillas P. Estimating Q‐Dummy injury criteria using the CASPER project results and scaling adult. Proceedings of IRCOBI Conference, 2012, Dublin, Ireland.
[4] Lubbe N. Comparison of Hybrid III 6yo and Q6 child dummies in high severity frontal impact tests. 8th International Conference on Protection of Children in Cars, 2010, Munich, Germany.
[5] Croatto S, Masuda M. Q10 and HIII‐10 YO in frontal impact: Sensitivity to restraint systems. Proceedings of the 23rd ESV Conference, 2013, Seoul, Korea.
[6] Arbogast K, Locey C, Bohman K, Seacrist T. Relative kinematics of the shoulder belt and the torso: Comparison of the Q10 ATD and pediatric human volunteers, Proceedings of IRCOBI Conference, 2013, Gothenburg, Sweden.
[7] Beillas P, Alonzo F, et al. Abdominal twin pressure sensors for the assessment of abdominal injuries in Q dummies: In‐dummy evaluation and performance in accident reconstructions. Stapp Car Crash Journal, 2012, 56:387‐410.
[8] Beillas P, Soni A, Renaudin F, Johannsen H. Comparison of the submarining behaviours of a 6 year old human model and a Q6 dummy in sled testing, Proceedings of 11th International Conference Protection of Children in Cars, 2013, Munich, Germany.
[9] Humanetics, Q6 Child Dummy Model LS‐Dyna – Release version 1.0, March 2013
[10] NPACS final task report Task C4: Measuring Seat Belt and Seat Geometry and (dynamic) Stiffness; 2005
[11] Kent R, Lopez¬Valdes FJ, et al. Characterization of the pediatic chest and abdomen using three post¬mortem human subjects. Proceedings of the 22nd ESV Conference, 2011, Washington DC.
[12] Davidsson J. Volunteer Shoulder range of motion and stiffness: data for evaluation of crash test dummies and human body models. Proceedings of the IRCOBI Conference, 2013, Gothenburg, Sweden.
IRC-14-39 IRCOBI Conference 2014
- 343 -
[13] Kallieris D, Barz J, Schmidt G, Hess G, Mattern R. Comparison between child cadavers and child dummy by using child restraint systems in simulated collisions. Stapp Car Crash Conference, 1976, paper 760815, Dearborn, MI, USA.
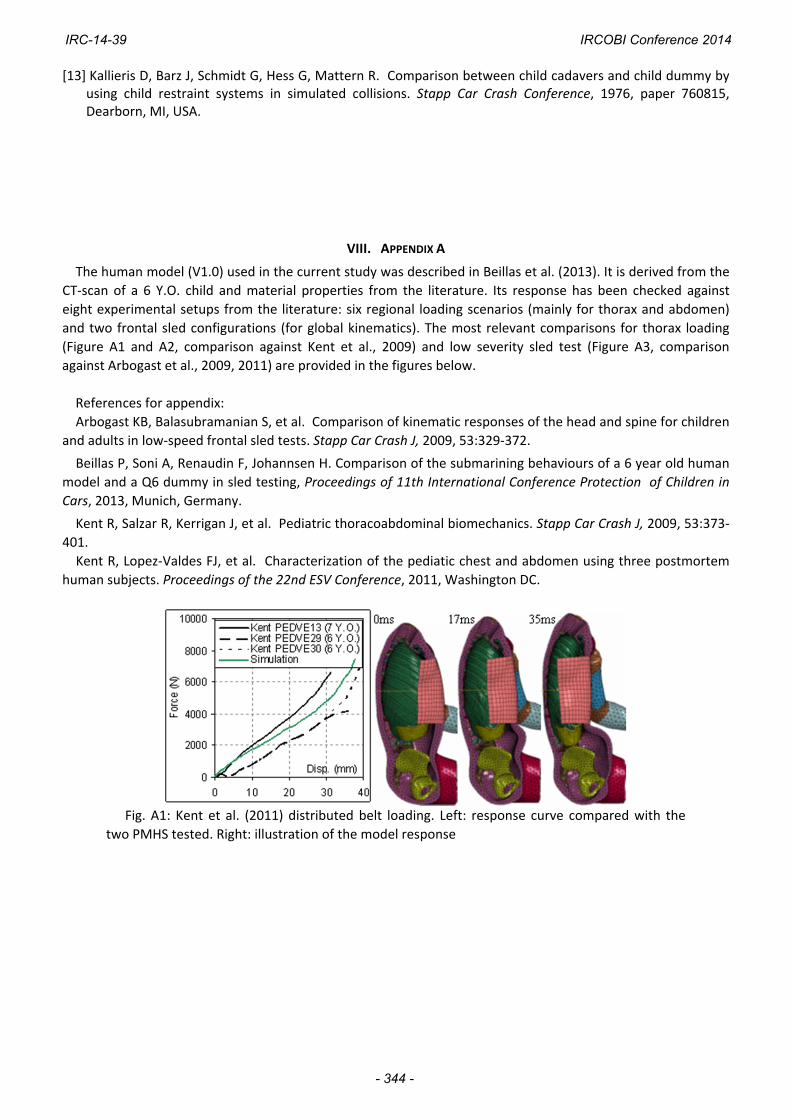
VIII. APPENDIX A
The human model (V1.0) used in the current study was described in Beillas et al. (2013). It is derived from the
CT‐scan of a 6 Y.O. child and material properties from the literature. Its response has been checked against
eight experimental setups from the literature: six regional loading scenarios (mainly for thorax and abdomen)
and two frontal sled configurations (for global kinematics). The most relevant comparisons for thorax loading
(Figure A1 and A2, comparison against Kent et al., 2009) and low severity sled test (Figure A3, comparison
against Arbogast et al., 2009, 2011) are provided in the figures below.
References for appendix:
Arbogast KB, Balasubramanian S, et al. Comparison of kinematic responses of the head and spine for children
and adults in low‐speed frontal sled tests. Stapp Car Crash J, 2009, 53:329‐372.
Beillas P, Soni A, Renaudin F, Johannsen H. Comparison of the submarining behaviours of a 6 year old human
model and a Q6 dummy in sled testing, Proceedings of 11th International Conference Protection of Children in
Cars, 2013, Munich, Germany.
Kent R, Salzar R, Kerrigan J, et al. Pediatric thoracoabdominal biomechanics. Stapp Car Crash J, 2009, 53:373‐
401.
Kent R, Lopez‐Valdes FJ, et al. Characterization of the pediatic chest and abdomen using three postmortem
human subjects. Proceedings of the 22nd ESV Conference, 2011, Washington DC.
Fig. A1: Kent et al. (2011) distributed belt loading. Left: response curve compared with the
two PMHS tested. Right: illustration of the model response
IRC-14-39 IRCOBI Conference 2014
- 344 -

Fig. A2: Kent et al. (2011) diagonal belt loading. Left: response curve compared with the PMHS
tested. Right: model response
Fig. A3: Comparison of (a) shoulder belt force, (b) lap belt force and (c) marker trajectories
between experiment and simulation for low severity sled impact tests in Arbogast et al. (2009)
IRC-14-39 IRCOBI Conference 2014
- 345 -
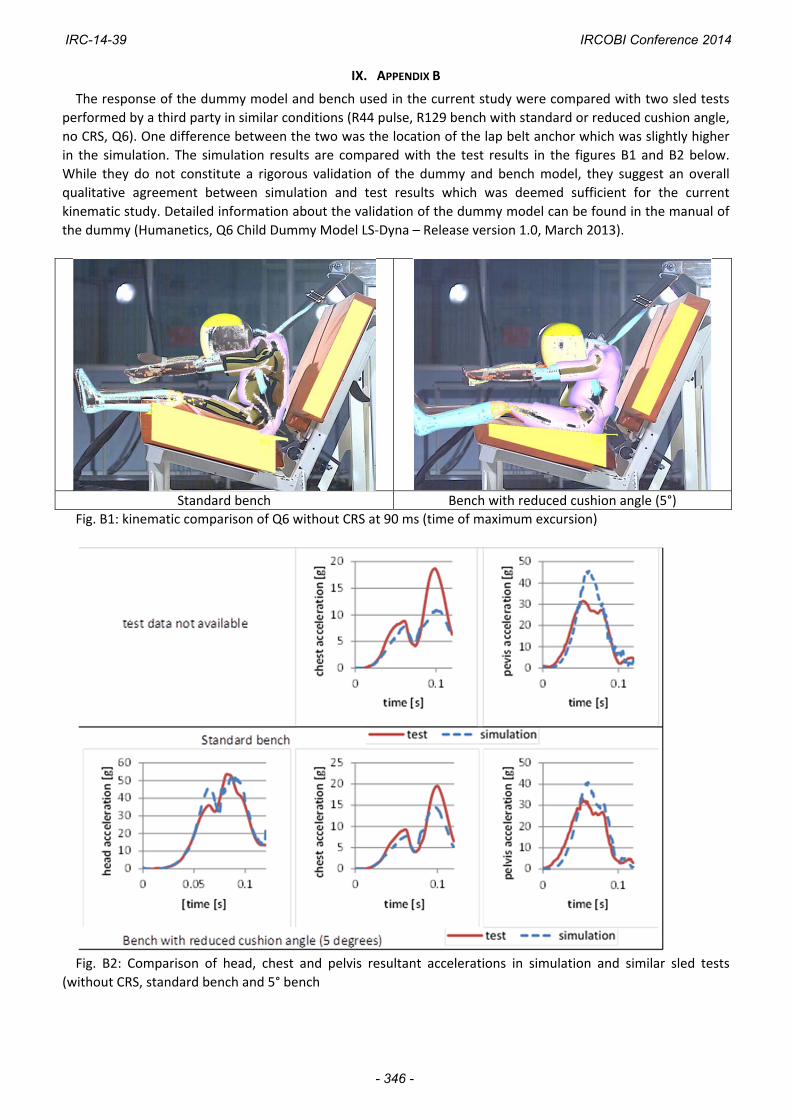
IX. APPENDIX B
The response of the dummy model and bench used in the current study were compared with two sled tests
performed by a third party in similar conditions (R44 pulse, R129 bench with standard or reduced cushion angle,
no CRS, Q6). One difference between the two was the location of the lap belt anchor which was slightly higher
in the simulation. The simulation results are compared with the test results in the figures B1 and B2 below.
While they do not constitute a rigorous validation of the dummy and bench model, they suggest an overall
qualitative agreement between simulation and test results which was deemed sufficient for the current
kinematic study. Detailed information about the validation of the dummy model can be found in the manual of
the dummy (Humanetics, Q6 Child Dummy Model LS‐Dyna – Release version 1.0, March 2013).
Standard bench Bench with reduced cushion angle (5°)
Fig. B1: kinematic comparison of Q6 without CRS at 90 ms (time of maximum excursion)
Fig. B2: Comparison of head, chest and pelvis resultant accelerations in simulation and similar sled tests
(without CRS, standard bench and 5° bench
IRC-14-39 IRCOBI Conference 2014
- 346 -