q3 results 2017 - panalpina · by sap tm system roll-out. modest volume growth in ocean freight...
TRANSCRIPT

RESULTS FROM JANUARY TO SEPTEMBER 2017 | BASEL | 19 OCTOBER 2017
NINE MONTHS RESULTS 2017INVESTOR PRESENTATION
2Q3 RESULTS 2017 | 19 OCTOBER 2017 |
Achievements and key figures
Operating and financial review
Outlook and priorities 2017
Appendix
3Q3 RESULTS 2017 | 19 OCTOBER 2017 |
ACHIEVEMENTS AND KEY FIGURES
4Q3 RESULTS 2017 | 19 OCTOBER 2017 |
479
299
246
185
2016 HYQ3
2017 HYQ3
PROFIT (adjusted for 2016)
608
420
329
301
2016 HYQ3
2017 HYQ3
EBIT (adjusted for 2016)
7363
6731
3554
3517
2016 HYQ3
2017 HYQ3
GROSS PROFIT
THIRD CONSECUTIVE QUARTER WITH GP AND EBIT GROWTH
ACHIEVEMENTSFINANCIAL HIGHLIGHTS CHALLENGES
Conversion ratio improved to 19 in Air Freight in Q3
Slightly higher costs driven by SAP TM system roll-out
Modest volume growth in Ocean Freight with low but
stable margins
Significant improvement in cash position compared to
end of June 2017
Strong volume growth and gross profit margin
recovery in Air Freight
Ocean Freight profitability
-61
-230
-333
1rsquo0248
1rsquo0917
721
936
484
726
YTD currency impact -03 (CHF -35 million)
YTD currency impact -44 (CHF -30 million)
YTD currency impact -45 (CHF -21 million)
Chart1
PROFIT (adjusted for 2016)
2016 HYQ32017 HYQ347942993
2016 HYQ32017 HYQ324621846
SNVeryHiddenParameterSheet
Charts
GROSS PROFIT
2016 HYQ32017 HYQ37362967311
2016 HYQ32017 HYQ33554135165
EBIT (adjusted for 2016)
2016 HYQ32017 HYQ36076999999999999641959999999999994
2016 HYQ32017 HYQ332863009
PROFIT (adjusted for 2016)
2016 HYQ32017 HYQ347942993
2016 HYQ32017 HYQ324621846
NOT IN USE
Chart2
EBIT (adjusted for 2016)
2016 HYQ32017 HYQ36076999999999999641959999999999994
2016 HYQ32017 HYQ332863009
SNVeryHiddenParameterSheet
Charts
GROSS PROFIT
2016 HYQ32017 HYQ37362967311
2016 HYQ32017 HYQ33554135165
EBIT (adjusted for 2016)
2016 HYQ32017 HYQ36076999999999999641959999999999994
2016 HYQ32017 HYQ332863009
PROFIT (adjusted for 2016)
2016 HYQ32017 HYQ347942993
2016 HYQ32017 HYQ324621846
NOT IN USE
Chart3
GROSS PROFIT
2016 HYQ32017 HYQ37362967311
2016 HYQ32017 HYQ33554135165
SNVeryHiddenParameterSheet
Charts
GROSS PROFIT
2016 HYQ32017 HYQ37362967311
2016 HYQ32017 HYQ33554135165
EBIT (adjusted for 2016)
2016 HYQ32017 HYQ36076999999999999641959999999999994
2016 HYQ32017 HYQ332863009
PROFIT (adjusted for 2016)
2016 HYQ32017 HYQ347942993
2016 HYQ32017 HYQ324621846
NOT IN USE
5Q3 RESULTS 2017 | 19 OCTOBER 2017 |
OPERATING AND FINANCIAL REVIEW
6Q3 RESULTS 2017 | 19 OCTOBER 2017 |
AIR FREIGHT STRONG AND PROFITABLE GROWTH
YTD 8 volume growth Improved unit profitability Conversion rate at previous-year
level
Note Gross profit and EBIT in CHF million
YoY Growth Q3 Q4 Q1 Q2 Q3Volume (market estimated) 2 8 6 10 10
Volume (Panalpina) 10 14 8 7 8
GPton -7 -14 -10 -10 -1
Gross Profit 2 -2 -3 -4 8
2017
2016 2017Gross Profit EBIT YTD YTDGross Profit 4534 4560 1
EBIT (adjusted PY) 726 694 -4
EBITGP () 160 152
Volumes (tons 000) 6690 7220 8
228252
233 240 249
653
562620 625 648
Q3 2016 Q4 2016 Q1 2017 Q2 2017 Q3 2017
TONNAGE GPTON
Tons (000) GPTon (in CHF)
269
208171
220
303
181
147118
147
188
Q3 2016 Q4 2016 Q1 2017 Q2 2017 Q3 2017
EBIT AND EBITGP MARGIN
EBIT (adjusted PY) EBITGP margin () (adjusted PY)
SNVeryHiddenParameterSheet
Table
Charts
TONNAGE GPTON
Tons (000)
Q3 2016Q4 2016Q1 2017Q2 2017Q3 20172282522332399248935GPTon (in CHF)
6535626206251430000000000364832899999999995
EBIT AND EBITGP MARGIN
EBIT (adjusted PY)
Q3 2016Q4 2016Q1 2017Q2 2017Q3 20172692081710000000000000121963330331299999999999EBITGP margin () (adjusted PY)
181000000000000011471181464999999999999918790000000000003
Chart1
TONNAGE GPTON
Tons (000)
Q3 2016Q4 2016Q1 2017Q2 2017Q3 20172282522332399248935GPTon (in CHF)
6535626206251430000000000364832899999999995
SNVeryHiddenParameterSheet
Table
Charts
TONNAGE GPTON
Tons (000)
Q3 2016Q4 2016Q1 2017Q2 2017Q3 20172282522332399248935GPTon (in CHF)
6535626206251430000000000364832899999999995
EBIT AND EBITGP MARGIN
EBIT (adjusted PY)
Q3 2016Q4 2016Q1 2017Q2 2017Q3 20172692081710000000000000121963330331299999999999EBITGP margin () (adjusted PY)
181000000000000011471181464999999999999918790000000000003
Chart2
EBIT AND EBITGP MARGIN
EBIT (adjusted PY)
Q3 2016Q4 2016Q1 2017Q2 2017Q3 20172692081710000000000000121963330331299999999999EBITGP margin () (adjusted PY)
181000000000000011471181464999999999999918790000000000003
SNVeryHiddenParameterSheet
Table
Charts
TONNAGE GPTON
Tons (000)
Q3 2016Q4 2016Q1 2017Q2 2017Q3 20172282522332399248935GPTon (in CHF)
6535626206251430000000000364832899999999995
EBIT AND EBITGP MARGIN
EBIT (adjusted PY)
Q3 2016Q4 2016Q1 2017Q2 2017Q3 20172692081710000000000000121963330331299999999999EBITGP margin () (adjusted PY)
181000000000000011471181464999999999999918790000000000003
7Q3 RESULTS 2017 | 19 OCTOBER 2017 |
OCEAN FREIGHT QUARTERLY LOSS DUE TO MARGIN STAGNATION
YTD 4 volume growth Higher volumes however at lower
margin and with increased costs resulted in loss for Q3
Note Gross profit and EBIT in CHF million
YoY Growth Q3 Q4 Q1 Q2 Q3Volume (market estimated) 0 3 4 3 3
Volume (Panalpina) -9 1 7 3 2
GPTEU -2 -18 -17 -7 -5
Gross Profit -10 -16 -11 -5 -3
2017
2016 2017Gross Profit EBIT YTD YTDGross Profit 3450 3234 -6
EBIT (adjusted PY) 160 -55 -135
EBITGP () 46 -17
Volumes (TEUs 000) 10995 11426 4
379 389 374 383 386
296
254
282 285 282
Q3 2016 Q4 2016 Q1 2017 Q2 2017 Q3 2017
TEU GPTEU
TEU (in 000) GPTEU (in CHF)
51
-51 -32
06
-29
45
-51 -30
06
-27
Q3 2016 Q4 2016 Q1 2017 Q2 2017 Q3 2017
EBIT AND EBITGP MARGIN
EBIT (adjusted PY) EBITGP margin () (adjusted PY)
SNVeryHiddenParameterSheet
Sheet1
charts
TEU GPTEU
TEU (in 000)
Q3 2016Q4 2016Q1 2017Q2 2017Q3 2017379389374382838560500000000002GPTEU (in CHF)
Q3 2016Q4 2016Q1 2017Q2 2017Q3 20172962542822849460000000000328207499999999999
EBIT AND EBITGP MARGIN
EBIT (adjusted PY)
Q3 2016Q4 2016Q1 2017Q2 2017Q3 201750999999999999996-50999999999999996-3205806-29489999999999998EBITGP margin () (adjusted PY)
Q3 2016Q4 2016Q1 2017Q2 2017Q3 201745-50999999999999996-305806-271
Chart1
TEU GPTEU
TEU (in 000)
Q3 2016Q4 2016Q1 2017Q2 2017Q3 2017379389374382838560500000000002GPTEU (in CHF)
Q3 2016Q4 2016Q1 2017Q2 2017Q3 20172962542822849460000000000328207499999999999
SNVeryHiddenParameterSheet
Sheet1
charts
TEU GPTEU
TEU (in 000)
Q3 2016Q4 2016Q1 2017Q2 2017Q3 2017379389374382838560500000000002GPTEU (in CHF)
Q3 2016Q4 2016Q1 2017Q2 2017Q3 20172962542822849460000000000328207499999999999
EBIT AND EBITGP MARGIN
EBIT (adjusted PY)
Q3 2016Q4 2016Q1 2017Q2 2017Q3 201750999999999999996-50999999999999996-3205806-29489999999999998EBITGP margin () (adjusted PY)
Q3 2016Q4 2016Q1 2017Q2 2017Q3 201745-50999999999999996-305806-271
Chart2
EBIT AND EBITGP MARGIN
EBIT (adjusted PY)
Q3 2016Q4 2016Q1 2017Q2 2017Q3 201750999999999999996-50999999999999996-3205806-29489999999999998EBITGP margin () (adjusted PY)
Q3 2016Q4 2016Q1 2017Q2 2017Q3 201745-50999999999999996-305806-271
SNVeryHiddenParameterSheet
Sheet1
charts
TEU GPTEU
TEU (in 000)
Q3 2016Q4 2016Q1 2017Q2 2017Q3 2017379389374382838560500000000002GPTEU (in CHF)
Q3 2016Q4 2016Q1 2017Q2 2017Q3 20172962542822849460000000000328207499999999999
EBIT AND EBITGP MARGIN
EBIT (adjusted PY)
Q3 2016Q4 2016Q1 2017Q2 2017Q3 201750999999999999996-50999999999999996-3205806-29489999999999998EBITGP margin () (adjusted PY)
Q3 2016Q4 2016Q1 2017Q2 2017Q3 201745-50999999999999996-305806-271
8Q3 RESULTS 2017 | 19 OCTOBER 2017 |
LOGISTICS IMPROVED PROFITABILITY
Top-line has stabilized Focus on growth
EBIT-over-NFR-margin of 20
Note Gross profit and EBIT in CHF million
2016 2017
Gross Profit EBIT YTD YTD
Gross Profit 2933 2454 -16
EBIT (adjusted PY) 50 81 63
NFR in of EBIT 10 20
YoY Growth Q3 Q4 Q1 Q2 Q3
Gross Profit -6 -11 -16 -19 -14
2017
94 9283 81 81
Q3 2016 Q4 2016 Q1 2017 Q2 2017 Q3 2017
GROSS PROFIT
0905
24
3127
Q3 2016 Q4 2016 Q1 2017 Q2 2017 Q3 2017
EBIT (ADJUSTED PY)
SNVeryHiddenParameterSheet
Table
charts
GROSS PROFIT
Q3 2016Q4 2016Q1 2017Q2 2017Q3 201794928381348148
EBIT (ADJUSTED PY)
Q3 2016Q4 2016Q1 2017Q2 2017Q3 2017090524306271
SNVeryHiddenParameterSheet
Table
charts
GROSS PROFIT
Q3 2016Q4 2016Q1 2017Q2 2017Q3 201794928381348148
EBIT (ADJUSTED PY)
Q3 2016Q4 2016Q1 2017Q2 2017Q3 2017090524306271
Chart1
GROSS PROFIT
Q3 2016Q4 2016Q1 2017Q2 2017Q3 201794928381348148
SNVeryHiddenParameterSheet
Table
charts
GROSS PROFIT
Q3 2016Q4 2016Q1 2017Q2 2017Q3 201794928381348148
EBIT (ADJUSTED PY)
Q3 2016Q4 2016Q1 2017Q2 2017Q3 2017090524306271
Chart2
EBIT (ADJUSTED PY)
Q3 2016Q4 2016Q1 2017Q2 2017Q3 2017090524306271
SNVeryHiddenParameterSheet
Table
charts
GROSS PROFIT
Q3 2016Q4 2016Q1 2017Q2 2017Q3 201794928381348148
EBIT (ADJUSTED PY)
Q3 2016Q4 2016Q1 2017Q2 2017Q3 2017090524306271
9Q3 RESULTS 2017 | 19 OCTOBER 2017 |
OUTLOOK AND PRIORITIES 2017
10Q3 RESULTS 2017 | 19 OCTOBER 2017 |
OUTLOOK AND PRIORITIES 2017
OUTLOOK Market
minus Air continuous strong volumes expected but growth rate slowing down (tough Q4 2016 comparison)
minus Ocean Soft market conditions Q4
Panalpina
minus Air margin impact of peak season difficult to anticipate
minus Ocean spot market rates have decreased lately and a slight margin improvement could be expected
PRIORITIES
Focus on topline growth and further improvement of unit profitability
Improve EBIT in Ocean Freight
Accelerate growth through selected bolt-on acquisitions
Maintain cost discipline and push ahead operations transformation program
11Q3 RESULTS 2017 | 19 OCTOBER 2017 |
YEAR-END RESULTS
MARCH 7 2018
NEXT EVENTS
12Q3 RESULTS 2017 | 19 OCTOBER 2017 |
DISCLAIMER
Investing in the shares of Panalpina World Transport (Holding) Ltd involves risks Prospective investors are strongly requested to consult their investment advisors and tax advisors prior to investing in shares of Panalpina World Transport (Holding) Ltd
This document contains forward-looking statements which involve risks and uncertainties These statements may be identified by such words as ldquomayrdquo ldquoplansrdquo ldquoexpectsrdquo ldquobelievesrdquo and similar expressions or by their context These statements are made on the basis of current knowledge and assumptions Various factors could cause actual future results performance or events to differ materially from those described in these statements No obligation is assumed to update any forward-looking statements Potential risks and uncertainties include such factors as general economic conditions foreign exchange fluctuations competitive product and pricing pressures and regulatory developments
The information contained in this document has not been independently verified and no representation or warranty express or implied is made to and no reliance should be placed on the fairness accuracy completeness or correctness of the information or opinions contained herein The information in this presentation is subject to change without notice it may be incomplete or condensed and it may not contain all material information concerning the Panalpina Group None of Panalpina World Transport (Holding) Ltd or their respective affiliates shall have any liability whatsoever for any loss whatsoever arising from any use of this document or its content or otherwise arising in connection with this document
This document does not constitute or form part of an offer to sell or a solicitation of an offer to purchase any shares and neither it nor any part of it shall form the basis of or be relied upon in connection with any contract or commitment whatsoever This information does neither constitute an offer to buy shares of Panalpina World Transport (Holding) Ltd nor a prospectus within the meaning of the applicable Swiss law
13Q3 RESULTS 2017 | 19 OCTOBER 2017 |
APPENDIX
14Q3 RESULTS 2017 | 19 OCTOBER 2017 |
INCOME STATEMENT PER QUARTER ndash GROUP
Note Group figures in CHF million
Group Q1 2016 Q2 2016 Q3 2016 Q3YTD Q4 2016 FY 2016 Q1 2017 Q2 2017 Q3 2017 Q3YTD 2017Net forwarding revenue 13072 12894 12670 38635 13325 51960 12772 13549 14334 40655 Forwarding expenses (9423) (9180) (9116) (27718) (9996) (37714) (9445) (10145) (10818) (30407)Gross profit 3649 3714 3554 10917 3329 14246 3327 3404 3516 10248 Personnel expenses (2250) (2213) (2129) (6592) (2113) (8705) (2164) (2162) (2186) (6511)Other operating expenses (1037) (1011) (971) (3018) (927) (3945) (893) (880) (925) (2698)EBITDA adjusted 362 491 454 1307 289 1596 271 362 406 1039 Depreciation of property plant and equip (62) (62) (62) (187) (71) (258) (53) (54) (50) (156)Amortization of intangible assets (60) (60) (63) (183) (56) (239) (54) (52) (55) (162)EBIT adjusted 240 368 329 936 163 1099 164 256 301 721 in of gross profit 66 99 92 86 49 77 49 75 86 70Non-recurring itemsRestructuring expenses 00 (261) 00 (261) (19) (280) 00 00 00 00
EBIT reported 240 107 329 675 144 820 164 256 301 721 in of gross profit 66 29 92 62 43 58 49 75 86 70Financial result (09) 07 (04) (06) 02 (04) 02 01 (04) (02)Earnings before taxes (EBT) 231 114 325 670 146 816 165 257 297 719 Income tax expenses (58) (69) (79) (205) (88) (293) (42) (81) (112) (235) of EBT 250 602 242 306 601 359 252 316 378 327Profit 173 45 246 465 58 523 124 176 185 484 Earnings per share 075 021 106 201 027 229 054 075 079 208
SNVeryHiddenParameterSheet
PAN_ISpQ_Group
image1png
15Q3 RESULTS 2017 | 19 OCTOBER 2017 |
INCOME STATEMENT PER QUARTER ndash AIR FREIGHT
Note Air Freight figures in CHF million
Air Freight Q1 2016 Q2 2016 Q3 2016 Q3YTD 2016 Q4 2016 FY 2016 Q1 2017 Q2 2017 Q3 2017 Q3 YTD 2017Net forwarding revenue 6332 6359 6341 19032 7234 26267 6571 7000 7389 20960 Forwarding expenses (4846) (4800) (4853) (14499) (5816) (20315) (5125) (5500) (5775) (16400)Gross profit 1486 1559 1489 4534 1418 5952 1447 1500 1614 4560 Personnel expenses (885) (869) (847) (2600) (873) (3473) (905) (916) (928) (2750)Other operating expenses (371) (359) (318) (1048) (284) (1333) (324) (317) (337) (978)EBITDA adjusted 230 331 324 885 261 1146 218 266 349 833 Depreciation and amortization (52) (52) (55) (158) (53) (211) (46) (47) (46) (139)EBIT adjusted 178 279 269 726 208 935 171 220 303 694 in of gross profit 120 179 181 160 147 157 118 146 188 152Non-recurring itemsRestructuring expenses 00 (127) 00 (127) 00 (127) 00 00 00 00
EBIT reported 178 153 269 600 208 808 171 220 303 694 in of gross profit 120 98 181 132 147 136 118 146 188 152
Air Freight volumes (000 tons) 2161 2251 2278 6690 2524 9214 2332 2399 2489 7220 change YoY 54 111 99 88 141 102 79 66 93 79GPton (CHF) 688 693 653 678 562 646 620 625 648 632 change YoY -47 -36 -73 -52 -140 -75 -98 -97 -08 -68
SNVeryHiddenParameterSheet
PAN_ISpQ_AirFreight
image1png
16Q3 RESULTS 2017 | 19 OCTOBER 2017 |
INCOME STATEMENT PER QUARTER ndash OCEAN FREIGHT
Note Ocean Freight figures in CHF million
Ocean Freight Q1 2016 Q2 2016 Q3 2016 Q3YTD 2016 Q4 2016 FY 2016 Q1 2017 Q2 2017 Q3 2017 Q3YTD 2017Net forwarding revenue 5338 4921 4955 15214 4770 19984 4915 5172 5551 15637 Forwarding expenses (4157) (3773) (3834) (11764) (3783) (15547) (3860) (4081) (4463) (12404)Gross profit 1181 1148 1121 3450 987 4438 1055 1091 1088 3234 Personnel expenses (791) (752) (755) (2298) (721) (3019) (779) (784) (788) (2352)Other operating expenses (305) (288) (274) (868) (275) (1144) (271) (265) (290) (827)EBITDA adjusted 84 108 92 284 (09) 275 05 41 09 55 Depreciation and amortization (41) (42) (41) (124) (42) (166) (36) (36) (38) (110)EBIT adjusted 43 66 51 160 (51) 109 (32) 06 (29) (55)in of gross profit 37 58 45 46 -51 25 -30 05 -27 -17Non-recurring itemsRestructuring expenses 00 (97) 0 (97) (19) (115) 00 00 00 00
EBIT reported 43 (30) 51 63 (69) (06) (32) 06 (29) (55)in of gross profit 37 -26 45 18 -70 -01 -30 05 -27 -17
Ocean Freight volumes (000 tons) 3482 3726 3787 10995 3890 14885 3742 3828 3856 11426 change YoY -100 -82 -88 -90 08 -66 75 27 18 39GPTEU (CHF) 339 308 296 314 254 298 282 285 282 283 change YoY 102 59 -16 47 -176 -11 -169 -75 -47 -98
SNVeryHiddenParameterSheet
PAN_ISpQ_OceanFreight
image1png
17Q3 RESULTS 2017 | 19 OCTOBER 2017 |
INCOME STATEMENT PER QUARTER ndash LOGISTICS
Note Logistics figures in CHF million
Logistics Q1 2016 Q2 2016 Q3 2016 Q3YTD 2016 Q4 2016 FY 2016 Q1 2017 Q2 2017 Q3 2017 Q3YTD 2017Net forwarding revenue 1402 1613 1374 4389 1321 5709 1286 1377 1394 4057 Forwarding expenses (420) (607) (429) (1456) (397) (1853) (460) (564) (580) (1604)Gross profit 982 1006 944 2933 924 3857 825 813 815 2454 Personnel expenses (574) (591) (528) (1694) (519) (2213) (479) (461) (469) (1409)Other operating expenses (360) (363) (378) (1102) (367) (1469) (298) (298) (298) (894)EBITDA adjusted 48 52 38 138 37 175 48 54 48 151 Depreciation and amortization (29) (29) (29) (88) (32) (119) (25) (24) (21) (69)EBIT adjusted 18 23 09 50 05 56 24 31 27 81 Non-recurring itemsRestructuring expenses 00 (38) 00 (38) 00 (38) 00 00 00 00
EBIT reported 18 (15) 09 12 05 18 24 31 27 81
SNVeryHiddenParameterSheet
PAN_ISpQ_Logistics
image1png
18Q3 RESULTS 2017 | 19 OCTOBER 2017 |
BALANCE SHEET
CHF Cash and cash equivalents 3888 2946 (942) -24Trade receivables unbilled forwarding services 9087 9893 806 9Other current assets 1025 1167 142 14Property plant and equipment 635 803 168 26Intangible assets 979 917 (62) -6Other non-current assets 990 1133 143 14Total assets 16606 16859 253 2
Short-term borrowings 23 21 (02) -10Trade payables accured cost of services 6524 7075 551 8Other current liabilities 2439 2254 (185) -8Long-Term borrowings 00 20 20 naOther long-term liabilities 1449 1527 78 5Total liabilities 10436 10896 460 4Share capital 24 24 (00) -1Reserves treasury shares 6057 5884 (173) -3Non-controlling interests 89 55 (34) -38Total equity 6170 5963 (207) -3Total equity and liabilities 16606 16859 253 2
31-Dec-16 30-Sept-17Change in
SNVeryHiddenParameterSheet
PAN_BalanceSheet
image1png
19Q3 RESULTS 2017 | 19 OCTOBER 2017 |
CASH FLOW
Note Figures in CHF million
30-Sep-16 30-Sep-17Change in
Cash flow before changes in working capital 1029 1075 Changes in working capital 357 (477)Cash from operations 1386 599
Interest and income taxes paid (292) (331)Net cash from operating activities 1094 267 -76
Net cash from investing activities (342) (409) 20
Free cash flow 752 (141) -119
Net cash used in financing activities (858) (894) 4
Net increase (decrease) in cash and cash equivalents (106) (1035)Cash and cash equivalents at beginning of period 3923 3888 Effect of exchange rate changes (17) 93 Cash and cash equivalents at end of period 3799 2946
SNVeryHiddenParameterSheet
Tabele PAN_Cashflow
Reported cash and cash equivalents at 31122016Profit YTD 092017Other non-cash items (eg DampA)Changes in working capitalInterest and income taxes paidNet cash from investing activitiesFinancing activitiesdividendEffect of exchange rate changesReported cash and cash equivalents at 300920173887843716999999999996448614155374652852799999999999728527999999999997Reported cash and cash equivalents at 31122016Profit YTD 092017Other non-cash items (eg DampA)Changes in working capitalInterest and income taxes paidNet cash from investing activitiesFinancing activitiesdividendEffect of exchange rate changesReported cash and cash equivalents at 30092017388784839591476633114085893793329463
- Nine months results 2017
- Slide Number 2
- ACHIEVEMENTS and key figures
- Third consecutive quarter with GP and EBIT Growth
- Operating and financial review
- Air Freight Strong and profitable growth
- Ocean Freight quarterly loss due to margin Stagnation
- Logistics improved profitability
- Outlook and priorities 2017
- outlook and priorities 2017
- Next EVENTs
- Disclaimer
- Appendix
- Income statement per quarter ndash Group
- Income statement per quarter ndash Air Freight
- Income statement per quarter ndash Ocean Freight
- Income statement per quarter ndash Logistics
- Balance sheet
- Cash flow
-
| 30-Sep-16 | 30-Sep-17 | Change in | ||||||||||||||||||||||||||||||||||||||||||||||||||||||
| Cash flow before changes in working capital | 1029 | 1075 | r2 PAC Hamon Pierrick Referenced Value (value_1_PQACTJAN02)1313Document Q3_2017_Quarter_Report13Chapter Consolidated Statement of Cash Flows13Row ltlt Subtotal cash flow from operations gtgt (ltlt 2017 gtgt q_act_jan)13User Value 10749 Tsd | PY IS MANUAL | ||||||||||||||||||||||||||||||||||||||||||||||||||||
| Changes in working capital | 357 | (477) | r3 PAC Hamon Pierrick Referenced Value (value_1_PQACTJAN02)1313Document Q3_2017_Quarter_Report13Chapter Consolidated Statement of Cash Flows1313-7973 Tsd - ltlt (Increase) decrease receivables other current assets and unbilled forwarding services gtgt (ltlt 2017 gtgt q_act_jan)134406 Tsd - ltlt Increase (decrease) payables and accruals incl accrued cost of service gtgt (ltlt 2017 gtgt q_act_jan)13-472 Tsd - ltlt Increase (decrease) non-current provisions and other liabilities gtgt (ltlt 2017 gtgt q_act_jan)13-749 Tsd - ltlt Increase (decrease) current provisions and other liabilities gtgt (ltlt 2017 gtgt q_act_jan)13---------------------13-4787 Tsd (Total) | |||||||||||||||||||||||||||||||||||||||||||||||||||||
| Cash from operations | 1386 | 599 | r4 PAC Hamon Pierrick Referenced Value (value_1_PQACTJAN02)1313Document Q3_2017_Quarter_Report13Chapter Consolidated Statement of Cash Flows13Row ltlt Cash generated from operations gtgt (ltlt 2017 gtgt q_act_jan)13User Value 5963 Tsd | |||||||||||||||||||||||||||||||||||||||||||||||||||||
| Interest and income taxes paid | (292) | (331) | r6 PAC Hamon Pierrick Referenced Value (value_1_PQACTJAN02)1313Document Q3_2017_Quarter_Report13Chapter Consolidated Statement of Cash Flows1313-136 Tsd - ltlt Interest paid gtgt (ltlt 2017 gtgt q_act_jan)13-3175 Tsd - ltlt Income taxes paid gtgt (ltlt 2017 gtgt q_act_jan)13---------------------13-3311 Tsd (Total) | |||||||||||||||||||||||||||||||||||||||||||||||||||||
| Net cash from operating activities | 1094 | 267 | -76 | r7 PAC Hamon Pierrick Referenced Value (value_1_PQACTJAN02)1313Document Q3_2017_Quarter_Report13Chapter Consolidated Statement of Cash Flows13Row ltlt Net cash from operating activities gtgt (ltlt 2017 gtgt q_act_jan)13User Value 2652 Tsd | ||||||||||||||||||||||||||||||||||||||||||||||||||||
| Net cash from investing activities | (342) | (409) | 20 | r9 PAC Hamon Pierrick Referenced Value (value_1_PQACTJAN02)1313Document Q3_2017_Quarter_Report13Chapter Consolidated Statement of Cash Flows13Row ltlt Net cash used in investing activities gtgt (ltlt 2017 gtgt q_act_jan)13User Value -4063 Tsd | ||||||||||||||||||||||||||||||||||||||||||||||||||||
| Free cash flow | 752 | (141) | -119 | r11 PAC Hamon Pierrick Referenced Value (value_1_PQACTJAN02)1313Document Q3_2017_Quarter_Report13Chapter Consolidated Statement of Cash Flows13Row ltlt Free cash flow gtgt (ltlt 2017 gtgt q_act_jan)13User Value -1411 Tsd | ||||||||||||||||||||||||||||||||||||||||||||||||||||
| Net cash used in financing activities | (858) | (894) | 4 | r13 PAC Hamon Pierrick Referenced Value (value_1_PQACTJAN02)1313Document Q3_2017_Quarter_Report13Chapter Consolidated Statement of Cash Flows13Row ltlt Net cash used in financing activities gtgt (ltlt 2017 gtgt q_act_jan)13User Value -8937 Tsd | ||||||||||||||||||||||||||||||||||||||||||||||||||||
| Net increase (decrease) in cash and cash equivalents | (106) | (1035) | r15 PAC Hamon Pierrick Referenced Value (value_1_PQACTJAN02)1313Document Q3_2017_Quarter_Report13Chapter Consolidated Statement of Cash Flows13Row ltlt Net increase (decrease) in cash and cash equivalents gtgt (ltlt 2017 gtgt q_act_jan)13User Value -10348 Tsd | |||||||||||||||||||||||||||||||||||||||||||||||||||||
| Cash and cash equivalents at beginning of period | 3923 | 3888 | r16 PAC Hamon Pierrick Referenced Value (value_1_PQACTJAN02)1313Document Q3_2017_Quarter_Report13Chapter Consolidated Statement of Cash Flows13Row ltlt Cash and cash equivalents at the beginning of the period gtgt (ltlt 2017 gtgt q_act_jan)13User Value 38878 Tsd | |||||||||||||||||||||||||||||||||||||||||||||||||||||
| Effect of exchange rate changes | (17) | 93 | r17 PAC Hamon Pierrick Referenced Value (value_1_PQACTJAN02)1313Document Q3_2017_Quarter_Report13Chapter Consolidated Statement of Cash Flows13Row ltlt Effect of exchange rate changes on cash and cash equivalents gtgt (ltlt 2017 gtgt q_act_jan)13User Value 933 Tsd | |||||||||||||||||||||||||||||||||||||||||||||||||||||
| Cash and cash equivalents at end of period | 3799 | 2946 | r18 PAC Hamon Pierrick Referenced Value (value_1_PQACTJAN02)1313Document Q3_2017_Quarter_Report13Chapter Consolidated Statement of Cash Flows13Row ltlt Cash and cash equivalents at the end of the period gtgt (ltlt 2017 gtgt q_act_jan)13User Value 29463 Tsd | |||||||||||||||||||||||||||||||||||||||||||||||||||||
| Reported cash and cash equivalents at 31122016 | 3888 | r21 PAC Hamon Pierrick Referenced Value (value_1_PQACTJAN02)1313Document Q3_2017_Quarter_Report13Chapter Consolidated Statement of Cash Flows13Row ltlt Cash and cash equivalents at the beginning of the period gtgt (ltlt 2017 gtgt q_act_jan)13User Value 38878 Tsd | Reported cash and cash equivalents at 31122016 | 3888 | ||||||||||||||||||||||||||||||||||||||||||||||||||||
| Profit YTD 092017 | 4839 | r19 PAC Hamon Pierrick Referenced Value (value_1_PQACTJAN02)1313Document Q3_2017_Quarter_Report13Chapter Consolidated Statement of Cash Flows13Row ltlt Profit gtgt (ltlt 2017 gtgt q_act_jan)13User Value 4839 Tsd | Profit YTD 092017 | 3888 | 484 | |||||||||||||||||||||||||||||||||||||||||||||||||||
| Other non-cash items (eg DampA) | 591 | r23 PAC Hamon Pierrick Referenced Value (value_1_PQACTJAN02)1313Document Q3_2017_Quarter_Report13Chapter Consolidated Statement of Cash Flows13131565 Tsd - ltlt Depreciation of property plant and equipment gtgt (ltlt 2017 gtgt q_act_jan)131616 Tsd - ltlt Amortization of intangible assets gtgt (ltlt 2017 gtgt q_act_jan)13-165 Tsd - ltlt Interest income and dividend on available-for-sale financial assets gtgt (ltlt 2017 gtgt q_act_jan)13-167 Tsd - ltlt Exchange differences gtgt (ltlt 2017 gtgt q_act_jan)13-025 Tsd - ltlt Loss (gain) on sales of property plant and equipment gtgt (ltlt 2017 gtgt q_act_jan)13000 Tsd - ltlt Loss (gain) on sales of financial assets gtgt (ltlt 2017 gtgt q_act_jan)13497 Tsd - ltlt Expenses for share-based compensation plans gtgt (ltlt 2017 gtgt q_act_jan)13238 Tsd - ltlt Other non-cash (income) and expenses gtgt (ltlt 2017 gtgt q_act_jan)132351 Tsd - ltlt Income tax expenses gtgt (ltlt 2017 gtgt q_act_jan)13---------------------135910 Tsd (Total) | Other non-cash items (eg DampA) | 4372 | 591 | |||||||||||||||||||||||||||||||||||||||||||||||||||
| Changes in working capital | -4766 | r24 PAC Hamon Pierrick Referenced Value (value_1_PQACTJAN02)1313Document Q3_2017_Quarter_Report13Chapter Consolidated Statement of Cash Flows1313-7973 Tsd - ltlt (Increase) decrease receivables other current assets and unbilled forwarding services gtgt (ltlt 2017 gtgt q_act_jan)134406 Tsd - ltlt Increase (decrease) payables and accruals incl accrued cost of service gtgt (ltlt 2017 gtgt q_act_jan)13-472 Tsd - ltlt Increase (decrease) non-current provisions and other liabilities gtgt (ltlt 2017 gtgt q_act_jan)13-749 Tsd - ltlt Increase (decrease) current provisions and other liabilities gtgt (ltlt 2017 gtgt q_act_jan)13---------------------13-4787 Tsd (Total) | Changes in working capital | 4486 | 477 | neg | ||||||||||||||||||||||||||||||||||||||||||||||||||
| Interest and income taxes paid | -3311 | r25 PAC Hamon Pierrick Referenced Value (value_1_PQACTJAN02)1313Document Q3_2017_Quarter_Report13Chapter Consolidated Statement of Cash Flows1313-136 Tsd - ltlt Interest paid gtgt (ltlt 2017 gtgt q_act_jan)13-3175 Tsd - ltlt Income taxes paid gtgt (ltlt 2017 gtgt q_act_jan)13---------------------13-3311 Tsd (Total) | Interest and income taxes paid | 4155 | 331 | neg | ||||||||||||||||||||||||||||||||||||||||||||||||||
| Net cash from investing activities | -4085 | r26 PAC Hamon Pierrick Referenced Value (value_1_PQACTJAN02)1313Document Q3_2017_Quarter_Report13Chapter Consolidated Statement of Cash Flows13Row ltlt Net cash used in investing activities gtgt (ltlt 2017 gtgt q_act_jan)13User Value -4063 Tsd | Net cash from investing activities | 3747 | 409 | neg | ||||||||||||||||||||||||||||||||||||||||||||||||||
| Financing activitiesdividend | -8937 | r27 PAC Hamon Pierrick Referenced Value (value_1_PQACTJAN02)1313Document Q3_2017_Quarter_Report13Chapter Consolidated Statement of Cash Flows13Row ltlt Net cash used in financing activities gtgt (ltlt 2017 gtgt q_act_jan)13User Value -8937 Tsd | Financing activitiesdividend | 2853 | 894 | neg | ||||||||||||||||||||||||||||||||||||||||||||||||||
| Effect of exchange rate changes | 933 | r28 PAC Hamon Pierrick Referenced Value (value_1_PQACTJAN02)1313Document Q3_2017_Quarter_Report13Chapter Consolidated Statement of Cash Flows13Row ltlt Effect of exchange rate changes on cash and cash equivalents gtgt (ltlt 2017 gtgt q_act_jan)13User Value 933 Tsd | Effect of exchange rate changes | 2853 | 93 | |||||||||||||||||||||||||||||||||||||||||||||||||||
| Reported cash and cash equivalents at 30092017 | 29463 | r29 PAC Hamon Pierrick Referenced Value (value_1_PQACTJAN02)1313Document Q3_2017_Quarter_Report13Chapter Consolidated Statement of Cash Flows13Row ltlt Cash and cash equivalents at the end of the period gtgt (ltlt 2017 gtgt q_act_jan)13User Value 29463 Tsd | PAC Hamon Pierrick Referenced Value (value_1_PQACTJAN02)1313Document Q3_2017_Quarter_Report13Chapter Consolidated Statement of Cash Flows13Row ltlt Subtotal cash flow from operations gtgt (ltlt 2017 gtgt q_act_jan)13User Value 10749 Tsd | PAC Hamon Pierrick Referenced Value (value_1_PQACTJAN02)1313Document Q3_2017_Quarter_Report13Chapter Consolidated Statement of Cash Flows1313-7973 Tsd - ltlt (Increase) decrease receivables other current assets and unbilled forwarding services gtgt (ltlt 2017 gtgt q_act_jan)134406 Tsd - ltlt Increase (decrease) payables and accruals incl accrued cost of service gtgt (ltlt 2017 gtgt q_act_jan)13-472 Tsd - ltlt Increase (decrease) non-current provisions and other liabilities gtgt (ltlt 2017 gtgt q_act_jan)13-749 Tsd - ltlt Increase (decrease) current provisions and other liabilities gtgt (ltlt 2017 gtgt q_act_jan)13---------------------13-4787 Tsd (Total) | PAC Hamon Pierrick Referenced Value (value_1_PQACTJAN02)1313Document Q3_2017_Quarter_Report13Chapter Consolidated Statement of Cash Flows13Row ltlt Cash generated from operations gtgt (ltlt 2017 gtgt q_act_jan)13User Value 5963 Tsd | PAC Hamon Pierrick Referenced Value (value_1_PQACTJAN02)1313Document Q3_2017_Quarter_Report13Chapter Consolidated Statement of Cash Flows1313-136 Tsd - ltlt Interest paid gtgt (ltlt 2017 gtgt q_act_jan)13-3175 Tsd - ltlt Income taxes paid gtgt (ltlt 2017 gtgt q_act_jan)13---------------------13-3311 Tsd (Total) | PAC Hamon Pierrick Referenced Value (value_1_PQACTJAN02)1313Document Q3_2017_Quarter_Report13Chapter Consolidated Statement of Cash Flows13Row ltlt Net cash from operating activities gtgt (ltlt 2017 gtgt q_act_jan)13User Value 2652 Tsd | PAC Hamon Pierrick Referenced Value (value_1_PQACTJAN02)1313Document Q3_2017_Quarter_Report13Chapter Consolidated Statement of Cash Flows13Row ltlt Net cash used in investing activities gtgt (ltlt 2017 gtgt q_act_jan)13User Value -4063 Tsd | PAC Hamon Pierrick Referenced Value (value_1_PQACTJAN02)1313Document Q3_2017_Quarter_Report13Chapter Consolidated Statement of Cash Flows13Row ltlt Free cash flow gtgt (ltlt 2017 gtgt q_act_jan)13User Value -1411 Tsd | PAC Hamon Pierrick Referenced Value (value_1_PQACTJAN02)1313Document Q3_2017_Quarter_Report13Chapter Consolidated Statement of Cash Flows13Row ltlt Net cash used in financing activities gtgt (ltlt 2017 gtgt q_act_jan)13User Value -8937 Tsd | PAC Hamon Pierrick Referenced Value (value_1_PQACTJAN02)1313Document Q3_2017_Quarter_Report13Chapter Consolidated Statement of Cash Flows13Row ltlt Net increase (decrease) in cash and cash equivalents gtgt (ltlt 2017 gtgt q_act_jan)13User Value -10348 Tsd | PAC Hamon Pierrick Referenced Value (value_1_PQACTJAN02)1313Document Q3_2017_Quarter_Report13Chapter Consolidated Statement of Cash Flows13Row ltlt Cash and cash equivalents at the beginning of the period gtgt (ltlt 2017 gtgt q_act_jan)13User Value 38878 Tsd | PAC Hamon Pierrick Referenced Value (value_1_PQACTJAN02)1313Document Q3_2017_Quarter_Report13Chapter Consolidated Statement of Cash Flows13Row ltlt Effect of exchange rate changes on cash and cash equivalents gtgt (ltlt 2017 gtgt q_act_jan)13User Value 933 Tsd | PAC Hamon Pierrick Referenced Value (value_1_PQACTJAN02)1313Document Q3_2017_Quarter_Report13Chapter Consolidated Statement of Cash Flows13Row ltlt Cash and cash equivalents at the end of the period gtgt (ltlt 2017 gtgt q_act_jan)13User Value 29463 Tsd | PAC Hamon Pierrick Referenced Value (value_1_PQACTJAN02)1313Document Q3_2017_Quarter_Report13Chapter Consolidated Statement of Cash Flows13Row ltlt Cash and cash equivalents at the beginning of the period gtgt (ltlt 2017 gtgt q_act_jan)13User Value 38878 Tsd | PAC Hamon Pierrick Referenced Value (value_1_PQACTJAN02)1313Document Q3_2017_Quarter_Report13Chapter Consolidated Statement of Cash Flows13Row ltlt Profit gtgt (ltlt 2017 gtgt q_act_jan)13User Value 4839 Tsd | PAC Hamon Pierrick Referenced Value (value_1_PQACTJAN02)1313Document Q3_2017_Quarter_Report13Chapter Consolidated Statement of Cash Flows13131565 Tsd - ltlt Depreciation of property plant and equipment gtgt (ltlt 2017 gtgt q_act_jan)131616 Tsd - ltlt Amortization of intangible assets gtgt (ltlt 2017 gtgt q_act_jan)13-165 Tsd - ltlt Interest income and dividend on available-for-sale financial assets gtgt (ltlt 2017 gtgt q_act_jan)13-167 Tsd - ltlt Exchange differences gtgt (ltlt 2017 gtgt q_act_jan)13-025 Tsd - ltlt Loss (gain) on sales of property plant and equipment gtgt (ltlt 2017 gtgt q_act_jan)13000 Tsd - ltlt Loss (gain) on sales of financial assets gtgt (ltlt 2017 gtgt q_act_jan)13497 Tsd - ltlt Expenses for share-based compensation plans gtgt (ltlt 2017 gtgt q_act_jan)13238 Tsd - ltlt Other non-cash (income) and expenses gtgt (ltlt 2017 gtgt q_act_jan)132351 Tsd - ltlt Income tax expenses gtgt (ltlt 2017 gtgt q_act_jan)13---------------------135910 Tsd (Total) | PAC Hamon Pierrick Referenced Value (value_1_PQACTJAN02)1313Document Q3_2017_Quarter_Report13Chapter Consolidated Statement of Cash Flows1313-7973 Tsd - ltlt (Increase) decrease receivables other current assets and unbilled forwarding services gtgt (ltlt 2017 gtgt q_act_jan)134406 Tsd - ltlt Increase (decrease) payables and accruals incl accrued cost of service gtgt (ltlt 2017 gtgt q_act_jan)13-472 Tsd - ltlt Increase (decrease) non-current provisions and other liabilities gtgt (ltlt 2017 gtgt q_act_jan)13-749 Tsd - ltlt Increase (decrease) current provisions and other liabilities gtgt (ltlt 2017 gtgt q_act_jan)13---------------------13-4787 Tsd (Total) | PAC Hamon Pierrick Referenced Value (value_1_PQACTJAN02)1313Document Q3_2017_Quarter_Report13Chapter Consolidated Statement of Cash Flows1313-136 Tsd - ltlt Interest paid gtgt (ltlt 2017 gtgt q_act_jan)13-3175 Tsd - ltlt Income taxes paid gtgt (ltlt 2017 gtgt q_act_jan)13---------------------13-3311 Tsd (Total) | Reported cash and cash equivalents at 30092017 | 2946 | 3888 | ||||||||||||||||||||||||||||||||||
| 484 | ||||||||||||||||||||||||||||||||||||||||||||||||||||||||
| 591 | ||||||||||||||||||||||||||||||||||||||||||||||||||||||||
| (479) | ||||||||||||||||||||||||||||||||||||||||||||||||||||||||
| (331) | ||||||||||||||||||||||||||||||||||||||||||||||||||||||||
| (406) | ||||||||||||||||||||||||||||||||||||||||||||||||||||||||
| (894) | ||||||||||||||||||||||||||||||||||||||||||||||||||||||||
| 93 | ||||||||||||||||||||||||||||||||||||||||||||||||||||||||
| 2946 |
| 31-Dec-16 | 30-Sept-17 | Change in | ||||||||||||||||||||||||||||||||||||||||||||||||||||||||
| CHF | ||||||||||||||||||||||||||||||||||||||||||||||||||||||||||
| Cash and cash equivalents | 3888 | 2946 | (942) | -24 | r3 PAC Hamon Pierrick Referenced Value (value_1_PQACTJAN02)1313Document Q3_2017_Quarter_Report13Chapter Consolidated Statement of Financial Position13Row ltlt Cash and cash equivalents gtgt (ltlt September 30 2017 gtgt q_act_jan)13User Value 29463 Tsd | 3888 | 3999 | 111 | 3 | |||||||||||||||||||||||||||||||||||||||||||||||||
| Trade receivables unbilled forwarding services | 9087 | 9893 | 806 | 9 | r4 PAC Hamon Pierrick Referenced Value (value_1_PQACTJAN02)1313Document Q3_2017_Quarter_Report13Chapter Consolidated Statement of Financial Position13Row ltlt Trade receivables unbilled forwarding services gtgt (ltlt September 30 2017 gtgt q_act_jan)13User Value 98929 Tsd | 9087 | 8693 | -394 | -4 | |||||||||||||||||||||||||||||||||||||||||||||||||
| Other current assets | 1025 | 1167 | 142 | 14 | r5 PAC Hamon Pierrick Referenced Value (value_1_PQACTJAN02)1313Document Q3_2017_Quarter_Report13Chapter Consolidated Statement of Financial Position13Row ltlt Other current assets gtgt (ltlt September 30 2017 gtgt q_act_jan)13User Value 11671 Tsd | 1025 | 1335 | 31 | 30 | |||||||||||||||||||||||||||||||||||||||||||||||||
| Property plant and equipment | 635 | 803 | 168 | 26 | r6 PAC Hamon Pierrick Referenced Value (value_1_PQACTJAN02)1313Document Q3_2017_Quarter_Report13Chapter Consolidated Statement of Financial Position13Row ltlt Property plant and equipment gtgt (ltlt September 30 2017 gtgt q_act_jan)13User Value 8028 Tsd | 635 | 651 | 16 | 3 | |||||||||||||||||||||||||||||||||||||||||||||||||
| Intangible assets | 979 | 917 | (62) | -6 | r7 PAC Hamon Pierrick Referenced Value (value_1_PQACTJAN02)1313Document Q3_2017_Quarter_Report13Chapter Consolidated Statement of Financial Position13Row ltlt Intangible assets gtgt (ltlt September 30 2017 gtgt q_act_jan)13User Value 9168 Tsd | 979 | 926 | -53 | -5 | |||||||||||||||||||||||||||||||||||||||||||||||||
| Other non-current assets | 990 | 1133 | 143 | 14 | r8 PAC Hamon Pierrick Referenced Value (value_1_PQACTJAN02)1313Document Q3_2017_Quarter_Report13Chapter Consolidated Statement of Financial Position13Row ltlt Other non-current assets gtgt (ltlt September 30 2017 gtgt q_act_jan)13User Value 11586 Tsd | 99 | 1073 | 83 | 8 | |||||||||||||||||||||||||||||||||||||||||||||||||
| Total assets | 16606 | 16859 | 253 | 2 | r9 PAC Hamon Pierrick Referenced Value (value_1_PQACTJAN02)1313Document Q3_2017_Quarter_Report13Chapter Consolidated Statement of Financial Position13Row ltlt Total assets gtgt (ltlt September 30 2017 gtgt q_act_jan)13User Value 168844 Tsd | 166060 | 166780 | 72 | 0 | |||||||||||||||||||||||||||||||||||||||||||||||||
| 0 | ||||||||||||||||||||||||||||||||||||||||||||||||||||||||||
| Short-term borrowings | 23 | 21 | (02) | -10 | r11 PAC Hamon Pierrick Referenced Value (value_1_PQACTJAN02)1313Document Q3_2017_Quarter_Report13Chapter Consolidated Statement of Financial Position13Row ltlt Short-term borrowings gtgt (ltlt September 30 2017 gtgt q_act_jan)13User Value 208 Tsd | 23 | 05 | -18 | -78 | |||||||||||||||||||||||||||||||||||||||||||||||||
| Trade payables accured cost of services | 6524 | 7075 | 551 | 8 | r12 PAC Hamon Pierrick Referenced Value (value_1_PQACTJAN02)1313Document Q3_2017_Quarter_Report13Chapter Consolidated Statement of Financial Position13Row ltlt Trade payables accured cost of services gtgt (ltlt September 30 2017 gtgt q_act_jan)13User Value 70745 Tsd | 6524 | 620 | -324 | -5 | |||||||||||||||||||||||||||||||||||||||||||||||||
| Other current liabilities | 2439 | 2254 | (185) | -8 | r13 PAC Hamon Pierrick Referenced Value (value_1_PQACTJAN02)1313Document Q3_2017_Quarter_Report13Chapter Consolidated Statement of Financial Position13Row ltlt Other current liabilities gtgt (ltlt September 30 2017 gtgt q_act_jan)13User Value 22538 Tsd | 2439 | 2592 | 153 | 6 | |||||||||||||||||||||||||||||||||||||||||||||||||
| Long-Term borrowings | 00 | 20 | 20 | na | r20 PAC Hamon Pierrick Referenced Value (value_1_PQACTJAN02)1313Document Q3_2017_Quarter_Report13Chapter Consolidated Statement of Financial Position13Row ltlt Long-term borrowings gtgt (ltlt September 30 2017 gtgt q_act_jan)13User Value 197 Tsd | 0 | 12 | 12 | na | |||||||||||||||||||||||||||||||||||||||||||||||||
| Other long-term liabilities | 1449 | 1527 | 78 | 5 | r21 PAC Hamon Pierrick Referenced Value (value_1_PQACTJAN02)1313Document Q3_2017_Quarter_Report13Chapter Consolidated Statement of Financial Position13Row ltlt Other long-term liabilities gtgt (ltlt September 30 2017 gtgt q_act_jan)13User Value 15270 Tsd | 1449 | 1479 | 3 | 2 | |||||||||||||||||||||||||||||||||||||||||||||||||
| Total liabilities | 10436 | 10896 | 460 | 4 | r14 PAC Hamon Pierrick Referenced Value (value_1_PQACTJAN02)1313Document Q3_2017_Quarter_Report13Chapter Consolidated Statement of Financial Position13Row ltlt Total liabilities gtgt (ltlt September 30 2017 gtgt q_act_jan)13User Value 108956 Tsd | 104360 | 102880 | -148 | -1 | |||||||||||||||||||||||||||||||||||||||||||||||||
| Share capital | 24 | 24 | (00) | -1 | r15 PAC Hamon Pierrick Referenced Value (value_1_PQACTJAN02)1313Document Q3_2017_Quarter_Report13Chapter Consolidated Statement of Financial Position13Row ltlt Share capital gtgt (ltlt September 30 2017 gtgt q_act_jan)13User Value 238 Tsd | 24 | 24 | 0 | 0 | |||||||||||||||||||||||||||||||||||||||||||||||||
| Reserves treasury shares | 6057 | 5884 | (173) | -3 | r16 PAC Hamon Pierrick Referenced Value (value_1_PQACTJAN02)1313Document Q3_2017_Quarter_Report13Chapter Consolidated Statement of Financial Position13Row ltlt Reserves treasury shares gtgt (ltlt September 30 2017 gtgt q_act_jan)13User Value 59100 Tsd | 6057 | 6285 | 228 | 4 | |||||||||||||||||||||||||||||||||||||||||||||||||
| Non-controlling interests | 89 | 55 | (34) | -38 | r17 PAC Hamon Pierrick Referenced Value (value_1_PQACTJAN02)1313Document Q3_2017_Quarter_Report13Chapter Consolidated Statement of Financial Position13Row ltlt Non-controlling interests gtgt (ltlt September 30 2017 gtgt q_act_jan)13User Value 550 Tsd | 89 | 81 | -08 | -9 | |||||||||||||||||||||||||||||||||||||||||||||||||
| Total equity | 6170 | 5963 | (207) | -3 | r18 PAC Hamon Pierrick Referenced Value (value_1_PQACTJAN02)1313Document Q3_2017_Quarter_Report13Chapter Consolidated Statement of Financial Position13Row ltlt Total equity gtgt (ltlt September 30 2017 gtgt q_act_jan)13User Value 59887 Tsd | 617 | 639 | 22 | 4 | |||||||||||||||||||||||||||||||||||||||||||||||||
| Total equity and liabilities | 16606 | 16859 | 253 | 2 | r19 PAC Hamon Pierrick Referenced Value (value_1_PQACTJAN02)1313Document Q3_2017_Quarter_Report13Chapter Consolidated Statement of Financial Position13Row ltlt Total equity and liabilities gtgt (ltlt September 30 2017 gtgt q_act_jan)13User Value 168844 Tsd | 166060 | 166780 | 72 | 0 | |||||||||||||||||||||||||||||||||||||||||||||||||
| KPIs | 31-Dec-16 | 30-Jun-17 | ||||||||||||||||||||||||||||||||||||||||||||||||||||||||
| Equity Ratio | 372 | 354 | s20 PAC Hamon Pierrick Referenced Value (value_1_PQACTJAN02)1313Document Q2_2017_Quarter_Report13Chapter Consolidated Statement of Financial Position13Row ltlt Total equity and liabilities gtgt (ltlt June 30 2017 gtgt q_act_jan)13User Value 153472 Tsd | |||||||||||||||||||||||||||||||||||||||||||||||||||||||
PAC Hamon Pierrick Referenced Value (value_1_PQACTJAN02)1313Document Q3_2017_Quarter_Report13Chapter Consolidated Statement of Financial Position13Row ltlt Cash and cash equivalents gtgt (ltlt September 30 2017 gtgt q_act_jan)13User Value 29463 Tsd | PAC Hamon Pierrick Referenced Value (value_1_PQACTJAN02)1313Document Q3_2017_Quarter_Report13Chapter Consolidated Statement of Financial Position13Row ltlt Trade receivables unbilled forwarding services gtgt (ltlt September 30 2017 gtgt q_act_jan)13User Value 98929 Tsd | PAC Hamon Pierrick Referenced Value (value_1_PQACTJAN02)1313Document Q3_2017_Quarter_Report13Chapter Consolidated Statement of Financial Position13Row ltlt Other current assets gtgt (ltlt September 30 2017 gtgt q_act_jan)13User Value 11671 Tsd | PAC Hamon Pierrick Referenced Value (value_1_PQACTJAN02)1313Document Q3_2017_Quarter_Report13Chapter Consolidated Statement of Financial Position13Row ltlt Property plant and equipment gtgt (ltlt September 30 2017 gtgt q_act_jan)13User Value 8028 Tsd | PAC Hamon Pierrick Referenced Value (value_1_PQACTJAN02)1313Document Q3_2017_Quarter_Report13Chapter Consolidated Statement of Financial Position13Row ltlt Intangible assets gtgt (ltlt September 30 2017 gtgt q_act_jan)13User Value 9168 Tsd | PAC Hamon Pierrick Referenced Value (value_1_PQACTJAN02)1313Document Q3_2017_Quarter_Report13Chapter Consolidated Statement of Financial Position13Row ltlt Other non-current assets gtgt (ltlt September 30 2017 gtgt q_act_jan)13User Value 11586 Tsd | PAC Hamon Pierrick Referenced Value (value_1_PQACTJAN02)1313Document Q3_2017_Quarter_Report13Chapter Consolidated Statement of Financial Position13Row ltlt Total assets gtgt (ltlt September 30 2017 gtgt q_act_jan)13User Value 168844 Tsd | PAC Hamon Pierrick Referenced Value (value_1_PQACTJAN02)1313Document Q3_2017_Quarter_Report13Chapter Consolidated Statement of Financial Position13Row ltlt Short-term borrowings gtgt (ltlt September 30 2017 gtgt q_act_jan)13User Value 208 Tsd | PAC Hamon Pierrick Referenced Value (value_1_PQACTJAN02)1313Document Q3_2017_Quarter_Report13Chapter Consolidated Statement of Financial Position13Row ltlt Trade payables accured cost of services gtgt (ltlt September 30 2017 gtgt q_act_jan)13User Value 70745 Tsd | PAC Hamon Pierrick Referenced Value (value_1_PQACTJAN02)1313Document Q3_2017_Quarter_Report13Chapter Consolidated Statement of Financial Position13Row ltlt Other current liabilities gtgt (ltlt September 30 2017 gtgt q_act_jan)13User Value 22538 Tsd | PAC Hamon Pierrick Referenced Value (value_1_PQACTJAN02)1313Document Q3_2017_Quarter_Report13Chapter Consolidated Statement of Financial Position13Row ltlt Long-term borrowings gtgt (ltlt September 30 2017 gtgt q_act_jan)13User Value 197 Tsd | PAC Hamon Pierrick Referenced Value (value_1_PQACTJAN02)1313Document Q3_2017_Quarter_Report13Chapter Consolidated Statement of Financial Position13Row ltlt Other long-term liabilities gtgt (ltlt September 30 2017 gtgt q_act_jan)13User Value 15270 Tsd | PAC Hamon Pierrick Referenced Value (value_1_PQACTJAN02)1313Document Q3_2017_Quarter_Report13Chapter Consolidated Statement of Financial Position13Row ltlt Total liabilities gtgt (ltlt September 30 2017 gtgt q_act_jan)13User Value 108956 Tsd | PAC Hamon Pierrick Referenced Value (value_1_PQACTJAN02)1313Document Q3_2017_Quarter_Report13Chapter Consolidated Statement of Financial Position13Row ltlt Share capital gtgt (ltlt September 30 2017 gtgt q_act_jan)13User Value 238 Tsd | PAC Hamon Pierrick Referenced Value (value_1_PQACTJAN02)1313Document Q3_2017_Quarter_Report13Chapter Consolidated Statement of Financial Position13Row ltlt Reserves treasury shares gtgt (ltlt September 30 2017 gtgt q_act_jan)13User Value 59100 Tsd | PAC Hamon Pierrick Referenced Value (value_1_PQACTJAN02)1313Document Q3_2017_Quarter_Report13Chapter Consolidated Statement of Financial Position13Row ltlt Non-controlling interests gtgt (ltlt September 30 2017 gtgt q_act_jan)13User Value 550 Tsd | PAC Hamon Pierrick Referenced Value (value_1_PQACTJAN02)1313Document Q3_2017_Quarter_Report13Chapter Consolidated Statement of Financial Position13Row ltlt Total equity gtgt (ltlt September 30 2017 gtgt q_act_jan)13User Value 59887 Tsd | PAC Hamon Pierrick Referenced Value (value_1_PQACTJAN02)1313Document Q3_2017_Quarter_Report13Chapter Consolidated Statement of Financial Position13Row ltlt Total equity and liabilities gtgt (ltlt September 30 2017 gtgt q_act_jan)13User Value 168844 Tsd | NWC-Intensity | 18 | 13 | mf24 | |||||||||||||||||||||||||||||||||||||
| DSO 3-m-rolling YTD | 455 | 467 | m22 | |||||||||||||||||||||||||||||||||||||||||||||||||||||||
| DPO 3-m-rolling YTD | 407 | 397 | m23 |
| 2017 | 2016 | |||||||||||||||||||||||||||||||||||||||||||||||||||||||||||||||||||
| Logistics | Q1 2016 | Q2 2016 | HY 2016 | Q3 2016 | Q3YTD 2016 | Q4 2016 | FY 2016 | Q1 2017 | Q2 2017 | HY 2017 | Q3 2017 | Q3YTD 2017 | ||||||||||||||||||||||||||||||||||||||||||||||||||||||||
| Net forwarding revenue | 1402 | 1613 | 3015 | 1374 | 4389 | 1321 | 5709 | 1286 | 1377 | 2663 | 1394 | 4057 | m4 | m4 | r4 PAC Hamon Pierrick Referenced Value (value_1_PQACT02)1313Document Q3_2017_Quarter_Report13Chapter Products quater and year to date13Row ltlt Net forwarding revenue gtgt (ltlt value_3 gtgt q_act)13User Value 13945 Tsd | r4 PAC Hamon Pierrick Referenced Value (value_1_PQACTJAN02)1313Document Q3_2017_Quarter_Report13Chapter Products quater and year to date13Row ltlt Net forwarding revenue gtgt (ltlt value_3 gtgt q_act_jan)13User Value 40573 Tsd | -00 | 00 | (01) | |||||||||||||||||||||||||||||||||||||||||||||||||
| Forwarding expenses | (420) | (607) | (1027) | (429) | (1456) | (397) | (1853) | (460) | (564) | (1024) | (580) | (1604) | m5 | m5 | r5 PAC Hamon Pierrick Referenced Value (value_1_PQACT02)1313Document Q3_2017_Quarter_Report13Chapter Products quater and year to date13Row ltlt Forwarding services from third parties gtgt (ltlt value_3 gtgt q_act)13User Value -5796 Tsd | r5 PAC Hamon Pierrick Referenced Value (value_1_PQACTJAN02)1313Document Q3_2017_Quarter_Report13Chapter Products quater and year to date13Row ltlt Forwarding services from third parties gtgt (ltlt value_3 gtgt q_act_jan)13User Value -16035 Tsd | -00 | 00 | 00 | |||||||||||||||||||||||||||||||||||||||||||||||||
| Gross profit | 982 | 1006 | 1989 | 944 | 2933 | 924 | 3857 | 825 | 813 | 1639 | 815 | 2454 | m6 | m6 | r6 PAC Hamon Pierrick Referenced Value (value_1_PQACT02)1313Document Q3_2017_Quarter_Report13Chapter Products quater and year to date13Row ltlt Gross profit gtgt (ltlt value_3 gtgt q_act)13User Value 8148 Tsd | r6 PAC Hamon Pierrick Referenced Value (value_1_PQACTJAN02)1313Document Q3_2017_Quarter_Report13Chapter Products quater and year to date13Row ltlt Gross profit gtgt (ltlt value_3 gtgt q_act_jan)13User Value 24537 Tsd | 00 | 01 | 01 | |||||||||||||||||||||||||||||||||||||||||||||||||
| Personnel expenses | (574) | (591) | (1166) | (528) | (1694) | (519) | (2213) | (479) | (461) | (940) | (469) | (1409) | m7 | m7 | r7 PAC Hamon Pierrick Referenced Value (value_1_PQACT02)1313Document Q3_2017_Quarter_Report13Chapter Products quater and year to date13Row ltlt Personnel expenses gtgt (ltlt value_3 gtgt q_act)13User Value -4692 Tsd | r7 PAC Hamon Pierrick Referenced Value (value_1_PQACTJAN02)1313Document Q3_2017_Quarter_Report13Chapter Products quater and year to date13Row ltlt Personnel expenses gtgt (ltlt value_3 gtgt q_act_jan)13User Value -14091 Tsd | -00 | (01) | (01) | |||||||||||||||||||||||||||||||||||||||||||||||||
| Other operating expenses | (360) | (363) | (723) | (378) | (1102) | (367) | (1469) | (298) | (298) | (596) | (298) | (894) | m8 | m8 | r8 PAC Hamon Pierrick Referenced Value (value_1_PQACT02)1313Document Q3_2017_Quarter_Report13Chapter Products quater and year to date13Row ltlt Other operating expenses gtgt (ltlt value_3 gtgt q_act)13User Value -2977 Tsd | r8 PAC Hamon Pierrick Referenced Value (value_1_PQACTJAN02)1313Document Q3_2017_Quarter_Report13Chapter Products quater and year to date13Row ltlt Other operating expenses gtgt (ltlt value_3 gtgt q_act_jan)13User Value -8940 Tsd | 00 | 00 | (01) | |||||||||||||||||||||||||||||||||||||||||||||||||
| EBITDA adjusted | 48 | 52 | 100 | 38 | 138 | 37 | 175 | 48 | 54 | 103 | 48 | 151 | m9 | m9 | r9 PAC Hamon Pierrick Referenced Value (value_1_PQACT02)1313Document Q3_2017_Quarter_Report13Chapter Products quater and year to date13Row ltlt EBITDA gtgt (ltlt value_3 gtgt q_act)13User Value 479 Tsd | r9 PAC Hamon Pierrick Referenced Value (value_1_PQACTJAN02)1313Document Q3_2017_Quarter_Report13Chapter Products quater and year to date13Row ltlt EBITDA gtgt (ltlt value_3 gtgt q_act_jan)13User Value 1506 Tsd | 00 | 00 | 00 | |||||||||||||||||||||||||||||||||||||||||||||||||
| Depreciation and amortization | (29) | (29) | (58) | (29) | (88) | (32) | (119) | (25) | (24) | (48) | (21) | (69) | m10 | m10 | r10 PAC Hamon Pierrick Referenced Value (value_1_PQACT02)1313Document Q3_2017_Quarter_Report13Chapter Products quater and year to date13Row ltlt Depreciation and amortization gtgt (ltlt value_3 gtgt q_act)13User Value -208 Tsd | r10 PAC Hamon Pierrick Referenced Value (value_1_PQACTJAN02)1313Document Q3_2017_Quarter_Report13Chapter Products quater and year to date13Row ltlt Depreciation and amortization gtgt (ltlt value_3 gtgt q_act_jan)13User Value -692 Tsd | 00 | 00 | 00 | |||||||||||||||||||||||||||||||||||||||||||||||||
| EBIT adjusted | 18 | 23 | 41 | 09 | 50 | 05 | 56 | 24 | 31 | 54 | 27 | 81 | m11 | m11 | r11 PAC Hamon Pierrick Referenced Value (value_1_PQACT02)1313Document Q3_2017_Quarter_Report13Chapter Products quater and year to date13Row ltlt Operating result (EBIT) gtgt (ltlt value_3 gtgt q_act)13User Value 271 Tsd | r11 PAC Hamon Pierrick Referenced Value (value_1_PQACTJAN02)1313Document Q3_2017_Quarter_Report13Chapter Products quater and year to date13Row ltlt Operating result (EBIT) gtgt (ltlt value_3 gtgt q_act_jan)13User Value 815 Tsd | -00 | 00 | 01 | |||||||||||||||||||||||||||||||||||||||||||||||||
| Non-recurring items | ||||||||||||||||||||||||||||||||||||||||||||||||||||||||||||||||||||
| Restructuring expenses | 00 | (38) | (38) | 00 | (38) | 00 | (38) | 00 | 00 | 00 | 00 | 00 | m13 | m13 | m13 | m13 | 00 | 00 | 00 | |||||||||||||||||||||||||||||||||||||||||||||||||
| EBIT reported | 18 | (15) | 03 | 09 | 12 | 05 | 18 | 24 | 31 | 54 | 27 | 81 | m15 | m15 | r15 PAC Hamon Pierrick Referenced Value (value_1_PQACT02)1313Document Q3_2017_Quarter_Report13Chapter Products quater and year to date13Row ltlt Operating result (EBIT) gtgt (ltlt value_3 gtgt q_act)13User Value 271 Tsd | r15 PAC Hamon Pierrick Referenced Value (value_1_PQACTJAN02)1313Document Q3_2017_Quarter_Report13Chapter Products quater and year to date13Row ltlt Operating result (EBIT) gtgt (ltlt value_3 gtgt q_act_jan)13User Value 815 Tsd | ||||||||||||||||||||||||||||||||||||||||||||||||||||
PAC Hamon Pierrick Referenced Value (value_1_PQACT02)1313Document Q3_2017_Quarter_Report13Chapter Products quater and year to date13Row ltlt Net forwarding revenue gtgt (ltlt value_3 gtgt q_act)13User Value 13945 Tsd | PAC Hamon Pierrick Referenced Value (value_1_PQACTJAN02)1313Document Q3_2017_Quarter_Report13Chapter Products quater and year to date13Row ltlt Net forwarding revenue gtgt (ltlt value_3 gtgt q_act_jan)13User Value 40573 Tsd | PAC Hamon Pierrick Referenced Value (value_1_PQACT02)1313Document Q3_2017_Quarter_Report13Chapter Products quater and year to date13Row ltlt Forwarding services from third parties gtgt (ltlt value_3 gtgt q_act)13User Value -5796 Tsd | GP Change YoY | -19 | -18 | -14 | -16 | s16 | s16 | |||||||||||||||||||||||||||||||||||||||||||||||||||||||||||
| 2017 | 2016 | ||||||||||||||||||||||||||||||||||||||||||||||||||||||||||
| Ocean Freight | Q1 2016 | Q2 2016 | HY 2016 | Q3 2016 | Q3YTD 2016 | Q4 2016 | FY 2016 | Q1 2017 | Q2 2017 | HY 2017 | Q3 2017 | Q3YTD 2017 | |||||||||||||||||||||||||||||||||||||||||||||||
| Net forwarding revenue | 5338 | 4921 | 10259 | 4955 | 15214 | 4770 | 19984 | 4915 | 5172 | 10087 | 5551 | 15637 | m4 | m4 | r4 PAC Hamon Pierrick Referenced Value (value_1_PQACT02)1313Document Q3_2017_Quarter_Report13Chapter Products quater and year to date13Row ltlt Net forwarding revenue gtgt (ltlt value_2 gtgt q_act)13User Value 55506 Tsd | r4 PAC Hamon Pierrick Referenced Value (value_1_PQACTJAN02)1313Document Q3_2017_Quarter_Report13Chapter Products quater and year to date13Row ltlt Net forwarding revenue gtgt (ltlt value_2 gtgt q_act_jan)13User Value 156375 Tsd | 00 | 00 | 00 | ||||||||||||||||||||||||||||||||||||||||
| Forwarding expenses | (4157) | (3773) | (7930) | (3834) | (11764) | (3783) | (15547) | (3860) | (4081) | (7941) | (4463) | (12404) | m5 | m5 | r5 PAC Hamon Pierrick Referenced Value (value_1_PQACT02)1313Document Q3_2017_Quarter_Report13Chapter Products quater and year to date13Row ltlt Forwarding services from third parties gtgt (ltlt value_2 gtgt q_act)13User Value -44629 Tsd | r5 PAC Hamon Pierrick Referenced Value (value_1_PQACTJAN02)1313Document Q3_2017_Quarter_Report13Chapter Products quater and year to date13Row ltlt Forwarding services from third parties gtgt (ltlt value_2 gtgt q_act_jan)13User Value -124038 Tsd | -00 | 00 | 00 | ||||||||||||||||||||||||||||||||||||||||
| Gross profit | 1181 | 1148 | 2329 | 1121 | 3450 | 987 | 4438 | 1055 | 1091 | 2146 | 1088 | 3234 | m6 | m6 | r6 PAC Hamon Pierrick Referenced Value (value_1_PQACT02)1313Document Q3_2017_Quarter_Report13Chapter Products quater and year to date13Row ltlt Gross profit gtgt (ltlt value_2 gtgt q_act)13User Value 10877 Tsd | r6 PAC Hamon Pierrick Referenced Value (value_1_PQACTJAN02)1313Document Q3_2017_Quarter_Report13Chapter Products quater and year to date13Row ltlt Gross profit gtgt (ltlt value_2 gtgt q_act_jan)13User Value 32337 Tsd | 00 | 00 | 01 | ||||||||||||||||||||||||||||||||||||||||
| Personnel expenses | (791) | (752) | (1543) | (755) | (2298) | (721) | (3019) | (779) | (784) | (1564) | (788) | (2352) | m7 | m7 | r7 PAC Hamon Pierrick Referenced Value (value_1_PQACT02)1313Document Q3_2017_Quarter_Report13Chapter Products quater and year to date13Row ltlt Personnel expenses gtgt (ltlt value_2 gtgt q_act)13User Value -7884 Tsd | r7 PAC Hamon Pierrick Referenced Value (value_1_PQACTJAN02)1313Document Q3_2017_Quarter_Report13Chapter Products quater and year to date13Row ltlt Personnel expenses gtgt (ltlt value_2 gtgt q_act_jan)13User Value -23522 Tsd | -00 | 00 | 00 | ||||||||||||||||||||||||||||||||||||||||
| Other operating expenses | (305) | (288) | (594) | (274) | (868) | (275) | (1144) | (271) | (265) | (536) | (290) | (827) | m8 | m8 | r8 PAC Hamon Pierrick Referenced Value (value_1_PQACT02)1313Document Q3_2017_Quarter_Report13Chapter Products quater and year to date13Row ltlt Other operating expenses gtgt (ltlt value_2 gtgt q_act)13User Value -2905 Tsd | r8 PAC Hamon Pierrick Referenced Value (value_1_PQACTJAN02)1313Document Q3_2017_Quarter_Report13Chapter Products quater and year to date13Row ltlt Other operating expenses gtgt (ltlt value_2 gtgt q_act_jan)13User Value -8265 Tsd | -00 | (01) | (02) | ||||||||||||||||||||||||||||||||||||||||
| EBITDA adjusted | 84 | 108 | 192 | 92 | 284 | (09) | 275 | 05 | 41 | 46 | 09 | 55 | m9 | m9 | r9 PAC Hamon Pierrick Referenced Value (value_1_PQACT02)1313Document Q3_2017_Quarter_Report13Chapter Products quater and year to date13Row ltlt EBITDA gtgt (ltlt value_2 gtgt q_act)13User Value 089 Tsd | r9 PAC Hamon Pierrick Referenced Value (value_1_PQACTJAN02)1313Document Q3_2017_Quarter_Report13Chapter Products quater and year to date13Row ltlt EBITDA gtgt (ltlt value_2 gtgt q_act_jan)13User Value 550 Tsd | -00 | 00 | 00 | ||||||||||||||||||||||||||||||||||||||||
| Depreciation and amortization | (41) | (42) | (83) | (41) | (124) | (42) | (166) | (36) | (36) | (72) | (38) | (110) | m10 | m10 | r10 PAC Hamon Pierrick Referenced Value (value_1_PQACT02)1313Document Q3_2017_Quarter_Report13Chapter Products quater and year to date13Row ltlt Depreciation and amortization gtgt (ltlt value_2 gtgt q_act)13User Value -384 Tsd | r10 PAC Hamon Pierrick Referenced Value (value_1_PQACTJAN02)1313Document Q3_2017_Quarter_Report13Chapter Products quater and year to date13Row ltlt Depreciation and amortization gtgt (ltlt value_2 gtgt q_act_jan)13User Value -1102 Tsd | -00 | 00 | 00 | ||||||||||||||||||||||||||||||||||||||||
| EBIT adjusted | 43 | 66 | 109 | 51 | 160 | (51) | 109 | (32) | 06 | (26) | (29) | (55) | m11 | m11 | r11 PAC Hamon Pierrick Referenced Value (value_1_PQACT02)1313Document Q3_2017_Quarter_Report13Chapter Products quater and year to date13Row ltlt Operating result (EBIT) gtgt (ltlt value_2 gtgt q_act)13User Value -295 Tsd | r11 PAC Hamon Pierrick Referenced Value (value_1_PQACTJAN02)1313Document Q3_2017_Quarter_Report13Chapter Products quater and year to date13Row ltlt Operating result (EBIT) gtgt (ltlt value_2 gtgt q_act_jan)13User Value -552 Tsd | 00 | 00 | 00 | ||||||||||||||||||||||||||||||||||||||||
| in of gross profit | 37 | 58 | 47 | 45 | 46 | -51 | 25 | -30 | 05 | -12 | -27 | -17 | m12 | m12 | s12 | s12 | |||||||||||||||||||||||||||||||||||||||||||
| Non-recurring items | 00 | 00 | 00 | ||||||||||||||||||||||||||||||||||||||||||||||||||||||||
| Restructuring expenses | 00 | (97) | (97) | 0 | (97) | (19) | (115) | 00 | 00 | 00 | 00 | 00 | m14 | m14 | m14 | m14 | 00 | 00 | 01 | ||||||||||||||||||||||||||||||||||||||||
| EBIT reported | 43 | (30) | 13 | 51 | 63 | (69) | (06) | (32) | 06 | (26) | (29) | (55) | m16 | m16 | r16 PAC Hamon Pierrick Referenced Value (value_1_PQACT02)1313Document Q3_2017_Quarter_Report13Chapter Products quater and year to date13Row ltlt Operating result (EBIT) gtgt (ltlt value_2 gtgt q_act)13User Value -295 Tsd | r16 PAC Hamon Pierrick Referenced Value (value_1_PQACTJAN02)1313Document Q3_2017_Quarter_Report13Chapter Products quater and year to date13Row ltlt Operating result (EBIT) gtgt (ltlt value_2 gtgt q_act_jan)13User Value -552 Tsd | PAC Hamon Pierrick Referenced Value (value_1_PQACT02)1313Document Q3_2017_Quarter_Report13Chapter Products quater and year to date13Row ltlt Net forwarding revenue gtgt (ltlt value_2 gtgt q_act)13User Value 55506 Tsd | PAC Hamon Pierrick Referenced Value (value_1_PQACTJAN02)1313Document Q3_2017_Quarter_Report13Chapter Products quater and year to date13Row ltlt Net forwarding revenue gtgt (ltlt value_2 gtgt q_act_jan)13User Value 156375 Tsd | PAC Hamon Pierrick Referenced Value (value_1_PQACT02)1313Document Q3_2017_Quarter_Report13Chapter Products quater and year to date13Row ltlt Forwarding services from third parties gtgt (ltlt value_2 gtgt q_act)13User Value -44629 Tsd | 00 | 00 | (01) | |||||||||||||||||||||||||||||||||||||
| in of gross profit | 37 | -26 | 05 | 45 | 18 | -70 | -01 | -30 | 05 | -12 | -27 | -17 | m17 | m17 | s17 | s17 | |||||||||||||||||||||||||||||||||||||||||||
| Ocean Freight volumes (000 tons) | 3482 | 3726 | 7208 | 3787 | 10995 | 3890 | 14885 | 3742 | 3828 | 7570 | 3856 | 11426 | m19 | m19 | m19 | m19 | 00 | 00 | 00 | ||||||||||||||||||||||||||||||||||||||||
| change YoY | -100 | -82 | -91 | -88 | -90 | 08 | -66 | 75 | 27 | 50 | 18 | 39 | m20 | m20 | s20 | s20 | |||||||||||||||||||||||||||||||||||||||||||
| GPTEU (CHF) | 339 | 308 | 323 | 296 | 314 | 254 | 298 | 282 | 285 | 283 | 282 | 283 | m21 | m21 | s21 | s21 | |||||||||||||||||||||||||||||||||||||||||||
| change YoY | 102 | 59 | 80 | -16 | 47 | -176 | -11 | -169 | -75 | -122 | -47 | -98 | m22 | m22 | s22 | s22 | |||||||||||||||||||||||||||||||||||||||||||
| GP change YoY | -5 | -8 | -3 | -6 | s23 | s23 | |||||||||||||||||||||||||||||||||||||||||||||||||||||
| 2017 | 2016 | ||||||||||||||||||||||||||||||||||||||||||||||||||||||||||
| Air Freight | Q1 2016 | Q2 2016 | HY 2016 | Q3 2016 | Q3YTD 2016 | Q4 2016 | FY 2016 | Q1 2017 | Q2 2017 | HY 2017 | Q3 2017 | Q3 YTD 2017 | |||||||||||||||||||||||||||||||||||||||||||||||
| Net forwarding revenue | 6332 | 6359 | 12691 | 6341 | 19032 | 7234 | 26267 | 6571 | 7000 | 13571 | 7389 | 20960 | m4 | m4 | r4 PAC Hamon Pierrick Referenced Value (value_1_PQACT02)1313Document Q3_2017_Quarter_Report13Chapter Products quater and year to date13Row ltlt Net forwarding revenue gtgt (ltlt value_1 gtgt q_act)13User Value 73890 Tsd | r4 PAC Hamon Pierrick Referenced Value (value_1_PQACTJAN02)1313Document Q3_2017_Quarter_Report13Chapter Products quater and year to date13Row ltlt Net forwarding revenue gtgt (ltlt value_1 gtgt q_act_jan)13User Value 209603 Tsd | 00 | 00 | 006009999999958 | ||||||||||||||||||||||||||||||||||||||||
| Forwarding expenses | (4846) | (4800) | (9646) | (4853) | (14499) | (5816) | (20315) | (5125) | (5500) | (10625) | (5775) | (16400) | m5 | m5 | r5 PAC Hamon Pierrick Referenced Value (value_1_PQACT02)1313Document Q3_2017_Quarter_Report13Chapter Products quater and year to date13Row ltlt Forwarding services from third parties gtgt (ltlt value_1 gtgt q_act)13User Value -57751 Tsd | r5 PAC Hamon Pierrick Referenced Value (value_1_PQACTJAN02)1313Document Q3_2017_Quarter_Report13Chapter Products quater and year to date13Row ltlt Forwarding services from third parties gtgt (ltlt value_1 gtgt q_act_jan)13User Value -164000 Tsd | 00 | 00 | 00 | ||||||||||||||||||||||||||||||||||||||||
| Gross profit | 1486 | 1559 | 3045 | 1489 | 4534 | 1418 | 5952 | 1447 | 1500 | 2946 | 1614 | 4560 | m6 | m6 | r6 PAC Hamon Pierrick Referenced Value (value_1_PQACT02)1313Document Q3_2017_Quarter_Report13Chapter Products quater and year to date13Row ltlt Gross profit gtgt (ltlt value_1 gtgt q_act)13User Value 16139 Tsd | r6 PAC Hamon Pierrick Referenced Value (value_1_PQACTJAN02)1313Document Q3_2017_Quarter_Report13Chapter Products quater and year to date13Row ltlt Gross profit gtgt (ltlt value_1 gtgt q_act_jan)13User Value 45602 Tsd | -00 | 00 | 00 | ||||||||||||||||||||||||||||||||||||||||
| Personnel expenses | (885) | (869) | (1754) | (847) | (2600) | (873) | (3473) | (905) | (916) | (1822) | (928) | (2750) | m7 | m7 | r7 PAC Hamon Pierrick Referenced Value (value_1_PQACT02)1313Document Q3_2017_Quarter_Report13Chapter Products quater and year to date13Row ltlt Personnel expenses gtgt (ltlt value_1 gtgt q_act)13User Value -9280 Tsd | r7 PAC Hamon Pierrick Referenced Value (value_1_PQACTJAN02)1313Document Q3_2017_Quarter_Report13Chapter Products quater and year to date13Row ltlt Personnel expenses gtgt (ltlt value_1 gtgt q_act_jan)13User Value -27496 Tsd | -00 | 00 | 01 | ||||||||||||||||||||||||||||||||||||||||
| Other operating expenses | (371) | (359) | (730) | (318) | (1048) | (284) | (1333) | (324) | (317) | (641) | (337) | (978) | m8 | m8 | r8 PAC Hamon Pierrick Referenced Value (value_1_PQACT02)1313Document Q3_2017_Quarter_Report13Chapter Products quater and year to date13Row ltlt Other operating expenses gtgt (ltlt value_1 gtgt q_act)13User Value -3367 Tsd | r8 PAC Hamon Pierrick Referenced Value (value_1_PQACTJAN02)1313Document Q3_2017_Quarter_Report13Chapter Products quater and year to date13Row ltlt Other operating expenses gtgt (ltlt value_1 gtgt q_act_jan)13User Value -9776 Tsd | 00 | 00 | (01) | ||||||||||||||||||||||||||||||||||||||||
| EBITDA adjusted | 230 | 331 | 561 | 324 | 885 | 261 | 1146 | 218 | 266 | 484 | 349 | 833 | m9 | m9 | r9 PAC Hamon Pierrick Referenced Value (value_1_PQACT02)1313Document Q3_2017_Quarter_Report13Chapter Products quater and year to date13Row ltlt EBITDA gtgt (ltlt value_1 gtgt q_act)13User Value 3492 Tsd | r9 PAC Hamon Pierrick Referenced Value (value_1_PQACTJAN02)1313Document Q3_2017_Quarter_Report13Chapter Products quater and year to date13Row ltlt EBITDA gtgt (ltlt value_1 gtgt q_act_jan)13User Value 8330 Tsd | -00 | 00 | 00 | ||||||||||||||||||||||||||||||||||||||||
| Depreciation and amortization | (52) | (52) | (103) | (55) | (158) | (53) | (211) | (46) | (47) | (93) | (46) | (139) | m10 | m10 | r10 PAC Hamon Pierrick Referenced Value (value_1_PQACT02)1313Document Q3_2017_Quarter_Report13Chapter Products quater and year to date13Row ltlt Depreciation and amortization gtgt (ltlt value_1 gtgt q_act)13User Value -458 Tsd | r10 PAC Hamon Pierrick Referenced Value (value_1_PQACTJAN02)1313Document Q3_2017_Quarter_Report13Chapter Products quater and year to date13Row ltlt Depreciation and amortization gtgt (ltlt value_1 gtgt q_act_jan)13User Value -1387 Tsd | -00 | 01 | 01 | ||||||||||||||||||||||||||||||||||||||||
| EBIT adjusted | 178 | 279 | 457 | 269 | 726 | 208 | 935 | 171 | 220 | 391 | 303 | 694 | m11 | m11 | r11 PAC Hamon Pierrick Referenced Value (value_1_PQACT02)1313Document Q3_2017_Quarter_Report13Chapter Products quater and year to date13Row ltlt Operating result (EBIT) gtgt (ltlt value_1 gtgt q_act)13User Value 3033 Tsd | r11 PAC Hamon Pierrick Referenced Value (value_1_PQACTJAN02)1313Document Q3_2017_Quarter_Report13Chapter Products quater and year to date13Row ltlt Operating result (EBIT) gtgt (ltlt value_1 gtgt q_act_jan)13User Value 6943 Tsd | 00 | 00 | 01 | ||||||||||||||||||||||||||||||||||||||||
| in of gross profit | 120 | 179 | 150 | 181 | 160 | 147 | 157 | 118 | 146 | 133 | 188 | 152 | m12 | m12 | s12 | s12 | |||||||||||||||||||||||||||||||||||||||||||
| Non-recurring items | 00 | 00 | 00 | ||||||||||||||||||||||||||||||||||||||||||||||||||||||||
| Restructuring expenses | 00 | (127) | (127) | 00 | (127) | 00 | (127) | 00 | 00 | 00 | 00 | 00 | m14 | m14 | m14 | m14 | 00 | 00 | 00 | ||||||||||||||||||||||||||||||||||||||||
| EBIT reported | 178 | 153 | 331 | 269 | 600 | 208 | 808 | 171 | 220 | 391 | 303 | 694 | m16 | m16 | r16 PAC Hamon Pierrick Referenced Value (value_1_PQACT02)1313Document Q3_2017_Quarter_Report13Chapter Products quater and year to date13Row ltlt Operating result (EBIT) gtgt (ltlt value_1 gtgt q_act)13User Value 3033 Tsd | r16 PAC Hamon Pierrick Referenced Value (value_1_PQACTJAN02)1313Document Q3_2017_Quarter_Report13Chapter Products quater and year to date13Row ltlt Operating result (EBIT) gtgt (ltlt value_1 gtgt q_act_jan)13User Value 6943 Tsd | PAC Hamon Pierrick Referenced Value (value_1_PQACT02)1313Document Q3_2017_Quarter_Report13Chapter Products quater and year to date13Row ltlt Net forwarding revenue gtgt (ltlt value_1 gtgt q_act)13User Value 73890 Tsd | PAC Hamon Pierrick Referenced Value (value_1_PQACTJAN02)1313Document Q3_2017_Quarter_Report13Chapter Products quater and year to date13Row ltlt Net forwarding revenue gtgt (ltlt value_1 gtgt q_act_jan)13User Value 209603 Tsd | PAC Hamon Pierrick Referenced Value (value_1_PQACT02)1313Document Q3_2017_Quarter_Report13Chapter Products quater and year to date13Row ltlt Forwarding services from third parties gtgt (ltlt value_1 gtgt q_act)13User Value -57751 Tsd | 00 | 00 | 00 | |||||||||||||||||||||||||||||||||||||
| in of gross profit | 120 | 98 | 109 | 181 | 132 | 147 | 136 | 118 | 146 | 133 | 188 | 152 | m17 | m17 | s17 | s17 | |||||||||||||||||||||||||||||||||||||||||||
| Air Freight volumes (000 tons) | 2161 | 2251 | 4412 | 2278 | 6690 | 2524 | 9214 | 2332 | 2399 | 4731 | 2489 | 7220 | m19 | m19 | m19 | m19 | 00 | 00 | 00 | ||||||||||||||||||||||||||||||||||||||||
| change YoY | 54 | 111 | 82 | 99 | 88 | 141 | 102 | 79 | 66 | 72 | 93 | 79 | m20 | m20 | s20 | s20 | |||||||||||||||||||||||||||||||||||||||||||
| GPton (CHF) | 688 | 693 | 690 | 653 | 678 | 562 | 646 | 620 | 625 | 623 | 648 | 632 | m21 | m21 | s21 | s21 | |||||||||||||||||||||||||||||||||||||||||||
| change YoY | -47 | -36 | -41 | -73 | -52 | -140 | -75 | -98 | -97 | -98 | -08 | -68 | m22 | m22 | s22 | s22 | |||||||||||||||||||||||||||||||||||||||||||
| GP change YoY | -4 | -3 | 8 | 1 | s23 | s23 |
| 2017 | 2016 | |||||||||||||||||||||||||||||||||||||||||||||||
| Group | Q1 2016 | Q2 2016 | HY 2016 | Q3 2016 | Q3YTD 2016 | Q4 2016 | FY 2016 | Q1 2017 | Q2 2017 | HY 2017 | Q3 2017 | Q3YTD 2017 | ||||||||||||||||||||||||||||||||||||
| Net forwarding revenue | 13072 | 12894 | 25965 | 12670 | 38635 | 13325 | 51960 | 12772 | 13549 | 26321 | 14334 | 40655 | r4 PAC Hamon Pierrick Referenced Value (value_1_PQACT02)1313Document Q3_2017_Quarter_Report13Chapter Consolidated Income Statement13Row ltlt Net forwarding revenue gtgt (ltlt 2017 gtgt q_act)13User Value 1433411124 Tsd | r4 PAC Hamon Pierrick Referenced Value (value_1_PQACTJAN02)1313Document Q3_2017_Quarter_Report13Chapter Consolidated Income Statement13Row ltlt Net forwarding revenue gtgt (ltlt 2017 gtgt q_act_jan)13User Value 4065500417 Tsd | -00 | -01 | -01 | |||||||||||||||||||||||||||||||
| Forwarding expenses | (9423) | (9180) | (18602) | (9116) | (27718) | (9996) | (37714) | (9445) | (10145) | (19590) | (10818) | (30407) | r5 PAC Hamon Pierrick Referenced Value (value_1_PQACT02)1313Document Q3_2017_Quarter_Report13Chapter Consolidated Income Statement13Row ltlt Forwarding services from third parties gtgt (ltlt 2017 gtgt q_act)13User Value -1081765298 Tsd | r5 PAC Hamon Pierrick Referenced Value (value_1_PQACTJAN02)1313Document Q3_2017_Quarter_Report13Chapter Consolidated Income Statement13Row ltlt Forwarding services from third parties gtgt (ltlt 2017 gtgt q_act_jan)13User Value -3040736424 Tsd | 00 | 01 | 01 | |||||||||||||||||||||||||||||||
| Gross profit | 3649 | 3714 | 7363 | 3554 | 10917 | 3329 | 14246 | 3327 | 3404 | 6731 | 3516 | 10248 | r6 PAC Hamon Pierrick Referenced Value (value_1_PQACT02)1313Document Q3_2017_Quarter_Report13Chapter Consolidated Income Statement13Row ltlt Gross profit gtgt (ltlt 2017 gtgt q_act)13User Value 351645826 Tsd | r6 PAC Hamon Pierrick Referenced Value (value_1_PQACTJAN02)1313Document Q3_2017_Quarter_Report13Chapter Consolidated Income Statement13Row ltlt Gross profit gtgt (ltlt 2017 gtgt q_act_jan)13User Value 1024763993 Tsd | 00 | 00 | 00 | |||||||||||||||||||||||||||||||
| Personnel expenses | (2250) | (2213) | (4463) | (2129) | (6592) | (2113) | (8705) | (2164) | (2162) | (4326) | (2186) | (6511) | r7 PAC Hamon Pierrick Referenced Value (value_1_PQACT02)1313Document Q3_2017_Quarter_Report13Chapter Consolidated Income Statement13Row ltlt Personnel expenses gtgt (ltlt 2017 gtgt q_act)13User Value -218561825 Tsd | r7 PAC Hamon Pierrick Referenced Value (value_1_PQACTJAN02)1313Document Q3_2017_Quarter_Report13Chapter Consolidated Income Statement13Row ltlt Personnel expenses gtgt (ltlt 2017 gtgt q_act_jan)13User Value -651090060 Tsd | 00 | 00 | 00 | |||||||||||||||||||||||||||||||
| Other operating expenses | (1037) | (1011) | (2047) | (971) | (3018) | (927) | (3945) | (893) | (880) | (1773) | (925) | (2698) | r8 PAC Hamon Pierrick Referenced Value (value_1_PQACT02)1313Document Q3_2017_Quarter_Report13Chapter Consolidated Income Statement13Row ltlt Other operating expenses gtgt (ltlt 2017 gtgt q_act)13User Value -92494218 Tsd | r8 PAC Hamon Pierrick Referenced Value (value_1_PQACTJAN02)1313Document Q3_2017_Quarter_Report13Chapter Consolidated Income Statement13Row ltlt Other operating expenses gtgt (ltlt 2017 gtgt q_act_jan)13User Value -269813050 Tsd | 00 | 01 | 01 | |||||||||||||||||||||||||||||||
| EBITDA adjusted | 362 | 491 | 853 | 454 | 1307 | 289 | 1596 | 271 | 362 | 633 | 406 | 1039 | r9 PAC Hamon Pierrick Referenced Value (value_1_PQACT02)1313Document Q3_2017_Quarter_Report13Chapter Consolidated Income Statement13Row ltlt EBITDA gtgt (ltlt 2017 gtgt q_act)13User Value 40589783 Tsd | r9 PAC Hamon Pierrick Referenced Value (value_1_PQACTJAN02)1313Document Q3_2017_Quarter_Report13Chapter Consolidated Income Statement13Row ltlt EBITDA gtgt (ltlt 2017 gtgt q_act_jan)13User Value 103860882 Tsd | -00 | 00 | 00 | |||||||||||||||||||||||||||||||
| Depreciation of property plant and equip | (62) | (62) | (125) | (62) | (187) | (71) | (258) | (53) | (54) | (107) | (50) | (156) | r10 PAC Hamon Pierrick Referenced Value (value_1_PQACT02)1313Document Q3_2017_Quarter_Report13Chapter Consolidated Income Statement13Row ltlt Depreciation of property plant and equipment gtgt (ltlt 2017 gtgt q_act)13User Value -4981553 Tsd | r10 PAC Hamon Pierrick Referenced Value (value_1_PQACTJAN02)1313Document Q3_2017_Quarter_Report13Chapter Consolidated Income Statement13Row ltlt Depreciation of property plant and equipment gtgt (ltlt 2017 gtgt q_act_jan)13User Value -15648388 Tsd | 00 | -01 | -01 | |||||||||||||||||||||||||||||||
| Amortization of intangible assets | (60) | (60) | (120) | (63) | (183) | (56) | (239) | (54) | (52) | (106) | (55) | (162) | r11 PAC Hamon Pierrick Referenced Value (value_1_PQACT02)1313Document Q3_2017_Quarter_Report13Chapter Consolidated Income Statement13Row ltlt Amortization of intangible assets gtgt (ltlt 2017 gtgt q_act)13User Value -5514918 Tsd | r11 PAC Hamon Pierrick Referenced Value (value_1_PQACTJAN02)1313Document Q3_2017_Quarter_Report13Chapter Consolidated Income Statement13Row ltlt Amortization of intangible assets gtgt (ltlt 2017 gtgt q_act_jan)13User Value -16157763 Tsd | -00 | 00 | 00 | |||||||||||||||||||||||||||||||
| EBIT adjusted | 240 | 368 | 608 | 329 | 936 | 163 | 1099 | 164 | 256 | 420 | 301 | 721 | r12 PAC Hamon Pierrick Referenced Value (value_1_PQACT02)1313Document Q3_2017_Quarter_Report13Chapter Consolidated Income Statement13Row ltlt Operating result (EBIT) gtgt (ltlt 2017 gtgt q_act)13User Value 30093312 Tsd | r12 PAC Hamon Pierrick Referenced Value (value_1_PQACTJAN02)1313Document Q3_2017_Quarter_Report13Chapter Consolidated Income Statement13Row ltlt Operating result (EBIT) gtgt (ltlt 2017 gtgt q_act_jan)13User Value 72054731 Tsd | -00 | 00 | -01 | |||||||||||||||||||||||||||||||
| in of gross profit | 66 | 99 | 83 | 92 | 86 | 49 | 77 | 49 | 75 | 62 | 86 | 70 | s13 | s13 | ||||||||||||||||||||||||||||||||||
| Non-recurring items | 00 | 00 | 00 | |||||||||||||||||||||||||||||||||||||||||||||
| Restructuring expenses | 00 | (261) | (261) | 00 | (261) | (19) | (280) | 00 | 00 | 00 | 00 | 00 | r15 PAC Hamon Pierrick Referenced Value (value_1_PQACT02)1313Document Q3_2017_Quarter_Report13Chapter Consolidated Income Statement13Row ltlt Restructuring expenses gtgt (ltlt 2017 gtgt q_act)13User Value 0000000 Tsd | r15 PAC Hamon Pierrick Referenced Value (value_1_PQACTJAN02)1313Document Q3_2017_Quarter_Report13Chapter Consolidated Income Statement13Row ltlt Restructuring expenses gtgt (ltlt 2017 gtgt q_act_jan)13User Value 0000000 Tsd | 00 | 00 | 00 | |||||||||||||||||||||||||||||||
| EBIT reported | 240 | 107 | 347 | 329 | 675 | 144 | 820 | 164 | 256 | 420 | 301 | 721 | s17 | s17 | -00 | 00 | 00 | |||||||||||||||||||||||||||||||
| in of gross profit | 66 | 29 | 47 | 92 | 62 | 43 | 58 | 49 | 75 | 62 | 86 | 70 | s18 | s18 | -01 | -00 | -02 | |||||||||||||||||||||||||||||||
| Financial result | (09) | 07 | (02) | (04) | (06) | 02 | (04) | 02 | 01 | 03 | (04) | (02) | r19 PAC Hamon Pierrick Referenced Value (value_1_PQACT02)1313Document Q3_2017_Quarter_Report13Chapter Consolidated Income Statement13130939883 Tsd - ltlt Finance income gtgt (ltlt 2017 gtgt q_act)13-1343957 Tsd - ltlt Finance costs gtgt (ltlt 2017 gtgt q_act)13---------------------13-0404074 Tsd (Total) | r19 PAC Hamon Pierrick Referenced Value (value_1_PQACTJAN02)1313Document Q3_2017_Quarter_Report13Chapter Consolidated Income Statement13133163726 Tsd - ltlt Finance income gtgt (ltlt 2017 gtgt q_act_jan)13-3315684 Tsd - ltlt Finance costs gtgt (ltlt 2017 gtgt q_act_jan)13---------------------13-0151958 Tsd (Total) | -00 | 00 | 00 | |||||||||||||||||||||||||||||||
| Earnings before taxes (EBT) | 231 | 114 | 345 | 325 | 670 | 146 | 816 | 165 | 257 | 422 | 297 | 719 | r20 PAC Hamon Pierrick Referenced Value (value_1_PQACT02)1313Document Q3_2017_Quarter_Report13Chapter Consolidated Income Statement13Row ltlt Profit before income tax (EBT) gtgt (ltlt 2017 gtgt q_act)13User Value 29689237 Tsd | r20 PAC Hamon Pierrick Referenced Value (value_1_PQACTJAN02)1313Document Q3_2017_Quarter_Report13Chapter Consolidated Income Statement13Row ltlt Profit before income tax (EBT) gtgt (ltlt 2017 gtgt q_act_jan)13User Value 71902773 Tsd | 00 | 00 | 00 | |||||||||||||||||||||||||||||||
| Income tax expenses | (58) | (69) | (126) | (79) | (205) | (88) | (293) | (42) | (81) | (123) | (112) | (235) | r21 PAC Hamon Pierrick Referenced Value (value_1_PQACT02)1313Document Q3_2017_Quarter_Report13Chapter Consolidated Income Statement13Row ltlt Income tax expenses gtgt (ltlt 2017 gtgt q_act)13User Value -8638414 Tsd | r21 PAC Hamon Pierrick Referenced Value (value_1_PQACTJAN02)1313Document Q3_2017_Quarter_Report13Chapter Consolidated Income Statement13Row ltlt Income tax expenses gtgt (ltlt 2017 gtgt q_act_jan)13User Value -20922552 Tsd | 00 | 01 | 01 | |||||||||||||||||||||||||||||||
| of EBT | 250 | 602 | 367 | 242 | 306 | 601 | 359 | 252 | 316 | 291 | 378 | 327 | s22 | s22 | ||||||||||||||||||||||||||||||||||
| Profit | 173 | 45 | 218 | 246 | 465 | 58 | 523 | 124 | 176 | 299 | 185 | 484 | r23 PAC Hamon Pierrick Referenced Value (value_1_PQACT02)1313Document Q3_2017_Quarter_Report13Chapter Consolidated Income Statement13Row ltlt Profit gtgt (ltlt 2017 gtgt q_act)13User Value 21050824 Tsd | r23 PAC Hamon Pierrick Referenced Value (value_1_PQACTJAN02)1313Document Q3_2017_Quarter_Report13Chapter Consolidated Income Statement13Row ltlt Profit gtgt (ltlt 2017 gtgt q_act_jan)13User Value 50980221 Tsd | -00 | 00 | 01 | |||||||||||||||||||||||||||||||
| Earnings per share | 075 | 021 | 096 | 106 | 201 | 027 | 229 | 054 | 075 | 129 | 079 | 208 | s24 PAC Serova Elena (External) Referenced Value (value_1_PQACTJAN02)1313Document Q2_2017_Quarter_Report13Chapter Consolidated Income Statement13Row ltlt Basic gtgt (ltlt 2017 gtgt q_act_jan)13User Value 0000540 Tsd | s24 PAC Serova Elena (External) Referenced Value (value_1_PQACTJAN02)1313Document Q2_2017_Quarter_Report13Chapter Consolidated Income Statement13Row ltlt Basic gtgt (ltlt 2017 gtgt q_act_jan)13User Value 0000540 Tsd | 00 | 00 | 00 | |||||||||||||||||||||||||||||||
| 0 | 0 | 46460419259 | 0 | 0 | 0 | 0 | m25 | m25 | 00 | 00 | ||||||||||||||||||||||||||||||||||||||
| Earnings per share 1000 | 0000788 | 0002078 | rf28 PAC Hamon Pierrick Referenced Value (value_1_PQACT02)1313Document Q3_2017_Quarter_Report13Chapter Consolidated Income Statement13Row ltlt Basic gtgt (ltlt 2017 gtgt q_act)13User Value 0000898 Tsd | rf28 PAC Hamon Pierrick Referenced Value (value_1_PQACTJAN02)1313Document Q3_2017_Quarter_Report13Chapter Consolidated Income Statement13Row ltlt Basic gtgt (ltlt 2017 gtgt q_act_jan)13User Value 0002188 Tsd | ||||||||||||||||||||||||||||||||||||||||||||
| Total Operating Expenses | (3111) | (9209) | s25 | s25 | ||||||||||||||||||||||||||||||||||||||||||||
| OOE YoY | ||||||||||||||||||||||||||||||||||||||||||||||||
| 042 |
| Q3 | |||||||||||||||||||
| GP | Q3 2016 | Q4 2016 | Q1 2017 | Q2 2017 | Q3 2017 | Gross profit | |||||||||||||
| 94 | 92 | 83 | 81 | 81 | r3 PAC Stuker Benjamin Referenced Value (value_3_PQACT02)1313Document Q3_2017_Investor amp AC presentations13Chapter 38 - IRAC Income statement per quarter - Logistics13Row Gross profit (value_1 q_act)13User Value 814848 Mio | Q3 2016 | 94 | ||||||||||||
| Q4 2016 | 92 | ||||||||||||||||||
| Q1 2017 | 83 | ||||||||||||||||||
| Q2 2017 | 81 | ||||||||||||||||||
| EBIT | 09 | 05 | 24 | 31 | 27 | r7 PAC Stuker Benjamin Referenced Value (value_3_PQACT02)1313Document Q3_2017_Investor amp AC presentations13Chapter 38 - IRAC Income statement per quarter - Logistics13Row EBIT reported (value_1 q_act)13User Value 27118 Mio | Q3 2017 | 81 | |||||||||||
| EBIT | |||||||||||||||||||
| Q3 2016 | 09 | ||||||||||||||||||
| Q4 2016 | 05 | ||||||||||||||||||
| Q1 2017 | 24 | ||||||||||||||||||
| Q2 2017 | 31 | ||||||||||||||||||
| Q3 2017 | 27 |
| 2017 | 2016 | ||||||||||||||||||||||||||||||||
| 2017 | 2016 | 2017 | |||||||||||||||||||||||||||||||
| YoY Growth | Q3 | Q4 | Q1 | Q2 | Q3 | Gross Profit EBIT | YTD | YTD | |||||||||||||||||||||||||
| Gross Profit | -6 | -11 | -16 | -19 | -14 | r5 PAC Stuker Benjamin Referenced Value (value_1_PQACT02)1313Document Q3_2017_Investor amp AC presentations13Chapter 38 - IRAC Income statement per quarter - Logistics13Row GP Change YoY (value_1 q_act)13User Value -01372 Mio | Gross Profit | 2933 | 24537 | -16 | r5 PAC Stuker Benjamin Referenced Value (value_2_PQACT02)1313Document Q3_2017_Quarter_Report13Chapter Products quater and year to date13Row ltlt Gross profit gtgt (ltlt value_3 gtgt q_act_jan)13User Value 24537 Tsd1313----------------------------------------------------------------------------------------1313Referenced Value (value_2_PQPRIOR02)1313Document Q3_2017_Investor amp AC presentations13Chapter 38 - IRAC Income statement per quarter - Logistics13Row Gross profit (value_1 q_prior_jan)13User Value 2933025 Mio | ||||||||||||||||||||||
| EBIT (adjusted PY) | 50 | 81 | 63 | rf7 PAC Stuker Benjamin Referenced Value (value_2_PQACT02)1313Document Q3_2017_Quarter_Report13Chapter Products quater and year to date13Row ltlt Operating result (EBIT) gtgt (ltlt value_3 gtgt q_act_jan)13User Value 815 Tsd1313----------------------------------------------------------------------------------------1313Referenced Value (value_2_PQPRIOR02)1313Document Q3_2017_Quarter_Report13Chapter Products quater and year to date13Row ltlt Operating result (Segment EBIT) adjusted gtgt (ltlt value_3 gtgt q_prior_jan)13User Value 501 Tsd | |||||||||||||||||||||||||||||
| NFR in of EBIT | 10 | 20 | m9 | ||||||||||||||||||||||||||||||
| NFR | 43888478 | 4057267 | rf8 PAC Stuker Benjamin Referenced Value (value_2_PQACT02)1313Document Q3_2017_Quarter_Report13Chapter Products quater and year to date13Row ltlt Net forwarding revenue gtgt (ltlt value_3 gtgt q_act_jan)13User Value 40573 Tsd1313----------------------------------------------------------------------------------------1313Referenced Value (value_2_PQPRIOR02)1313Document Q3_2017_Quarter_Report13Chapter Products quater and year to date13Row ltlt Net forwarding revenue gtgt (ltlt value_3 gtgt q_prior_jan)13User Value 43888 Tsd |
| Q3 | ||||||||||||||||||||||||||
| TEU | Q3 2016 | Q4 2016 | Q1 2017 | Q2 2017 | Q3 2017 | TEU | ||||||||||||||||||||
| 379 | 389 | 374 | 3828 | 386 | m3 | r3 PAC Monaco Salvatore Referenced Value (value_3_PQACT02)1313Document Q3_2017_Investor amp AC presentations13Chapter 37 - IRAC Income statement per quarter - Ocean Freight13Row Ocean Freight volumes (000 tons) (value_1 q_act)13User Value 3856050 Mio | Q3 2016 | 379 | 296 | |||||||||||||||||
| 296 | 254 | 282 | 285 | 282 | m4 | r4 PAC Monaco Salvatore Referenced Value (value_3_PQACT02)1313Document Q3_2017_Investor amp AC presentations13Chapter 37 - IRAC Income statement per quarter - Ocean Freight13Row GPTEU (CHF) (value_1 q_act)13User Value 2820750 Mio | Q4 2016 | 389 | 254 | |||||||||||||||||
| Q1 2017 | 374 | 282 | ||||||||||||||||||||||||
| Q2 2017 | 383 | 285 | ||||||||||||||||||||||||
| EBIT | 51 | -51 | -32 | 06 | -29 | m7 | r10 PAC Monaco Salvatore Referenced Value (value_3_PQACT02)1313Document Q3_2017_Investor amp AC presentations13Chapter 37 - IRAC Income statement per quarter - Ocean Freight13Row EBIT reported (value_1 q_act)13User Value -29490 Mio | Q3 2017 | 386 | 282 | ||||||||||||||||
| 45 | -51 | -3 | 06 | -003 | m8 | r8 PAC Monaco Salvatore Referenced Value (value_3_PQACT02)1313Document Q3_2017_Investor amp AC presentations13Chapter 37 - IRAC Income statement per quarter - Ocean Freight13Row in of gross profit (value_1 q_act)13User Value -00271 Mio | ||||||||||||||||||||
PAC Hamon Pierrick Invalid Reference (value_3_PQACT02) 1313Reference could not be handled13Underlying Formula | EBIT | EBIT | EBIT GP | |||||||||||||||||||||||
| 0 | -00271 | r11 PAC Monaco Salvatore Referenced Value (value_3_PQACT02)1313Document Q3_2017_Investor amp AC presentations13Chapter 37 - IRAC Income statement per quarter - Ocean Freight13Row in of gross profit (value_1 q_act)13User Value -00271 Mio | PAC Monaco Salvatore Referenced Value (value_3_PQACT02)1313Document Q3_2017_Investor amp AC presentations13Chapter 37 - IRAC Income statement per quarter - Ocean Freight13Row Ocean Freight volumes (000 tons) (value_1 q_act)13User Value 3856050 Mio | PAC Monaco Salvatore Referenced Value (value_3_PQACT02)1313Document Q3_2017_Investor amp AC presentations13Chapter 37 - IRAC Income statement per quarter - Ocean Freight13Row GPTEU (CHF) (value_1 q_act)13User Value 2820750 Mio | PAC Monaco Salvatore Referenced Value (value_3_PQACT02)1313Document Q3_2017_Investor amp AC presentations13Chapter 37 - IRAC Income statement per quarter - Ocean Freight13Row EBIT reported (value_1 q_act)13User Value -29490 Mio | PAC Monaco Salvatore Referenced Value (value_3_PQACT02)1313Document Q3_2017_Investor amp AC presentations13Chapter 37 - IRAC Income statement per quarter - Ocean Freight13Row in of gross profit (value_1 q_act)13User Value -00271 Mio | Q3 2016 | 51 | 45 | |||||||||||||||||
| Q4 2016 | -51 | -51 | ||||||||||||||||||||||||
| Q1 2017 | -32 | -30 | ||||||||||||||||||||||||
| Q2 2017 | 06 | 06 | ||||||||||||||||||||||||
| Q3 2017 | -29 | -27 |
| 2017 | 2016 | |||||||||||||||||||||||||||||||||||||||||||||
| 2017 | 2016 | 2017 | ||||||||||||||||||||||||||||||||||||||||||||
| YoY Growth | Q3 | Q4 | Q1 | Q2 | Q3 | Gross Profit EBIT | YTD | YTD | ||||||||||||||||||||||||||||||||||||||
| Volume (market estimated) | 0 | 3 | 4 | 3 | 3 | m5 | Gross Profit | 3450 | 3234 | -6 | r5 PAC Monaco Salvatore Referenced Value (value_2_PQACT02)1313Document Q3_2017_Investor amp AC presentations13Chapter 37 - IRAC Income statement per quarter - Ocean Freight13Row Gross profit (value_1 q_act_jan)13User Value 3233667 Mio1313----------------------------------------------------------------------------------------1313Referenced Value (value_2_PQPRIOR02)1313Document Q3_2017_Investor amp AC presentations13Chapter 37 - IRAC Income statement per quarter - Ocean Freight13Row Gross profit (value_1 q_prior_jan)13User Value 3450353 Mio | |||||||||||||||||||||||||||||||||||
| Volume (Panalpina) | -9 | 1 | 7 | 3 | 2 | r6 PAC Monaco Salvatore Referenced Value (value_1_PQACT02)1313Document Q3_2017_Investor amp AC presentations13Chapter 37 - IRAC Income statement per quarter - Ocean Freight13Row change YoY (value_1 q_act)13User Value 00182 Mio | EBIT (adjusted PY) | 160 | -55 | -135 | r6 PAC Monaco Salvatore Referenced Value (value_2_PQACT02)1313Document Q3_2017_Investor amp AC presentations13Chapter 37 - IRAC Income statement per quarter - Ocean Freight13Row EBIT adjusted (value_1 q_act_jan)13User Value -55208 Mio1313----------------------------------------------------------------------------------------1313Referenced Value (value_2_PQPRIOR02)1313Document Q3_2017_Investor amp AC presentations13Chapter 37 - IRAC Income statement per quarter - Ocean Freight13Row EBIT adjusted (value_1 q_prior_jan)13User Value 159801 Mio | |||||||||||||||||||||||||||||||||||
| GPTEU | -2 | -18 | -17 | -7 | -5 | r7 PAC Monaco Salvatore Referenced Value (value_1_PQACT02)1313Document Q3_2017_Investor amp AC presentations13Chapter 37 - IRAC Income statement per quarter - Ocean Freight13Row change YoY (value_1 q_act)13User Value -00471 Mio | EBITGP () | 46 | -17 | r7 PAC Monaco Salvatore Referenced Value (value_2_PQACT02)1313Document Q3_2017_Investor amp AC presentations13Chapter 37 - IRAC Income statement per quarter - Ocean Freight13Row in of gross profit (value_1 q_act_jan)13User Value -00171 Mio1313----------------------------------------------------------------------------------------1313Referenced Value (value_2_PQPRIOR02)1313Document Q3_2017_Investor amp AC presentations13Chapter 37 - IRAC Income statement per quarter - Ocean Freight13Row in of gross profit (value_1 q_prior_jan)13User Value 00463 Mio | ||||||||||||||||||||||||||||||||||||
| Gross Profit | -10 | -16 | -11 | -5 | -3 | r8 PAC Monaco Salvatore Referenced Value (value_1_PQACT02)1313Document Q3_2017_Investor amp AC presentations13Chapter 37 - IRAC Income statement per quarter - Ocean Freight13Row GP change YoY (value_1 q_act)13User Value -00298 Mio | PAC Monaco Salvatore Referenced Value (value_2_PQACT02)1313Document Q3_2017_Investor amp AC presentations13Chapter 37 - IRAC Income statement per quarter - Ocean Freight13Row Gross profit (value_1 q_act_jan)13User Value 3233667 Mio1313----------------------------------------------------------------------------------------1313Referenced Value (value_2_PQPRIOR02)1313Document Q3_2017_Investor amp AC presentations13Chapter 37 - IRAC Income statement per quarter - Ocean Freight13Row Gross profit (value_1 q_prior_jan)13User Value 3450353 Mio | PAC Monaco Salvatore Referenced Value (value_2_PQACT02)1313Document Q3_2017_Investor amp AC presentations13Chapter 37 - IRAC Income statement per quarter - Ocean Freight13Row EBIT adjusted (value_1 q_act_jan)13User Value -55208 Mio1313----------------------------------------------------------------------------------------1313Referenced Value (value_2_PQPRIOR02)1313Document Q3_2017_Investor amp AC presentations13Chapter 37 - IRAC Income statement per quarter - Ocean Freight13Row EBIT adjusted (value_1 q_prior_jan)13User Value 159801 Mio | PAC Monaco Salvatore Referenced Value (value_2_PQACT02)1313Document Q3_2017_Investor amp AC presentations13Chapter 37 - IRAC Income statement per quarter - Ocean Freight13Row in of gross profit (value_1 q_act_jan)13User Value -00171 Mio1313----------------------------------------------------------------------------------------1313Referenced Value (value_2_PQPRIOR02)1313Document Q3_2017_Investor amp AC presentations13Chapter 37 - IRAC Income statement per quarter - Ocean Freight13Row in of gross profit (value_1 q_prior_jan)13User Value 00463 Mio | Volumes (TEUs 000) | 10995 | 11426 | 4 | r8 PAC Monaco Salvatore Referenced Value (value_2_PQACT02)1313Document Q3_2017_Investor amp AC presentations13Chapter 37 - IRAC Income statement per quarter - Ocean Freight13Row Ocean Freight volumes (000 tons) (value_1 q_act_jan)13User Value 11426050 Mio1313----------------------------------------------------------------------------------------1313Referenced Value (value_2_PQPRIOR02)1313Document Q3_2017_Investor amp AC presentations13Chapter 37 - IRAC Income statement per quarter - Ocean Freight13Row Ocean Freight volumes (000 tons) (value_1 q_prior_jan)13User Value 10994918 Mio |
| Q3 | |||||||||||||||||||||||
| TEU | Q3 2016 | Q4 2016 | Q1 2017 | Q2 2017 | Q3 2017 | TEU | |||||||||||||||||
| 228 | 252 | 233 | 240 | 249 | m4 | r3 PAC Monaco Salvatore Referenced Value (value_3_PQACT02)1313Document Q3_2017_Investor amp AC presentations13Chapter 36 - IRAC Income statement per quarter - Air Freight13Row Air Freight volumes (000 tons) (value_1 q_act)13User Value 2489350 Mio | Q3 2016 | 228 | 653 | ||||||||||||||
| 653 | 562 | 620 | 625 | 648 | m5 | r4 PAC Monaco Salvatore Referenced Value (value_3_PQACT02)1313Document Q3_2017_Investor amp AC presentations13Chapter 36 - IRAC Income statement per quarter - Air Freight13Row GPton (CHF) (value_1 q_act)13User Value 6483290 Mio | Q4 2016 | 252 | 562 | ||||||||||||||
| Q1 2017 | 233 | 620 | |||||||||||||||||||||
| Q2 2017 | 240 | 625 | |||||||||||||||||||||
| EBIT | 269 | 208 | 171 | 220 | 303 | m6 | r7 PAC Monaco Salvatore Referenced Value (value_3_PQACT02)1313Document Q3_2017_Investor amp AC presentations13Chapter 36 - IRAC Income statement per quarter - Air Freight13Row EBIT adjusted (value_1 q_act)13User Value 303313 Mio | Q3 2017 | 249 | 648 | |||||||||||||
| 181 | 147 | 118 | 147 | 019 | m7 | r8 PAC Monaco Salvatore Referenced Value (value_3_PQACT02)1313Document Q3_2017_Investor amp AC presentations13Chapter 36 - IRAC Income statement per quarter - Air Freight13Row in of gross profit (value_1 q_act)13User Value 01879 Mio | |||||||||||||||||
| EBIT | |||||||||||||||||||||||
| Q3 2016 | 269 | 181 | |||||||||||||||||||||
| Q4 2016 | 208 | 147 | |||||||||||||||||||||
| Q1 2017 | 171 | 118 | |||||||||||||||||||||
| Q2 2017 | 220 | 147 | |||||||||||||||||||||
| Q3 2017 | 303 | 188 |
| 2017 | 2016 | |||||||||||||||||||||||||||||||||||||||||||||
| 2017 | 2016 | 2017 | ||||||||||||||||||||||||||||||||||||||||||||
| YoY Growth | Q3 | Q4 | Q1 | Q2 | Q3 | Gross Profit EBIT | YTD | YTD | ||||||||||||||||||||||||||||||||||||||
| Volume (market estimated) | 2 | 8 | 6 | 10 | 10 | m5 | Gross Profit | 4534 | 4560 | 1 | r5 PAC Monaco Salvatore Referenced Value (value_2_PQACT02)1313Document Q3_2017_Investor amp AC presentations13Chapter 36 - IRAC Income statement per quarter - Air Freight13Row Gross profit (value_1 q_act_jan)13User Value 4560242 Mio1313----------------------------------------------------------------------------------------1313Referenced Value (value_2_PQPRIOR02)1313Document Q3_2017_Investor amp AC presentations13Chapter 36 - IRAC Income statement per quarter - Air Freight13Row Gross profit (value_1 q_prior_jan)13User Value 4533576 Mio | |||||||||||||||||||||||||||||||||||
| Volume (Panalpina) | 10 | 14 | 8 | 7 | 8 | r6 PAC Monaco Salvatore Referenced Value (value_1_PQACT02)1313Document Q3_2017_Investor amp AC presentations13Chapter 36 - IRAC Income statement per quarter - Air Freight13Row change YoY (value_1 q_act_jan)13User Value 00793 Mio | EBIT (adjusted PY) | 726 | 694 | -4 | r6 PAC Monaco Salvatore Referenced Value (value_2_PQACT02)1313Document Q3_2017_Investor amp AC presentations13Chapter 36 - IRAC Income statement per quarter - Air Freight13Row EBIT reported (value_1 q_act_jan)13User Value 694303 Mio1313----------------------------------------------------------------------------------------1313Referenced Value (value_2_PQPRIOR02)1313Document Q3_2017_Investor amp AC presentations13Chapter 36 - IRAC Income statement per quarter - Air Freight13Row EBIT adjusted (value_1 q_prior_jan)13User Value 726409 Mio | |||||||||||||||||||||||||||||||||||
| GPton | -7 | -14 | -10 | -10 | -1 | r7 PAC Monaco Salvatore Referenced Value (value_1_PQACT02)1313Document Q3_2017_Investor amp AC presentations13Chapter 36 - IRAC Income statement per quarter - Air Freight13Row change YoY (value_1 q_act)13User Value -00079 Mio | EBITGP () | 160 | 152 | r7 PAC Monaco Salvatore Referenced Value (value_2_PQACT02)1313Document Q3_2017_Investor amp AC presentations13Chapter 36 - IRAC Income statement per quarter - Air Freight13Row in of gross profit (value_1 q_act_jan)13User Value 01523 Mio1313----------------------------------------------------------------------------------------1313Referenced Value (value_2_PQPRIOR02)1313Document Q3_2017_Investor amp AC presentations13Chapter 36 - IRAC Income statement per quarter - Air Freight13Row in of gross profit (value_1 q_prior_jan)13User Value 01602 Mio | ||||||||||||||||||||||||||||||||||||
| Gross Profit | 2 | -2 | -3 | -4 | 8 | r8 PAC Monaco Salvatore Referenced Value (value_1_PQACT02)1313Document Q3_2017_Investor amp AC presentations13Chapter 36 - IRAC Income statement per quarter - Air Freight13Row GP change YoY (value_1 q_act)13User Value 00842 Mio | PAC Monaco Salvatore Referenced Value (value_2_PQACT02)1313Document Q3_2017_Investor amp AC presentations13Chapter 36 - IRAC Income statement per quarter - Air Freight13Row Gross profit (value_1 q_act_jan)13User Value 4560242 Mio1313----------------------------------------------------------------------------------------1313Referenced Value (value_2_PQPRIOR02)1313Document Q3_2017_Investor amp AC presentations13Chapter 36 - IRAC Income statement per quarter - Air Freight13Row Gross profit (value_1 q_prior_jan)13User Value 4533576 Mio | PAC Monaco Salvatore Referenced Value (value_2_PQACT02)1313Document Q3_2017_Investor amp AC presentations13Chapter 36 - IRAC Income statement per quarter - Air Freight13Row EBIT reported (value_1 q_act_jan)13User Value 694303 Mio1313----------------------------------------------------------------------------------------1313Referenced Value (value_2_PQPRIOR02)1313Document Q3_2017_Investor amp AC presentations13Chapter 36 - IRAC Income statement per quarter - Air Freight13Row EBIT adjusted (value_1 q_prior_jan)13User Value 726409 Mio | PAC Monaco Salvatore Referenced Value (value_2_PQACT02)1313Document Q3_2017_Investor amp AC presentations13Chapter 36 - IRAC Income statement per quarter - Air Freight13Row in of gross profit (value_1 q_act_jan)13User Value 01523 Mio1313----------------------------------------------------------------------------------------1313Referenced Value (value_2_PQPRIOR02)1313Document Q3_2017_Investor amp AC presentations13Chapter 36 - IRAC Income statement per quarter - Air Freight13Row in of gross profit (value_1 q_prior_jan)13User Value 01602 Mio | Volumes (tons 000) | 6690 | 7220 | 8 | r8 PAC Monaco Salvatore Referenced Value (value_2_PQACT02)1313Document Q3_2017_Investor amp AC presentations13Chapter 36 - IRAC Income statement per quarter - Air Freight13Row Air Freight volumes (000 tons) (value_1 q_act_jan)13User Value 7220350 Mio1313----------------------------------------------------------------------------------------1313Referenced Value (value_2_PQPRIOR02)1313Document Q3_2017_Investor amp AC presentations13Chapter 36 - IRAC Income statement per quarter - Air Freight13Row Air Freight volumes (000 tons) (value_1 q_prior_jan)13User Value 6690029 Mio |
| 2016 | 2017 | |||||||||||||||
| YoY Growth | Q1 | Q2 | Q3 | Q4 | Q1 | |||||||||||
| Volume (market) | -4 | -2 | 2 | 8 | 6 | |||||||||||
| Volume (Panalpina) | 5 | 11 | 10 | 14 | 8 | |||||||||||
| GPton | -5 | -4 | -7 | -14 | -10 | |||||||||||
| GPton | 0 | 7 | 2 | -2 | -3 | |||||||||||
| 2016 | 2017 | |||||||||||||||
| Gross Profit EBIT | Q1 | Q1 | ||||||||||||||
| Gross Profit | 1486 | 1447 | ||||||||||||||
| EBIT | 178 | 171 | ||||||||||||||
| EBITGP () | 120 | 118 |
| Q3 | 2017 | 2016 | ||||||||||||||||||||
| Data for Charts | ||||||||||||||||||||||
| Gross profit | Gross profit | |||||||||||||||||||||
| Q3 | 102476 | 10917 | r4 PAC Hamon Pierrick Referenced Value (value_1_PQACTJAN02)1313Document Q3_2017_Quarter_Report13Chapter Consolidated Income Statement13Row ltlt Gross profit gtgt (ltlt 2017 gtgt q_act_jan)13User Value 1024763993 Tsd1313----------------------------------------------------------------------------------------1313Referenced Value (value_1_PQPRIORJAN02)1313Document Q3_2017_Quarter_Report13Chapter Consolidated Income Statement13Row ltlt Gross profit gtgt (ltlt 2017 gtgt q_prior_jan)13User Value 1091695000 Tsd | 2016 HYQ3 | 7363 | 3554 | ||||||||||||||||
| Q3 alone | 352 | 355 | r5 PAC Hamon Pierrick Referenced Value (value_1_PQACTJAN02)1313Document Q3_2017_Quarter_Report13Chapter Consolidated Income Statement13Row ltlt Gross profit gtgt (ltlt 2017 gtgt q_act)13User Value 351645826 Tsd1313----------------------------------------------------------------------------------------1313Referenced Value (value_1_PQPRIORJAN02)1313Document Q3_2017_Quarter_Report13Chapter Consolidated Income Statement13Row ltlt Gross profit gtgt (ltlt 2017 gtgt q_prior)13User Value 355406000 Tsd | 2017 HYQ3 | 6731 | 3517 | -61 | |||||||||||||||
| HY alone | 673 | 736 | s6 | |||||||||||||||||||
| EBIT | EBIT | |||||||||||||||||||||
| Q3 | 7205 | 9363 | r8 PAC Hamon Pierrick Referenced Value (value_1_PQACTJAN02)1313Document Q3_2017_Quarter_Report13Chapter Consolidated Income Statement13Row ltlt Operating result (EBIT) gtgt (ltlt 2017 gtgt q_act_jan)13User Value 72054731 Tsd1313----------------------------------------------------------------------------------------1313Referenced Value (value_1_PQPRIORJAN02)1313Document Q3_2017_Quarter_Report13Chapter Products quater and year to date13Row ltlt Operating result (Segment EBIT) adjusted gtgt (ltlt value_4 gtgt q_prior_jan)13User Value 9363 Tsd | 2016 HYQ3 | 608 | 329 | ||||||||||||||||
| Q3 alone | 3009 | 3286 | r10 PAC Hamon Pierrick Referenced Value (value_1_PQACTJAN02)1313Document Q3_2017_Quarter_Report13Chapter Consolidated Income Statement13Row ltlt Operating result (EBIT) gtgt (ltlt 2017 gtgt q_act)13User Value 30093312 Tsd1313----------------------------------------------------------------------------------------1313Referenced Value (value_1_PQPRIORJAN02)1313Document Q3_2017_Quarter_Report13Chapter Consolidated Income Statement131332856500 Tsd - ltlt Operating result (EBIT) gtgt (ltlt 2017 gtgt q_prior)130000000 Tsd - ltlt Restructuring expenses gtgt (ltlt 2017 gtgt q_prior)13---------------------1332856500 Tsd (Total) | 2017 HYQ3 | 420 | 301 | -230 | |||||||||||||||
| HY alone | 4196 | 6077 | s11 | |||||||||||||||||||
| Profit | Profit | |||||||||||||||||||||
| Q3 | 4839 | 7256 | r12 PAC Hamon Pierrick Referenced Value (value_1_PQACTJAN02)1313Document Q3_2017_Quarter_Report13Chapter Consolidated Income Statement13Row ltlt Profit gtgt (ltlt 2017 gtgt q_act_jan)13User Value 48390567 Tsd1313----------------------------------------------------------------------------------------1313Referenced Value (value_1_PQPRIORJAN02)1313Document Q3_2017_Quarter_Report13Chapter Products quater and year to date13134646 Tsd - ltlt Profit gtgt (ltlt value_4 gtgt q_prior_jan)132610 Tsd - ltlt Restructuring expenses gtgt (ltlt value_4 gtgt q_prior_jan)13---------------------137256 Tsd (Total) | 2016 HYQ3 | 479 | 246 | ||||||||||||||||
| Q3 alone | 1846 | 2462 | r15 PAC Hamon Pierrick Referenced Value (value_1_PQACTJAN02)1313Document Q3_2017_Quarter_Report13Chapter Consolidated Income Statement13Row ltlt Profit gtgt (ltlt 2017 gtgt q_act)13User Value 18461169 Tsd1313----------------------------------------------------------------------------------------1313Referenced Value (value_1_PQPRIORJAN02)1313Document Q3_2017_Quarter_Report13Chapter Consolidated Income Statement131324623919 Tsd - ltlt Profit gtgt (ltlt 2017 gtgt q_prior)130000000 Tsd - ltlt Restructuring expenses gtgt (ltlt 2017 gtgt q_prior)13---------------------1324623919 Tsd (Total) | PAC Hamon Pierrick Referenced Value (value_1_PQACTJAN02)1313Document Q3_2017_Quarter_Report13Chapter Consolidated Income Statement13Row ltlt Gross profit gtgt (ltlt 2017 gtgt q_act_jan)13User Value 1024763993 Tsd1313----------------------------------------------------------------------------------------1313Referenced Value (value_1_PQPRIORJAN02)1313Document Q3_2017_Quarter_Report13Chapter Consolidated Income Statement13Row ltlt Gross profit gtgt (ltlt 2017 gtgt q_prior_jan)13User Value 1091695000 Tsd | PAC Hamon Pierrick Referenced Value (value_1_PQACTJAN02)1313Document Q3_2017_Quarter_Report13Chapter Consolidated Income Statement13Row ltlt Gross profit gtgt (ltlt 2017 gtgt q_act)13User Value 351645826 Tsd1313----------------------------------------------------------------------------------------1313Referenced Value (value_1_PQPRIORJAN02)1313Document Q3_2017_Quarter_Report13Chapter Consolidated Income Statement13Row ltlt Gross profit gtgt (ltlt 2017 gtgt q_prior)13User Value 355406000 Tsd | PAC Hamon Pierrick Referenced Value (value_1_PQACTJAN02)1313Document Q3_2017_Quarter_Report13Chapter Consolidated Income Statement13Row ltlt Operating result (EBIT) gtgt (ltlt 2017 gtgt q_act_jan)13User Value 72054731 Tsd1313----------------------------------------------------------------------------------------1313Referenced Value (value_1_PQPRIORJAN02)1313Document Q3_2017_Quarter_Report13Chapter Products quater and year to date13Row ltlt Operating result (Segment EBIT) adjusted gtgt (ltlt value_4 gtgt q_prior_jan)13User Value 9363 Tsd | PAC Hamon Pierrick Referenced Value (value_1_PQACTJAN02)1313Document Q3_2017_Quarter_Report13Chapter Consolidated Income Statement13Row ltlt Operating result (EBIT) gtgt (ltlt 2017 gtgt q_act)13User Value 30093312 Tsd1313----------------------------------------------------------------------------------------1313Referenced Value (value_1_PQPRIORJAN02)1313Document Q3_2017_Quarter_Report13Chapter Consolidated Income Statement131332856500 Tsd - ltlt Operating result (EBIT) gtgt (ltlt 2017 gtgt q_prior)130000000 Tsd - ltlt Restructuring expenses gtgt (ltlt 2017 gtgt q_prior)13---------------------1332856500 Tsd (Total) | 2017 HYQ3 | 299 | 185 | ||||||||||||
| HY alone | 2993 | 4794 | s16 | -333 |
| 2016 | 2017 | |||||||||||||||
| YoY Growth | Q1 | Q2 | Q3 | Q4 | Q1 | |||||||||||
| Volume (market) | -4 | -2 | 2 | 8 | 6 | |||||||||||
| Volume (Panalpina) | 5 | 11 | 10 | 14 | 8 | |||||||||||
| GPton | -5 | -4 | -7 | -14 | -10 | |||||||||||
| GPton | 0 | 7 | 2 | -2 | -3 | |||||||||||
| 2016 | 2017 | |||||||||||||||
| Gross Profit EBIT | Q1 | Q1 | ||||||||||||||
| Gross Profit | 1486 | 1447 | ||||||||||||||
| EBIT | 178 | 171 | ||||||||||||||
| EBITGP () | 120 | 118 |
| Q3 | 2017 | 2016 | ||||||||||||||||||||
| Data for Charts | ||||||||||||||||||||||
| Gross profit | Gross profit | |||||||||||||||||||||
| Q3 | 102476 | 10917 | r4 PAC Hamon Pierrick Referenced Value (value_1_PQACTJAN02)1313Document Q3_2017_Quarter_Report13Chapter Consolidated Income Statement13Row ltlt Gross profit gtgt (ltlt 2017 gtgt q_act_jan)13User Value 1024763993 Tsd1313----------------------------------------------------------------------------------------1313Referenced Value (value_1_PQPRIORJAN02)1313Document Q3_2017_Quarter_Report13Chapter Consolidated Income Statement13Row ltlt Gross profit gtgt (ltlt 2017 gtgt q_prior_jan)13User Value 1091695000 Tsd | 2016 HYQ3 | 7363 | 3554 | ||||||||||||||||
| Q3 alone | 352 | 355 | r5 PAC Hamon Pierrick Referenced Value (value_1_PQACTJAN02)1313Document Q3_2017_Quarter_Report13Chapter Consolidated Income Statement13Row ltlt Gross profit gtgt (ltlt 2017 gtgt q_act)13User Value 351645826 Tsd1313----------------------------------------------------------------------------------------1313Referenced Value (value_1_PQPRIORJAN02)1313Document Q3_2017_Quarter_Report13Chapter Consolidated Income Statement13Row ltlt Gross profit gtgt (ltlt 2017 gtgt q_prior)13User Value 355406000 Tsd | 2017 HYQ3 | 6731 | 3517 | -61 | |||||||||||||||
| HY alone | 673 | 736 | s6 | |||||||||||||||||||
| EBIT | EBIT | |||||||||||||||||||||
| Q3 | 7205 | 9363 | r8 PAC Hamon Pierrick Referenced Value (value_1_PQACTJAN02)1313Document Q3_2017_Quarter_Report13Chapter Consolidated Income Statement13Row ltlt Operating result (EBIT) gtgt (ltlt 2017 gtgt q_act_jan)13User Value 72054731 Tsd1313----------------------------------------------------------------------------------------1313Referenced Value (value_1_PQPRIORJAN02)1313Document Q3_2017_Quarter_Report13Chapter Products quater and year to date13Row ltlt Operating result (Segment EBIT) adjusted gtgt (ltlt value_4 gtgt q_prior_jan)13User Value 9363 Tsd | 2016 HYQ3 | 608 | 329 | ||||||||||||||||
| Q3 alone | 3009 | 3286 | r10 PAC Hamon Pierrick Referenced Value (value_1_PQACTJAN02)1313Document Q3_2017_Quarter_Report13Chapter Consolidated Income Statement13Row ltlt Operating result (EBIT) gtgt (ltlt 2017 gtgt q_act)13User Value 30093312 Tsd1313----------------------------------------------------------------------------------------1313Referenced Value (value_1_PQPRIORJAN02)1313Document Q3_2017_Quarter_Report13Chapter Consolidated Income Statement131332856500 Tsd - ltlt Operating result (EBIT) gtgt (ltlt 2017 gtgt q_prior)130000000 Tsd - ltlt Restructuring expenses gtgt (ltlt 2017 gtgt q_prior)13---------------------1332856500 Tsd (Total) | 2017 HYQ3 | 420 | 301 | -230 | |||||||||||||||
| HY alone | 4196 | 6077 | s11 | |||||||||||||||||||
| Profit | Profit | |||||||||||||||||||||
| Q3 | 4839 | 7256 | r12 PAC Hamon Pierrick Referenced Value (value_1_PQACTJAN02)1313Document Q3_2017_Quarter_Report13Chapter Consolidated Income Statement13Row ltlt Profit gtgt (ltlt 2017 gtgt q_act_jan)13User Value 48390567 Tsd1313----------------------------------------------------------------------------------------1313Referenced Value (value_1_PQPRIORJAN02)1313Document Q3_2017_Quarter_Report13Chapter Products quater and year to date13134646 Tsd - ltlt Profit gtgt (ltlt value_4 gtgt q_prior_jan)132610 Tsd - ltlt Restructuring expenses gtgt (ltlt value_4 gtgt q_prior_jan)13---------------------137256 Tsd (Total) | 2016 HYQ3 | 479 | 246 | ||||||||||||||||
| Q3 alone | 1846 | 2462 | r15 PAC Hamon Pierrick Referenced Value (value_1_PQACTJAN02)1313Document Q3_2017_Quarter_Report13Chapter Consolidated Income Statement13Row ltlt Profit gtgt (ltlt 2017 gtgt q_act)13User Value 18461169 Tsd1313----------------------------------------------------------------------------------------1313Referenced Value (value_1_PQPRIORJAN02)1313Document Q3_2017_Quarter_Report13Chapter Consolidated Income Statement131324623919 Tsd - ltlt Profit gtgt (ltlt 2017 gtgt q_prior)130000000 Tsd - ltlt Restructuring expenses gtgt (ltlt 2017 gtgt q_prior)13---------------------1324623919 Tsd (Total) | PAC Hamon Pierrick Referenced Value (value_1_PQACTJAN02)1313Document Q3_2017_Quarter_Report13Chapter Consolidated Income Statement13Row ltlt Gross profit gtgt (ltlt 2017 gtgt q_act_jan)13User Value 1024763993 Tsd1313----------------------------------------------------------------------------------------1313Referenced Value (value_1_PQPRIORJAN02)1313Document Q3_2017_Quarter_Report13Chapter Consolidated Income Statement13Row ltlt Gross profit gtgt (ltlt 2017 gtgt q_prior_jan)13User Value 1091695000 Tsd | PAC Hamon Pierrick Referenced Value (value_1_PQACTJAN02)1313Document Q3_2017_Quarter_Report13Chapter Consolidated Income Statement13Row ltlt Gross profit gtgt (ltlt 2017 gtgt q_act)13User Value 351645826 Tsd1313----------------------------------------------------------------------------------------1313Referenced Value (value_1_PQPRIORJAN02)1313Document Q3_2017_Quarter_Report13Chapter Consolidated Income Statement13Row ltlt Gross profit gtgt (ltlt 2017 gtgt q_prior)13User Value 355406000 Tsd | PAC Hamon Pierrick Referenced Value (value_1_PQACTJAN02)1313Document Q3_2017_Quarter_Report13Chapter Consolidated Income Statement13Row ltlt Operating result (EBIT) gtgt (ltlt 2017 gtgt q_act_jan)13User Value 72054731 Tsd1313----------------------------------------------------------------------------------------1313Referenced Value (value_1_PQPRIORJAN02)1313Document Q3_2017_Quarter_Report13Chapter Products quater and year to date13Row ltlt Operating result (Segment EBIT) adjusted gtgt (ltlt value_4 gtgt q_prior_jan)13User Value 9363 Tsd | PAC Hamon Pierrick Referenced Value (value_1_PQACTJAN02)1313Document Q3_2017_Quarter_Report13Chapter Consolidated Income Statement13Row ltlt Operating result (EBIT) gtgt (ltlt 2017 gtgt q_act)13User Value 30093312 Tsd1313----------------------------------------------------------------------------------------1313Referenced Value (value_1_PQPRIORJAN02)1313Document Q3_2017_Quarter_Report13Chapter Consolidated Income Statement131332856500 Tsd - ltlt Operating result (EBIT) gtgt (ltlt 2017 gtgt q_prior)130000000 Tsd - ltlt Restructuring expenses gtgt (ltlt 2017 gtgt q_prior)13---------------------1332856500 Tsd (Total) | 2017 HYQ3 | 299 | 185 | ||||||||||||
| HY alone | 2993 | 4794 | s16 | -333 |

5Q3 RESULTS 2017 | 19 OCTOBER 2017 |
OPERATING AND FINANCIAL REVIEW
6Q3 RESULTS 2017 | 19 OCTOBER 2017 |
AIR FREIGHT STRONG AND PROFITABLE GROWTH
YTD 8 volume growth Improved unit profitability Conversion rate at previous-year
level
Note Gross profit and EBIT in CHF million
YoY Growth Q3 Q4 Q1 Q2 Q3Volume (market estimated) 2 8 6 10 10
Volume (Panalpina) 10 14 8 7 8
GPton -7 -14 -10 -10 -1
Gross Profit 2 -2 -3 -4 8
2017
2016 2017Gross Profit EBIT YTD YTDGross Profit 4534 4560 1
EBIT (adjusted PY) 726 694 -4
EBITGP () 160 152
Volumes (tons 000) 6690 7220 8
228252
233 240 249
653
562620 625 648
Q3 2016 Q4 2016 Q1 2017 Q2 2017 Q3 2017
TONNAGE GPTON
Tons (000) GPTon (in CHF)
269
208171
220
303
181
147118
147
188
Q3 2016 Q4 2016 Q1 2017 Q2 2017 Q3 2017
EBIT AND EBITGP MARGIN
EBIT (adjusted PY) EBITGP margin () (adjusted PY)
SNVeryHiddenParameterSheet
Table
Charts
TONNAGE GPTON
Tons (000)
Q3 2016Q4 2016Q1 2017Q2 2017Q3 20172282522332399248935GPTon (in CHF)
6535626206251430000000000364832899999999995
EBIT AND EBITGP MARGIN
EBIT (adjusted PY)
Q3 2016Q4 2016Q1 2017Q2 2017Q3 20172692081710000000000000121963330331299999999999EBITGP margin () (adjusted PY)
181000000000000011471181464999999999999918790000000000003
SNVeryHiddenParameterSheet
Table
Charts
TONNAGE GPTON
Tons (000)
Q3 2016Q4 2016Q1 2017Q2 2017Q3 20172282522332399248935GPTon (in CHF)
6535626206251430000000000364832899999999995
EBIT AND EBITGP MARGIN
EBIT (adjusted PY)
Q3 2016Q4 2016Q1 2017Q2 2017Q3 20172692081710000000000000121963330331299999999999EBITGP margin () (adjusted PY)
181000000000000011471181464999999999999918790000000000003
Chart1
TONNAGE GPTON
Tons (000)
Q3 2016Q4 2016Q1 2017Q2 2017Q3 20172282522332399248935GPTon (in CHF)
6535626206251430000000000364832899999999995
SNVeryHiddenParameterSheet
Table
Charts
TONNAGE GPTON
Tons (000)
Q3 2016Q4 2016Q1 2017Q2 2017Q3 20172282522332399248935GPTon (in CHF)
6535626206251430000000000364832899999999995
EBIT AND EBITGP MARGIN
EBIT (adjusted PY)
Q3 2016Q4 2016Q1 2017Q2 2017Q3 20172692081710000000000000121963330331299999999999EBITGP margin () (adjusted PY)
181000000000000011471181464999999999999918790000000000003
Chart2
EBIT AND EBITGP MARGIN
EBIT (adjusted PY)
Q3 2016Q4 2016Q1 2017Q2 2017Q3 20172692081710000000000000121963330331299999999999EBITGP margin () (adjusted PY)
181000000000000011471181464999999999999918790000000000003
SNVeryHiddenParameterSheet
Table
Charts
TONNAGE GPTON
Tons (000)
Q3 2016Q4 2016Q1 2017Q2 2017Q3 20172282522332399248935GPTon (in CHF)
6535626206251430000000000364832899999999995
EBIT AND EBITGP MARGIN
EBIT (adjusted PY)
Q3 2016Q4 2016Q1 2017Q2 2017Q3 20172692081710000000000000121963330331299999999999EBITGP margin () (adjusted PY)
181000000000000011471181464999999999999918790000000000003
7Q3 RESULTS 2017 | 19 OCTOBER 2017 |
OCEAN FREIGHT QUARTERLY LOSS DUE TO MARGIN STAGNATION
YTD 4 volume growth Higher volumes however at lower
margin and with increased costs resulted in loss for Q3
Note Gross profit and EBIT in CHF million
YoY Growth Q3 Q4 Q1 Q2 Q3Volume (market estimated) 0 3 4 3 3
Volume (Panalpina) -9 1 7 3 2
GPTEU -2 -18 -17 -7 -5
Gross Profit -10 -16 -11 -5 -3
2017
2016 2017Gross Profit EBIT YTD YTDGross Profit 3450 3234 -6
EBIT (adjusted PY) 160 -55 -135
EBITGP () 46 -17
Volumes (TEUs 000) 10995 11426 4
379 389 374 383 386
296
254
282 285 282
Q3 2016 Q4 2016 Q1 2017 Q2 2017 Q3 2017
TEU GPTEU
TEU (in 000) GPTEU (in CHF)
51
-51 -32
06
-29
45
-51 -30
06
-27
Q3 2016 Q4 2016 Q1 2017 Q2 2017 Q3 2017
EBIT AND EBITGP MARGIN
EBIT (adjusted PY) EBITGP margin () (adjusted PY)
SNVeryHiddenParameterSheet
Sheet1
charts
TEU GPTEU
TEU (in 000)
Q3 2016Q4 2016Q1 2017Q2 2017Q3 2017379389374382838560500000000002GPTEU (in CHF)
Q3 2016Q4 2016Q1 2017Q2 2017Q3 20172962542822849460000000000328207499999999999
EBIT AND EBITGP MARGIN
EBIT (adjusted PY)
Q3 2016Q4 2016Q1 2017Q2 2017Q3 201750999999999999996-50999999999999996-3205806-29489999999999998EBITGP margin () (adjusted PY)
Q3 2016Q4 2016Q1 2017Q2 2017Q3 201745-50999999999999996-305806-271
SNVeryHiddenParameterSheet
Sheet1
charts
TEU GPTEU
TEU (in 000)
Q3 2016Q4 2016Q1 2017Q2 2017Q3 2017379389374382838560500000000002GPTEU (in CHF)
Q3 2016Q4 2016Q1 2017Q2 2017Q3 20172962542822849460000000000328207499999999999
EBIT AND EBITGP MARGIN
EBIT (adjusted PY)
Q3 2016Q4 2016Q1 2017Q2 2017Q3 201750999999999999996-50999999999999996-3205806-29489999999999998EBITGP margin () (adjusted PY)
Q3 2016Q4 2016Q1 2017Q2 2017Q3 201745-50999999999999996-305806-271
Chart1
TEU GPTEU
TEU (in 000)
Q3 2016Q4 2016Q1 2017Q2 2017Q3 2017379389374382838560500000000002GPTEU (in CHF)
Q3 2016Q4 2016Q1 2017Q2 2017Q3 20172962542822849460000000000328207499999999999
SNVeryHiddenParameterSheet
Sheet1
charts
TEU GPTEU
TEU (in 000)
Q3 2016Q4 2016Q1 2017Q2 2017Q3 2017379389374382838560500000000002GPTEU (in CHF)
Q3 2016Q4 2016Q1 2017Q2 2017Q3 20172962542822849460000000000328207499999999999
EBIT AND EBITGP MARGIN
EBIT (adjusted PY)
Q3 2016Q4 2016Q1 2017Q2 2017Q3 201750999999999999996-50999999999999996-3205806-29489999999999998EBITGP margin () (adjusted PY)
Q3 2016Q4 2016Q1 2017Q2 2017Q3 201745-50999999999999996-305806-271
Chart2
EBIT AND EBITGP MARGIN
EBIT (adjusted PY)
Q3 2016Q4 2016Q1 2017Q2 2017Q3 201750999999999999996-50999999999999996-3205806-29489999999999998EBITGP margin () (adjusted PY)
Q3 2016Q4 2016Q1 2017Q2 2017Q3 201745-50999999999999996-305806-271
SNVeryHiddenParameterSheet
Sheet1
charts
TEU GPTEU
TEU (in 000)
Q3 2016Q4 2016Q1 2017Q2 2017Q3 2017379389374382838560500000000002GPTEU (in CHF)
Q3 2016Q4 2016Q1 2017Q2 2017Q3 20172962542822849460000000000328207499999999999
EBIT AND EBITGP MARGIN
EBIT (adjusted PY)
Q3 2016Q4 2016Q1 2017Q2 2017Q3 201750999999999999996-50999999999999996-3205806-29489999999999998EBITGP margin () (adjusted PY)
Q3 2016Q4 2016Q1 2017Q2 2017Q3 201745-50999999999999996-305806-271
8Q3 RESULTS 2017 | 19 OCTOBER 2017 |
LOGISTICS IMPROVED PROFITABILITY
Top-line has stabilized Focus on growth
EBIT-over-NFR-margin of 20
Note Gross profit and EBIT in CHF million
2016 2017
Gross Profit EBIT YTD YTD
Gross Profit 2933 2454 -16
EBIT (adjusted PY) 50 81 63
NFR in of EBIT 10 20
YoY Growth Q3 Q4 Q1 Q2 Q3
Gross Profit -6 -11 -16 -19 -14
2017
94 9283 81 81
Q3 2016 Q4 2016 Q1 2017 Q2 2017 Q3 2017
GROSS PROFIT
0905
24
3127
Q3 2016 Q4 2016 Q1 2017 Q2 2017 Q3 2017
EBIT (ADJUSTED PY)
SNVeryHiddenParameterSheet
Table
charts
GROSS PROFIT
Q3 2016Q4 2016Q1 2017Q2 2017Q3 201794928381348148
EBIT (ADJUSTED PY)
Q3 2016Q4 2016Q1 2017Q2 2017Q3 2017090524306271
SNVeryHiddenParameterSheet
Table
charts
GROSS PROFIT
Q3 2016Q4 2016Q1 2017Q2 2017Q3 201794928381348148
EBIT (ADJUSTED PY)
Q3 2016Q4 2016Q1 2017Q2 2017Q3 2017090524306271
Chart1
GROSS PROFIT
Q3 2016Q4 2016Q1 2017Q2 2017Q3 201794928381348148
SNVeryHiddenParameterSheet
Table
charts
GROSS PROFIT
Q3 2016Q4 2016Q1 2017Q2 2017Q3 201794928381348148
EBIT (ADJUSTED PY)
Q3 2016Q4 2016Q1 2017Q2 2017Q3 2017090524306271
Chart2
EBIT (ADJUSTED PY)
Q3 2016Q4 2016Q1 2017Q2 2017Q3 2017090524306271
SNVeryHiddenParameterSheet
Table
charts
GROSS PROFIT
Q3 2016Q4 2016Q1 2017Q2 2017Q3 201794928381348148
EBIT (ADJUSTED PY)
Q3 2016Q4 2016Q1 2017Q2 2017Q3 2017090524306271
9Q3 RESULTS 2017 | 19 OCTOBER 2017 |
OUTLOOK AND PRIORITIES 2017
10Q3 RESULTS 2017 | 19 OCTOBER 2017 |
OUTLOOK AND PRIORITIES 2017
OUTLOOK Market
minus Air continuous strong volumes expected but growth rate slowing down (tough Q4 2016 comparison)
minus Ocean Soft market conditions Q4
Panalpina
minus Air margin impact of peak season difficult to anticipate
minus Ocean spot market rates have decreased lately and a slight margin improvement could be expected
PRIORITIES
Focus on topline growth and further improvement of unit profitability
Improve EBIT in Ocean Freight
Accelerate growth through selected bolt-on acquisitions
Maintain cost discipline and push ahead operations transformation program
11Q3 RESULTS 2017 | 19 OCTOBER 2017 |
YEAR-END RESULTS
MARCH 7 2018
NEXT EVENTS
12Q3 RESULTS 2017 | 19 OCTOBER 2017 |
DISCLAIMER
Investing in the shares of Panalpina World Transport (Holding) Ltd involves risks Prospective investors are strongly requested to consult their investment advisors and tax advisors prior to investing in shares of Panalpina World Transport (Holding) Ltd
This document contains forward-looking statements which involve risks and uncertainties These statements may be identified by such words as ldquomayrdquo ldquoplansrdquo ldquoexpectsrdquo ldquobelievesrdquo and similar expressions or by their context These statements are made on the basis of current knowledge and assumptions Various factors could cause actual future results performance or events to differ materially from those described in these statements No obligation is assumed to update any forward-looking statements Potential risks and uncertainties include such factors as general economic conditions foreign exchange fluctuations competitive product and pricing pressures and regulatory developments
The information contained in this document has not been independently verified and no representation or warranty express or implied is made to and no reliance should be placed on the fairness accuracy completeness or correctness of the information or opinions contained herein The information in this presentation is subject to change without notice it may be incomplete or condensed and it may not contain all material information concerning the Panalpina Group None of Panalpina World Transport (Holding) Ltd or their respective affiliates shall have any liability whatsoever for any loss whatsoever arising from any use of this document or its content or otherwise arising in connection with this document
This document does not constitute or form part of an offer to sell or a solicitation of an offer to purchase any shares and neither it nor any part of it shall form the basis of or be relied upon in connection with any contract or commitment whatsoever This information does neither constitute an offer to buy shares of Panalpina World Transport (Holding) Ltd nor a prospectus within the meaning of the applicable Swiss law
13Q3 RESULTS 2017 | 19 OCTOBER 2017 |
APPENDIX
14Q3 RESULTS 2017 | 19 OCTOBER 2017 |
INCOME STATEMENT PER QUARTER ndash GROUP
Note Group figures in CHF million
Group Q1 2016 Q2 2016 Q3 2016 Q3YTD Q4 2016 FY 2016 Q1 2017 Q2 2017 Q3 2017 Q3YTD 2017Net forwarding revenue 13072 12894 12670 38635 13325 51960 12772 13549 14334 40655 Forwarding expenses (9423) (9180) (9116) (27718) (9996) (37714) (9445) (10145) (10818) (30407)Gross profit 3649 3714 3554 10917 3329 14246 3327 3404 3516 10248 Personnel expenses (2250) (2213) (2129) (6592) (2113) (8705) (2164) (2162) (2186) (6511)Other operating expenses (1037) (1011) (971) (3018) (927) (3945) (893) (880) (925) (2698)EBITDA adjusted 362 491 454 1307 289 1596 271 362 406 1039 Depreciation of property plant and equip (62) (62) (62) (187) (71) (258) (53) (54) (50) (156)Amortization of intangible assets (60) (60) (63) (183) (56) (239) (54) (52) (55) (162)EBIT adjusted 240 368 329 936 163 1099 164 256 301 721 in of gross profit 66 99 92 86 49 77 49 75 86 70Non-recurring itemsRestructuring expenses 00 (261) 00 (261) (19) (280) 00 00 00 00
EBIT reported 240 107 329 675 144 820 164 256 301 721 in of gross profit 66 29 92 62 43 58 49 75 86 70Financial result (09) 07 (04) (06) 02 (04) 02 01 (04) (02)Earnings before taxes (EBT) 231 114 325 670 146 816 165 257 297 719 Income tax expenses (58) (69) (79) (205) (88) (293) (42) (81) (112) (235) of EBT 250 602 242 306 601 359 252 316 378 327Profit 173 45 246 465 58 523 124 176 185 484 Earnings per share 075 021 106 201 027 229 054 075 079 208
SNVeryHiddenParameterSheet
PAN_ISpQ_Group
image1png
15Q3 RESULTS 2017 | 19 OCTOBER 2017 |
INCOME STATEMENT PER QUARTER ndash AIR FREIGHT
Note Air Freight figures in CHF million
Air Freight Q1 2016 Q2 2016 Q3 2016 Q3YTD 2016 Q4 2016 FY 2016 Q1 2017 Q2 2017 Q3 2017 Q3 YTD 2017Net forwarding revenue 6332 6359 6341 19032 7234 26267 6571 7000 7389 20960 Forwarding expenses (4846) (4800) (4853) (14499) (5816) (20315) (5125) (5500) (5775) (16400)Gross profit 1486 1559 1489 4534 1418 5952 1447 1500 1614 4560 Personnel expenses (885) (869) (847) (2600) (873) (3473) (905) (916) (928) (2750)Other operating expenses (371) (359) (318) (1048) (284) (1333) (324) (317) (337) (978)EBITDA adjusted 230 331 324 885 261 1146 218 266 349 833 Depreciation and amortization (52) (52) (55) (158) (53) (211) (46) (47) (46) (139)EBIT adjusted 178 279 269 726 208 935 171 220 303 694 in of gross profit 120 179 181 160 147 157 118 146 188 152Non-recurring itemsRestructuring expenses 00 (127) 00 (127) 00 (127) 00 00 00 00
EBIT reported 178 153 269 600 208 808 171 220 303 694 in of gross profit 120 98 181 132 147 136 118 146 188 152
Air Freight volumes (000 tons) 2161 2251 2278 6690 2524 9214 2332 2399 2489 7220 change YoY 54 111 99 88 141 102 79 66 93 79GPton (CHF) 688 693 653 678 562 646 620 625 648 632 change YoY -47 -36 -73 -52 -140 -75 -98 -97 -08 -68
SNVeryHiddenParameterSheet
PAN_ISpQ_AirFreight
image1png
16Q3 RESULTS 2017 | 19 OCTOBER 2017 |
INCOME STATEMENT PER QUARTER ndash OCEAN FREIGHT
Note Ocean Freight figures in CHF million
Ocean Freight Q1 2016 Q2 2016 Q3 2016 Q3YTD 2016 Q4 2016 FY 2016 Q1 2017 Q2 2017 Q3 2017 Q3YTD 2017Net forwarding revenue 5338 4921 4955 15214 4770 19984 4915 5172 5551 15637 Forwarding expenses (4157) (3773) (3834) (11764) (3783) (15547) (3860) (4081) (4463) (12404)Gross profit 1181 1148 1121 3450 987 4438 1055 1091 1088 3234 Personnel expenses (791) (752) (755) (2298) (721) (3019) (779) (784) (788) (2352)Other operating expenses (305) (288) (274) (868) (275) (1144) (271) (265) (290) (827)EBITDA adjusted 84 108 92 284 (09) 275 05 41 09 55 Depreciation and amortization (41) (42) (41) (124) (42) (166) (36) (36) (38) (110)EBIT adjusted 43 66 51 160 (51) 109 (32) 06 (29) (55)in of gross profit 37 58 45 46 -51 25 -30 05 -27 -17Non-recurring itemsRestructuring expenses 00 (97) 0 (97) (19) (115) 00 00 00 00
EBIT reported 43 (30) 51 63 (69) (06) (32) 06 (29) (55)in of gross profit 37 -26 45 18 -70 -01 -30 05 -27 -17
Ocean Freight volumes (000 tons) 3482 3726 3787 10995 3890 14885 3742 3828 3856 11426 change YoY -100 -82 -88 -90 08 -66 75 27 18 39GPTEU (CHF) 339 308 296 314 254 298 282 285 282 283 change YoY 102 59 -16 47 -176 -11 -169 -75 -47 -98
SNVeryHiddenParameterSheet
PAN_ISpQ_OceanFreight
image1png
17Q3 RESULTS 2017 | 19 OCTOBER 2017 |
INCOME STATEMENT PER QUARTER ndash LOGISTICS
Note Logistics figures in CHF million
Logistics Q1 2016 Q2 2016 Q3 2016 Q3YTD 2016 Q4 2016 FY 2016 Q1 2017 Q2 2017 Q3 2017 Q3YTD 2017Net forwarding revenue 1402 1613 1374 4389 1321 5709 1286 1377 1394 4057 Forwarding expenses (420) (607) (429) (1456) (397) (1853) (460) (564) (580) (1604)Gross profit 982 1006 944 2933 924 3857 825 813 815 2454 Personnel expenses (574) (591) (528) (1694) (519) (2213) (479) (461) (469) (1409)Other operating expenses (360) (363) (378) (1102) (367) (1469) (298) (298) (298) (894)EBITDA adjusted 48 52 38 138 37 175 48 54 48 151 Depreciation and amortization (29) (29) (29) (88) (32) (119) (25) (24) (21) (69)EBIT adjusted 18 23 09 50 05 56 24 31 27 81 Non-recurring itemsRestructuring expenses 00 (38) 00 (38) 00 (38) 00 00 00 00
EBIT reported 18 (15) 09 12 05 18 24 31 27 81
SNVeryHiddenParameterSheet
PAN_ISpQ_Logistics
image1png
18Q3 RESULTS 2017 | 19 OCTOBER 2017 |
BALANCE SHEET
CHF Cash and cash equivalents 3888 2946 (942) -24Trade receivables unbilled forwarding services 9087 9893 806 9Other current assets 1025 1167 142 14Property plant and equipment 635 803 168 26Intangible assets 979 917 (62) -6Other non-current assets 990 1133 143 14Total assets 16606 16859 253 2
Short-term borrowings 23 21 (02) -10Trade payables accured cost of services 6524 7075 551 8Other current liabilities 2439 2254 (185) -8Long-Term borrowings 00 20 20 naOther long-term liabilities 1449 1527 78 5Total liabilities 10436 10896 460 4Share capital 24 24 (00) -1Reserves treasury shares 6057 5884 (173) -3Non-controlling interests 89 55 (34) -38Total equity 6170 5963 (207) -3Total equity and liabilities 16606 16859 253 2
31-Dec-16 30-Sept-17Change in
SNVeryHiddenParameterSheet
PAN_BalanceSheet
image1png
19Q3 RESULTS 2017 | 19 OCTOBER 2017 |
CASH FLOW
Note Figures in CHF million
30-Sep-16 30-Sep-17Change in
Cash flow before changes in working capital 1029 1075 Changes in working capital 357 (477)Cash from operations 1386 599
Interest and income taxes paid (292) (331)Net cash from operating activities 1094 267 -76
Net cash from investing activities (342) (409) 20
Free cash flow 752 (141) -119
Net cash used in financing activities (858) (894) 4
Net increase (decrease) in cash and cash equivalents (106) (1035)Cash and cash equivalents at beginning of period 3923 3888 Effect of exchange rate changes (17) 93 Cash and cash equivalents at end of period 3799 2946
SNVeryHiddenParameterSheet
Tabele PAN_Cashflow
Reported cash and cash equivalents at 31122016Profit YTD 092017Other non-cash items (eg DampA)Changes in working capitalInterest and income taxes paidNet cash from investing activitiesFinancing activitiesdividendEffect of exchange rate changesReported cash and cash equivalents at 300920173887843716999999999996448614155374652852799999999999728527999999999997Reported cash and cash equivalents at 31122016Profit YTD 092017Other non-cash items (eg DampA)Changes in working capitalInterest and income taxes paidNet cash from investing activitiesFinancing activitiesdividendEffect of exchange rate changesReported cash and cash equivalents at 30092017388784839591476633114085893793329463
- Nine months results 2017
- Slide Number 2
- ACHIEVEMENTS and key figures
- Third consecutive quarter with GP and EBIT Growth
- Operating and financial review
- Air Freight Strong and profitable growth
- Ocean Freight quarterly loss due to margin Stagnation
- Logistics improved profitability
- Outlook and priorities 2017
- outlook and priorities 2017
- Next EVENTs
- Disclaimer
- Appendix
- Income statement per quarter ndash Group
- Income statement per quarter ndash Air Freight
- Income statement per quarter ndash Ocean Freight
- Income statement per quarter ndash Logistics
- Balance sheet
- Cash flow
-
| 30-Sep-16 | 30-Sep-17 | Change in | ||||||||||||||||||||||||||||||||||||||||||||||||||||||
| Cash flow before changes in working capital | 1029 | 1075 | r2 PAC Hamon Pierrick Referenced Value (value_1_PQACTJAN02)1313Document Q3_2017_Quarter_Report13Chapter Consolidated Statement of Cash Flows13Row ltlt Subtotal cash flow from operations gtgt (ltlt 2017 gtgt q_act_jan)13User Value 10749 Tsd | PY IS MANUAL | ||||||||||||||||||||||||||||||||||||||||||||||||||||
| Changes in working capital | 357 | (477) | r3 PAC Hamon Pierrick Referenced Value (value_1_PQACTJAN02)1313Document Q3_2017_Quarter_Report13Chapter Consolidated Statement of Cash Flows1313-7973 Tsd - ltlt (Increase) decrease receivables other current assets and unbilled forwarding services gtgt (ltlt 2017 gtgt q_act_jan)134406 Tsd - ltlt Increase (decrease) payables and accruals incl accrued cost of service gtgt (ltlt 2017 gtgt q_act_jan)13-472 Tsd - ltlt Increase (decrease) non-current provisions and other liabilities gtgt (ltlt 2017 gtgt q_act_jan)13-749 Tsd - ltlt Increase (decrease) current provisions and other liabilities gtgt (ltlt 2017 gtgt q_act_jan)13---------------------13-4787 Tsd (Total) | |||||||||||||||||||||||||||||||||||||||||||||||||||||
| Cash from operations | 1386 | 599 | r4 PAC Hamon Pierrick Referenced Value (value_1_PQACTJAN02)1313Document Q3_2017_Quarter_Report13Chapter Consolidated Statement of Cash Flows13Row ltlt Cash generated from operations gtgt (ltlt 2017 gtgt q_act_jan)13User Value 5963 Tsd | |||||||||||||||||||||||||||||||||||||||||||||||||||||
| Interest and income taxes paid | (292) | (331) | r6 PAC Hamon Pierrick Referenced Value (value_1_PQACTJAN02)1313Document Q3_2017_Quarter_Report13Chapter Consolidated Statement of Cash Flows1313-136 Tsd - ltlt Interest paid gtgt (ltlt 2017 gtgt q_act_jan)13-3175 Tsd - ltlt Income taxes paid gtgt (ltlt 2017 gtgt q_act_jan)13---------------------13-3311 Tsd (Total) | |||||||||||||||||||||||||||||||||||||||||||||||||||||
| Net cash from operating activities | 1094 | 267 | -76 | r7 PAC Hamon Pierrick Referenced Value (value_1_PQACTJAN02)1313Document Q3_2017_Quarter_Report13Chapter Consolidated Statement of Cash Flows13Row ltlt Net cash from operating activities gtgt (ltlt 2017 gtgt q_act_jan)13User Value 2652 Tsd | ||||||||||||||||||||||||||||||||||||||||||||||||||||
| Net cash from investing activities | (342) | (409) | 20 | r9 PAC Hamon Pierrick Referenced Value (value_1_PQACTJAN02)1313Document Q3_2017_Quarter_Report13Chapter Consolidated Statement of Cash Flows13Row ltlt Net cash used in investing activities gtgt (ltlt 2017 gtgt q_act_jan)13User Value -4063 Tsd | ||||||||||||||||||||||||||||||||||||||||||||||||||||
| Free cash flow | 752 | (141) | -119 | r11 PAC Hamon Pierrick Referenced Value (value_1_PQACTJAN02)1313Document Q3_2017_Quarter_Report13Chapter Consolidated Statement of Cash Flows13Row ltlt Free cash flow gtgt (ltlt 2017 gtgt q_act_jan)13User Value -1411 Tsd | ||||||||||||||||||||||||||||||||||||||||||||||||||||
| Net cash used in financing activities | (858) | (894) | 4 | r13 PAC Hamon Pierrick Referenced Value (value_1_PQACTJAN02)1313Document Q3_2017_Quarter_Report13Chapter Consolidated Statement of Cash Flows13Row ltlt Net cash used in financing activities gtgt (ltlt 2017 gtgt q_act_jan)13User Value -8937 Tsd | ||||||||||||||||||||||||||||||||||||||||||||||||||||
| Net increase (decrease) in cash and cash equivalents | (106) | (1035) | r15 PAC Hamon Pierrick Referenced Value (value_1_PQACTJAN02)1313Document Q3_2017_Quarter_Report13Chapter Consolidated Statement of Cash Flows13Row ltlt Net increase (decrease) in cash and cash equivalents gtgt (ltlt 2017 gtgt q_act_jan)13User Value -10348 Tsd | |||||||||||||||||||||||||||||||||||||||||||||||||||||
| Cash and cash equivalents at beginning of period | 3923 | 3888 | r16 PAC Hamon Pierrick Referenced Value (value_1_PQACTJAN02)1313Document Q3_2017_Quarter_Report13Chapter Consolidated Statement of Cash Flows13Row ltlt Cash and cash equivalents at the beginning of the period gtgt (ltlt 2017 gtgt q_act_jan)13User Value 38878 Tsd | |||||||||||||||||||||||||||||||||||||||||||||||||||||
| Effect of exchange rate changes | (17) | 93 | r17 PAC Hamon Pierrick Referenced Value (value_1_PQACTJAN02)1313Document Q3_2017_Quarter_Report13Chapter Consolidated Statement of Cash Flows13Row ltlt Effect of exchange rate changes on cash and cash equivalents gtgt (ltlt 2017 gtgt q_act_jan)13User Value 933 Tsd | |||||||||||||||||||||||||||||||||||||||||||||||||||||
| Cash and cash equivalents at end of period | 3799 | 2946 | r18 PAC Hamon Pierrick Referenced Value (value_1_PQACTJAN02)1313Document Q3_2017_Quarter_Report13Chapter Consolidated Statement of Cash Flows13Row ltlt Cash and cash equivalents at the end of the period gtgt (ltlt 2017 gtgt q_act_jan)13User Value 29463 Tsd | |||||||||||||||||||||||||||||||||||||||||||||||||||||
| Reported cash and cash equivalents at 31122016 | 3888 | r21 PAC Hamon Pierrick Referenced Value (value_1_PQACTJAN02)1313Document Q3_2017_Quarter_Report13Chapter Consolidated Statement of Cash Flows13Row ltlt Cash and cash equivalents at the beginning of the period gtgt (ltlt 2017 gtgt q_act_jan)13User Value 38878 Tsd | Reported cash and cash equivalents at 31122016 | 3888 | ||||||||||||||||||||||||||||||||||||||||||||||||||||
| Profit YTD 092017 | 4839 | r19 PAC Hamon Pierrick Referenced Value (value_1_PQACTJAN02)1313Document Q3_2017_Quarter_Report13Chapter Consolidated Statement of Cash Flows13Row ltlt Profit gtgt (ltlt 2017 gtgt q_act_jan)13User Value 4839 Tsd | Profit YTD 092017 | 3888 | 484 | |||||||||||||||||||||||||||||||||||||||||||||||||||
| Other non-cash items (eg DampA) | 591 | r23 PAC Hamon Pierrick Referenced Value (value_1_PQACTJAN02)1313Document Q3_2017_Quarter_Report13Chapter Consolidated Statement of Cash Flows13131565 Tsd - ltlt Depreciation of property plant and equipment gtgt (ltlt 2017 gtgt q_act_jan)131616 Tsd - ltlt Amortization of intangible assets gtgt (ltlt 2017 gtgt q_act_jan)13-165 Tsd - ltlt Interest income and dividend on available-for-sale financial assets gtgt (ltlt 2017 gtgt q_act_jan)13-167 Tsd - ltlt Exchange differences gtgt (ltlt 2017 gtgt q_act_jan)13-025 Tsd - ltlt Loss (gain) on sales of property plant and equipment gtgt (ltlt 2017 gtgt q_act_jan)13000 Tsd - ltlt Loss (gain) on sales of financial assets gtgt (ltlt 2017 gtgt q_act_jan)13497 Tsd - ltlt Expenses for share-based compensation plans gtgt (ltlt 2017 gtgt q_act_jan)13238 Tsd - ltlt Other non-cash (income) and expenses gtgt (ltlt 2017 gtgt q_act_jan)132351 Tsd - ltlt Income tax expenses gtgt (ltlt 2017 gtgt q_act_jan)13---------------------135910 Tsd (Total) | Other non-cash items (eg DampA) | 4372 | 591 | |||||||||||||||||||||||||||||||||||||||||||||||||||
| Changes in working capital | -4766 | r24 PAC Hamon Pierrick Referenced Value (value_1_PQACTJAN02)1313Document Q3_2017_Quarter_Report13Chapter Consolidated Statement of Cash Flows1313-7973 Tsd - ltlt (Increase) decrease receivables other current assets and unbilled forwarding services gtgt (ltlt 2017 gtgt q_act_jan)134406 Tsd - ltlt Increase (decrease) payables and accruals incl accrued cost of service gtgt (ltlt 2017 gtgt q_act_jan)13-472 Tsd - ltlt Increase (decrease) non-current provisions and other liabilities gtgt (ltlt 2017 gtgt q_act_jan)13-749 Tsd - ltlt Increase (decrease) current provisions and other liabilities gtgt (ltlt 2017 gtgt q_act_jan)13---------------------13-4787 Tsd (Total) | Changes in working capital | 4486 | 477 | neg | ||||||||||||||||||||||||||||||||||||||||||||||||||
| Interest and income taxes paid | -3311 | r25 PAC Hamon Pierrick Referenced Value (value_1_PQACTJAN02)1313Document Q3_2017_Quarter_Report13Chapter Consolidated Statement of Cash Flows1313-136 Tsd - ltlt Interest paid gtgt (ltlt 2017 gtgt q_act_jan)13-3175 Tsd - ltlt Income taxes paid gtgt (ltlt 2017 gtgt q_act_jan)13---------------------13-3311 Tsd (Total) | Interest and income taxes paid | 4155 | 331 | neg | ||||||||||||||||||||||||||||||||||||||||||||||||||
| Net cash from investing activities | -4085 | r26 PAC Hamon Pierrick Referenced Value (value_1_PQACTJAN02)1313Document Q3_2017_Quarter_Report13Chapter Consolidated Statement of Cash Flows13Row ltlt Net cash used in investing activities gtgt (ltlt 2017 gtgt q_act_jan)13User Value -4063 Tsd | Net cash from investing activities | 3747 | 409 | neg | ||||||||||||||||||||||||||||||||||||||||||||||||||
| Financing activitiesdividend | -8937 | r27 PAC Hamon Pierrick Referenced Value (value_1_PQACTJAN02)1313Document Q3_2017_Quarter_Report13Chapter Consolidated Statement of Cash Flows13Row ltlt Net cash used in financing activities gtgt (ltlt 2017 gtgt q_act_jan)13User Value -8937 Tsd | Financing activitiesdividend | 2853 | 894 | neg | ||||||||||||||||||||||||||||||||||||||||||||||||||
| Effect of exchange rate changes | 933 | r28 PAC Hamon Pierrick Referenced Value (value_1_PQACTJAN02)1313Document Q3_2017_Quarter_Report13Chapter Consolidated Statement of Cash Flows13Row ltlt Effect of exchange rate changes on cash and cash equivalents gtgt (ltlt 2017 gtgt q_act_jan)13User Value 933 Tsd | Effect of exchange rate changes | 2853 | 93 | |||||||||||||||||||||||||||||||||||||||||||||||||||
| Reported cash and cash equivalents at 30092017 | 29463 | r29 PAC Hamon Pierrick Referenced Value (value_1_PQACTJAN02)1313Document Q3_2017_Quarter_Report13Chapter Consolidated Statement of Cash Flows13Row ltlt Cash and cash equivalents at the end of the period gtgt (ltlt 2017 gtgt q_act_jan)13User Value 29463 Tsd | PAC Hamon Pierrick Referenced Value (value_1_PQACTJAN02)1313Document Q3_2017_Quarter_Report13Chapter Consolidated Statement of Cash Flows13Row ltlt Subtotal cash flow from operations gtgt (ltlt 2017 gtgt q_act_jan)13User Value 10749 Tsd | PAC Hamon Pierrick Referenced Value (value_1_PQACTJAN02)1313Document Q3_2017_Quarter_Report13Chapter Consolidated Statement of Cash Flows1313-7973 Tsd - ltlt (Increase) decrease receivables other current assets and unbilled forwarding services gtgt (ltlt 2017 gtgt q_act_jan)134406 Tsd - ltlt Increase (decrease) payables and accruals incl accrued cost of service gtgt (ltlt 2017 gtgt q_act_jan)13-472 Tsd - ltlt Increase (decrease) non-current provisions and other liabilities gtgt (ltlt 2017 gtgt q_act_jan)13-749 Tsd - ltlt Increase (decrease) current provisions and other liabilities gtgt (ltlt 2017 gtgt q_act_jan)13---------------------13-4787 Tsd (Total) | PAC Hamon Pierrick Referenced Value (value_1_PQACTJAN02)1313Document Q3_2017_Quarter_Report13Chapter Consolidated Statement of Cash Flows13Row ltlt Cash generated from operations gtgt (ltlt 2017 gtgt q_act_jan)13User Value 5963 Tsd | PAC Hamon Pierrick Referenced Value (value_1_PQACTJAN02)1313Document Q3_2017_Quarter_Report13Chapter Consolidated Statement of Cash Flows1313-136 Tsd - ltlt Interest paid gtgt (ltlt 2017 gtgt q_act_jan)13-3175 Tsd - ltlt Income taxes paid gtgt (ltlt 2017 gtgt q_act_jan)13---------------------13-3311 Tsd (Total) | PAC Hamon Pierrick Referenced Value (value_1_PQACTJAN02)1313Document Q3_2017_Quarter_Report13Chapter Consolidated Statement of Cash Flows13Row ltlt Net cash from operating activities gtgt (ltlt 2017 gtgt q_act_jan)13User Value 2652 Tsd | PAC Hamon Pierrick Referenced Value (value_1_PQACTJAN02)1313Document Q3_2017_Quarter_Report13Chapter Consolidated Statement of Cash Flows13Row ltlt Net cash used in investing activities gtgt (ltlt 2017 gtgt q_act_jan)13User Value -4063 Tsd | PAC Hamon Pierrick Referenced Value (value_1_PQACTJAN02)1313Document Q3_2017_Quarter_Report13Chapter Consolidated Statement of Cash Flows13Row ltlt Free cash flow gtgt (ltlt 2017 gtgt q_act_jan)13User Value -1411 Tsd | PAC Hamon Pierrick Referenced Value (value_1_PQACTJAN02)1313Document Q3_2017_Quarter_Report13Chapter Consolidated Statement of Cash Flows13Row ltlt Net cash used in financing activities gtgt (ltlt 2017 gtgt q_act_jan)13User Value -8937 Tsd | PAC Hamon Pierrick Referenced Value (value_1_PQACTJAN02)1313Document Q3_2017_Quarter_Report13Chapter Consolidated Statement of Cash Flows13Row ltlt Net increase (decrease) in cash and cash equivalents gtgt (ltlt 2017 gtgt q_act_jan)13User Value -10348 Tsd | PAC Hamon Pierrick Referenced Value (value_1_PQACTJAN02)1313Document Q3_2017_Quarter_Report13Chapter Consolidated Statement of Cash Flows13Row ltlt Cash and cash equivalents at the beginning of the period gtgt (ltlt 2017 gtgt q_act_jan)13User Value 38878 Tsd | PAC Hamon Pierrick Referenced Value (value_1_PQACTJAN02)1313Document Q3_2017_Quarter_Report13Chapter Consolidated Statement of Cash Flows13Row ltlt Effect of exchange rate changes on cash and cash equivalents gtgt (ltlt 2017 gtgt q_act_jan)13User Value 933 Tsd | PAC Hamon Pierrick Referenced Value (value_1_PQACTJAN02)1313Document Q3_2017_Quarter_Report13Chapter Consolidated Statement of Cash Flows13Row ltlt Cash and cash equivalents at the end of the period gtgt (ltlt 2017 gtgt q_act_jan)13User Value 29463 Tsd | PAC Hamon Pierrick Referenced Value (value_1_PQACTJAN02)1313Document Q3_2017_Quarter_Report13Chapter Consolidated Statement of Cash Flows13Row ltlt Cash and cash equivalents at the beginning of the period gtgt (ltlt 2017 gtgt q_act_jan)13User Value 38878 Tsd | PAC Hamon Pierrick Referenced Value (value_1_PQACTJAN02)1313Document Q3_2017_Quarter_Report13Chapter Consolidated Statement of Cash Flows13Row ltlt Profit gtgt (ltlt 2017 gtgt q_act_jan)13User Value 4839 Tsd | PAC Hamon Pierrick Referenced Value (value_1_PQACTJAN02)1313Document Q3_2017_Quarter_Report13Chapter Consolidated Statement of Cash Flows13131565 Tsd - ltlt Depreciation of property plant and equipment gtgt (ltlt 2017 gtgt q_act_jan)131616 Tsd - ltlt Amortization of intangible assets gtgt (ltlt 2017 gtgt q_act_jan)13-165 Tsd - ltlt Interest income and dividend on available-for-sale financial assets gtgt (ltlt 2017 gtgt q_act_jan)13-167 Tsd - ltlt Exchange differences gtgt (ltlt 2017 gtgt q_act_jan)13-025 Tsd - ltlt Loss (gain) on sales of property plant and equipment gtgt (ltlt 2017 gtgt q_act_jan)13000 Tsd - ltlt Loss (gain) on sales of financial assets gtgt (ltlt 2017 gtgt q_act_jan)13497 Tsd - ltlt Expenses for share-based compensation plans gtgt (ltlt 2017 gtgt q_act_jan)13238 Tsd - ltlt Other non-cash (income) and expenses gtgt (ltlt 2017 gtgt q_act_jan)132351 Tsd - ltlt Income tax expenses gtgt (ltlt 2017 gtgt q_act_jan)13---------------------135910 Tsd (Total) | PAC Hamon Pierrick Referenced Value (value_1_PQACTJAN02)1313Document Q3_2017_Quarter_Report13Chapter Consolidated Statement of Cash Flows1313-7973 Tsd - ltlt (Increase) decrease receivables other current assets and unbilled forwarding services gtgt (ltlt 2017 gtgt q_act_jan)134406 Tsd - ltlt Increase (decrease) payables and accruals incl accrued cost of service gtgt (ltlt 2017 gtgt q_act_jan)13-472 Tsd - ltlt Increase (decrease) non-current provisions and other liabilities gtgt (ltlt 2017 gtgt q_act_jan)13-749 Tsd - ltlt Increase (decrease) current provisions and other liabilities gtgt (ltlt 2017 gtgt q_act_jan)13---------------------13-4787 Tsd (Total) | PAC Hamon Pierrick Referenced Value (value_1_PQACTJAN02)1313Document Q3_2017_Quarter_Report13Chapter Consolidated Statement of Cash Flows1313-136 Tsd - ltlt Interest paid gtgt (ltlt 2017 gtgt q_act_jan)13-3175 Tsd - ltlt Income taxes paid gtgt (ltlt 2017 gtgt q_act_jan)13---------------------13-3311 Tsd (Total) | Reported cash and cash equivalents at 30092017 | 2946 | 3888 | ||||||||||||||||||||||||||||||||||
| 484 | ||||||||||||||||||||||||||||||||||||||||||||||||||||||||
| 591 | ||||||||||||||||||||||||||||||||||||||||||||||||||||||||
| (479) | ||||||||||||||||||||||||||||||||||||||||||||||||||||||||
| (331) | ||||||||||||||||||||||||||||||||||||||||||||||||||||||||
| (406) | ||||||||||||||||||||||||||||||||||||||||||||||||||||||||
| (894) | ||||||||||||||||||||||||||||||||||||||||||||||||||||||||
| 93 | ||||||||||||||||||||||||||||||||||||||||||||||||||||||||
| 2946 |
| 31-Dec-16 | 30-Sept-17 | Change in | ||||||||||||||||||||||||||||||||||||||||||||||||||||||||
| CHF | ||||||||||||||||||||||||||||||||||||||||||||||||||||||||||
| Cash and cash equivalents | 3888 | 2946 | (942) | -24 | r3 PAC Hamon Pierrick Referenced Value (value_1_PQACTJAN02)1313Document Q3_2017_Quarter_Report13Chapter Consolidated Statement of Financial Position13Row ltlt Cash and cash equivalents gtgt (ltlt September 30 2017 gtgt q_act_jan)13User Value 29463 Tsd | 3888 | 3999 | 111 | 3 | |||||||||||||||||||||||||||||||||||||||||||||||||
| Trade receivables unbilled forwarding services | 9087 | 9893 | 806 | 9 | r4 PAC Hamon Pierrick Referenced Value (value_1_PQACTJAN02)1313Document Q3_2017_Quarter_Report13Chapter Consolidated Statement of Financial Position13Row ltlt Trade receivables unbilled forwarding services gtgt (ltlt September 30 2017 gtgt q_act_jan)13User Value 98929 Tsd | 9087 | 8693 | -394 | -4 | |||||||||||||||||||||||||||||||||||||||||||||||||
| Other current assets | 1025 | 1167 | 142 | 14 | r5 PAC Hamon Pierrick Referenced Value (value_1_PQACTJAN02)1313Document Q3_2017_Quarter_Report13Chapter Consolidated Statement of Financial Position13Row ltlt Other current assets gtgt (ltlt September 30 2017 gtgt q_act_jan)13User Value 11671 Tsd | 1025 | 1335 | 31 | 30 | |||||||||||||||||||||||||||||||||||||||||||||||||
| Property plant and equipment | 635 | 803 | 168 | 26 | r6 PAC Hamon Pierrick Referenced Value (value_1_PQACTJAN02)1313Document Q3_2017_Quarter_Report13Chapter Consolidated Statement of Financial Position13Row ltlt Property plant and equipment gtgt (ltlt September 30 2017 gtgt q_act_jan)13User Value 8028 Tsd | 635 | 651 | 16 | 3 | |||||||||||||||||||||||||||||||||||||||||||||||||
| Intangible assets | 979 | 917 | (62) | -6 | r7 PAC Hamon Pierrick Referenced Value (value_1_PQACTJAN02)1313Document Q3_2017_Quarter_Report13Chapter Consolidated Statement of Financial Position13Row ltlt Intangible assets gtgt (ltlt September 30 2017 gtgt q_act_jan)13User Value 9168 Tsd | 979 | 926 | -53 | -5 | |||||||||||||||||||||||||||||||||||||||||||||||||
| Other non-current assets | 990 | 1133 | 143 | 14 | r8 PAC Hamon Pierrick Referenced Value (value_1_PQACTJAN02)1313Document Q3_2017_Quarter_Report13Chapter Consolidated Statement of Financial Position13Row ltlt Other non-current assets gtgt (ltlt September 30 2017 gtgt q_act_jan)13User Value 11586 Tsd | 99 | 1073 | 83 | 8 | |||||||||||||||||||||||||||||||||||||||||||||||||
| Total assets | 16606 | 16859 | 253 | 2 | r9 PAC Hamon Pierrick Referenced Value (value_1_PQACTJAN02)1313Document Q3_2017_Quarter_Report13Chapter Consolidated Statement of Financial Position13Row ltlt Total assets gtgt (ltlt September 30 2017 gtgt q_act_jan)13User Value 168844 Tsd | 166060 | 166780 | 72 | 0 | |||||||||||||||||||||||||||||||||||||||||||||||||
| 0 | ||||||||||||||||||||||||||||||||||||||||||||||||||||||||||
| Short-term borrowings | 23 | 21 | (02) | -10 | r11 PAC Hamon Pierrick Referenced Value (value_1_PQACTJAN02)1313Document Q3_2017_Quarter_Report13Chapter Consolidated Statement of Financial Position13Row ltlt Short-term borrowings gtgt (ltlt September 30 2017 gtgt q_act_jan)13User Value 208 Tsd | 23 | 05 | -18 | -78 | |||||||||||||||||||||||||||||||||||||||||||||||||
| Trade payables accured cost of services | 6524 | 7075 | 551 | 8 | r12 PAC Hamon Pierrick Referenced Value (value_1_PQACTJAN02)1313Document Q3_2017_Quarter_Report13Chapter Consolidated Statement of Financial Position13Row ltlt Trade payables accured cost of services gtgt (ltlt September 30 2017 gtgt q_act_jan)13User Value 70745 Tsd | 6524 | 620 | -324 | -5 | |||||||||||||||||||||||||||||||||||||||||||||||||
| Other current liabilities | 2439 | 2254 | (185) | -8 | r13 PAC Hamon Pierrick Referenced Value (value_1_PQACTJAN02)1313Document Q3_2017_Quarter_Report13Chapter Consolidated Statement of Financial Position13Row ltlt Other current liabilities gtgt (ltlt September 30 2017 gtgt q_act_jan)13User Value 22538 Tsd | 2439 | 2592 | 153 | 6 | |||||||||||||||||||||||||||||||||||||||||||||||||
| Long-Term borrowings | 00 | 20 | 20 | na | r20 PAC Hamon Pierrick Referenced Value (value_1_PQACTJAN02)1313Document Q3_2017_Quarter_Report13Chapter Consolidated Statement of Financial Position13Row ltlt Long-term borrowings gtgt (ltlt September 30 2017 gtgt q_act_jan)13User Value 197 Tsd | 0 | 12 | 12 | na | |||||||||||||||||||||||||||||||||||||||||||||||||
| Other long-term liabilities | 1449 | 1527 | 78 | 5 | r21 PAC Hamon Pierrick Referenced Value (value_1_PQACTJAN02)1313Document Q3_2017_Quarter_Report13Chapter Consolidated Statement of Financial Position13Row ltlt Other long-term liabilities gtgt (ltlt September 30 2017 gtgt q_act_jan)13User Value 15270 Tsd | 1449 | 1479 | 3 | 2 | |||||||||||||||||||||||||||||||||||||||||||||||||
| Total liabilities | 10436 | 10896 | 460 | 4 | r14 PAC Hamon Pierrick Referenced Value (value_1_PQACTJAN02)1313Document Q3_2017_Quarter_Report13Chapter Consolidated Statement of Financial Position13Row ltlt Total liabilities gtgt (ltlt September 30 2017 gtgt q_act_jan)13User Value 108956 Tsd | 104360 | 102880 | -148 | -1 | |||||||||||||||||||||||||||||||||||||||||||||||||
| Share capital | 24 | 24 | (00) | -1 | r15 PAC Hamon Pierrick Referenced Value (value_1_PQACTJAN02)1313Document Q3_2017_Quarter_Report13Chapter Consolidated Statement of Financial Position13Row ltlt Share capital gtgt (ltlt September 30 2017 gtgt q_act_jan)13User Value 238 Tsd | 24 | 24 | 0 | 0 | |||||||||||||||||||||||||||||||||||||||||||||||||
| Reserves treasury shares | 6057 | 5884 | (173) | -3 | r16 PAC Hamon Pierrick Referenced Value (value_1_PQACTJAN02)1313Document Q3_2017_Quarter_Report13Chapter Consolidated Statement of Financial Position13Row ltlt Reserves treasury shares gtgt (ltlt September 30 2017 gtgt q_act_jan)13User Value 59100 Tsd | 6057 | 6285 | 228 | 4 | |||||||||||||||||||||||||||||||||||||||||||||||||
| Non-controlling interests | 89 | 55 | (34) | -38 | r17 PAC Hamon Pierrick Referenced Value (value_1_PQACTJAN02)1313Document Q3_2017_Quarter_Report13Chapter Consolidated Statement of Financial Position13Row ltlt Non-controlling interests gtgt (ltlt September 30 2017 gtgt q_act_jan)13User Value 550 Tsd | 89 | 81 | -08 | -9 | |||||||||||||||||||||||||||||||||||||||||||||||||
| Total equity | 6170 | 5963 | (207) | -3 | r18 PAC Hamon Pierrick Referenced Value (value_1_PQACTJAN02)1313Document Q3_2017_Quarter_Report13Chapter Consolidated Statement of Financial Position13Row ltlt Total equity gtgt (ltlt September 30 2017 gtgt q_act_jan)13User Value 59887 Tsd | 617 | 639 | 22 | 4 | |||||||||||||||||||||||||||||||||||||||||||||||||
| Total equity and liabilities | 16606 | 16859 | 253 | 2 | r19 PAC Hamon Pierrick Referenced Value (value_1_PQACTJAN02)1313Document Q3_2017_Quarter_Report13Chapter Consolidated Statement of Financial Position13Row ltlt Total equity and liabilities gtgt (ltlt September 30 2017 gtgt q_act_jan)13User Value 168844 Tsd | 166060 | 166780 | 72 | 0 | |||||||||||||||||||||||||||||||||||||||||||||||||
| KPIs | 31-Dec-16 | 30-Jun-17 | ||||||||||||||||||||||||||||||||||||||||||||||||||||||||
| Equity Ratio | 372 | 354 | s20 PAC Hamon Pierrick Referenced Value (value_1_PQACTJAN02)1313Document Q2_2017_Quarter_Report13Chapter Consolidated Statement of Financial Position13Row ltlt Total equity and liabilities gtgt (ltlt June 30 2017 gtgt q_act_jan)13User Value 153472 Tsd | |||||||||||||||||||||||||||||||||||||||||||||||||||||||
PAC Hamon Pierrick Referenced Value (value_1_PQACTJAN02)1313Document Q3_2017_Quarter_Report13Chapter Consolidated Statement of Financial Position13Row ltlt Cash and cash equivalents gtgt (ltlt September 30 2017 gtgt q_act_jan)13User Value 29463 Tsd | PAC Hamon Pierrick Referenced Value (value_1_PQACTJAN02)1313Document Q3_2017_Quarter_Report13Chapter Consolidated Statement of Financial Position13Row ltlt Trade receivables unbilled forwarding services gtgt (ltlt September 30 2017 gtgt q_act_jan)13User Value 98929 Tsd | PAC Hamon Pierrick Referenced Value (value_1_PQACTJAN02)1313Document Q3_2017_Quarter_Report13Chapter Consolidated Statement of Financial Position13Row ltlt Other current assets gtgt (ltlt September 30 2017 gtgt q_act_jan)13User Value 11671 Tsd | PAC Hamon Pierrick Referenced Value (value_1_PQACTJAN02)1313Document Q3_2017_Quarter_Report13Chapter Consolidated Statement of Financial Position13Row ltlt Property plant and equipment gtgt (ltlt September 30 2017 gtgt q_act_jan)13User Value 8028 Tsd | PAC Hamon Pierrick Referenced Value (value_1_PQACTJAN02)1313Document Q3_2017_Quarter_Report13Chapter Consolidated Statement of Financial Position13Row ltlt Intangible assets gtgt (ltlt September 30 2017 gtgt q_act_jan)13User Value 9168 Tsd | PAC Hamon Pierrick Referenced Value (value_1_PQACTJAN02)1313Document Q3_2017_Quarter_Report13Chapter Consolidated Statement of Financial Position13Row ltlt Other non-current assets gtgt (ltlt September 30 2017 gtgt q_act_jan)13User Value 11586 Tsd | PAC Hamon Pierrick Referenced Value (value_1_PQACTJAN02)1313Document Q3_2017_Quarter_Report13Chapter Consolidated Statement of Financial Position13Row ltlt Total assets gtgt (ltlt September 30 2017 gtgt q_act_jan)13User Value 168844 Tsd | PAC Hamon Pierrick Referenced Value (value_1_PQACTJAN02)1313Document Q3_2017_Quarter_Report13Chapter Consolidated Statement of Financial Position13Row ltlt Short-term borrowings gtgt (ltlt September 30 2017 gtgt q_act_jan)13User Value 208 Tsd | PAC Hamon Pierrick Referenced Value (value_1_PQACTJAN02)1313Document Q3_2017_Quarter_Report13Chapter Consolidated Statement of Financial Position13Row ltlt Trade payables accured cost of services gtgt (ltlt September 30 2017 gtgt q_act_jan)13User Value 70745 Tsd | PAC Hamon Pierrick Referenced Value (value_1_PQACTJAN02)1313Document Q3_2017_Quarter_Report13Chapter Consolidated Statement of Financial Position13Row ltlt Other current liabilities gtgt (ltlt September 30 2017 gtgt q_act_jan)13User Value 22538 Tsd | PAC Hamon Pierrick Referenced Value (value_1_PQACTJAN02)1313Document Q3_2017_Quarter_Report13Chapter Consolidated Statement of Financial Position13Row ltlt Long-term borrowings gtgt (ltlt September 30 2017 gtgt q_act_jan)13User Value 197 Tsd | PAC Hamon Pierrick Referenced Value (value_1_PQACTJAN02)1313Document Q3_2017_Quarter_Report13Chapter Consolidated Statement of Financial Position13Row ltlt Other long-term liabilities gtgt (ltlt September 30 2017 gtgt q_act_jan)13User Value 15270 Tsd | PAC Hamon Pierrick Referenced Value (value_1_PQACTJAN02)1313Document Q3_2017_Quarter_Report13Chapter Consolidated Statement of Financial Position13Row ltlt Total liabilities gtgt (ltlt September 30 2017 gtgt q_act_jan)13User Value 108956 Tsd | PAC Hamon Pierrick Referenced Value (value_1_PQACTJAN02)1313Document Q3_2017_Quarter_Report13Chapter Consolidated Statement of Financial Position13Row ltlt Share capital gtgt (ltlt September 30 2017 gtgt q_act_jan)13User Value 238 Tsd | PAC Hamon Pierrick Referenced Value (value_1_PQACTJAN02)1313Document Q3_2017_Quarter_Report13Chapter Consolidated Statement of Financial Position13Row ltlt Reserves treasury shares gtgt (ltlt September 30 2017 gtgt q_act_jan)13User Value 59100 Tsd | PAC Hamon Pierrick Referenced Value (value_1_PQACTJAN02)1313Document Q3_2017_Quarter_Report13Chapter Consolidated Statement of Financial Position13Row ltlt Non-controlling interests gtgt (ltlt September 30 2017 gtgt q_act_jan)13User Value 550 Tsd | PAC Hamon Pierrick Referenced Value (value_1_PQACTJAN02)1313Document Q3_2017_Quarter_Report13Chapter Consolidated Statement of Financial Position13Row ltlt Total equity gtgt (ltlt September 30 2017 gtgt q_act_jan)13User Value 59887 Tsd | PAC Hamon Pierrick Referenced Value (value_1_PQACTJAN02)1313Document Q3_2017_Quarter_Report13Chapter Consolidated Statement of Financial Position13Row ltlt Total equity and liabilities gtgt (ltlt September 30 2017 gtgt q_act_jan)13User Value 168844 Tsd | NWC-Intensity | 18 | 13 | mf24 | |||||||||||||||||||||||||||||||||||||
| DSO 3-m-rolling YTD | 455 | 467 | m22 | |||||||||||||||||||||||||||||||||||||||||||||||||||||||
| DPO 3-m-rolling YTD | 407 | 397 | m23 |
| 2017 | 2016 | |||||||||||||||||||||||||||||||||||||||||||||||||||||||||||||||||||
| Logistics | Q1 2016 | Q2 2016 | HY 2016 | Q3 2016 | Q3YTD 2016 | Q4 2016 | FY 2016 | Q1 2017 | Q2 2017 | HY 2017 | Q3 2017 | Q3YTD 2017 | ||||||||||||||||||||||||||||||||||||||||||||||||||||||||
| Net forwarding revenue | 1402 | 1613 | 3015 | 1374 | 4389 | 1321 | 5709 | 1286 | 1377 | 2663 | 1394 | 4057 | m4 | m4 | r4 PAC Hamon Pierrick Referenced Value (value_1_PQACT02)1313Document Q3_2017_Quarter_Report13Chapter Products quater and year to date13Row ltlt Net forwarding revenue gtgt (ltlt value_3 gtgt q_act)13User Value 13945 Tsd | r4 PAC Hamon Pierrick Referenced Value (value_1_PQACTJAN02)1313Document Q3_2017_Quarter_Report13Chapter Products quater and year to date13Row ltlt Net forwarding revenue gtgt (ltlt value_3 gtgt q_act_jan)13User Value 40573 Tsd | -00 | 00 | (01) | |||||||||||||||||||||||||||||||||||||||||||||||||
| Forwarding expenses | (420) | (607) | (1027) | (429) | (1456) | (397) | (1853) | (460) | (564) | (1024) | (580) | (1604) | m5 | m5 | r5 PAC Hamon Pierrick Referenced Value (value_1_PQACT02)1313Document Q3_2017_Quarter_Report13Chapter Products quater and year to date13Row ltlt Forwarding services from third parties gtgt (ltlt value_3 gtgt q_act)13User Value -5796 Tsd | r5 PAC Hamon Pierrick Referenced Value (value_1_PQACTJAN02)1313Document Q3_2017_Quarter_Report13Chapter Products quater and year to date13Row ltlt Forwarding services from third parties gtgt (ltlt value_3 gtgt q_act_jan)13User Value -16035 Tsd | -00 | 00 | 00 | |||||||||||||||||||||||||||||||||||||||||||||||||
| Gross profit | 982 | 1006 | 1989 | 944 | 2933 | 924 | 3857 | 825 | 813 | 1639 | 815 | 2454 | m6 | m6 | r6 PAC Hamon Pierrick Referenced Value (value_1_PQACT02)1313Document Q3_2017_Quarter_Report13Chapter Products quater and year to date13Row ltlt Gross profit gtgt (ltlt value_3 gtgt q_act)13User Value 8148 Tsd | r6 PAC Hamon Pierrick Referenced Value (value_1_PQACTJAN02)1313Document Q3_2017_Quarter_Report13Chapter Products quater and year to date13Row ltlt Gross profit gtgt (ltlt value_3 gtgt q_act_jan)13User Value 24537 Tsd | 00 | 01 | 01 | |||||||||||||||||||||||||||||||||||||||||||||||||
| Personnel expenses | (574) | (591) | (1166) | (528) | (1694) | (519) | (2213) | (479) | (461) | (940) | (469) | (1409) | m7 | m7 | r7 PAC Hamon Pierrick Referenced Value (value_1_PQACT02)1313Document Q3_2017_Quarter_Report13Chapter Products quater and year to date13Row ltlt Personnel expenses gtgt (ltlt value_3 gtgt q_act)13User Value -4692 Tsd | r7 PAC Hamon Pierrick Referenced Value (value_1_PQACTJAN02)1313Document Q3_2017_Quarter_Report13Chapter Products quater and year to date13Row ltlt Personnel expenses gtgt (ltlt value_3 gtgt q_act_jan)13User Value -14091 Tsd | -00 | (01) | (01) | |||||||||||||||||||||||||||||||||||||||||||||||||
| Other operating expenses | (360) | (363) | (723) | (378) | (1102) | (367) | (1469) | (298) | (298) | (596) | (298) | (894) | m8 | m8 | r8 PAC Hamon Pierrick Referenced Value (value_1_PQACT02)1313Document Q3_2017_Quarter_Report13Chapter Products quater and year to date13Row ltlt Other operating expenses gtgt (ltlt value_3 gtgt q_act)13User Value -2977 Tsd | r8 PAC Hamon Pierrick Referenced Value (value_1_PQACTJAN02)1313Document Q3_2017_Quarter_Report13Chapter Products quater and year to date13Row ltlt Other operating expenses gtgt (ltlt value_3 gtgt q_act_jan)13User Value -8940 Tsd | 00 | 00 | (01) | |||||||||||||||||||||||||||||||||||||||||||||||||
| EBITDA adjusted | 48 | 52 | 100 | 38 | 138 | 37 | 175 | 48 | 54 | 103 | 48 | 151 | m9 | m9 | r9 PAC Hamon Pierrick Referenced Value (value_1_PQACT02)1313Document Q3_2017_Quarter_Report13Chapter Products quater and year to date13Row ltlt EBITDA gtgt (ltlt value_3 gtgt q_act)13User Value 479 Tsd | r9 PAC Hamon Pierrick Referenced Value (value_1_PQACTJAN02)1313Document Q3_2017_Quarter_Report13Chapter Products quater and year to date13Row ltlt EBITDA gtgt (ltlt value_3 gtgt q_act_jan)13User Value 1506 Tsd | 00 | 00 | 00 | |||||||||||||||||||||||||||||||||||||||||||||||||
| Depreciation and amortization | (29) | (29) | (58) | (29) | (88) | (32) | (119) | (25) | (24) | (48) | (21) | (69) | m10 | m10 | r10 PAC Hamon Pierrick Referenced Value (value_1_PQACT02)1313Document Q3_2017_Quarter_Report13Chapter Products quater and year to date13Row ltlt Depreciation and amortization gtgt (ltlt value_3 gtgt q_act)13User Value -208 Tsd | r10 PAC Hamon Pierrick Referenced Value (value_1_PQACTJAN02)1313Document Q3_2017_Quarter_Report13Chapter Products quater and year to date13Row ltlt Depreciation and amortization gtgt (ltlt value_3 gtgt q_act_jan)13User Value -692 Tsd | 00 | 00 | 00 | |||||||||||||||||||||||||||||||||||||||||||||||||
| EBIT adjusted | 18 | 23 | 41 | 09 | 50 | 05 | 56 | 24 | 31 | 54 | 27 | 81 | m11 | m11 | r11 PAC Hamon Pierrick Referenced Value (value_1_PQACT02)1313Document Q3_2017_Quarter_Report13Chapter Products quater and year to date13Row ltlt Operating result (EBIT) gtgt (ltlt value_3 gtgt q_act)13User Value 271 Tsd | r11 PAC Hamon Pierrick Referenced Value (value_1_PQACTJAN02)1313Document Q3_2017_Quarter_Report13Chapter Products quater and year to date13Row ltlt Operating result (EBIT) gtgt (ltlt value_3 gtgt q_act_jan)13User Value 815 Tsd | -00 | 00 | 01 | |||||||||||||||||||||||||||||||||||||||||||||||||
| Non-recurring items | ||||||||||||||||||||||||||||||||||||||||||||||||||||||||||||||||||||
| Restructuring expenses | 00 | (38) | (38) | 00 | (38) | 00 | (38) | 00 | 00 | 00 | 00 | 00 | m13 | m13 | m13 | m13 | 00 | 00 | 00 | |||||||||||||||||||||||||||||||||||||||||||||||||
| EBIT reported | 18 | (15) | 03 | 09 | 12 | 05 | 18 | 24 | 31 | 54 | 27 | 81 | m15 | m15 | r15 PAC Hamon Pierrick Referenced Value (value_1_PQACT02)1313Document Q3_2017_Quarter_Report13Chapter Products quater and year to date13Row ltlt Operating result (EBIT) gtgt (ltlt value_3 gtgt q_act)13User Value 271 Tsd | r15 PAC Hamon Pierrick Referenced Value (value_1_PQACTJAN02)1313Document Q3_2017_Quarter_Report13Chapter Products quater and year to date13Row ltlt Operating result (EBIT) gtgt (ltlt value_3 gtgt q_act_jan)13User Value 815 Tsd | ||||||||||||||||||||||||||||||||||||||||||||||||||||
PAC Hamon Pierrick Referenced Value (value_1_PQACT02)1313Document Q3_2017_Quarter_Report13Chapter Products quater and year to date13Row ltlt Net forwarding revenue gtgt (ltlt value_3 gtgt q_act)13User Value 13945 Tsd | PAC Hamon Pierrick Referenced Value (value_1_PQACTJAN02)1313Document Q3_2017_Quarter_Report13Chapter Products quater and year to date13Row ltlt Net forwarding revenue gtgt (ltlt value_3 gtgt q_act_jan)13User Value 40573 Tsd | PAC Hamon Pierrick Referenced Value (value_1_PQACT02)1313Document Q3_2017_Quarter_Report13Chapter Products quater and year to date13Row ltlt Forwarding services from third parties gtgt (ltlt value_3 gtgt q_act)13User Value -5796 Tsd | GP Change YoY | -19 | -18 | -14 | -16 | s16 | s16 | |||||||||||||||||||||||||||||||||||||||||||||||||||||||||||
| 2017 | 2016 | ||||||||||||||||||||||||||||||||||||||||||||||||||||||||||
| Ocean Freight | Q1 2016 | Q2 2016 | HY 2016 | Q3 2016 | Q3YTD 2016 | Q4 2016 | FY 2016 | Q1 2017 | Q2 2017 | HY 2017 | Q3 2017 | Q3YTD 2017 | |||||||||||||||||||||||||||||||||||||||||||||||
| Net forwarding revenue | 5338 | 4921 | 10259 | 4955 | 15214 | 4770 | 19984 | 4915 | 5172 | 10087 | 5551 | 15637 | m4 | m4 | r4 PAC Hamon Pierrick Referenced Value (value_1_PQACT02)1313Document Q3_2017_Quarter_Report13Chapter Products quater and year to date13Row ltlt Net forwarding revenue gtgt (ltlt value_2 gtgt q_act)13User Value 55506 Tsd | r4 PAC Hamon Pierrick Referenced Value (value_1_PQACTJAN02)1313Document Q3_2017_Quarter_Report13Chapter Products quater and year to date13Row ltlt Net forwarding revenue gtgt (ltlt value_2 gtgt q_act_jan)13User Value 156375 Tsd | 00 | 00 | 00 | ||||||||||||||||||||||||||||||||||||||||
| Forwarding expenses | (4157) | (3773) | (7930) | (3834) | (11764) | (3783) | (15547) | (3860) | (4081) | (7941) | (4463) | (12404) | m5 | m5 | r5 PAC Hamon Pierrick Referenced Value (value_1_PQACT02)1313Document Q3_2017_Quarter_Report13Chapter Products quater and year to date13Row ltlt Forwarding services from third parties gtgt (ltlt value_2 gtgt q_act)13User Value -44629 Tsd | r5 PAC Hamon Pierrick Referenced Value (value_1_PQACTJAN02)1313Document Q3_2017_Quarter_Report13Chapter Products quater and year to date13Row ltlt Forwarding services from third parties gtgt (ltlt value_2 gtgt q_act_jan)13User Value -124038 Tsd | -00 | 00 | 00 | ||||||||||||||||||||||||||||||||||||||||
| Gross profit | 1181 | 1148 | 2329 | 1121 | 3450 | 987 | 4438 | 1055 | 1091 | 2146 | 1088 | 3234 | m6 | m6 | r6 PAC Hamon Pierrick Referenced Value (value_1_PQACT02)1313Document Q3_2017_Quarter_Report13Chapter Products quater and year to date13Row ltlt Gross profit gtgt (ltlt value_2 gtgt q_act)13User Value 10877 Tsd | r6 PAC Hamon Pierrick Referenced Value (value_1_PQACTJAN02)1313Document Q3_2017_Quarter_Report13Chapter Products quater and year to date13Row ltlt Gross profit gtgt (ltlt value_2 gtgt q_act_jan)13User Value 32337 Tsd | 00 | 00 | 01 | ||||||||||||||||||||||||||||||||||||||||
| Personnel expenses | (791) | (752) | (1543) | (755) | (2298) | (721) | (3019) | (779) | (784) | (1564) | (788) | (2352) | m7 | m7 | r7 PAC Hamon Pierrick Referenced Value (value_1_PQACT02)1313Document Q3_2017_Quarter_Report13Chapter Products quater and year to date13Row ltlt Personnel expenses gtgt (ltlt value_2 gtgt q_act)13User Value -7884 Tsd | r7 PAC Hamon Pierrick Referenced Value (value_1_PQACTJAN02)1313Document Q3_2017_Quarter_Report13Chapter Products quater and year to date13Row ltlt Personnel expenses gtgt (ltlt value_2 gtgt q_act_jan)13User Value -23522 Tsd | -00 | 00 | 00 | ||||||||||||||||||||||||||||||||||||||||
| Other operating expenses | (305) | (288) | (594) | (274) | (868) | (275) | (1144) | (271) | (265) | (536) | (290) | (827) | m8 | m8 | r8 PAC Hamon Pierrick Referenced Value (value_1_PQACT02)1313Document Q3_2017_Quarter_Report13Chapter Products quater and year to date13Row ltlt Other operating expenses gtgt (ltlt value_2 gtgt q_act)13User Value -2905 Tsd | r8 PAC Hamon Pierrick Referenced Value (value_1_PQACTJAN02)1313Document Q3_2017_Quarter_Report13Chapter Products quater and year to date13Row ltlt Other operating expenses gtgt (ltlt value_2 gtgt q_act_jan)13User Value -8265 Tsd | -00 | (01) | (02) | ||||||||||||||||||||||||||||||||||||||||
| EBITDA adjusted | 84 | 108 | 192 | 92 | 284 | (09) | 275 | 05 | 41 | 46 | 09 | 55 | m9 | m9 | r9 PAC Hamon Pierrick Referenced Value (value_1_PQACT02)1313Document Q3_2017_Quarter_Report13Chapter Products quater and year to date13Row ltlt EBITDA gtgt (ltlt value_2 gtgt q_act)13User Value 089 Tsd | r9 PAC Hamon Pierrick Referenced Value (value_1_PQACTJAN02)1313Document Q3_2017_Quarter_Report13Chapter Products quater and year to date13Row ltlt EBITDA gtgt (ltlt value_2 gtgt q_act_jan)13User Value 550 Tsd | -00 | 00 | 00 | ||||||||||||||||||||||||||||||||||||||||
| Depreciation and amortization | (41) | (42) | (83) | (41) | (124) | (42) | (166) | (36) | (36) | (72) | (38) | (110) | m10 | m10 | r10 PAC Hamon Pierrick Referenced Value (value_1_PQACT02)1313Document Q3_2017_Quarter_Report13Chapter Products quater and year to date13Row ltlt Depreciation and amortization gtgt (ltlt value_2 gtgt q_act)13User Value -384 Tsd | r10 PAC Hamon Pierrick Referenced Value (value_1_PQACTJAN02)1313Document Q3_2017_Quarter_Report13Chapter Products quater and year to date13Row ltlt Depreciation and amortization gtgt (ltlt value_2 gtgt q_act_jan)13User Value -1102 Tsd | -00 | 00 | 00 | ||||||||||||||||||||||||||||||||||||||||
| EBIT adjusted | 43 | 66 | 109 | 51 | 160 | (51) | 109 | (32) | 06 | (26) | (29) | (55) | m11 | m11 | r11 PAC Hamon Pierrick Referenced Value (value_1_PQACT02)1313Document Q3_2017_Quarter_Report13Chapter Products quater and year to date13Row ltlt Operating result (EBIT) gtgt (ltlt value_2 gtgt q_act)13User Value -295 Tsd | r11 PAC Hamon Pierrick Referenced Value (value_1_PQACTJAN02)1313Document Q3_2017_Quarter_Report13Chapter Products quater and year to date13Row ltlt Operating result (EBIT) gtgt (ltlt value_2 gtgt q_act_jan)13User Value -552 Tsd | 00 | 00 | 00 | ||||||||||||||||||||||||||||||||||||||||
| in of gross profit | 37 | 58 | 47 | 45 | 46 | -51 | 25 | -30 | 05 | -12 | -27 | -17 | m12 | m12 | s12 | s12 | |||||||||||||||||||||||||||||||||||||||||||
| Non-recurring items | 00 | 00 | 00 | ||||||||||||||||||||||||||||||||||||||||||||||||||||||||
| Restructuring expenses | 00 | (97) | (97) | 0 | (97) | (19) | (115) | 00 | 00 | 00 | 00 | 00 | m14 | m14 | m14 | m14 | 00 | 00 | 01 | ||||||||||||||||||||||||||||||||||||||||
| EBIT reported | 43 | (30) | 13 | 51 | 63 | (69) | (06) | (32) | 06 | (26) | (29) | (55) | m16 | m16 | r16 PAC Hamon Pierrick Referenced Value (value_1_PQACT02)1313Document Q3_2017_Quarter_Report13Chapter Products quater and year to date13Row ltlt Operating result (EBIT) gtgt (ltlt value_2 gtgt q_act)13User Value -295 Tsd | r16 PAC Hamon Pierrick Referenced Value (value_1_PQACTJAN02)1313Document Q3_2017_Quarter_Report13Chapter Products quater and year to date13Row ltlt Operating result (EBIT) gtgt (ltlt value_2 gtgt q_act_jan)13User Value -552 Tsd | PAC Hamon Pierrick Referenced Value (value_1_PQACT02)1313Document Q3_2017_Quarter_Report13Chapter Products quater and year to date13Row ltlt Net forwarding revenue gtgt (ltlt value_2 gtgt q_act)13User Value 55506 Tsd | PAC Hamon Pierrick Referenced Value (value_1_PQACTJAN02)1313Document Q3_2017_Quarter_Report13Chapter Products quater and year to date13Row ltlt Net forwarding revenue gtgt (ltlt value_2 gtgt q_act_jan)13User Value 156375 Tsd | PAC Hamon Pierrick Referenced Value (value_1_PQACT02)1313Document Q3_2017_Quarter_Report13Chapter Products quater and year to date13Row ltlt Forwarding services from third parties gtgt (ltlt value_2 gtgt q_act)13User Value -44629 Tsd | 00 | 00 | (01) | |||||||||||||||||||||||||||||||||||||
| in of gross profit | 37 | -26 | 05 | 45 | 18 | -70 | -01 | -30 | 05 | -12 | -27 | -17 | m17 | m17 | s17 | s17 | |||||||||||||||||||||||||||||||||||||||||||
| Ocean Freight volumes (000 tons) | 3482 | 3726 | 7208 | 3787 | 10995 | 3890 | 14885 | 3742 | 3828 | 7570 | 3856 | 11426 | m19 | m19 | m19 | m19 | 00 | 00 | 00 | ||||||||||||||||||||||||||||||||||||||||
| change YoY | -100 | -82 | -91 | -88 | -90 | 08 | -66 | 75 | 27 | 50 | 18 | 39 | m20 | m20 | s20 | s20 | |||||||||||||||||||||||||||||||||||||||||||
| GPTEU (CHF) | 339 | 308 | 323 | 296 | 314 | 254 | 298 | 282 | 285 | 283 | 282 | 283 | m21 | m21 | s21 | s21 | |||||||||||||||||||||||||||||||||||||||||||
| change YoY | 102 | 59 | 80 | -16 | 47 | -176 | -11 | -169 | -75 | -122 | -47 | -98 | m22 | m22 | s22 | s22 | |||||||||||||||||||||||||||||||||||||||||||
| GP change YoY | -5 | -8 | -3 | -6 | s23 | s23 | |||||||||||||||||||||||||||||||||||||||||||||||||||||
| 2017 | 2016 | ||||||||||||||||||||||||||||||||||||||||||||||||||||||||||
| Air Freight | Q1 2016 | Q2 2016 | HY 2016 | Q3 2016 | Q3YTD 2016 | Q4 2016 | FY 2016 | Q1 2017 | Q2 2017 | HY 2017 | Q3 2017 | Q3 YTD 2017 | |||||||||||||||||||||||||||||||||||||||||||||||
| Net forwarding revenue | 6332 | 6359 | 12691 | 6341 | 19032 | 7234 | 26267 | 6571 | 7000 | 13571 | 7389 | 20960 | m4 | m4 | r4 PAC Hamon Pierrick Referenced Value (value_1_PQACT02)1313Document Q3_2017_Quarter_Report13Chapter Products quater and year to date13Row ltlt Net forwarding revenue gtgt (ltlt value_1 gtgt q_act)13User Value 73890 Tsd | r4 PAC Hamon Pierrick Referenced Value (value_1_PQACTJAN02)1313Document Q3_2017_Quarter_Report13Chapter Products quater and year to date13Row ltlt Net forwarding revenue gtgt (ltlt value_1 gtgt q_act_jan)13User Value 209603 Tsd | 00 | 00 | 006009999999958 | ||||||||||||||||||||||||||||||||||||||||
| Forwarding expenses | (4846) | (4800) | (9646) | (4853) | (14499) | (5816) | (20315) | (5125) | (5500) | (10625) | (5775) | (16400) | m5 | m5 | r5 PAC Hamon Pierrick Referenced Value (value_1_PQACT02)1313Document Q3_2017_Quarter_Report13Chapter Products quater and year to date13Row ltlt Forwarding services from third parties gtgt (ltlt value_1 gtgt q_act)13User Value -57751 Tsd | r5 PAC Hamon Pierrick Referenced Value (value_1_PQACTJAN02)1313Document Q3_2017_Quarter_Report13Chapter Products quater and year to date13Row ltlt Forwarding services from third parties gtgt (ltlt value_1 gtgt q_act_jan)13User Value -164000 Tsd | 00 | 00 | 00 | ||||||||||||||||||||||||||||||||||||||||
| Gross profit | 1486 | 1559 | 3045 | 1489 | 4534 | 1418 | 5952 | 1447 | 1500 | 2946 | 1614 | 4560 | m6 | m6 | r6 PAC Hamon Pierrick Referenced Value (value_1_PQACT02)1313Document Q3_2017_Quarter_Report13Chapter Products quater and year to date13Row ltlt Gross profit gtgt (ltlt value_1 gtgt q_act)13User Value 16139 Tsd | r6 PAC Hamon Pierrick Referenced Value (value_1_PQACTJAN02)1313Document Q3_2017_Quarter_Report13Chapter Products quater and year to date13Row ltlt Gross profit gtgt (ltlt value_1 gtgt q_act_jan)13User Value 45602 Tsd | -00 | 00 | 00 | ||||||||||||||||||||||||||||||||||||||||
| Personnel expenses | (885) | (869) | (1754) | (847) | (2600) | (873) | (3473) | (905) | (916) | (1822) | (928) | (2750) | m7 | m7 | r7 PAC Hamon Pierrick Referenced Value (value_1_PQACT02)1313Document Q3_2017_Quarter_Report13Chapter Products quater and year to date13Row ltlt Personnel expenses gtgt (ltlt value_1 gtgt q_act)13User Value -9280 Tsd | r7 PAC Hamon Pierrick Referenced Value (value_1_PQACTJAN02)1313Document Q3_2017_Quarter_Report13Chapter Products quater and year to date13Row ltlt Personnel expenses gtgt (ltlt value_1 gtgt q_act_jan)13User Value -27496 Tsd | -00 | 00 | 01 | ||||||||||||||||||||||||||||||||||||||||
| Other operating expenses | (371) | (359) | (730) | (318) | (1048) | (284) | (1333) | (324) | (317) | (641) | (337) | (978) | m8 | m8 | r8 PAC Hamon Pierrick Referenced Value (value_1_PQACT02)1313Document Q3_2017_Quarter_Report13Chapter Products quater and year to date13Row ltlt Other operating expenses gtgt (ltlt value_1 gtgt q_act)13User Value -3367 Tsd | r8 PAC Hamon Pierrick Referenced Value (value_1_PQACTJAN02)1313Document Q3_2017_Quarter_Report13Chapter Products quater and year to date13Row ltlt Other operating expenses gtgt (ltlt value_1 gtgt q_act_jan)13User Value -9776 Tsd | 00 | 00 | (01) | ||||||||||||||||||||||||||||||||||||||||
| EBITDA adjusted | 230 | 331 | 561 | 324 | 885 | 261 | 1146 | 218 | 266 | 484 | 349 | 833 | m9 | m9 | r9 PAC Hamon Pierrick Referenced Value (value_1_PQACT02)1313Document Q3_2017_Quarter_Report13Chapter Products quater and year to date13Row ltlt EBITDA gtgt (ltlt value_1 gtgt q_act)13User Value 3492 Tsd | r9 PAC Hamon Pierrick Referenced Value (value_1_PQACTJAN02)1313Document Q3_2017_Quarter_Report13Chapter Products quater and year to date13Row ltlt EBITDA gtgt (ltlt value_1 gtgt q_act_jan)13User Value 8330 Tsd | -00 | 00 | 00 | ||||||||||||||||||||||||||||||||||||||||
| Depreciation and amortization | (52) | (52) | (103) | (55) | (158) | (53) | (211) | (46) | (47) | (93) | (46) | (139) | m10 | m10 | r10 PAC Hamon Pierrick Referenced Value (value_1_PQACT02)1313Document Q3_2017_Quarter_Report13Chapter Products quater and year to date13Row ltlt Depreciation and amortization gtgt (ltlt value_1 gtgt q_act)13User Value -458 Tsd | r10 PAC Hamon Pierrick Referenced Value (value_1_PQACTJAN02)1313Document Q3_2017_Quarter_Report13Chapter Products quater and year to date13Row ltlt Depreciation and amortization gtgt (ltlt value_1 gtgt q_act_jan)13User Value -1387 Tsd | -00 | 01 | 01 | ||||||||||||||||||||||||||||||||||||||||
| EBIT adjusted | 178 | 279 | 457 | 269 | 726 | 208 | 935 | 171 | 220 | 391 | 303 | 694 | m11 | m11 | r11 PAC Hamon Pierrick Referenced Value (value_1_PQACT02)1313Document Q3_2017_Quarter_Report13Chapter Products quater and year to date13Row ltlt Operating result (EBIT) gtgt (ltlt value_1 gtgt q_act)13User Value 3033 Tsd | r11 PAC Hamon Pierrick Referenced Value (value_1_PQACTJAN02)1313Document Q3_2017_Quarter_Report13Chapter Products quater and year to date13Row ltlt Operating result (EBIT) gtgt (ltlt value_1 gtgt q_act_jan)13User Value 6943 Tsd | 00 | 00 | 01 | ||||||||||||||||||||||||||||||||||||||||
| in of gross profit | 120 | 179 | 150 | 181 | 160 | 147 | 157 | 118 | 146 | 133 | 188 | 152 | m12 | m12 | s12 | s12 | |||||||||||||||||||||||||||||||||||||||||||
| Non-recurring items | 00 | 00 | 00 | ||||||||||||||||||||||||||||||||||||||||||||||||||||||||
| Restructuring expenses | 00 | (127) | (127) | 00 | (127) | 00 | (127) | 00 | 00 | 00 | 00 | 00 | m14 | m14 | m14 | m14 | 00 | 00 | 00 | ||||||||||||||||||||||||||||||||||||||||
| EBIT reported | 178 | 153 | 331 | 269 | 600 | 208 | 808 | 171 | 220 | 391 | 303 | 694 | m16 | m16 | r16 PAC Hamon Pierrick Referenced Value (value_1_PQACT02)1313Document Q3_2017_Quarter_Report13Chapter Products quater and year to date13Row ltlt Operating result (EBIT) gtgt (ltlt value_1 gtgt q_act)13User Value 3033 Tsd | r16 PAC Hamon Pierrick Referenced Value (value_1_PQACTJAN02)1313Document Q3_2017_Quarter_Report13Chapter Products quater and year to date13Row ltlt Operating result (EBIT) gtgt (ltlt value_1 gtgt q_act_jan)13User Value 6943 Tsd | PAC Hamon Pierrick Referenced Value (value_1_PQACT02)1313Document Q3_2017_Quarter_Report13Chapter Products quater and year to date13Row ltlt Net forwarding revenue gtgt (ltlt value_1 gtgt q_act)13User Value 73890 Tsd | PAC Hamon Pierrick Referenced Value (value_1_PQACTJAN02)1313Document Q3_2017_Quarter_Report13Chapter Products quater and year to date13Row ltlt Net forwarding revenue gtgt (ltlt value_1 gtgt q_act_jan)13User Value 209603 Tsd | PAC Hamon Pierrick Referenced Value (value_1_PQACT02)1313Document Q3_2017_Quarter_Report13Chapter Products quater and year to date13Row ltlt Forwarding services from third parties gtgt (ltlt value_1 gtgt q_act)13User Value -57751 Tsd | 00 | 00 | 00 | |||||||||||||||||||||||||||||||||||||
| in of gross profit | 120 | 98 | 109 | 181 | 132 | 147 | 136 | 118 | 146 | 133 | 188 | 152 | m17 | m17 | s17 | s17 | |||||||||||||||||||||||||||||||||||||||||||
| Air Freight volumes (000 tons) | 2161 | 2251 | 4412 | 2278 | 6690 | 2524 | 9214 | 2332 | 2399 | 4731 | 2489 | 7220 | m19 | m19 | m19 | m19 | 00 | 00 | 00 | ||||||||||||||||||||||||||||||||||||||||
| change YoY | 54 | 111 | 82 | 99 | 88 | 141 | 102 | 79 | 66 | 72 | 93 | 79 | m20 | m20 | s20 | s20 | |||||||||||||||||||||||||||||||||||||||||||
| GPton (CHF) | 688 | 693 | 690 | 653 | 678 | 562 | 646 | 620 | 625 | 623 | 648 | 632 | m21 | m21 | s21 | s21 | |||||||||||||||||||||||||||||||||||||||||||
| change YoY | -47 | -36 | -41 | -73 | -52 | -140 | -75 | -98 | -97 | -98 | -08 | -68 | m22 | m22 | s22 | s22 | |||||||||||||||||||||||||||||||||||||||||||
| GP change YoY | -4 | -3 | 8 | 1 | s23 | s23 |
| 2017 | 2016 | |||||||||||||||||||||||||||||||||||||||||||||||
| Group | Q1 2016 | Q2 2016 | HY 2016 | Q3 2016 | Q3YTD 2016 | Q4 2016 | FY 2016 | Q1 2017 | Q2 2017 | HY 2017 | Q3 2017 | Q3YTD 2017 | ||||||||||||||||||||||||||||||||||||
| Net forwarding revenue | 13072 | 12894 | 25965 | 12670 | 38635 | 13325 | 51960 | 12772 | 13549 | 26321 | 14334 | 40655 | r4 PAC Hamon Pierrick Referenced Value (value_1_PQACT02)1313Document Q3_2017_Quarter_Report13Chapter Consolidated Income Statement13Row ltlt Net forwarding revenue gtgt (ltlt 2017 gtgt q_act)13User Value 1433411124 Tsd | r4 PAC Hamon Pierrick Referenced Value (value_1_PQACTJAN02)1313Document Q3_2017_Quarter_Report13Chapter Consolidated Income Statement13Row ltlt Net forwarding revenue gtgt (ltlt 2017 gtgt q_act_jan)13User Value 4065500417 Tsd | -00 | -01 | -01 | |||||||||||||||||||||||||||||||
| Forwarding expenses | (9423) | (9180) | (18602) | (9116) | (27718) | (9996) | (37714) | (9445) | (10145) | (19590) | (10818) | (30407) | r5 PAC Hamon Pierrick Referenced Value (value_1_PQACT02)1313Document Q3_2017_Quarter_Report13Chapter Consolidated Income Statement13Row ltlt Forwarding services from third parties gtgt (ltlt 2017 gtgt q_act)13User Value -1081765298 Tsd | r5 PAC Hamon Pierrick Referenced Value (value_1_PQACTJAN02)1313Document Q3_2017_Quarter_Report13Chapter Consolidated Income Statement13Row ltlt Forwarding services from third parties gtgt (ltlt 2017 gtgt q_act_jan)13User Value -3040736424 Tsd | 00 | 01 | 01 | |||||||||||||||||||||||||||||||
| Gross profit | 3649 | 3714 | 7363 | 3554 | 10917 | 3329 | 14246 | 3327 | 3404 | 6731 | 3516 | 10248 | r6 PAC Hamon Pierrick Referenced Value (value_1_PQACT02)1313Document Q3_2017_Quarter_Report13Chapter Consolidated Income Statement13Row ltlt Gross profit gtgt (ltlt 2017 gtgt q_act)13User Value 351645826 Tsd | r6 PAC Hamon Pierrick Referenced Value (value_1_PQACTJAN02)1313Document Q3_2017_Quarter_Report13Chapter Consolidated Income Statement13Row ltlt Gross profit gtgt (ltlt 2017 gtgt q_act_jan)13User Value 1024763993 Tsd | 00 | 00 | 00 | |||||||||||||||||||||||||||||||
| Personnel expenses | (2250) | (2213) | (4463) | (2129) | (6592) | (2113) | (8705) | (2164) | (2162) | (4326) | (2186) | (6511) | r7 PAC Hamon Pierrick Referenced Value (value_1_PQACT02)1313Document Q3_2017_Quarter_Report13Chapter Consolidated Income Statement13Row ltlt Personnel expenses gtgt (ltlt 2017 gtgt q_act)13User Value -218561825 Tsd | r7 PAC Hamon Pierrick Referenced Value (value_1_PQACTJAN02)1313Document Q3_2017_Quarter_Report13Chapter Consolidated Income Statement13Row ltlt Personnel expenses gtgt (ltlt 2017 gtgt q_act_jan)13User Value -651090060 Tsd | 00 | 00 | 00 | |||||||||||||||||||||||||||||||
| Other operating expenses | (1037) | (1011) | (2047) | (971) | (3018) | (927) | (3945) | (893) | (880) | (1773) | (925) | (2698) | r8 PAC Hamon Pierrick Referenced Value (value_1_PQACT02)1313Document Q3_2017_Quarter_Report13Chapter Consolidated Income Statement13Row ltlt Other operating expenses gtgt (ltlt 2017 gtgt q_act)13User Value -92494218 Tsd | r8 PAC Hamon Pierrick Referenced Value (value_1_PQACTJAN02)1313Document Q3_2017_Quarter_Report13Chapter Consolidated Income Statement13Row ltlt Other operating expenses gtgt (ltlt 2017 gtgt q_act_jan)13User Value -269813050 Tsd | 00 | 01 | 01 | |||||||||||||||||||||||||||||||
| EBITDA adjusted | 362 | 491 | 853 | 454 | 1307 | 289 | 1596 | 271 | 362 | 633 | 406 | 1039 | r9 PAC Hamon Pierrick Referenced Value (value_1_PQACT02)1313Document Q3_2017_Quarter_Report13Chapter Consolidated Income Statement13Row ltlt EBITDA gtgt (ltlt 2017 gtgt q_act)13User Value 40589783 Tsd | r9 PAC Hamon Pierrick Referenced Value (value_1_PQACTJAN02)1313Document Q3_2017_Quarter_Report13Chapter Consolidated Income Statement13Row ltlt EBITDA gtgt (ltlt 2017 gtgt q_act_jan)13User Value 103860882 Tsd | -00 | 00 | 00 | |||||||||||||||||||||||||||||||
| Depreciation of property plant and equip | (62) | (62) | (125) | (62) | (187) | (71) | (258) | (53) | (54) | (107) | (50) | (156) | r10 PAC Hamon Pierrick Referenced Value (value_1_PQACT02)1313Document Q3_2017_Quarter_Report13Chapter Consolidated Income Statement13Row ltlt Depreciation of property plant and equipment gtgt (ltlt 2017 gtgt q_act)13User Value -4981553 Tsd | r10 PAC Hamon Pierrick Referenced Value (value_1_PQACTJAN02)1313Document Q3_2017_Quarter_Report13Chapter Consolidated Income Statement13Row ltlt Depreciation of property plant and equipment gtgt (ltlt 2017 gtgt q_act_jan)13User Value -15648388 Tsd | 00 | -01 | -01 | |||||||||||||||||||||||||||||||
| Amortization of intangible assets | (60) | (60) | (120) | (63) | (183) | (56) | (239) | (54) | (52) | (106) | (55) | (162) | r11 PAC Hamon Pierrick Referenced Value (value_1_PQACT02)1313Document Q3_2017_Quarter_Report13Chapter Consolidated Income Statement13Row ltlt Amortization of intangible assets gtgt (ltlt 2017 gtgt q_act)13User Value -5514918 Tsd | r11 PAC Hamon Pierrick Referenced Value (value_1_PQACTJAN02)1313Document Q3_2017_Quarter_Report13Chapter Consolidated Income Statement13Row ltlt Amortization of intangible assets gtgt (ltlt 2017 gtgt q_act_jan)13User Value -16157763 Tsd | -00 | 00 | 00 | |||||||||||||||||||||||||||||||
| EBIT adjusted | 240 | 368 | 608 | 329 | 936 | 163 | 1099 | 164 | 256 | 420 | 301 | 721 | r12 PAC Hamon Pierrick Referenced Value (value_1_PQACT02)1313Document Q3_2017_Quarter_Report13Chapter Consolidated Income Statement13Row ltlt Operating result (EBIT) gtgt (ltlt 2017 gtgt q_act)13User Value 30093312 Tsd | r12 PAC Hamon Pierrick Referenced Value (value_1_PQACTJAN02)1313Document Q3_2017_Quarter_Report13Chapter Consolidated Income Statement13Row ltlt Operating result (EBIT) gtgt (ltlt 2017 gtgt q_act_jan)13User Value 72054731 Tsd | -00 | 00 | -01 | |||||||||||||||||||||||||||||||
| in of gross profit | 66 | 99 | 83 | 92 | 86 | 49 | 77 | 49 | 75 | 62 | 86 | 70 | s13 | s13 | ||||||||||||||||||||||||||||||||||
| Non-recurring items | 00 | 00 | 00 | |||||||||||||||||||||||||||||||||||||||||||||
| Restructuring expenses | 00 | (261) | (261) | 00 | (261) | (19) | (280) | 00 | 00 | 00 | 00 | 00 | r15 PAC Hamon Pierrick Referenced Value (value_1_PQACT02)1313Document Q3_2017_Quarter_Report13Chapter Consolidated Income Statement13Row ltlt Restructuring expenses gtgt (ltlt 2017 gtgt q_act)13User Value 0000000 Tsd | r15 PAC Hamon Pierrick Referenced Value (value_1_PQACTJAN02)1313Document Q3_2017_Quarter_Report13Chapter Consolidated Income Statement13Row ltlt Restructuring expenses gtgt (ltlt 2017 gtgt q_act_jan)13User Value 0000000 Tsd | 00 | 00 | 00 | |||||||||||||||||||||||||||||||
| EBIT reported | 240 | 107 | 347 | 329 | 675 | 144 | 820 | 164 | 256 | 420 | 301 | 721 | s17 | s17 | -00 | 00 | 00 | |||||||||||||||||||||||||||||||
| in of gross profit | 66 | 29 | 47 | 92 | 62 | 43 | 58 | 49 | 75 | 62 | 86 | 70 | s18 | s18 | -01 | -00 | -02 | |||||||||||||||||||||||||||||||
| Financial result | (09) | 07 | (02) | (04) | (06) | 02 | (04) | 02 | 01 | 03 | (04) | (02) | r19 PAC Hamon Pierrick Referenced Value (value_1_PQACT02)1313Document Q3_2017_Quarter_Report13Chapter Consolidated Income Statement13130939883 Tsd - ltlt Finance income gtgt (ltlt 2017 gtgt q_act)13-1343957 Tsd - ltlt Finance costs gtgt (ltlt 2017 gtgt q_act)13---------------------13-0404074 Tsd (Total) | r19 PAC Hamon Pierrick Referenced Value (value_1_PQACTJAN02)1313Document Q3_2017_Quarter_Report13Chapter Consolidated Income Statement13133163726 Tsd - ltlt Finance income gtgt (ltlt 2017 gtgt q_act_jan)13-3315684 Tsd - ltlt Finance costs gtgt (ltlt 2017 gtgt q_act_jan)13---------------------13-0151958 Tsd (Total) | -00 | 00 | 00 | |||||||||||||||||||||||||||||||
| Earnings before taxes (EBT) | 231 | 114 | 345 | 325 | 670 | 146 | 816 | 165 | 257 | 422 | 297 | 719 | r20 PAC Hamon Pierrick Referenced Value (value_1_PQACT02)1313Document Q3_2017_Quarter_Report13Chapter Consolidated Income Statement13Row ltlt Profit before income tax (EBT) gtgt (ltlt 2017 gtgt q_act)13User Value 29689237 Tsd | r20 PAC Hamon Pierrick Referenced Value (value_1_PQACTJAN02)1313Document Q3_2017_Quarter_Report13Chapter Consolidated Income Statement13Row ltlt Profit before income tax (EBT) gtgt (ltlt 2017 gtgt q_act_jan)13User Value 71902773 Tsd | 00 | 00 | 00 | |||||||||||||||||||||||||||||||
| Income tax expenses | (58) | (69) | (126) | (79) | (205) | (88) | (293) | (42) | (81) | (123) | (112) | (235) | r21 PAC Hamon Pierrick Referenced Value (value_1_PQACT02)1313Document Q3_2017_Quarter_Report13Chapter Consolidated Income Statement13Row ltlt Income tax expenses gtgt (ltlt 2017 gtgt q_act)13User Value -8638414 Tsd | r21 PAC Hamon Pierrick Referenced Value (value_1_PQACTJAN02)1313Document Q3_2017_Quarter_Report13Chapter Consolidated Income Statement13Row ltlt Income tax expenses gtgt (ltlt 2017 gtgt q_act_jan)13User Value -20922552 Tsd | 00 | 01 | 01 | |||||||||||||||||||||||||||||||
| of EBT | 250 | 602 | 367 | 242 | 306 | 601 | 359 | 252 | 316 | 291 | 378 | 327 | s22 | s22 | ||||||||||||||||||||||||||||||||||
| Profit | 173 | 45 | 218 | 246 | 465 | 58 | 523 | 124 | 176 | 299 | 185 | 484 | r23 PAC Hamon Pierrick Referenced Value (value_1_PQACT02)1313Document Q3_2017_Quarter_Report13Chapter Consolidated Income Statement13Row ltlt Profit gtgt (ltlt 2017 gtgt q_act)13User Value 21050824 Tsd | r23 PAC Hamon Pierrick Referenced Value (value_1_PQACTJAN02)1313Document Q3_2017_Quarter_Report13Chapter Consolidated Income Statement13Row ltlt Profit gtgt (ltlt 2017 gtgt q_act_jan)13User Value 50980221 Tsd | -00 | 00 | 01 | |||||||||||||||||||||||||||||||
| Earnings per share | 075 | 021 | 096 | 106 | 201 | 027 | 229 | 054 | 075 | 129 | 079 | 208 | s24 PAC Serova Elena (External) Referenced Value (value_1_PQACTJAN02)1313Document Q2_2017_Quarter_Report13Chapter Consolidated Income Statement13Row ltlt Basic gtgt (ltlt 2017 gtgt q_act_jan)13User Value 0000540 Tsd | s24 PAC Serova Elena (External) Referenced Value (value_1_PQACTJAN02)1313Document Q2_2017_Quarter_Report13Chapter Consolidated Income Statement13Row ltlt Basic gtgt (ltlt 2017 gtgt q_act_jan)13User Value 0000540 Tsd | 00 | 00 | 00 | |||||||||||||||||||||||||||||||
| 0 | 0 | 46460419259 | 0 | 0 | 0 | 0 | m25 | m25 | 00 | 00 | ||||||||||||||||||||||||||||||||||||||
| Earnings per share 1000 | 0000788 | 0002078 | rf28 PAC Hamon Pierrick Referenced Value (value_1_PQACT02)1313Document Q3_2017_Quarter_Report13Chapter Consolidated Income Statement13Row ltlt Basic gtgt (ltlt 2017 gtgt q_act)13User Value 0000898 Tsd | rf28 PAC Hamon Pierrick Referenced Value (value_1_PQACTJAN02)1313Document Q3_2017_Quarter_Report13Chapter Consolidated Income Statement13Row ltlt Basic gtgt (ltlt 2017 gtgt q_act_jan)13User Value 0002188 Tsd | ||||||||||||||||||||||||||||||||||||||||||||
| Total Operating Expenses | (3111) | (9209) | s25 | s25 | ||||||||||||||||||||||||||||||||||||||||||||
| OOE YoY | ||||||||||||||||||||||||||||||||||||||||||||||||
| 042 |
| Q3 | |||||||||||||||||||
| GP | Q3 2016 | Q4 2016 | Q1 2017 | Q2 2017 | Q3 2017 | Gross profit | |||||||||||||
| 94 | 92 | 83 | 81 | 81 | r3 PAC Stuker Benjamin Referenced Value (value_3_PQACT02)1313Document Q3_2017_Investor amp AC presentations13Chapter 38 - IRAC Income statement per quarter - Logistics13Row Gross profit (value_1 q_act)13User Value 814848 Mio | Q3 2016 | 94 | ||||||||||||
| Q4 2016 | 92 | ||||||||||||||||||
| Q1 2017 | 83 | ||||||||||||||||||
| Q2 2017 | 81 | ||||||||||||||||||
| EBIT | 09 | 05 | 24 | 31 | 27 | r7 PAC Stuker Benjamin Referenced Value (value_3_PQACT02)1313Document Q3_2017_Investor amp AC presentations13Chapter 38 - IRAC Income statement per quarter - Logistics13Row EBIT reported (value_1 q_act)13User Value 27118 Mio | Q3 2017 | 81 | |||||||||||
| EBIT | |||||||||||||||||||
| Q3 2016 | 09 | ||||||||||||||||||
| Q4 2016 | 05 | ||||||||||||||||||
| Q1 2017 | 24 | ||||||||||||||||||
| Q2 2017 | 31 | ||||||||||||||||||
| Q3 2017 | 27 |
| 2017 | 2016 | ||||||||||||||||||||||||||||||||
| 2017 | 2016 | 2017 | |||||||||||||||||||||||||||||||
| YoY Growth | Q3 | Q4 | Q1 | Q2 | Q3 | Gross Profit EBIT | YTD | YTD | |||||||||||||||||||||||||
| Gross Profit | -6 | -11 | -16 | -19 | -14 | r5 PAC Stuker Benjamin Referenced Value (value_1_PQACT02)1313Document Q3_2017_Investor amp AC presentations13Chapter 38 - IRAC Income statement per quarter - Logistics13Row GP Change YoY (value_1 q_act)13User Value -01372 Mio | Gross Profit | 2933 | 24537 | -16 | r5 PAC Stuker Benjamin Referenced Value (value_2_PQACT02)1313Document Q3_2017_Quarter_Report13Chapter Products quater and year to date13Row ltlt Gross profit gtgt (ltlt value_3 gtgt q_act_jan)13User Value 24537 Tsd1313----------------------------------------------------------------------------------------1313Referenced Value (value_2_PQPRIOR02)1313Document Q3_2017_Investor amp AC presentations13Chapter 38 - IRAC Income statement per quarter - Logistics13Row Gross profit (value_1 q_prior_jan)13User Value 2933025 Mio | ||||||||||||||||||||||
| EBIT (adjusted PY) | 50 | 81 | 63 | rf7 PAC Stuker Benjamin Referenced Value (value_2_PQACT02)1313Document Q3_2017_Quarter_Report13Chapter Products quater and year to date13Row ltlt Operating result (EBIT) gtgt (ltlt value_3 gtgt q_act_jan)13User Value 815 Tsd1313----------------------------------------------------------------------------------------1313Referenced Value (value_2_PQPRIOR02)1313Document Q3_2017_Quarter_Report13Chapter Products quater and year to date13Row ltlt Operating result (Segment EBIT) adjusted gtgt (ltlt value_3 gtgt q_prior_jan)13User Value 501 Tsd | |||||||||||||||||||||||||||||
| NFR in of EBIT | 10 | 20 | m9 | ||||||||||||||||||||||||||||||
| NFR | 43888478 | 4057267 | rf8 PAC Stuker Benjamin Referenced Value (value_2_PQACT02)1313Document Q3_2017_Quarter_Report13Chapter Products quater and year to date13Row ltlt Net forwarding revenue gtgt (ltlt value_3 gtgt q_act_jan)13User Value 40573 Tsd1313----------------------------------------------------------------------------------------1313Referenced Value (value_2_PQPRIOR02)1313Document Q3_2017_Quarter_Report13Chapter Products quater and year to date13Row ltlt Net forwarding revenue gtgt (ltlt value_3 gtgt q_prior_jan)13User Value 43888 Tsd |
| Q3 | |||||||||||||||||||
| GP | Q3 2016 | Q4 2016 | Q1 2017 | Q2 2017 | Q3 2017 | Gross profit | |||||||||||||
| 94 | 92 | 83 | 81 | 81 | r3 PAC Stuker Benjamin Referenced Value (value_3_PQACT02)1313Document Q3_2017_Investor amp AC presentations13Chapter 38 - IRAC Income statement per quarter - Logistics13Row Gross profit (value_1 q_act)13User Value 814848 Mio | Q3 2016 | 94 | ||||||||||||
| Q4 2016 | 92 | ||||||||||||||||||
| Q1 2017 | 83 | ||||||||||||||||||
| Q2 2017 | 81 | ||||||||||||||||||
| EBIT | 09 | 05 | 24 | 31 | 27 | r7 PAC Stuker Benjamin Referenced Value (value_3_PQACT02)1313Document Q3_2017_Investor amp AC presentations13Chapter 38 - IRAC Income statement per quarter - Logistics13Row EBIT reported (value_1 q_act)13User Value 27118 Mio | Q3 2017 | 81 | |||||||||||
| EBIT | |||||||||||||||||||
| Q3 2016 | 09 | ||||||||||||||||||
| Q4 2016 | 05 | ||||||||||||||||||
| Q1 2017 | 24 | ||||||||||||||||||
| Q2 2017 | 31 | ||||||||||||||||||
| Q3 2017 | 27 |
| 2017 | 2016 | ||||||||||||||||||||||||||||||||
| 2017 | 2016 | 2017 | |||||||||||||||||||||||||||||||
| YoY Growth | Q3 | Q4 | Q1 | Q2 | Q3 | Gross Profit EBIT | YTD | YTD | |||||||||||||||||||||||||
| Gross Profit | -6 | -11 | -16 | -19 | -14 | r5 PAC Stuker Benjamin Referenced Value (value_1_PQACT02)1313Document Q3_2017_Investor amp AC presentations13Chapter 38 - IRAC Income statement per quarter - Logistics13Row GP Change YoY (value_1 q_act)13User Value -01372 Mio | Gross Profit | 2933 | 24537 | -16 | r5 PAC Stuker Benjamin Referenced Value (value_2_PQACT02)1313Document Q3_2017_Quarter_Report13Chapter Products quater and year to date13Row ltlt Gross profit gtgt (ltlt value_3 gtgt q_act_jan)13User Value 24537 Tsd1313----------------------------------------------------------------------------------------1313Referenced Value (value_2_PQPRIOR02)1313Document Q3_2017_Investor amp AC presentations13Chapter 38 - IRAC Income statement per quarter - Logistics13Row Gross profit (value_1 q_prior_jan)13User Value 2933025 Mio | ||||||||||||||||||||||
| EBIT (adjusted PY) | 50 | 81 | 63 | rf7 PAC Stuker Benjamin Referenced Value (value_2_PQACT02)1313Document Q3_2017_Quarter_Report13Chapter Products quater and year to date13Row ltlt Operating result (EBIT) gtgt (ltlt value_3 gtgt q_act_jan)13User Value 815 Tsd1313----------------------------------------------------------------------------------------1313Referenced Value (value_2_PQPRIOR02)1313Document Q3_2017_Quarter_Report13Chapter Products quater and year to date13Row ltlt Operating result (Segment EBIT) adjusted gtgt (ltlt value_3 gtgt q_prior_jan)13User Value 501 Tsd | |||||||||||||||||||||||||||||
| NFR in of EBIT | 10 | 20 | m9 | ||||||||||||||||||||||||||||||
| NFR | 43888478 | 4057267 | rf8 PAC Stuker Benjamin Referenced Value (value_2_PQACT02)1313Document Q3_2017_Quarter_Report13Chapter Products quater and year to date13Row ltlt Net forwarding revenue gtgt (ltlt value_3 gtgt q_act_jan)13User Value 40573 Tsd1313----------------------------------------------------------------------------------------1313Referenced Value (value_2_PQPRIOR02)1313Document Q3_2017_Quarter_Report13Chapter Products quater and year to date13Row ltlt Net forwarding revenue gtgt (ltlt value_3 gtgt q_prior_jan)13User Value 43888 Tsd |
| Q3 | |||||||||||||||||||
| GP | Q3 2016 | Q4 2016 | Q1 2017 | Q2 2017 | Q3 2017 | Gross profit | |||||||||||||
| 94 | 92 | 83 | 81 | 81 | r3 PAC Stuker Benjamin Referenced Value (value_3_PQACT02)1313Document Q3_2017_Investor amp AC presentations13Chapter 38 - IRAC Income statement per quarter - Logistics13Row Gross profit (value_1 q_act)13User Value 814848 Mio | Q3 2016 | 94 | ||||||||||||
| Q4 2016 | 92 | ||||||||||||||||||
| Q1 2017 | 83 | ||||||||||||||||||
| Q2 2017 | 81 | ||||||||||||||||||
| EBIT | 09 | 05 | 24 | 31 | 27 | r7 PAC Stuker Benjamin Referenced Value (value_3_PQACT02)1313Document Q3_2017_Investor amp AC presentations13Chapter 38 - IRAC Income statement per quarter - Logistics13Row EBIT reported (value_1 q_act)13User Value 27118 Mio | Q3 2017 | 81 | |||||||||||
| EBIT | |||||||||||||||||||
| Q3 2016 | 09 | ||||||||||||||||||
| Q4 2016 | 05 | ||||||||||||||||||
| Q1 2017 | 24 | ||||||||||||||||||
| Q2 2017 | 31 | ||||||||||||||||||
| Q3 2017 | 27 |
| 2017 | 2016 | ||||||||||||||||||||||||||||||||
| 2017 | 2016 | 2017 | |||||||||||||||||||||||||||||||
| YoY Growth | Q3 | Q4 | Q1 | Q2 | Q3 | Gross Profit EBIT | YTD | YTD | |||||||||||||||||||||||||
| Gross Profit | -6 | -11 | -16 | -19 | -14 | r5 PAC Stuker Benjamin Referenced Value (value_1_PQACT02)1313Document Q3_2017_Investor amp AC presentations13Chapter 38 - IRAC Income statement per quarter - Logistics13Row GP Change YoY (value_1 q_act)13User Value -01372 Mio | Gross Profit | 2933 | 24537 | -16 | r5 PAC Stuker Benjamin Referenced Value (value_2_PQACT02)1313Document Q3_2017_Quarter_Report13Chapter Products quater and year to date13Row ltlt Gross profit gtgt (ltlt value_3 gtgt q_act_jan)13User Value 24537 Tsd1313----------------------------------------------------------------------------------------1313Referenced Value (value_2_PQPRIOR02)1313Document Q3_2017_Investor amp AC presentations13Chapter 38 - IRAC Income statement per quarter - Logistics13Row Gross profit (value_1 q_prior_jan)13User Value 2933025 Mio | ||||||||||||||||||||||
| EBIT (adjusted PY) | 50 | 81 | 63 | rf7 PAC Stuker Benjamin Referenced Value (value_2_PQACT02)1313Document Q3_2017_Quarter_Report13Chapter Products quater and year to date13Row ltlt Operating result (EBIT) gtgt (ltlt value_3 gtgt q_act_jan)13User Value 815 Tsd1313----------------------------------------------------------------------------------------1313Referenced Value (value_2_PQPRIOR02)1313Document Q3_2017_Quarter_Report13Chapter Products quater and year to date13Row ltlt Operating result (Segment EBIT) adjusted gtgt (ltlt value_3 gtgt q_prior_jan)13User Value 501 Tsd | |||||||||||||||||||||||||||||
| NFR in of EBIT | 10 | 20 | m9 | ||||||||||||||||||||||||||||||
| NFR | 43888478 | 4057267 | rf8 PAC Stuker Benjamin Referenced Value (value_2_PQACT02)1313Document Q3_2017_Quarter_Report13Chapter Products quater and year to date13Row ltlt Net forwarding revenue gtgt (ltlt value_3 gtgt q_act_jan)13User Value 40573 Tsd1313----------------------------------------------------------------------------------------1313Referenced Value (value_2_PQPRIOR02)1313Document Q3_2017_Quarter_Report13Chapter Products quater and year to date13Row ltlt Net forwarding revenue gtgt (ltlt value_3 gtgt q_prior_jan)13User Value 43888 Tsd |
| Q3 | |||||||||||||||||||
| GP | Q3 2016 | Q4 2016 | Q1 2017 | Q2 2017 | Q3 2017 | Gross profit | |||||||||||||
| 94 | 92 | 83 | 81 | 81 | r3 PAC Stuker Benjamin Referenced Value (value_3_PQACT02)1313Document Q3_2017_Investor amp AC presentations13Chapter 38 - IRAC Income statement per quarter - Logistics13Row Gross profit (value_1 q_act)13User Value 814848 Mio | Q3 2016 | 94 | ||||||||||||
| Q4 2016 | 92 | ||||||||||||||||||
| Q1 2017 | 83 | ||||||||||||||||||
| Q2 2017 | 81 | ||||||||||||||||||
| EBIT | 09 | 05 | 24 | 31 | 27 | r7 PAC Stuker Benjamin Referenced Value (value_3_PQACT02)1313Document Q3_2017_Investor amp AC presentations13Chapter 38 - IRAC Income statement per quarter - Logistics13Row EBIT reported (value_1 q_act)13User Value 27118 Mio | Q3 2017 | 81 | |||||||||||
| EBIT | |||||||||||||||||||
| Q3 2016 | 09 | ||||||||||||||||||
| Q4 2016 | 05 | ||||||||||||||||||
| Q1 2017 | 24 | ||||||||||||||||||
| Q2 2017 | 31 | ||||||||||||||||||
| Q3 2017 | 27 |
| 2017 | 2016 | ||||||||||||||||||||||||||||||||
| 2017 | 2016 | 2017 | |||||||||||||||||||||||||||||||
| YoY Growth | Q3 | Q4 | Q1 | Q2 | Q3 | Gross Profit EBIT | YTD | YTD | |||||||||||||||||||||||||
| Gross Profit | -6 | -11 | -16 | -19 | -14 | r5 PAC Stuker Benjamin Referenced Value (value_1_PQACT02)1313Document Q3_2017_Investor amp AC presentations13Chapter 38 - IRAC Income statement per quarter - Logistics13Row GP Change YoY (value_1 q_act)13User Value -01372 Mio | Gross Profit | 2933 | 24537 | -16 | r5 PAC Stuker Benjamin Referenced Value (value_2_PQACT02)1313Document Q3_2017_Quarter_Report13Chapter Products quater and year to date13Row ltlt Gross profit gtgt (ltlt value_3 gtgt q_act_jan)13User Value 24537 Tsd1313----------------------------------------------------------------------------------------1313Referenced Value (value_2_PQPRIOR02)1313Document Q3_2017_Investor amp AC presentations13Chapter 38 - IRAC Income statement per quarter - Logistics13Row Gross profit (value_1 q_prior_jan)13User Value 2933025 Mio | ||||||||||||||||||||||
| EBIT (adjusted PY) | 50 | 81 | 63 | rf7 PAC Stuker Benjamin Referenced Value (value_2_PQACT02)1313Document Q3_2017_Quarter_Report13Chapter Products quater and year to date13Row ltlt Operating result (EBIT) gtgt (ltlt value_3 gtgt q_act_jan)13User Value 815 Tsd1313----------------------------------------------------------------------------------------1313Referenced Value (value_2_PQPRIOR02)1313Document Q3_2017_Quarter_Report13Chapter Products quater and year to date13Row ltlt Operating result (Segment EBIT) adjusted gtgt (ltlt value_3 gtgt q_prior_jan)13User Value 501 Tsd | |||||||||||||||||||||||||||||
| NFR in of EBIT | 10 | 20 | m9 | ||||||||||||||||||||||||||||||
| NFR | 43888478 | 4057267 | rf8 PAC Stuker Benjamin Referenced Value (value_2_PQACT02)1313Document Q3_2017_Quarter_Report13Chapter Products quater and year to date13Row ltlt Net forwarding revenue gtgt (ltlt value_3 gtgt q_act_jan)13User Value 40573 Tsd1313----------------------------------------------------------------------------------------1313Referenced Value (value_2_PQPRIOR02)1313Document Q3_2017_Quarter_Report13Chapter Products quater and year to date13Row ltlt Net forwarding revenue gtgt (ltlt value_3 gtgt q_prior_jan)13User Value 43888 Tsd |
| Q3 | ||||||||||||||||||||||||||
| TEU | Q3 2016 | Q4 2016 | Q1 2017 | Q2 2017 | Q3 2017 | TEU | ||||||||||||||||||||
| 379 | 389 | 374 | 3828 | 386 | m3 | r3 PAC Monaco Salvatore Referenced Value (value_3_PQACT02)1313Document Q3_2017_Investor amp AC presentations13Chapter 37 - IRAC Income statement per quarter - Ocean Freight13Row Ocean Freight volumes (000 tons) (value_1 q_act)13User Value 3856050 Mio | Q3 2016 | 379 | 296 | |||||||||||||||||
| 296 | 254 | 282 | 285 | 282 | m4 | r4 PAC Monaco Salvatore Referenced Value (value_3_PQACT02)1313Document Q3_2017_Investor amp AC presentations13Chapter 37 - IRAC Income statement per quarter - Ocean Freight13Row GPTEU (CHF) (value_1 q_act)13User Value 2820750 Mio | Q4 2016 | 389 | 254 | |||||||||||||||||
| Q1 2017 | 374 | 282 | ||||||||||||||||||||||||
| Q2 2017 | 383 | 285 | ||||||||||||||||||||||||
| EBIT | 51 | -51 | -32 | 06 | -29 | m7 | r10 PAC Monaco Salvatore Referenced Value (value_3_PQACT02)1313Document Q3_2017_Investor amp AC presentations13Chapter 37 - IRAC Income statement per quarter - Ocean Freight13Row EBIT reported (value_1 q_act)13User Value -29490 Mio | Q3 2017 | 386 | 282 | ||||||||||||||||
| 45 | -51 | -3 | 06 | -003 | m8 | r8 PAC Monaco Salvatore Referenced Value (value_3_PQACT02)1313Document Q3_2017_Investor amp AC presentations13Chapter 37 - IRAC Income statement per quarter - Ocean Freight13Row in of gross profit (value_1 q_act)13User Value -00271 Mio | ||||||||||||||||||||
PAC Hamon Pierrick Invalid Reference (value_3_PQACT02) 1313Reference could not be handled13Underlying Formula | EBIT | EBIT | EBIT GP | |||||||||||||||||||||||
| 0 | -00271 | r11 PAC Monaco Salvatore Referenced Value (value_3_PQACT02)1313Document Q3_2017_Investor amp AC presentations13Chapter 37 - IRAC Income statement per quarter - Ocean Freight13Row in of gross profit (value_1 q_act)13User Value -00271 Mio | PAC Monaco Salvatore Referenced Value (value_3_PQACT02)1313Document Q3_2017_Investor amp AC presentations13Chapter 37 - IRAC Income statement per quarter - Ocean Freight13Row Ocean Freight volumes (000 tons) (value_1 q_act)13User Value 3856050 Mio | PAC Monaco Salvatore Referenced Value (value_3_PQACT02)1313Document Q3_2017_Investor amp AC presentations13Chapter 37 - IRAC Income statement per quarter - Ocean Freight13Row GPTEU (CHF) (value_1 q_act)13User Value 2820750 Mio | PAC Monaco Salvatore Referenced Value (value_3_PQACT02)1313Document Q3_2017_Investor amp AC presentations13Chapter 37 - IRAC Income statement per quarter - Ocean Freight13Row EBIT reported (value_1 q_act)13User Value -29490 Mio | PAC Monaco Salvatore Referenced Value (value_3_PQACT02)1313Document Q3_2017_Investor amp AC presentations13Chapter 37 - IRAC Income statement per quarter - Ocean Freight13Row in of gross profit (value_1 q_act)13User Value -00271 Mio | Q3 2016 | 51 | 45 | |||||||||||||||||
| Q4 2016 | -51 | -51 | ||||||||||||||||||||||||
| Q1 2017 | -32 | -30 | ||||||||||||||||||||||||
| Q2 2017 | 06 | 06 | ||||||||||||||||||||||||
| Q3 2017 | -29 | -27 |
| 2017 | 2016 | |||||||||||||||||||||||||||||||||||||||||||||
| 2017 | 2016 | 2017 | ||||||||||||||||||||||||||||||||||||||||||||
| YoY Growth | Q3 | Q4 | Q1 | Q2 | Q3 | Gross Profit EBIT | YTD | YTD | ||||||||||||||||||||||||||||||||||||||
| Volume (market estimated) | 0 | 3 | 4 | 3 | 3 | m5 | Gross Profit | 3450 | 3234 | -6 | r5 PAC Monaco Salvatore Referenced Value (value_2_PQACT02)1313Document Q3_2017_Investor amp AC presentations13Chapter 37 - IRAC Income statement per quarter - Ocean Freight13Row Gross profit (value_1 q_act_jan)13User Value 3233667 Mio1313----------------------------------------------------------------------------------------1313Referenced Value (value_2_PQPRIOR02)1313Document Q3_2017_Investor amp AC presentations13Chapter 37 - IRAC Income statement per quarter - Ocean Freight13Row Gross profit (value_1 q_prior_jan)13User Value 3450353 Mio | |||||||||||||||||||||||||||||||||||
| Volume (Panalpina) | -9 | 1 | 7 | 3 | 2 | r6 PAC Monaco Salvatore Referenced Value (value_1_PQACT02)1313Document Q3_2017_Investor amp AC presentations13Chapter 37 - IRAC Income statement per quarter - Ocean Freight13Row change YoY (value_1 q_act)13User Value 00182 Mio | EBIT (adjusted PY) | 160 | -55 | -135 | r6 PAC Monaco Salvatore Referenced Value (value_2_PQACT02)1313Document Q3_2017_Investor amp AC presentations13Chapter 37 - IRAC Income statement per quarter - Ocean Freight13Row EBIT adjusted (value_1 q_act_jan)13User Value -55208 Mio1313----------------------------------------------------------------------------------------1313Referenced Value (value_2_PQPRIOR02)1313Document Q3_2017_Investor amp AC presentations13Chapter 37 - IRAC Income statement per quarter - Ocean Freight13Row EBIT adjusted (value_1 q_prior_jan)13User Value 159801 Mio | |||||||||||||||||||||||||||||||||||
| GPTEU | -2 | -18 | -17 | -7 | -5 | r7 PAC Monaco Salvatore Referenced Value (value_1_PQACT02)1313Document Q3_2017_Investor amp AC presentations13Chapter 37 - IRAC Income statement per quarter - Ocean Freight13Row change YoY (value_1 q_act)13User Value -00471 Mio | EBITGP () | 46 | -17 | r7 PAC Monaco Salvatore Referenced Value (value_2_PQACT02)1313Document Q3_2017_Investor amp AC presentations13Chapter 37 - IRAC Income statement per quarter - Ocean Freight13Row in of gross profit (value_1 q_act_jan)13User Value -00171 Mio1313----------------------------------------------------------------------------------------1313Referenced Value (value_2_PQPRIOR02)1313Document Q3_2017_Investor amp AC presentations13Chapter 37 - IRAC Income statement per quarter - Ocean Freight13Row in of gross profit (value_1 q_prior_jan)13User Value 00463 Mio | ||||||||||||||||||||||||||||||||||||
| Gross Profit | -10 | -16 | -11 | -5 | -3 | r8 PAC Monaco Salvatore Referenced Value (value_1_PQACT02)1313Document Q3_2017_Investor amp AC presentations13Chapter 37 - IRAC Income statement per quarter - Ocean Freight13Row GP change YoY (value_1 q_act)13User Value -00298 Mio | PAC Monaco Salvatore Referenced Value (value_2_PQACT02)1313Document Q3_2017_Investor amp AC presentations13Chapter 37 - IRAC Income statement per quarter - Ocean Freight13Row Gross profit (value_1 q_act_jan)13User Value 3233667 Mio1313----------------------------------------------------------------------------------------1313Referenced Value (value_2_PQPRIOR02)1313Document Q3_2017_Investor amp AC presentations13Chapter 37 - IRAC Income statement per quarter - Ocean Freight13Row Gross profit (value_1 q_prior_jan)13User Value 3450353 Mio | PAC Monaco Salvatore Referenced Value (value_2_PQACT02)1313Document Q3_2017_Investor amp AC presentations13Chapter 37 - IRAC Income statement per quarter - Ocean Freight13Row EBIT adjusted (value_1 q_act_jan)13User Value -55208 Mio1313----------------------------------------------------------------------------------------1313Referenced Value (value_2_PQPRIOR02)1313Document Q3_2017_Investor amp AC presentations13Chapter 37 - IRAC Income statement per quarter - Ocean Freight13Row EBIT adjusted (value_1 q_prior_jan)13User Value 159801 Mio | PAC Monaco Salvatore Referenced Value (value_2_PQACT02)1313Document Q3_2017_Investor amp AC presentations13Chapter 37 - IRAC Income statement per quarter - Ocean Freight13Row in of gross profit (value_1 q_act_jan)13User Value -00171 Mio1313----------------------------------------------------------------------------------------1313Referenced Value (value_2_PQPRIOR02)1313Document Q3_2017_Investor amp AC presentations13Chapter 37 - IRAC Income statement per quarter - Ocean Freight13Row in of gross profit (value_1 q_prior_jan)13User Value 00463 Mio | Volumes (TEUs 000) | 10995 | 11426 | 4 | r8 PAC Monaco Salvatore Referenced Value (value_2_PQACT02)1313Document Q3_2017_Investor amp AC presentations13Chapter 37 - IRAC Income statement per quarter - Ocean Freight13Row Ocean Freight volumes (000 tons) (value_1 q_act_jan)13User Value 11426050 Mio1313----------------------------------------------------------------------------------------1313Referenced Value (value_2_PQPRIOR02)1313Document Q3_2017_Investor amp AC presentations13Chapter 37 - IRAC Income statement per quarter - Ocean Freight13Row Ocean Freight volumes (000 tons) (value_1 q_prior_jan)13User Value 10994918 Mio |
| Q3 | ||||||||||||||||||||||||||
| TEU | Q3 2016 | Q4 2016 | Q1 2017 | Q2 2017 | Q3 2017 | TEU | ||||||||||||||||||||
| 379 | 389 | 374 | 3828 | 386 | m3 | r3 PAC Monaco Salvatore Referenced Value (value_3_PQACT02)1313Document Q3_2017_Investor amp AC presentations13Chapter 37 - IRAC Income statement per quarter - Ocean Freight13Row Ocean Freight volumes (000 tons) (value_1 q_act)13User Value 3856050 Mio | Q3 2016 | 379 | 296 | |||||||||||||||||
| 296 | 254 | 282 | 285 | 282 | m4 | r4 PAC Monaco Salvatore Referenced Value (value_3_PQACT02)1313Document Q3_2017_Investor amp AC presentations13Chapter 37 - IRAC Income statement per quarter - Ocean Freight13Row GPTEU (CHF) (value_1 q_act)13User Value 2820750 Mio | Q4 2016 | 389 | 254 | |||||||||||||||||
| Q1 2017 | 374 | 282 | ||||||||||||||||||||||||
| Q2 2017 | 383 | 285 | ||||||||||||||||||||||||
| EBIT | 51 | -51 | -32 | 06 | -29 | m7 | r10 PAC Monaco Salvatore Referenced Value (value_3_PQACT02)1313Document Q3_2017_Investor amp AC presentations13Chapter 37 - IRAC Income statement per quarter - Ocean Freight13Row EBIT reported (value_1 q_act)13User Value -29490 Mio | Q3 2017 | 386 | 282 | ||||||||||||||||
| 45 | -51 | -3 | 06 | -003 | m8 | r8 PAC Monaco Salvatore Referenced Value (value_3_PQACT02)1313Document Q3_2017_Investor amp AC presentations13Chapter 37 - IRAC Income statement per quarter - Ocean Freight13Row in of gross profit (value_1 q_act)13User Value -00271 Mio | ||||||||||||||||||||
PAC Hamon Pierrick Invalid Reference (value_3_PQACT02) 1313Reference could not be handled13Underlying Formula | EBIT | EBIT | EBIT GP | |||||||||||||||||||||||
| 0 | -00271 | r11 PAC Monaco Salvatore Referenced Value (value_3_PQACT02)1313Document Q3_2017_Investor amp AC presentations13Chapter 37 - IRAC Income statement per quarter - Ocean Freight13Row in of gross profit (value_1 q_act)13User Value -00271 Mio | PAC Monaco Salvatore Referenced Value (value_3_PQACT02)1313Document Q3_2017_Investor amp AC presentations13Chapter 37 - IRAC Income statement per quarter - Ocean Freight13Row Ocean Freight volumes (000 tons) (value_1 q_act)13User Value 3856050 Mio | PAC Monaco Salvatore Referenced Value (value_3_PQACT02)1313Document Q3_2017_Investor amp AC presentations13Chapter 37 - IRAC Income statement per quarter - Ocean Freight13Row GPTEU (CHF) (value_1 q_act)13User Value 2820750 Mio | PAC Monaco Salvatore Referenced Value (value_3_PQACT02)1313Document Q3_2017_Investor amp AC presentations13Chapter 37 - IRAC Income statement per quarter - Ocean Freight13Row EBIT reported (value_1 q_act)13User Value -29490 Mio | PAC Monaco Salvatore Referenced Value (value_3_PQACT02)1313Document Q3_2017_Investor amp AC presentations13Chapter 37 - IRAC Income statement per quarter - Ocean Freight13Row in of gross profit (value_1 q_act)13User Value -00271 Mio | Q3 2016 | 51 | 45 | |||||||||||||||||
| Q4 2016 | -51 | -51 | ||||||||||||||||||||||||
| Q1 2017 | -32 | -30 | ||||||||||||||||||||||||
| Q2 2017 | 06 | 06 | ||||||||||||||||||||||||
| Q3 2017 | -29 | -27 |
| 2017 | 2016 | |||||||||||||||||||||||||||||||||||||||||||||
| 2017 | 2016 | 2017 | ||||||||||||||||||||||||||||||||||||||||||||
| YoY Growth | Q3 | Q4 | Q1 | Q2 | Q3 | Gross Profit EBIT | YTD | YTD | ||||||||||||||||||||||||||||||||||||||
| Volume (market estimated) | 0 | 3 | 4 | 3 | 3 | m5 | Gross Profit | 3450 | 3234 | -6 | r5 PAC Monaco Salvatore Referenced Value (value_2_PQACT02)1313Document Q3_2017_Investor amp AC presentations13Chapter 37 - IRAC Income statement per quarter - Ocean Freight13Row Gross profit (value_1 q_act_jan)13User Value 3233667 Mio1313----------------------------------------------------------------------------------------1313Referenced Value (value_2_PQPRIOR02)1313Document Q3_2017_Investor amp AC presentations13Chapter 37 - IRAC Income statement per quarter - Ocean Freight13Row Gross profit (value_1 q_prior_jan)13User Value 3450353 Mio | |||||||||||||||||||||||||||||||||||
| Volume (Panalpina) | -9 | 1 | 7 | 3 | 2 | r6 PAC Monaco Salvatore Referenced Value (value_1_PQACT02)1313Document Q3_2017_Investor amp AC presentations13Chapter 37 - IRAC Income statement per quarter - Ocean Freight13Row change YoY (value_1 q_act)13User Value 00182 Mio | EBIT (adjusted PY) | 160 | -55 | -135 | r6 PAC Monaco Salvatore Referenced Value (value_2_PQACT02)1313Document Q3_2017_Investor amp AC presentations13Chapter 37 - IRAC Income statement per quarter - Ocean Freight13Row EBIT adjusted (value_1 q_act_jan)13User Value -55208 Mio1313----------------------------------------------------------------------------------------1313Referenced Value (value_2_PQPRIOR02)1313Document Q3_2017_Investor amp AC presentations13Chapter 37 - IRAC Income statement per quarter - Ocean Freight13Row EBIT adjusted (value_1 q_prior_jan)13User Value 159801 Mio | |||||||||||||||||||||||||||||||||||
| GPTEU | -2 | -18 | -17 | -7 | -5 | r7 PAC Monaco Salvatore Referenced Value (value_1_PQACT02)1313Document Q3_2017_Investor amp AC presentations13Chapter 37 - IRAC Income statement per quarter - Ocean Freight13Row change YoY (value_1 q_act)13User Value -00471 Mio | EBITGP () | 46 | -17 | r7 PAC Monaco Salvatore Referenced Value (value_2_PQACT02)1313Document Q3_2017_Investor amp AC presentations13Chapter 37 - IRAC Income statement per quarter - Ocean Freight13Row in of gross profit (value_1 q_act_jan)13User Value -00171 Mio1313----------------------------------------------------------------------------------------1313Referenced Value (value_2_PQPRIOR02)1313Document Q3_2017_Investor amp AC presentations13Chapter 37 - IRAC Income statement per quarter - Ocean Freight13Row in of gross profit (value_1 q_prior_jan)13User Value 00463 Mio | ||||||||||||||||||||||||||||||||||||
| Gross Profit | -10 | -16 | -11 | -5 | -3 | r8 PAC Monaco Salvatore Referenced Value (value_1_PQACT02)1313Document Q3_2017_Investor amp AC presentations13Chapter 37 - IRAC Income statement per quarter - Ocean Freight13Row GP change YoY (value_1 q_act)13User Value -00298 Mio | PAC Monaco Salvatore Referenced Value (value_2_PQACT02)1313Document Q3_2017_Investor amp AC presentations13Chapter 37 - IRAC Income statement per quarter - Ocean Freight13Row Gross profit (value_1 q_act_jan)13User Value 3233667 Mio1313----------------------------------------------------------------------------------------1313Referenced Value (value_2_PQPRIOR02)1313Document Q3_2017_Investor amp AC presentations13Chapter 37 - IRAC Income statement per quarter - Ocean Freight13Row Gross profit (value_1 q_prior_jan)13User Value 3450353 Mio | PAC Monaco Salvatore Referenced Value (value_2_PQACT02)1313Document Q3_2017_Investor amp AC presentations13Chapter 37 - IRAC Income statement per quarter - Ocean Freight13Row EBIT adjusted (value_1 q_act_jan)13User Value -55208 Mio1313----------------------------------------------------------------------------------------1313Referenced Value (value_2_PQPRIOR02)1313Document Q3_2017_Investor amp AC presentations13Chapter 37 - IRAC Income statement per quarter - Ocean Freight13Row EBIT adjusted (value_1 q_prior_jan)13User Value 159801 Mio | PAC Monaco Salvatore Referenced Value (value_2_PQACT02)1313Document Q3_2017_Investor amp AC presentations13Chapter 37 - IRAC Income statement per quarter - Ocean Freight13Row in of gross profit (value_1 q_act_jan)13User Value -00171 Mio1313----------------------------------------------------------------------------------------1313Referenced Value (value_2_PQPRIOR02)1313Document Q3_2017_Investor amp AC presentations13Chapter 37 - IRAC Income statement per quarter - Ocean Freight13Row in of gross profit (value_1 q_prior_jan)13User Value 00463 Mio | Volumes (TEUs 000) | 10995 | 11426 | 4 | r8 PAC Monaco Salvatore Referenced Value (value_2_PQACT02)1313Document Q3_2017_Investor amp AC presentations13Chapter 37 - IRAC Income statement per quarter - Ocean Freight13Row Ocean Freight volumes (000 tons) (value_1 q_act_jan)13User Value 11426050 Mio1313----------------------------------------------------------------------------------------1313Referenced Value (value_2_PQPRIOR02)1313Document Q3_2017_Investor amp AC presentations13Chapter 37 - IRAC Income statement per quarter - Ocean Freight13Row Ocean Freight volumes (000 tons) (value_1 q_prior_jan)13User Value 10994918 Mio |
| Q3 | ||||||||||||||||||||||||||
| TEU | Q3 2016 | Q4 2016 | Q1 2017 | Q2 2017 | Q3 2017 | TEU | ||||||||||||||||||||
| 379 | 389 | 374 | 3828 | 386 | m3 | r3 PAC Monaco Salvatore Referenced Value (value_3_PQACT02)1313Document Q3_2017_Investor amp AC presentations13Chapter 37 - IRAC Income statement per quarter - Ocean Freight13Row Ocean Freight volumes (000 tons) (value_1 q_act)13User Value 3856050 Mio | Q3 2016 | 379 | 296 | |||||||||||||||||
| 296 | 254 | 282 | 285 | 282 | m4 | r4 PAC Monaco Salvatore Referenced Value (value_3_PQACT02)1313Document Q3_2017_Investor amp AC presentations13Chapter 37 - IRAC Income statement per quarter - Ocean Freight13Row GPTEU (CHF) (value_1 q_act)13User Value 2820750 Mio | Q4 2016 | 389 | 254 | |||||||||||||||||
| Q1 2017 | 374 | 282 | ||||||||||||||||||||||||
| Q2 2017 | 383 | 285 | ||||||||||||||||||||||||
| EBIT | 51 | -51 | -32 | 06 | -29 | m7 | r10 PAC Monaco Salvatore Referenced Value (value_3_PQACT02)1313Document Q3_2017_Investor amp AC presentations13Chapter 37 - IRAC Income statement per quarter - Ocean Freight13Row EBIT reported (value_1 q_act)13User Value -29490 Mio | Q3 2017 | 386 | 282 | ||||||||||||||||
| 45 | -51 | -3 | 06 | -003 | m8 | r8 PAC Monaco Salvatore Referenced Value (value_3_PQACT02)1313Document Q3_2017_Investor amp AC presentations13Chapter 37 - IRAC Income statement per quarter - Ocean Freight13Row in of gross profit (value_1 q_act)13User Value -00271 Mio | ||||||||||||||||||||
PAC Hamon Pierrick Invalid Reference (value_3_PQACT02) 1313Reference could not be handled13Underlying Formula | EBIT | EBIT | EBIT GP | |||||||||||||||||||||||
| 0 | -00271 | r11 PAC Monaco Salvatore Referenced Value (value_3_PQACT02)1313Document Q3_2017_Investor amp AC presentations13Chapter 37 - IRAC Income statement per quarter - Ocean Freight13Row in of gross profit (value_1 q_act)13User Value -00271 Mio | PAC Monaco Salvatore Referenced Value (value_3_PQACT02)1313Document Q3_2017_Investor amp AC presentations13Chapter 37 - IRAC Income statement per quarter - Ocean Freight13Row Ocean Freight volumes (000 tons) (value_1 q_act)13User Value 3856050 Mio | PAC Monaco Salvatore Referenced Value (value_3_PQACT02)1313Document Q3_2017_Investor amp AC presentations13Chapter 37 - IRAC Income statement per quarter - Ocean Freight13Row GPTEU (CHF) (value_1 q_act)13User Value 2820750 Mio | PAC Monaco Salvatore Referenced Value (value_3_PQACT02)1313Document Q3_2017_Investor amp AC presentations13Chapter 37 - IRAC Income statement per quarter - Ocean Freight13Row EBIT reported (value_1 q_act)13User Value -29490 Mio | PAC Monaco Salvatore Referenced Value (value_3_PQACT02)1313Document Q3_2017_Investor amp AC presentations13Chapter 37 - IRAC Income statement per quarter - Ocean Freight13Row in of gross profit (value_1 q_act)13User Value -00271 Mio | Q3 2016 | 51 | 45 | |||||||||||||||||
| Q4 2016 | -51 | -51 | ||||||||||||||||||||||||
| Q1 2017 | -32 | -30 | ||||||||||||||||||||||||
| Q2 2017 | 06 | 06 | ||||||||||||||||||||||||
| Q3 2017 | -29 | -27 |
| 2017 | 2016 | |||||||||||||||||||||||||||||||||||||||||||||
| 2017 | 2016 | 2017 | ||||||||||||||||||||||||||||||||||||||||||||
| YoY Growth | Q3 | Q4 | Q1 | Q2 | Q3 | Gross Profit EBIT | YTD | YTD | ||||||||||||||||||||||||||||||||||||||
| Volume (market estimated) | 0 | 3 | 4 | 3 | 3 | m5 | Gross Profit | 3450 | 3234 | -6 | r5 PAC Monaco Salvatore Referenced Value (value_2_PQACT02)1313Document Q3_2017_Investor amp AC presentations13Chapter 37 - IRAC Income statement per quarter - Ocean Freight13Row Gross profit (value_1 q_act_jan)13User Value 3233667 Mio1313----------------------------------------------------------------------------------------1313Referenced Value (value_2_PQPRIOR02)1313Document Q3_2017_Investor amp AC presentations13Chapter 37 - IRAC Income statement per quarter - Ocean Freight13Row Gross profit (value_1 q_prior_jan)13User Value 3450353 Mio | |||||||||||||||||||||||||||||||||||
| Volume (Panalpina) | -9 | 1 | 7 | 3 | 2 | r6 PAC Monaco Salvatore Referenced Value (value_1_PQACT02)1313Document Q3_2017_Investor amp AC presentations13Chapter 37 - IRAC Income statement per quarter - Ocean Freight13Row change YoY (value_1 q_act)13User Value 00182 Mio | EBIT (adjusted PY) | 160 | -55 | -135 | r6 PAC Monaco Salvatore Referenced Value (value_2_PQACT02)1313Document Q3_2017_Investor amp AC presentations13Chapter 37 - IRAC Income statement per quarter - Ocean Freight13Row EBIT adjusted (value_1 q_act_jan)13User Value -55208 Mio1313----------------------------------------------------------------------------------------1313Referenced Value (value_2_PQPRIOR02)1313Document Q3_2017_Investor amp AC presentations13Chapter 37 - IRAC Income statement per quarter - Ocean Freight13Row EBIT adjusted (value_1 q_prior_jan)13User Value 159801 Mio | |||||||||||||||||||||||||||||||||||
| GPTEU | -2 | -18 | -17 | -7 | -5 | r7 PAC Monaco Salvatore Referenced Value (value_1_PQACT02)1313Document Q3_2017_Investor amp AC presentations13Chapter 37 - IRAC Income statement per quarter - Ocean Freight13Row change YoY (value_1 q_act)13User Value -00471 Mio | EBITGP () | 46 | -17 | r7 PAC Monaco Salvatore Referenced Value (value_2_PQACT02)1313Document Q3_2017_Investor amp AC presentations13Chapter 37 - IRAC Income statement per quarter - Ocean Freight13Row in of gross profit (value_1 q_act_jan)13User Value -00171 Mio1313----------------------------------------------------------------------------------------1313Referenced Value (value_2_PQPRIOR02)1313Document Q3_2017_Investor amp AC presentations13Chapter 37 - IRAC Income statement per quarter - Ocean Freight13Row in of gross profit (value_1 q_prior_jan)13User Value 00463 Mio | ||||||||||||||||||||||||||||||||||||
| Gross Profit | -10 | -16 | -11 | -5 | -3 | r8 PAC Monaco Salvatore Referenced Value (value_1_PQACT02)1313Document Q3_2017_Investor amp AC presentations13Chapter 37 - IRAC Income statement per quarter - Ocean Freight13Row GP change YoY (value_1 q_act)13User Value -00298 Mio | PAC Monaco Salvatore Referenced Value (value_2_PQACT02)1313Document Q3_2017_Investor amp AC presentations13Chapter 37 - IRAC Income statement per quarter - Ocean Freight13Row Gross profit (value_1 q_act_jan)13User Value 3233667 Mio1313----------------------------------------------------------------------------------------1313Referenced Value (value_2_PQPRIOR02)1313Document Q3_2017_Investor amp AC presentations13Chapter 37 - IRAC Income statement per quarter - Ocean Freight13Row Gross profit (value_1 q_prior_jan)13User Value 3450353 Mio | PAC Monaco Salvatore Referenced Value (value_2_PQACT02)1313Document Q3_2017_Investor amp AC presentations13Chapter 37 - IRAC Income statement per quarter - Ocean Freight13Row EBIT adjusted (value_1 q_act_jan)13User Value -55208 Mio1313----------------------------------------------------------------------------------------1313Referenced Value (value_2_PQPRIOR02)1313Document Q3_2017_Investor amp AC presentations13Chapter 37 - IRAC Income statement per quarter - Ocean Freight13Row EBIT adjusted (value_1 q_prior_jan)13User Value 159801 Mio | PAC Monaco Salvatore Referenced Value (value_2_PQACT02)1313Document Q3_2017_Investor amp AC presentations13Chapter 37 - IRAC Income statement per quarter - Ocean Freight13Row in of gross profit (value_1 q_act_jan)13User Value -00171 Mio1313----------------------------------------------------------------------------------------1313Referenced Value (value_2_PQPRIOR02)1313Document Q3_2017_Investor amp AC presentations13Chapter 37 - IRAC Income statement per quarter - Ocean Freight13Row in of gross profit (value_1 q_prior_jan)13User Value 00463 Mio | Volumes (TEUs 000) | 10995 | 11426 | 4 | r8 PAC Monaco Salvatore Referenced Value (value_2_PQACT02)1313Document Q3_2017_Investor amp AC presentations13Chapter 37 - IRAC Income statement per quarter - Ocean Freight13Row Ocean Freight volumes (000 tons) (value_1 q_act_jan)13User Value 11426050 Mio1313----------------------------------------------------------------------------------------1313Referenced Value (value_2_PQPRIOR02)1313Document Q3_2017_Investor amp AC presentations13Chapter 37 - IRAC Income statement per quarter - Ocean Freight13Row Ocean Freight volumes (000 tons) (value_1 q_prior_jan)13User Value 10994918 Mio |
| Q3 | ||||||||||||||||||||||||||
| TEU | Q3 2016 | Q4 2016 | Q1 2017 | Q2 2017 | Q3 2017 | TEU | ||||||||||||||||||||
| 379 | 389 | 374 | 3828 | 386 | m3 | r3 PAC Monaco Salvatore Referenced Value (value_3_PQACT02)1313Document Q3_2017_Investor amp AC presentations13Chapter 37 - IRAC Income statement per quarter - Ocean Freight13Row Ocean Freight volumes (000 tons) (value_1 q_act)13User Value 3856050 Mio | Q3 2016 | 379 | 296 | |||||||||||||||||
| 296 | 254 | 282 | 285 | 282 | m4 | r4 PAC Monaco Salvatore Referenced Value (value_3_PQACT02)1313Document Q3_2017_Investor amp AC presentations13Chapter 37 - IRAC Income statement per quarter - Ocean Freight13Row GPTEU (CHF) (value_1 q_act)13User Value 2820750 Mio | Q4 2016 | 389 | 254 | |||||||||||||||||
| Q1 2017 | 374 | 282 | ||||||||||||||||||||||||
| Q2 2017 | 383 | 285 | ||||||||||||||||||||||||
| EBIT | 51 | -51 | -32 | 06 | -29 | m7 | r10 PAC Monaco Salvatore Referenced Value (value_3_PQACT02)1313Document Q3_2017_Investor amp AC presentations13Chapter 37 - IRAC Income statement per quarter - Ocean Freight13Row EBIT reported (value_1 q_act)13User Value -29490 Mio | Q3 2017 | 386 | 282 | ||||||||||||||||
| 45 | -51 | -3 | 06 | -003 | m8 | r8 PAC Monaco Salvatore Referenced Value (value_3_PQACT02)1313Document Q3_2017_Investor amp AC presentations13Chapter 37 - IRAC Income statement per quarter - Ocean Freight13Row in of gross profit (value_1 q_act)13User Value -00271 Mio | ||||||||||||||||||||
PAC Hamon Pierrick Invalid Reference (value_3_PQACT02) 1313Reference could not be handled13Underlying Formula | EBIT | EBIT | EBIT GP | |||||||||||||||||||||||
| 0 | -00271 | r11 PAC Monaco Salvatore Referenced Value (value_3_PQACT02)1313Document Q3_2017_Investor amp AC presentations13Chapter 37 - IRAC Income statement per quarter - Ocean Freight13Row in of gross profit (value_1 q_act)13User Value -00271 Mio | PAC Monaco Salvatore Referenced Value (value_3_PQACT02)1313Document Q3_2017_Investor amp AC presentations13Chapter 37 - IRAC Income statement per quarter - Ocean Freight13Row Ocean Freight volumes (000 tons) (value_1 q_act)13User Value 3856050 Mio | PAC Monaco Salvatore Referenced Value (value_3_PQACT02)1313Document Q3_2017_Investor amp AC presentations13Chapter 37 - IRAC Income statement per quarter - Ocean Freight13Row GPTEU (CHF) (value_1 q_act)13User Value 2820750 Mio | PAC Monaco Salvatore Referenced Value (value_3_PQACT02)1313Document Q3_2017_Investor amp AC presentations13Chapter 37 - IRAC Income statement per quarter - Ocean Freight13Row EBIT reported (value_1 q_act)13User Value -29490 Mio | PAC Monaco Salvatore Referenced Value (value_3_PQACT02)1313Document Q3_2017_Investor amp AC presentations13Chapter 37 - IRAC Income statement per quarter - Ocean Freight13Row in of gross profit (value_1 q_act)13User Value -00271 Mio | Q3 2016 | 51 | 45 | |||||||||||||||||
| Q4 2016 | -51 | -51 | ||||||||||||||||||||||||
| Q1 2017 | -32 | -30 | ||||||||||||||||||||||||
| Q2 2017 | 06 | 06 | ||||||||||||||||||||||||
| Q3 2017 | -29 | -27 |
| 2017 | 2016 | |||||||||||||||||||||||||||||||||||||||||||||
| 2017 | 2016 | 2017 | ||||||||||||||||||||||||||||||||||||||||||||
| YoY Growth | Q3 | Q4 | Q1 | Q2 | Q3 | Gross Profit EBIT | YTD | YTD | ||||||||||||||||||||||||||||||||||||||
| Volume (market estimated) | 0 | 3 | 4 | 3 | 3 | m5 | Gross Profit | 3450 | 3234 | -6 | r5 PAC Monaco Salvatore Referenced Value (value_2_PQACT02)1313Document Q3_2017_Investor amp AC presentations13Chapter 37 - IRAC Income statement per quarter - Ocean Freight13Row Gross profit (value_1 q_act_jan)13User Value 3233667 Mio1313----------------------------------------------------------------------------------------1313Referenced Value (value_2_PQPRIOR02)1313Document Q3_2017_Investor amp AC presentations13Chapter 37 - IRAC Income statement per quarter - Ocean Freight13Row Gross profit (value_1 q_prior_jan)13User Value 3450353 Mio | |||||||||||||||||||||||||||||||||||
| Volume (Panalpina) | -9 | 1 | 7 | 3 | 2 | r6 PAC Monaco Salvatore Referenced Value (value_1_PQACT02)1313Document Q3_2017_Investor amp AC presentations13Chapter 37 - IRAC Income statement per quarter - Ocean Freight13Row change YoY (value_1 q_act)13User Value 00182 Mio | EBIT (adjusted PY) | 160 | -55 | -135 | r6 PAC Monaco Salvatore Referenced Value (value_2_PQACT02)1313Document Q3_2017_Investor amp AC presentations13Chapter 37 - IRAC Income statement per quarter - Ocean Freight13Row EBIT adjusted (value_1 q_act_jan)13User Value -55208 Mio1313----------------------------------------------------------------------------------------1313Referenced Value (value_2_PQPRIOR02)1313Document Q3_2017_Investor amp AC presentations13Chapter 37 - IRAC Income statement per quarter - Ocean Freight13Row EBIT adjusted (value_1 q_prior_jan)13User Value 159801 Mio | |||||||||||||||||||||||||||||||||||
| GPTEU | -2 | -18 | -17 | -7 | -5 | r7 PAC Monaco Salvatore Referenced Value (value_1_PQACT02)1313Document Q3_2017_Investor amp AC presentations13Chapter 37 - IRAC Income statement per quarter - Ocean Freight13Row change YoY (value_1 q_act)13User Value -00471 Mio | EBITGP () | 46 | -17 | r7 PAC Monaco Salvatore Referenced Value (value_2_PQACT02)1313Document Q3_2017_Investor amp AC presentations13Chapter 37 - IRAC Income statement per quarter - Ocean Freight13Row in of gross profit (value_1 q_act_jan)13User Value -00171 Mio1313----------------------------------------------------------------------------------------1313Referenced Value (value_2_PQPRIOR02)1313Document Q3_2017_Investor amp AC presentations13Chapter 37 - IRAC Income statement per quarter - Ocean Freight13Row in of gross profit (value_1 q_prior_jan)13User Value 00463 Mio | ||||||||||||||||||||||||||||||||||||
| Gross Profit | -10 | -16 | -11 | -5 | -3 | r8 PAC Monaco Salvatore Referenced Value (value_1_PQACT02)1313Document Q3_2017_Investor amp AC presentations13Chapter 37 - IRAC Income statement per quarter - Ocean Freight13Row GP change YoY (value_1 q_act)13User Value -00298 Mio | PAC Monaco Salvatore Referenced Value (value_2_PQACT02)1313Document Q3_2017_Investor amp AC presentations13Chapter 37 - IRAC Income statement per quarter - Ocean Freight13Row Gross profit (value_1 q_act_jan)13User Value 3233667 Mio1313----------------------------------------------------------------------------------------1313Referenced Value (value_2_PQPRIOR02)1313Document Q3_2017_Investor amp AC presentations13Chapter 37 - IRAC Income statement per quarter - Ocean Freight13Row Gross profit (value_1 q_prior_jan)13User Value 3450353 Mio | PAC Monaco Salvatore Referenced Value (value_2_PQACT02)1313Document Q3_2017_Investor amp AC presentations13Chapter 37 - IRAC Income statement per quarter - Ocean Freight13Row EBIT adjusted (value_1 q_act_jan)13User Value -55208 Mio1313----------------------------------------------------------------------------------------1313Referenced Value (value_2_PQPRIOR02)1313Document Q3_2017_Investor amp AC presentations13Chapter 37 - IRAC Income statement per quarter - Ocean Freight13Row EBIT adjusted (value_1 q_prior_jan)13User Value 159801 Mio | PAC Monaco Salvatore Referenced Value (value_2_PQACT02)1313Document Q3_2017_Investor amp AC presentations13Chapter 37 - IRAC Income statement per quarter - Ocean Freight13Row in of gross profit (value_1 q_act_jan)13User Value -00171 Mio1313----------------------------------------------------------------------------------------1313Referenced Value (value_2_PQPRIOR02)1313Document Q3_2017_Investor amp AC presentations13Chapter 37 - IRAC Income statement per quarter - Ocean Freight13Row in of gross profit (value_1 q_prior_jan)13User Value 00463 Mio | Volumes (TEUs 000) | 10995 | 11426 | 4 | r8 PAC Monaco Salvatore Referenced Value (value_2_PQACT02)1313Document Q3_2017_Investor amp AC presentations13Chapter 37 - IRAC Income statement per quarter - Ocean Freight13Row Ocean Freight volumes (000 tons) (value_1 q_act_jan)13User Value 11426050 Mio1313----------------------------------------------------------------------------------------1313Referenced Value (value_2_PQPRIOR02)1313Document Q3_2017_Investor amp AC presentations13Chapter 37 - IRAC Income statement per quarter - Ocean Freight13Row Ocean Freight volumes (000 tons) (value_1 q_prior_jan)13User Value 10994918 Mio |
| Q3 | |||||||||||||||||||||||
| TEU | Q3 2016 | Q4 2016 | Q1 2017 | Q2 2017 | Q3 2017 | TEU | |||||||||||||||||
| 228 | 252 | 233 | 240 | 249 | m4 | r3 PAC Monaco Salvatore Referenced Value (value_3_PQACT02)1313Document Q3_2017_Investor amp AC presentations13Chapter 36 - IRAC Income statement per quarter - Air Freight13Row Air Freight volumes (000 tons) (value_1 q_act)13User Value 2489350 Mio | Q3 2016 | 228 | 653 | ||||||||||||||
| 653 | 562 | 620 | 625 | 648 | m5 | r4 PAC Monaco Salvatore Referenced Value (value_3_PQACT02)1313Document Q3_2017_Investor amp AC presentations13Chapter 36 - IRAC Income statement per quarter - Air Freight13Row GPton (CHF) (value_1 q_act)13User Value 6483290 Mio | Q4 2016 | 252 | 562 | ||||||||||||||
| Q1 2017 | 233 | 620 | |||||||||||||||||||||
| Q2 2017 | 240 | 625 | |||||||||||||||||||||
| EBIT | 269 | 208 | 171 | 220 | 303 | m6 | r7 PAC Monaco Salvatore Referenced Value (value_3_PQACT02)1313Document Q3_2017_Investor amp AC presentations13Chapter 36 - IRAC Income statement per quarter - Air Freight13Row EBIT adjusted (value_1 q_act)13User Value 303313 Mio | Q3 2017 | 249 | 648 | |||||||||||||
| 181 | 147 | 118 | 147 | 019 | m7 | r8 PAC Monaco Salvatore Referenced Value (value_3_PQACT02)1313Document Q3_2017_Investor amp AC presentations13Chapter 36 - IRAC Income statement per quarter - Air Freight13Row in of gross profit (value_1 q_act)13User Value 01879 Mio | |||||||||||||||||
| EBIT | |||||||||||||||||||||||
| Q3 2016 | 269 | 181 | |||||||||||||||||||||
| Q4 2016 | 208 | 147 | |||||||||||||||||||||
| Q1 2017 | 171 | 118 | |||||||||||||||||||||
| Q2 2017 | 220 | 147 | |||||||||||||||||||||
| Q3 2017 | 303 | 188 |
| 2017 | 2016 | |||||||||||||||||||||||||||||||||||||||||||||
| 2017 | 2016 | 2017 | ||||||||||||||||||||||||||||||||||||||||||||
| YoY Growth | Q3 | Q4 | Q1 | Q2 | Q3 | Gross Profit EBIT | YTD | YTD | ||||||||||||||||||||||||||||||||||||||
| Volume (market estimated) | 2 | 8 | 6 | 10 | 10 | m5 | Gross Profit | 4534 | 4560 | 1 | r5 PAC Monaco Salvatore Referenced Value (value_2_PQACT02)1313Document Q3_2017_Investor amp AC presentations13Chapter 36 - IRAC Income statement per quarter - Air Freight13Row Gross profit (value_1 q_act_jan)13User Value 4560242 Mio1313----------------------------------------------------------------------------------------1313Referenced Value (value_2_PQPRIOR02)1313Document Q3_2017_Investor amp AC presentations13Chapter 36 - IRAC Income statement per quarter - Air Freight13Row Gross profit (value_1 q_prior_jan)13User Value 4533576 Mio | |||||||||||||||||||||||||||||||||||
| Volume (Panalpina) | 10 | 14 | 8 | 7 | 8 | r6 PAC Monaco Salvatore Referenced Value (value_1_PQACT02)1313Document Q3_2017_Investor amp AC presentations13Chapter 36 - IRAC Income statement per quarter - Air Freight13Row change YoY (value_1 q_act_jan)13User Value 00793 Mio | EBIT (adjusted PY) | 726 | 694 | -4 | r6 PAC Monaco Salvatore Referenced Value (value_2_PQACT02)1313Document Q3_2017_Investor amp AC presentations13Chapter 36 - IRAC Income statement per quarter - Air Freight13Row EBIT reported (value_1 q_act_jan)13User Value 694303 Mio1313----------------------------------------------------------------------------------------1313Referenced Value (value_2_PQPRIOR02)1313Document Q3_2017_Investor amp AC presentations13Chapter 36 - IRAC Income statement per quarter - Air Freight13Row EBIT adjusted (value_1 q_prior_jan)13User Value 726409 Mio | |||||||||||||||||||||||||||||||||||
| GPton | -7 | -14 | -10 | -10 | -1 | r7 PAC Monaco Salvatore Referenced Value (value_1_PQACT02)1313Document Q3_2017_Investor amp AC presentations13Chapter 36 - IRAC Income statement per quarter - Air Freight13Row change YoY (value_1 q_act)13User Value -00079 Mio | EBITGP () | 160 | 152 | r7 PAC Monaco Salvatore Referenced Value (value_2_PQACT02)1313Document Q3_2017_Investor amp AC presentations13Chapter 36 - IRAC Income statement per quarter - Air Freight13Row in of gross profit (value_1 q_act_jan)13User Value 01523 Mio1313----------------------------------------------------------------------------------------1313Referenced Value (value_2_PQPRIOR02)1313Document Q3_2017_Investor amp AC presentations13Chapter 36 - IRAC Income statement per quarter - Air Freight13Row in of gross profit (value_1 q_prior_jan)13User Value 01602 Mio | ||||||||||||||||||||||||||||||||||||
| Gross Profit | 2 | -2 | -3 | -4 | 8 | r8 PAC Monaco Salvatore Referenced Value (value_1_PQACT02)1313Document Q3_2017_Investor amp AC presentations13Chapter 36 - IRAC Income statement per quarter - Air Freight13Row GP change YoY (value_1 q_act)13User Value 00842 Mio | PAC Monaco Salvatore Referenced Value (value_2_PQACT02)1313Document Q3_2017_Investor amp AC presentations13Chapter 36 - IRAC Income statement per quarter - Air Freight13Row Gross profit (value_1 q_act_jan)13User Value 4560242 Mio1313----------------------------------------------------------------------------------------1313Referenced Value (value_2_PQPRIOR02)1313Document Q3_2017_Investor amp AC presentations13Chapter 36 - IRAC Income statement per quarter - Air Freight13Row Gross profit (value_1 q_prior_jan)13User Value 4533576 Mio | PAC Monaco Salvatore Referenced Value (value_2_PQACT02)1313Document Q3_2017_Investor amp AC presentations13Chapter 36 - IRAC Income statement per quarter - Air Freight13Row EBIT reported (value_1 q_act_jan)13User Value 694303 Mio1313----------------------------------------------------------------------------------------1313Referenced Value (value_2_PQPRIOR02)1313Document Q3_2017_Investor amp AC presentations13Chapter 36 - IRAC Income statement per quarter - Air Freight13Row EBIT adjusted (value_1 q_prior_jan)13User Value 726409 Mio | PAC Monaco Salvatore Referenced Value (value_2_PQACT02)1313Document Q3_2017_Investor amp AC presentations13Chapter 36 - IRAC Income statement per quarter - Air Freight13Row in of gross profit (value_1 q_act_jan)13User Value 01523 Mio1313----------------------------------------------------------------------------------------1313Referenced Value (value_2_PQPRIOR02)1313Document Q3_2017_Investor amp AC presentations13Chapter 36 - IRAC Income statement per quarter - Air Freight13Row in of gross profit (value_1 q_prior_jan)13User Value 01602 Mio | Volumes (tons 000) | 6690 | 7220 | 8 | r8 PAC Monaco Salvatore Referenced Value (value_2_PQACT02)1313Document Q3_2017_Investor amp AC presentations13Chapter 36 - IRAC Income statement per quarter - Air Freight13Row Air Freight volumes (000 tons) (value_1 q_act_jan)13User Value 7220350 Mio1313----------------------------------------------------------------------------------------1313Referenced Value (value_2_PQPRIOR02)1313Document Q3_2017_Investor amp AC presentations13Chapter 36 - IRAC Income statement per quarter - Air Freight13Row Air Freight volumes (000 tons) (value_1 q_prior_jan)13User Value 6690029 Mio |
| Q3 | |||||||||||||||||||||||
| TEU | Q3 2016 | Q4 2016 | Q1 2017 | Q2 2017 | Q3 2017 | TEU | |||||||||||||||||
| 228 | 252 | 233 | 240 | 249 | m4 | r3 PAC Monaco Salvatore Referenced Value (value_3_PQACT02)1313Document Q3_2017_Investor amp AC presentations13Chapter 36 - IRAC Income statement per quarter - Air Freight13Row Air Freight volumes (000 tons) (value_1 q_act)13User Value 2489350 Mio | Q3 2016 | 228 | 653 | ||||||||||||||
| 653 | 562 | 620 | 625 | 648 | m5 | r4 PAC Monaco Salvatore Referenced Value (value_3_PQACT02)1313Document Q3_2017_Investor amp AC presentations13Chapter 36 - IRAC Income statement per quarter - Air Freight13Row GPton (CHF) (value_1 q_act)13User Value 6483290 Mio | Q4 2016 | 252 | 562 | ||||||||||||||
| Q1 2017 | 233 | 620 | |||||||||||||||||||||
| Q2 2017 | 240 | 625 | |||||||||||||||||||||
| EBIT | 269 | 208 | 171 | 220 | 303 | m6 | r7 PAC Monaco Salvatore Referenced Value (value_3_PQACT02)1313Document Q3_2017_Investor amp AC presentations13Chapter 36 - IRAC Income statement per quarter - Air Freight13Row EBIT adjusted (value_1 q_act)13User Value 303313 Mio | Q3 2017 | 249 | 648 | |||||||||||||
| 181 | 147 | 118 | 147 | 019 | m7 | r8 PAC Monaco Salvatore Referenced Value (value_3_PQACT02)1313Document Q3_2017_Investor amp AC presentations13Chapter 36 - IRAC Income statement per quarter - Air Freight13Row in of gross profit (value_1 q_act)13User Value 01879 Mio | |||||||||||||||||
| EBIT | |||||||||||||||||||||||
| Q3 2016 | 269 | 181 | |||||||||||||||||||||
| Q4 2016 | 208 | 147 | |||||||||||||||||||||
| Q1 2017 | 171 | 118 | |||||||||||||||||||||
| Q2 2017 | 220 | 147 | |||||||||||||||||||||
| Q3 2017 | 303 | 188 |
| 2017 | 2016 | |||||||||||||||||||||||||||||||||||||||||||||
| 2017 | 2016 | 2017 | ||||||||||||||||||||||||||||||||||||||||||||
| YoY Growth | Q3 | Q4 | Q1 | Q2 | Q3 | Gross Profit EBIT | YTD | YTD | ||||||||||||||||||||||||||||||||||||||
| Volume (market estimated) | 2 | 8 | 6 | 10 | 10 | m5 | Gross Profit | 4534 | 4560 | 1 | r5 PAC Monaco Salvatore Referenced Value (value_2_PQACT02)1313Document Q3_2017_Investor amp AC presentations13Chapter 36 - IRAC Income statement per quarter - Air Freight13Row Gross profit (value_1 q_act_jan)13User Value 4560242 Mio1313----------------------------------------------------------------------------------------1313Referenced Value (value_2_PQPRIOR02)1313Document Q3_2017_Investor amp AC presentations13Chapter 36 - IRAC Income statement per quarter - Air Freight13Row Gross profit (value_1 q_prior_jan)13User Value 4533576 Mio | |||||||||||||||||||||||||||||||||||
| Volume (Panalpina) | 10 | 14 | 8 | 7 | 8 | r6 PAC Monaco Salvatore Referenced Value (value_1_PQACT02)1313Document Q3_2017_Investor amp AC presentations13Chapter 36 - IRAC Income statement per quarter - Air Freight13Row change YoY (value_1 q_act_jan)13User Value 00793 Mio | EBIT (adjusted PY) | 726 | 694 | -4 | r6 PAC Monaco Salvatore Referenced Value (value_2_PQACT02)1313Document Q3_2017_Investor amp AC presentations13Chapter 36 - IRAC Income statement per quarter - Air Freight13Row EBIT reported (value_1 q_act_jan)13User Value 694303 Mio1313----------------------------------------------------------------------------------------1313Referenced Value (value_2_PQPRIOR02)1313Document Q3_2017_Investor amp AC presentations13Chapter 36 - IRAC Income statement per quarter - Air Freight13Row EBIT adjusted (value_1 q_prior_jan)13User Value 726409 Mio | |||||||||||||||||||||||||||||||||||
| GPton | -7 | -14 | -10 | -10 | -1 | r7 PAC Monaco Salvatore Referenced Value (value_1_PQACT02)1313Document Q3_2017_Investor amp AC presentations13Chapter 36 - IRAC Income statement per quarter - Air Freight13Row change YoY (value_1 q_act)13User Value -00079 Mio | EBITGP () | 160 | 152 | r7 PAC Monaco Salvatore Referenced Value (value_2_PQACT02)1313Document Q3_2017_Investor amp AC presentations13Chapter 36 - IRAC Income statement per quarter - Air Freight13Row in of gross profit (value_1 q_act_jan)13User Value 01523 Mio1313----------------------------------------------------------------------------------------1313Referenced Value (value_2_PQPRIOR02)1313Document Q3_2017_Investor amp AC presentations13Chapter 36 - IRAC Income statement per quarter - Air Freight13Row in of gross profit (value_1 q_prior_jan)13User Value 01602 Mio | ||||||||||||||||||||||||||||||||||||
| Gross Profit | 2 | -2 | -3 | -4 | 8 | r8 PAC Monaco Salvatore Referenced Value (value_1_PQACT02)1313Document Q3_2017_Investor amp AC presentations13Chapter 36 - IRAC Income statement per quarter - Air Freight13Row GP change YoY (value_1 q_act)13User Value 00842 Mio | PAC Monaco Salvatore Referenced Value (value_2_PQACT02)1313Document Q3_2017_Investor amp AC presentations13Chapter 36 - IRAC Income statement per quarter - Air Freight13Row Gross profit (value_1 q_act_jan)13User Value 4560242 Mio1313----------------------------------------------------------------------------------------1313Referenced Value (value_2_PQPRIOR02)1313Document Q3_2017_Investor amp AC presentations13Chapter 36 - IRAC Income statement per quarter - Air Freight13Row Gross profit (value_1 q_prior_jan)13User Value 4533576 Mio | PAC Monaco Salvatore Referenced Value (value_2_PQACT02)1313Document Q3_2017_Investor amp AC presentations13Chapter 36 - IRAC Income statement per quarter - Air Freight13Row EBIT reported (value_1 q_act_jan)13User Value 694303 Mio1313----------------------------------------------------------------------------------------1313Referenced Value (value_2_PQPRIOR02)1313Document Q3_2017_Investor amp AC presentations13Chapter 36 - IRAC Income statement per quarter - Air Freight13Row EBIT adjusted (value_1 q_prior_jan)13User Value 726409 Mio | PAC Monaco Salvatore Referenced Value (value_2_PQACT02)1313Document Q3_2017_Investor amp AC presentations13Chapter 36 - IRAC Income statement per quarter - Air Freight13Row in of gross profit (value_1 q_act_jan)13User Value 01523 Mio1313----------------------------------------------------------------------------------------1313Referenced Value (value_2_PQPRIOR02)1313Document Q3_2017_Investor amp AC presentations13Chapter 36 - IRAC Income statement per quarter - Air Freight13Row in of gross profit (value_1 q_prior_jan)13User Value 01602 Mio | Volumes (tons 000) | 6690 | 7220 | 8 | r8 PAC Monaco Salvatore Referenced Value (value_2_PQACT02)1313Document Q3_2017_Investor amp AC presentations13Chapter 36 - IRAC Income statement per quarter - Air Freight13Row Air Freight volumes (000 tons) (value_1 q_act_jan)13User Value 7220350 Mio1313----------------------------------------------------------------------------------------1313Referenced Value (value_2_PQPRIOR02)1313Document Q3_2017_Investor amp AC presentations13Chapter 36 - IRAC Income statement per quarter - Air Freight13Row Air Freight volumes (000 tons) (value_1 q_prior_jan)13User Value 6690029 Mio |
| Q3 | |||||||||||||||||||||||
| TEU | Q3 2016 | Q4 2016 | Q1 2017 | Q2 2017 | Q3 2017 | TEU | |||||||||||||||||
| 228 | 252 | 233 | 240 | 249 | m4 | r3 PAC Monaco Salvatore Referenced Value (value_3_PQACT02)1313Document Q3_2017_Investor amp AC presentations13Chapter 36 - IRAC Income statement per quarter - Air Freight13Row Air Freight volumes (000 tons) (value_1 q_act)13User Value 2489350 Mio | Q3 2016 | 228 | 653 | ||||||||||||||
| 653 | 562 | 620 | 625 | 648 | m5 | r4 PAC Monaco Salvatore Referenced Value (value_3_PQACT02)1313Document Q3_2017_Investor amp AC presentations13Chapter 36 - IRAC Income statement per quarter - Air Freight13Row GPton (CHF) (value_1 q_act)13User Value 6483290 Mio | Q4 2016 | 252 | 562 | ||||||||||||||
| Q1 2017 | 233 | 620 | |||||||||||||||||||||
| Q2 2017 | 240 | 625 | |||||||||||||||||||||
| EBIT | 269 | 208 | 171 | 220 | 303 | m6 | r7 PAC Monaco Salvatore Referenced Value (value_3_PQACT02)1313Document Q3_2017_Investor amp AC presentations13Chapter 36 - IRAC Income statement per quarter - Air Freight13Row EBIT adjusted (value_1 q_act)13User Value 303313 Mio | Q3 2017 | 249 | 648 | |||||||||||||
| 181 | 147 | 118 | 147 | 019 | m7 | r8 PAC Monaco Salvatore Referenced Value (value_3_PQACT02)1313Document Q3_2017_Investor amp AC presentations13Chapter 36 - IRAC Income statement per quarter - Air Freight13Row in of gross profit (value_1 q_act)13User Value 01879 Mio | |||||||||||||||||
| EBIT | |||||||||||||||||||||||
| Q3 2016 | 269 | 181 | |||||||||||||||||||||
| Q4 2016 | 208 | 147 | |||||||||||||||||||||
| Q1 2017 | 171 | 118 | |||||||||||||||||||||
| Q2 2017 | 220 | 147 | |||||||||||||||||||||
| Q3 2017 | 303 | 188 |
| 2017 | 2016 | |||||||||||||||||||||||||||||||||||||||||||||
| 2017 | 2016 | 2017 | ||||||||||||||||||||||||||||||||||||||||||||
| YoY Growth | Q3 | Q4 | Q1 | Q2 | Q3 | Gross Profit EBIT | YTD | YTD | ||||||||||||||||||||||||||||||||||||||
| Volume (market estimated) | 2 | 8 | 6 | 10 | 10 | m5 | Gross Profit | 4534 | 4560 | 1 | r5 PAC Monaco Salvatore Referenced Value (value_2_PQACT02)1313Document Q3_2017_Investor amp AC presentations13Chapter 36 - IRAC Income statement per quarter - Air Freight13Row Gross profit (value_1 q_act_jan)13User Value 4560242 Mio1313----------------------------------------------------------------------------------------1313Referenced Value (value_2_PQPRIOR02)1313Document Q3_2017_Investor amp AC presentations13Chapter 36 - IRAC Income statement per quarter - Air Freight13Row Gross profit (value_1 q_prior_jan)13User Value 4533576 Mio | |||||||||||||||||||||||||||||||||||
| Volume (Panalpina) | 10 | 14 | 8 | 7 | 8 | r6 PAC Monaco Salvatore Referenced Value (value_1_PQACT02)1313Document Q3_2017_Investor amp AC presentations13Chapter 36 - IRAC Income statement per quarter - Air Freight13Row change YoY (value_1 q_act_jan)13User Value 00793 Mio | EBIT (adjusted PY) | 726 | 694 | -4 | r6 PAC Monaco Salvatore Referenced Value (value_2_PQACT02)1313Document Q3_2017_Investor amp AC presentations13Chapter 36 - IRAC Income statement per quarter - Air Freight13Row EBIT reported (value_1 q_act_jan)13User Value 694303 Mio1313----------------------------------------------------------------------------------------1313Referenced Value (value_2_PQPRIOR02)1313Document Q3_2017_Investor amp AC presentations13Chapter 36 - IRAC Income statement per quarter - Air Freight13Row EBIT adjusted (value_1 q_prior_jan)13User Value 726409 Mio | |||||||||||||||||||||||||||||||||||
| GPton | -7 | -14 | -10 | -10 | -1 | r7 PAC Monaco Salvatore Referenced Value (value_1_PQACT02)1313Document Q3_2017_Investor amp AC presentations13Chapter 36 - IRAC Income statement per quarter - Air Freight13Row change YoY (value_1 q_act)13User Value -00079 Mio | EBITGP () | 160 | 152 | r7 PAC Monaco Salvatore Referenced Value (value_2_PQACT02)1313Document Q3_2017_Investor amp AC presentations13Chapter 36 - IRAC Income statement per quarter - Air Freight13Row in of gross profit (value_1 q_act_jan)13User Value 01523 Mio1313----------------------------------------------------------------------------------------1313Referenced Value (value_2_PQPRIOR02)1313Document Q3_2017_Investor amp AC presentations13Chapter 36 - IRAC Income statement per quarter - Air Freight13Row in of gross profit (value_1 q_prior_jan)13User Value 01602 Mio | ||||||||||||||||||||||||||||||||||||
| Gross Profit | 2 | -2 | -3 | -4 | 8 | r8 PAC Monaco Salvatore Referenced Value (value_1_PQACT02)1313Document Q3_2017_Investor amp AC presentations13Chapter 36 - IRAC Income statement per quarter - Air Freight13Row GP change YoY (value_1 q_act)13User Value 00842 Mio | PAC Monaco Salvatore Referenced Value (value_2_PQACT02)1313Document Q3_2017_Investor amp AC presentations13Chapter 36 - IRAC Income statement per quarter - Air Freight13Row Gross profit (value_1 q_act_jan)13User Value 4560242 Mio1313----------------------------------------------------------------------------------------1313Referenced Value (value_2_PQPRIOR02)1313Document Q3_2017_Investor amp AC presentations13Chapter 36 - IRAC Income statement per quarter - Air Freight13Row Gross profit (value_1 q_prior_jan)13User Value 4533576 Mio | PAC Monaco Salvatore Referenced Value (value_2_PQACT02)1313Document Q3_2017_Investor amp AC presentations13Chapter 36 - IRAC Income statement per quarter - Air Freight13Row EBIT reported (value_1 q_act_jan)13User Value 694303 Mio1313----------------------------------------------------------------------------------------1313Referenced Value (value_2_PQPRIOR02)1313Document Q3_2017_Investor amp AC presentations13Chapter 36 - IRAC Income statement per quarter - Air Freight13Row EBIT adjusted (value_1 q_prior_jan)13User Value 726409 Mio | PAC Monaco Salvatore Referenced Value (value_2_PQACT02)1313Document Q3_2017_Investor amp AC presentations13Chapter 36 - IRAC Income statement per quarter - Air Freight13Row in of gross profit (value_1 q_act_jan)13User Value 01523 Mio1313----------------------------------------------------------------------------------------1313Referenced Value (value_2_PQPRIOR02)1313Document Q3_2017_Investor amp AC presentations13Chapter 36 - IRAC Income statement per quarter - Air Freight13Row in of gross profit (value_1 q_prior_jan)13User Value 01602 Mio | Volumes (tons 000) | 6690 | 7220 | 8 | r8 PAC Monaco Salvatore Referenced Value (value_2_PQACT02)1313Document Q3_2017_Investor amp AC presentations13Chapter 36 - IRAC Income statement per quarter - Air Freight13Row Air Freight volumes (000 tons) (value_1 q_act_jan)13User Value 7220350 Mio1313----------------------------------------------------------------------------------------1313Referenced Value (value_2_PQPRIOR02)1313Document Q3_2017_Investor amp AC presentations13Chapter 36 - IRAC Income statement per quarter - Air Freight13Row Air Freight volumes (000 tons) (value_1 q_prior_jan)13User Value 6690029 Mio |
| Q3 | |||||||||||||||||||||||
| TEU | Q3 2016 | Q4 2016 | Q1 2017 | Q2 2017 | Q3 2017 | TEU | |||||||||||||||||
| 228 | 252 | 233 | 240 | 249 | m4 | r3 PAC Monaco Salvatore Referenced Value (value_3_PQACT02)1313Document Q3_2017_Investor amp AC presentations13Chapter 36 - IRAC Income statement per quarter - Air Freight13Row Air Freight volumes (000 tons) (value_1 q_act)13User Value 2489350 Mio | Q3 2016 | 228 | 653 | ||||||||||||||
| 653 | 562 | 620 | 625 | 648 | m5 | r4 PAC Monaco Salvatore Referenced Value (value_3_PQACT02)1313Document Q3_2017_Investor amp AC presentations13Chapter 36 - IRAC Income statement per quarter - Air Freight13Row GPton (CHF) (value_1 q_act)13User Value 6483290 Mio | Q4 2016 | 252 | 562 | ||||||||||||||
| Q1 2017 | 233 | 620 | |||||||||||||||||||||
| Q2 2017 | 240 | 625 | |||||||||||||||||||||
| EBIT | 269 | 208 | 171 | 220 | 303 | m6 | r7 PAC Monaco Salvatore Referenced Value (value_3_PQACT02)1313Document Q3_2017_Investor amp AC presentations13Chapter 36 - IRAC Income statement per quarter - Air Freight13Row EBIT adjusted (value_1 q_act)13User Value 303313 Mio | Q3 2017 | 249 | 648 | |||||||||||||
| 181 | 147 | 118 | 147 | 019 | m7 | r8 PAC Monaco Salvatore Referenced Value (value_3_PQACT02)1313Document Q3_2017_Investor amp AC presentations13Chapter 36 - IRAC Income statement per quarter - Air Freight13Row in of gross profit (value_1 q_act)13User Value 01879 Mio | |||||||||||||||||
| EBIT | |||||||||||||||||||||||
| Q3 2016 | 269 | 181 | |||||||||||||||||||||
| Q4 2016 | 208 | 147 | |||||||||||||||||||||
| Q1 2017 | 171 | 118 | |||||||||||||||||||||
| Q2 2017 | 220 | 147 | |||||||||||||||||||||
| Q3 2017 | 303 | 188 |
| 2017 | 2016 | |||||||||||||||||||||||||||||||||||||||||||||
| 2017 | 2016 | 2017 | ||||||||||||||||||||||||||||||||||||||||||||
| YoY Growth | Q3 | Q4 | Q1 | Q2 | Q3 | Gross Profit EBIT | YTD | YTD | ||||||||||||||||||||||||||||||||||||||
| Volume (market estimated) | 2 | 8 | 6 | 10 | 10 | m5 | Gross Profit | 4534 | 4560 | 1 | r5 PAC Monaco Salvatore Referenced Value (value_2_PQACT02)1313Document Q3_2017_Investor amp AC presentations13Chapter 36 - IRAC Income statement per quarter - Air Freight13Row Gross profit (value_1 q_act_jan)13User Value 4560242 Mio1313----------------------------------------------------------------------------------------1313Referenced Value (value_2_PQPRIOR02)1313Document Q3_2017_Investor amp AC presentations13Chapter 36 - IRAC Income statement per quarter - Air Freight13Row Gross profit (value_1 q_prior_jan)13User Value 4533576 Mio | |||||||||||||||||||||||||||||||||||
| Volume (Panalpina) | 10 | 14 | 8 | 7 | 8 | r6 PAC Monaco Salvatore Referenced Value (value_1_PQACT02)1313Document Q3_2017_Investor amp AC presentations13Chapter 36 - IRAC Income statement per quarter - Air Freight13Row change YoY (value_1 q_act_jan)13User Value 00793 Mio | EBIT (adjusted PY) | 726 | 694 | -4 | r6 PAC Monaco Salvatore Referenced Value (value_2_PQACT02)1313Document Q3_2017_Investor amp AC presentations13Chapter 36 - IRAC Income statement per quarter - Air Freight13Row EBIT reported (value_1 q_act_jan)13User Value 694303 Mio1313----------------------------------------------------------------------------------------1313Referenced Value (value_2_PQPRIOR02)1313Document Q3_2017_Investor amp AC presentations13Chapter 36 - IRAC Income statement per quarter - Air Freight13Row EBIT adjusted (value_1 q_prior_jan)13User Value 726409 Mio | |||||||||||||||||||||||||||||||||||
| GPton | -7 | -14 | -10 | -10 | -1 | r7 PAC Monaco Salvatore Referenced Value (value_1_PQACT02)1313Document Q3_2017_Investor amp AC presentations13Chapter 36 - IRAC Income statement per quarter - Air Freight13Row change YoY (value_1 q_act)13User Value -00079 Mio | EBITGP () | 160 | 152 | r7 PAC Monaco Salvatore Referenced Value (value_2_PQACT02)1313Document Q3_2017_Investor amp AC presentations13Chapter 36 - IRAC Income statement per quarter - Air Freight13Row in of gross profit (value_1 q_act_jan)13User Value 01523 Mio1313----------------------------------------------------------------------------------------1313Referenced Value (value_2_PQPRIOR02)1313Document Q3_2017_Investor amp AC presentations13Chapter 36 - IRAC Income statement per quarter - Air Freight13Row in of gross profit (value_1 q_prior_jan)13User Value 01602 Mio | ||||||||||||||||||||||||||||||||||||
| Gross Profit | 2 | -2 | -3 | -4 | 8 | r8 PAC Monaco Salvatore Referenced Value (value_1_PQACT02)1313Document Q3_2017_Investor amp AC presentations13Chapter 36 - IRAC Income statement per quarter - Air Freight13Row GP change YoY (value_1 q_act)13User Value 00842 Mio | PAC Monaco Salvatore Referenced Value (value_2_PQACT02)1313Document Q3_2017_Investor amp AC presentations13Chapter 36 - IRAC Income statement per quarter - Air Freight13Row Gross profit (value_1 q_act_jan)13User Value 4560242 Mio1313----------------------------------------------------------------------------------------1313Referenced Value (value_2_PQPRIOR02)1313Document Q3_2017_Investor amp AC presentations13Chapter 36 - IRAC Income statement per quarter - Air Freight13Row Gross profit (value_1 q_prior_jan)13User Value 4533576 Mio | PAC Monaco Salvatore Referenced Value (value_2_PQACT02)1313Document Q3_2017_Investor amp AC presentations13Chapter 36 - IRAC Income statement per quarter - Air Freight13Row EBIT reported (value_1 q_act_jan)13User Value 694303 Mio1313----------------------------------------------------------------------------------------1313Referenced Value (value_2_PQPRIOR02)1313Document Q3_2017_Investor amp AC presentations13Chapter 36 - IRAC Income statement per quarter - Air Freight13Row EBIT adjusted (value_1 q_prior_jan)13User Value 726409 Mio | PAC Monaco Salvatore Referenced Value (value_2_PQACT02)1313Document Q3_2017_Investor amp AC presentations13Chapter 36 - IRAC Income statement per quarter - Air Freight13Row in of gross profit (value_1 q_act_jan)13User Value 01523 Mio1313----------------------------------------------------------------------------------------1313Referenced Value (value_2_PQPRIOR02)1313Document Q3_2017_Investor amp AC presentations13Chapter 36 - IRAC Income statement per quarter - Air Freight13Row in of gross profit (value_1 q_prior_jan)13User Value 01602 Mio | Volumes (tons 000) | 6690 | 7220 | 8 | r8 PAC Monaco Salvatore Referenced Value (value_2_PQACT02)1313Document Q3_2017_Investor amp AC presentations13Chapter 36 - IRAC Income statement per quarter - Air Freight13Row Air Freight volumes (000 tons) (value_1 q_act_jan)13User Value 7220350 Mio1313----------------------------------------------------------------------------------------1313Referenced Value (value_2_PQPRIOR02)1313Document Q3_2017_Investor amp AC presentations13Chapter 36 - IRAC Income statement per quarter - Air Freight13Row Air Freight volumes (000 tons) (value_1 q_prior_jan)13User Value 6690029 Mio |

7Q3 RESULTS 2017 | 19 OCTOBER 2017 |
OCEAN FREIGHT QUARTERLY LOSS DUE TO MARGIN STAGNATION
YTD 4 volume growth Higher volumes however at lower
margin and with increased costs resulted in loss for Q3
Note Gross profit and EBIT in CHF million
YoY Growth Q3 Q4 Q1 Q2 Q3Volume (market estimated) 0 3 4 3 3
Volume (Panalpina) -9 1 7 3 2
GPTEU -2 -18 -17 -7 -5
Gross Profit -10 -16 -11 -5 -3
2017
2016 2017Gross Profit EBIT YTD YTDGross Profit 3450 3234 -6
EBIT (adjusted PY) 160 -55 -135
EBITGP () 46 -17
Volumes (TEUs 000) 10995 11426 4
379 389 374 383 386
296
254
282 285 282
Q3 2016 Q4 2016 Q1 2017 Q2 2017 Q3 2017
TEU GPTEU
TEU (in 000) GPTEU (in CHF)
51
-51 -32
06
-29
45
-51 -30
06
-27
Q3 2016 Q4 2016 Q1 2017 Q2 2017 Q3 2017
EBIT AND EBITGP MARGIN
EBIT (adjusted PY) EBITGP margin () (adjusted PY)
SNVeryHiddenParameterSheet
Sheet1
charts
TEU GPTEU
TEU (in 000)
Q3 2016Q4 2016Q1 2017Q2 2017Q3 2017379389374382838560500000000002GPTEU (in CHF)
Q3 2016Q4 2016Q1 2017Q2 2017Q3 20172962542822849460000000000328207499999999999
EBIT AND EBITGP MARGIN
EBIT (adjusted PY)
Q3 2016Q4 2016Q1 2017Q2 2017Q3 201750999999999999996-50999999999999996-3205806-29489999999999998EBITGP margin () (adjusted PY)
Q3 2016Q4 2016Q1 2017Q2 2017Q3 201745-50999999999999996-305806-271
SNVeryHiddenParameterSheet
Sheet1
charts
TEU GPTEU
TEU (in 000)
Q3 2016Q4 2016Q1 2017Q2 2017Q3 2017379389374382838560500000000002GPTEU (in CHF)
Q3 2016Q4 2016Q1 2017Q2 2017Q3 20172962542822849460000000000328207499999999999
EBIT AND EBITGP MARGIN
EBIT (adjusted PY)
Q3 2016Q4 2016Q1 2017Q2 2017Q3 201750999999999999996-50999999999999996-3205806-29489999999999998EBITGP margin () (adjusted PY)
Q3 2016Q4 2016Q1 2017Q2 2017Q3 201745-50999999999999996-305806-271
Chart1
TEU GPTEU
TEU (in 000)
Q3 2016Q4 2016Q1 2017Q2 2017Q3 2017379389374382838560500000000002GPTEU (in CHF)
Q3 2016Q4 2016Q1 2017Q2 2017Q3 20172962542822849460000000000328207499999999999
SNVeryHiddenParameterSheet
Sheet1
charts
TEU GPTEU
TEU (in 000)
Q3 2016Q4 2016Q1 2017Q2 2017Q3 2017379389374382838560500000000002GPTEU (in CHF)
Q3 2016Q4 2016Q1 2017Q2 2017Q3 20172962542822849460000000000328207499999999999
EBIT AND EBITGP MARGIN
EBIT (adjusted PY)
Q3 2016Q4 2016Q1 2017Q2 2017Q3 201750999999999999996-50999999999999996-3205806-29489999999999998EBITGP margin () (adjusted PY)
Q3 2016Q4 2016Q1 2017Q2 2017Q3 201745-50999999999999996-305806-271
Chart2
EBIT AND EBITGP MARGIN
EBIT (adjusted PY)
Q3 2016Q4 2016Q1 2017Q2 2017Q3 201750999999999999996-50999999999999996-3205806-29489999999999998EBITGP margin () (adjusted PY)
Q3 2016Q4 2016Q1 2017Q2 2017Q3 201745-50999999999999996-305806-271
SNVeryHiddenParameterSheet
Sheet1
charts
TEU GPTEU
TEU (in 000)
Q3 2016Q4 2016Q1 2017Q2 2017Q3 2017379389374382838560500000000002GPTEU (in CHF)
Q3 2016Q4 2016Q1 2017Q2 2017Q3 20172962542822849460000000000328207499999999999
EBIT AND EBITGP MARGIN
EBIT (adjusted PY)
Q3 2016Q4 2016Q1 2017Q2 2017Q3 201750999999999999996-50999999999999996-3205806-29489999999999998EBITGP margin () (adjusted PY)
Q3 2016Q4 2016Q1 2017Q2 2017Q3 201745-50999999999999996-305806-271
8Q3 RESULTS 2017 | 19 OCTOBER 2017 |
LOGISTICS IMPROVED PROFITABILITY
Top-line has stabilized Focus on growth
EBIT-over-NFR-margin of 20
Note Gross profit and EBIT in CHF million
2016 2017
Gross Profit EBIT YTD YTD
Gross Profit 2933 2454 -16
EBIT (adjusted PY) 50 81 63
NFR in of EBIT 10 20
YoY Growth Q3 Q4 Q1 Q2 Q3
Gross Profit -6 -11 -16 -19 -14
2017
94 9283 81 81
Q3 2016 Q4 2016 Q1 2017 Q2 2017 Q3 2017
GROSS PROFIT
0905
24
3127
Q3 2016 Q4 2016 Q1 2017 Q2 2017 Q3 2017
EBIT (ADJUSTED PY)
SNVeryHiddenParameterSheet
Table
charts
GROSS PROFIT
Q3 2016Q4 2016Q1 2017Q2 2017Q3 201794928381348148
EBIT (ADJUSTED PY)
Q3 2016Q4 2016Q1 2017Q2 2017Q3 2017090524306271
SNVeryHiddenParameterSheet
Table
charts
GROSS PROFIT
Q3 2016Q4 2016Q1 2017Q2 2017Q3 201794928381348148
EBIT (ADJUSTED PY)
Q3 2016Q4 2016Q1 2017Q2 2017Q3 2017090524306271
Chart1
GROSS PROFIT
Q3 2016Q4 2016Q1 2017Q2 2017Q3 201794928381348148
SNVeryHiddenParameterSheet
Table
charts
GROSS PROFIT
Q3 2016Q4 2016Q1 2017Q2 2017Q3 201794928381348148
EBIT (ADJUSTED PY)
Q3 2016Q4 2016Q1 2017Q2 2017Q3 2017090524306271
Chart2
EBIT (ADJUSTED PY)
Q3 2016Q4 2016Q1 2017Q2 2017Q3 2017090524306271
SNVeryHiddenParameterSheet
Table
charts
GROSS PROFIT
Q3 2016Q4 2016Q1 2017Q2 2017Q3 201794928381348148
EBIT (ADJUSTED PY)
Q3 2016Q4 2016Q1 2017Q2 2017Q3 2017090524306271
9Q3 RESULTS 2017 | 19 OCTOBER 2017 |
OUTLOOK AND PRIORITIES 2017
10Q3 RESULTS 2017 | 19 OCTOBER 2017 |
OUTLOOK AND PRIORITIES 2017
OUTLOOK Market
minus Air continuous strong volumes expected but growth rate slowing down (tough Q4 2016 comparison)
minus Ocean Soft market conditions Q4
Panalpina
minus Air margin impact of peak season difficult to anticipate
minus Ocean spot market rates have decreased lately and a slight margin improvement could be expected
PRIORITIES
Focus on topline growth and further improvement of unit profitability
Improve EBIT in Ocean Freight
Accelerate growth through selected bolt-on acquisitions
Maintain cost discipline and push ahead operations transformation program
11Q3 RESULTS 2017 | 19 OCTOBER 2017 |
YEAR-END RESULTS
MARCH 7 2018
NEXT EVENTS
12Q3 RESULTS 2017 | 19 OCTOBER 2017 |
DISCLAIMER
Investing in the shares of Panalpina World Transport (Holding) Ltd involves risks Prospective investors are strongly requested to consult their investment advisors and tax advisors prior to investing in shares of Panalpina World Transport (Holding) Ltd
This document contains forward-looking statements which involve risks and uncertainties These statements may be identified by such words as ldquomayrdquo ldquoplansrdquo ldquoexpectsrdquo ldquobelievesrdquo and similar expressions or by their context These statements are made on the basis of current knowledge and assumptions Various factors could cause actual future results performance or events to differ materially from those described in these statements No obligation is assumed to update any forward-looking statements Potential risks and uncertainties include such factors as general economic conditions foreign exchange fluctuations competitive product and pricing pressures and regulatory developments
The information contained in this document has not been independently verified and no representation or warranty express or implied is made to and no reliance should be placed on the fairness accuracy completeness or correctness of the information or opinions contained herein The information in this presentation is subject to change without notice it may be incomplete or condensed and it may not contain all material information concerning the Panalpina Group None of Panalpina World Transport (Holding) Ltd or their respective affiliates shall have any liability whatsoever for any loss whatsoever arising from any use of this document or its content or otherwise arising in connection with this document
This document does not constitute or form part of an offer to sell or a solicitation of an offer to purchase any shares and neither it nor any part of it shall form the basis of or be relied upon in connection with any contract or commitment whatsoever This information does neither constitute an offer to buy shares of Panalpina World Transport (Holding) Ltd nor a prospectus within the meaning of the applicable Swiss law
13Q3 RESULTS 2017 | 19 OCTOBER 2017 |
APPENDIX
14Q3 RESULTS 2017 | 19 OCTOBER 2017 |
INCOME STATEMENT PER QUARTER ndash GROUP
Note Group figures in CHF million
Group Q1 2016 Q2 2016 Q3 2016 Q3YTD Q4 2016 FY 2016 Q1 2017 Q2 2017 Q3 2017 Q3YTD 2017Net forwarding revenue 13072 12894 12670 38635 13325 51960 12772 13549 14334 40655 Forwarding expenses (9423) (9180) (9116) (27718) (9996) (37714) (9445) (10145) (10818) (30407)Gross profit 3649 3714 3554 10917 3329 14246 3327 3404 3516 10248 Personnel expenses (2250) (2213) (2129) (6592) (2113) (8705) (2164) (2162) (2186) (6511)Other operating expenses (1037) (1011) (971) (3018) (927) (3945) (893) (880) (925) (2698)EBITDA adjusted 362 491 454 1307 289 1596 271 362 406 1039 Depreciation of property plant and equip (62) (62) (62) (187) (71) (258) (53) (54) (50) (156)Amortization of intangible assets (60) (60) (63) (183) (56) (239) (54) (52) (55) (162)EBIT adjusted 240 368 329 936 163 1099 164 256 301 721 in of gross profit 66 99 92 86 49 77 49 75 86 70Non-recurring itemsRestructuring expenses 00 (261) 00 (261) (19) (280) 00 00 00 00
EBIT reported 240 107 329 675 144 820 164 256 301 721 in of gross profit 66 29 92 62 43 58 49 75 86 70Financial result (09) 07 (04) (06) 02 (04) 02 01 (04) (02)Earnings before taxes (EBT) 231 114 325 670 146 816 165 257 297 719 Income tax expenses (58) (69) (79) (205) (88) (293) (42) (81) (112) (235) of EBT 250 602 242 306 601 359 252 316 378 327Profit 173 45 246 465 58 523 124 176 185 484 Earnings per share 075 021 106 201 027 229 054 075 079 208
SNVeryHiddenParameterSheet
PAN_ISpQ_Group
image1png
15Q3 RESULTS 2017 | 19 OCTOBER 2017 |
INCOME STATEMENT PER QUARTER ndash AIR FREIGHT
Note Air Freight figures in CHF million
Air Freight Q1 2016 Q2 2016 Q3 2016 Q3YTD 2016 Q4 2016 FY 2016 Q1 2017 Q2 2017 Q3 2017 Q3 YTD 2017Net forwarding revenue 6332 6359 6341 19032 7234 26267 6571 7000 7389 20960 Forwarding expenses (4846) (4800) (4853) (14499) (5816) (20315) (5125) (5500) (5775) (16400)Gross profit 1486 1559 1489 4534 1418 5952 1447 1500 1614 4560 Personnel expenses (885) (869) (847) (2600) (873) (3473) (905) (916) (928) (2750)Other operating expenses (371) (359) (318) (1048) (284) (1333) (324) (317) (337) (978)EBITDA adjusted 230 331 324 885 261 1146 218 266 349 833 Depreciation and amortization (52) (52) (55) (158) (53) (211) (46) (47) (46) (139)EBIT adjusted 178 279 269 726 208 935 171 220 303 694 in of gross profit 120 179 181 160 147 157 118 146 188 152Non-recurring itemsRestructuring expenses 00 (127) 00 (127) 00 (127) 00 00 00 00
EBIT reported 178 153 269 600 208 808 171 220 303 694 in of gross profit 120 98 181 132 147 136 118 146 188 152
Air Freight volumes (000 tons) 2161 2251 2278 6690 2524 9214 2332 2399 2489 7220 change YoY 54 111 99 88 141 102 79 66 93 79GPton (CHF) 688 693 653 678 562 646 620 625 648 632 change YoY -47 -36 -73 -52 -140 -75 -98 -97 -08 -68
SNVeryHiddenParameterSheet
PAN_ISpQ_AirFreight
image1png
16Q3 RESULTS 2017 | 19 OCTOBER 2017 |
INCOME STATEMENT PER QUARTER ndash OCEAN FREIGHT
Note Ocean Freight figures in CHF million
Ocean Freight Q1 2016 Q2 2016 Q3 2016 Q3YTD 2016 Q4 2016 FY 2016 Q1 2017 Q2 2017 Q3 2017 Q3YTD 2017Net forwarding revenue 5338 4921 4955 15214 4770 19984 4915 5172 5551 15637 Forwarding expenses (4157) (3773) (3834) (11764) (3783) (15547) (3860) (4081) (4463) (12404)Gross profit 1181 1148 1121 3450 987 4438 1055 1091 1088 3234 Personnel expenses (791) (752) (755) (2298) (721) (3019) (779) (784) (788) (2352)Other operating expenses (305) (288) (274) (868) (275) (1144) (271) (265) (290) (827)EBITDA adjusted 84 108 92 284 (09) 275 05 41 09 55 Depreciation and amortization (41) (42) (41) (124) (42) (166) (36) (36) (38) (110)EBIT adjusted 43 66 51 160 (51) 109 (32) 06 (29) (55)in of gross profit 37 58 45 46 -51 25 -30 05 -27 -17Non-recurring itemsRestructuring expenses 00 (97) 0 (97) (19) (115) 00 00 00 00
EBIT reported 43 (30) 51 63 (69) (06) (32) 06 (29) (55)in of gross profit 37 -26 45 18 -70 -01 -30 05 -27 -17
Ocean Freight volumes (000 tons) 3482 3726 3787 10995 3890 14885 3742 3828 3856 11426 change YoY -100 -82 -88 -90 08 -66 75 27 18 39GPTEU (CHF) 339 308 296 314 254 298 282 285 282 283 change YoY 102 59 -16 47 -176 -11 -169 -75 -47 -98
SNVeryHiddenParameterSheet
PAN_ISpQ_OceanFreight
image1png
17Q3 RESULTS 2017 | 19 OCTOBER 2017 |
INCOME STATEMENT PER QUARTER ndash LOGISTICS
Note Logistics figures in CHF million
Logistics Q1 2016 Q2 2016 Q3 2016 Q3YTD 2016 Q4 2016 FY 2016 Q1 2017 Q2 2017 Q3 2017 Q3YTD 2017Net forwarding revenue 1402 1613 1374 4389 1321 5709 1286 1377 1394 4057 Forwarding expenses (420) (607) (429) (1456) (397) (1853) (460) (564) (580) (1604)Gross profit 982 1006 944 2933 924 3857 825 813 815 2454 Personnel expenses (574) (591) (528) (1694) (519) (2213) (479) (461) (469) (1409)Other operating expenses (360) (363) (378) (1102) (367) (1469) (298) (298) (298) (894)EBITDA adjusted 48 52 38 138 37 175 48 54 48 151 Depreciation and amortization (29) (29) (29) (88) (32) (119) (25) (24) (21) (69)EBIT adjusted 18 23 09 50 05 56 24 31 27 81 Non-recurring itemsRestructuring expenses 00 (38) 00 (38) 00 (38) 00 00 00 00
EBIT reported 18 (15) 09 12 05 18 24 31 27 81
SNVeryHiddenParameterSheet
PAN_ISpQ_Logistics
image1png
18Q3 RESULTS 2017 | 19 OCTOBER 2017 |
BALANCE SHEET
CHF Cash and cash equivalents 3888 2946 (942) -24Trade receivables unbilled forwarding services 9087 9893 806 9Other current assets 1025 1167 142 14Property plant and equipment 635 803 168 26Intangible assets 979 917 (62) -6Other non-current assets 990 1133 143 14Total assets 16606 16859 253 2
Short-term borrowings 23 21 (02) -10Trade payables accured cost of services 6524 7075 551 8Other current liabilities 2439 2254 (185) -8Long-Term borrowings 00 20 20 naOther long-term liabilities 1449 1527 78 5Total liabilities 10436 10896 460 4Share capital 24 24 (00) -1Reserves treasury shares 6057 5884 (173) -3Non-controlling interests 89 55 (34) -38Total equity 6170 5963 (207) -3Total equity and liabilities 16606 16859 253 2
31-Dec-16 30-Sept-17Change in
SNVeryHiddenParameterSheet
PAN_BalanceSheet
image1png
19Q3 RESULTS 2017 | 19 OCTOBER 2017 |
CASH FLOW
Note Figures in CHF million
30-Sep-16 30-Sep-17Change in
Cash flow before changes in working capital 1029 1075 Changes in working capital 357 (477)Cash from operations 1386 599
Interest and income taxes paid (292) (331)Net cash from operating activities 1094 267 -76
Net cash from investing activities (342) (409) 20
Free cash flow 752 (141) -119
Net cash used in financing activities (858) (894) 4
Net increase (decrease) in cash and cash equivalents (106) (1035)Cash and cash equivalents at beginning of period 3923 3888 Effect of exchange rate changes (17) 93 Cash and cash equivalents at end of period 3799 2946
SNVeryHiddenParameterSheet
Tabele PAN_Cashflow
Reported cash and cash equivalents at 31122016Profit YTD 092017Other non-cash items (eg DampA)Changes in working capitalInterest and income taxes paidNet cash from investing activitiesFinancing activitiesdividendEffect of exchange rate changesReported cash and cash equivalents at 300920173887843716999999999996448614155374652852799999999999728527999999999997Reported cash and cash equivalents at 31122016Profit YTD 092017Other non-cash items (eg DampA)Changes in working capitalInterest and income taxes paidNet cash from investing activitiesFinancing activitiesdividendEffect of exchange rate changesReported cash and cash equivalents at 30092017388784839591476633114085893793329463
- Nine months results 2017
- Slide Number 2
- ACHIEVEMENTS and key figures
- Third consecutive quarter with GP and EBIT Growth
- Operating and financial review
- Air Freight Strong and profitable growth
- Ocean Freight quarterly loss due to margin Stagnation
- Logistics improved profitability
- Outlook and priorities 2017
- outlook and priorities 2017
- Next EVENTs
- Disclaimer
- Appendix
- Income statement per quarter ndash Group
- Income statement per quarter ndash Air Freight
- Income statement per quarter ndash Ocean Freight
- Income statement per quarter ndash Logistics
- Balance sheet
- Cash flow
-
| 30-Sep-16 | 30-Sep-17 | Change in | ||||||||||||||||||||||||||||||||||||||||||||||||||||||
| Cash flow before changes in working capital | 1029 | 1075 | r2 PAC Hamon Pierrick Referenced Value (value_1_PQACTJAN02)1313Document Q3_2017_Quarter_Report13Chapter Consolidated Statement of Cash Flows13Row ltlt Subtotal cash flow from operations gtgt (ltlt 2017 gtgt q_act_jan)13User Value 10749 Tsd | PY IS MANUAL | ||||||||||||||||||||||||||||||||||||||||||||||||||||
| Changes in working capital | 357 | (477) | r3 PAC Hamon Pierrick Referenced Value (value_1_PQACTJAN02)1313Document Q3_2017_Quarter_Report13Chapter Consolidated Statement of Cash Flows1313-7973 Tsd - ltlt (Increase) decrease receivables other current assets and unbilled forwarding services gtgt (ltlt 2017 gtgt q_act_jan)134406 Tsd - ltlt Increase (decrease) payables and accruals incl accrued cost of service gtgt (ltlt 2017 gtgt q_act_jan)13-472 Tsd - ltlt Increase (decrease) non-current provisions and other liabilities gtgt (ltlt 2017 gtgt q_act_jan)13-749 Tsd - ltlt Increase (decrease) current provisions and other liabilities gtgt (ltlt 2017 gtgt q_act_jan)13---------------------13-4787 Tsd (Total) | |||||||||||||||||||||||||||||||||||||||||||||||||||||
| Cash from operations | 1386 | 599 | r4 PAC Hamon Pierrick Referenced Value (value_1_PQACTJAN02)1313Document Q3_2017_Quarter_Report13Chapter Consolidated Statement of Cash Flows13Row ltlt Cash generated from operations gtgt (ltlt 2017 gtgt q_act_jan)13User Value 5963 Tsd | |||||||||||||||||||||||||||||||||||||||||||||||||||||
| Interest and income taxes paid | (292) | (331) | r6 PAC Hamon Pierrick Referenced Value (value_1_PQACTJAN02)1313Document Q3_2017_Quarter_Report13Chapter Consolidated Statement of Cash Flows1313-136 Tsd - ltlt Interest paid gtgt (ltlt 2017 gtgt q_act_jan)13-3175 Tsd - ltlt Income taxes paid gtgt (ltlt 2017 gtgt q_act_jan)13---------------------13-3311 Tsd (Total) | |||||||||||||||||||||||||||||||||||||||||||||||||||||
| Net cash from operating activities | 1094 | 267 | -76 | r7 PAC Hamon Pierrick Referenced Value (value_1_PQACTJAN02)1313Document Q3_2017_Quarter_Report13Chapter Consolidated Statement of Cash Flows13Row ltlt Net cash from operating activities gtgt (ltlt 2017 gtgt q_act_jan)13User Value 2652 Tsd | ||||||||||||||||||||||||||||||||||||||||||||||||||||
| Net cash from investing activities | (342) | (409) | 20 | r9 PAC Hamon Pierrick Referenced Value (value_1_PQACTJAN02)1313Document Q3_2017_Quarter_Report13Chapter Consolidated Statement of Cash Flows13Row ltlt Net cash used in investing activities gtgt (ltlt 2017 gtgt q_act_jan)13User Value -4063 Tsd | ||||||||||||||||||||||||||||||||||||||||||||||||||||
| Free cash flow | 752 | (141) | -119 | r11 PAC Hamon Pierrick Referenced Value (value_1_PQACTJAN02)1313Document Q3_2017_Quarter_Report13Chapter Consolidated Statement of Cash Flows13Row ltlt Free cash flow gtgt (ltlt 2017 gtgt q_act_jan)13User Value -1411 Tsd | ||||||||||||||||||||||||||||||||||||||||||||||||||||
| Net cash used in financing activities | (858) | (894) | 4 | r13 PAC Hamon Pierrick Referenced Value (value_1_PQACTJAN02)1313Document Q3_2017_Quarter_Report13Chapter Consolidated Statement of Cash Flows13Row ltlt Net cash used in financing activities gtgt (ltlt 2017 gtgt q_act_jan)13User Value -8937 Tsd | ||||||||||||||||||||||||||||||||||||||||||||||||||||
| Net increase (decrease) in cash and cash equivalents | (106) | (1035) | r15 PAC Hamon Pierrick Referenced Value (value_1_PQACTJAN02)1313Document Q3_2017_Quarter_Report13Chapter Consolidated Statement of Cash Flows13Row ltlt Net increase (decrease) in cash and cash equivalents gtgt (ltlt 2017 gtgt q_act_jan)13User Value -10348 Tsd | |||||||||||||||||||||||||||||||||||||||||||||||||||||
| Cash and cash equivalents at beginning of period | 3923 | 3888 | r16 PAC Hamon Pierrick Referenced Value (value_1_PQACTJAN02)1313Document Q3_2017_Quarter_Report13Chapter Consolidated Statement of Cash Flows13Row ltlt Cash and cash equivalents at the beginning of the period gtgt (ltlt 2017 gtgt q_act_jan)13User Value 38878 Tsd | |||||||||||||||||||||||||||||||||||||||||||||||||||||
| Effect of exchange rate changes | (17) | 93 | r17 PAC Hamon Pierrick Referenced Value (value_1_PQACTJAN02)1313Document Q3_2017_Quarter_Report13Chapter Consolidated Statement of Cash Flows13Row ltlt Effect of exchange rate changes on cash and cash equivalents gtgt (ltlt 2017 gtgt q_act_jan)13User Value 933 Tsd | |||||||||||||||||||||||||||||||||||||||||||||||||||||
| Cash and cash equivalents at end of period | 3799 | 2946 | r18 PAC Hamon Pierrick Referenced Value (value_1_PQACTJAN02)1313Document Q3_2017_Quarter_Report13Chapter Consolidated Statement of Cash Flows13Row ltlt Cash and cash equivalents at the end of the period gtgt (ltlt 2017 gtgt q_act_jan)13User Value 29463 Tsd | |||||||||||||||||||||||||||||||||||||||||||||||||||||
| Reported cash and cash equivalents at 31122016 | 3888 | r21 PAC Hamon Pierrick Referenced Value (value_1_PQACTJAN02)1313Document Q3_2017_Quarter_Report13Chapter Consolidated Statement of Cash Flows13Row ltlt Cash and cash equivalents at the beginning of the period gtgt (ltlt 2017 gtgt q_act_jan)13User Value 38878 Tsd | Reported cash and cash equivalents at 31122016 | 3888 | ||||||||||||||||||||||||||||||||||||||||||||||||||||
| Profit YTD 092017 | 4839 | r19 PAC Hamon Pierrick Referenced Value (value_1_PQACTJAN02)1313Document Q3_2017_Quarter_Report13Chapter Consolidated Statement of Cash Flows13Row ltlt Profit gtgt (ltlt 2017 gtgt q_act_jan)13User Value 4839 Tsd | Profit YTD 092017 | 3888 | 484 | |||||||||||||||||||||||||||||||||||||||||||||||||||
| Other non-cash items (eg DampA) | 591 | r23 PAC Hamon Pierrick Referenced Value (value_1_PQACTJAN02)1313Document Q3_2017_Quarter_Report13Chapter Consolidated Statement of Cash Flows13131565 Tsd - ltlt Depreciation of property plant and equipment gtgt (ltlt 2017 gtgt q_act_jan)131616 Tsd - ltlt Amortization of intangible assets gtgt (ltlt 2017 gtgt q_act_jan)13-165 Tsd - ltlt Interest income and dividend on available-for-sale financial assets gtgt (ltlt 2017 gtgt q_act_jan)13-167 Tsd - ltlt Exchange differences gtgt (ltlt 2017 gtgt q_act_jan)13-025 Tsd - ltlt Loss (gain) on sales of property plant and equipment gtgt (ltlt 2017 gtgt q_act_jan)13000 Tsd - ltlt Loss (gain) on sales of financial assets gtgt (ltlt 2017 gtgt q_act_jan)13497 Tsd - ltlt Expenses for share-based compensation plans gtgt (ltlt 2017 gtgt q_act_jan)13238 Tsd - ltlt Other non-cash (income) and expenses gtgt (ltlt 2017 gtgt q_act_jan)132351 Tsd - ltlt Income tax expenses gtgt (ltlt 2017 gtgt q_act_jan)13---------------------135910 Tsd (Total) | Other non-cash items (eg DampA) | 4372 | 591 | |||||||||||||||||||||||||||||||||||||||||||||||||||
| Changes in working capital | -4766 | r24 PAC Hamon Pierrick Referenced Value (value_1_PQACTJAN02)1313Document Q3_2017_Quarter_Report13Chapter Consolidated Statement of Cash Flows1313-7973 Tsd - ltlt (Increase) decrease receivables other current assets and unbilled forwarding services gtgt (ltlt 2017 gtgt q_act_jan)134406 Tsd - ltlt Increase (decrease) payables and accruals incl accrued cost of service gtgt (ltlt 2017 gtgt q_act_jan)13-472 Tsd - ltlt Increase (decrease) non-current provisions and other liabilities gtgt (ltlt 2017 gtgt q_act_jan)13-749 Tsd - ltlt Increase (decrease) current provisions and other liabilities gtgt (ltlt 2017 gtgt q_act_jan)13---------------------13-4787 Tsd (Total) | Changes in working capital | 4486 | 477 | neg | ||||||||||||||||||||||||||||||||||||||||||||||||||
| Interest and income taxes paid | -3311 | r25 PAC Hamon Pierrick Referenced Value (value_1_PQACTJAN02)1313Document Q3_2017_Quarter_Report13Chapter Consolidated Statement of Cash Flows1313-136 Tsd - ltlt Interest paid gtgt (ltlt 2017 gtgt q_act_jan)13-3175 Tsd - ltlt Income taxes paid gtgt (ltlt 2017 gtgt q_act_jan)13---------------------13-3311 Tsd (Total) | Interest and income taxes paid | 4155 | 331 | neg | ||||||||||||||||||||||||||||||||||||||||||||||||||
| Net cash from investing activities | -4085 | r26 PAC Hamon Pierrick Referenced Value (value_1_PQACTJAN02)1313Document Q3_2017_Quarter_Report13Chapter Consolidated Statement of Cash Flows13Row ltlt Net cash used in investing activities gtgt (ltlt 2017 gtgt q_act_jan)13User Value -4063 Tsd | Net cash from investing activities | 3747 | 409 | neg | ||||||||||||||||||||||||||||||||||||||||||||||||||
| Financing activitiesdividend | -8937 | r27 PAC Hamon Pierrick Referenced Value (value_1_PQACTJAN02)1313Document Q3_2017_Quarter_Report13Chapter Consolidated Statement of Cash Flows13Row ltlt Net cash used in financing activities gtgt (ltlt 2017 gtgt q_act_jan)13User Value -8937 Tsd | Financing activitiesdividend | 2853 | 894 | neg | ||||||||||||||||||||||||||||||||||||||||||||||||||
| Effect of exchange rate changes | 933 | r28 PAC Hamon Pierrick Referenced Value (value_1_PQACTJAN02)1313Document Q3_2017_Quarter_Report13Chapter Consolidated Statement of Cash Flows13Row ltlt Effect of exchange rate changes on cash and cash equivalents gtgt (ltlt 2017 gtgt q_act_jan)13User Value 933 Tsd | Effect of exchange rate changes | 2853 | 93 | |||||||||||||||||||||||||||||||||||||||||||||||||||
| Reported cash and cash equivalents at 30092017 | 29463 | r29 PAC Hamon Pierrick Referenced Value (value_1_PQACTJAN02)1313Document Q3_2017_Quarter_Report13Chapter Consolidated Statement of Cash Flows13Row ltlt Cash and cash equivalents at the end of the period gtgt (ltlt 2017 gtgt q_act_jan)13User Value 29463 Tsd | PAC Hamon Pierrick Referenced Value (value_1_PQACTJAN02)1313Document Q3_2017_Quarter_Report13Chapter Consolidated Statement of Cash Flows13Row ltlt Subtotal cash flow from operations gtgt (ltlt 2017 gtgt q_act_jan)13User Value 10749 Tsd | PAC Hamon Pierrick Referenced Value (value_1_PQACTJAN02)1313Document Q3_2017_Quarter_Report13Chapter Consolidated Statement of Cash Flows1313-7973 Tsd - ltlt (Increase) decrease receivables other current assets and unbilled forwarding services gtgt (ltlt 2017 gtgt q_act_jan)134406 Tsd - ltlt Increase (decrease) payables and accruals incl accrued cost of service gtgt (ltlt 2017 gtgt q_act_jan)13-472 Tsd - ltlt Increase (decrease) non-current provisions and other liabilities gtgt (ltlt 2017 gtgt q_act_jan)13-749 Tsd - ltlt Increase (decrease) current provisions and other liabilities gtgt (ltlt 2017 gtgt q_act_jan)13---------------------13-4787 Tsd (Total) | PAC Hamon Pierrick Referenced Value (value_1_PQACTJAN02)1313Document Q3_2017_Quarter_Report13Chapter Consolidated Statement of Cash Flows13Row ltlt Cash generated from operations gtgt (ltlt 2017 gtgt q_act_jan)13User Value 5963 Tsd | PAC Hamon Pierrick Referenced Value (value_1_PQACTJAN02)1313Document Q3_2017_Quarter_Report13Chapter Consolidated Statement of Cash Flows1313-136 Tsd - ltlt Interest paid gtgt (ltlt 2017 gtgt q_act_jan)13-3175 Tsd - ltlt Income taxes paid gtgt (ltlt 2017 gtgt q_act_jan)13---------------------13-3311 Tsd (Total) | PAC Hamon Pierrick Referenced Value (value_1_PQACTJAN02)1313Document Q3_2017_Quarter_Report13Chapter Consolidated Statement of Cash Flows13Row ltlt Net cash from operating activities gtgt (ltlt 2017 gtgt q_act_jan)13User Value 2652 Tsd | PAC Hamon Pierrick Referenced Value (value_1_PQACTJAN02)1313Document Q3_2017_Quarter_Report13Chapter Consolidated Statement of Cash Flows13Row ltlt Net cash used in investing activities gtgt (ltlt 2017 gtgt q_act_jan)13User Value -4063 Tsd | PAC Hamon Pierrick Referenced Value (value_1_PQACTJAN02)1313Document Q3_2017_Quarter_Report13Chapter Consolidated Statement of Cash Flows13Row ltlt Free cash flow gtgt (ltlt 2017 gtgt q_act_jan)13User Value -1411 Tsd | PAC Hamon Pierrick Referenced Value (value_1_PQACTJAN02)1313Document Q3_2017_Quarter_Report13Chapter Consolidated Statement of Cash Flows13Row ltlt Net cash used in financing activities gtgt (ltlt 2017 gtgt q_act_jan)13User Value -8937 Tsd | PAC Hamon Pierrick Referenced Value (value_1_PQACTJAN02)1313Document Q3_2017_Quarter_Report13Chapter Consolidated Statement of Cash Flows13Row ltlt Net increase (decrease) in cash and cash equivalents gtgt (ltlt 2017 gtgt q_act_jan)13User Value -10348 Tsd | PAC Hamon Pierrick Referenced Value (value_1_PQACTJAN02)1313Document Q3_2017_Quarter_Report13Chapter Consolidated Statement of Cash Flows13Row ltlt Cash and cash equivalents at the beginning of the period gtgt (ltlt 2017 gtgt q_act_jan)13User Value 38878 Tsd | PAC Hamon Pierrick Referenced Value (value_1_PQACTJAN02)1313Document Q3_2017_Quarter_Report13Chapter Consolidated Statement of Cash Flows13Row ltlt Effect of exchange rate changes on cash and cash equivalents gtgt (ltlt 2017 gtgt q_act_jan)13User Value 933 Tsd | PAC Hamon Pierrick Referenced Value (value_1_PQACTJAN02)1313Document Q3_2017_Quarter_Report13Chapter Consolidated Statement of Cash Flows13Row ltlt Cash and cash equivalents at the end of the period gtgt (ltlt 2017 gtgt q_act_jan)13User Value 29463 Tsd | PAC Hamon Pierrick Referenced Value (value_1_PQACTJAN02)1313Document Q3_2017_Quarter_Report13Chapter Consolidated Statement of Cash Flows13Row ltlt Cash and cash equivalents at the beginning of the period gtgt (ltlt 2017 gtgt q_act_jan)13User Value 38878 Tsd | PAC Hamon Pierrick Referenced Value (value_1_PQACTJAN02)1313Document Q3_2017_Quarter_Report13Chapter Consolidated Statement of Cash Flows13Row ltlt Profit gtgt (ltlt 2017 gtgt q_act_jan)13User Value 4839 Tsd | PAC Hamon Pierrick Referenced Value (value_1_PQACTJAN02)1313Document Q3_2017_Quarter_Report13Chapter Consolidated Statement of Cash Flows13131565 Tsd - ltlt Depreciation of property plant and equipment gtgt (ltlt 2017 gtgt q_act_jan)131616 Tsd - ltlt Amortization of intangible assets gtgt (ltlt 2017 gtgt q_act_jan)13-165 Tsd - ltlt Interest income and dividend on available-for-sale financial assets gtgt (ltlt 2017 gtgt q_act_jan)13-167 Tsd - ltlt Exchange differences gtgt (ltlt 2017 gtgt q_act_jan)13-025 Tsd - ltlt Loss (gain) on sales of property plant and equipment gtgt (ltlt 2017 gtgt q_act_jan)13000 Tsd - ltlt Loss (gain) on sales of financial assets gtgt (ltlt 2017 gtgt q_act_jan)13497 Tsd - ltlt Expenses for share-based compensation plans gtgt (ltlt 2017 gtgt q_act_jan)13238 Tsd - ltlt Other non-cash (income) and expenses gtgt (ltlt 2017 gtgt q_act_jan)132351 Tsd - ltlt Income tax expenses gtgt (ltlt 2017 gtgt q_act_jan)13---------------------135910 Tsd (Total) | PAC Hamon Pierrick Referenced Value (value_1_PQACTJAN02)1313Document Q3_2017_Quarter_Report13Chapter Consolidated Statement of Cash Flows1313-7973 Tsd - ltlt (Increase) decrease receivables other current assets and unbilled forwarding services gtgt (ltlt 2017 gtgt q_act_jan)134406 Tsd - ltlt Increase (decrease) payables and accruals incl accrued cost of service gtgt (ltlt 2017 gtgt q_act_jan)13-472 Tsd - ltlt Increase (decrease) non-current provisions and other liabilities gtgt (ltlt 2017 gtgt q_act_jan)13-749 Tsd - ltlt Increase (decrease) current provisions and other liabilities gtgt (ltlt 2017 gtgt q_act_jan)13---------------------13-4787 Tsd (Total) | PAC Hamon Pierrick Referenced Value (value_1_PQACTJAN02)1313Document Q3_2017_Quarter_Report13Chapter Consolidated Statement of Cash Flows1313-136 Tsd - ltlt Interest paid gtgt (ltlt 2017 gtgt q_act_jan)13-3175 Tsd - ltlt Income taxes paid gtgt (ltlt 2017 gtgt q_act_jan)13---------------------13-3311 Tsd (Total) | Reported cash and cash equivalents at 30092017 | 2946 | 3888 | ||||||||||||||||||||||||||||||||||
| 484 | ||||||||||||||||||||||||||||||||||||||||||||||||||||||||
| 591 | ||||||||||||||||||||||||||||||||||||||||||||||||||||||||
| (479) | ||||||||||||||||||||||||||||||||||||||||||||||||||||||||
| (331) | ||||||||||||||||||||||||||||||||||||||||||||||||||||||||
| (406) | ||||||||||||||||||||||||||||||||||||||||||||||||||||||||
| (894) | ||||||||||||||||||||||||||||||||||||||||||||||||||||||||
| 93 | ||||||||||||||||||||||||||||||||||||||||||||||||||||||||
| 2946 |
| 31-Dec-16 | 30-Sept-17 | Change in | ||||||||||||||||||||||||||||||||||||||||||||||||||||||||
| CHF | ||||||||||||||||||||||||||||||||||||||||||||||||||||||||||
| Cash and cash equivalents | 3888 | 2946 | (942) | -24 | r3 PAC Hamon Pierrick Referenced Value (value_1_PQACTJAN02)1313Document Q3_2017_Quarter_Report13Chapter Consolidated Statement of Financial Position13Row ltlt Cash and cash equivalents gtgt (ltlt September 30 2017 gtgt q_act_jan)13User Value 29463 Tsd | 3888 | 3999 | 111 | 3 | |||||||||||||||||||||||||||||||||||||||||||||||||
| Trade receivables unbilled forwarding services | 9087 | 9893 | 806 | 9 | r4 PAC Hamon Pierrick Referenced Value (value_1_PQACTJAN02)1313Document Q3_2017_Quarter_Report13Chapter Consolidated Statement of Financial Position13Row ltlt Trade receivables unbilled forwarding services gtgt (ltlt September 30 2017 gtgt q_act_jan)13User Value 98929 Tsd | 9087 | 8693 | -394 | -4 | |||||||||||||||||||||||||||||||||||||||||||||||||
| Other current assets | 1025 | 1167 | 142 | 14 | r5 PAC Hamon Pierrick Referenced Value (value_1_PQACTJAN02)1313Document Q3_2017_Quarter_Report13Chapter Consolidated Statement of Financial Position13Row ltlt Other current assets gtgt (ltlt September 30 2017 gtgt q_act_jan)13User Value 11671 Tsd | 1025 | 1335 | 31 | 30 | |||||||||||||||||||||||||||||||||||||||||||||||||
| Property plant and equipment | 635 | 803 | 168 | 26 | r6 PAC Hamon Pierrick Referenced Value (value_1_PQACTJAN02)1313Document Q3_2017_Quarter_Report13Chapter Consolidated Statement of Financial Position13Row ltlt Property plant and equipment gtgt (ltlt September 30 2017 gtgt q_act_jan)13User Value 8028 Tsd | 635 | 651 | 16 | 3 | |||||||||||||||||||||||||||||||||||||||||||||||||
| Intangible assets | 979 | 917 | (62) | -6 | r7 PAC Hamon Pierrick Referenced Value (value_1_PQACTJAN02)1313Document Q3_2017_Quarter_Report13Chapter Consolidated Statement of Financial Position13Row ltlt Intangible assets gtgt (ltlt September 30 2017 gtgt q_act_jan)13User Value 9168 Tsd | 979 | 926 | -53 | -5 | |||||||||||||||||||||||||||||||||||||||||||||||||
| Other non-current assets | 990 | 1133 | 143 | 14 | r8 PAC Hamon Pierrick Referenced Value (value_1_PQACTJAN02)1313Document Q3_2017_Quarter_Report13Chapter Consolidated Statement of Financial Position13Row ltlt Other non-current assets gtgt (ltlt September 30 2017 gtgt q_act_jan)13User Value 11586 Tsd | 99 | 1073 | 83 | 8 | |||||||||||||||||||||||||||||||||||||||||||||||||
| Total assets | 16606 | 16859 | 253 | 2 | r9 PAC Hamon Pierrick Referenced Value (value_1_PQACTJAN02)1313Document Q3_2017_Quarter_Report13Chapter Consolidated Statement of Financial Position13Row ltlt Total assets gtgt (ltlt September 30 2017 gtgt q_act_jan)13User Value 168844 Tsd | 166060 | 166780 | 72 | 0 | |||||||||||||||||||||||||||||||||||||||||||||||||
| 0 | ||||||||||||||||||||||||||||||||||||||||||||||||||||||||||
| Short-term borrowings | 23 | 21 | (02) | -10 | r11 PAC Hamon Pierrick Referenced Value (value_1_PQACTJAN02)1313Document Q3_2017_Quarter_Report13Chapter Consolidated Statement of Financial Position13Row ltlt Short-term borrowings gtgt (ltlt September 30 2017 gtgt q_act_jan)13User Value 208 Tsd | 23 | 05 | -18 | -78 | |||||||||||||||||||||||||||||||||||||||||||||||||
| Trade payables accured cost of services | 6524 | 7075 | 551 | 8 | r12 PAC Hamon Pierrick Referenced Value (value_1_PQACTJAN02)1313Document Q3_2017_Quarter_Report13Chapter Consolidated Statement of Financial Position13Row ltlt Trade payables accured cost of services gtgt (ltlt September 30 2017 gtgt q_act_jan)13User Value 70745 Tsd | 6524 | 620 | -324 | -5 | |||||||||||||||||||||||||||||||||||||||||||||||||
| Other current liabilities | 2439 | 2254 | (185) | -8 | r13 PAC Hamon Pierrick Referenced Value (value_1_PQACTJAN02)1313Document Q3_2017_Quarter_Report13Chapter Consolidated Statement of Financial Position13Row ltlt Other current liabilities gtgt (ltlt September 30 2017 gtgt q_act_jan)13User Value 22538 Tsd | 2439 | 2592 | 153 | 6 | |||||||||||||||||||||||||||||||||||||||||||||||||
| Long-Term borrowings | 00 | 20 | 20 | na | r20 PAC Hamon Pierrick Referenced Value (value_1_PQACTJAN02)1313Document Q3_2017_Quarter_Report13Chapter Consolidated Statement of Financial Position13Row ltlt Long-term borrowings gtgt (ltlt September 30 2017 gtgt q_act_jan)13User Value 197 Tsd | 0 | 12 | 12 | na | |||||||||||||||||||||||||||||||||||||||||||||||||
| Other long-term liabilities | 1449 | 1527 | 78 | 5 | r21 PAC Hamon Pierrick Referenced Value (value_1_PQACTJAN02)1313Document Q3_2017_Quarter_Report13Chapter Consolidated Statement of Financial Position13Row ltlt Other long-term liabilities gtgt (ltlt September 30 2017 gtgt q_act_jan)13User Value 15270 Tsd | 1449 | 1479 | 3 | 2 | |||||||||||||||||||||||||||||||||||||||||||||||||
| Total liabilities | 10436 | 10896 | 460 | 4 | r14 PAC Hamon Pierrick Referenced Value (value_1_PQACTJAN02)1313Document Q3_2017_Quarter_Report13Chapter Consolidated Statement of Financial Position13Row ltlt Total liabilities gtgt (ltlt September 30 2017 gtgt q_act_jan)13User Value 108956 Tsd | 104360 | 102880 | -148 | -1 | |||||||||||||||||||||||||||||||||||||||||||||||||
| Share capital | 24 | 24 | (00) | -1 | r15 PAC Hamon Pierrick Referenced Value (value_1_PQACTJAN02)1313Document Q3_2017_Quarter_Report13Chapter Consolidated Statement of Financial Position13Row ltlt Share capital gtgt (ltlt September 30 2017 gtgt q_act_jan)13User Value 238 Tsd | 24 | 24 | 0 | 0 | |||||||||||||||||||||||||||||||||||||||||||||||||
| Reserves treasury shares | 6057 | 5884 | (173) | -3 | r16 PAC Hamon Pierrick Referenced Value (value_1_PQACTJAN02)1313Document Q3_2017_Quarter_Report13Chapter Consolidated Statement of Financial Position13Row ltlt Reserves treasury shares gtgt (ltlt September 30 2017 gtgt q_act_jan)13User Value 59100 Tsd | 6057 | 6285 | 228 | 4 | |||||||||||||||||||||||||||||||||||||||||||||||||
| Non-controlling interests | 89 | 55 | (34) | -38 | r17 PAC Hamon Pierrick Referenced Value (value_1_PQACTJAN02)1313Document Q3_2017_Quarter_Report13Chapter Consolidated Statement of Financial Position13Row ltlt Non-controlling interests gtgt (ltlt September 30 2017 gtgt q_act_jan)13User Value 550 Tsd | 89 | 81 | -08 | -9 | |||||||||||||||||||||||||||||||||||||||||||||||||
| Total equity | 6170 | 5963 | (207) | -3 | r18 PAC Hamon Pierrick Referenced Value (value_1_PQACTJAN02)1313Document Q3_2017_Quarter_Report13Chapter Consolidated Statement of Financial Position13Row ltlt Total equity gtgt (ltlt September 30 2017 gtgt q_act_jan)13User Value 59887 Tsd | 617 | 639 | 22 | 4 | |||||||||||||||||||||||||||||||||||||||||||||||||
| Total equity and liabilities | 16606 | 16859 | 253 | 2 | r19 PAC Hamon Pierrick Referenced Value (value_1_PQACTJAN02)1313Document Q3_2017_Quarter_Report13Chapter Consolidated Statement of Financial Position13Row ltlt Total equity and liabilities gtgt (ltlt September 30 2017 gtgt q_act_jan)13User Value 168844 Tsd | 166060 | 166780 | 72 | 0 | |||||||||||||||||||||||||||||||||||||||||||||||||
| KPIs | 31-Dec-16 | 30-Jun-17 | ||||||||||||||||||||||||||||||||||||||||||||||||||||||||
| Equity Ratio | 372 | 354 | s20 PAC Hamon Pierrick Referenced Value (value_1_PQACTJAN02)1313Document Q2_2017_Quarter_Report13Chapter Consolidated Statement of Financial Position13Row ltlt Total equity and liabilities gtgt (ltlt June 30 2017 gtgt q_act_jan)13User Value 153472 Tsd | |||||||||||||||||||||||||||||||||||||||||||||||||||||||
PAC Hamon Pierrick Referenced Value (value_1_PQACTJAN02)1313Document Q3_2017_Quarter_Report13Chapter Consolidated Statement of Financial Position13Row ltlt Cash and cash equivalents gtgt (ltlt September 30 2017 gtgt q_act_jan)13User Value 29463 Tsd | PAC Hamon Pierrick Referenced Value (value_1_PQACTJAN02)1313Document Q3_2017_Quarter_Report13Chapter Consolidated Statement of Financial Position13Row ltlt Trade receivables unbilled forwarding services gtgt (ltlt September 30 2017 gtgt q_act_jan)13User Value 98929 Tsd | PAC Hamon Pierrick Referenced Value (value_1_PQACTJAN02)1313Document Q3_2017_Quarter_Report13Chapter Consolidated Statement of Financial Position13Row ltlt Other current assets gtgt (ltlt September 30 2017 gtgt q_act_jan)13User Value 11671 Tsd | PAC Hamon Pierrick Referenced Value (value_1_PQACTJAN02)1313Document Q3_2017_Quarter_Report13Chapter Consolidated Statement of Financial Position13Row ltlt Property plant and equipment gtgt (ltlt September 30 2017 gtgt q_act_jan)13User Value 8028 Tsd | PAC Hamon Pierrick Referenced Value (value_1_PQACTJAN02)1313Document Q3_2017_Quarter_Report13Chapter Consolidated Statement of Financial Position13Row ltlt Intangible assets gtgt (ltlt September 30 2017 gtgt q_act_jan)13User Value 9168 Tsd | PAC Hamon Pierrick Referenced Value (value_1_PQACTJAN02)1313Document Q3_2017_Quarter_Report13Chapter Consolidated Statement of Financial Position13Row ltlt Other non-current assets gtgt (ltlt September 30 2017 gtgt q_act_jan)13User Value 11586 Tsd | PAC Hamon Pierrick Referenced Value (value_1_PQACTJAN02)1313Document Q3_2017_Quarter_Report13Chapter Consolidated Statement of Financial Position13Row ltlt Total assets gtgt (ltlt September 30 2017 gtgt q_act_jan)13User Value 168844 Tsd | PAC Hamon Pierrick Referenced Value (value_1_PQACTJAN02)1313Document Q3_2017_Quarter_Report13Chapter Consolidated Statement of Financial Position13Row ltlt Short-term borrowings gtgt (ltlt September 30 2017 gtgt q_act_jan)13User Value 208 Tsd | PAC Hamon Pierrick Referenced Value (value_1_PQACTJAN02)1313Document Q3_2017_Quarter_Report13Chapter Consolidated Statement of Financial Position13Row ltlt Trade payables accured cost of services gtgt (ltlt September 30 2017 gtgt q_act_jan)13User Value 70745 Tsd | PAC Hamon Pierrick Referenced Value (value_1_PQACTJAN02)1313Document Q3_2017_Quarter_Report13Chapter Consolidated Statement of Financial Position13Row ltlt Other current liabilities gtgt (ltlt September 30 2017 gtgt q_act_jan)13User Value 22538 Tsd | PAC Hamon Pierrick Referenced Value (value_1_PQACTJAN02)1313Document Q3_2017_Quarter_Report13Chapter Consolidated Statement of Financial Position13Row ltlt Long-term borrowings gtgt (ltlt September 30 2017 gtgt q_act_jan)13User Value 197 Tsd | PAC Hamon Pierrick Referenced Value (value_1_PQACTJAN02)1313Document Q3_2017_Quarter_Report13Chapter Consolidated Statement of Financial Position13Row ltlt Other long-term liabilities gtgt (ltlt September 30 2017 gtgt q_act_jan)13User Value 15270 Tsd | PAC Hamon Pierrick Referenced Value (value_1_PQACTJAN02)1313Document Q3_2017_Quarter_Report13Chapter Consolidated Statement of Financial Position13Row ltlt Total liabilities gtgt (ltlt September 30 2017 gtgt q_act_jan)13User Value 108956 Tsd | PAC Hamon Pierrick Referenced Value (value_1_PQACTJAN02)1313Document Q3_2017_Quarter_Report13Chapter Consolidated Statement of Financial Position13Row ltlt Share capital gtgt (ltlt September 30 2017 gtgt q_act_jan)13User Value 238 Tsd | PAC Hamon Pierrick Referenced Value (value_1_PQACTJAN02)1313Document Q3_2017_Quarter_Report13Chapter Consolidated Statement of Financial Position13Row ltlt Reserves treasury shares gtgt (ltlt September 30 2017 gtgt q_act_jan)13User Value 59100 Tsd | PAC Hamon Pierrick Referenced Value (value_1_PQACTJAN02)1313Document Q3_2017_Quarter_Report13Chapter Consolidated Statement of Financial Position13Row ltlt Non-controlling interests gtgt (ltlt September 30 2017 gtgt q_act_jan)13User Value 550 Tsd | PAC Hamon Pierrick Referenced Value (value_1_PQACTJAN02)1313Document Q3_2017_Quarter_Report13Chapter Consolidated Statement of Financial Position13Row ltlt Total equity gtgt (ltlt September 30 2017 gtgt q_act_jan)13User Value 59887 Tsd | PAC Hamon Pierrick Referenced Value (value_1_PQACTJAN02)1313Document Q3_2017_Quarter_Report13Chapter Consolidated Statement of Financial Position13Row ltlt Total equity and liabilities gtgt (ltlt September 30 2017 gtgt q_act_jan)13User Value 168844 Tsd | NWC-Intensity | 18 | 13 | mf24 | |||||||||||||||||||||||||||||||||||||
| DSO 3-m-rolling YTD | 455 | 467 | m22 | |||||||||||||||||||||||||||||||||||||||||||||||||||||||
| DPO 3-m-rolling YTD | 407 | 397 | m23 |
| 2017 | 2016 | |||||||||||||||||||||||||||||||||||||||||||||||||||||||||||||||||||
| Logistics | Q1 2016 | Q2 2016 | HY 2016 | Q3 2016 | Q3YTD 2016 | Q4 2016 | FY 2016 | Q1 2017 | Q2 2017 | HY 2017 | Q3 2017 | Q3YTD 2017 | ||||||||||||||||||||||||||||||||||||||||||||||||||||||||
| Net forwarding revenue | 1402 | 1613 | 3015 | 1374 | 4389 | 1321 | 5709 | 1286 | 1377 | 2663 | 1394 | 4057 | m4 | m4 | r4 PAC Hamon Pierrick Referenced Value (value_1_PQACT02)1313Document Q3_2017_Quarter_Report13Chapter Products quater and year to date13Row ltlt Net forwarding revenue gtgt (ltlt value_3 gtgt q_act)13User Value 13945 Tsd | r4 PAC Hamon Pierrick Referenced Value (value_1_PQACTJAN02)1313Document Q3_2017_Quarter_Report13Chapter Products quater and year to date13Row ltlt Net forwarding revenue gtgt (ltlt value_3 gtgt q_act_jan)13User Value 40573 Tsd | -00 | 00 | (01) | |||||||||||||||||||||||||||||||||||||||||||||||||
| Forwarding expenses | (420) | (607) | (1027) | (429) | (1456) | (397) | (1853) | (460) | (564) | (1024) | (580) | (1604) | m5 | m5 | r5 PAC Hamon Pierrick Referenced Value (value_1_PQACT02)1313Document Q3_2017_Quarter_Report13Chapter Products quater and year to date13Row ltlt Forwarding services from third parties gtgt (ltlt value_3 gtgt q_act)13User Value -5796 Tsd | r5 PAC Hamon Pierrick Referenced Value (value_1_PQACTJAN02)1313Document Q3_2017_Quarter_Report13Chapter Products quater and year to date13Row ltlt Forwarding services from third parties gtgt (ltlt value_3 gtgt q_act_jan)13User Value -16035 Tsd | -00 | 00 | 00 | |||||||||||||||||||||||||||||||||||||||||||||||||
| Gross profit | 982 | 1006 | 1989 | 944 | 2933 | 924 | 3857 | 825 | 813 | 1639 | 815 | 2454 | m6 | m6 | r6 PAC Hamon Pierrick Referenced Value (value_1_PQACT02)1313Document Q3_2017_Quarter_Report13Chapter Products quater and year to date13Row ltlt Gross profit gtgt (ltlt value_3 gtgt q_act)13User Value 8148 Tsd | r6 PAC Hamon Pierrick Referenced Value (value_1_PQACTJAN02)1313Document Q3_2017_Quarter_Report13Chapter Products quater and year to date13Row ltlt Gross profit gtgt (ltlt value_3 gtgt q_act_jan)13User Value 24537 Tsd | 00 | 01 | 01 | |||||||||||||||||||||||||||||||||||||||||||||||||
| Personnel expenses | (574) | (591) | (1166) | (528) | (1694) | (519) | (2213) | (479) | (461) | (940) | (469) | (1409) | m7 | m7 | r7 PAC Hamon Pierrick Referenced Value (value_1_PQACT02)1313Document Q3_2017_Quarter_Report13Chapter Products quater and year to date13Row ltlt Personnel expenses gtgt (ltlt value_3 gtgt q_act)13User Value -4692 Tsd | r7 PAC Hamon Pierrick Referenced Value (value_1_PQACTJAN02)1313Document Q3_2017_Quarter_Report13Chapter Products quater and year to date13Row ltlt Personnel expenses gtgt (ltlt value_3 gtgt q_act_jan)13User Value -14091 Tsd | -00 | (01) | (01) | |||||||||||||||||||||||||||||||||||||||||||||||||
| Other operating expenses | (360) | (363) | (723) | (378) | (1102) | (367) | (1469) | (298) | (298) | (596) | (298) | (894) | m8 | m8 | r8 PAC Hamon Pierrick Referenced Value (value_1_PQACT02)1313Document Q3_2017_Quarter_Report13Chapter Products quater and year to date13Row ltlt Other operating expenses gtgt (ltlt value_3 gtgt q_act)13User Value -2977 Tsd | r8 PAC Hamon Pierrick Referenced Value (value_1_PQACTJAN02)1313Document Q3_2017_Quarter_Report13Chapter Products quater and year to date13Row ltlt Other operating expenses gtgt (ltlt value_3 gtgt q_act_jan)13User Value -8940 Tsd | 00 | 00 | (01) | |||||||||||||||||||||||||||||||||||||||||||||||||
| EBITDA adjusted | 48 | 52 | 100 | 38 | 138 | 37 | 175 | 48 | 54 | 103 | 48 | 151 | m9 | m9 | r9 PAC Hamon Pierrick Referenced Value (value_1_PQACT02)1313Document Q3_2017_Quarter_Report13Chapter Products quater and year to date13Row ltlt EBITDA gtgt (ltlt value_3 gtgt q_act)13User Value 479 Tsd | r9 PAC Hamon Pierrick Referenced Value (value_1_PQACTJAN02)1313Document Q3_2017_Quarter_Report13Chapter Products quater and year to date13Row ltlt EBITDA gtgt (ltlt value_3 gtgt q_act_jan)13User Value 1506 Tsd | 00 | 00 | 00 | |||||||||||||||||||||||||||||||||||||||||||||||||
| Depreciation and amortization | (29) | (29) | (58) | (29) | (88) | (32) | (119) | (25) | (24) | (48) | (21) | (69) | m10 | m10 | r10 PAC Hamon Pierrick Referenced Value (value_1_PQACT02)1313Document Q3_2017_Quarter_Report13Chapter Products quater and year to date13Row ltlt Depreciation and amortization gtgt (ltlt value_3 gtgt q_act)13User Value -208 Tsd | r10 PAC Hamon Pierrick Referenced Value (value_1_PQACTJAN02)1313Document Q3_2017_Quarter_Report13Chapter Products quater and year to date13Row ltlt Depreciation and amortization gtgt (ltlt value_3 gtgt q_act_jan)13User Value -692 Tsd | 00 | 00 | 00 | |||||||||||||||||||||||||||||||||||||||||||||||||
| EBIT adjusted | 18 | 23 | 41 | 09 | 50 | 05 | 56 | 24 | 31 | 54 | 27 | 81 | m11 | m11 | r11 PAC Hamon Pierrick Referenced Value (value_1_PQACT02)1313Document Q3_2017_Quarter_Report13Chapter Products quater and year to date13Row ltlt Operating result (EBIT) gtgt (ltlt value_3 gtgt q_act)13User Value 271 Tsd | r11 PAC Hamon Pierrick Referenced Value (value_1_PQACTJAN02)1313Document Q3_2017_Quarter_Report13Chapter Products quater and year to date13Row ltlt Operating result (EBIT) gtgt (ltlt value_3 gtgt q_act_jan)13User Value 815 Tsd | -00 | 00 | 01 | |||||||||||||||||||||||||||||||||||||||||||||||||
| Non-recurring items | ||||||||||||||||||||||||||||||||||||||||||||||||||||||||||||||||||||
| Restructuring expenses | 00 | (38) | (38) | 00 | (38) | 00 | (38) | 00 | 00 | 00 | 00 | 00 | m13 | m13 | m13 | m13 | 00 | 00 | 00 | |||||||||||||||||||||||||||||||||||||||||||||||||
| EBIT reported | 18 | (15) | 03 | 09 | 12 | 05 | 18 | 24 | 31 | 54 | 27 | 81 | m15 | m15 | r15 PAC Hamon Pierrick Referenced Value (value_1_PQACT02)1313Document Q3_2017_Quarter_Report13Chapter Products quater and year to date13Row ltlt Operating result (EBIT) gtgt (ltlt value_3 gtgt q_act)13User Value 271 Tsd | r15 PAC Hamon Pierrick Referenced Value (value_1_PQACTJAN02)1313Document Q3_2017_Quarter_Report13Chapter Products quater and year to date13Row ltlt Operating result (EBIT) gtgt (ltlt value_3 gtgt q_act_jan)13User Value 815 Tsd | ||||||||||||||||||||||||||||||||||||||||||||||||||||
PAC Hamon Pierrick Referenced Value (value_1_PQACT02)1313Document Q3_2017_Quarter_Report13Chapter Products quater and year to date13Row ltlt Net forwarding revenue gtgt (ltlt value_3 gtgt q_act)13User Value 13945 Tsd | PAC Hamon Pierrick Referenced Value (value_1_PQACTJAN02)1313Document Q3_2017_Quarter_Report13Chapter Products quater and year to date13Row ltlt Net forwarding revenue gtgt (ltlt value_3 gtgt q_act_jan)13User Value 40573 Tsd | PAC Hamon Pierrick Referenced Value (value_1_PQACT02)1313Document Q3_2017_Quarter_Report13Chapter Products quater and year to date13Row ltlt Forwarding services from third parties gtgt (ltlt value_3 gtgt q_act)13User Value -5796 Tsd | GP Change YoY | -19 | -18 | -14 | -16 | s16 | s16 | |||||||||||||||||||||||||||||||||||||||||||||||||||||||||||
| 2017 | 2016 | ||||||||||||||||||||||||||||||||||||||||||||||||||||||||||
| Ocean Freight | Q1 2016 | Q2 2016 | HY 2016 | Q3 2016 | Q3YTD 2016 | Q4 2016 | FY 2016 | Q1 2017 | Q2 2017 | HY 2017 | Q3 2017 | Q3YTD 2017 | |||||||||||||||||||||||||||||||||||||||||||||||
| Net forwarding revenue | 5338 | 4921 | 10259 | 4955 | 15214 | 4770 | 19984 | 4915 | 5172 | 10087 | 5551 | 15637 | m4 | m4 | r4 PAC Hamon Pierrick Referenced Value (value_1_PQACT02)1313Document Q3_2017_Quarter_Report13Chapter Products quater and year to date13Row ltlt Net forwarding revenue gtgt (ltlt value_2 gtgt q_act)13User Value 55506 Tsd | r4 PAC Hamon Pierrick Referenced Value (value_1_PQACTJAN02)1313Document Q3_2017_Quarter_Report13Chapter Products quater and year to date13Row ltlt Net forwarding revenue gtgt (ltlt value_2 gtgt q_act_jan)13User Value 156375 Tsd | 00 | 00 | 00 | ||||||||||||||||||||||||||||||||||||||||
| Forwarding expenses | (4157) | (3773) | (7930) | (3834) | (11764) | (3783) | (15547) | (3860) | (4081) | (7941) | (4463) | (12404) | m5 | m5 | r5 PAC Hamon Pierrick Referenced Value (value_1_PQACT02)1313Document Q3_2017_Quarter_Report13Chapter Products quater and year to date13Row ltlt Forwarding services from third parties gtgt (ltlt value_2 gtgt q_act)13User Value -44629 Tsd | r5 PAC Hamon Pierrick Referenced Value (value_1_PQACTJAN02)1313Document Q3_2017_Quarter_Report13Chapter Products quater and year to date13Row ltlt Forwarding services from third parties gtgt (ltlt value_2 gtgt q_act_jan)13User Value -124038 Tsd | -00 | 00 | 00 | ||||||||||||||||||||||||||||||||||||||||
| Gross profit | 1181 | 1148 | 2329 | 1121 | 3450 | 987 | 4438 | 1055 | 1091 | 2146 | 1088 | 3234 | m6 | m6 | r6 PAC Hamon Pierrick Referenced Value (value_1_PQACT02)1313Document Q3_2017_Quarter_Report13Chapter Products quater and year to date13Row ltlt Gross profit gtgt (ltlt value_2 gtgt q_act)13User Value 10877 Tsd | r6 PAC Hamon Pierrick Referenced Value (value_1_PQACTJAN02)1313Document Q3_2017_Quarter_Report13Chapter Products quater and year to date13Row ltlt Gross profit gtgt (ltlt value_2 gtgt q_act_jan)13User Value 32337 Tsd | 00 | 00 | 01 | ||||||||||||||||||||||||||||||||||||||||
| Personnel expenses | (791) | (752) | (1543) | (755) | (2298) | (721) | (3019) | (779) | (784) | (1564) | (788) | (2352) | m7 | m7 | r7 PAC Hamon Pierrick Referenced Value (value_1_PQACT02)1313Document Q3_2017_Quarter_Report13Chapter Products quater and year to date13Row ltlt Personnel expenses gtgt (ltlt value_2 gtgt q_act)13User Value -7884 Tsd | r7 PAC Hamon Pierrick Referenced Value (value_1_PQACTJAN02)1313Document Q3_2017_Quarter_Report13Chapter Products quater and year to date13Row ltlt Personnel expenses gtgt (ltlt value_2 gtgt q_act_jan)13User Value -23522 Tsd | -00 | 00 | 00 | ||||||||||||||||||||||||||||||||||||||||
| Other operating expenses | (305) | (288) | (594) | (274) | (868) | (275) | (1144) | (271) | (265) | (536) | (290) | (827) | m8 | m8 | r8 PAC Hamon Pierrick Referenced Value (value_1_PQACT02)1313Document Q3_2017_Quarter_Report13Chapter Products quater and year to date13Row ltlt Other operating expenses gtgt (ltlt value_2 gtgt q_act)13User Value -2905 Tsd | r8 PAC Hamon Pierrick Referenced Value (value_1_PQACTJAN02)1313Document Q3_2017_Quarter_Report13Chapter Products quater and year to date13Row ltlt Other operating expenses gtgt (ltlt value_2 gtgt q_act_jan)13User Value -8265 Tsd | -00 | (01) | (02) | ||||||||||||||||||||||||||||||||||||||||
| EBITDA adjusted | 84 | 108 | 192 | 92 | 284 | (09) | 275 | 05 | 41 | 46 | 09 | 55 | m9 | m9 | r9 PAC Hamon Pierrick Referenced Value (value_1_PQACT02)1313Document Q3_2017_Quarter_Report13Chapter Products quater and year to date13Row ltlt EBITDA gtgt (ltlt value_2 gtgt q_act)13User Value 089 Tsd | r9 PAC Hamon Pierrick Referenced Value (value_1_PQACTJAN02)1313Document Q3_2017_Quarter_Report13Chapter Products quater and year to date13Row ltlt EBITDA gtgt (ltlt value_2 gtgt q_act_jan)13User Value 550 Tsd | -00 | 00 | 00 | ||||||||||||||||||||||||||||||||||||||||
| Depreciation and amortization | (41) | (42) | (83) | (41) | (124) | (42) | (166) | (36) | (36) | (72) | (38) | (110) | m10 | m10 | r10 PAC Hamon Pierrick Referenced Value (value_1_PQACT02)1313Document Q3_2017_Quarter_Report13Chapter Products quater and year to date13Row ltlt Depreciation and amortization gtgt (ltlt value_2 gtgt q_act)13User Value -384 Tsd | r10 PAC Hamon Pierrick Referenced Value (value_1_PQACTJAN02)1313Document Q3_2017_Quarter_Report13Chapter Products quater and year to date13Row ltlt Depreciation and amortization gtgt (ltlt value_2 gtgt q_act_jan)13User Value -1102 Tsd | -00 | 00 | 00 | ||||||||||||||||||||||||||||||||||||||||
| EBIT adjusted | 43 | 66 | 109 | 51 | 160 | (51) | 109 | (32) | 06 | (26) | (29) | (55) | m11 | m11 | r11 PAC Hamon Pierrick Referenced Value (value_1_PQACT02)1313Document Q3_2017_Quarter_Report13Chapter Products quater and year to date13Row ltlt Operating result (EBIT) gtgt (ltlt value_2 gtgt q_act)13User Value -295 Tsd | r11 PAC Hamon Pierrick Referenced Value (value_1_PQACTJAN02)1313Document Q3_2017_Quarter_Report13Chapter Products quater and year to date13Row ltlt Operating result (EBIT) gtgt (ltlt value_2 gtgt q_act_jan)13User Value -552 Tsd | 00 | 00 | 00 | ||||||||||||||||||||||||||||||||||||||||
| in of gross profit | 37 | 58 | 47 | 45 | 46 | -51 | 25 | -30 | 05 | -12 | -27 | -17 | m12 | m12 | s12 | s12 | |||||||||||||||||||||||||||||||||||||||||||
| Non-recurring items | 00 | 00 | 00 | ||||||||||||||||||||||||||||||||||||||||||||||||||||||||
| Restructuring expenses | 00 | (97) | (97) | 0 | (97) | (19) | (115) | 00 | 00 | 00 | 00 | 00 | m14 | m14 | m14 | m14 | 00 | 00 | 01 | ||||||||||||||||||||||||||||||||||||||||
| EBIT reported | 43 | (30) | 13 | 51 | 63 | (69) | (06) | (32) | 06 | (26) | (29) | (55) | m16 | m16 | r16 PAC Hamon Pierrick Referenced Value (value_1_PQACT02)1313Document Q3_2017_Quarter_Report13Chapter Products quater and year to date13Row ltlt Operating result (EBIT) gtgt (ltlt value_2 gtgt q_act)13User Value -295 Tsd | r16 PAC Hamon Pierrick Referenced Value (value_1_PQACTJAN02)1313Document Q3_2017_Quarter_Report13Chapter Products quater and year to date13Row ltlt Operating result (EBIT) gtgt (ltlt value_2 gtgt q_act_jan)13User Value -552 Tsd | PAC Hamon Pierrick Referenced Value (value_1_PQACT02)1313Document Q3_2017_Quarter_Report13Chapter Products quater and year to date13Row ltlt Net forwarding revenue gtgt (ltlt value_2 gtgt q_act)13User Value 55506 Tsd | PAC Hamon Pierrick Referenced Value (value_1_PQACTJAN02)1313Document Q3_2017_Quarter_Report13Chapter Products quater and year to date13Row ltlt Net forwarding revenue gtgt (ltlt value_2 gtgt q_act_jan)13User Value 156375 Tsd | PAC Hamon Pierrick Referenced Value (value_1_PQACT02)1313Document Q3_2017_Quarter_Report13Chapter Products quater and year to date13Row ltlt Forwarding services from third parties gtgt (ltlt value_2 gtgt q_act)13User Value -44629 Tsd | 00 | 00 | (01) | |||||||||||||||||||||||||||||||||||||
| in of gross profit | 37 | -26 | 05 | 45 | 18 | -70 | -01 | -30 | 05 | -12 | -27 | -17 | m17 | m17 | s17 | s17 | |||||||||||||||||||||||||||||||||||||||||||
| Ocean Freight volumes (000 tons) | 3482 | 3726 | 7208 | 3787 | 10995 | 3890 | 14885 | 3742 | 3828 | 7570 | 3856 | 11426 | m19 | m19 | m19 | m19 | 00 | 00 | 00 | ||||||||||||||||||||||||||||||||||||||||
| change YoY | -100 | -82 | -91 | -88 | -90 | 08 | -66 | 75 | 27 | 50 | 18 | 39 | m20 | m20 | s20 | s20 | |||||||||||||||||||||||||||||||||||||||||||
| GPTEU (CHF) | 339 | 308 | 323 | 296 | 314 | 254 | 298 | 282 | 285 | 283 | 282 | 283 | m21 | m21 | s21 | s21 | |||||||||||||||||||||||||||||||||||||||||||
| change YoY | 102 | 59 | 80 | -16 | 47 | -176 | -11 | -169 | -75 | -122 | -47 | -98 | m22 | m22 | s22 | s22 | |||||||||||||||||||||||||||||||||||||||||||
| GP change YoY | -5 | -8 | -3 | -6 | s23 | s23 | |||||||||||||||||||||||||||||||||||||||||||||||||||||
| 2017 | 2016 | ||||||||||||||||||||||||||||||||||||||||||||||||||||||||||
| Air Freight | Q1 2016 | Q2 2016 | HY 2016 | Q3 2016 | Q3YTD 2016 | Q4 2016 | FY 2016 | Q1 2017 | Q2 2017 | HY 2017 | Q3 2017 | Q3 YTD 2017 | |||||||||||||||||||||||||||||||||||||||||||||||
| Net forwarding revenue | 6332 | 6359 | 12691 | 6341 | 19032 | 7234 | 26267 | 6571 | 7000 | 13571 | 7389 | 20960 | m4 | m4 | r4 PAC Hamon Pierrick Referenced Value (value_1_PQACT02)1313Document Q3_2017_Quarter_Report13Chapter Products quater and year to date13Row ltlt Net forwarding revenue gtgt (ltlt value_1 gtgt q_act)13User Value 73890 Tsd | r4 PAC Hamon Pierrick Referenced Value (value_1_PQACTJAN02)1313Document Q3_2017_Quarter_Report13Chapter Products quater and year to date13Row ltlt Net forwarding revenue gtgt (ltlt value_1 gtgt q_act_jan)13User Value 209603 Tsd | 00 | 00 | 006009999999958 | ||||||||||||||||||||||||||||||||||||||||
| Forwarding expenses | (4846) | (4800) | (9646) | (4853) | (14499) | (5816) | (20315) | (5125) | (5500) | (10625) | (5775) | (16400) | m5 | m5 | r5 PAC Hamon Pierrick Referenced Value (value_1_PQACT02)1313Document Q3_2017_Quarter_Report13Chapter Products quater and year to date13Row ltlt Forwarding services from third parties gtgt (ltlt value_1 gtgt q_act)13User Value -57751 Tsd | r5 PAC Hamon Pierrick Referenced Value (value_1_PQACTJAN02)1313Document Q3_2017_Quarter_Report13Chapter Products quater and year to date13Row ltlt Forwarding services from third parties gtgt (ltlt value_1 gtgt q_act_jan)13User Value -164000 Tsd | 00 | 00 | 00 | ||||||||||||||||||||||||||||||||||||||||
| Gross profit | 1486 | 1559 | 3045 | 1489 | 4534 | 1418 | 5952 | 1447 | 1500 | 2946 | 1614 | 4560 | m6 | m6 | r6 PAC Hamon Pierrick Referenced Value (value_1_PQACT02)1313Document Q3_2017_Quarter_Report13Chapter Products quater and year to date13Row ltlt Gross profit gtgt (ltlt value_1 gtgt q_act)13User Value 16139 Tsd | r6 PAC Hamon Pierrick Referenced Value (value_1_PQACTJAN02)1313Document Q3_2017_Quarter_Report13Chapter Products quater and year to date13Row ltlt Gross profit gtgt (ltlt value_1 gtgt q_act_jan)13User Value 45602 Tsd | -00 | 00 | 00 | ||||||||||||||||||||||||||||||||||||||||
| Personnel expenses | (885) | (869) | (1754) | (847) | (2600) | (873) | (3473) | (905) | (916) | (1822) | (928) | (2750) | m7 | m7 | r7 PAC Hamon Pierrick Referenced Value (value_1_PQACT02)1313Document Q3_2017_Quarter_Report13Chapter Products quater and year to date13Row ltlt Personnel expenses gtgt (ltlt value_1 gtgt q_act)13User Value -9280 Tsd | r7 PAC Hamon Pierrick Referenced Value (value_1_PQACTJAN02)1313Document Q3_2017_Quarter_Report13Chapter Products quater and year to date13Row ltlt Personnel expenses gtgt (ltlt value_1 gtgt q_act_jan)13User Value -27496 Tsd | -00 | 00 | 01 | ||||||||||||||||||||||||||||||||||||||||
| Other operating expenses | (371) | (359) | (730) | (318) | (1048) | (284) | (1333) | (324) | (317) | (641) | (337) | (978) | m8 | m8 | r8 PAC Hamon Pierrick Referenced Value (value_1_PQACT02)1313Document Q3_2017_Quarter_Report13Chapter Products quater and year to date13Row ltlt Other operating expenses gtgt (ltlt value_1 gtgt q_act)13User Value -3367 Tsd | r8 PAC Hamon Pierrick Referenced Value (value_1_PQACTJAN02)1313Document Q3_2017_Quarter_Report13Chapter Products quater and year to date13Row ltlt Other operating expenses gtgt (ltlt value_1 gtgt q_act_jan)13User Value -9776 Tsd | 00 | 00 | (01) | ||||||||||||||||||||||||||||||||||||||||
| EBITDA adjusted | 230 | 331 | 561 | 324 | 885 | 261 | 1146 | 218 | 266 | 484 | 349 | 833 | m9 | m9 | r9 PAC Hamon Pierrick Referenced Value (value_1_PQACT02)1313Document Q3_2017_Quarter_Report13Chapter Products quater and year to date13Row ltlt EBITDA gtgt (ltlt value_1 gtgt q_act)13User Value 3492 Tsd | r9 PAC Hamon Pierrick Referenced Value (value_1_PQACTJAN02)1313Document Q3_2017_Quarter_Report13Chapter Products quater and year to date13Row ltlt EBITDA gtgt (ltlt value_1 gtgt q_act_jan)13User Value 8330 Tsd | -00 | 00 | 00 | ||||||||||||||||||||||||||||||||||||||||
| Depreciation and amortization | (52) | (52) | (103) | (55) | (158) | (53) | (211) | (46) | (47) | (93) | (46) | (139) | m10 | m10 | r10 PAC Hamon Pierrick Referenced Value (value_1_PQACT02)1313Document Q3_2017_Quarter_Report13Chapter Products quater and year to date13Row ltlt Depreciation and amortization gtgt (ltlt value_1 gtgt q_act)13User Value -458 Tsd | r10 PAC Hamon Pierrick Referenced Value (value_1_PQACTJAN02)1313Document Q3_2017_Quarter_Report13Chapter Products quater and year to date13Row ltlt Depreciation and amortization gtgt (ltlt value_1 gtgt q_act_jan)13User Value -1387 Tsd | -00 | 01 | 01 | ||||||||||||||||||||||||||||||||||||||||
| EBIT adjusted | 178 | 279 | 457 | 269 | 726 | 208 | 935 | 171 | 220 | 391 | 303 | 694 | m11 | m11 | r11 PAC Hamon Pierrick Referenced Value (value_1_PQACT02)1313Document Q3_2017_Quarter_Report13Chapter Products quater and year to date13Row ltlt Operating result (EBIT) gtgt (ltlt value_1 gtgt q_act)13User Value 3033 Tsd | r11 PAC Hamon Pierrick Referenced Value (value_1_PQACTJAN02)1313Document Q3_2017_Quarter_Report13Chapter Products quater and year to date13Row ltlt Operating result (EBIT) gtgt (ltlt value_1 gtgt q_act_jan)13User Value 6943 Tsd | 00 | 00 | 01 | ||||||||||||||||||||||||||||||||||||||||
| in of gross profit | 120 | 179 | 150 | 181 | 160 | 147 | 157 | 118 | 146 | 133 | 188 | 152 | m12 | m12 | s12 | s12 | |||||||||||||||||||||||||||||||||||||||||||
| Non-recurring items | 00 | 00 | 00 | ||||||||||||||||||||||||||||||||||||||||||||||||||||||||
| Restructuring expenses | 00 | (127) | (127) | 00 | (127) | 00 | (127) | 00 | 00 | 00 | 00 | 00 | m14 | m14 | m14 | m14 | 00 | 00 | 00 | ||||||||||||||||||||||||||||||||||||||||
| EBIT reported | 178 | 153 | 331 | 269 | 600 | 208 | 808 | 171 | 220 | 391 | 303 | 694 | m16 | m16 | r16 PAC Hamon Pierrick Referenced Value (value_1_PQACT02)1313Document Q3_2017_Quarter_Report13Chapter Products quater and year to date13Row ltlt Operating result (EBIT) gtgt (ltlt value_1 gtgt q_act)13User Value 3033 Tsd | r16 PAC Hamon Pierrick Referenced Value (value_1_PQACTJAN02)1313Document Q3_2017_Quarter_Report13Chapter Products quater and year to date13Row ltlt Operating result (EBIT) gtgt (ltlt value_1 gtgt q_act_jan)13User Value 6943 Tsd | PAC Hamon Pierrick Referenced Value (value_1_PQACT02)1313Document Q3_2017_Quarter_Report13Chapter Products quater and year to date13Row ltlt Net forwarding revenue gtgt (ltlt value_1 gtgt q_act)13User Value 73890 Tsd | PAC Hamon Pierrick Referenced Value (value_1_PQACTJAN02)1313Document Q3_2017_Quarter_Report13Chapter Products quater and year to date13Row ltlt Net forwarding revenue gtgt (ltlt value_1 gtgt q_act_jan)13User Value 209603 Tsd | PAC Hamon Pierrick Referenced Value (value_1_PQACT02)1313Document Q3_2017_Quarter_Report13Chapter Products quater and year to date13Row ltlt Forwarding services from third parties gtgt (ltlt value_1 gtgt q_act)13User Value -57751 Tsd | 00 | 00 | 00 | |||||||||||||||||||||||||||||||||||||
| in of gross profit | 120 | 98 | 109 | 181 | 132 | 147 | 136 | 118 | 146 | 133 | 188 | 152 | m17 | m17 | s17 | s17 | |||||||||||||||||||||||||||||||||||||||||||
| Air Freight volumes (000 tons) | 2161 | 2251 | 4412 | 2278 | 6690 | 2524 | 9214 | 2332 | 2399 | 4731 | 2489 | 7220 | m19 | m19 | m19 | m19 | 00 | 00 | 00 | ||||||||||||||||||||||||||||||||||||||||
| change YoY | 54 | 111 | 82 | 99 | 88 | 141 | 102 | 79 | 66 | 72 | 93 | 79 | m20 | m20 | s20 | s20 | |||||||||||||||||||||||||||||||||||||||||||
| GPton (CHF) | 688 | 693 | 690 | 653 | 678 | 562 | 646 | 620 | 625 | 623 | 648 | 632 | m21 | m21 | s21 | s21 | |||||||||||||||||||||||||||||||||||||||||||
| change YoY | -47 | -36 | -41 | -73 | -52 | -140 | -75 | -98 | -97 | -98 | -08 | -68 | m22 | m22 | s22 | s22 | |||||||||||||||||||||||||||||||||||||||||||
| GP change YoY | -4 | -3 | 8 | 1 | s23 | s23 |
| 2017 | 2016 | |||||||||||||||||||||||||||||||||||||||||||||||
| Group | Q1 2016 | Q2 2016 | HY 2016 | Q3 2016 | Q3YTD 2016 | Q4 2016 | FY 2016 | Q1 2017 | Q2 2017 | HY 2017 | Q3 2017 | Q3YTD 2017 | ||||||||||||||||||||||||||||||||||||
| Net forwarding revenue | 13072 | 12894 | 25965 | 12670 | 38635 | 13325 | 51960 | 12772 | 13549 | 26321 | 14334 | 40655 | r4 PAC Hamon Pierrick Referenced Value (value_1_PQACT02)1313Document Q3_2017_Quarter_Report13Chapter Consolidated Income Statement13Row ltlt Net forwarding revenue gtgt (ltlt 2017 gtgt q_act)13User Value 1433411124 Tsd | r4 PAC Hamon Pierrick Referenced Value (value_1_PQACTJAN02)1313Document Q3_2017_Quarter_Report13Chapter Consolidated Income Statement13Row ltlt Net forwarding revenue gtgt (ltlt 2017 gtgt q_act_jan)13User Value 4065500417 Tsd | -00 | -01 | -01 | |||||||||||||||||||||||||||||||
| Forwarding expenses | (9423) | (9180) | (18602) | (9116) | (27718) | (9996) | (37714) | (9445) | (10145) | (19590) | (10818) | (30407) | r5 PAC Hamon Pierrick Referenced Value (value_1_PQACT02)1313Document Q3_2017_Quarter_Report13Chapter Consolidated Income Statement13Row ltlt Forwarding services from third parties gtgt (ltlt 2017 gtgt q_act)13User Value -1081765298 Tsd | r5 PAC Hamon Pierrick Referenced Value (value_1_PQACTJAN02)1313Document Q3_2017_Quarter_Report13Chapter Consolidated Income Statement13Row ltlt Forwarding services from third parties gtgt (ltlt 2017 gtgt q_act_jan)13User Value -3040736424 Tsd | 00 | 01 | 01 | |||||||||||||||||||||||||||||||
| Gross profit | 3649 | 3714 | 7363 | 3554 | 10917 | 3329 | 14246 | 3327 | 3404 | 6731 | 3516 | 10248 | r6 PAC Hamon Pierrick Referenced Value (value_1_PQACT02)1313Document Q3_2017_Quarter_Report13Chapter Consolidated Income Statement13Row ltlt Gross profit gtgt (ltlt 2017 gtgt q_act)13User Value 351645826 Tsd | r6 PAC Hamon Pierrick Referenced Value (value_1_PQACTJAN02)1313Document Q3_2017_Quarter_Report13Chapter Consolidated Income Statement13Row ltlt Gross profit gtgt (ltlt 2017 gtgt q_act_jan)13User Value 1024763993 Tsd | 00 | 00 | 00 | |||||||||||||||||||||||||||||||
| Personnel expenses | (2250) | (2213) | (4463) | (2129) | (6592) | (2113) | (8705) | (2164) | (2162) | (4326) | (2186) | (6511) | r7 PAC Hamon Pierrick Referenced Value (value_1_PQACT02)1313Document Q3_2017_Quarter_Report13Chapter Consolidated Income Statement13Row ltlt Personnel expenses gtgt (ltlt 2017 gtgt q_act)13User Value -218561825 Tsd | r7 PAC Hamon Pierrick Referenced Value (value_1_PQACTJAN02)1313Document Q3_2017_Quarter_Report13Chapter Consolidated Income Statement13Row ltlt Personnel expenses gtgt (ltlt 2017 gtgt q_act_jan)13User Value -651090060 Tsd | 00 | 00 | 00 | |||||||||||||||||||||||||||||||
| Other operating expenses | (1037) | (1011) | (2047) | (971) | (3018) | (927) | (3945) | (893) | (880) | (1773) | (925) | (2698) | r8 PAC Hamon Pierrick Referenced Value (value_1_PQACT02)1313Document Q3_2017_Quarter_Report13Chapter Consolidated Income Statement13Row ltlt Other operating expenses gtgt (ltlt 2017 gtgt q_act)13User Value -92494218 Tsd | r8 PAC Hamon Pierrick Referenced Value (value_1_PQACTJAN02)1313Document Q3_2017_Quarter_Report13Chapter Consolidated Income Statement13Row ltlt Other operating expenses gtgt (ltlt 2017 gtgt q_act_jan)13User Value -269813050 Tsd | 00 | 01 | 01 | |||||||||||||||||||||||||||||||
| EBITDA adjusted | 362 | 491 | 853 | 454 | 1307 | 289 | 1596 | 271 | 362 | 633 | 406 | 1039 | r9 PAC Hamon Pierrick Referenced Value (value_1_PQACT02)1313Document Q3_2017_Quarter_Report13Chapter Consolidated Income Statement13Row ltlt EBITDA gtgt (ltlt 2017 gtgt q_act)13User Value 40589783 Tsd | r9 PAC Hamon Pierrick Referenced Value (value_1_PQACTJAN02)1313Document Q3_2017_Quarter_Report13Chapter Consolidated Income Statement13Row ltlt EBITDA gtgt (ltlt 2017 gtgt q_act_jan)13User Value 103860882 Tsd | -00 | 00 | 00 | |||||||||||||||||||||||||||||||
| Depreciation of property plant and equip | (62) | (62) | (125) | (62) | (187) | (71) | (258) | (53) | (54) | (107) | (50) | (156) | r10 PAC Hamon Pierrick Referenced Value (value_1_PQACT02)1313Document Q3_2017_Quarter_Report13Chapter Consolidated Income Statement13Row ltlt Depreciation of property plant and equipment gtgt (ltlt 2017 gtgt q_act)13User Value -4981553 Tsd | r10 PAC Hamon Pierrick Referenced Value (value_1_PQACTJAN02)1313Document Q3_2017_Quarter_Report13Chapter Consolidated Income Statement13Row ltlt Depreciation of property plant and equipment gtgt (ltlt 2017 gtgt q_act_jan)13User Value -15648388 Tsd | 00 | -01 | -01 | |||||||||||||||||||||||||||||||
| Amortization of intangible assets | (60) | (60) | (120) | (63) | (183) | (56) | (239) | (54) | (52) | (106) | (55) | (162) | r11 PAC Hamon Pierrick Referenced Value (value_1_PQACT02)1313Document Q3_2017_Quarter_Report13Chapter Consolidated Income Statement13Row ltlt Amortization of intangible assets gtgt (ltlt 2017 gtgt q_act)13User Value -5514918 Tsd | r11 PAC Hamon Pierrick Referenced Value (value_1_PQACTJAN02)1313Document Q3_2017_Quarter_Report13Chapter Consolidated Income Statement13Row ltlt Amortization of intangible assets gtgt (ltlt 2017 gtgt q_act_jan)13User Value -16157763 Tsd | -00 | 00 | 00 | |||||||||||||||||||||||||||||||
| EBIT adjusted | 240 | 368 | 608 | 329 | 936 | 163 | 1099 | 164 | 256 | 420 | 301 | 721 | r12 PAC Hamon Pierrick Referenced Value (value_1_PQACT02)1313Document Q3_2017_Quarter_Report13Chapter Consolidated Income Statement13Row ltlt Operating result (EBIT) gtgt (ltlt 2017 gtgt q_act)13User Value 30093312 Tsd | r12 PAC Hamon Pierrick Referenced Value (value_1_PQACTJAN02)1313Document Q3_2017_Quarter_Report13Chapter Consolidated Income Statement13Row ltlt Operating result (EBIT) gtgt (ltlt 2017 gtgt q_act_jan)13User Value 72054731 Tsd | -00 | 00 | -01 | |||||||||||||||||||||||||||||||
| in of gross profit | 66 | 99 | 83 | 92 | 86 | 49 | 77 | 49 | 75 | 62 | 86 | 70 | s13 | s13 | ||||||||||||||||||||||||||||||||||
| Non-recurring items | 00 | 00 | 00 | |||||||||||||||||||||||||||||||||||||||||||||
| Restructuring expenses | 00 | (261) | (261) | 00 | (261) | (19) | (280) | 00 | 00 | 00 | 00 | 00 | r15 PAC Hamon Pierrick Referenced Value (value_1_PQACT02)1313Document Q3_2017_Quarter_Report13Chapter Consolidated Income Statement13Row ltlt Restructuring expenses gtgt (ltlt 2017 gtgt q_act)13User Value 0000000 Tsd | r15 PAC Hamon Pierrick Referenced Value (value_1_PQACTJAN02)1313Document Q3_2017_Quarter_Report13Chapter Consolidated Income Statement13Row ltlt Restructuring expenses gtgt (ltlt 2017 gtgt q_act_jan)13User Value 0000000 Tsd | 00 | 00 | 00 | |||||||||||||||||||||||||||||||
| EBIT reported | 240 | 107 | 347 | 329 | 675 | 144 | 820 | 164 | 256 | 420 | 301 | 721 | s17 | s17 | -00 | 00 | 00 | |||||||||||||||||||||||||||||||
| in of gross profit | 66 | 29 | 47 | 92 | 62 | 43 | 58 | 49 | 75 | 62 | 86 | 70 | s18 | s18 | -01 | -00 | -02 | |||||||||||||||||||||||||||||||
| Financial result | (09) | 07 | (02) | (04) | (06) | 02 | (04) | 02 | 01 | 03 | (04) | (02) | r19 PAC Hamon Pierrick Referenced Value (value_1_PQACT02)1313Document Q3_2017_Quarter_Report13Chapter Consolidated Income Statement13130939883 Tsd - ltlt Finance income gtgt (ltlt 2017 gtgt q_act)13-1343957 Tsd - ltlt Finance costs gtgt (ltlt 2017 gtgt q_act)13---------------------13-0404074 Tsd (Total) | r19 PAC Hamon Pierrick Referenced Value (value_1_PQACTJAN02)1313Document Q3_2017_Quarter_Report13Chapter Consolidated Income Statement13133163726 Tsd - ltlt Finance income gtgt (ltlt 2017 gtgt q_act_jan)13-3315684 Tsd - ltlt Finance costs gtgt (ltlt 2017 gtgt q_act_jan)13---------------------13-0151958 Tsd (Total) | -00 | 00 | 00 | |||||||||||||||||||||||||||||||
| Earnings before taxes (EBT) | 231 | 114 | 345 | 325 | 670 | 146 | 816 | 165 | 257 | 422 | 297 | 719 | r20 PAC Hamon Pierrick Referenced Value (value_1_PQACT02)1313Document Q3_2017_Quarter_Report13Chapter Consolidated Income Statement13Row ltlt Profit before income tax (EBT) gtgt (ltlt 2017 gtgt q_act)13User Value 29689237 Tsd | r20 PAC Hamon Pierrick Referenced Value (value_1_PQACTJAN02)1313Document Q3_2017_Quarter_Report13Chapter Consolidated Income Statement13Row ltlt Profit before income tax (EBT) gtgt (ltlt 2017 gtgt q_act_jan)13User Value 71902773 Tsd | 00 | 00 | 00 | |||||||||||||||||||||||||||||||
| Income tax expenses | (58) | (69) | (126) | (79) | (205) | (88) | (293) | (42) | (81) | (123) | (112) | (235) | r21 PAC Hamon Pierrick Referenced Value (value_1_PQACT02)1313Document Q3_2017_Quarter_Report13Chapter Consolidated Income Statement13Row ltlt Income tax expenses gtgt (ltlt 2017 gtgt q_act)13User Value -8638414 Tsd | r21 PAC Hamon Pierrick Referenced Value (value_1_PQACTJAN02)1313Document Q3_2017_Quarter_Report13Chapter Consolidated Income Statement13Row ltlt Income tax expenses gtgt (ltlt 2017 gtgt q_act_jan)13User Value -20922552 Tsd | 00 | 01 | 01 | |||||||||||||||||||||||||||||||
| of EBT | 250 | 602 | 367 | 242 | 306 | 601 | 359 | 252 | 316 | 291 | 378 | 327 | s22 | s22 | ||||||||||||||||||||||||||||||||||
| Profit | 173 | 45 | 218 | 246 | 465 | 58 | 523 | 124 | 176 | 299 | 185 | 484 | r23 PAC Hamon Pierrick Referenced Value (value_1_PQACT02)1313Document Q3_2017_Quarter_Report13Chapter Consolidated Income Statement13Row ltlt Profit gtgt (ltlt 2017 gtgt q_act)13User Value 21050824 Tsd | r23 PAC Hamon Pierrick Referenced Value (value_1_PQACTJAN02)1313Document Q3_2017_Quarter_Report13Chapter Consolidated Income Statement13Row ltlt Profit gtgt (ltlt 2017 gtgt q_act_jan)13User Value 50980221 Tsd | -00 | 00 | 01 | |||||||||||||||||||||||||||||||
| Earnings per share | 075 | 021 | 096 | 106 | 201 | 027 | 229 | 054 | 075 | 129 | 079 | 208 | s24 PAC Serova Elena (External) Referenced Value (value_1_PQACTJAN02)1313Document Q2_2017_Quarter_Report13Chapter Consolidated Income Statement13Row ltlt Basic gtgt (ltlt 2017 gtgt q_act_jan)13User Value 0000540 Tsd | s24 PAC Serova Elena (External) Referenced Value (value_1_PQACTJAN02)1313Document Q2_2017_Quarter_Report13Chapter Consolidated Income Statement13Row ltlt Basic gtgt (ltlt 2017 gtgt q_act_jan)13User Value 0000540 Tsd | 00 | 00 | 00 | |||||||||||||||||||||||||||||||
| 0 | 0 | 46460419259 | 0 | 0 | 0 | 0 | m25 | m25 | 00 | 00 | ||||||||||||||||||||||||||||||||||||||
| Earnings per share 1000 | 0000788 | 0002078 | rf28 PAC Hamon Pierrick Referenced Value (value_1_PQACT02)1313Document Q3_2017_Quarter_Report13Chapter Consolidated Income Statement13Row ltlt Basic gtgt (ltlt 2017 gtgt q_act)13User Value 0000898 Tsd | rf28 PAC Hamon Pierrick Referenced Value (value_1_PQACTJAN02)1313Document Q3_2017_Quarter_Report13Chapter Consolidated Income Statement13Row ltlt Basic gtgt (ltlt 2017 gtgt q_act_jan)13User Value 0002188 Tsd | ||||||||||||||||||||||||||||||||||||||||||||
| Total Operating Expenses | (3111) | (9209) | s25 | s25 | ||||||||||||||||||||||||||||||||||||||||||||
| OOE YoY | ||||||||||||||||||||||||||||||||||||||||||||||||
| 042 |
| Q3 | |||||||||||||||||||
| GP | Q3 2016 | Q4 2016 | Q1 2017 | Q2 2017 | Q3 2017 | Gross profit | |||||||||||||
| 94 | 92 | 83 | 81 | 81 | r3 PAC Stuker Benjamin Referenced Value (value_3_PQACT02)1313Document Q3_2017_Investor amp AC presentations13Chapter 38 - IRAC Income statement per quarter - Logistics13Row Gross profit (value_1 q_act)13User Value 814848 Mio | Q3 2016 | 94 | ||||||||||||
| Q4 2016 | 92 | ||||||||||||||||||
| Q1 2017 | 83 | ||||||||||||||||||
| Q2 2017 | 81 | ||||||||||||||||||
| EBIT | 09 | 05 | 24 | 31 | 27 | r7 PAC Stuker Benjamin Referenced Value (value_3_PQACT02)1313Document Q3_2017_Investor amp AC presentations13Chapter 38 - IRAC Income statement per quarter - Logistics13Row EBIT reported (value_1 q_act)13User Value 27118 Mio | Q3 2017 | 81 | |||||||||||
| EBIT | |||||||||||||||||||
| Q3 2016 | 09 | ||||||||||||||||||
| Q4 2016 | 05 | ||||||||||||||||||
| Q1 2017 | 24 | ||||||||||||||||||
| Q2 2017 | 31 | ||||||||||||||||||
| Q3 2017 | 27 |
| 2017 | 2016 | ||||||||||||||||||||||||||||||||
| 2017 | 2016 | 2017 | |||||||||||||||||||||||||||||||
| YoY Growth | Q3 | Q4 | Q1 | Q2 | Q3 | Gross Profit EBIT | YTD | YTD | |||||||||||||||||||||||||
| Gross Profit | -6 | -11 | -16 | -19 | -14 | r5 PAC Stuker Benjamin Referenced Value (value_1_PQACT02)1313Document Q3_2017_Investor amp AC presentations13Chapter 38 - IRAC Income statement per quarter - Logistics13Row GP Change YoY (value_1 q_act)13User Value -01372 Mio | Gross Profit | 2933 | 24537 | -16 | r5 PAC Stuker Benjamin Referenced Value (value_2_PQACT02)1313Document Q3_2017_Quarter_Report13Chapter Products quater and year to date13Row ltlt Gross profit gtgt (ltlt value_3 gtgt q_act_jan)13User Value 24537 Tsd1313----------------------------------------------------------------------------------------1313Referenced Value (value_2_PQPRIOR02)1313Document Q3_2017_Investor amp AC presentations13Chapter 38 - IRAC Income statement per quarter - Logistics13Row Gross profit (value_1 q_prior_jan)13User Value 2933025 Mio | ||||||||||||||||||||||
| EBIT (adjusted PY) | 50 | 81 | 63 | rf7 PAC Stuker Benjamin Referenced Value (value_2_PQACT02)1313Document Q3_2017_Quarter_Report13Chapter Products quater and year to date13Row ltlt Operating result (EBIT) gtgt (ltlt value_3 gtgt q_act_jan)13User Value 815 Tsd1313----------------------------------------------------------------------------------------1313Referenced Value (value_2_PQPRIOR02)1313Document Q3_2017_Quarter_Report13Chapter Products quater and year to date13Row ltlt Operating result (Segment EBIT) adjusted gtgt (ltlt value_3 gtgt q_prior_jan)13User Value 501 Tsd | |||||||||||||||||||||||||||||
| NFR in of EBIT | 10 | 20 | m9 | ||||||||||||||||||||||||||||||
| NFR | 43888478 | 4057267 | rf8 PAC Stuker Benjamin Referenced Value (value_2_PQACT02)1313Document Q3_2017_Quarter_Report13Chapter Products quater and year to date13Row ltlt Net forwarding revenue gtgt (ltlt value_3 gtgt q_act_jan)13User Value 40573 Tsd1313----------------------------------------------------------------------------------------1313Referenced Value (value_2_PQPRIOR02)1313Document Q3_2017_Quarter_Report13Chapter Products quater and year to date13Row ltlt Net forwarding revenue gtgt (ltlt value_3 gtgt q_prior_jan)13User Value 43888 Tsd |
| Q3 | |||||||||||||||||||
| GP | Q3 2016 | Q4 2016 | Q1 2017 | Q2 2017 | Q3 2017 | Gross profit | |||||||||||||
| 94 | 92 | 83 | 81 | 81 | r3 PAC Stuker Benjamin Referenced Value (value_3_PQACT02)1313Document Q3_2017_Investor amp AC presentations13Chapter 38 - IRAC Income statement per quarter - Logistics13Row Gross profit (value_1 q_act)13User Value 814848 Mio | Q3 2016 | 94 | ||||||||||||
| Q4 2016 | 92 | ||||||||||||||||||
| Q1 2017 | 83 | ||||||||||||||||||
| Q2 2017 | 81 | ||||||||||||||||||
| EBIT | 09 | 05 | 24 | 31 | 27 | r7 PAC Stuker Benjamin Referenced Value (value_3_PQACT02)1313Document Q3_2017_Investor amp AC presentations13Chapter 38 - IRAC Income statement per quarter - Logistics13Row EBIT reported (value_1 q_act)13User Value 27118 Mio | Q3 2017 | 81 | |||||||||||
| EBIT | |||||||||||||||||||
| Q3 2016 | 09 | ||||||||||||||||||
| Q4 2016 | 05 | ||||||||||||||||||
| Q1 2017 | 24 | ||||||||||||||||||
| Q2 2017 | 31 | ||||||||||||||||||
| Q3 2017 | 27 |
| 2017 | 2016 | ||||||||||||||||||||||||||||||||
| 2017 | 2016 | 2017 | |||||||||||||||||||||||||||||||
| YoY Growth | Q3 | Q4 | Q1 | Q2 | Q3 | Gross Profit EBIT | YTD | YTD | |||||||||||||||||||||||||
| Gross Profit | -6 | -11 | -16 | -19 | -14 | r5 PAC Stuker Benjamin Referenced Value (value_1_PQACT02)1313Document Q3_2017_Investor amp AC presentations13Chapter 38 - IRAC Income statement per quarter - Logistics13Row GP Change YoY (value_1 q_act)13User Value -01372 Mio | Gross Profit | 2933 | 24537 | -16 | r5 PAC Stuker Benjamin Referenced Value (value_2_PQACT02)1313Document Q3_2017_Quarter_Report13Chapter Products quater and year to date13Row ltlt Gross profit gtgt (ltlt value_3 gtgt q_act_jan)13User Value 24537 Tsd1313----------------------------------------------------------------------------------------1313Referenced Value (value_2_PQPRIOR02)1313Document Q3_2017_Investor amp AC presentations13Chapter 38 - IRAC Income statement per quarter - Logistics13Row Gross profit (value_1 q_prior_jan)13User Value 2933025 Mio | ||||||||||||||||||||||
| EBIT (adjusted PY) | 50 | 81 | 63 | rf7 PAC Stuker Benjamin Referenced Value (value_2_PQACT02)1313Document Q3_2017_Quarter_Report13Chapter Products quater and year to date13Row ltlt Operating result (EBIT) gtgt (ltlt value_3 gtgt q_act_jan)13User Value 815 Tsd1313----------------------------------------------------------------------------------------1313Referenced Value (value_2_PQPRIOR02)1313Document Q3_2017_Quarter_Report13Chapter Products quater and year to date13Row ltlt Operating result (Segment EBIT) adjusted gtgt (ltlt value_3 gtgt q_prior_jan)13User Value 501 Tsd | |||||||||||||||||||||||||||||
| NFR in of EBIT | 10 | 20 | m9 | ||||||||||||||||||||||||||||||
| NFR | 43888478 | 4057267 | rf8 PAC Stuker Benjamin Referenced Value (value_2_PQACT02)1313Document Q3_2017_Quarter_Report13Chapter Products quater and year to date13Row ltlt Net forwarding revenue gtgt (ltlt value_3 gtgt q_act_jan)13User Value 40573 Tsd1313----------------------------------------------------------------------------------------1313Referenced Value (value_2_PQPRIOR02)1313Document Q3_2017_Quarter_Report13Chapter Products quater and year to date13Row ltlt Net forwarding revenue gtgt (ltlt value_3 gtgt q_prior_jan)13User Value 43888 Tsd |
| Q3 | |||||||||||||||||||
| GP | Q3 2016 | Q4 2016 | Q1 2017 | Q2 2017 | Q3 2017 | Gross profit | |||||||||||||
| 94 | 92 | 83 | 81 | 81 | r3 PAC Stuker Benjamin Referenced Value (value_3_PQACT02)1313Document Q3_2017_Investor amp AC presentations13Chapter 38 - IRAC Income statement per quarter - Logistics13Row Gross profit (value_1 q_act)13User Value 814848 Mio | Q3 2016 | 94 | ||||||||||||
| Q4 2016 | 92 | ||||||||||||||||||
| Q1 2017 | 83 | ||||||||||||||||||
| Q2 2017 | 81 | ||||||||||||||||||
| EBIT | 09 | 05 | 24 | 31 | 27 | r7 PAC Stuker Benjamin Referenced Value (value_3_PQACT02)1313Document Q3_2017_Investor amp AC presentations13Chapter 38 - IRAC Income statement per quarter - Logistics13Row EBIT reported (value_1 q_act)13User Value 27118 Mio | Q3 2017 | 81 | |||||||||||
| EBIT | |||||||||||||||||||
| Q3 2016 | 09 | ||||||||||||||||||
| Q4 2016 | 05 | ||||||||||||||||||
| Q1 2017 | 24 | ||||||||||||||||||
| Q2 2017 | 31 | ||||||||||||||||||
| Q3 2017 | 27 |
| 2017 | 2016 | ||||||||||||||||||||||||||||||||
| 2017 | 2016 | 2017 | |||||||||||||||||||||||||||||||
| YoY Growth | Q3 | Q4 | Q1 | Q2 | Q3 | Gross Profit EBIT | YTD | YTD | |||||||||||||||||||||||||
| Gross Profit | -6 | -11 | -16 | -19 | -14 | r5 PAC Stuker Benjamin Referenced Value (value_1_PQACT02)1313Document Q3_2017_Investor amp AC presentations13Chapter 38 - IRAC Income statement per quarter - Logistics13Row GP Change YoY (value_1 q_act)13User Value -01372 Mio | Gross Profit | 2933 | 24537 | -16 | r5 PAC Stuker Benjamin Referenced Value (value_2_PQACT02)1313Document Q3_2017_Quarter_Report13Chapter Products quater and year to date13Row ltlt Gross profit gtgt (ltlt value_3 gtgt q_act_jan)13User Value 24537 Tsd1313----------------------------------------------------------------------------------------1313Referenced Value (value_2_PQPRIOR02)1313Document Q3_2017_Investor amp AC presentations13Chapter 38 - IRAC Income statement per quarter - Logistics13Row Gross profit (value_1 q_prior_jan)13User Value 2933025 Mio | ||||||||||||||||||||||
| EBIT (adjusted PY) | 50 | 81 | 63 | rf7 PAC Stuker Benjamin Referenced Value (value_2_PQACT02)1313Document Q3_2017_Quarter_Report13Chapter Products quater and year to date13Row ltlt Operating result (EBIT) gtgt (ltlt value_3 gtgt q_act_jan)13User Value 815 Tsd1313----------------------------------------------------------------------------------------1313Referenced Value (value_2_PQPRIOR02)1313Document Q3_2017_Quarter_Report13Chapter Products quater and year to date13Row ltlt Operating result (Segment EBIT) adjusted gtgt (ltlt value_3 gtgt q_prior_jan)13User Value 501 Tsd | |||||||||||||||||||||||||||||
| NFR in of EBIT | 10 | 20 | m9 | ||||||||||||||||||||||||||||||
| NFR | 43888478 | 4057267 | rf8 PAC Stuker Benjamin Referenced Value (value_2_PQACT02)1313Document Q3_2017_Quarter_Report13Chapter Products quater and year to date13Row ltlt Net forwarding revenue gtgt (ltlt value_3 gtgt q_act_jan)13User Value 40573 Tsd1313----------------------------------------------------------------------------------------1313Referenced Value (value_2_PQPRIOR02)1313Document Q3_2017_Quarter_Report13Chapter Products quater and year to date13Row ltlt Net forwarding revenue gtgt (ltlt value_3 gtgt q_prior_jan)13User Value 43888 Tsd |
| Q3 | |||||||||||||||||||
| GP | Q3 2016 | Q4 2016 | Q1 2017 | Q2 2017 | Q3 2017 | Gross profit | |||||||||||||
| 94 | 92 | 83 | 81 | 81 | r3 PAC Stuker Benjamin Referenced Value (value_3_PQACT02)1313Document Q3_2017_Investor amp AC presentations13Chapter 38 - IRAC Income statement per quarter - Logistics13Row Gross profit (value_1 q_act)13User Value 814848 Mio | Q3 2016 | 94 | ||||||||||||
| Q4 2016 | 92 | ||||||||||||||||||
| Q1 2017 | 83 | ||||||||||||||||||
| Q2 2017 | 81 | ||||||||||||||||||
| EBIT | 09 | 05 | 24 | 31 | 27 | r7 PAC Stuker Benjamin Referenced Value (value_3_PQACT02)1313Document Q3_2017_Investor amp AC presentations13Chapter 38 - IRAC Income statement per quarter - Logistics13Row EBIT reported (value_1 q_act)13User Value 27118 Mio | Q3 2017 | 81 | |||||||||||
| EBIT | |||||||||||||||||||
| Q3 2016 | 09 | ||||||||||||||||||
| Q4 2016 | 05 | ||||||||||||||||||
| Q1 2017 | 24 | ||||||||||||||||||
| Q2 2017 | 31 | ||||||||||||||||||
| Q3 2017 | 27 |
| 2017 | 2016 | ||||||||||||||||||||||||||||||||
| 2017 | 2016 | 2017 | |||||||||||||||||||||||||||||||
| YoY Growth | Q3 | Q4 | Q1 | Q2 | Q3 | Gross Profit EBIT | YTD | YTD | |||||||||||||||||||||||||
| Gross Profit | -6 | -11 | -16 | -19 | -14 | r5 PAC Stuker Benjamin Referenced Value (value_1_PQACT02)1313Document Q3_2017_Investor amp AC presentations13Chapter 38 - IRAC Income statement per quarter - Logistics13Row GP Change YoY (value_1 q_act)13User Value -01372 Mio | Gross Profit | 2933 | 24537 | -16 | r5 PAC Stuker Benjamin Referenced Value (value_2_PQACT02)1313Document Q3_2017_Quarter_Report13Chapter Products quater and year to date13Row ltlt Gross profit gtgt (ltlt value_3 gtgt q_act_jan)13User Value 24537 Tsd1313----------------------------------------------------------------------------------------1313Referenced Value (value_2_PQPRIOR02)1313Document Q3_2017_Investor amp AC presentations13Chapter 38 - IRAC Income statement per quarter - Logistics13Row Gross profit (value_1 q_prior_jan)13User Value 2933025 Mio | ||||||||||||||||||||||
| EBIT (adjusted PY) | 50 | 81 | 63 | rf7 PAC Stuker Benjamin Referenced Value (value_2_PQACT02)1313Document Q3_2017_Quarter_Report13Chapter Products quater and year to date13Row ltlt Operating result (EBIT) gtgt (ltlt value_3 gtgt q_act_jan)13User Value 815 Tsd1313----------------------------------------------------------------------------------------1313Referenced Value (value_2_PQPRIOR02)1313Document Q3_2017_Quarter_Report13Chapter Products quater and year to date13Row ltlt Operating result (Segment EBIT) adjusted gtgt (ltlt value_3 gtgt q_prior_jan)13User Value 501 Tsd | |||||||||||||||||||||||||||||
| NFR in of EBIT | 10 | 20 | m9 | ||||||||||||||||||||||||||||||
| NFR | 43888478 | 4057267 | rf8 PAC Stuker Benjamin Referenced Value (value_2_PQACT02)1313Document Q3_2017_Quarter_Report13Chapter Products quater and year to date13Row ltlt Net forwarding revenue gtgt (ltlt value_3 gtgt q_act_jan)13User Value 40573 Tsd1313----------------------------------------------------------------------------------------1313Referenced Value (value_2_PQPRIOR02)1313Document Q3_2017_Quarter_Report13Chapter Products quater and year to date13Row ltlt Net forwarding revenue gtgt (ltlt value_3 gtgt q_prior_jan)13User Value 43888 Tsd |
| Q3 | ||||||||||||||||||||||||||
| TEU | Q3 2016 | Q4 2016 | Q1 2017 | Q2 2017 | Q3 2017 | TEU | ||||||||||||||||||||
| 379 | 389 | 374 | 3828 | 386 | m3 | r3 PAC Monaco Salvatore Referenced Value (value_3_PQACT02)1313Document Q3_2017_Investor amp AC presentations13Chapter 37 - IRAC Income statement per quarter - Ocean Freight13Row Ocean Freight volumes (000 tons) (value_1 q_act)13User Value 3856050 Mio | Q3 2016 | 379 | 296 | |||||||||||||||||
| 296 | 254 | 282 | 285 | 282 | m4 | r4 PAC Monaco Salvatore Referenced Value (value_3_PQACT02)1313Document Q3_2017_Investor amp AC presentations13Chapter 37 - IRAC Income statement per quarter - Ocean Freight13Row GPTEU (CHF) (value_1 q_act)13User Value 2820750 Mio | Q4 2016 | 389 | 254 | |||||||||||||||||
| Q1 2017 | 374 | 282 | ||||||||||||||||||||||||
| Q2 2017 | 383 | 285 | ||||||||||||||||||||||||
| EBIT | 51 | -51 | -32 | 06 | -29 | m7 | r10 PAC Monaco Salvatore Referenced Value (value_3_PQACT02)1313Document Q3_2017_Investor amp AC presentations13Chapter 37 - IRAC Income statement per quarter - Ocean Freight13Row EBIT reported (value_1 q_act)13User Value -29490 Mio | Q3 2017 | 386 | 282 | ||||||||||||||||
| 45 | -51 | -3 | 06 | -003 | m8 | r8 PAC Monaco Salvatore Referenced Value (value_3_PQACT02)1313Document Q3_2017_Investor amp AC presentations13Chapter 37 - IRAC Income statement per quarter - Ocean Freight13Row in of gross profit (value_1 q_act)13User Value -00271 Mio | ||||||||||||||||||||
PAC Hamon Pierrick Invalid Reference (value_3_PQACT02) 1313Reference could not be handled13Underlying Formula | EBIT | EBIT | EBIT GP | |||||||||||||||||||||||
| 0 | -00271 | r11 PAC Monaco Salvatore Referenced Value (value_3_PQACT02)1313Document Q3_2017_Investor amp AC presentations13Chapter 37 - IRAC Income statement per quarter - Ocean Freight13Row in of gross profit (value_1 q_act)13User Value -00271 Mio | PAC Monaco Salvatore Referenced Value (value_3_PQACT02)1313Document Q3_2017_Investor amp AC presentations13Chapter 37 - IRAC Income statement per quarter - Ocean Freight13Row Ocean Freight volumes (000 tons) (value_1 q_act)13User Value 3856050 Mio | PAC Monaco Salvatore Referenced Value (value_3_PQACT02)1313Document Q3_2017_Investor amp AC presentations13Chapter 37 - IRAC Income statement per quarter - Ocean Freight13Row GPTEU (CHF) (value_1 q_act)13User Value 2820750 Mio | PAC Monaco Salvatore Referenced Value (value_3_PQACT02)1313Document Q3_2017_Investor amp AC presentations13Chapter 37 - IRAC Income statement per quarter - Ocean Freight13Row EBIT reported (value_1 q_act)13User Value -29490 Mio | PAC Monaco Salvatore Referenced Value (value_3_PQACT02)1313Document Q3_2017_Investor amp AC presentations13Chapter 37 - IRAC Income statement per quarter - Ocean Freight13Row in of gross profit (value_1 q_act)13User Value -00271 Mio | Q3 2016 | 51 | 45 | |||||||||||||||||
| Q4 2016 | -51 | -51 | ||||||||||||||||||||||||
| Q1 2017 | -32 | -30 | ||||||||||||||||||||||||
| Q2 2017 | 06 | 06 | ||||||||||||||||||||||||
| Q3 2017 | -29 | -27 |
| 2017 | 2016 | |||||||||||||||||||||||||||||||||||||||||||||
| 2017 | 2016 | 2017 | ||||||||||||||||||||||||||||||||||||||||||||
| YoY Growth | Q3 | Q4 | Q1 | Q2 | Q3 | Gross Profit EBIT | YTD | YTD | ||||||||||||||||||||||||||||||||||||||
| Volume (market estimated) | 0 | 3 | 4 | 3 | 3 | m5 | Gross Profit | 3450 | 3234 | -6 | r5 PAC Monaco Salvatore Referenced Value (value_2_PQACT02)1313Document Q3_2017_Investor amp AC presentations13Chapter 37 - IRAC Income statement per quarter - Ocean Freight13Row Gross profit (value_1 q_act_jan)13User Value 3233667 Mio1313----------------------------------------------------------------------------------------1313Referenced Value (value_2_PQPRIOR02)1313Document Q3_2017_Investor amp AC presentations13Chapter 37 - IRAC Income statement per quarter - Ocean Freight13Row Gross profit (value_1 q_prior_jan)13User Value 3450353 Mio | |||||||||||||||||||||||||||||||||||
| Volume (Panalpina) | -9 | 1 | 7 | 3 | 2 | r6 PAC Monaco Salvatore Referenced Value (value_1_PQACT02)1313Document Q3_2017_Investor amp AC presentations13Chapter 37 - IRAC Income statement per quarter - Ocean Freight13Row change YoY (value_1 q_act)13User Value 00182 Mio | EBIT (adjusted PY) | 160 | -55 | -135 | r6 PAC Monaco Salvatore Referenced Value (value_2_PQACT02)1313Document Q3_2017_Investor amp AC presentations13Chapter 37 - IRAC Income statement per quarter - Ocean Freight13Row EBIT adjusted (value_1 q_act_jan)13User Value -55208 Mio1313----------------------------------------------------------------------------------------1313Referenced Value (value_2_PQPRIOR02)1313Document Q3_2017_Investor amp AC presentations13Chapter 37 - IRAC Income statement per quarter - Ocean Freight13Row EBIT adjusted (value_1 q_prior_jan)13User Value 159801 Mio | |||||||||||||||||||||||||||||||||||
| GPTEU | -2 | -18 | -17 | -7 | -5 | r7 PAC Monaco Salvatore Referenced Value (value_1_PQACT02)1313Document Q3_2017_Investor amp AC presentations13Chapter 37 - IRAC Income statement per quarter - Ocean Freight13Row change YoY (value_1 q_act)13User Value -00471 Mio | EBITGP () | 46 | -17 | r7 PAC Monaco Salvatore Referenced Value (value_2_PQACT02)1313Document Q3_2017_Investor amp AC presentations13Chapter 37 - IRAC Income statement per quarter - Ocean Freight13Row in of gross profit (value_1 q_act_jan)13User Value -00171 Mio1313----------------------------------------------------------------------------------------1313Referenced Value (value_2_PQPRIOR02)1313Document Q3_2017_Investor amp AC presentations13Chapter 37 - IRAC Income statement per quarter - Ocean Freight13Row in of gross profit (value_1 q_prior_jan)13User Value 00463 Mio | ||||||||||||||||||||||||||||||||||||
| Gross Profit | -10 | -16 | -11 | -5 | -3 | r8 PAC Monaco Salvatore Referenced Value (value_1_PQACT02)1313Document Q3_2017_Investor amp AC presentations13Chapter 37 - IRAC Income statement per quarter - Ocean Freight13Row GP change YoY (value_1 q_act)13User Value -00298 Mio | PAC Monaco Salvatore Referenced Value (value_2_PQACT02)1313Document Q3_2017_Investor amp AC presentations13Chapter 37 - IRAC Income statement per quarter - Ocean Freight13Row Gross profit (value_1 q_act_jan)13User Value 3233667 Mio1313----------------------------------------------------------------------------------------1313Referenced Value (value_2_PQPRIOR02)1313Document Q3_2017_Investor amp AC presentations13Chapter 37 - IRAC Income statement per quarter - Ocean Freight13Row Gross profit (value_1 q_prior_jan)13User Value 3450353 Mio | PAC Monaco Salvatore Referenced Value (value_2_PQACT02)1313Document Q3_2017_Investor amp AC presentations13Chapter 37 - IRAC Income statement per quarter - Ocean Freight13Row EBIT adjusted (value_1 q_act_jan)13User Value -55208 Mio1313----------------------------------------------------------------------------------------1313Referenced Value (value_2_PQPRIOR02)1313Document Q3_2017_Investor amp AC presentations13Chapter 37 - IRAC Income statement per quarter - Ocean Freight13Row EBIT adjusted (value_1 q_prior_jan)13User Value 159801 Mio | PAC Monaco Salvatore Referenced Value (value_2_PQACT02)1313Document Q3_2017_Investor amp AC presentations13Chapter 37 - IRAC Income statement per quarter - Ocean Freight13Row in of gross profit (value_1 q_act_jan)13User Value -00171 Mio1313----------------------------------------------------------------------------------------1313Referenced Value (value_2_PQPRIOR02)1313Document Q3_2017_Investor amp AC presentations13Chapter 37 - IRAC Income statement per quarter - Ocean Freight13Row in of gross profit (value_1 q_prior_jan)13User Value 00463 Mio | Volumes (TEUs 000) | 10995 | 11426 | 4 | r8 PAC Monaco Salvatore Referenced Value (value_2_PQACT02)1313Document Q3_2017_Investor amp AC presentations13Chapter 37 - IRAC Income statement per quarter - Ocean Freight13Row Ocean Freight volumes (000 tons) (value_1 q_act_jan)13User Value 11426050 Mio1313----------------------------------------------------------------------------------------1313Referenced Value (value_2_PQPRIOR02)1313Document Q3_2017_Investor amp AC presentations13Chapter 37 - IRAC Income statement per quarter - Ocean Freight13Row Ocean Freight volumes (000 tons) (value_1 q_prior_jan)13User Value 10994918 Mio |
| Q3 | ||||||||||||||||||||||||||
| TEU | Q3 2016 | Q4 2016 | Q1 2017 | Q2 2017 | Q3 2017 | TEU | ||||||||||||||||||||
| 379 | 389 | 374 | 3828 | 386 | m3 | r3 PAC Monaco Salvatore Referenced Value (value_3_PQACT02)1313Document Q3_2017_Investor amp AC presentations13Chapter 37 - IRAC Income statement per quarter - Ocean Freight13Row Ocean Freight volumes (000 tons) (value_1 q_act)13User Value 3856050 Mio | Q3 2016 | 379 | 296 | |||||||||||||||||
| 296 | 254 | 282 | 285 | 282 | m4 | r4 PAC Monaco Salvatore Referenced Value (value_3_PQACT02)1313Document Q3_2017_Investor amp AC presentations13Chapter 37 - IRAC Income statement per quarter - Ocean Freight13Row GPTEU (CHF) (value_1 q_act)13User Value 2820750 Mio | Q4 2016 | 389 | 254 | |||||||||||||||||
| Q1 2017 | 374 | 282 | ||||||||||||||||||||||||
| Q2 2017 | 383 | 285 | ||||||||||||||||||||||||
| EBIT | 51 | -51 | -32 | 06 | -29 | m7 | r10 PAC Monaco Salvatore Referenced Value (value_3_PQACT02)1313Document Q3_2017_Investor amp AC presentations13Chapter 37 - IRAC Income statement per quarter - Ocean Freight13Row EBIT reported (value_1 q_act)13User Value -29490 Mio | Q3 2017 | 386 | 282 | ||||||||||||||||
| 45 | -51 | -3 | 06 | -003 | m8 | r8 PAC Monaco Salvatore Referenced Value (value_3_PQACT02)1313Document Q3_2017_Investor amp AC presentations13Chapter 37 - IRAC Income statement per quarter - Ocean Freight13Row in of gross profit (value_1 q_act)13User Value -00271 Mio | ||||||||||||||||||||
PAC Hamon Pierrick Invalid Reference (value_3_PQACT02) 1313Reference could not be handled13Underlying Formula | EBIT | EBIT | EBIT GP | |||||||||||||||||||||||
| 0 | -00271 | r11 PAC Monaco Salvatore Referenced Value (value_3_PQACT02)1313Document Q3_2017_Investor amp AC presentations13Chapter 37 - IRAC Income statement per quarter - Ocean Freight13Row in of gross profit (value_1 q_act)13User Value -00271 Mio | PAC Monaco Salvatore Referenced Value (value_3_PQACT02)1313Document Q3_2017_Investor amp AC presentations13Chapter 37 - IRAC Income statement per quarter - Ocean Freight13Row Ocean Freight volumes (000 tons) (value_1 q_act)13User Value 3856050 Mio | PAC Monaco Salvatore Referenced Value (value_3_PQACT02)1313Document Q3_2017_Investor amp AC presentations13Chapter 37 - IRAC Income statement per quarter - Ocean Freight13Row GPTEU (CHF) (value_1 q_act)13User Value 2820750 Mio | PAC Monaco Salvatore Referenced Value (value_3_PQACT02)1313Document Q3_2017_Investor amp AC presentations13Chapter 37 - IRAC Income statement per quarter - Ocean Freight13Row EBIT reported (value_1 q_act)13User Value -29490 Mio | PAC Monaco Salvatore Referenced Value (value_3_PQACT02)1313Document Q3_2017_Investor amp AC presentations13Chapter 37 - IRAC Income statement per quarter - Ocean Freight13Row in of gross profit (value_1 q_act)13User Value -00271 Mio | Q3 2016 | 51 | 45 | |||||||||||||||||
| Q4 2016 | -51 | -51 | ||||||||||||||||||||||||
| Q1 2017 | -32 | -30 | ||||||||||||||||||||||||
| Q2 2017 | 06 | 06 | ||||||||||||||||||||||||
| Q3 2017 | -29 | -27 |
| 2017 | 2016 | |||||||||||||||||||||||||||||||||||||||||||||
| 2017 | 2016 | 2017 | ||||||||||||||||||||||||||||||||||||||||||||
| YoY Growth | Q3 | Q4 | Q1 | Q2 | Q3 | Gross Profit EBIT | YTD | YTD | ||||||||||||||||||||||||||||||||||||||
| Volume (market estimated) | 0 | 3 | 4 | 3 | 3 | m5 | Gross Profit | 3450 | 3234 | -6 | r5 PAC Monaco Salvatore Referenced Value (value_2_PQACT02)1313Document Q3_2017_Investor amp AC presentations13Chapter 37 - IRAC Income statement per quarter - Ocean Freight13Row Gross profit (value_1 q_act_jan)13User Value 3233667 Mio1313----------------------------------------------------------------------------------------1313Referenced Value (value_2_PQPRIOR02)1313Document Q3_2017_Investor amp AC presentations13Chapter 37 - IRAC Income statement per quarter - Ocean Freight13Row Gross profit (value_1 q_prior_jan)13User Value 3450353 Mio | |||||||||||||||||||||||||||||||||||
| Volume (Panalpina) | -9 | 1 | 7 | 3 | 2 | r6 PAC Monaco Salvatore Referenced Value (value_1_PQACT02)1313Document Q3_2017_Investor amp AC presentations13Chapter 37 - IRAC Income statement per quarter - Ocean Freight13Row change YoY (value_1 q_act)13User Value 00182 Mio | EBIT (adjusted PY) | 160 | -55 | -135 | r6 PAC Monaco Salvatore Referenced Value (value_2_PQACT02)1313Document Q3_2017_Investor amp AC presentations13Chapter 37 - IRAC Income statement per quarter - Ocean Freight13Row EBIT adjusted (value_1 q_act_jan)13User Value -55208 Mio1313----------------------------------------------------------------------------------------1313Referenced Value (value_2_PQPRIOR02)1313Document Q3_2017_Investor amp AC presentations13Chapter 37 - IRAC Income statement per quarter - Ocean Freight13Row EBIT adjusted (value_1 q_prior_jan)13User Value 159801 Mio | |||||||||||||||||||||||||||||||||||
| GPTEU | -2 | -18 | -17 | -7 | -5 | r7 PAC Monaco Salvatore Referenced Value (value_1_PQACT02)1313Document Q3_2017_Investor amp AC presentations13Chapter 37 - IRAC Income statement per quarter - Ocean Freight13Row change YoY (value_1 q_act)13User Value -00471 Mio | EBITGP () | 46 | -17 | r7 PAC Monaco Salvatore Referenced Value (value_2_PQACT02)1313Document Q3_2017_Investor amp AC presentations13Chapter 37 - IRAC Income statement per quarter - Ocean Freight13Row in of gross profit (value_1 q_act_jan)13User Value -00171 Mio1313----------------------------------------------------------------------------------------1313Referenced Value (value_2_PQPRIOR02)1313Document Q3_2017_Investor amp AC presentations13Chapter 37 - IRAC Income statement per quarter - Ocean Freight13Row in of gross profit (value_1 q_prior_jan)13User Value 00463 Mio | ||||||||||||||||||||||||||||||||||||
| Gross Profit | -10 | -16 | -11 | -5 | -3 | r8 PAC Monaco Salvatore Referenced Value (value_1_PQACT02)1313Document Q3_2017_Investor amp AC presentations13Chapter 37 - IRAC Income statement per quarter - Ocean Freight13Row GP change YoY (value_1 q_act)13User Value -00298 Mio | PAC Monaco Salvatore Referenced Value (value_2_PQACT02)1313Document Q3_2017_Investor amp AC presentations13Chapter 37 - IRAC Income statement per quarter - Ocean Freight13Row Gross profit (value_1 q_act_jan)13User Value 3233667 Mio1313----------------------------------------------------------------------------------------1313Referenced Value (value_2_PQPRIOR02)1313Document Q3_2017_Investor amp AC presentations13Chapter 37 - IRAC Income statement per quarter - Ocean Freight13Row Gross profit (value_1 q_prior_jan)13User Value 3450353 Mio | PAC Monaco Salvatore Referenced Value (value_2_PQACT02)1313Document Q3_2017_Investor amp AC presentations13Chapter 37 - IRAC Income statement per quarter - Ocean Freight13Row EBIT adjusted (value_1 q_act_jan)13User Value -55208 Mio1313----------------------------------------------------------------------------------------1313Referenced Value (value_2_PQPRIOR02)1313Document Q3_2017_Investor amp AC presentations13Chapter 37 - IRAC Income statement per quarter - Ocean Freight13Row EBIT adjusted (value_1 q_prior_jan)13User Value 159801 Mio | PAC Monaco Salvatore Referenced Value (value_2_PQACT02)1313Document Q3_2017_Investor amp AC presentations13Chapter 37 - IRAC Income statement per quarter - Ocean Freight13Row in of gross profit (value_1 q_act_jan)13User Value -00171 Mio1313----------------------------------------------------------------------------------------1313Referenced Value (value_2_PQPRIOR02)1313Document Q3_2017_Investor amp AC presentations13Chapter 37 - IRAC Income statement per quarter - Ocean Freight13Row in of gross profit (value_1 q_prior_jan)13User Value 00463 Mio | Volumes (TEUs 000) | 10995 | 11426 | 4 | r8 PAC Monaco Salvatore Referenced Value (value_2_PQACT02)1313Document Q3_2017_Investor amp AC presentations13Chapter 37 - IRAC Income statement per quarter - Ocean Freight13Row Ocean Freight volumes (000 tons) (value_1 q_act_jan)13User Value 11426050 Mio1313----------------------------------------------------------------------------------------1313Referenced Value (value_2_PQPRIOR02)1313Document Q3_2017_Investor amp AC presentations13Chapter 37 - IRAC Income statement per quarter - Ocean Freight13Row Ocean Freight volumes (000 tons) (value_1 q_prior_jan)13User Value 10994918 Mio |
| Q3 | ||||||||||||||||||||||||||
| TEU | Q3 2016 | Q4 2016 | Q1 2017 | Q2 2017 | Q3 2017 | TEU | ||||||||||||||||||||
| 379 | 389 | 374 | 3828 | 386 | m3 | r3 PAC Monaco Salvatore Referenced Value (value_3_PQACT02)1313Document Q3_2017_Investor amp AC presentations13Chapter 37 - IRAC Income statement per quarter - Ocean Freight13Row Ocean Freight volumes (000 tons) (value_1 q_act)13User Value 3856050 Mio | Q3 2016 | 379 | 296 | |||||||||||||||||
| 296 | 254 | 282 | 285 | 282 | m4 | r4 PAC Monaco Salvatore Referenced Value (value_3_PQACT02)1313Document Q3_2017_Investor amp AC presentations13Chapter 37 - IRAC Income statement per quarter - Ocean Freight13Row GPTEU (CHF) (value_1 q_act)13User Value 2820750 Mio | Q4 2016 | 389 | 254 | |||||||||||||||||
| Q1 2017 | 374 | 282 | ||||||||||||||||||||||||
| Q2 2017 | 383 | 285 | ||||||||||||||||||||||||
| EBIT | 51 | -51 | -32 | 06 | -29 | m7 | r10 PAC Monaco Salvatore Referenced Value (value_3_PQACT02)1313Document Q3_2017_Investor amp AC presentations13Chapter 37 - IRAC Income statement per quarter - Ocean Freight13Row EBIT reported (value_1 q_act)13User Value -29490 Mio | Q3 2017 | 386 | 282 | ||||||||||||||||
| 45 | -51 | -3 | 06 | -003 | m8 | r8 PAC Monaco Salvatore Referenced Value (value_3_PQACT02)1313Document Q3_2017_Investor amp AC presentations13Chapter 37 - IRAC Income statement per quarter - Ocean Freight13Row in of gross profit (value_1 q_act)13User Value -00271 Mio | ||||||||||||||||||||
PAC Hamon Pierrick Invalid Reference (value_3_PQACT02) 1313Reference could not be handled13Underlying Formula | EBIT | EBIT | EBIT GP | |||||||||||||||||||||||
| 0 | -00271 | r11 PAC Monaco Salvatore Referenced Value (value_3_PQACT02)1313Document Q3_2017_Investor amp AC presentations13Chapter 37 - IRAC Income statement per quarter - Ocean Freight13Row in of gross profit (value_1 q_act)13User Value -00271 Mio | PAC Monaco Salvatore Referenced Value (value_3_PQACT02)1313Document Q3_2017_Investor amp AC presentations13Chapter 37 - IRAC Income statement per quarter - Ocean Freight13Row Ocean Freight volumes (000 tons) (value_1 q_act)13User Value 3856050 Mio | PAC Monaco Salvatore Referenced Value (value_3_PQACT02)1313Document Q3_2017_Investor amp AC presentations13Chapter 37 - IRAC Income statement per quarter - Ocean Freight13Row GPTEU (CHF) (value_1 q_act)13User Value 2820750 Mio | PAC Monaco Salvatore Referenced Value (value_3_PQACT02)1313Document Q3_2017_Investor amp AC presentations13Chapter 37 - IRAC Income statement per quarter - Ocean Freight13Row EBIT reported (value_1 q_act)13User Value -29490 Mio | PAC Monaco Salvatore Referenced Value (value_3_PQACT02)1313Document Q3_2017_Investor amp AC presentations13Chapter 37 - IRAC Income statement per quarter - Ocean Freight13Row in of gross profit (value_1 q_act)13User Value -00271 Mio | Q3 2016 | 51 | 45 | |||||||||||||||||
| Q4 2016 | -51 | -51 | ||||||||||||||||||||||||
| Q1 2017 | -32 | -30 | ||||||||||||||||||||||||
| Q2 2017 | 06 | 06 | ||||||||||||||||||||||||
| Q3 2017 | -29 | -27 |
| 2017 | 2016 | |||||||||||||||||||||||||||||||||||||||||||||
| 2017 | 2016 | 2017 | ||||||||||||||||||||||||||||||||||||||||||||
| YoY Growth | Q3 | Q4 | Q1 | Q2 | Q3 | Gross Profit EBIT | YTD | YTD | ||||||||||||||||||||||||||||||||||||||
| Volume (market estimated) | 0 | 3 | 4 | 3 | 3 | m5 | Gross Profit | 3450 | 3234 | -6 | r5 PAC Monaco Salvatore Referenced Value (value_2_PQACT02)1313Document Q3_2017_Investor amp AC presentations13Chapter 37 - IRAC Income statement per quarter - Ocean Freight13Row Gross profit (value_1 q_act_jan)13User Value 3233667 Mio1313----------------------------------------------------------------------------------------1313Referenced Value (value_2_PQPRIOR02)1313Document Q3_2017_Investor amp AC presentations13Chapter 37 - IRAC Income statement per quarter - Ocean Freight13Row Gross profit (value_1 q_prior_jan)13User Value 3450353 Mio | |||||||||||||||||||||||||||||||||||
| Volume (Panalpina) | -9 | 1 | 7 | 3 | 2 | r6 PAC Monaco Salvatore Referenced Value (value_1_PQACT02)1313Document Q3_2017_Investor amp AC presentations13Chapter 37 - IRAC Income statement per quarter - Ocean Freight13Row change YoY (value_1 q_act)13User Value 00182 Mio | EBIT (adjusted PY) | 160 | -55 | -135 | r6 PAC Monaco Salvatore Referenced Value (value_2_PQACT02)1313Document Q3_2017_Investor amp AC presentations13Chapter 37 - IRAC Income statement per quarter - Ocean Freight13Row EBIT adjusted (value_1 q_act_jan)13User Value -55208 Mio1313----------------------------------------------------------------------------------------1313Referenced Value (value_2_PQPRIOR02)1313Document Q3_2017_Investor amp AC presentations13Chapter 37 - IRAC Income statement per quarter - Ocean Freight13Row EBIT adjusted (value_1 q_prior_jan)13User Value 159801 Mio | |||||||||||||||||||||||||||||||||||
| GPTEU | -2 | -18 | -17 | -7 | -5 | r7 PAC Monaco Salvatore Referenced Value (value_1_PQACT02)1313Document Q3_2017_Investor amp AC presentations13Chapter 37 - IRAC Income statement per quarter - Ocean Freight13Row change YoY (value_1 q_act)13User Value -00471 Mio | EBITGP () | 46 | -17 | r7 PAC Monaco Salvatore Referenced Value (value_2_PQACT02)1313Document Q3_2017_Investor amp AC presentations13Chapter 37 - IRAC Income statement per quarter - Ocean Freight13Row in of gross profit (value_1 q_act_jan)13User Value -00171 Mio1313----------------------------------------------------------------------------------------1313Referenced Value (value_2_PQPRIOR02)1313Document Q3_2017_Investor amp AC presentations13Chapter 37 - IRAC Income statement per quarter - Ocean Freight13Row in of gross profit (value_1 q_prior_jan)13User Value 00463 Mio | ||||||||||||||||||||||||||||||||||||
| Gross Profit | -10 | -16 | -11 | -5 | -3 | r8 PAC Monaco Salvatore Referenced Value (value_1_PQACT02)1313Document Q3_2017_Investor amp AC presentations13Chapter 37 - IRAC Income statement per quarter - Ocean Freight13Row GP change YoY (value_1 q_act)13User Value -00298 Mio | PAC Monaco Salvatore Referenced Value (value_2_PQACT02)1313Document Q3_2017_Investor amp AC presentations13Chapter 37 - IRAC Income statement per quarter - Ocean Freight13Row Gross profit (value_1 q_act_jan)13User Value 3233667 Mio1313----------------------------------------------------------------------------------------1313Referenced Value (value_2_PQPRIOR02)1313Document Q3_2017_Investor amp AC presentations13Chapter 37 - IRAC Income statement per quarter - Ocean Freight13Row Gross profit (value_1 q_prior_jan)13User Value 3450353 Mio | PAC Monaco Salvatore Referenced Value (value_2_PQACT02)1313Document Q3_2017_Investor amp AC presentations13Chapter 37 - IRAC Income statement per quarter - Ocean Freight13Row EBIT adjusted (value_1 q_act_jan)13User Value -55208 Mio1313----------------------------------------------------------------------------------------1313Referenced Value (value_2_PQPRIOR02)1313Document Q3_2017_Investor amp AC presentations13Chapter 37 - IRAC Income statement per quarter - Ocean Freight13Row EBIT adjusted (value_1 q_prior_jan)13User Value 159801 Mio | PAC Monaco Salvatore Referenced Value (value_2_PQACT02)1313Document Q3_2017_Investor amp AC presentations13Chapter 37 - IRAC Income statement per quarter - Ocean Freight13Row in of gross profit (value_1 q_act_jan)13User Value -00171 Mio1313----------------------------------------------------------------------------------------1313Referenced Value (value_2_PQPRIOR02)1313Document Q3_2017_Investor amp AC presentations13Chapter 37 - IRAC Income statement per quarter - Ocean Freight13Row in of gross profit (value_1 q_prior_jan)13User Value 00463 Mio | Volumes (TEUs 000) | 10995 | 11426 | 4 | r8 PAC Monaco Salvatore Referenced Value (value_2_PQACT02)1313Document Q3_2017_Investor amp AC presentations13Chapter 37 - IRAC Income statement per quarter - Ocean Freight13Row Ocean Freight volumes (000 tons) (value_1 q_act_jan)13User Value 11426050 Mio1313----------------------------------------------------------------------------------------1313Referenced Value (value_2_PQPRIOR02)1313Document Q3_2017_Investor amp AC presentations13Chapter 37 - IRAC Income statement per quarter - Ocean Freight13Row Ocean Freight volumes (000 tons) (value_1 q_prior_jan)13User Value 10994918 Mio |
| Q3 | ||||||||||||||||||||||||||
| TEU | Q3 2016 | Q4 2016 | Q1 2017 | Q2 2017 | Q3 2017 | TEU | ||||||||||||||||||||
| 379 | 389 | 374 | 3828 | 386 | m3 | r3 PAC Monaco Salvatore Referenced Value (value_3_PQACT02)1313Document Q3_2017_Investor amp AC presentations13Chapter 37 - IRAC Income statement per quarter - Ocean Freight13Row Ocean Freight volumes (000 tons) (value_1 q_act)13User Value 3856050 Mio | Q3 2016 | 379 | 296 | |||||||||||||||||
| 296 | 254 | 282 | 285 | 282 | m4 | r4 PAC Monaco Salvatore Referenced Value (value_3_PQACT02)1313Document Q3_2017_Investor amp AC presentations13Chapter 37 - IRAC Income statement per quarter - Ocean Freight13Row GPTEU (CHF) (value_1 q_act)13User Value 2820750 Mio | Q4 2016 | 389 | 254 | |||||||||||||||||
| Q1 2017 | 374 | 282 | ||||||||||||||||||||||||
| Q2 2017 | 383 | 285 | ||||||||||||||||||||||||
| EBIT | 51 | -51 | -32 | 06 | -29 | m7 | r10 PAC Monaco Salvatore Referenced Value (value_3_PQACT02)1313Document Q3_2017_Investor amp AC presentations13Chapter 37 - IRAC Income statement per quarter - Ocean Freight13Row EBIT reported (value_1 q_act)13User Value -29490 Mio | Q3 2017 | 386 | 282 | ||||||||||||||||
| 45 | -51 | -3 | 06 | -003 | m8 | r8 PAC Monaco Salvatore Referenced Value (value_3_PQACT02)1313Document Q3_2017_Investor amp AC presentations13Chapter 37 - IRAC Income statement per quarter - Ocean Freight13Row in of gross profit (value_1 q_act)13User Value -00271 Mio | ||||||||||||||||||||
PAC Hamon Pierrick Invalid Reference (value_3_PQACT02) 1313Reference could not be handled13Underlying Formula | EBIT | EBIT | EBIT GP | |||||||||||||||||||||||
| 0 | -00271 | r11 PAC Monaco Salvatore Referenced Value (value_3_PQACT02)1313Document Q3_2017_Investor amp AC presentations13Chapter 37 - IRAC Income statement per quarter - Ocean Freight13Row in of gross profit (value_1 q_act)13User Value -00271 Mio | PAC Monaco Salvatore Referenced Value (value_3_PQACT02)1313Document Q3_2017_Investor amp AC presentations13Chapter 37 - IRAC Income statement per quarter - Ocean Freight13Row Ocean Freight volumes (000 tons) (value_1 q_act)13User Value 3856050 Mio | PAC Monaco Salvatore Referenced Value (value_3_PQACT02)1313Document Q3_2017_Investor amp AC presentations13Chapter 37 - IRAC Income statement per quarter - Ocean Freight13Row GPTEU (CHF) (value_1 q_act)13User Value 2820750 Mio | PAC Monaco Salvatore Referenced Value (value_3_PQACT02)1313Document Q3_2017_Investor amp AC presentations13Chapter 37 - IRAC Income statement per quarter - Ocean Freight13Row EBIT reported (value_1 q_act)13User Value -29490 Mio | PAC Monaco Salvatore Referenced Value (value_3_PQACT02)1313Document Q3_2017_Investor amp AC presentations13Chapter 37 - IRAC Income statement per quarter - Ocean Freight13Row in of gross profit (value_1 q_act)13User Value -00271 Mio | Q3 2016 | 51 | 45 | |||||||||||||||||
| Q4 2016 | -51 | -51 | ||||||||||||||||||||||||
| Q1 2017 | -32 | -30 | ||||||||||||||||||||||||
| Q2 2017 | 06 | 06 | ||||||||||||||||||||||||
| Q3 2017 | -29 | -27 |
| 2017 | 2016 | |||||||||||||||||||||||||||||||||||||||||||||
| 2017 | 2016 | 2017 | ||||||||||||||||||||||||||||||||||||||||||||
| YoY Growth | Q3 | Q4 | Q1 | Q2 | Q3 | Gross Profit EBIT | YTD | YTD | ||||||||||||||||||||||||||||||||||||||
| Volume (market estimated) | 0 | 3 | 4 | 3 | 3 | m5 | Gross Profit | 3450 | 3234 | -6 | r5 PAC Monaco Salvatore Referenced Value (value_2_PQACT02)1313Document Q3_2017_Investor amp AC presentations13Chapter 37 - IRAC Income statement per quarter - Ocean Freight13Row Gross profit (value_1 q_act_jan)13User Value 3233667 Mio1313----------------------------------------------------------------------------------------1313Referenced Value (value_2_PQPRIOR02)1313Document Q3_2017_Investor amp AC presentations13Chapter 37 - IRAC Income statement per quarter - Ocean Freight13Row Gross profit (value_1 q_prior_jan)13User Value 3450353 Mio | |||||||||||||||||||||||||||||||||||
| Volume (Panalpina) | -9 | 1 | 7 | 3 | 2 | r6 PAC Monaco Salvatore Referenced Value (value_1_PQACT02)1313Document Q3_2017_Investor amp AC presentations13Chapter 37 - IRAC Income statement per quarter - Ocean Freight13Row change YoY (value_1 q_act)13User Value 00182 Mio | EBIT (adjusted PY) | 160 | -55 | -135 | r6 PAC Monaco Salvatore Referenced Value (value_2_PQACT02)1313Document Q3_2017_Investor amp AC presentations13Chapter 37 - IRAC Income statement per quarter - Ocean Freight13Row EBIT adjusted (value_1 q_act_jan)13User Value -55208 Mio1313----------------------------------------------------------------------------------------1313Referenced Value (value_2_PQPRIOR02)1313Document Q3_2017_Investor amp AC presentations13Chapter 37 - IRAC Income statement per quarter - Ocean Freight13Row EBIT adjusted (value_1 q_prior_jan)13User Value 159801 Mio | |||||||||||||||||||||||||||||||||||
| GPTEU | -2 | -18 | -17 | -7 | -5 | r7 PAC Monaco Salvatore Referenced Value (value_1_PQACT02)1313Document Q3_2017_Investor amp AC presentations13Chapter 37 - IRAC Income statement per quarter - Ocean Freight13Row change YoY (value_1 q_act)13User Value -00471 Mio | EBITGP () | 46 | -17 | r7 PAC Monaco Salvatore Referenced Value (value_2_PQACT02)1313Document Q3_2017_Investor amp AC presentations13Chapter 37 - IRAC Income statement per quarter - Ocean Freight13Row in of gross profit (value_1 q_act_jan)13User Value -00171 Mio1313----------------------------------------------------------------------------------------1313Referenced Value (value_2_PQPRIOR02)1313Document Q3_2017_Investor amp AC presentations13Chapter 37 - IRAC Income statement per quarter - Ocean Freight13Row in of gross profit (value_1 q_prior_jan)13User Value 00463 Mio | ||||||||||||||||||||||||||||||||||||
| Gross Profit | -10 | -16 | -11 | -5 | -3 | r8 PAC Monaco Salvatore Referenced Value (value_1_PQACT02)1313Document Q3_2017_Investor amp AC presentations13Chapter 37 - IRAC Income statement per quarter - Ocean Freight13Row GP change YoY (value_1 q_act)13User Value -00298 Mio | PAC Monaco Salvatore Referenced Value (value_2_PQACT02)1313Document Q3_2017_Investor amp AC presentations13Chapter 37 - IRAC Income statement per quarter - Ocean Freight13Row Gross profit (value_1 q_act_jan)13User Value 3233667 Mio1313----------------------------------------------------------------------------------------1313Referenced Value (value_2_PQPRIOR02)1313Document Q3_2017_Investor amp AC presentations13Chapter 37 - IRAC Income statement per quarter - Ocean Freight13Row Gross profit (value_1 q_prior_jan)13User Value 3450353 Mio | PAC Monaco Salvatore Referenced Value (value_2_PQACT02)1313Document Q3_2017_Investor amp AC presentations13Chapter 37 - IRAC Income statement per quarter - Ocean Freight13Row EBIT adjusted (value_1 q_act_jan)13User Value -55208 Mio1313----------------------------------------------------------------------------------------1313Referenced Value (value_2_PQPRIOR02)1313Document Q3_2017_Investor amp AC presentations13Chapter 37 - IRAC Income statement per quarter - Ocean Freight13Row EBIT adjusted (value_1 q_prior_jan)13User Value 159801 Mio | PAC Monaco Salvatore Referenced Value (value_2_PQACT02)1313Document Q3_2017_Investor amp AC presentations13Chapter 37 - IRAC Income statement per quarter - Ocean Freight13Row in of gross profit (value_1 q_act_jan)13User Value -00171 Mio1313----------------------------------------------------------------------------------------1313Referenced Value (value_2_PQPRIOR02)1313Document Q3_2017_Investor amp AC presentations13Chapter 37 - IRAC Income statement per quarter - Ocean Freight13Row in of gross profit (value_1 q_prior_jan)13User Value 00463 Mio | Volumes (TEUs 000) | 10995 | 11426 | 4 | r8 PAC Monaco Salvatore Referenced Value (value_2_PQACT02)1313Document Q3_2017_Investor amp AC presentations13Chapter 37 - IRAC Income statement per quarter - Ocean Freight13Row Ocean Freight volumes (000 tons) (value_1 q_act_jan)13User Value 11426050 Mio1313----------------------------------------------------------------------------------------1313Referenced Value (value_2_PQPRIOR02)1313Document Q3_2017_Investor amp AC presentations13Chapter 37 - IRAC Income statement per quarter - Ocean Freight13Row Ocean Freight volumes (000 tons) (value_1 q_prior_jan)13User Value 10994918 Mio |
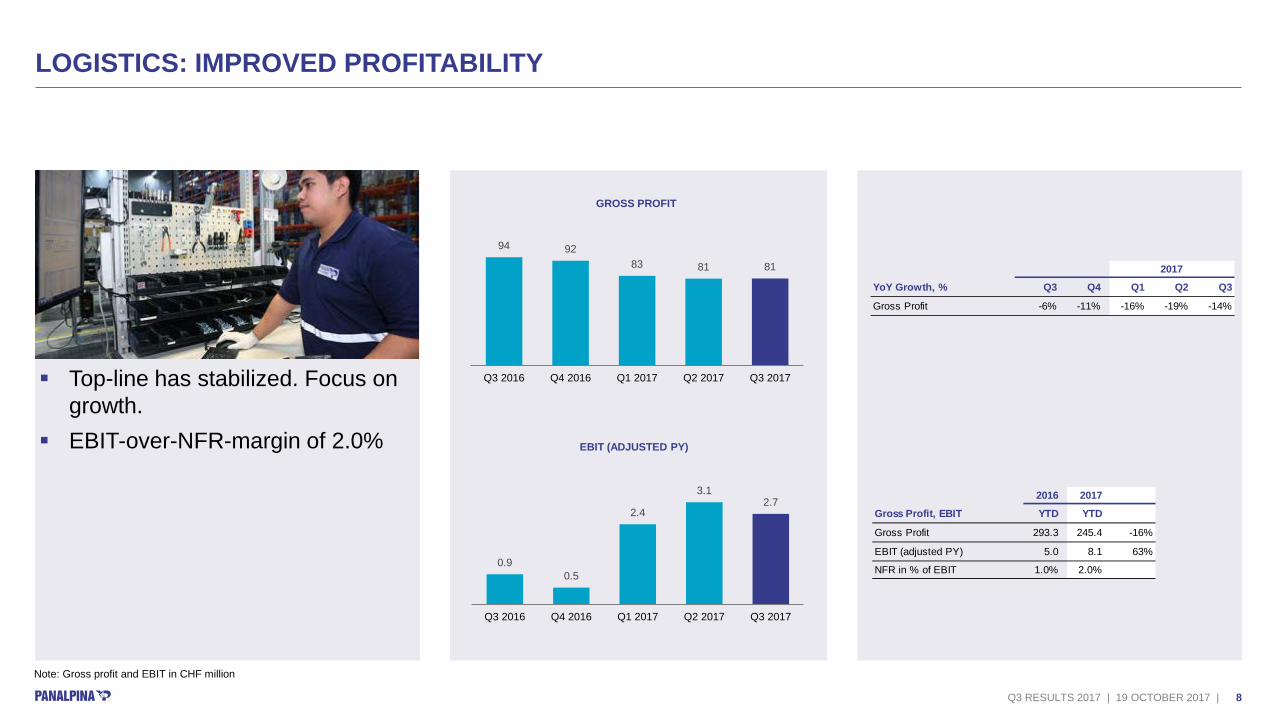
8Q3 RESULTS 2017 | 19 OCTOBER 2017 |
LOGISTICS IMPROVED PROFITABILITY
Top-line has stabilized Focus on growth
EBIT-over-NFR-margin of 20
Note Gross profit and EBIT in CHF million
2016 2017
Gross Profit EBIT YTD YTD
Gross Profit 2933 2454 -16
EBIT (adjusted PY) 50 81 63
NFR in of EBIT 10 20
YoY Growth Q3 Q4 Q1 Q2 Q3
Gross Profit -6 -11 -16 -19 -14
2017
94 9283 81 81
Q3 2016 Q4 2016 Q1 2017 Q2 2017 Q3 2017
GROSS PROFIT
0905
24
3127
Q3 2016 Q4 2016 Q1 2017 Q2 2017 Q3 2017
EBIT (ADJUSTED PY)
SNVeryHiddenParameterSheet
Table
charts
GROSS PROFIT
Q3 2016Q4 2016Q1 2017Q2 2017Q3 201794928381348148
EBIT (ADJUSTED PY)
Q3 2016Q4 2016Q1 2017Q2 2017Q3 2017090524306271
SNVeryHiddenParameterSheet
Table
charts
GROSS PROFIT
Q3 2016Q4 2016Q1 2017Q2 2017Q3 201794928381348148
EBIT (ADJUSTED PY)
Q3 2016Q4 2016Q1 2017Q2 2017Q3 2017090524306271
Chart1
GROSS PROFIT
Q3 2016Q4 2016Q1 2017Q2 2017Q3 201794928381348148
SNVeryHiddenParameterSheet
Table
charts
GROSS PROFIT
Q3 2016Q4 2016Q1 2017Q2 2017Q3 201794928381348148
EBIT (ADJUSTED PY)
Q3 2016Q4 2016Q1 2017Q2 2017Q3 2017090524306271
Chart2
EBIT (ADJUSTED PY)
Q3 2016Q4 2016Q1 2017Q2 2017Q3 2017090524306271
SNVeryHiddenParameterSheet
Table
charts
GROSS PROFIT
Q3 2016Q4 2016Q1 2017Q2 2017Q3 201794928381348148
EBIT (ADJUSTED PY)
Q3 2016Q4 2016Q1 2017Q2 2017Q3 2017090524306271
9Q3 RESULTS 2017 | 19 OCTOBER 2017 |
OUTLOOK AND PRIORITIES 2017
10Q3 RESULTS 2017 | 19 OCTOBER 2017 |
OUTLOOK AND PRIORITIES 2017
OUTLOOK Market
minus Air continuous strong volumes expected but growth rate slowing down (tough Q4 2016 comparison)
minus Ocean Soft market conditions Q4
Panalpina
minus Air margin impact of peak season difficult to anticipate
minus Ocean spot market rates have decreased lately and a slight margin improvement could be expected
PRIORITIES
Focus on topline growth and further improvement of unit profitability
Improve EBIT in Ocean Freight
Accelerate growth through selected bolt-on acquisitions
Maintain cost discipline and push ahead operations transformation program
11Q3 RESULTS 2017 | 19 OCTOBER 2017 |
YEAR-END RESULTS
MARCH 7 2018
NEXT EVENTS
12Q3 RESULTS 2017 | 19 OCTOBER 2017 |
DISCLAIMER
Investing in the shares of Panalpina World Transport (Holding) Ltd involves risks Prospective investors are strongly requested to consult their investment advisors and tax advisors prior to investing in shares of Panalpina World Transport (Holding) Ltd
This document contains forward-looking statements which involve risks and uncertainties These statements may be identified by such words as ldquomayrdquo ldquoplansrdquo ldquoexpectsrdquo ldquobelievesrdquo and similar expressions or by their context These statements are made on the basis of current knowledge and assumptions Various factors could cause actual future results performance or events to differ materially from those described in these statements No obligation is assumed to update any forward-looking statements Potential risks and uncertainties include such factors as general economic conditions foreign exchange fluctuations competitive product and pricing pressures and regulatory developments
The information contained in this document has not been independently verified and no representation or warranty express or implied is made to and no reliance should be placed on the fairness accuracy completeness or correctness of the information or opinions contained herein The information in this presentation is subject to change without notice it may be incomplete or condensed and it may not contain all material information concerning the Panalpina Group None of Panalpina World Transport (Holding) Ltd or their respective affiliates shall have any liability whatsoever for any loss whatsoever arising from any use of this document or its content or otherwise arising in connection with this document
This document does not constitute or form part of an offer to sell or a solicitation of an offer to purchase any shares and neither it nor any part of it shall form the basis of or be relied upon in connection with any contract or commitment whatsoever This information does neither constitute an offer to buy shares of Panalpina World Transport (Holding) Ltd nor a prospectus within the meaning of the applicable Swiss law
13Q3 RESULTS 2017 | 19 OCTOBER 2017 |
APPENDIX
14Q3 RESULTS 2017 | 19 OCTOBER 2017 |
INCOME STATEMENT PER QUARTER ndash GROUP
Note Group figures in CHF million
Group Q1 2016 Q2 2016 Q3 2016 Q3YTD Q4 2016 FY 2016 Q1 2017 Q2 2017 Q3 2017 Q3YTD 2017Net forwarding revenue 13072 12894 12670 38635 13325 51960 12772 13549 14334 40655 Forwarding expenses (9423) (9180) (9116) (27718) (9996) (37714) (9445) (10145) (10818) (30407)Gross profit 3649 3714 3554 10917 3329 14246 3327 3404 3516 10248 Personnel expenses (2250) (2213) (2129) (6592) (2113) (8705) (2164) (2162) (2186) (6511)Other operating expenses (1037) (1011) (971) (3018) (927) (3945) (893) (880) (925) (2698)EBITDA adjusted 362 491 454 1307 289 1596 271 362 406 1039 Depreciation of property plant and equip (62) (62) (62) (187) (71) (258) (53) (54) (50) (156)Amortization of intangible assets (60) (60) (63) (183) (56) (239) (54) (52) (55) (162)EBIT adjusted 240 368 329 936 163 1099 164 256 301 721 in of gross profit 66 99 92 86 49 77 49 75 86 70Non-recurring itemsRestructuring expenses 00 (261) 00 (261) (19) (280) 00 00 00 00
EBIT reported 240 107 329 675 144 820 164 256 301 721 in of gross profit 66 29 92 62 43 58 49 75 86 70Financial result (09) 07 (04) (06) 02 (04) 02 01 (04) (02)Earnings before taxes (EBT) 231 114 325 670 146 816 165 257 297 719 Income tax expenses (58) (69) (79) (205) (88) (293) (42) (81) (112) (235) of EBT 250 602 242 306 601 359 252 316 378 327Profit 173 45 246 465 58 523 124 176 185 484 Earnings per share 075 021 106 201 027 229 054 075 079 208
SNVeryHiddenParameterSheet
PAN_ISpQ_Group
image1png
15Q3 RESULTS 2017 | 19 OCTOBER 2017 |
INCOME STATEMENT PER QUARTER ndash AIR FREIGHT
Note Air Freight figures in CHF million
Air Freight Q1 2016 Q2 2016 Q3 2016 Q3YTD 2016 Q4 2016 FY 2016 Q1 2017 Q2 2017 Q3 2017 Q3 YTD 2017Net forwarding revenue 6332 6359 6341 19032 7234 26267 6571 7000 7389 20960 Forwarding expenses (4846) (4800) (4853) (14499) (5816) (20315) (5125) (5500) (5775) (16400)Gross profit 1486 1559 1489 4534 1418 5952 1447 1500 1614 4560 Personnel expenses (885) (869) (847) (2600) (873) (3473) (905) (916) (928) (2750)Other operating expenses (371) (359) (318) (1048) (284) (1333) (324) (317) (337) (978)EBITDA adjusted 230 331 324 885 261 1146 218 266 349 833 Depreciation and amortization (52) (52) (55) (158) (53) (211) (46) (47) (46) (139)EBIT adjusted 178 279 269 726 208 935 171 220 303 694 in of gross profit 120 179 181 160 147 157 118 146 188 152Non-recurring itemsRestructuring expenses 00 (127) 00 (127) 00 (127) 00 00 00 00
EBIT reported 178 153 269 600 208 808 171 220 303 694 in of gross profit 120 98 181 132 147 136 118 146 188 152
Air Freight volumes (000 tons) 2161 2251 2278 6690 2524 9214 2332 2399 2489 7220 change YoY 54 111 99 88 141 102 79 66 93 79GPton (CHF) 688 693 653 678 562 646 620 625 648 632 change YoY -47 -36 -73 -52 -140 -75 -98 -97 -08 -68
SNVeryHiddenParameterSheet
PAN_ISpQ_AirFreight
image1png
16Q3 RESULTS 2017 | 19 OCTOBER 2017 |
INCOME STATEMENT PER QUARTER ndash OCEAN FREIGHT
Note Ocean Freight figures in CHF million
Ocean Freight Q1 2016 Q2 2016 Q3 2016 Q3YTD 2016 Q4 2016 FY 2016 Q1 2017 Q2 2017 Q3 2017 Q3YTD 2017Net forwarding revenue 5338 4921 4955 15214 4770 19984 4915 5172 5551 15637 Forwarding expenses (4157) (3773) (3834) (11764) (3783) (15547) (3860) (4081) (4463) (12404)Gross profit 1181 1148 1121 3450 987 4438 1055 1091 1088 3234 Personnel expenses (791) (752) (755) (2298) (721) (3019) (779) (784) (788) (2352)Other operating expenses (305) (288) (274) (868) (275) (1144) (271) (265) (290) (827)EBITDA adjusted 84 108 92 284 (09) 275 05 41 09 55 Depreciation and amortization (41) (42) (41) (124) (42) (166) (36) (36) (38) (110)EBIT adjusted 43 66 51 160 (51) 109 (32) 06 (29) (55)in of gross profit 37 58 45 46 -51 25 -30 05 -27 -17Non-recurring itemsRestructuring expenses 00 (97) 0 (97) (19) (115) 00 00 00 00
EBIT reported 43 (30) 51 63 (69) (06) (32) 06 (29) (55)in of gross profit 37 -26 45 18 -70 -01 -30 05 -27 -17
Ocean Freight volumes (000 tons) 3482 3726 3787 10995 3890 14885 3742 3828 3856 11426 change YoY -100 -82 -88 -90 08 -66 75 27 18 39GPTEU (CHF) 339 308 296 314 254 298 282 285 282 283 change YoY 102 59 -16 47 -176 -11 -169 -75 -47 -98
SNVeryHiddenParameterSheet
PAN_ISpQ_OceanFreight
image1png
17Q3 RESULTS 2017 | 19 OCTOBER 2017 |
INCOME STATEMENT PER QUARTER ndash LOGISTICS
Note Logistics figures in CHF million
Logistics Q1 2016 Q2 2016 Q3 2016 Q3YTD 2016 Q4 2016 FY 2016 Q1 2017 Q2 2017 Q3 2017 Q3YTD 2017Net forwarding revenue 1402 1613 1374 4389 1321 5709 1286 1377 1394 4057 Forwarding expenses (420) (607) (429) (1456) (397) (1853) (460) (564) (580) (1604)Gross profit 982 1006 944 2933 924 3857 825 813 815 2454 Personnel expenses (574) (591) (528) (1694) (519) (2213) (479) (461) (469) (1409)Other operating expenses (360) (363) (378) (1102) (367) (1469) (298) (298) (298) (894)EBITDA adjusted 48 52 38 138 37 175 48 54 48 151 Depreciation and amortization (29) (29) (29) (88) (32) (119) (25) (24) (21) (69)EBIT adjusted 18 23 09 50 05 56 24 31 27 81 Non-recurring itemsRestructuring expenses 00 (38) 00 (38) 00 (38) 00 00 00 00
EBIT reported 18 (15) 09 12 05 18 24 31 27 81
SNVeryHiddenParameterSheet
PAN_ISpQ_Logistics
image1png
18Q3 RESULTS 2017 | 19 OCTOBER 2017 |
BALANCE SHEET
CHF Cash and cash equivalents 3888 2946 (942) -24Trade receivables unbilled forwarding services 9087 9893 806 9Other current assets 1025 1167 142 14Property plant and equipment 635 803 168 26Intangible assets 979 917 (62) -6Other non-current assets 990 1133 143 14Total assets 16606 16859 253 2
Short-term borrowings 23 21 (02) -10Trade payables accured cost of services 6524 7075 551 8Other current liabilities 2439 2254 (185) -8Long-Term borrowings 00 20 20 naOther long-term liabilities 1449 1527 78 5Total liabilities 10436 10896 460 4Share capital 24 24 (00) -1Reserves treasury shares 6057 5884 (173) -3Non-controlling interests 89 55 (34) -38Total equity 6170 5963 (207) -3Total equity and liabilities 16606 16859 253 2
31-Dec-16 30-Sept-17Change in
SNVeryHiddenParameterSheet
PAN_BalanceSheet
image1png
19Q3 RESULTS 2017 | 19 OCTOBER 2017 |
CASH FLOW
Note Figures in CHF million
30-Sep-16 30-Sep-17Change in
Cash flow before changes in working capital 1029 1075 Changes in working capital 357 (477)Cash from operations 1386 599
Interest and income taxes paid (292) (331)Net cash from operating activities 1094 267 -76
Net cash from investing activities (342) (409) 20
Free cash flow 752 (141) -119
Net cash used in financing activities (858) (894) 4
Net increase (decrease) in cash and cash equivalents (106) (1035)Cash and cash equivalents at beginning of period 3923 3888 Effect of exchange rate changes (17) 93 Cash and cash equivalents at end of period 3799 2946
SNVeryHiddenParameterSheet
Tabele PAN_Cashflow
Reported cash and cash equivalents at 31122016Profit YTD 092017Other non-cash items (eg DampA)Changes in working capitalInterest and income taxes paidNet cash from investing activitiesFinancing activitiesdividendEffect of exchange rate changesReported cash and cash equivalents at 300920173887843716999999999996448614155374652852799999999999728527999999999997Reported cash and cash equivalents at 31122016Profit YTD 092017Other non-cash items (eg DampA)Changes in working capitalInterest and income taxes paidNet cash from investing activitiesFinancing activitiesdividendEffect of exchange rate changesReported cash and cash equivalents at 30092017388784839591476633114085893793329463
- Nine months results 2017
- Slide Number 2
- ACHIEVEMENTS and key figures
- Third consecutive quarter with GP and EBIT Growth
- Operating and financial review
- Air Freight Strong and profitable growth
- Ocean Freight quarterly loss due to margin Stagnation
- Logistics improved profitability
- Outlook and priorities 2017
- outlook and priorities 2017
- Next EVENTs
- Disclaimer
- Appendix
- Income statement per quarter ndash Group
- Income statement per quarter ndash Air Freight
- Income statement per quarter ndash Ocean Freight
- Income statement per quarter ndash Logistics
- Balance sheet
- Cash flow
-
| 30-Sep-16 | 30-Sep-17 | Change in | ||||||||||||||||||||||||||||||||||||||||||||||||||||||
| Cash flow before changes in working capital | 1029 | 1075 | r2 PAC Hamon Pierrick Referenced Value (value_1_PQACTJAN02)1313Document Q3_2017_Quarter_Report13Chapter Consolidated Statement of Cash Flows13Row ltlt Subtotal cash flow from operations gtgt (ltlt 2017 gtgt q_act_jan)13User Value 10749 Tsd | PY IS MANUAL | ||||||||||||||||||||||||||||||||||||||||||||||||||||
| Changes in working capital | 357 | (477) | r3 PAC Hamon Pierrick Referenced Value (value_1_PQACTJAN02)1313Document Q3_2017_Quarter_Report13Chapter Consolidated Statement of Cash Flows1313-7973 Tsd - ltlt (Increase) decrease receivables other current assets and unbilled forwarding services gtgt (ltlt 2017 gtgt q_act_jan)134406 Tsd - ltlt Increase (decrease) payables and accruals incl accrued cost of service gtgt (ltlt 2017 gtgt q_act_jan)13-472 Tsd - ltlt Increase (decrease) non-current provisions and other liabilities gtgt (ltlt 2017 gtgt q_act_jan)13-749 Tsd - ltlt Increase (decrease) current provisions and other liabilities gtgt (ltlt 2017 gtgt q_act_jan)13---------------------13-4787 Tsd (Total) | |||||||||||||||||||||||||||||||||||||||||||||||||||||
| Cash from operations | 1386 | 599 | r4 PAC Hamon Pierrick Referenced Value (value_1_PQACTJAN02)1313Document Q3_2017_Quarter_Report13Chapter Consolidated Statement of Cash Flows13Row ltlt Cash generated from operations gtgt (ltlt 2017 gtgt q_act_jan)13User Value 5963 Tsd | |||||||||||||||||||||||||||||||||||||||||||||||||||||
| Interest and income taxes paid | (292) | (331) | r6 PAC Hamon Pierrick Referenced Value (value_1_PQACTJAN02)1313Document Q3_2017_Quarter_Report13Chapter Consolidated Statement of Cash Flows1313-136 Tsd - ltlt Interest paid gtgt (ltlt 2017 gtgt q_act_jan)13-3175 Tsd - ltlt Income taxes paid gtgt (ltlt 2017 gtgt q_act_jan)13---------------------13-3311 Tsd (Total) | |||||||||||||||||||||||||||||||||||||||||||||||||||||
| Net cash from operating activities | 1094 | 267 | -76 | r7 PAC Hamon Pierrick Referenced Value (value_1_PQACTJAN02)1313Document Q3_2017_Quarter_Report13Chapter Consolidated Statement of Cash Flows13Row ltlt Net cash from operating activities gtgt (ltlt 2017 gtgt q_act_jan)13User Value 2652 Tsd | ||||||||||||||||||||||||||||||||||||||||||||||||||||
| Net cash from investing activities | (342) | (409) | 20 | r9 PAC Hamon Pierrick Referenced Value (value_1_PQACTJAN02)1313Document Q3_2017_Quarter_Report13Chapter Consolidated Statement of Cash Flows13Row ltlt Net cash used in investing activities gtgt (ltlt 2017 gtgt q_act_jan)13User Value -4063 Tsd | ||||||||||||||||||||||||||||||||||||||||||||||||||||
| Free cash flow | 752 | (141) | -119 | r11 PAC Hamon Pierrick Referenced Value (value_1_PQACTJAN02)1313Document Q3_2017_Quarter_Report13Chapter Consolidated Statement of Cash Flows13Row ltlt Free cash flow gtgt (ltlt 2017 gtgt q_act_jan)13User Value -1411 Tsd | ||||||||||||||||||||||||||||||||||||||||||||||||||||
| Net cash used in financing activities | (858) | (894) | 4 | r13 PAC Hamon Pierrick Referenced Value (value_1_PQACTJAN02)1313Document Q3_2017_Quarter_Report13Chapter Consolidated Statement of Cash Flows13Row ltlt Net cash used in financing activities gtgt (ltlt 2017 gtgt q_act_jan)13User Value -8937 Tsd | ||||||||||||||||||||||||||||||||||||||||||||||||||||
| Net increase (decrease) in cash and cash equivalents | (106) | (1035) | r15 PAC Hamon Pierrick Referenced Value (value_1_PQACTJAN02)1313Document Q3_2017_Quarter_Report13Chapter Consolidated Statement of Cash Flows13Row ltlt Net increase (decrease) in cash and cash equivalents gtgt (ltlt 2017 gtgt q_act_jan)13User Value -10348 Tsd | |||||||||||||||||||||||||||||||||||||||||||||||||||||
| Cash and cash equivalents at beginning of period | 3923 | 3888 | r16 PAC Hamon Pierrick Referenced Value (value_1_PQACTJAN02)1313Document Q3_2017_Quarter_Report13Chapter Consolidated Statement of Cash Flows13Row ltlt Cash and cash equivalents at the beginning of the period gtgt (ltlt 2017 gtgt q_act_jan)13User Value 38878 Tsd | |||||||||||||||||||||||||||||||||||||||||||||||||||||
| Effect of exchange rate changes | (17) | 93 | r17 PAC Hamon Pierrick Referenced Value (value_1_PQACTJAN02)1313Document Q3_2017_Quarter_Report13Chapter Consolidated Statement of Cash Flows13Row ltlt Effect of exchange rate changes on cash and cash equivalents gtgt (ltlt 2017 gtgt q_act_jan)13User Value 933 Tsd | |||||||||||||||||||||||||||||||||||||||||||||||||||||
| Cash and cash equivalents at end of period | 3799 | 2946 | r18 PAC Hamon Pierrick Referenced Value (value_1_PQACTJAN02)1313Document Q3_2017_Quarter_Report13Chapter Consolidated Statement of Cash Flows13Row ltlt Cash and cash equivalents at the end of the period gtgt (ltlt 2017 gtgt q_act_jan)13User Value 29463 Tsd | |||||||||||||||||||||||||||||||||||||||||||||||||||||
| Reported cash and cash equivalents at 31122016 | 3888 | r21 PAC Hamon Pierrick Referenced Value (value_1_PQACTJAN02)1313Document Q3_2017_Quarter_Report13Chapter Consolidated Statement of Cash Flows13Row ltlt Cash and cash equivalents at the beginning of the period gtgt (ltlt 2017 gtgt q_act_jan)13User Value 38878 Tsd | Reported cash and cash equivalents at 31122016 | 3888 | ||||||||||||||||||||||||||||||||||||||||||||||||||||
| Profit YTD 092017 | 4839 | r19 PAC Hamon Pierrick Referenced Value (value_1_PQACTJAN02)1313Document Q3_2017_Quarter_Report13Chapter Consolidated Statement of Cash Flows13Row ltlt Profit gtgt (ltlt 2017 gtgt q_act_jan)13User Value 4839 Tsd | Profit YTD 092017 | 3888 | 484 | |||||||||||||||||||||||||||||||||||||||||||||||||||
| Other non-cash items (eg DampA) | 591 | r23 PAC Hamon Pierrick Referenced Value (value_1_PQACTJAN02)1313Document Q3_2017_Quarter_Report13Chapter Consolidated Statement of Cash Flows13131565 Tsd - ltlt Depreciation of property plant and equipment gtgt (ltlt 2017 gtgt q_act_jan)131616 Tsd - ltlt Amortization of intangible assets gtgt (ltlt 2017 gtgt q_act_jan)13-165 Tsd - ltlt Interest income and dividend on available-for-sale financial assets gtgt (ltlt 2017 gtgt q_act_jan)13-167 Tsd - ltlt Exchange differences gtgt (ltlt 2017 gtgt q_act_jan)13-025 Tsd - ltlt Loss (gain) on sales of property plant and equipment gtgt (ltlt 2017 gtgt q_act_jan)13000 Tsd - ltlt Loss (gain) on sales of financial assets gtgt (ltlt 2017 gtgt q_act_jan)13497 Tsd - ltlt Expenses for share-based compensation plans gtgt (ltlt 2017 gtgt q_act_jan)13238 Tsd - ltlt Other non-cash (income) and expenses gtgt (ltlt 2017 gtgt q_act_jan)132351 Tsd - ltlt Income tax expenses gtgt (ltlt 2017 gtgt q_act_jan)13---------------------135910 Tsd (Total) | Other non-cash items (eg DampA) | 4372 | 591 | |||||||||||||||||||||||||||||||||||||||||||||||||||
| Changes in working capital | -4766 | r24 PAC Hamon Pierrick Referenced Value (value_1_PQACTJAN02)1313Document Q3_2017_Quarter_Report13Chapter Consolidated Statement of Cash Flows1313-7973 Tsd - ltlt (Increase) decrease receivables other current assets and unbilled forwarding services gtgt (ltlt 2017 gtgt q_act_jan)134406 Tsd - ltlt Increase (decrease) payables and accruals incl accrued cost of service gtgt (ltlt 2017 gtgt q_act_jan)13-472 Tsd - ltlt Increase (decrease) non-current provisions and other liabilities gtgt (ltlt 2017 gtgt q_act_jan)13-749 Tsd - ltlt Increase (decrease) current provisions and other liabilities gtgt (ltlt 2017 gtgt q_act_jan)13---------------------13-4787 Tsd (Total) | Changes in working capital | 4486 | 477 | neg | ||||||||||||||||||||||||||||||||||||||||||||||||||
| Interest and income taxes paid | -3311 | r25 PAC Hamon Pierrick Referenced Value (value_1_PQACTJAN02)1313Document Q3_2017_Quarter_Report13Chapter Consolidated Statement of Cash Flows1313-136 Tsd - ltlt Interest paid gtgt (ltlt 2017 gtgt q_act_jan)13-3175 Tsd - ltlt Income taxes paid gtgt (ltlt 2017 gtgt q_act_jan)13---------------------13-3311 Tsd (Total) | Interest and income taxes paid | 4155 | 331 | neg | ||||||||||||||||||||||||||||||||||||||||||||||||||
| Net cash from investing activities | -4085 | r26 PAC Hamon Pierrick Referenced Value (value_1_PQACTJAN02)1313Document Q3_2017_Quarter_Report13Chapter Consolidated Statement of Cash Flows13Row ltlt Net cash used in investing activities gtgt (ltlt 2017 gtgt q_act_jan)13User Value -4063 Tsd | Net cash from investing activities | 3747 | 409 | neg | ||||||||||||||||||||||||||||||||||||||||||||||||||
| Financing activitiesdividend | -8937 | r27 PAC Hamon Pierrick Referenced Value (value_1_PQACTJAN02)1313Document Q3_2017_Quarter_Report13Chapter Consolidated Statement of Cash Flows13Row ltlt Net cash used in financing activities gtgt (ltlt 2017 gtgt q_act_jan)13User Value -8937 Tsd | Financing activitiesdividend | 2853 | 894 | neg | ||||||||||||||||||||||||||||||||||||||||||||||||||
| Effect of exchange rate changes | 933 | r28 PAC Hamon Pierrick Referenced Value (value_1_PQACTJAN02)1313Document Q3_2017_Quarter_Report13Chapter Consolidated Statement of Cash Flows13Row ltlt Effect of exchange rate changes on cash and cash equivalents gtgt (ltlt 2017 gtgt q_act_jan)13User Value 933 Tsd | Effect of exchange rate changes | 2853 | 93 | |||||||||||||||||||||||||||||||||||||||||||||||||||
| Reported cash and cash equivalents at 30092017 | 29463 | r29 PAC Hamon Pierrick Referenced Value (value_1_PQACTJAN02)1313Document Q3_2017_Quarter_Report13Chapter Consolidated Statement of Cash Flows13Row ltlt Cash and cash equivalents at the end of the period gtgt (ltlt 2017 gtgt q_act_jan)13User Value 29463 Tsd | PAC Hamon Pierrick Referenced Value (value_1_PQACTJAN02)1313Document Q3_2017_Quarter_Report13Chapter Consolidated Statement of Cash Flows13Row ltlt Subtotal cash flow from operations gtgt (ltlt 2017 gtgt q_act_jan)13User Value 10749 Tsd | PAC Hamon Pierrick Referenced Value (value_1_PQACTJAN02)1313Document Q3_2017_Quarter_Report13Chapter Consolidated Statement of Cash Flows1313-7973 Tsd - ltlt (Increase) decrease receivables other current assets and unbilled forwarding services gtgt (ltlt 2017 gtgt q_act_jan)134406 Tsd - ltlt Increase (decrease) payables and accruals incl accrued cost of service gtgt (ltlt 2017 gtgt q_act_jan)13-472 Tsd - ltlt Increase (decrease) non-current provisions and other liabilities gtgt (ltlt 2017 gtgt q_act_jan)13-749 Tsd - ltlt Increase (decrease) current provisions and other liabilities gtgt (ltlt 2017 gtgt q_act_jan)13---------------------13-4787 Tsd (Total) | PAC Hamon Pierrick Referenced Value (value_1_PQACTJAN02)1313Document Q3_2017_Quarter_Report13Chapter Consolidated Statement of Cash Flows13Row ltlt Cash generated from operations gtgt (ltlt 2017 gtgt q_act_jan)13User Value 5963 Tsd | PAC Hamon Pierrick Referenced Value (value_1_PQACTJAN02)1313Document Q3_2017_Quarter_Report13Chapter Consolidated Statement of Cash Flows1313-136 Tsd - ltlt Interest paid gtgt (ltlt 2017 gtgt q_act_jan)13-3175 Tsd - ltlt Income taxes paid gtgt (ltlt 2017 gtgt q_act_jan)13---------------------13-3311 Tsd (Total) | PAC Hamon Pierrick Referenced Value (value_1_PQACTJAN02)1313Document Q3_2017_Quarter_Report13Chapter Consolidated Statement of Cash Flows13Row ltlt Net cash from operating activities gtgt (ltlt 2017 gtgt q_act_jan)13User Value 2652 Tsd | PAC Hamon Pierrick Referenced Value (value_1_PQACTJAN02)1313Document Q3_2017_Quarter_Report13Chapter Consolidated Statement of Cash Flows13Row ltlt Net cash used in investing activities gtgt (ltlt 2017 gtgt q_act_jan)13User Value -4063 Tsd | PAC Hamon Pierrick Referenced Value (value_1_PQACTJAN02)1313Document Q3_2017_Quarter_Report13Chapter Consolidated Statement of Cash Flows13Row ltlt Free cash flow gtgt (ltlt 2017 gtgt q_act_jan)13User Value -1411 Tsd | PAC Hamon Pierrick Referenced Value (value_1_PQACTJAN02)1313Document Q3_2017_Quarter_Report13Chapter Consolidated Statement of Cash Flows13Row ltlt Net cash used in financing activities gtgt (ltlt 2017 gtgt q_act_jan)13User Value -8937 Tsd | PAC Hamon Pierrick Referenced Value (value_1_PQACTJAN02)1313Document Q3_2017_Quarter_Report13Chapter Consolidated Statement of Cash Flows13Row ltlt Net increase (decrease) in cash and cash equivalents gtgt (ltlt 2017 gtgt q_act_jan)13User Value -10348 Tsd | PAC Hamon Pierrick Referenced Value (value_1_PQACTJAN02)1313Document Q3_2017_Quarter_Report13Chapter Consolidated Statement of Cash Flows13Row ltlt Cash and cash equivalents at the beginning of the period gtgt (ltlt 2017 gtgt q_act_jan)13User Value 38878 Tsd | PAC Hamon Pierrick Referenced Value (value_1_PQACTJAN02)1313Document Q3_2017_Quarter_Report13Chapter Consolidated Statement of Cash Flows13Row ltlt Effect of exchange rate changes on cash and cash equivalents gtgt (ltlt 2017 gtgt q_act_jan)13User Value 933 Tsd | PAC Hamon Pierrick Referenced Value (value_1_PQACTJAN02)1313Document Q3_2017_Quarter_Report13Chapter Consolidated Statement of Cash Flows13Row ltlt Cash and cash equivalents at the end of the period gtgt (ltlt 2017 gtgt q_act_jan)13User Value 29463 Tsd | PAC Hamon Pierrick Referenced Value (value_1_PQACTJAN02)1313Document Q3_2017_Quarter_Report13Chapter Consolidated Statement of Cash Flows13Row ltlt Cash and cash equivalents at the beginning of the period gtgt (ltlt 2017 gtgt q_act_jan)13User Value 38878 Tsd | PAC Hamon Pierrick Referenced Value (value_1_PQACTJAN02)1313Document Q3_2017_Quarter_Report13Chapter Consolidated Statement of Cash Flows13Row ltlt Profit gtgt (ltlt 2017 gtgt q_act_jan)13User Value 4839 Tsd | PAC Hamon Pierrick Referenced Value (value_1_PQACTJAN02)1313Document Q3_2017_Quarter_Report13Chapter Consolidated Statement of Cash Flows13131565 Tsd - ltlt Depreciation of property plant and equipment gtgt (ltlt 2017 gtgt q_act_jan)131616 Tsd - ltlt Amortization of intangible assets gtgt (ltlt 2017 gtgt q_act_jan)13-165 Tsd - ltlt Interest income and dividend on available-for-sale financial assets gtgt (ltlt 2017 gtgt q_act_jan)13-167 Tsd - ltlt Exchange differences gtgt (ltlt 2017 gtgt q_act_jan)13-025 Tsd - ltlt Loss (gain) on sales of property plant and equipment gtgt (ltlt 2017 gtgt q_act_jan)13000 Tsd - ltlt Loss (gain) on sales of financial assets gtgt (ltlt 2017 gtgt q_act_jan)13497 Tsd - ltlt Expenses for share-based compensation plans gtgt (ltlt 2017 gtgt q_act_jan)13238 Tsd - ltlt Other non-cash (income) and expenses gtgt (ltlt 2017 gtgt q_act_jan)132351 Tsd - ltlt Income tax expenses gtgt (ltlt 2017 gtgt q_act_jan)13---------------------135910 Tsd (Total) | PAC Hamon Pierrick Referenced Value (value_1_PQACTJAN02)1313Document Q3_2017_Quarter_Report13Chapter Consolidated Statement of Cash Flows1313-7973 Tsd - ltlt (Increase) decrease receivables other current assets and unbilled forwarding services gtgt (ltlt 2017 gtgt q_act_jan)134406 Tsd - ltlt Increase (decrease) payables and accruals incl accrued cost of service gtgt (ltlt 2017 gtgt q_act_jan)13-472 Tsd - ltlt Increase (decrease) non-current provisions and other liabilities gtgt (ltlt 2017 gtgt q_act_jan)13-749 Tsd - ltlt Increase (decrease) current provisions and other liabilities gtgt (ltlt 2017 gtgt q_act_jan)13---------------------13-4787 Tsd (Total) | PAC Hamon Pierrick Referenced Value (value_1_PQACTJAN02)1313Document Q3_2017_Quarter_Report13Chapter Consolidated Statement of Cash Flows1313-136 Tsd - ltlt Interest paid gtgt (ltlt 2017 gtgt q_act_jan)13-3175 Tsd - ltlt Income taxes paid gtgt (ltlt 2017 gtgt q_act_jan)13---------------------13-3311 Tsd (Total) | Reported cash and cash equivalents at 30092017 | 2946 | 3888 | ||||||||||||||||||||||||||||||||||
| 484 | ||||||||||||||||||||||||||||||||||||||||||||||||||||||||
| 591 | ||||||||||||||||||||||||||||||||||||||||||||||||||||||||
| (479) | ||||||||||||||||||||||||||||||||||||||||||||||||||||||||
| (331) | ||||||||||||||||||||||||||||||||||||||||||||||||||||||||
| (406) | ||||||||||||||||||||||||||||||||||||||||||||||||||||||||
| (894) | ||||||||||||||||||||||||||||||||||||||||||||||||||||||||
| 93 | ||||||||||||||||||||||||||||||||||||||||||||||||||||||||
| 2946 |
| 31-Dec-16 | 30-Sept-17 | Change in | ||||||||||||||||||||||||||||||||||||||||||||||||||||||||
| CHF | ||||||||||||||||||||||||||||||||||||||||||||||||||||||||||
| Cash and cash equivalents | 3888 | 2946 | (942) | -24 | r3 PAC Hamon Pierrick Referenced Value (value_1_PQACTJAN02)1313Document Q3_2017_Quarter_Report13Chapter Consolidated Statement of Financial Position13Row ltlt Cash and cash equivalents gtgt (ltlt September 30 2017 gtgt q_act_jan)13User Value 29463 Tsd | 3888 | 3999 | 111 | 3 | |||||||||||||||||||||||||||||||||||||||||||||||||
| Trade receivables unbilled forwarding services | 9087 | 9893 | 806 | 9 | r4 PAC Hamon Pierrick Referenced Value (value_1_PQACTJAN02)1313Document Q3_2017_Quarter_Report13Chapter Consolidated Statement of Financial Position13Row ltlt Trade receivables unbilled forwarding services gtgt (ltlt September 30 2017 gtgt q_act_jan)13User Value 98929 Tsd | 9087 | 8693 | -394 | -4 | |||||||||||||||||||||||||||||||||||||||||||||||||
| Other current assets | 1025 | 1167 | 142 | 14 | r5 PAC Hamon Pierrick Referenced Value (value_1_PQACTJAN02)1313Document Q3_2017_Quarter_Report13Chapter Consolidated Statement of Financial Position13Row ltlt Other current assets gtgt (ltlt September 30 2017 gtgt q_act_jan)13User Value 11671 Tsd | 1025 | 1335 | 31 | 30 | |||||||||||||||||||||||||||||||||||||||||||||||||
| Property plant and equipment | 635 | 803 | 168 | 26 | r6 PAC Hamon Pierrick Referenced Value (value_1_PQACTJAN02)1313Document Q3_2017_Quarter_Report13Chapter Consolidated Statement of Financial Position13Row ltlt Property plant and equipment gtgt (ltlt September 30 2017 gtgt q_act_jan)13User Value 8028 Tsd | 635 | 651 | 16 | 3 | |||||||||||||||||||||||||||||||||||||||||||||||||
| Intangible assets | 979 | 917 | (62) | -6 | r7 PAC Hamon Pierrick Referenced Value (value_1_PQACTJAN02)1313Document Q3_2017_Quarter_Report13Chapter Consolidated Statement of Financial Position13Row ltlt Intangible assets gtgt (ltlt September 30 2017 gtgt q_act_jan)13User Value 9168 Tsd | 979 | 926 | -53 | -5 | |||||||||||||||||||||||||||||||||||||||||||||||||
| Other non-current assets | 990 | 1133 | 143 | 14 | r8 PAC Hamon Pierrick Referenced Value (value_1_PQACTJAN02)1313Document Q3_2017_Quarter_Report13Chapter Consolidated Statement of Financial Position13Row ltlt Other non-current assets gtgt (ltlt September 30 2017 gtgt q_act_jan)13User Value 11586 Tsd | 99 | 1073 | 83 | 8 | |||||||||||||||||||||||||||||||||||||||||||||||||
| Total assets | 16606 | 16859 | 253 | 2 | r9 PAC Hamon Pierrick Referenced Value (value_1_PQACTJAN02)1313Document Q3_2017_Quarter_Report13Chapter Consolidated Statement of Financial Position13Row ltlt Total assets gtgt (ltlt September 30 2017 gtgt q_act_jan)13User Value 168844 Tsd | 166060 | 166780 | 72 | 0 | |||||||||||||||||||||||||||||||||||||||||||||||||
| 0 | ||||||||||||||||||||||||||||||||||||||||||||||||||||||||||
| Short-term borrowings | 23 | 21 | (02) | -10 | r11 PAC Hamon Pierrick Referenced Value (value_1_PQACTJAN02)1313Document Q3_2017_Quarter_Report13Chapter Consolidated Statement of Financial Position13Row ltlt Short-term borrowings gtgt (ltlt September 30 2017 gtgt q_act_jan)13User Value 208 Tsd | 23 | 05 | -18 | -78 | |||||||||||||||||||||||||||||||||||||||||||||||||
| Trade payables accured cost of services | 6524 | 7075 | 551 | 8 | r12 PAC Hamon Pierrick Referenced Value (value_1_PQACTJAN02)1313Document Q3_2017_Quarter_Report13Chapter Consolidated Statement of Financial Position13Row ltlt Trade payables accured cost of services gtgt (ltlt September 30 2017 gtgt q_act_jan)13User Value 70745 Tsd | 6524 | 620 | -324 | -5 | |||||||||||||||||||||||||||||||||||||||||||||||||
| Other current liabilities | 2439 | 2254 | (185) | -8 | r13 PAC Hamon Pierrick Referenced Value (value_1_PQACTJAN02)1313Document Q3_2017_Quarter_Report13Chapter Consolidated Statement of Financial Position13Row ltlt Other current liabilities gtgt (ltlt September 30 2017 gtgt q_act_jan)13User Value 22538 Tsd | 2439 | 2592 | 153 | 6 | |||||||||||||||||||||||||||||||||||||||||||||||||
| Long-Term borrowings | 00 | 20 | 20 | na | r20 PAC Hamon Pierrick Referenced Value (value_1_PQACTJAN02)1313Document Q3_2017_Quarter_Report13Chapter Consolidated Statement of Financial Position13Row ltlt Long-term borrowings gtgt (ltlt September 30 2017 gtgt q_act_jan)13User Value 197 Tsd | 0 | 12 | 12 | na | |||||||||||||||||||||||||||||||||||||||||||||||||
| Other long-term liabilities | 1449 | 1527 | 78 | 5 | r21 PAC Hamon Pierrick Referenced Value (value_1_PQACTJAN02)1313Document Q3_2017_Quarter_Report13Chapter Consolidated Statement of Financial Position13Row ltlt Other long-term liabilities gtgt (ltlt September 30 2017 gtgt q_act_jan)13User Value 15270 Tsd | 1449 | 1479 | 3 | 2 | |||||||||||||||||||||||||||||||||||||||||||||||||
| Total liabilities | 10436 | 10896 | 460 | 4 | r14 PAC Hamon Pierrick Referenced Value (value_1_PQACTJAN02)1313Document Q3_2017_Quarter_Report13Chapter Consolidated Statement of Financial Position13Row ltlt Total liabilities gtgt (ltlt September 30 2017 gtgt q_act_jan)13User Value 108956 Tsd | 104360 | 102880 | -148 | -1 | |||||||||||||||||||||||||||||||||||||||||||||||||
| Share capital | 24 | 24 | (00) | -1 | r15 PAC Hamon Pierrick Referenced Value (value_1_PQACTJAN02)1313Document Q3_2017_Quarter_Report13Chapter Consolidated Statement of Financial Position13Row ltlt Share capital gtgt (ltlt September 30 2017 gtgt q_act_jan)13User Value 238 Tsd | 24 | 24 | 0 | 0 | |||||||||||||||||||||||||||||||||||||||||||||||||
| Reserves treasury shares | 6057 | 5884 | (173) | -3 | r16 PAC Hamon Pierrick Referenced Value (value_1_PQACTJAN02)1313Document Q3_2017_Quarter_Report13Chapter Consolidated Statement of Financial Position13Row ltlt Reserves treasury shares gtgt (ltlt September 30 2017 gtgt q_act_jan)13User Value 59100 Tsd | 6057 | 6285 | 228 | 4 | |||||||||||||||||||||||||||||||||||||||||||||||||
| Non-controlling interests | 89 | 55 | (34) | -38 | r17 PAC Hamon Pierrick Referenced Value (value_1_PQACTJAN02)1313Document Q3_2017_Quarter_Report13Chapter Consolidated Statement of Financial Position13Row ltlt Non-controlling interests gtgt (ltlt September 30 2017 gtgt q_act_jan)13User Value 550 Tsd | 89 | 81 | -08 | -9 | |||||||||||||||||||||||||||||||||||||||||||||||||
| Total equity | 6170 | 5963 | (207) | -3 | r18 PAC Hamon Pierrick Referenced Value (value_1_PQACTJAN02)1313Document Q3_2017_Quarter_Report13Chapter Consolidated Statement of Financial Position13Row ltlt Total equity gtgt (ltlt September 30 2017 gtgt q_act_jan)13User Value 59887 Tsd | 617 | 639 | 22 | 4 | |||||||||||||||||||||||||||||||||||||||||||||||||
| Total equity and liabilities | 16606 | 16859 | 253 | 2 | r19 PAC Hamon Pierrick Referenced Value (value_1_PQACTJAN02)1313Document Q3_2017_Quarter_Report13Chapter Consolidated Statement of Financial Position13Row ltlt Total equity and liabilities gtgt (ltlt September 30 2017 gtgt q_act_jan)13User Value 168844 Tsd | 166060 | 166780 | 72 | 0 | |||||||||||||||||||||||||||||||||||||||||||||||||
| KPIs | 31-Dec-16 | 30-Jun-17 | ||||||||||||||||||||||||||||||||||||||||||||||||||||||||
| Equity Ratio | 372 | 354 | s20 PAC Hamon Pierrick Referenced Value (value_1_PQACTJAN02)1313Document Q2_2017_Quarter_Report13Chapter Consolidated Statement of Financial Position13Row ltlt Total equity and liabilities gtgt (ltlt June 30 2017 gtgt q_act_jan)13User Value 153472 Tsd | |||||||||||||||||||||||||||||||||||||||||||||||||||||||
PAC Hamon Pierrick Referenced Value (value_1_PQACTJAN02)1313Document Q3_2017_Quarter_Report13Chapter Consolidated Statement of Financial Position13Row ltlt Cash and cash equivalents gtgt (ltlt September 30 2017 gtgt q_act_jan)13User Value 29463 Tsd | PAC Hamon Pierrick Referenced Value (value_1_PQACTJAN02)1313Document Q3_2017_Quarter_Report13Chapter Consolidated Statement of Financial Position13Row ltlt Trade receivables unbilled forwarding services gtgt (ltlt September 30 2017 gtgt q_act_jan)13User Value 98929 Tsd | PAC Hamon Pierrick Referenced Value (value_1_PQACTJAN02)1313Document Q3_2017_Quarter_Report13Chapter Consolidated Statement of Financial Position13Row ltlt Other current assets gtgt (ltlt September 30 2017 gtgt q_act_jan)13User Value 11671 Tsd | PAC Hamon Pierrick Referenced Value (value_1_PQACTJAN02)1313Document Q3_2017_Quarter_Report13Chapter Consolidated Statement of Financial Position13Row ltlt Property plant and equipment gtgt (ltlt September 30 2017 gtgt q_act_jan)13User Value 8028 Tsd | PAC Hamon Pierrick Referenced Value (value_1_PQACTJAN02)1313Document Q3_2017_Quarter_Report13Chapter Consolidated Statement of Financial Position13Row ltlt Intangible assets gtgt (ltlt September 30 2017 gtgt q_act_jan)13User Value 9168 Tsd | PAC Hamon Pierrick Referenced Value (value_1_PQACTJAN02)1313Document Q3_2017_Quarter_Report13Chapter Consolidated Statement of Financial Position13Row ltlt Other non-current assets gtgt (ltlt September 30 2017 gtgt q_act_jan)13User Value 11586 Tsd | PAC Hamon Pierrick Referenced Value (value_1_PQACTJAN02)1313Document Q3_2017_Quarter_Report13Chapter Consolidated Statement of Financial Position13Row ltlt Total assets gtgt (ltlt September 30 2017 gtgt q_act_jan)13User Value 168844 Tsd | PAC Hamon Pierrick Referenced Value (value_1_PQACTJAN02)1313Document Q3_2017_Quarter_Report13Chapter Consolidated Statement of Financial Position13Row ltlt Short-term borrowings gtgt (ltlt September 30 2017 gtgt q_act_jan)13User Value 208 Tsd | PAC Hamon Pierrick Referenced Value (value_1_PQACTJAN02)1313Document Q3_2017_Quarter_Report13Chapter Consolidated Statement of Financial Position13Row ltlt Trade payables accured cost of services gtgt (ltlt September 30 2017 gtgt q_act_jan)13User Value 70745 Tsd | PAC Hamon Pierrick Referenced Value (value_1_PQACTJAN02)1313Document Q3_2017_Quarter_Report13Chapter Consolidated Statement of Financial Position13Row ltlt Other current liabilities gtgt (ltlt September 30 2017 gtgt q_act_jan)13User Value 22538 Tsd | PAC Hamon Pierrick Referenced Value (value_1_PQACTJAN02)1313Document Q3_2017_Quarter_Report13Chapter Consolidated Statement of Financial Position13Row ltlt Long-term borrowings gtgt (ltlt September 30 2017 gtgt q_act_jan)13User Value 197 Tsd | PAC Hamon Pierrick Referenced Value (value_1_PQACTJAN02)1313Document Q3_2017_Quarter_Report13Chapter Consolidated Statement of Financial Position13Row ltlt Other long-term liabilities gtgt (ltlt September 30 2017 gtgt q_act_jan)13User Value 15270 Tsd | PAC Hamon Pierrick Referenced Value (value_1_PQACTJAN02)1313Document Q3_2017_Quarter_Report13Chapter Consolidated Statement of Financial Position13Row ltlt Total liabilities gtgt (ltlt September 30 2017 gtgt q_act_jan)13User Value 108956 Tsd | PAC Hamon Pierrick Referenced Value (value_1_PQACTJAN02)1313Document Q3_2017_Quarter_Report13Chapter Consolidated Statement of Financial Position13Row ltlt Share capital gtgt (ltlt September 30 2017 gtgt q_act_jan)13User Value 238 Tsd | PAC Hamon Pierrick Referenced Value (value_1_PQACTJAN02)1313Document Q3_2017_Quarter_Report13Chapter Consolidated Statement of Financial Position13Row ltlt Reserves treasury shares gtgt (ltlt September 30 2017 gtgt q_act_jan)13User Value 59100 Tsd | PAC Hamon Pierrick Referenced Value (value_1_PQACTJAN02)1313Document Q3_2017_Quarter_Report13Chapter Consolidated Statement of Financial Position13Row ltlt Non-controlling interests gtgt (ltlt September 30 2017 gtgt q_act_jan)13User Value 550 Tsd | PAC Hamon Pierrick Referenced Value (value_1_PQACTJAN02)1313Document Q3_2017_Quarter_Report13Chapter Consolidated Statement of Financial Position13Row ltlt Total equity gtgt (ltlt September 30 2017 gtgt q_act_jan)13User Value 59887 Tsd | PAC Hamon Pierrick Referenced Value (value_1_PQACTJAN02)1313Document Q3_2017_Quarter_Report13Chapter Consolidated Statement of Financial Position13Row ltlt Total equity and liabilities gtgt (ltlt September 30 2017 gtgt q_act_jan)13User Value 168844 Tsd | NWC-Intensity | 18 | 13 | mf24 | |||||||||||||||||||||||||||||||||||||
| DSO 3-m-rolling YTD | 455 | 467 | m22 | |||||||||||||||||||||||||||||||||||||||||||||||||||||||
| DPO 3-m-rolling YTD | 407 | 397 | m23 |
| 2017 | 2016 | |||||||||||||||||||||||||||||||||||||||||||||||||||||||||||||||||||
| Logistics | Q1 2016 | Q2 2016 | HY 2016 | Q3 2016 | Q3YTD 2016 | Q4 2016 | FY 2016 | Q1 2017 | Q2 2017 | HY 2017 | Q3 2017 | Q3YTD 2017 | ||||||||||||||||||||||||||||||||||||||||||||||||||||||||
| Net forwarding revenue | 1402 | 1613 | 3015 | 1374 | 4389 | 1321 | 5709 | 1286 | 1377 | 2663 | 1394 | 4057 | m4 | m4 | r4 PAC Hamon Pierrick Referenced Value (value_1_PQACT02)1313Document Q3_2017_Quarter_Report13Chapter Products quater and year to date13Row ltlt Net forwarding revenue gtgt (ltlt value_3 gtgt q_act)13User Value 13945 Tsd | r4 PAC Hamon Pierrick Referenced Value (value_1_PQACTJAN02)1313Document Q3_2017_Quarter_Report13Chapter Products quater and year to date13Row ltlt Net forwarding revenue gtgt (ltlt value_3 gtgt q_act_jan)13User Value 40573 Tsd | -00 | 00 | (01) | |||||||||||||||||||||||||||||||||||||||||||||||||
| Forwarding expenses | (420) | (607) | (1027) | (429) | (1456) | (397) | (1853) | (460) | (564) | (1024) | (580) | (1604) | m5 | m5 | r5 PAC Hamon Pierrick Referenced Value (value_1_PQACT02)1313Document Q3_2017_Quarter_Report13Chapter Products quater and year to date13Row ltlt Forwarding services from third parties gtgt (ltlt value_3 gtgt q_act)13User Value -5796 Tsd | r5 PAC Hamon Pierrick Referenced Value (value_1_PQACTJAN02)1313Document Q3_2017_Quarter_Report13Chapter Products quater and year to date13Row ltlt Forwarding services from third parties gtgt (ltlt value_3 gtgt q_act_jan)13User Value -16035 Tsd | -00 | 00 | 00 | |||||||||||||||||||||||||||||||||||||||||||||||||
| Gross profit | 982 | 1006 | 1989 | 944 | 2933 | 924 | 3857 | 825 | 813 | 1639 | 815 | 2454 | m6 | m6 | r6 PAC Hamon Pierrick Referenced Value (value_1_PQACT02)1313Document Q3_2017_Quarter_Report13Chapter Products quater and year to date13Row ltlt Gross profit gtgt (ltlt value_3 gtgt q_act)13User Value 8148 Tsd | r6 PAC Hamon Pierrick Referenced Value (value_1_PQACTJAN02)1313Document Q3_2017_Quarter_Report13Chapter Products quater and year to date13Row ltlt Gross profit gtgt (ltlt value_3 gtgt q_act_jan)13User Value 24537 Tsd | 00 | 01 | 01 | |||||||||||||||||||||||||||||||||||||||||||||||||
| Personnel expenses | (574) | (591) | (1166) | (528) | (1694) | (519) | (2213) | (479) | (461) | (940) | (469) | (1409) | m7 | m7 | r7 PAC Hamon Pierrick Referenced Value (value_1_PQACT02)1313Document Q3_2017_Quarter_Report13Chapter Products quater and year to date13Row ltlt Personnel expenses gtgt (ltlt value_3 gtgt q_act)13User Value -4692 Tsd | r7 PAC Hamon Pierrick Referenced Value (value_1_PQACTJAN02)1313Document Q3_2017_Quarter_Report13Chapter Products quater and year to date13Row ltlt Personnel expenses gtgt (ltlt value_3 gtgt q_act_jan)13User Value -14091 Tsd | -00 | (01) | (01) | |||||||||||||||||||||||||||||||||||||||||||||||||
| Other operating expenses | (360) | (363) | (723) | (378) | (1102) | (367) | (1469) | (298) | (298) | (596) | (298) | (894) | m8 | m8 | r8 PAC Hamon Pierrick Referenced Value (value_1_PQACT02)1313Document Q3_2017_Quarter_Report13Chapter Products quater and year to date13Row ltlt Other operating expenses gtgt (ltlt value_3 gtgt q_act)13User Value -2977 Tsd | r8 PAC Hamon Pierrick Referenced Value (value_1_PQACTJAN02)1313Document Q3_2017_Quarter_Report13Chapter Products quater and year to date13Row ltlt Other operating expenses gtgt (ltlt value_3 gtgt q_act_jan)13User Value -8940 Tsd | 00 | 00 | (01) | |||||||||||||||||||||||||||||||||||||||||||||||||
| EBITDA adjusted | 48 | 52 | 100 | 38 | 138 | 37 | 175 | 48 | 54 | 103 | 48 | 151 | m9 | m9 | r9 PAC Hamon Pierrick Referenced Value (value_1_PQACT02)1313Document Q3_2017_Quarter_Report13Chapter Products quater and year to date13Row ltlt EBITDA gtgt (ltlt value_3 gtgt q_act)13User Value 479 Tsd | r9 PAC Hamon Pierrick Referenced Value (value_1_PQACTJAN02)1313Document Q3_2017_Quarter_Report13Chapter Products quater and year to date13Row ltlt EBITDA gtgt (ltlt value_3 gtgt q_act_jan)13User Value 1506 Tsd | 00 | 00 | 00 | |||||||||||||||||||||||||||||||||||||||||||||||||
| Depreciation and amortization | (29) | (29) | (58) | (29) | (88) | (32) | (119) | (25) | (24) | (48) | (21) | (69) | m10 | m10 | r10 PAC Hamon Pierrick Referenced Value (value_1_PQACT02)1313Document Q3_2017_Quarter_Report13Chapter Products quater and year to date13Row ltlt Depreciation and amortization gtgt (ltlt value_3 gtgt q_act)13User Value -208 Tsd | r10 PAC Hamon Pierrick Referenced Value (value_1_PQACTJAN02)1313Document Q3_2017_Quarter_Report13Chapter Products quater and year to date13Row ltlt Depreciation and amortization gtgt (ltlt value_3 gtgt q_act_jan)13User Value -692 Tsd | 00 | 00 | 00 | |||||||||||||||||||||||||||||||||||||||||||||||||
| EBIT adjusted | 18 | 23 | 41 | 09 | 50 | 05 | 56 | 24 | 31 | 54 | 27 | 81 | m11 | m11 | r11 PAC Hamon Pierrick Referenced Value (value_1_PQACT02)1313Document Q3_2017_Quarter_Report13Chapter Products quater and year to date13Row ltlt Operating result (EBIT) gtgt (ltlt value_3 gtgt q_act)13User Value 271 Tsd | r11 PAC Hamon Pierrick Referenced Value (value_1_PQACTJAN02)1313Document Q3_2017_Quarter_Report13Chapter Products quater and year to date13Row ltlt Operating result (EBIT) gtgt (ltlt value_3 gtgt q_act_jan)13User Value 815 Tsd | -00 | 00 | 01 | |||||||||||||||||||||||||||||||||||||||||||||||||
| Non-recurring items | ||||||||||||||||||||||||||||||||||||||||||||||||||||||||||||||||||||
| Restructuring expenses | 00 | (38) | (38) | 00 | (38) | 00 | (38) | 00 | 00 | 00 | 00 | 00 | m13 | m13 | m13 | m13 | 00 | 00 | 00 | |||||||||||||||||||||||||||||||||||||||||||||||||
| EBIT reported | 18 | (15) | 03 | 09 | 12 | 05 | 18 | 24 | 31 | 54 | 27 | 81 | m15 | m15 | r15 PAC Hamon Pierrick Referenced Value (value_1_PQACT02)1313Document Q3_2017_Quarter_Report13Chapter Products quater and year to date13Row ltlt Operating result (EBIT) gtgt (ltlt value_3 gtgt q_act)13User Value 271 Tsd | r15 PAC Hamon Pierrick Referenced Value (value_1_PQACTJAN02)1313Document Q3_2017_Quarter_Report13Chapter Products quater and year to date13Row ltlt Operating result (EBIT) gtgt (ltlt value_3 gtgt q_act_jan)13User Value 815 Tsd | ||||||||||||||||||||||||||||||||||||||||||||||||||||
PAC Hamon Pierrick Referenced Value (value_1_PQACT02)1313Document Q3_2017_Quarter_Report13Chapter Products quater and year to date13Row ltlt Net forwarding revenue gtgt (ltlt value_3 gtgt q_act)13User Value 13945 Tsd | PAC Hamon Pierrick Referenced Value (value_1_PQACTJAN02)1313Document Q3_2017_Quarter_Report13Chapter Products quater and year to date13Row ltlt Net forwarding revenue gtgt (ltlt value_3 gtgt q_act_jan)13User Value 40573 Tsd | PAC Hamon Pierrick Referenced Value (value_1_PQACT02)1313Document Q3_2017_Quarter_Report13Chapter Products quater and year to date13Row ltlt Forwarding services from third parties gtgt (ltlt value_3 gtgt q_act)13User Value -5796 Tsd | GP Change YoY | -19 | -18 | -14 | -16 | s16 | s16 | |||||||||||||||||||||||||||||||||||||||||||||||||||||||||||
| 2017 | 2016 | ||||||||||||||||||||||||||||||||||||||||||||||||||||||||||
| Ocean Freight | Q1 2016 | Q2 2016 | HY 2016 | Q3 2016 | Q3YTD 2016 | Q4 2016 | FY 2016 | Q1 2017 | Q2 2017 | HY 2017 | Q3 2017 | Q3YTD 2017 | |||||||||||||||||||||||||||||||||||||||||||||||
| Net forwarding revenue | 5338 | 4921 | 10259 | 4955 | 15214 | 4770 | 19984 | 4915 | 5172 | 10087 | 5551 | 15637 | m4 | m4 | r4 PAC Hamon Pierrick Referenced Value (value_1_PQACT02)1313Document Q3_2017_Quarter_Report13Chapter Products quater and year to date13Row ltlt Net forwarding revenue gtgt (ltlt value_2 gtgt q_act)13User Value 55506 Tsd | r4 PAC Hamon Pierrick Referenced Value (value_1_PQACTJAN02)1313Document Q3_2017_Quarter_Report13Chapter Products quater and year to date13Row ltlt Net forwarding revenue gtgt (ltlt value_2 gtgt q_act_jan)13User Value 156375 Tsd | 00 | 00 | 00 | ||||||||||||||||||||||||||||||||||||||||
| Forwarding expenses | (4157) | (3773) | (7930) | (3834) | (11764) | (3783) | (15547) | (3860) | (4081) | (7941) | (4463) | (12404) | m5 | m5 | r5 PAC Hamon Pierrick Referenced Value (value_1_PQACT02)1313Document Q3_2017_Quarter_Report13Chapter Products quater and year to date13Row ltlt Forwarding services from third parties gtgt (ltlt value_2 gtgt q_act)13User Value -44629 Tsd | r5 PAC Hamon Pierrick Referenced Value (value_1_PQACTJAN02)1313Document Q3_2017_Quarter_Report13Chapter Products quater and year to date13Row ltlt Forwarding services from third parties gtgt (ltlt value_2 gtgt q_act_jan)13User Value -124038 Tsd | -00 | 00 | 00 | ||||||||||||||||||||||||||||||||||||||||
| Gross profit | 1181 | 1148 | 2329 | 1121 | 3450 | 987 | 4438 | 1055 | 1091 | 2146 | 1088 | 3234 | m6 | m6 | r6 PAC Hamon Pierrick Referenced Value (value_1_PQACT02)1313Document Q3_2017_Quarter_Report13Chapter Products quater and year to date13Row ltlt Gross profit gtgt (ltlt value_2 gtgt q_act)13User Value 10877 Tsd | r6 PAC Hamon Pierrick Referenced Value (value_1_PQACTJAN02)1313Document Q3_2017_Quarter_Report13Chapter Products quater and year to date13Row ltlt Gross profit gtgt (ltlt value_2 gtgt q_act_jan)13User Value 32337 Tsd | 00 | 00 | 01 | ||||||||||||||||||||||||||||||||||||||||
| Personnel expenses | (791) | (752) | (1543) | (755) | (2298) | (721) | (3019) | (779) | (784) | (1564) | (788) | (2352) | m7 | m7 | r7 PAC Hamon Pierrick Referenced Value (value_1_PQACT02)1313Document Q3_2017_Quarter_Report13Chapter Products quater and year to date13Row ltlt Personnel expenses gtgt (ltlt value_2 gtgt q_act)13User Value -7884 Tsd | r7 PAC Hamon Pierrick Referenced Value (value_1_PQACTJAN02)1313Document Q3_2017_Quarter_Report13Chapter Products quater and year to date13Row ltlt Personnel expenses gtgt (ltlt value_2 gtgt q_act_jan)13User Value -23522 Tsd | -00 | 00 | 00 | ||||||||||||||||||||||||||||||||||||||||
| Other operating expenses | (305) | (288) | (594) | (274) | (868) | (275) | (1144) | (271) | (265) | (536) | (290) | (827) | m8 | m8 | r8 PAC Hamon Pierrick Referenced Value (value_1_PQACT02)1313Document Q3_2017_Quarter_Report13Chapter Products quater and year to date13Row ltlt Other operating expenses gtgt (ltlt value_2 gtgt q_act)13User Value -2905 Tsd | r8 PAC Hamon Pierrick Referenced Value (value_1_PQACTJAN02)1313Document Q3_2017_Quarter_Report13Chapter Products quater and year to date13Row ltlt Other operating expenses gtgt (ltlt value_2 gtgt q_act_jan)13User Value -8265 Tsd | -00 | (01) | (02) | ||||||||||||||||||||||||||||||||||||||||
| EBITDA adjusted | 84 | 108 | 192 | 92 | 284 | (09) | 275 | 05 | 41 | 46 | 09 | 55 | m9 | m9 | r9 PAC Hamon Pierrick Referenced Value (value_1_PQACT02)1313Document Q3_2017_Quarter_Report13Chapter Products quater and year to date13Row ltlt EBITDA gtgt (ltlt value_2 gtgt q_act)13User Value 089 Tsd | r9 PAC Hamon Pierrick Referenced Value (value_1_PQACTJAN02)1313Document Q3_2017_Quarter_Report13Chapter Products quater and year to date13Row ltlt EBITDA gtgt (ltlt value_2 gtgt q_act_jan)13User Value 550 Tsd | -00 | 00 | 00 | ||||||||||||||||||||||||||||||||||||||||
| Depreciation and amortization | (41) | (42) | (83) | (41) | (124) | (42) | (166) | (36) | (36) | (72) | (38) | (110) | m10 | m10 | r10 PAC Hamon Pierrick Referenced Value (value_1_PQACT02)1313Document Q3_2017_Quarter_Report13Chapter Products quater and year to date13Row ltlt Depreciation and amortization gtgt (ltlt value_2 gtgt q_act)13User Value -384 Tsd | r10 PAC Hamon Pierrick Referenced Value (value_1_PQACTJAN02)1313Document Q3_2017_Quarter_Report13Chapter Products quater and year to date13Row ltlt Depreciation and amortization gtgt (ltlt value_2 gtgt q_act_jan)13User Value -1102 Tsd | -00 | 00 | 00 | ||||||||||||||||||||||||||||||||||||||||
| EBIT adjusted | 43 | 66 | 109 | 51 | 160 | (51) | 109 | (32) | 06 | (26) | (29) | (55) | m11 | m11 | r11 PAC Hamon Pierrick Referenced Value (value_1_PQACT02)1313Document Q3_2017_Quarter_Report13Chapter Products quater and year to date13Row ltlt Operating result (EBIT) gtgt (ltlt value_2 gtgt q_act)13User Value -295 Tsd | r11 PAC Hamon Pierrick Referenced Value (value_1_PQACTJAN02)1313Document Q3_2017_Quarter_Report13Chapter Products quater and year to date13Row ltlt Operating result (EBIT) gtgt (ltlt value_2 gtgt q_act_jan)13User Value -552 Tsd | 00 | 00 | 00 | ||||||||||||||||||||||||||||||||||||||||
| in of gross profit | 37 | 58 | 47 | 45 | 46 | -51 | 25 | -30 | 05 | -12 | -27 | -17 | m12 | m12 | s12 | s12 | |||||||||||||||||||||||||||||||||||||||||||
| Non-recurring items | 00 | 00 | 00 | ||||||||||||||||||||||||||||||||||||||||||||||||||||||||
| Restructuring expenses | 00 | (97) | (97) | 0 | (97) | (19) | (115) | 00 | 00 | 00 | 00 | 00 | m14 | m14 | m14 | m14 | 00 | 00 | 01 | ||||||||||||||||||||||||||||||||||||||||
| EBIT reported | 43 | (30) | 13 | 51 | 63 | (69) | (06) | (32) | 06 | (26) | (29) | (55) | m16 | m16 | r16 PAC Hamon Pierrick Referenced Value (value_1_PQACT02)1313Document Q3_2017_Quarter_Report13Chapter Products quater and year to date13Row ltlt Operating result (EBIT) gtgt (ltlt value_2 gtgt q_act)13User Value -295 Tsd | r16 PAC Hamon Pierrick Referenced Value (value_1_PQACTJAN02)1313Document Q3_2017_Quarter_Report13Chapter Products quater and year to date13Row ltlt Operating result (EBIT) gtgt (ltlt value_2 gtgt q_act_jan)13User Value -552 Tsd | PAC Hamon Pierrick Referenced Value (value_1_PQACT02)1313Document Q3_2017_Quarter_Report13Chapter Products quater and year to date13Row ltlt Net forwarding revenue gtgt (ltlt value_2 gtgt q_act)13User Value 55506 Tsd | PAC Hamon Pierrick Referenced Value (value_1_PQACTJAN02)1313Document Q3_2017_Quarter_Report13Chapter Products quater and year to date13Row ltlt Net forwarding revenue gtgt (ltlt value_2 gtgt q_act_jan)13User Value 156375 Tsd | PAC Hamon Pierrick Referenced Value (value_1_PQACT02)1313Document Q3_2017_Quarter_Report13Chapter Products quater and year to date13Row ltlt Forwarding services from third parties gtgt (ltlt value_2 gtgt q_act)13User Value -44629 Tsd | 00 | 00 | (01) | |||||||||||||||||||||||||||||||||||||
| in of gross profit | 37 | -26 | 05 | 45 | 18 | -70 | -01 | -30 | 05 | -12 | -27 | -17 | m17 | m17 | s17 | s17 | |||||||||||||||||||||||||||||||||||||||||||
| Ocean Freight volumes (000 tons) | 3482 | 3726 | 7208 | 3787 | 10995 | 3890 | 14885 | 3742 | 3828 | 7570 | 3856 | 11426 | m19 | m19 | m19 | m19 | 00 | 00 | 00 | ||||||||||||||||||||||||||||||||||||||||
| change YoY | -100 | -82 | -91 | -88 | -90 | 08 | -66 | 75 | 27 | 50 | 18 | 39 | m20 | m20 | s20 | s20 | |||||||||||||||||||||||||||||||||||||||||||
| GPTEU (CHF) | 339 | 308 | 323 | 296 | 314 | 254 | 298 | 282 | 285 | 283 | 282 | 283 | m21 | m21 | s21 | s21 | |||||||||||||||||||||||||||||||||||||||||||
| change YoY | 102 | 59 | 80 | -16 | 47 | -176 | -11 | -169 | -75 | -122 | -47 | -98 | m22 | m22 | s22 | s22 | |||||||||||||||||||||||||||||||||||||||||||
| GP change YoY | -5 | -8 | -3 | -6 | s23 | s23 | |||||||||||||||||||||||||||||||||||||||||||||||||||||
| 2017 | 2016 | ||||||||||||||||||||||||||||||||||||||||||||||||||||||||||
| Air Freight | Q1 2016 | Q2 2016 | HY 2016 | Q3 2016 | Q3YTD 2016 | Q4 2016 | FY 2016 | Q1 2017 | Q2 2017 | HY 2017 | Q3 2017 | Q3 YTD 2017 | |||||||||||||||||||||||||||||||||||||||||||||||
| Net forwarding revenue | 6332 | 6359 | 12691 | 6341 | 19032 | 7234 | 26267 | 6571 | 7000 | 13571 | 7389 | 20960 | m4 | m4 | r4 PAC Hamon Pierrick Referenced Value (value_1_PQACT02)1313Document Q3_2017_Quarter_Report13Chapter Products quater and year to date13Row ltlt Net forwarding revenue gtgt (ltlt value_1 gtgt q_act)13User Value 73890 Tsd | r4 PAC Hamon Pierrick Referenced Value (value_1_PQACTJAN02)1313Document Q3_2017_Quarter_Report13Chapter Products quater and year to date13Row ltlt Net forwarding revenue gtgt (ltlt value_1 gtgt q_act_jan)13User Value 209603 Tsd | 00 | 00 | 006009999999958 | ||||||||||||||||||||||||||||||||||||||||
| Forwarding expenses | (4846) | (4800) | (9646) | (4853) | (14499) | (5816) | (20315) | (5125) | (5500) | (10625) | (5775) | (16400) | m5 | m5 | r5 PAC Hamon Pierrick Referenced Value (value_1_PQACT02)1313Document Q3_2017_Quarter_Report13Chapter Products quater and year to date13Row ltlt Forwarding services from third parties gtgt (ltlt value_1 gtgt q_act)13User Value -57751 Tsd | r5 PAC Hamon Pierrick Referenced Value (value_1_PQACTJAN02)1313Document Q3_2017_Quarter_Report13Chapter Products quater and year to date13Row ltlt Forwarding services from third parties gtgt (ltlt value_1 gtgt q_act_jan)13User Value -164000 Tsd | 00 | 00 | 00 | ||||||||||||||||||||||||||||||||||||||||
| Gross profit | 1486 | 1559 | 3045 | 1489 | 4534 | 1418 | 5952 | 1447 | 1500 | 2946 | 1614 | 4560 | m6 | m6 | r6 PAC Hamon Pierrick Referenced Value (value_1_PQACT02)1313Document Q3_2017_Quarter_Report13Chapter Products quater and year to date13Row ltlt Gross profit gtgt (ltlt value_1 gtgt q_act)13User Value 16139 Tsd | r6 PAC Hamon Pierrick Referenced Value (value_1_PQACTJAN02)1313Document Q3_2017_Quarter_Report13Chapter Products quater and year to date13Row ltlt Gross profit gtgt (ltlt value_1 gtgt q_act_jan)13User Value 45602 Tsd | -00 | 00 | 00 | ||||||||||||||||||||||||||||||||||||||||
| Personnel expenses | (885) | (869) | (1754) | (847) | (2600) | (873) | (3473) | (905) | (916) | (1822) | (928) | (2750) | m7 | m7 | r7 PAC Hamon Pierrick Referenced Value (value_1_PQACT02)1313Document Q3_2017_Quarter_Report13Chapter Products quater and year to date13Row ltlt Personnel expenses gtgt (ltlt value_1 gtgt q_act)13User Value -9280 Tsd | r7 PAC Hamon Pierrick Referenced Value (value_1_PQACTJAN02)1313Document Q3_2017_Quarter_Report13Chapter Products quater and year to date13Row ltlt Personnel expenses gtgt (ltlt value_1 gtgt q_act_jan)13User Value -27496 Tsd | -00 | 00 | 01 | ||||||||||||||||||||||||||||||||||||||||
| Other operating expenses | (371) | (359) | (730) | (318) | (1048) | (284) | (1333) | (324) | (317) | (641) | (337) | (978) | m8 | m8 | r8 PAC Hamon Pierrick Referenced Value (value_1_PQACT02)1313Document Q3_2017_Quarter_Report13Chapter Products quater and year to date13Row ltlt Other operating expenses gtgt (ltlt value_1 gtgt q_act)13User Value -3367 Tsd | r8 PAC Hamon Pierrick Referenced Value (value_1_PQACTJAN02)1313Document Q3_2017_Quarter_Report13Chapter Products quater and year to date13Row ltlt Other operating expenses gtgt (ltlt value_1 gtgt q_act_jan)13User Value -9776 Tsd | 00 | 00 | (01) | ||||||||||||||||||||||||||||||||||||||||
| EBITDA adjusted | 230 | 331 | 561 | 324 | 885 | 261 | 1146 | 218 | 266 | 484 | 349 | 833 | m9 | m9 | r9 PAC Hamon Pierrick Referenced Value (value_1_PQACT02)1313Document Q3_2017_Quarter_Report13Chapter Products quater and year to date13Row ltlt EBITDA gtgt (ltlt value_1 gtgt q_act)13User Value 3492 Tsd | r9 PAC Hamon Pierrick Referenced Value (value_1_PQACTJAN02)1313Document Q3_2017_Quarter_Report13Chapter Products quater and year to date13Row ltlt EBITDA gtgt (ltlt value_1 gtgt q_act_jan)13User Value 8330 Tsd | -00 | 00 | 00 | ||||||||||||||||||||||||||||||||||||||||
| Depreciation and amortization | (52) | (52) | (103) | (55) | (158) | (53) | (211) | (46) | (47) | (93) | (46) | (139) | m10 | m10 | r10 PAC Hamon Pierrick Referenced Value (value_1_PQACT02)1313Document Q3_2017_Quarter_Report13Chapter Products quater and year to date13Row ltlt Depreciation and amortization gtgt (ltlt value_1 gtgt q_act)13User Value -458 Tsd | r10 PAC Hamon Pierrick Referenced Value (value_1_PQACTJAN02)1313Document Q3_2017_Quarter_Report13Chapter Products quater and year to date13Row ltlt Depreciation and amortization gtgt (ltlt value_1 gtgt q_act_jan)13User Value -1387 Tsd | -00 | 01 | 01 | ||||||||||||||||||||||||||||||||||||||||
| EBIT adjusted | 178 | 279 | 457 | 269 | 726 | 208 | 935 | 171 | 220 | 391 | 303 | 694 | m11 | m11 | r11 PAC Hamon Pierrick Referenced Value (value_1_PQACT02)1313Document Q3_2017_Quarter_Report13Chapter Products quater and year to date13Row ltlt Operating result (EBIT) gtgt (ltlt value_1 gtgt q_act)13User Value 3033 Tsd | r11 PAC Hamon Pierrick Referenced Value (value_1_PQACTJAN02)1313Document Q3_2017_Quarter_Report13Chapter Products quater and year to date13Row ltlt Operating result (EBIT) gtgt (ltlt value_1 gtgt q_act_jan)13User Value 6943 Tsd | 00 | 00 | 01 | ||||||||||||||||||||||||||||||||||||||||
| in of gross profit | 120 | 179 | 150 | 181 | 160 | 147 | 157 | 118 | 146 | 133 | 188 | 152 | m12 | m12 | s12 | s12 | |||||||||||||||||||||||||||||||||||||||||||
| Non-recurring items | 00 | 00 | 00 | ||||||||||||||||||||||||||||||||||||||||||||||||||||||||
| Restructuring expenses | 00 | (127) | (127) | 00 | (127) | 00 | (127) | 00 | 00 | 00 | 00 | 00 | m14 | m14 | m14 | m14 | 00 | 00 | 00 | ||||||||||||||||||||||||||||||||||||||||
| EBIT reported | 178 | 153 | 331 | 269 | 600 | 208 | 808 | 171 | 220 | 391 | 303 | 694 | m16 | m16 | r16 PAC Hamon Pierrick Referenced Value (value_1_PQACT02)1313Document Q3_2017_Quarter_Report13Chapter Products quater and year to date13Row ltlt Operating result (EBIT) gtgt (ltlt value_1 gtgt q_act)13User Value 3033 Tsd | r16 PAC Hamon Pierrick Referenced Value (value_1_PQACTJAN02)1313Document Q3_2017_Quarter_Report13Chapter Products quater and year to date13Row ltlt Operating result (EBIT) gtgt (ltlt value_1 gtgt q_act_jan)13User Value 6943 Tsd | PAC Hamon Pierrick Referenced Value (value_1_PQACT02)1313Document Q3_2017_Quarter_Report13Chapter Products quater and year to date13Row ltlt Net forwarding revenue gtgt (ltlt value_1 gtgt q_act)13User Value 73890 Tsd | PAC Hamon Pierrick Referenced Value (value_1_PQACTJAN02)1313Document Q3_2017_Quarter_Report13Chapter Products quater and year to date13Row ltlt Net forwarding revenue gtgt (ltlt value_1 gtgt q_act_jan)13User Value 209603 Tsd | PAC Hamon Pierrick Referenced Value (value_1_PQACT02)1313Document Q3_2017_Quarter_Report13Chapter Products quater and year to date13Row ltlt Forwarding services from third parties gtgt (ltlt value_1 gtgt q_act)13User Value -57751 Tsd | 00 | 00 | 00 | |||||||||||||||||||||||||||||||||||||
| in of gross profit | 120 | 98 | 109 | 181 | 132 | 147 | 136 | 118 | 146 | 133 | 188 | 152 | m17 | m17 | s17 | s17 | |||||||||||||||||||||||||||||||||||||||||||
| Air Freight volumes (000 tons) | 2161 | 2251 | 4412 | 2278 | 6690 | 2524 | 9214 | 2332 | 2399 | 4731 | 2489 | 7220 | m19 | m19 | m19 | m19 | 00 | 00 | 00 | ||||||||||||||||||||||||||||||||||||||||
| change YoY | 54 | 111 | 82 | 99 | 88 | 141 | 102 | 79 | 66 | 72 | 93 | 79 | m20 | m20 | s20 | s20 | |||||||||||||||||||||||||||||||||||||||||||
| GPton (CHF) | 688 | 693 | 690 | 653 | 678 | 562 | 646 | 620 | 625 | 623 | 648 | 632 | m21 | m21 | s21 | s21 | |||||||||||||||||||||||||||||||||||||||||||
| change YoY | -47 | -36 | -41 | -73 | -52 | -140 | -75 | -98 | -97 | -98 | -08 | -68 | m22 | m22 | s22 | s22 | |||||||||||||||||||||||||||||||||||||||||||
| GP change YoY | -4 | -3 | 8 | 1 | s23 | s23 |
| 2017 | 2016 | |||||||||||||||||||||||||||||||||||||||||||||||
| Group | Q1 2016 | Q2 2016 | HY 2016 | Q3 2016 | Q3YTD 2016 | Q4 2016 | FY 2016 | Q1 2017 | Q2 2017 | HY 2017 | Q3 2017 | Q3YTD 2017 | ||||||||||||||||||||||||||||||||||||
| Net forwarding revenue | 13072 | 12894 | 25965 | 12670 | 38635 | 13325 | 51960 | 12772 | 13549 | 26321 | 14334 | 40655 | r4 PAC Hamon Pierrick Referenced Value (value_1_PQACT02)1313Document Q3_2017_Quarter_Report13Chapter Consolidated Income Statement13Row ltlt Net forwarding revenue gtgt (ltlt 2017 gtgt q_act)13User Value 1433411124 Tsd | r4 PAC Hamon Pierrick Referenced Value (value_1_PQACTJAN02)1313Document Q3_2017_Quarter_Report13Chapter Consolidated Income Statement13Row ltlt Net forwarding revenue gtgt (ltlt 2017 gtgt q_act_jan)13User Value 4065500417 Tsd | -00 | -01 | -01 | |||||||||||||||||||||||||||||||
| Forwarding expenses | (9423) | (9180) | (18602) | (9116) | (27718) | (9996) | (37714) | (9445) | (10145) | (19590) | (10818) | (30407) | r5 PAC Hamon Pierrick Referenced Value (value_1_PQACT02)1313Document Q3_2017_Quarter_Report13Chapter Consolidated Income Statement13Row ltlt Forwarding services from third parties gtgt (ltlt 2017 gtgt q_act)13User Value -1081765298 Tsd | r5 PAC Hamon Pierrick Referenced Value (value_1_PQACTJAN02)1313Document Q3_2017_Quarter_Report13Chapter Consolidated Income Statement13Row ltlt Forwarding services from third parties gtgt (ltlt 2017 gtgt q_act_jan)13User Value -3040736424 Tsd | 00 | 01 | 01 | |||||||||||||||||||||||||||||||
| Gross profit | 3649 | 3714 | 7363 | 3554 | 10917 | 3329 | 14246 | 3327 | 3404 | 6731 | 3516 | 10248 | r6 PAC Hamon Pierrick Referenced Value (value_1_PQACT02)1313Document Q3_2017_Quarter_Report13Chapter Consolidated Income Statement13Row ltlt Gross profit gtgt (ltlt 2017 gtgt q_act)13User Value 351645826 Tsd | r6 PAC Hamon Pierrick Referenced Value (value_1_PQACTJAN02)1313Document Q3_2017_Quarter_Report13Chapter Consolidated Income Statement13Row ltlt Gross profit gtgt (ltlt 2017 gtgt q_act_jan)13User Value 1024763993 Tsd | 00 | 00 | 00 | |||||||||||||||||||||||||||||||
| Personnel expenses | (2250) | (2213) | (4463) | (2129) | (6592) | (2113) | (8705) | (2164) | (2162) | (4326) | (2186) | (6511) | r7 PAC Hamon Pierrick Referenced Value (value_1_PQACT02)1313Document Q3_2017_Quarter_Report13Chapter Consolidated Income Statement13Row ltlt Personnel expenses gtgt (ltlt 2017 gtgt q_act)13User Value -218561825 Tsd | r7 PAC Hamon Pierrick Referenced Value (value_1_PQACTJAN02)1313Document Q3_2017_Quarter_Report13Chapter Consolidated Income Statement13Row ltlt Personnel expenses gtgt (ltlt 2017 gtgt q_act_jan)13User Value -651090060 Tsd | 00 | 00 | 00 | |||||||||||||||||||||||||||||||
| Other operating expenses | (1037) | (1011) | (2047) | (971) | (3018) | (927) | (3945) | (893) | (880) | (1773) | (925) | (2698) | r8 PAC Hamon Pierrick Referenced Value (value_1_PQACT02)1313Document Q3_2017_Quarter_Report13Chapter Consolidated Income Statement13Row ltlt Other operating expenses gtgt (ltlt 2017 gtgt q_act)13User Value -92494218 Tsd | r8 PAC Hamon Pierrick Referenced Value (value_1_PQACTJAN02)1313Document Q3_2017_Quarter_Report13Chapter Consolidated Income Statement13Row ltlt Other operating expenses gtgt (ltlt 2017 gtgt q_act_jan)13User Value -269813050 Tsd | 00 | 01 | 01 | |||||||||||||||||||||||||||||||
| EBITDA adjusted | 362 | 491 | 853 | 454 | 1307 | 289 | 1596 | 271 | 362 | 633 | 406 | 1039 | r9 PAC Hamon Pierrick Referenced Value (value_1_PQACT02)1313Document Q3_2017_Quarter_Report13Chapter Consolidated Income Statement13Row ltlt EBITDA gtgt (ltlt 2017 gtgt q_act)13User Value 40589783 Tsd | r9 PAC Hamon Pierrick Referenced Value (value_1_PQACTJAN02)1313Document Q3_2017_Quarter_Report13Chapter Consolidated Income Statement13Row ltlt EBITDA gtgt (ltlt 2017 gtgt q_act_jan)13User Value 103860882 Tsd | -00 | 00 | 00 | |||||||||||||||||||||||||||||||
| Depreciation of property plant and equip | (62) | (62) | (125) | (62) | (187) | (71) | (258) | (53) | (54) | (107) | (50) | (156) | r10 PAC Hamon Pierrick Referenced Value (value_1_PQACT02)1313Document Q3_2017_Quarter_Report13Chapter Consolidated Income Statement13Row ltlt Depreciation of property plant and equipment gtgt (ltlt 2017 gtgt q_act)13User Value -4981553 Tsd | r10 PAC Hamon Pierrick Referenced Value (value_1_PQACTJAN02)1313Document Q3_2017_Quarter_Report13Chapter Consolidated Income Statement13Row ltlt Depreciation of property plant and equipment gtgt (ltlt 2017 gtgt q_act_jan)13User Value -15648388 Tsd | 00 | -01 | -01 | |||||||||||||||||||||||||||||||
| Amortization of intangible assets | (60) | (60) | (120) | (63) | (183) | (56) | (239) | (54) | (52) | (106) | (55) | (162) | r11 PAC Hamon Pierrick Referenced Value (value_1_PQACT02)1313Document Q3_2017_Quarter_Report13Chapter Consolidated Income Statement13Row ltlt Amortization of intangible assets gtgt (ltlt 2017 gtgt q_act)13User Value -5514918 Tsd | r11 PAC Hamon Pierrick Referenced Value (value_1_PQACTJAN02)1313Document Q3_2017_Quarter_Report13Chapter Consolidated Income Statement13Row ltlt Amortization of intangible assets gtgt (ltlt 2017 gtgt q_act_jan)13User Value -16157763 Tsd | -00 | 00 | 00 | |||||||||||||||||||||||||||||||
| EBIT adjusted | 240 | 368 | 608 | 329 | 936 | 163 | 1099 | 164 | 256 | 420 | 301 | 721 | r12 PAC Hamon Pierrick Referenced Value (value_1_PQACT02)1313Document Q3_2017_Quarter_Report13Chapter Consolidated Income Statement13Row ltlt Operating result (EBIT) gtgt (ltlt 2017 gtgt q_act)13User Value 30093312 Tsd | r12 PAC Hamon Pierrick Referenced Value (value_1_PQACTJAN02)1313Document Q3_2017_Quarter_Report13Chapter Consolidated Income Statement13Row ltlt Operating result (EBIT) gtgt (ltlt 2017 gtgt q_act_jan)13User Value 72054731 Tsd | -00 | 00 | -01 | |||||||||||||||||||||||||||||||
| in of gross profit | 66 | 99 | 83 | 92 | 86 | 49 | 77 | 49 | 75 | 62 | 86 | 70 | s13 | s13 | ||||||||||||||||||||||||||||||||||
| Non-recurring items | 00 | 00 | 00 | |||||||||||||||||||||||||||||||||||||||||||||
| Restructuring expenses | 00 | (261) | (261) | 00 | (261) | (19) | (280) | 00 | 00 | 00 | 00 | 00 | r15 PAC Hamon Pierrick Referenced Value (value_1_PQACT02)1313Document Q3_2017_Quarter_Report13Chapter Consolidated Income Statement13Row ltlt Restructuring expenses gtgt (ltlt 2017 gtgt q_act)13User Value 0000000 Tsd | r15 PAC Hamon Pierrick Referenced Value (value_1_PQACTJAN02)1313Document Q3_2017_Quarter_Report13Chapter Consolidated Income Statement13Row ltlt Restructuring expenses gtgt (ltlt 2017 gtgt q_act_jan)13User Value 0000000 Tsd | 00 | 00 | 00 | |||||||||||||||||||||||||||||||
| EBIT reported | 240 | 107 | 347 | 329 | 675 | 144 | 820 | 164 | 256 | 420 | 301 | 721 | s17 | s17 | -00 | 00 | 00 | |||||||||||||||||||||||||||||||
| in of gross profit | 66 | 29 | 47 | 92 | 62 | 43 | 58 | 49 | 75 | 62 | 86 | 70 | s18 | s18 | -01 | -00 | -02 | |||||||||||||||||||||||||||||||
| Financial result | (09) | 07 | (02) | (04) | (06) | 02 | (04) | 02 | 01 | 03 | (04) | (02) | r19 PAC Hamon Pierrick Referenced Value (value_1_PQACT02)1313Document Q3_2017_Quarter_Report13Chapter Consolidated Income Statement13130939883 Tsd - ltlt Finance income gtgt (ltlt 2017 gtgt q_act)13-1343957 Tsd - ltlt Finance costs gtgt (ltlt 2017 gtgt q_act)13---------------------13-0404074 Tsd (Total) | r19 PAC Hamon Pierrick Referenced Value (value_1_PQACTJAN02)1313Document Q3_2017_Quarter_Report13Chapter Consolidated Income Statement13133163726 Tsd - ltlt Finance income gtgt (ltlt 2017 gtgt q_act_jan)13-3315684 Tsd - ltlt Finance costs gtgt (ltlt 2017 gtgt q_act_jan)13---------------------13-0151958 Tsd (Total) | -00 | 00 | 00 | |||||||||||||||||||||||||||||||
| Earnings before taxes (EBT) | 231 | 114 | 345 | 325 | 670 | 146 | 816 | 165 | 257 | 422 | 297 | 719 | r20 PAC Hamon Pierrick Referenced Value (value_1_PQACT02)1313Document Q3_2017_Quarter_Report13Chapter Consolidated Income Statement13Row ltlt Profit before income tax (EBT) gtgt (ltlt 2017 gtgt q_act)13User Value 29689237 Tsd | r20 PAC Hamon Pierrick Referenced Value (value_1_PQACTJAN02)1313Document Q3_2017_Quarter_Report13Chapter Consolidated Income Statement13Row ltlt Profit before income tax (EBT) gtgt (ltlt 2017 gtgt q_act_jan)13User Value 71902773 Tsd | 00 | 00 | 00 | |||||||||||||||||||||||||||||||
| Income tax expenses | (58) | (69) | (126) | (79) | (205) | (88) | (293) | (42) | (81) | (123) | (112) | (235) | r21 PAC Hamon Pierrick Referenced Value (value_1_PQACT02)1313Document Q3_2017_Quarter_Report13Chapter Consolidated Income Statement13Row ltlt Income tax expenses gtgt (ltlt 2017 gtgt q_act)13User Value -8638414 Tsd | r21 PAC Hamon Pierrick Referenced Value (value_1_PQACTJAN02)1313Document Q3_2017_Quarter_Report13Chapter Consolidated Income Statement13Row ltlt Income tax expenses gtgt (ltlt 2017 gtgt q_act_jan)13User Value -20922552 Tsd | 00 | 01 | 01 | |||||||||||||||||||||||||||||||
| of EBT | 250 | 602 | 367 | 242 | 306 | 601 | 359 | 252 | 316 | 291 | 378 | 327 | s22 | s22 | ||||||||||||||||||||||||||||||||||
| Profit | 173 | 45 | 218 | 246 | 465 | 58 | 523 | 124 | 176 | 299 | 185 | 484 | r23 PAC Hamon Pierrick Referenced Value (value_1_PQACT02)1313Document Q3_2017_Quarter_Report13Chapter Consolidated Income Statement13Row ltlt Profit gtgt (ltlt 2017 gtgt q_act)13User Value 21050824 Tsd | r23 PAC Hamon Pierrick Referenced Value (value_1_PQACTJAN02)1313Document Q3_2017_Quarter_Report13Chapter Consolidated Income Statement13Row ltlt Profit gtgt (ltlt 2017 gtgt q_act_jan)13User Value 50980221 Tsd | -00 | 00 | 01 | |||||||||||||||||||||||||||||||
| Earnings per share | 075 | 021 | 096 | 106 | 201 | 027 | 229 | 054 | 075 | 129 | 079 | 208 | s24 PAC Serova Elena (External) Referenced Value (value_1_PQACTJAN02)1313Document Q2_2017_Quarter_Report13Chapter Consolidated Income Statement13Row ltlt Basic gtgt (ltlt 2017 gtgt q_act_jan)13User Value 0000540 Tsd | s24 PAC Serova Elena (External) Referenced Value (value_1_PQACTJAN02)1313Document Q2_2017_Quarter_Report13Chapter Consolidated Income Statement13Row ltlt Basic gtgt (ltlt 2017 gtgt q_act_jan)13User Value 0000540 Tsd | 00 | 00 | 00 | |||||||||||||||||||||||||||||||
| 0 | 0 | 46460419259 | 0 | 0 | 0 | 0 | m25 | m25 | 00 | 00 | ||||||||||||||||||||||||||||||||||||||
| Earnings per share 1000 | 0000788 | 0002078 | rf28 PAC Hamon Pierrick Referenced Value (value_1_PQACT02)1313Document Q3_2017_Quarter_Report13Chapter Consolidated Income Statement13Row ltlt Basic gtgt (ltlt 2017 gtgt q_act)13User Value 0000898 Tsd | rf28 PAC Hamon Pierrick Referenced Value (value_1_PQACTJAN02)1313Document Q3_2017_Quarter_Report13Chapter Consolidated Income Statement13Row ltlt Basic gtgt (ltlt 2017 gtgt q_act_jan)13User Value 0002188 Tsd | ||||||||||||||||||||||||||||||||||||||||||||
| Total Operating Expenses | (3111) | (9209) | s25 | s25 | ||||||||||||||||||||||||||||||||||||||||||||
| OOE YoY | ||||||||||||||||||||||||||||||||||||||||||||||||
| 042 |
| Q3 | |||||||||||||||||||
| GP | Q3 2016 | Q4 2016 | Q1 2017 | Q2 2017 | Q3 2017 | Gross profit | |||||||||||||
| 94 | 92 | 83 | 81 | 81 | r3 PAC Stuker Benjamin Referenced Value (value_3_PQACT02)1313Document Q3_2017_Investor amp AC presentations13Chapter 38 - IRAC Income statement per quarter - Logistics13Row Gross profit (value_1 q_act)13User Value 814848 Mio | Q3 2016 | 94 | ||||||||||||
| Q4 2016 | 92 | ||||||||||||||||||
| Q1 2017 | 83 | ||||||||||||||||||
| Q2 2017 | 81 | ||||||||||||||||||
| EBIT | 09 | 05 | 24 | 31 | 27 | r7 PAC Stuker Benjamin Referenced Value (value_3_PQACT02)1313Document Q3_2017_Investor amp AC presentations13Chapter 38 - IRAC Income statement per quarter - Logistics13Row EBIT reported (value_1 q_act)13User Value 27118 Mio | Q3 2017 | 81 | |||||||||||
| EBIT | |||||||||||||||||||
| Q3 2016 | 09 | ||||||||||||||||||
| Q4 2016 | 05 | ||||||||||||||||||
| Q1 2017 | 24 | ||||||||||||||||||
| Q2 2017 | 31 | ||||||||||||||||||
| Q3 2017 | 27 |
| 2017 | 2016 | ||||||||||||||||||||||||||||||||
| 2017 | 2016 | 2017 | |||||||||||||||||||||||||||||||
| YoY Growth | Q3 | Q4 | Q1 | Q2 | Q3 | Gross Profit EBIT | YTD | YTD | |||||||||||||||||||||||||
| Gross Profit | -6 | -11 | -16 | -19 | -14 | r5 PAC Stuker Benjamin Referenced Value (value_1_PQACT02)1313Document Q3_2017_Investor amp AC presentations13Chapter 38 - IRAC Income statement per quarter - Logistics13Row GP Change YoY (value_1 q_act)13User Value -01372 Mio | Gross Profit | 2933 | 24537 | -16 | r5 PAC Stuker Benjamin Referenced Value (value_2_PQACT02)1313Document Q3_2017_Quarter_Report13Chapter Products quater and year to date13Row ltlt Gross profit gtgt (ltlt value_3 gtgt q_act_jan)13User Value 24537 Tsd1313----------------------------------------------------------------------------------------1313Referenced Value (value_2_PQPRIOR02)1313Document Q3_2017_Investor amp AC presentations13Chapter 38 - IRAC Income statement per quarter - Logistics13Row Gross profit (value_1 q_prior_jan)13User Value 2933025 Mio | ||||||||||||||||||||||
| EBIT (adjusted PY) | 50 | 81 | 63 | rf7 PAC Stuker Benjamin Referenced Value (value_2_PQACT02)1313Document Q3_2017_Quarter_Report13Chapter Products quater and year to date13Row ltlt Operating result (EBIT) gtgt (ltlt value_3 gtgt q_act_jan)13User Value 815 Tsd1313----------------------------------------------------------------------------------------1313Referenced Value (value_2_PQPRIOR02)1313Document Q3_2017_Quarter_Report13Chapter Products quater and year to date13Row ltlt Operating result (Segment EBIT) adjusted gtgt (ltlt value_3 gtgt q_prior_jan)13User Value 501 Tsd | |||||||||||||||||||||||||||||
| NFR in of EBIT | 10 | 20 | m9 | ||||||||||||||||||||||||||||||
| NFR | 43888478 | 4057267 | rf8 PAC Stuker Benjamin Referenced Value (value_2_PQACT02)1313Document Q3_2017_Quarter_Report13Chapter Products quater and year to date13Row ltlt Net forwarding revenue gtgt (ltlt value_3 gtgt q_act_jan)13User Value 40573 Tsd1313----------------------------------------------------------------------------------------1313Referenced Value (value_2_PQPRIOR02)1313Document Q3_2017_Quarter_Report13Chapter Products quater and year to date13Row ltlt Net forwarding revenue gtgt (ltlt value_3 gtgt q_prior_jan)13User Value 43888 Tsd |
| Q3 | |||||||||||||||||||
| GP | Q3 2016 | Q4 2016 | Q1 2017 | Q2 2017 | Q3 2017 | Gross profit | |||||||||||||
| 94 | 92 | 83 | 81 | 81 | r3 PAC Stuker Benjamin Referenced Value (value_3_PQACT02)1313Document Q3_2017_Investor amp AC presentations13Chapter 38 - IRAC Income statement per quarter - Logistics13Row Gross profit (value_1 q_act)13User Value 814848 Mio | Q3 2016 | 94 | ||||||||||||
| Q4 2016 | 92 | ||||||||||||||||||
| Q1 2017 | 83 | ||||||||||||||||||
| Q2 2017 | 81 | ||||||||||||||||||
| EBIT | 09 | 05 | 24 | 31 | 27 | r7 PAC Stuker Benjamin Referenced Value (value_3_PQACT02)1313Document Q3_2017_Investor amp AC presentations13Chapter 38 - IRAC Income statement per quarter - Logistics13Row EBIT reported (value_1 q_act)13User Value 27118 Mio | Q3 2017 | 81 | |||||||||||
| EBIT | |||||||||||||||||||
| Q3 2016 | 09 | ||||||||||||||||||
| Q4 2016 | 05 | ||||||||||||||||||
| Q1 2017 | 24 | ||||||||||||||||||
| Q2 2017 | 31 | ||||||||||||||||||
| Q3 2017 | 27 |
| 2017 | 2016 | ||||||||||||||||||||||||||||||||
| 2017 | 2016 | 2017 | |||||||||||||||||||||||||||||||
| YoY Growth | Q3 | Q4 | Q1 | Q2 | Q3 | Gross Profit EBIT | YTD | YTD | |||||||||||||||||||||||||
| Gross Profit | -6 | -11 | -16 | -19 | -14 | r5 PAC Stuker Benjamin Referenced Value (value_1_PQACT02)1313Document Q3_2017_Investor amp AC presentations13Chapter 38 - IRAC Income statement per quarter - Logistics13Row GP Change YoY (value_1 q_act)13User Value -01372 Mio | Gross Profit | 2933 | 24537 | -16 | r5 PAC Stuker Benjamin Referenced Value (value_2_PQACT02)1313Document Q3_2017_Quarter_Report13Chapter Products quater and year to date13Row ltlt Gross profit gtgt (ltlt value_3 gtgt q_act_jan)13User Value 24537 Tsd1313----------------------------------------------------------------------------------------1313Referenced Value (value_2_PQPRIOR02)1313Document Q3_2017_Investor amp AC presentations13Chapter 38 - IRAC Income statement per quarter - Logistics13Row Gross profit (value_1 q_prior_jan)13User Value 2933025 Mio | ||||||||||||||||||||||
| EBIT (adjusted PY) | 50 | 81 | 63 | rf7 PAC Stuker Benjamin Referenced Value (value_2_PQACT02)1313Document Q3_2017_Quarter_Report13Chapter Products quater and year to date13Row ltlt Operating result (EBIT) gtgt (ltlt value_3 gtgt q_act_jan)13User Value 815 Tsd1313----------------------------------------------------------------------------------------1313Referenced Value (value_2_PQPRIOR02)1313Document Q3_2017_Quarter_Report13Chapter Products quater and year to date13Row ltlt Operating result (Segment EBIT) adjusted gtgt (ltlt value_3 gtgt q_prior_jan)13User Value 501 Tsd | |||||||||||||||||||||||||||||
| NFR in of EBIT | 10 | 20 | m9 | ||||||||||||||||||||||||||||||
| NFR | 43888478 | 4057267 | rf8 PAC Stuker Benjamin Referenced Value (value_2_PQACT02)1313Document Q3_2017_Quarter_Report13Chapter Products quater and year to date13Row ltlt Net forwarding revenue gtgt (ltlt value_3 gtgt q_act_jan)13User Value 40573 Tsd1313----------------------------------------------------------------------------------------1313Referenced Value (value_2_PQPRIOR02)1313Document Q3_2017_Quarter_Report13Chapter Products quater and year to date13Row ltlt Net forwarding revenue gtgt (ltlt value_3 gtgt q_prior_jan)13User Value 43888 Tsd |
| Q3 | |||||||||||||||||||
| GP | Q3 2016 | Q4 2016 | Q1 2017 | Q2 2017 | Q3 2017 | Gross profit | |||||||||||||
| 94 | 92 | 83 | 81 | 81 | r3 PAC Stuker Benjamin Referenced Value (value_3_PQACT02)1313Document Q3_2017_Investor amp AC presentations13Chapter 38 - IRAC Income statement per quarter - Logistics13Row Gross profit (value_1 q_act)13User Value 814848 Mio | Q3 2016 | 94 | ||||||||||||
| Q4 2016 | 92 | ||||||||||||||||||
| Q1 2017 | 83 | ||||||||||||||||||
| Q2 2017 | 81 | ||||||||||||||||||
| EBIT | 09 | 05 | 24 | 31 | 27 | r7 PAC Stuker Benjamin Referenced Value (value_3_PQACT02)1313Document Q3_2017_Investor amp AC presentations13Chapter 38 - IRAC Income statement per quarter - Logistics13Row EBIT reported (value_1 q_act)13User Value 27118 Mio | Q3 2017 | 81 | |||||||||||
| EBIT | |||||||||||||||||||
| Q3 2016 | 09 | ||||||||||||||||||
| Q4 2016 | 05 | ||||||||||||||||||
| Q1 2017 | 24 | ||||||||||||||||||
| Q2 2017 | 31 | ||||||||||||||||||
| Q3 2017 | 27 |
| 2017 | 2016 | ||||||||||||||||||||||||||||||||
| 2017 | 2016 | 2017 | |||||||||||||||||||||||||||||||
| YoY Growth | Q3 | Q4 | Q1 | Q2 | Q3 | Gross Profit EBIT | YTD | YTD | |||||||||||||||||||||||||
| Gross Profit | -6 | -11 | -16 | -19 | -14 | r5 PAC Stuker Benjamin Referenced Value (value_1_PQACT02)1313Document Q3_2017_Investor amp AC presentations13Chapter 38 - IRAC Income statement per quarter - Logistics13Row GP Change YoY (value_1 q_act)13User Value -01372 Mio | Gross Profit | 2933 | 24537 | -16 | r5 PAC Stuker Benjamin Referenced Value (value_2_PQACT02)1313Document Q3_2017_Quarter_Report13Chapter Products quater and year to date13Row ltlt Gross profit gtgt (ltlt value_3 gtgt q_act_jan)13User Value 24537 Tsd1313----------------------------------------------------------------------------------------1313Referenced Value (value_2_PQPRIOR02)1313Document Q3_2017_Investor amp AC presentations13Chapter 38 - IRAC Income statement per quarter - Logistics13Row Gross profit (value_1 q_prior_jan)13User Value 2933025 Mio | ||||||||||||||||||||||
| EBIT (adjusted PY) | 50 | 81 | 63 | rf7 PAC Stuker Benjamin Referenced Value (value_2_PQACT02)1313Document Q3_2017_Quarter_Report13Chapter Products quater and year to date13Row ltlt Operating result (EBIT) gtgt (ltlt value_3 gtgt q_act_jan)13User Value 815 Tsd1313----------------------------------------------------------------------------------------1313Referenced Value (value_2_PQPRIOR02)1313Document Q3_2017_Quarter_Report13Chapter Products quater and year to date13Row ltlt Operating result (Segment EBIT) adjusted gtgt (ltlt value_3 gtgt q_prior_jan)13User Value 501 Tsd | |||||||||||||||||||||||||||||
| NFR in of EBIT | 10 | 20 | m9 | ||||||||||||||||||||||||||||||
| NFR | 43888478 | 4057267 | rf8 PAC Stuker Benjamin Referenced Value (value_2_PQACT02)1313Document Q3_2017_Quarter_Report13Chapter Products quater and year to date13Row ltlt Net forwarding revenue gtgt (ltlt value_3 gtgt q_act_jan)13User Value 40573 Tsd1313----------------------------------------------------------------------------------------1313Referenced Value (value_2_PQPRIOR02)1313Document Q3_2017_Quarter_Report13Chapter Products quater and year to date13Row ltlt Net forwarding revenue gtgt (ltlt value_3 gtgt q_prior_jan)13User Value 43888 Tsd |
| Q3 | |||||||||||||||||||
| GP | Q3 2016 | Q4 2016 | Q1 2017 | Q2 2017 | Q3 2017 | Gross profit | |||||||||||||
| 94 | 92 | 83 | 81 | 81 | r3 PAC Stuker Benjamin Referenced Value (value_3_PQACT02)1313Document Q3_2017_Investor amp AC presentations13Chapter 38 - IRAC Income statement per quarter - Logistics13Row Gross profit (value_1 q_act)13User Value 814848 Mio | Q3 2016 | 94 | ||||||||||||
| Q4 2016 | 92 | ||||||||||||||||||
| Q1 2017 | 83 | ||||||||||||||||||
| Q2 2017 | 81 | ||||||||||||||||||
| EBIT | 09 | 05 | 24 | 31 | 27 | r7 PAC Stuker Benjamin Referenced Value (value_3_PQACT02)1313Document Q3_2017_Investor amp AC presentations13Chapter 38 - IRAC Income statement per quarter - Logistics13Row EBIT reported (value_1 q_act)13User Value 27118 Mio | Q3 2017 | 81 | |||||||||||
| EBIT | |||||||||||||||||||
| Q3 2016 | 09 | ||||||||||||||||||
| Q4 2016 | 05 | ||||||||||||||||||
| Q1 2017 | 24 | ||||||||||||||||||
| Q2 2017 | 31 | ||||||||||||||||||
| Q3 2017 | 27 |
| 2017 | 2016 | ||||||||||||||||||||||||||||||||
| 2017 | 2016 | 2017 | |||||||||||||||||||||||||||||||
| YoY Growth | Q3 | Q4 | Q1 | Q2 | Q3 | Gross Profit EBIT | YTD | YTD | |||||||||||||||||||||||||
| Gross Profit | -6 | -11 | -16 | -19 | -14 | r5 PAC Stuker Benjamin Referenced Value (value_1_PQACT02)1313Document Q3_2017_Investor amp AC presentations13Chapter 38 - IRAC Income statement per quarter - Logistics13Row GP Change YoY (value_1 q_act)13User Value -01372 Mio | Gross Profit | 2933 | 24537 | -16 | r5 PAC Stuker Benjamin Referenced Value (value_2_PQACT02)1313Document Q3_2017_Quarter_Report13Chapter Products quater and year to date13Row ltlt Gross profit gtgt (ltlt value_3 gtgt q_act_jan)13User Value 24537 Tsd1313----------------------------------------------------------------------------------------1313Referenced Value (value_2_PQPRIOR02)1313Document Q3_2017_Investor amp AC presentations13Chapter 38 - IRAC Income statement per quarter - Logistics13Row Gross profit (value_1 q_prior_jan)13User Value 2933025 Mio | ||||||||||||||||||||||
| EBIT (adjusted PY) | 50 | 81 | 63 | rf7 PAC Stuker Benjamin Referenced Value (value_2_PQACT02)1313Document Q3_2017_Quarter_Report13Chapter Products quater and year to date13Row ltlt Operating result (EBIT) gtgt (ltlt value_3 gtgt q_act_jan)13User Value 815 Tsd1313----------------------------------------------------------------------------------------1313Referenced Value (value_2_PQPRIOR02)1313Document Q3_2017_Quarter_Report13Chapter Products quater and year to date13Row ltlt Operating result (Segment EBIT) adjusted gtgt (ltlt value_3 gtgt q_prior_jan)13User Value 501 Tsd | |||||||||||||||||||||||||||||
| NFR in of EBIT | 10 | 20 | m9 | ||||||||||||||||||||||||||||||
| NFR | 43888478 | 4057267 | rf8 PAC Stuker Benjamin Referenced Value (value_2_PQACT02)1313Document Q3_2017_Quarter_Report13Chapter Products quater and year to date13Row ltlt Net forwarding revenue gtgt (ltlt value_3 gtgt q_act_jan)13User Value 40573 Tsd1313----------------------------------------------------------------------------------------1313Referenced Value (value_2_PQPRIOR02)1313Document Q3_2017_Quarter_Report13Chapter Products quater and year to date13Row ltlt Net forwarding revenue gtgt (ltlt value_3 gtgt q_prior_jan)13User Value 43888 Tsd |

9Q3 RESULTS 2017 | 19 OCTOBER 2017 |
OUTLOOK AND PRIORITIES 2017
10Q3 RESULTS 2017 | 19 OCTOBER 2017 |
OUTLOOK AND PRIORITIES 2017
OUTLOOK Market
minus Air continuous strong volumes expected but growth rate slowing down (tough Q4 2016 comparison)
minus Ocean Soft market conditions Q4
Panalpina
minus Air margin impact of peak season difficult to anticipate
minus Ocean spot market rates have decreased lately and a slight margin improvement could be expected
PRIORITIES
Focus on topline growth and further improvement of unit profitability
Improve EBIT in Ocean Freight
Accelerate growth through selected bolt-on acquisitions
Maintain cost discipline and push ahead operations transformation program
11Q3 RESULTS 2017 | 19 OCTOBER 2017 |
YEAR-END RESULTS
MARCH 7 2018
NEXT EVENTS
12Q3 RESULTS 2017 | 19 OCTOBER 2017 |
DISCLAIMER
Investing in the shares of Panalpina World Transport (Holding) Ltd involves risks Prospective investors are strongly requested to consult their investment advisors and tax advisors prior to investing in shares of Panalpina World Transport (Holding) Ltd
This document contains forward-looking statements which involve risks and uncertainties These statements may be identified by such words as ldquomayrdquo ldquoplansrdquo ldquoexpectsrdquo ldquobelievesrdquo and similar expressions or by their context These statements are made on the basis of current knowledge and assumptions Various factors could cause actual future results performance or events to differ materially from those described in these statements No obligation is assumed to update any forward-looking statements Potential risks and uncertainties include such factors as general economic conditions foreign exchange fluctuations competitive product and pricing pressures and regulatory developments
The information contained in this document has not been independently verified and no representation or warranty express or implied is made to and no reliance should be placed on the fairness accuracy completeness or correctness of the information or opinions contained herein The information in this presentation is subject to change without notice it may be incomplete or condensed and it may not contain all material information concerning the Panalpina Group None of Panalpina World Transport (Holding) Ltd or their respective affiliates shall have any liability whatsoever for any loss whatsoever arising from any use of this document or its content or otherwise arising in connection with this document
This document does not constitute or form part of an offer to sell or a solicitation of an offer to purchase any shares and neither it nor any part of it shall form the basis of or be relied upon in connection with any contract or commitment whatsoever This information does neither constitute an offer to buy shares of Panalpina World Transport (Holding) Ltd nor a prospectus within the meaning of the applicable Swiss law
13Q3 RESULTS 2017 | 19 OCTOBER 2017 |
APPENDIX
14Q3 RESULTS 2017 | 19 OCTOBER 2017 |
INCOME STATEMENT PER QUARTER ndash GROUP
Note Group figures in CHF million
Group Q1 2016 Q2 2016 Q3 2016 Q3YTD Q4 2016 FY 2016 Q1 2017 Q2 2017 Q3 2017 Q3YTD 2017Net forwarding revenue 13072 12894 12670 38635 13325 51960 12772 13549 14334 40655 Forwarding expenses (9423) (9180) (9116) (27718) (9996) (37714) (9445) (10145) (10818) (30407)Gross profit 3649 3714 3554 10917 3329 14246 3327 3404 3516 10248 Personnel expenses (2250) (2213) (2129) (6592) (2113) (8705) (2164) (2162) (2186) (6511)Other operating expenses (1037) (1011) (971) (3018) (927) (3945) (893) (880) (925) (2698)EBITDA adjusted 362 491 454 1307 289 1596 271 362 406 1039 Depreciation of property plant and equip (62) (62) (62) (187) (71) (258) (53) (54) (50) (156)Amortization of intangible assets (60) (60) (63) (183) (56) (239) (54) (52) (55) (162)EBIT adjusted 240 368 329 936 163 1099 164 256 301 721 in of gross profit 66 99 92 86 49 77 49 75 86 70Non-recurring itemsRestructuring expenses 00 (261) 00 (261) (19) (280) 00 00 00 00
EBIT reported 240 107 329 675 144 820 164 256 301 721 in of gross profit 66 29 92 62 43 58 49 75 86 70Financial result (09) 07 (04) (06) 02 (04) 02 01 (04) (02)Earnings before taxes (EBT) 231 114 325 670 146 816 165 257 297 719 Income tax expenses (58) (69) (79) (205) (88) (293) (42) (81) (112) (235) of EBT 250 602 242 306 601 359 252 316 378 327Profit 173 45 246 465 58 523 124 176 185 484 Earnings per share 075 021 106 201 027 229 054 075 079 208
SNVeryHiddenParameterSheet
PAN_ISpQ_Group
image1png
15Q3 RESULTS 2017 | 19 OCTOBER 2017 |
INCOME STATEMENT PER QUARTER ndash AIR FREIGHT
Note Air Freight figures in CHF million
Air Freight Q1 2016 Q2 2016 Q3 2016 Q3YTD 2016 Q4 2016 FY 2016 Q1 2017 Q2 2017 Q3 2017 Q3 YTD 2017Net forwarding revenue 6332 6359 6341 19032 7234 26267 6571 7000 7389 20960 Forwarding expenses (4846) (4800) (4853) (14499) (5816) (20315) (5125) (5500) (5775) (16400)Gross profit 1486 1559 1489 4534 1418 5952 1447 1500 1614 4560 Personnel expenses (885) (869) (847) (2600) (873) (3473) (905) (916) (928) (2750)Other operating expenses (371) (359) (318) (1048) (284) (1333) (324) (317) (337) (978)EBITDA adjusted 230 331 324 885 261 1146 218 266 349 833 Depreciation and amortization (52) (52) (55) (158) (53) (211) (46) (47) (46) (139)EBIT adjusted 178 279 269 726 208 935 171 220 303 694 in of gross profit 120 179 181 160 147 157 118 146 188 152Non-recurring itemsRestructuring expenses 00 (127) 00 (127) 00 (127) 00 00 00 00
EBIT reported 178 153 269 600 208 808 171 220 303 694 in of gross profit 120 98 181 132 147 136 118 146 188 152
Air Freight volumes (000 tons) 2161 2251 2278 6690 2524 9214 2332 2399 2489 7220 change YoY 54 111 99 88 141 102 79 66 93 79GPton (CHF) 688 693 653 678 562 646 620 625 648 632 change YoY -47 -36 -73 -52 -140 -75 -98 -97 -08 -68
SNVeryHiddenParameterSheet
PAN_ISpQ_AirFreight
image1png
16Q3 RESULTS 2017 | 19 OCTOBER 2017 |
INCOME STATEMENT PER QUARTER ndash OCEAN FREIGHT
Note Ocean Freight figures in CHF million
Ocean Freight Q1 2016 Q2 2016 Q3 2016 Q3YTD 2016 Q4 2016 FY 2016 Q1 2017 Q2 2017 Q3 2017 Q3YTD 2017Net forwarding revenue 5338 4921 4955 15214 4770 19984 4915 5172 5551 15637 Forwarding expenses (4157) (3773) (3834) (11764) (3783) (15547) (3860) (4081) (4463) (12404)Gross profit 1181 1148 1121 3450 987 4438 1055 1091 1088 3234 Personnel expenses (791) (752) (755) (2298) (721) (3019) (779) (784) (788) (2352)Other operating expenses (305) (288) (274) (868) (275) (1144) (271) (265) (290) (827)EBITDA adjusted 84 108 92 284 (09) 275 05 41 09 55 Depreciation and amortization (41) (42) (41) (124) (42) (166) (36) (36) (38) (110)EBIT adjusted 43 66 51 160 (51) 109 (32) 06 (29) (55)in of gross profit 37 58 45 46 -51 25 -30 05 -27 -17Non-recurring itemsRestructuring expenses 00 (97) 0 (97) (19) (115) 00 00 00 00
EBIT reported 43 (30) 51 63 (69) (06) (32) 06 (29) (55)in of gross profit 37 -26 45 18 -70 -01 -30 05 -27 -17
Ocean Freight volumes (000 tons) 3482 3726 3787 10995 3890 14885 3742 3828 3856 11426 change YoY -100 -82 -88 -90 08 -66 75 27 18 39GPTEU (CHF) 339 308 296 314 254 298 282 285 282 283 change YoY 102 59 -16 47 -176 -11 -169 -75 -47 -98
SNVeryHiddenParameterSheet
PAN_ISpQ_OceanFreight
image1png
17Q3 RESULTS 2017 | 19 OCTOBER 2017 |
INCOME STATEMENT PER QUARTER ndash LOGISTICS
Note Logistics figures in CHF million
Logistics Q1 2016 Q2 2016 Q3 2016 Q3YTD 2016 Q4 2016 FY 2016 Q1 2017 Q2 2017 Q3 2017 Q3YTD 2017Net forwarding revenue 1402 1613 1374 4389 1321 5709 1286 1377 1394 4057 Forwarding expenses (420) (607) (429) (1456) (397) (1853) (460) (564) (580) (1604)Gross profit 982 1006 944 2933 924 3857 825 813 815 2454 Personnel expenses (574) (591) (528) (1694) (519) (2213) (479) (461) (469) (1409)Other operating expenses (360) (363) (378) (1102) (367) (1469) (298) (298) (298) (894)EBITDA adjusted 48 52 38 138 37 175 48 54 48 151 Depreciation and amortization (29) (29) (29) (88) (32) (119) (25) (24) (21) (69)EBIT adjusted 18 23 09 50 05 56 24 31 27 81 Non-recurring itemsRestructuring expenses 00 (38) 00 (38) 00 (38) 00 00 00 00
EBIT reported 18 (15) 09 12 05 18 24 31 27 81
SNVeryHiddenParameterSheet
PAN_ISpQ_Logistics
image1png
18Q3 RESULTS 2017 | 19 OCTOBER 2017 |
BALANCE SHEET
CHF Cash and cash equivalents 3888 2946 (942) -24Trade receivables unbilled forwarding services 9087 9893 806 9Other current assets 1025 1167 142 14Property plant and equipment 635 803 168 26Intangible assets 979 917 (62) -6Other non-current assets 990 1133 143 14Total assets 16606 16859 253 2
Short-term borrowings 23 21 (02) -10Trade payables accured cost of services 6524 7075 551 8Other current liabilities 2439 2254 (185) -8Long-Term borrowings 00 20 20 naOther long-term liabilities 1449 1527 78 5Total liabilities 10436 10896 460 4Share capital 24 24 (00) -1Reserves treasury shares 6057 5884 (173) -3Non-controlling interests 89 55 (34) -38Total equity 6170 5963 (207) -3Total equity and liabilities 16606 16859 253 2
31-Dec-16 30-Sept-17Change in
SNVeryHiddenParameterSheet
PAN_BalanceSheet
image1png
19Q3 RESULTS 2017 | 19 OCTOBER 2017 |
CASH FLOW
Note Figures in CHF million
30-Sep-16 30-Sep-17Change in
Cash flow before changes in working capital 1029 1075 Changes in working capital 357 (477)Cash from operations 1386 599
Interest and income taxes paid (292) (331)Net cash from operating activities 1094 267 -76
Net cash from investing activities (342) (409) 20
Free cash flow 752 (141) -119
Net cash used in financing activities (858) (894) 4
Net increase (decrease) in cash and cash equivalents (106) (1035)Cash and cash equivalents at beginning of period 3923 3888 Effect of exchange rate changes (17) 93 Cash and cash equivalents at end of period 3799 2946
SNVeryHiddenParameterSheet
Tabele PAN_Cashflow
Reported cash and cash equivalents at 31122016Profit YTD 092017Other non-cash items (eg DampA)Changes in working capitalInterest and income taxes paidNet cash from investing activitiesFinancing activitiesdividendEffect of exchange rate changesReported cash and cash equivalents at 300920173887843716999999999996448614155374652852799999999999728527999999999997Reported cash and cash equivalents at 31122016Profit YTD 092017Other non-cash items (eg DampA)Changes in working capitalInterest and income taxes paidNet cash from investing activitiesFinancing activitiesdividendEffect of exchange rate changesReported cash and cash equivalents at 30092017388784839591476633114085893793329463
- Nine months results 2017
- Slide Number 2
- ACHIEVEMENTS and key figures
- Third consecutive quarter with GP and EBIT Growth
- Operating and financial review
- Air Freight Strong and profitable growth
- Ocean Freight quarterly loss due to margin Stagnation
- Logistics improved profitability
- Outlook and priorities 2017
- outlook and priorities 2017
- Next EVENTs
- Disclaimer
- Appendix
- Income statement per quarter ndash Group
- Income statement per quarter ndash Air Freight
- Income statement per quarter ndash Ocean Freight
- Income statement per quarter ndash Logistics
- Balance sheet
- Cash flow
-
| 30-Sep-16 | 30-Sep-17 | Change in | ||||||||||||||||||||||||||||||||||||||||||||||||||||||
| Cash flow before changes in working capital | 1029 | 1075 | r2 PAC Hamon Pierrick Referenced Value (value_1_PQACTJAN02)1313Document Q3_2017_Quarter_Report13Chapter Consolidated Statement of Cash Flows13Row ltlt Subtotal cash flow from operations gtgt (ltlt 2017 gtgt q_act_jan)13User Value 10749 Tsd | PY IS MANUAL | ||||||||||||||||||||||||||||||||||||||||||||||||||||
| Changes in working capital | 357 | (477) | r3 PAC Hamon Pierrick Referenced Value (value_1_PQACTJAN02)1313Document Q3_2017_Quarter_Report13Chapter Consolidated Statement of Cash Flows1313-7973 Tsd - ltlt (Increase) decrease receivables other current assets and unbilled forwarding services gtgt (ltlt 2017 gtgt q_act_jan)134406 Tsd - ltlt Increase (decrease) payables and accruals incl accrued cost of service gtgt (ltlt 2017 gtgt q_act_jan)13-472 Tsd - ltlt Increase (decrease) non-current provisions and other liabilities gtgt (ltlt 2017 gtgt q_act_jan)13-749 Tsd - ltlt Increase (decrease) current provisions and other liabilities gtgt (ltlt 2017 gtgt q_act_jan)13---------------------13-4787 Tsd (Total) | |||||||||||||||||||||||||||||||||||||||||||||||||||||
| Cash from operations | 1386 | 599 | r4 PAC Hamon Pierrick Referenced Value (value_1_PQACTJAN02)1313Document Q3_2017_Quarter_Report13Chapter Consolidated Statement of Cash Flows13Row ltlt Cash generated from operations gtgt (ltlt 2017 gtgt q_act_jan)13User Value 5963 Tsd | |||||||||||||||||||||||||||||||||||||||||||||||||||||
| Interest and income taxes paid | (292) | (331) | r6 PAC Hamon Pierrick Referenced Value (value_1_PQACTJAN02)1313Document Q3_2017_Quarter_Report13Chapter Consolidated Statement of Cash Flows1313-136 Tsd - ltlt Interest paid gtgt (ltlt 2017 gtgt q_act_jan)13-3175 Tsd - ltlt Income taxes paid gtgt (ltlt 2017 gtgt q_act_jan)13---------------------13-3311 Tsd (Total) | |||||||||||||||||||||||||||||||||||||||||||||||||||||
| Net cash from operating activities | 1094 | 267 | -76 | r7 PAC Hamon Pierrick Referenced Value (value_1_PQACTJAN02)1313Document Q3_2017_Quarter_Report13Chapter Consolidated Statement of Cash Flows13Row ltlt Net cash from operating activities gtgt (ltlt 2017 gtgt q_act_jan)13User Value 2652 Tsd | ||||||||||||||||||||||||||||||||||||||||||||||||||||
| Net cash from investing activities | (342) | (409) | 20 | r9 PAC Hamon Pierrick Referenced Value (value_1_PQACTJAN02)1313Document Q3_2017_Quarter_Report13Chapter Consolidated Statement of Cash Flows13Row ltlt Net cash used in investing activities gtgt (ltlt 2017 gtgt q_act_jan)13User Value -4063 Tsd | ||||||||||||||||||||||||||||||||||||||||||||||||||||
| Free cash flow | 752 | (141) | -119 | r11 PAC Hamon Pierrick Referenced Value (value_1_PQACTJAN02)1313Document Q3_2017_Quarter_Report13Chapter Consolidated Statement of Cash Flows13Row ltlt Free cash flow gtgt (ltlt 2017 gtgt q_act_jan)13User Value -1411 Tsd | ||||||||||||||||||||||||||||||||||||||||||||||||||||
| Net cash used in financing activities | (858) | (894) | 4 | r13 PAC Hamon Pierrick Referenced Value (value_1_PQACTJAN02)1313Document Q3_2017_Quarter_Report13Chapter Consolidated Statement of Cash Flows13Row ltlt Net cash used in financing activities gtgt (ltlt 2017 gtgt q_act_jan)13User Value -8937 Tsd | ||||||||||||||||||||||||||||||||||||||||||||||||||||
| Net increase (decrease) in cash and cash equivalents | (106) | (1035) | r15 PAC Hamon Pierrick Referenced Value (value_1_PQACTJAN02)1313Document Q3_2017_Quarter_Report13Chapter Consolidated Statement of Cash Flows13Row ltlt Net increase (decrease) in cash and cash equivalents gtgt (ltlt 2017 gtgt q_act_jan)13User Value -10348 Tsd | |||||||||||||||||||||||||||||||||||||||||||||||||||||
| Cash and cash equivalents at beginning of period | 3923 | 3888 | r16 PAC Hamon Pierrick Referenced Value (value_1_PQACTJAN02)1313Document Q3_2017_Quarter_Report13Chapter Consolidated Statement of Cash Flows13Row ltlt Cash and cash equivalents at the beginning of the period gtgt (ltlt 2017 gtgt q_act_jan)13User Value 38878 Tsd | |||||||||||||||||||||||||||||||||||||||||||||||||||||
| Effect of exchange rate changes | (17) | 93 | r17 PAC Hamon Pierrick Referenced Value (value_1_PQACTJAN02)1313Document Q3_2017_Quarter_Report13Chapter Consolidated Statement of Cash Flows13Row ltlt Effect of exchange rate changes on cash and cash equivalents gtgt (ltlt 2017 gtgt q_act_jan)13User Value 933 Tsd | |||||||||||||||||||||||||||||||||||||||||||||||||||||
| Cash and cash equivalents at end of period | 3799 | 2946 | r18 PAC Hamon Pierrick Referenced Value (value_1_PQACTJAN02)1313Document Q3_2017_Quarter_Report13Chapter Consolidated Statement of Cash Flows13Row ltlt Cash and cash equivalents at the end of the period gtgt (ltlt 2017 gtgt q_act_jan)13User Value 29463 Tsd | |||||||||||||||||||||||||||||||||||||||||||||||||||||
| Reported cash and cash equivalents at 31122016 | 3888 | r21 PAC Hamon Pierrick Referenced Value (value_1_PQACTJAN02)1313Document Q3_2017_Quarter_Report13Chapter Consolidated Statement of Cash Flows13Row ltlt Cash and cash equivalents at the beginning of the period gtgt (ltlt 2017 gtgt q_act_jan)13User Value 38878 Tsd | Reported cash and cash equivalents at 31122016 | 3888 | ||||||||||||||||||||||||||||||||||||||||||||||||||||
| Profit YTD 092017 | 4839 | r19 PAC Hamon Pierrick Referenced Value (value_1_PQACTJAN02)1313Document Q3_2017_Quarter_Report13Chapter Consolidated Statement of Cash Flows13Row ltlt Profit gtgt (ltlt 2017 gtgt q_act_jan)13User Value 4839 Tsd | Profit YTD 092017 | 3888 | 484 | |||||||||||||||||||||||||||||||||||||||||||||||||||
| Other non-cash items (eg DampA) | 591 | r23 PAC Hamon Pierrick Referenced Value (value_1_PQACTJAN02)1313Document Q3_2017_Quarter_Report13Chapter Consolidated Statement of Cash Flows13131565 Tsd - ltlt Depreciation of property plant and equipment gtgt (ltlt 2017 gtgt q_act_jan)131616 Tsd - ltlt Amortization of intangible assets gtgt (ltlt 2017 gtgt q_act_jan)13-165 Tsd - ltlt Interest income and dividend on available-for-sale financial assets gtgt (ltlt 2017 gtgt q_act_jan)13-167 Tsd - ltlt Exchange differences gtgt (ltlt 2017 gtgt q_act_jan)13-025 Tsd - ltlt Loss (gain) on sales of property plant and equipment gtgt (ltlt 2017 gtgt q_act_jan)13000 Tsd - ltlt Loss (gain) on sales of financial assets gtgt (ltlt 2017 gtgt q_act_jan)13497 Tsd - ltlt Expenses for share-based compensation plans gtgt (ltlt 2017 gtgt q_act_jan)13238 Tsd - ltlt Other non-cash (income) and expenses gtgt (ltlt 2017 gtgt q_act_jan)132351 Tsd - ltlt Income tax expenses gtgt (ltlt 2017 gtgt q_act_jan)13---------------------135910 Tsd (Total) | Other non-cash items (eg DampA) | 4372 | 591 | |||||||||||||||||||||||||||||||||||||||||||||||||||
| Changes in working capital | -4766 | r24 PAC Hamon Pierrick Referenced Value (value_1_PQACTJAN02)1313Document Q3_2017_Quarter_Report13Chapter Consolidated Statement of Cash Flows1313-7973 Tsd - ltlt (Increase) decrease receivables other current assets and unbilled forwarding services gtgt (ltlt 2017 gtgt q_act_jan)134406 Tsd - ltlt Increase (decrease) payables and accruals incl accrued cost of service gtgt (ltlt 2017 gtgt q_act_jan)13-472 Tsd - ltlt Increase (decrease) non-current provisions and other liabilities gtgt (ltlt 2017 gtgt q_act_jan)13-749 Tsd - ltlt Increase (decrease) current provisions and other liabilities gtgt (ltlt 2017 gtgt q_act_jan)13---------------------13-4787 Tsd (Total) | Changes in working capital | 4486 | 477 | neg | ||||||||||||||||||||||||||||||||||||||||||||||||||
| Interest and income taxes paid | -3311 | r25 PAC Hamon Pierrick Referenced Value (value_1_PQACTJAN02)1313Document Q3_2017_Quarter_Report13Chapter Consolidated Statement of Cash Flows1313-136 Tsd - ltlt Interest paid gtgt (ltlt 2017 gtgt q_act_jan)13-3175 Tsd - ltlt Income taxes paid gtgt (ltlt 2017 gtgt q_act_jan)13---------------------13-3311 Tsd (Total) | Interest and income taxes paid | 4155 | 331 | neg | ||||||||||||||||||||||||||||||||||||||||||||||||||
| Net cash from investing activities | -4085 | r26 PAC Hamon Pierrick Referenced Value (value_1_PQACTJAN02)1313Document Q3_2017_Quarter_Report13Chapter Consolidated Statement of Cash Flows13Row ltlt Net cash used in investing activities gtgt (ltlt 2017 gtgt q_act_jan)13User Value -4063 Tsd | Net cash from investing activities | 3747 | 409 | neg | ||||||||||||||||||||||||||||||||||||||||||||||||||
| Financing activitiesdividend | -8937 | r27 PAC Hamon Pierrick Referenced Value (value_1_PQACTJAN02)1313Document Q3_2017_Quarter_Report13Chapter Consolidated Statement of Cash Flows13Row ltlt Net cash used in financing activities gtgt (ltlt 2017 gtgt q_act_jan)13User Value -8937 Tsd | Financing activitiesdividend | 2853 | 894 | neg | ||||||||||||||||||||||||||||||||||||||||||||||||||
| Effect of exchange rate changes | 933 | r28 PAC Hamon Pierrick Referenced Value (value_1_PQACTJAN02)1313Document Q3_2017_Quarter_Report13Chapter Consolidated Statement of Cash Flows13Row ltlt Effect of exchange rate changes on cash and cash equivalents gtgt (ltlt 2017 gtgt q_act_jan)13User Value 933 Tsd | Effect of exchange rate changes | 2853 | 93 | |||||||||||||||||||||||||||||||||||||||||||||||||||
| Reported cash and cash equivalents at 30092017 | 29463 | r29 PAC Hamon Pierrick Referenced Value (value_1_PQACTJAN02)1313Document Q3_2017_Quarter_Report13Chapter Consolidated Statement of Cash Flows13Row ltlt Cash and cash equivalents at the end of the period gtgt (ltlt 2017 gtgt q_act_jan)13User Value 29463 Tsd | PAC Hamon Pierrick Referenced Value (value_1_PQACTJAN02)1313Document Q3_2017_Quarter_Report13Chapter Consolidated Statement of Cash Flows13Row ltlt Subtotal cash flow from operations gtgt (ltlt 2017 gtgt q_act_jan)13User Value 10749 Tsd | PAC Hamon Pierrick Referenced Value (value_1_PQACTJAN02)1313Document Q3_2017_Quarter_Report13Chapter Consolidated Statement of Cash Flows1313-7973 Tsd - ltlt (Increase) decrease receivables other current assets and unbilled forwarding services gtgt (ltlt 2017 gtgt q_act_jan)134406 Tsd - ltlt Increase (decrease) payables and accruals incl accrued cost of service gtgt (ltlt 2017 gtgt q_act_jan)13-472 Tsd - ltlt Increase (decrease) non-current provisions and other liabilities gtgt (ltlt 2017 gtgt q_act_jan)13-749 Tsd - ltlt Increase (decrease) current provisions and other liabilities gtgt (ltlt 2017 gtgt q_act_jan)13---------------------13-4787 Tsd (Total) | PAC Hamon Pierrick Referenced Value (value_1_PQACTJAN02)1313Document Q3_2017_Quarter_Report13Chapter Consolidated Statement of Cash Flows13Row ltlt Cash generated from operations gtgt (ltlt 2017 gtgt q_act_jan)13User Value 5963 Tsd | PAC Hamon Pierrick Referenced Value (value_1_PQACTJAN02)1313Document Q3_2017_Quarter_Report13Chapter Consolidated Statement of Cash Flows1313-136 Tsd - ltlt Interest paid gtgt (ltlt 2017 gtgt q_act_jan)13-3175 Tsd - ltlt Income taxes paid gtgt (ltlt 2017 gtgt q_act_jan)13---------------------13-3311 Tsd (Total) | PAC Hamon Pierrick Referenced Value (value_1_PQACTJAN02)1313Document Q3_2017_Quarter_Report13Chapter Consolidated Statement of Cash Flows13Row ltlt Net cash from operating activities gtgt (ltlt 2017 gtgt q_act_jan)13User Value 2652 Tsd | PAC Hamon Pierrick Referenced Value (value_1_PQACTJAN02)1313Document Q3_2017_Quarter_Report13Chapter Consolidated Statement of Cash Flows13Row ltlt Net cash used in investing activities gtgt (ltlt 2017 gtgt q_act_jan)13User Value -4063 Tsd | PAC Hamon Pierrick Referenced Value (value_1_PQACTJAN02)1313Document Q3_2017_Quarter_Report13Chapter Consolidated Statement of Cash Flows13Row ltlt Free cash flow gtgt (ltlt 2017 gtgt q_act_jan)13User Value -1411 Tsd | PAC Hamon Pierrick Referenced Value (value_1_PQACTJAN02)1313Document Q3_2017_Quarter_Report13Chapter Consolidated Statement of Cash Flows13Row ltlt Net cash used in financing activities gtgt (ltlt 2017 gtgt q_act_jan)13User Value -8937 Tsd | PAC Hamon Pierrick Referenced Value (value_1_PQACTJAN02)1313Document Q3_2017_Quarter_Report13Chapter Consolidated Statement of Cash Flows13Row ltlt Net increase (decrease) in cash and cash equivalents gtgt (ltlt 2017 gtgt q_act_jan)13User Value -10348 Tsd | PAC Hamon Pierrick Referenced Value (value_1_PQACTJAN02)1313Document Q3_2017_Quarter_Report13Chapter Consolidated Statement of Cash Flows13Row ltlt Cash and cash equivalents at the beginning of the period gtgt (ltlt 2017 gtgt q_act_jan)13User Value 38878 Tsd | PAC Hamon Pierrick Referenced Value (value_1_PQACTJAN02)1313Document Q3_2017_Quarter_Report13Chapter Consolidated Statement of Cash Flows13Row ltlt Effect of exchange rate changes on cash and cash equivalents gtgt (ltlt 2017 gtgt q_act_jan)13User Value 933 Tsd | PAC Hamon Pierrick Referenced Value (value_1_PQACTJAN02)1313Document Q3_2017_Quarter_Report13Chapter Consolidated Statement of Cash Flows13Row ltlt Cash and cash equivalents at the end of the period gtgt (ltlt 2017 gtgt q_act_jan)13User Value 29463 Tsd | PAC Hamon Pierrick Referenced Value (value_1_PQACTJAN02)1313Document Q3_2017_Quarter_Report13Chapter Consolidated Statement of Cash Flows13Row ltlt Cash and cash equivalents at the beginning of the period gtgt (ltlt 2017 gtgt q_act_jan)13User Value 38878 Tsd | PAC Hamon Pierrick Referenced Value (value_1_PQACTJAN02)1313Document Q3_2017_Quarter_Report13Chapter Consolidated Statement of Cash Flows13Row ltlt Profit gtgt (ltlt 2017 gtgt q_act_jan)13User Value 4839 Tsd | PAC Hamon Pierrick Referenced Value (value_1_PQACTJAN02)1313Document Q3_2017_Quarter_Report13Chapter Consolidated Statement of Cash Flows13131565 Tsd - ltlt Depreciation of property plant and equipment gtgt (ltlt 2017 gtgt q_act_jan)131616 Tsd - ltlt Amortization of intangible assets gtgt (ltlt 2017 gtgt q_act_jan)13-165 Tsd - ltlt Interest income and dividend on available-for-sale financial assets gtgt (ltlt 2017 gtgt q_act_jan)13-167 Tsd - ltlt Exchange differences gtgt (ltlt 2017 gtgt q_act_jan)13-025 Tsd - ltlt Loss (gain) on sales of property plant and equipment gtgt (ltlt 2017 gtgt q_act_jan)13000 Tsd - ltlt Loss (gain) on sales of financial assets gtgt (ltlt 2017 gtgt q_act_jan)13497 Tsd - ltlt Expenses for share-based compensation plans gtgt (ltlt 2017 gtgt q_act_jan)13238 Tsd - ltlt Other non-cash (income) and expenses gtgt (ltlt 2017 gtgt q_act_jan)132351 Tsd - ltlt Income tax expenses gtgt (ltlt 2017 gtgt q_act_jan)13---------------------135910 Tsd (Total) | PAC Hamon Pierrick Referenced Value (value_1_PQACTJAN02)1313Document Q3_2017_Quarter_Report13Chapter Consolidated Statement of Cash Flows1313-7973 Tsd - ltlt (Increase) decrease receivables other current assets and unbilled forwarding services gtgt (ltlt 2017 gtgt q_act_jan)134406 Tsd - ltlt Increase (decrease) payables and accruals incl accrued cost of service gtgt (ltlt 2017 gtgt q_act_jan)13-472 Tsd - ltlt Increase (decrease) non-current provisions and other liabilities gtgt (ltlt 2017 gtgt q_act_jan)13-749 Tsd - ltlt Increase (decrease) current provisions and other liabilities gtgt (ltlt 2017 gtgt q_act_jan)13---------------------13-4787 Tsd (Total) | PAC Hamon Pierrick Referenced Value (value_1_PQACTJAN02)1313Document Q3_2017_Quarter_Report13Chapter Consolidated Statement of Cash Flows1313-136 Tsd - ltlt Interest paid gtgt (ltlt 2017 gtgt q_act_jan)13-3175 Tsd - ltlt Income taxes paid gtgt (ltlt 2017 gtgt q_act_jan)13---------------------13-3311 Tsd (Total) | Reported cash and cash equivalents at 30092017 | 2946 | 3888 | ||||||||||||||||||||||||||||||||||
| 484 | ||||||||||||||||||||||||||||||||||||||||||||||||||||||||
| 591 | ||||||||||||||||||||||||||||||||||||||||||||||||||||||||
| (479) | ||||||||||||||||||||||||||||||||||||||||||||||||||||||||
| (331) | ||||||||||||||||||||||||||||||||||||||||||||||||||||||||
| (406) | ||||||||||||||||||||||||||||||||||||||||||||||||||||||||
| (894) | ||||||||||||||||||||||||||||||||||||||||||||||||||||||||
| 93 | ||||||||||||||||||||||||||||||||||||||||||||||||||||||||
| 2946 |
| 31-Dec-16 | 30-Sept-17 | Change in | ||||||||||||||||||||||||||||||||||||||||||||||||||||||||
| CHF | ||||||||||||||||||||||||||||||||||||||||||||||||||||||||||
| Cash and cash equivalents | 3888 | 2946 | (942) | -24 | r3 PAC Hamon Pierrick Referenced Value (value_1_PQACTJAN02)1313Document Q3_2017_Quarter_Report13Chapter Consolidated Statement of Financial Position13Row ltlt Cash and cash equivalents gtgt (ltlt September 30 2017 gtgt q_act_jan)13User Value 29463 Tsd | 3888 | 3999 | 111 | 3 | |||||||||||||||||||||||||||||||||||||||||||||||||
| Trade receivables unbilled forwarding services | 9087 | 9893 | 806 | 9 | r4 PAC Hamon Pierrick Referenced Value (value_1_PQACTJAN02)1313Document Q3_2017_Quarter_Report13Chapter Consolidated Statement of Financial Position13Row ltlt Trade receivables unbilled forwarding services gtgt (ltlt September 30 2017 gtgt q_act_jan)13User Value 98929 Tsd | 9087 | 8693 | -394 | -4 | |||||||||||||||||||||||||||||||||||||||||||||||||
| Other current assets | 1025 | 1167 | 142 | 14 | r5 PAC Hamon Pierrick Referenced Value (value_1_PQACTJAN02)1313Document Q3_2017_Quarter_Report13Chapter Consolidated Statement of Financial Position13Row ltlt Other current assets gtgt (ltlt September 30 2017 gtgt q_act_jan)13User Value 11671 Tsd | 1025 | 1335 | 31 | 30 | |||||||||||||||||||||||||||||||||||||||||||||||||
| Property plant and equipment | 635 | 803 | 168 | 26 | r6 PAC Hamon Pierrick Referenced Value (value_1_PQACTJAN02)1313Document Q3_2017_Quarter_Report13Chapter Consolidated Statement of Financial Position13Row ltlt Property plant and equipment gtgt (ltlt September 30 2017 gtgt q_act_jan)13User Value 8028 Tsd | 635 | 651 | 16 | 3 | |||||||||||||||||||||||||||||||||||||||||||||||||
| Intangible assets | 979 | 917 | (62) | -6 | r7 PAC Hamon Pierrick Referenced Value (value_1_PQACTJAN02)1313Document Q3_2017_Quarter_Report13Chapter Consolidated Statement of Financial Position13Row ltlt Intangible assets gtgt (ltlt September 30 2017 gtgt q_act_jan)13User Value 9168 Tsd | 979 | 926 | -53 | -5 | |||||||||||||||||||||||||||||||||||||||||||||||||
| Other non-current assets | 990 | 1133 | 143 | 14 | r8 PAC Hamon Pierrick Referenced Value (value_1_PQACTJAN02)1313Document Q3_2017_Quarter_Report13Chapter Consolidated Statement of Financial Position13Row ltlt Other non-current assets gtgt (ltlt September 30 2017 gtgt q_act_jan)13User Value 11586 Tsd | 99 | 1073 | 83 | 8 | |||||||||||||||||||||||||||||||||||||||||||||||||
| Total assets | 16606 | 16859 | 253 | 2 | r9 PAC Hamon Pierrick Referenced Value (value_1_PQACTJAN02)1313Document Q3_2017_Quarter_Report13Chapter Consolidated Statement of Financial Position13Row ltlt Total assets gtgt (ltlt September 30 2017 gtgt q_act_jan)13User Value 168844 Tsd | 166060 | 166780 | 72 | 0 | |||||||||||||||||||||||||||||||||||||||||||||||||
| 0 | ||||||||||||||||||||||||||||||||||||||||||||||||||||||||||
| Short-term borrowings | 23 | 21 | (02) | -10 | r11 PAC Hamon Pierrick Referenced Value (value_1_PQACTJAN02)1313Document Q3_2017_Quarter_Report13Chapter Consolidated Statement of Financial Position13Row ltlt Short-term borrowings gtgt (ltlt September 30 2017 gtgt q_act_jan)13User Value 208 Tsd | 23 | 05 | -18 | -78 | |||||||||||||||||||||||||||||||||||||||||||||||||
| Trade payables accured cost of services | 6524 | 7075 | 551 | 8 | r12 PAC Hamon Pierrick Referenced Value (value_1_PQACTJAN02)1313Document Q3_2017_Quarter_Report13Chapter Consolidated Statement of Financial Position13Row ltlt Trade payables accured cost of services gtgt (ltlt September 30 2017 gtgt q_act_jan)13User Value 70745 Tsd | 6524 | 620 | -324 | -5 | |||||||||||||||||||||||||||||||||||||||||||||||||
| Other current liabilities | 2439 | 2254 | (185) | -8 | r13 PAC Hamon Pierrick Referenced Value (value_1_PQACTJAN02)1313Document Q3_2017_Quarter_Report13Chapter Consolidated Statement of Financial Position13Row ltlt Other current liabilities gtgt (ltlt September 30 2017 gtgt q_act_jan)13User Value 22538 Tsd | 2439 | 2592 | 153 | 6 | |||||||||||||||||||||||||||||||||||||||||||||||||
| Long-Term borrowings | 00 | 20 | 20 | na | r20 PAC Hamon Pierrick Referenced Value (value_1_PQACTJAN02)1313Document Q3_2017_Quarter_Report13Chapter Consolidated Statement of Financial Position13Row ltlt Long-term borrowings gtgt (ltlt September 30 2017 gtgt q_act_jan)13User Value 197 Tsd | 0 | 12 | 12 | na | |||||||||||||||||||||||||||||||||||||||||||||||||
| Other long-term liabilities | 1449 | 1527 | 78 | 5 | r21 PAC Hamon Pierrick Referenced Value (value_1_PQACTJAN02)1313Document Q3_2017_Quarter_Report13Chapter Consolidated Statement of Financial Position13Row ltlt Other long-term liabilities gtgt (ltlt September 30 2017 gtgt q_act_jan)13User Value 15270 Tsd | 1449 | 1479 | 3 | 2 | |||||||||||||||||||||||||||||||||||||||||||||||||
| Total liabilities | 10436 | 10896 | 460 | 4 | r14 PAC Hamon Pierrick Referenced Value (value_1_PQACTJAN02)1313Document Q3_2017_Quarter_Report13Chapter Consolidated Statement of Financial Position13Row ltlt Total liabilities gtgt (ltlt September 30 2017 gtgt q_act_jan)13User Value 108956 Tsd | 104360 | 102880 | -148 | -1 | |||||||||||||||||||||||||||||||||||||||||||||||||
| Share capital | 24 | 24 | (00) | -1 | r15 PAC Hamon Pierrick Referenced Value (value_1_PQACTJAN02)1313Document Q3_2017_Quarter_Report13Chapter Consolidated Statement of Financial Position13Row ltlt Share capital gtgt (ltlt September 30 2017 gtgt q_act_jan)13User Value 238 Tsd | 24 | 24 | 0 | 0 | |||||||||||||||||||||||||||||||||||||||||||||||||
| Reserves treasury shares | 6057 | 5884 | (173) | -3 | r16 PAC Hamon Pierrick Referenced Value (value_1_PQACTJAN02)1313Document Q3_2017_Quarter_Report13Chapter Consolidated Statement of Financial Position13Row ltlt Reserves treasury shares gtgt (ltlt September 30 2017 gtgt q_act_jan)13User Value 59100 Tsd | 6057 | 6285 | 228 | 4 | |||||||||||||||||||||||||||||||||||||||||||||||||
| Non-controlling interests | 89 | 55 | (34) | -38 | r17 PAC Hamon Pierrick Referenced Value (value_1_PQACTJAN02)1313Document Q3_2017_Quarter_Report13Chapter Consolidated Statement of Financial Position13Row ltlt Non-controlling interests gtgt (ltlt September 30 2017 gtgt q_act_jan)13User Value 550 Tsd | 89 | 81 | -08 | -9 | |||||||||||||||||||||||||||||||||||||||||||||||||
| Total equity | 6170 | 5963 | (207) | -3 | r18 PAC Hamon Pierrick Referenced Value (value_1_PQACTJAN02)1313Document Q3_2017_Quarter_Report13Chapter Consolidated Statement of Financial Position13Row ltlt Total equity gtgt (ltlt September 30 2017 gtgt q_act_jan)13User Value 59887 Tsd | 617 | 639 | 22 | 4 | |||||||||||||||||||||||||||||||||||||||||||||||||
| Total equity and liabilities | 16606 | 16859 | 253 | 2 | r19 PAC Hamon Pierrick Referenced Value (value_1_PQACTJAN02)1313Document Q3_2017_Quarter_Report13Chapter Consolidated Statement of Financial Position13Row ltlt Total equity and liabilities gtgt (ltlt September 30 2017 gtgt q_act_jan)13User Value 168844 Tsd | 166060 | 166780 | 72 | 0 | |||||||||||||||||||||||||||||||||||||||||||||||||
| KPIs | 31-Dec-16 | 30-Jun-17 | ||||||||||||||||||||||||||||||||||||||||||||||||||||||||
| Equity Ratio | 372 | 354 | s20 PAC Hamon Pierrick Referenced Value (value_1_PQACTJAN02)1313Document Q2_2017_Quarter_Report13Chapter Consolidated Statement of Financial Position13Row ltlt Total equity and liabilities gtgt (ltlt June 30 2017 gtgt q_act_jan)13User Value 153472 Tsd | |||||||||||||||||||||||||||||||||||||||||||||||||||||||
PAC Hamon Pierrick Referenced Value (value_1_PQACTJAN02)1313Document Q3_2017_Quarter_Report13Chapter Consolidated Statement of Financial Position13Row ltlt Cash and cash equivalents gtgt (ltlt September 30 2017 gtgt q_act_jan)13User Value 29463 Tsd | PAC Hamon Pierrick Referenced Value (value_1_PQACTJAN02)1313Document Q3_2017_Quarter_Report13Chapter Consolidated Statement of Financial Position13Row ltlt Trade receivables unbilled forwarding services gtgt (ltlt September 30 2017 gtgt q_act_jan)13User Value 98929 Tsd | PAC Hamon Pierrick Referenced Value (value_1_PQACTJAN02)1313Document Q3_2017_Quarter_Report13Chapter Consolidated Statement of Financial Position13Row ltlt Other current assets gtgt (ltlt September 30 2017 gtgt q_act_jan)13User Value 11671 Tsd | PAC Hamon Pierrick Referenced Value (value_1_PQACTJAN02)1313Document Q3_2017_Quarter_Report13Chapter Consolidated Statement of Financial Position13Row ltlt Property plant and equipment gtgt (ltlt September 30 2017 gtgt q_act_jan)13User Value 8028 Tsd | PAC Hamon Pierrick Referenced Value (value_1_PQACTJAN02)1313Document Q3_2017_Quarter_Report13Chapter Consolidated Statement of Financial Position13Row ltlt Intangible assets gtgt (ltlt September 30 2017 gtgt q_act_jan)13User Value 9168 Tsd | PAC Hamon Pierrick Referenced Value (value_1_PQACTJAN02)1313Document Q3_2017_Quarter_Report13Chapter Consolidated Statement of Financial Position13Row ltlt Other non-current assets gtgt (ltlt September 30 2017 gtgt q_act_jan)13User Value 11586 Tsd | PAC Hamon Pierrick Referenced Value (value_1_PQACTJAN02)1313Document Q3_2017_Quarter_Report13Chapter Consolidated Statement of Financial Position13Row ltlt Total assets gtgt (ltlt September 30 2017 gtgt q_act_jan)13User Value 168844 Tsd | PAC Hamon Pierrick Referenced Value (value_1_PQACTJAN02)1313Document Q3_2017_Quarter_Report13Chapter Consolidated Statement of Financial Position13Row ltlt Short-term borrowings gtgt (ltlt September 30 2017 gtgt q_act_jan)13User Value 208 Tsd | PAC Hamon Pierrick Referenced Value (value_1_PQACTJAN02)1313Document Q3_2017_Quarter_Report13Chapter Consolidated Statement of Financial Position13Row ltlt Trade payables accured cost of services gtgt (ltlt September 30 2017 gtgt q_act_jan)13User Value 70745 Tsd | PAC Hamon Pierrick Referenced Value (value_1_PQACTJAN02)1313Document Q3_2017_Quarter_Report13Chapter Consolidated Statement of Financial Position13Row ltlt Other current liabilities gtgt (ltlt September 30 2017 gtgt q_act_jan)13User Value 22538 Tsd | PAC Hamon Pierrick Referenced Value (value_1_PQACTJAN02)1313Document Q3_2017_Quarter_Report13Chapter Consolidated Statement of Financial Position13Row ltlt Long-term borrowings gtgt (ltlt September 30 2017 gtgt q_act_jan)13User Value 197 Tsd | PAC Hamon Pierrick Referenced Value (value_1_PQACTJAN02)1313Document Q3_2017_Quarter_Report13Chapter Consolidated Statement of Financial Position13Row ltlt Other long-term liabilities gtgt (ltlt September 30 2017 gtgt q_act_jan)13User Value 15270 Tsd | PAC Hamon Pierrick Referenced Value (value_1_PQACTJAN02)1313Document Q3_2017_Quarter_Report13Chapter Consolidated Statement of Financial Position13Row ltlt Total liabilities gtgt (ltlt September 30 2017 gtgt q_act_jan)13User Value 108956 Tsd | PAC Hamon Pierrick Referenced Value (value_1_PQACTJAN02)1313Document Q3_2017_Quarter_Report13Chapter Consolidated Statement of Financial Position13Row ltlt Share capital gtgt (ltlt September 30 2017 gtgt q_act_jan)13User Value 238 Tsd | PAC Hamon Pierrick Referenced Value (value_1_PQACTJAN02)1313Document Q3_2017_Quarter_Report13Chapter Consolidated Statement of Financial Position13Row ltlt Reserves treasury shares gtgt (ltlt September 30 2017 gtgt q_act_jan)13User Value 59100 Tsd | PAC Hamon Pierrick Referenced Value (value_1_PQACTJAN02)1313Document Q3_2017_Quarter_Report13Chapter Consolidated Statement of Financial Position13Row ltlt Non-controlling interests gtgt (ltlt September 30 2017 gtgt q_act_jan)13User Value 550 Tsd | PAC Hamon Pierrick Referenced Value (value_1_PQACTJAN02)1313Document Q3_2017_Quarter_Report13Chapter Consolidated Statement of Financial Position13Row ltlt Total equity gtgt (ltlt September 30 2017 gtgt q_act_jan)13User Value 59887 Tsd | PAC Hamon Pierrick Referenced Value (value_1_PQACTJAN02)1313Document Q3_2017_Quarter_Report13Chapter Consolidated Statement of Financial Position13Row ltlt Total equity and liabilities gtgt (ltlt September 30 2017 gtgt q_act_jan)13User Value 168844 Tsd | NWC-Intensity | 18 | 13 | mf24 | |||||||||||||||||||||||||||||||||||||
| DSO 3-m-rolling YTD | 455 | 467 | m22 | |||||||||||||||||||||||||||||||||||||||||||||||||||||||
| DPO 3-m-rolling YTD | 407 | 397 | m23 |
| 2017 | 2016 | |||||||||||||||||||||||||||||||||||||||||||||||||||||||||||||||||||
| Logistics | Q1 2016 | Q2 2016 | HY 2016 | Q3 2016 | Q3YTD 2016 | Q4 2016 | FY 2016 | Q1 2017 | Q2 2017 | HY 2017 | Q3 2017 | Q3YTD 2017 | ||||||||||||||||||||||||||||||||||||||||||||||||||||||||
| Net forwarding revenue | 1402 | 1613 | 3015 | 1374 | 4389 | 1321 | 5709 | 1286 | 1377 | 2663 | 1394 | 4057 | m4 | m4 | r4 PAC Hamon Pierrick Referenced Value (value_1_PQACT02)1313Document Q3_2017_Quarter_Report13Chapter Products quater and year to date13Row ltlt Net forwarding revenue gtgt (ltlt value_3 gtgt q_act)13User Value 13945 Tsd | r4 PAC Hamon Pierrick Referenced Value (value_1_PQACTJAN02)1313Document Q3_2017_Quarter_Report13Chapter Products quater and year to date13Row ltlt Net forwarding revenue gtgt (ltlt value_3 gtgt q_act_jan)13User Value 40573 Tsd | -00 | 00 | (01) | |||||||||||||||||||||||||||||||||||||||||||||||||
| Forwarding expenses | (420) | (607) | (1027) | (429) | (1456) | (397) | (1853) | (460) | (564) | (1024) | (580) | (1604) | m5 | m5 | r5 PAC Hamon Pierrick Referenced Value (value_1_PQACT02)1313Document Q3_2017_Quarter_Report13Chapter Products quater and year to date13Row ltlt Forwarding services from third parties gtgt (ltlt value_3 gtgt q_act)13User Value -5796 Tsd | r5 PAC Hamon Pierrick Referenced Value (value_1_PQACTJAN02)1313Document Q3_2017_Quarter_Report13Chapter Products quater and year to date13Row ltlt Forwarding services from third parties gtgt (ltlt value_3 gtgt q_act_jan)13User Value -16035 Tsd | -00 | 00 | 00 | |||||||||||||||||||||||||||||||||||||||||||||||||
| Gross profit | 982 | 1006 | 1989 | 944 | 2933 | 924 | 3857 | 825 | 813 | 1639 | 815 | 2454 | m6 | m6 | r6 PAC Hamon Pierrick Referenced Value (value_1_PQACT02)1313Document Q3_2017_Quarter_Report13Chapter Products quater and year to date13Row ltlt Gross profit gtgt (ltlt value_3 gtgt q_act)13User Value 8148 Tsd | r6 PAC Hamon Pierrick Referenced Value (value_1_PQACTJAN02)1313Document Q3_2017_Quarter_Report13Chapter Products quater and year to date13Row ltlt Gross profit gtgt (ltlt value_3 gtgt q_act_jan)13User Value 24537 Tsd | 00 | 01 | 01 | |||||||||||||||||||||||||||||||||||||||||||||||||
| Personnel expenses | (574) | (591) | (1166) | (528) | (1694) | (519) | (2213) | (479) | (461) | (940) | (469) | (1409) | m7 | m7 | r7 PAC Hamon Pierrick Referenced Value (value_1_PQACT02)1313Document Q3_2017_Quarter_Report13Chapter Products quater and year to date13Row ltlt Personnel expenses gtgt (ltlt value_3 gtgt q_act)13User Value -4692 Tsd | r7 PAC Hamon Pierrick Referenced Value (value_1_PQACTJAN02)1313Document Q3_2017_Quarter_Report13Chapter Products quater and year to date13Row ltlt Personnel expenses gtgt (ltlt value_3 gtgt q_act_jan)13User Value -14091 Tsd | -00 | (01) | (01) | |||||||||||||||||||||||||||||||||||||||||||||||||
| Other operating expenses | (360) | (363) | (723) | (378) | (1102) | (367) | (1469) | (298) | (298) | (596) | (298) | (894) | m8 | m8 | r8 PAC Hamon Pierrick Referenced Value (value_1_PQACT02)1313Document Q3_2017_Quarter_Report13Chapter Products quater and year to date13Row ltlt Other operating expenses gtgt (ltlt value_3 gtgt q_act)13User Value -2977 Tsd | r8 PAC Hamon Pierrick Referenced Value (value_1_PQACTJAN02)1313Document Q3_2017_Quarter_Report13Chapter Products quater and year to date13Row ltlt Other operating expenses gtgt (ltlt value_3 gtgt q_act_jan)13User Value -8940 Tsd | 00 | 00 | (01) | |||||||||||||||||||||||||||||||||||||||||||||||||
| EBITDA adjusted | 48 | 52 | 100 | 38 | 138 | 37 | 175 | 48 | 54 | 103 | 48 | 151 | m9 | m9 | r9 PAC Hamon Pierrick Referenced Value (value_1_PQACT02)1313Document Q3_2017_Quarter_Report13Chapter Products quater and year to date13Row ltlt EBITDA gtgt (ltlt value_3 gtgt q_act)13User Value 479 Tsd | r9 PAC Hamon Pierrick Referenced Value (value_1_PQACTJAN02)1313Document Q3_2017_Quarter_Report13Chapter Products quater and year to date13Row ltlt EBITDA gtgt (ltlt value_3 gtgt q_act_jan)13User Value 1506 Tsd | 00 | 00 | 00 | |||||||||||||||||||||||||||||||||||||||||||||||||
| Depreciation and amortization | (29) | (29) | (58) | (29) | (88) | (32) | (119) | (25) | (24) | (48) | (21) | (69) | m10 | m10 | r10 PAC Hamon Pierrick Referenced Value (value_1_PQACT02)1313Document Q3_2017_Quarter_Report13Chapter Products quater and year to date13Row ltlt Depreciation and amortization gtgt (ltlt value_3 gtgt q_act)13User Value -208 Tsd | r10 PAC Hamon Pierrick Referenced Value (value_1_PQACTJAN02)1313Document Q3_2017_Quarter_Report13Chapter Products quater and year to date13Row ltlt Depreciation and amortization gtgt (ltlt value_3 gtgt q_act_jan)13User Value -692 Tsd | 00 | 00 | 00 | |||||||||||||||||||||||||||||||||||||||||||||||||
| EBIT adjusted | 18 | 23 | 41 | 09 | 50 | 05 | 56 | 24 | 31 | 54 | 27 | 81 | m11 | m11 | r11 PAC Hamon Pierrick Referenced Value (value_1_PQACT02)1313Document Q3_2017_Quarter_Report13Chapter Products quater and year to date13Row ltlt Operating result (EBIT) gtgt (ltlt value_3 gtgt q_act)13User Value 271 Tsd | r11 PAC Hamon Pierrick Referenced Value (value_1_PQACTJAN02)1313Document Q3_2017_Quarter_Report13Chapter Products quater and year to date13Row ltlt Operating result (EBIT) gtgt (ltlt value_3 gtgt q_act_jan)13User Value 815 Tsd | -00 | 00 | 01 | |||||||||||||||||||||||||||||||||||||||||||||||||
| Non-recurring items | ||||||||||||||||||||||||||||||||||||||||||||||||||||||||||||||||||||
| Restructuring expenses | 00 | (38) | (38) | 00 | (38) | 00 | (38) | 00 | 00 | 00 | 00 | 00 | m13 | m13 | m13 | m13 | 00 | 00 | 00 | |||||||||||||||||||||||||||||||||||||||||||||||||
| EBIT reported | 18 | (15) | 03 | 09 | 12 | 05 | 18 | 24 | 31 | 54 | 27 | 81 | m15 | m15 | r15 PAC Hamon Pierrick Referenced Value (value_1_PQACT02)1313Document Q3_2017_Quarter_Report13Chapter Products quater and year to date13Row ltlt Operating result (EBIT) gtgt (ltlt value_3 gtgt q_act)13User Value 271 Tsd | r15 PAC Hamon Pierrick Referenced Value (value_1_PQACTJAN02)1313Document Q3_2017_Quarter_Report13Chapter Products quater and year to date13Row ltlt Operating result (EBIT) gtgt (ltlt value_3 gtgt q_act_jan)13User Value 815 Tsd | ||||||||||||||||||||||||||||||||||||||||||||||||||||
PAC Hamon Pierrick Referenced Value (value_1_PQACT02)1313Document Q3_2017_Quarter_Report13Chapter Products quater and year to date13Row ltlt Net forwarding revenue gtgt (ltlt value_3 gtgt q_act)13User Value 13945 Tsd | PAC Hamon Pierrick Referenced Value (value_1_PQACTJAN02)1313Document Q3_2017_Quarter_Report13Chapter Products quater and year to date13Row ltlt Net forwarding revenue gtgt (ltlt value_3 gtgt q_act_jan)13User Value 40573 Tsd | PAC Hamon Pierrick Referenced Value (value_1_PQACT02)1313Document Q3_2017_Quarter_Report13Chapter Products quater and year to date13Row ltlt Forwarding services from third parties gtgt (ltlt value_3 gtgt q_act)13User Value -5796 Tsd | GP Change YoY | -19 | -18 | -14 | -16 | s16 | s16 | |||||||||||||||||||||||||||||||||||||||||||||||||||||||||||
| 2017 | 2016 | ||||||||||||||||||||||||||||||||||||||||||||||||||||||||||
| Ocean Freight | Q1 2016 | Q2 2016 | HY 2016 | Q3 2016 | Q3YTD 2016 | Q4 2016 | FY 2016 | Q1 2017 | Q2 2017 | HY 2017 | Q3 2017 | Q3YTD 2017 | |||||||||||||||||||||||||||||||||||||||||||||||
| Net forwarding revenue | 5338 | 4921 | 10259 | 4955 | 15214 | 4770 | 19984 | 4915 | 5172 | 10087 | 5551 | 15637 | m4 | m4 | r4 PAC Hamon Pierrick Referenced Value (value_1_PQACT02)1313Document Q3_2017_Quarter_Report13Chapter Products quater and year to date13Row ltlt Net forwarding revenue gtgt (ltlt value_2 gtgt q_act)13User Value 55506 Tsd | r4 PAC Hamon Pierrick Referenced Value (value_1_PQACTJAN02)1313Document Q3_2017_Quarter_Report13Chapter Products quater and year to date13Row ltlt Net forwarding revenue gtgt (ltlt value_2 gtgt q_act_jan)13User Value 156375 Tsd | 00 | 00 | 00 | ||||||||||||||||||||||||||||||||||||||||
| Forwarding expenses | (4157) | (3773) | (7930) | (3834) | (11764) | (3783) | (15547) | (3860) | (4081) | (7941) | (4463) | (12404) | m5 | m5 | r5 PAC Hamon Pierrick Referenced Value (value_1_PQACT02)1313Document Q3_2017_Quarter_Report13Chapter Products quater and year to date13Row ltlt Forwarding services from third parties gtgt (ltlt value_2 gtgt q_act)13User Value -44629 Tsd | r5 PAC Hamon Pierrick Referenced Value (value_1_PQACTJAN02)1313Document Q3_2017_Quarter_Report13Chapter Products quater and year to date13Row ltlt Forwarding services from third parties gtgt (ltlt value_2 gtgt q_act_jan)13User Value -124038 Tsd | -00 | 00 | 00 | ||||||||||||||||||||||||||||||||||||||||
| Gross profit | 1181 | 1148 | 2329 | 1121 | 3450 | 987 | 4438 | 1055 | 1091 | 2146 | 1088 | 3234 | m6 | m6 | r6 PAC Hamon Pierrick Referenced Value (value_1_PQACT02)1313Document Q3_2017_Quarter_Report13Chapter Products quater and year to date13Row ltlt Gross profit gtgt (ltlt value_2 gtgt q_act)13User Value 10877 Tsd | r6 PAC Hamon Pierrick Referenced Value (value_1_PQACTJAN02)1313Document Q3_2017_Quarter_Report13Chapter Products quater and year to date13Row ltlt Gross profit gtgt (ltlt value_2 gtgt q_act_jan)13User Value 32337 Tsd | 00 | 00 | 01 | ||||||||||||||||||||||||||||||||||||||||
| Personnel expenses | (791) | (752) | (1543) | (755) | (2298) | (721) | (3019) | (779) | (784) | (1564) | (788) | (2352) | m7 | m7 | r7 PAC Hamon Pierrick Referenced Value (value_1_PQACT02)1313Document Q3_2017_Quarter_Report13Chapter Products quater and year to date13Row ltlt Personnel expenses gtgt (ltlt value_2 gtgt q_act)13User Value -7884 Tsd | r7 PAC Hamon Pierrick Referenced Value (value_1_PQACTJAN02)1313Document Q3_2017_Quarter_Report13Chapter Products quater and year to date13Row ltlt Personnel expenses gtgt (ltlt value_2 gtgt q_act_jan)13User Value -23522 Tsd | -00 | 00 | 00 | ||||||||||||||||||||||||||||||||||||||||
| Other operating expenses | (305) | (288) | (594) | (274) | (868) | (275) | (1144) | (271) | (265) | (536) | (290) | (827) | m8 | m8 | r8 PAC Hamon Pierrick Referenced Value (value_1_PQACT02)1313Document Q3_2017_Quarter_Report13Chapter Products quater and year to date13Row ltlt Other operating expenses gtgt (ltlt value_2 gtgt q_act)13User Value -2905 Tsd | r8 PAC Hamon Pierrick Referenced Value (value_1_PQACTJAN02)1313Document Q3_2017_Quarter_Report13Chapter Products quater and year to date13Row ltlt Other operating expenses gtgt (ltlt value_2 gtgt q_act_jan)13User Value -8265 Tsd | -00 | (01) | (02) | ||||||||||||||||||||||||||||||||||||||||
| EBITDA adjusted | 84 | 108 | 192 | 92 | 284 | (09) | 275 | 05 | 41 | 46 | 09 | 55 | m9 | m9 | r9 PAC Hamon Pierrick Referenced Value (value_1_PQACT02)1313Document Q3_2017_Quarter_Report13Chapter Products quater and year to date13Row ltlt EBITDA gtgt (ltlt value_2 gtgt q_act)13User Value 089 Tsd | r9 PAC Hamon Pierrick Referenced Value (value_1_PQACTJAN02)1313Document Q3_2017_Quarter_Report13Chapter Products quater and year to date13Row ltlt EBITDA gtgt (ltlt value_2 gtgt q_act_jan)13User Value 550 Tsd | -00 | 00 | 00 | ||||||||||||||||||||||||||||||||||||||||
| Depreciation and amortization | (41) | (42) | (83) | (41) | (124) | (42) | (166) | (36) | (36) | (72) | (38) | (110) | m10 | m10 | r10 PAC Hamon Pierrick Referenced Value (value_1_PQACT02)1313Document Q3_2017_Quarter_Report13Chapter Products quater and year to date13Row ltlt Depreciation and amortization gtgt (ltlt value_2 gtgt q_act)13User Value -384 Tsd | r10 PAC Hamon Pierrick Referenced Value (value_1_PQACTJAN02)1313Document Q3_2017_Quarter_Report13Chapter Products quater and year to date13Row ltlt Depreciation and amortization gtgt (ltlt value_2 gtgt q_act_jan)13User Value -1102 Tsd | -00 | 00 | 00 | ||||||||||||||||||||||||||||||||||||||||
| EBIT adjusted | 43 | 66 | 109 | 51 | 160 | (51) | 109 | (32) | 06 | (26) | (29) | (55) | m11 | m11 | r11 PAC Hamon Pierrick Referenced Value (value_1_PQACT02)1313Document Q3_2017_Quarter_Report13Chapter Products quater and year to date13Row ltlt Operating result (EBIT) gtgt (ltlt value_2 gtgt q_act)13User Value -295 Tsd | r11 PAC Hamon Pierrick Referenced Value (value_1_PQACTJAN02)1313Document Q3_2017_Quarter_Report13Chapter Products quater and year to date13Row ltlt Operating result (EBIT) gtgt (ltlt value_2 gtgt q_act_jan)13User Value -552 Tsd | 00 | 00 | 00 | ||||||||||||||||||||||||||||||||||||||||
| in of gross profit | 37 | 58 | 47 | 45 | 46 | -51 | 25 | -30 | 05 | -12 | -27 | -17 | m12 | m12 | s12 | s12 | |||||||||||||||||||||||||||||||||||||||||||
| Non-recurring items | 00 | 00 | 00 | ||||||||||||||||||||||||||||||||||||||||||||||||||||||||
| Restructuring expenses | 00 | (97) | (97) | 0 | (97) | (19) | (115) | 00 | 00 | 00 | 00 | 00 | m14 | m14 | m14 | m14 | 00 | 00 | 01 | ||||||||||||||||||||||||||||||||||||||||
| EBIT reported | 43 | (30) | 13 | 51 | 63 | (69) | (06) | (32) | 06 | (26) | (29) | (55) | m16 | m16 | r16 PAC Hamon Pierrick Referenced Value (value_1_PQACT02)1313Document Q3_2017_Quarter_Report13Chapter Products quater and year to date13Row ltlt Operating result (EBIT) gtgt (ltlt value_2 gtgt q_act)13User Value -295 Tsd | r16 PAC Hamon Pierrick Referenced Value (value_1_PQACTJAN02)1313Document Q3_2017_Quarter_Report13Chapter Products quater and year to date13Row ltlt Operating result (EBIT) gtgt (ltlt value_2 gtgt q_act_jan)13User Value -552 Tsd | PAC Hamon Pierrick Referenced Value (value_1_PQACT02)1313Document Q3_2017_Quarter_Report13Chapter Products quater and year to date13Row ltlt Net forwarding revenue gtgt (ltlt value_2 gtgt q_act)13User Value 55506 Tsd | PAC Hamon Pierrick Referenced Value (value_1_PQACTJAN02)1313Document Q3_2017_Quarter_Report13Chapter Products quater and year to date13Row ltlt Net forwarding revenue gtgt (ltlt value_2 gtgt q_act_jan)13User Value 156375 Tsd | PAC Hamon Pierrick Referenced Value (value_1_PQACT02)1313Document Q3_2017_Quarter_Report13Chapter Products quater and year to date13Row ltlt Forwarding services from third parties gtgt (ltlt value_2 gtgt q_act)13User Value -44629 Tsd | 00 | 00 | (01) | |||||||||||||||||||||||||||||||||||||
| in of gross profit | 37 | -26 | 05 | 45 | 18 | -70 | -01 | -30 | 05 | -12 | -27 | -17 | m17 | m17 | s17 | s17 | |||||||||||||||||||||||||||||||||||||||||||
| Ocean Freight volumes (000 tons) | 3482 | 3726 | 7208 | 3787 | 10995 | 3890 | 14885 | 3742 | 3828 | 7570 | 3856 | 11426 | m19 | m19 | m19 | m19 | 00 | 00 | 00 | ||||||||||||||||||||||||||||||||||||||||
| change YoY | -100 | -82 | -91 | -88 | -90 | 08 | -66 | 75 | 27 | 50 | 18 | 39 | m20 | m20 | s20 | s20 | |||||||||||||||||||||||||||||||||||||||||||
| GPTEU (CHF) | 339 | 308 | 323 | 296 | 314 | 254 | 298 | 282 | 285 | 283 | 282 | 283 | m21 | m21 | s21 | s21 | |||||||||||||||||||||||||||||||||||||||||||
| change YoY | 102 | 59 | 80 | -16 | 47 | -176 | -11 | -169 | -75 | -122 | -47 | -98 | m22 | m22 | s22 | s22 | |||||||||||||||||||||||||||||||||||||||||||
| GP change YoY | -5 | -8 | -3 | -6 | s23 | s23 | |||||||||||||||||||||||||||||||||||||||||||||||||||||
| 2017 | 2016 | ||||||||||||||||||||||||||||||||||||||||||||||||||||||||||
| Air Freight | Q1 2016 | Q2 2016 | HY 2016 | Q3 2016 | Q3YTD 2016 | Q4 2016 | FY 2016 | Q1 2017 | Q2 2017 | HY 2017 | Q3 2017 | Q3 YTD 2017 | |||||||||||||||||||||||||||||||||||||||||||||||
| Net forwarding revenue | 6332 | 6359 | 12691 | 6341 | 19032 | 7234 | 26267 | 6571 | 7000 | 13571 | 7389 | 20960 | m4 | m4 | r4 PAC Hamon Pierrick Referenced Value (value_1_PQACT02)1313Document Q3_2017_Quarter_Report13Chapter Products quater and year to date13Row ltlt Net forwarding revenue gtgt (ltlt value_1 gtgt q_act)13User Value 73890 Tsd | r4 PAC Hamon Pierrick Referenced Value (value_1_PQACTJAN02)1313Document Q3_2017_Quarter_Report13Chapter Products quater and year to date13Row ltlt Net forwarding revenue gtgt (ltlt value_1 gtgt q_act_jan)13User Value 209603 Tsd | 00 | 00 | 006009999999958 | ||||||||||||||||||||||||||||||||||||||||
| Forwarding expenses | (4846) | (4800) | (9646) | (4853) | (14499) | (5816) | (20315) | (5125) | (5500) | (10625) | (5775) | (16400) | m5 | m5 | r5 PAC Hamon Pierrick Referenced Value (value_1_PQACT02)1313Document Q3_2017_Quarter_Report13Chapter Products quater and year to date13Row ltlt Forwarding services from third parties gtgt (ltlt value_1 gtgt q_act)13User Value -57751 Tsd | r5 PAC Hamon Pierrick Referenced Value (value_1_PQACTJAN02)1313Document Q3_2017_Quarter_Report13Chapter Products quater and year to date13Row ltlt Forwarding services from third parties gtgt (ltlt value_1 gtgt q_act_jan)13User Value -164000 Tsd | 00 | 00 | 00 | ||||||||||||||||||||||||||||||||||||||||
| Gross profit | 1486 | 1559 | 3045 | 1489 | 4534 | 1418 | 5952 | 1447 | 1500 | 2946 | 1614 | 4560 | m6 | m6 | r6 PAC Hamon Pierrick Referenced Value (value_1_PQACT02)1313Document Q3_2017_Quarter_Report13Chapter Products quater and year to date13Row ltlt Gross profit gtgt (ltlt value_1 gtgt q_act)13User Value 16139 Tsd | r6 PAC Hamon Pierrick Referenced Value (value_1_PQACTJAN02)1313Document Q3_2017_Quarter_Report13Chapter Products quater and year to date13Row ltlt Gross profit gtgt (ltlt value_1 gtgt q_act_jan)13User Value 45602 Tsd | -00 | 00 | 00 | ||||||||||||||||||||||||||||||||||||||||
| Personnel expenses | (885) | (869) | (1754) | (847) | (2600) | (873) | (3473) | (905) | (916) | (1822) | (928) | (2750) | m7 | m7 | r7 PAC Hamon Pierrick Referenced Value (value_1_PQACT02)1313Document Q3_2017_Quarter_Report13Chapter Products quater and year to date13Row ltlt Personnel expenses gtgt (ltlt value_1 gtgt q_act)13User Value -9280 Tsd | r7 PAC Hamon Pierrick Referenced Value (value_1_PQACTJAN02)1313Document Q3_2017_Quarter_Report13Chapter Products quater and year to date13Row ltlt Personnel expenses gtgt (ltlt value_1 gtgt q_act_jan)13User Value -27496 Tsd | -00 | 00 | 01 | ||||||||||||||||||||||||||||||||||||||||
| Other operating expenses | (371) | (359) | (730) | (318) | (1048) | (284) | (1333) | (324) | (317) | (641) | (337) | (978) | m8 | m8 | r8 PAC Hamon Pierrick Referenced Value (value_1_PQACT02)1313Document Q3_2017_Quarter_Report13Chapter Products quater and year to date13Row ltlt Other operating expenses gtgt (ltlt value_1 gtgt q_act)13User Value -3367 Tsd | r8 PAC Hamon Pierrick Referenced Value (value_1_PQACTJAN02)1313Document Q3_2017_Quarter_Report13Chapter Products quater and year to date13Row ltlt Other operating expenses gtgt (ltlt value_1 gtgt q_act_jan)13User Value -9776 Tsd | 00 | 00 | (01) | ||||||||||||||||||||||||||||||||||||||||
| EBITDA adjusted | 230 | 331 | 561 | 324 | 885 | 261 | 1146 | 218 | 266 | 484 | 349 | 833 | m9 | m9 | r9 PAC Hamon Pierrick Referenced Value (value_1_PQACT02)1313Document Q3_2017_Quarter_Report13Chapter Products quater and year to date13Row ltlt EBITDA gtgt (ltlt value_1 gtgt q_act)13User Value 3492 Tsd | r9 PAC Hamon Pierrick Referenced Value (value_1_PQACTJAN02)1313Document Q3_2017_Quarter_Report13Chapter Products quater and year to date13Row ltlt EBITDA gtgt (ltlt value_1 gtgt q_act_jan)13User Value 8330 Tsd | -00 | 00 | 00 | ||||||||||||||||||||||||||||||||||||||||
| Depreciation and amortization | (52) | (52) | (103) | (55) | (158) | (53) | (211) | (46) | (47) | (93) | (46) | (139) | m10 | m10 | r10 PAC Hamon Pierrick Referenced Value (value_1_PQACT02)1313Document Q3_2017_Quarter_Report13Chapter Products quater and year to date13Row ltlt Depreciation and amortization gtgt (ltlt value_1 gtgt q_act)13User Value -458 Tsd | r10 PAC Hamon Pierrick Referenced Value (value_1_PQACTJAN02)1313Document Q3_2017_Quarter_Report13Chapter Products quater and year to date13Row ltlt Depreciation and amortization gtgt (ltlt value_1 gtgt q_act_jan)13User Value -1387 Tsd | -00 | 01 | 01 | ||||||||||||||||||||||||||||||||||||||||
| EBIT adjusted | 178 | 279 | 457 | 269 | 726 | 208 | 935 | 171 | 220 | 391 | 303 | 694 | m11 | m11 | r11 PAC Hamon Pierrick Referenced Value (value_1_PQACT02)1313Document Q3_2017_Quarter_Report13Chapter Products quater and year to date13Row ltlt Operating result (EBIT) gtgt (ltlt value_1 gtgt q_act)13User Value 3033 Tsd | r11 PAC Hamon Pierrick Referenced Value (value_1_PQACTJAN02)1313Document Q3_2017_Quarter_Report13Chapter Products quater and year to date13Row ltlt Operating result (EBIT) gtgt (ltlt value_1 gtgt q_act_jan)13User Value 6943 Tsd | 00 | 00 | 01 | ||||||||||||||||||||||||||||||||||||||||
| in of gross profit | 120 | 179 | 150 | 181 | 160 | 147 | 157 | 118 | 146 | 133 | 188 | 152 | m12 | m12 | s12 | s12 | |||||||||||||||||||||||||||||||||||||||||||
| Non-recurring items | 00 | 00 | 00 | ||||||||||||||||||||||||||||||||||||||||||||||||||||||||
| Restructuring expenses | 00 | (127) | (127) | 00 | (127) | 00 | (127) | 00 | 00 | 00 | 00 | 00 | m14 | m14 | m14 | m14 | 00 | 00 | 00 | ||||||||||||||||||||||||||||||||||||||||
| EBIT reported | 178 | 153 | 331 | 269 | 600 | 208 | 808 | 171 | 220 | 391 | 303 | 694 | m16 | m16 | r16 PAC Hamon Pierrick Referenced Value (value_1_PQACT02)1313Document Q3_2017_Quarter_Report13Chapter Products quater and year to date13Row ltlt Operating result (EBIT) gtgt (ltlt value_1 gtgt q_act)13User Value 3033 Tsd | r16 PAC Hamon Pierrick Referenced Value (value_1_PQACTJAN02)1313Document Q3_2017_Quarter_Report13Chapter Products quater and year to date13Row ltlt Operating result (EBIT) gtgt (ltlt value_1 gtgt q_act_jan)13User Value 6943 Tsd | PAC Hamon Pierrick Referenced Value (value_1_PQACT02)1313Document Q3_2017_Quarter_Report13Chapter Products quater and year to date13Row ltlt Net forwarding revenue gtgt (ltlt value_1 gtgt q_act)13User Value 73890 Tsd | PAC Hamon Pierrick Referenced Value (value_1_PQACTJAN02)1313Document Q3_2017_Quarter_Report13Chapter Products quater and year to date13Row ltlt Net forwarding revenue gtgt (ltlt value_1 gtgt q_act_jan)13User Value 209603 Tsd | PAC Hamon Pierrick Referenced Value (value_1_PQACT02)1313Document Q3_2017_Quarter_Report13Chapter Products quater and year to date13Row ltlt Forwarding services from third parties gtgt (ltlt value_1 gtgt q_act)13User Value -57751 Tsd | 00 | 00 | 00 | |||||||||||||||||||||||||||||||||||||
| in of gross profit | 120 | 98 | 109 | 181 | 132 | 147 | 136 | 118 | 146 | 133 | 188 | 152 | m17 | m17 | s17 | s17 | |||||||||||||||||||||||||||||||||||||||||||
| Air Freight volumes (000 tons) | 2161 | 2251 | 4412 | 2278 | 6690 | 2524 | 9214 | 2332 | 2399 | 4731 | 2489 | 7220 | m19 | m19 | m19 | m19 | 00 | 00 | 00 | ||||||||||||||||||||||||||||||||||||||||
| change YoY | 54 | 111 | 82 | 99 | 88 | 141 | 102 | 79 | 66 | 72 | 93 | 79 | m20 | m20 | s20 | s20 | |||||||||||||||||||||||||||||||||||||||||||
| GPton (CHF) | 688 | 693 | 690 | 653 | 678 | 562 | 646 | 620 | 625 | 623 | 648 | 632 | m21 | m21 | s21 | s21 | |||||||||||||||||||||||||||||||||||||||||||
| change YoY | -47 | -36 | -41 | -73 | -52 | -140 | -75 | -98 | -97 | -98 | -08 | -68 | m22 | m22 | s22 | s22 | |||||||||||||||||||||||||||||||||||||||||||
| GP change YoY | -4 | -3 | 8 | 1 | s23 | s23 |
| 2017 | 2016 | |||||||||||||||||||||||||||||||||||||||||||||||
| Group | Q1 2016 | Q2 2016 | HY 2016 | Q3 2016 | Q3YTD 2016 | Q4 2016 | FY 2016 | Q1 2017 | Q2 2017 | HY 2017 | Q3 2017 | Q3YTD 2017 | ||||||||||||||||||||||||||||||||||||
| Net forwarding revenue | 13072 | 12894 | 25965 | 12670 | 38635 | 13325 | 51960 | 12772 | 13549 | 26321 | 14334 | 40655 | r4 PAC Hamon Pierrick Referenced Value (value_1_PQACT02)1313Document Q3_2017_Quarter_Report13Chapter Consolidated Income Statement13Row ltlt Net forwarding revenue gtgt (ltlt 2017 gtgt q_act)13User Value 1433411124 Tsd | r4 PAC Hamon Pierrick Referenced Value (value_1_PQACTJAN02)1313Document Q3_2017_Quarter_Report13Chapter Consolidated Income Statement13Row ltlt Net forwarding revenue gtgt (ltlt 2017 gtgt q_act_jan)13User Value 4065500417 Tsd | -00 | -01 | -01 | |||||||||||||||||||||||||||||||
| Forwarding expenses | (9423) | (9180) | (18602) | (9116) | (27718) | (9996) | (37714) | (9445) | (10145) | (19590) | (10818) | (30407) | r5 PAC Hamon Pierrick Referenced Value (value_1_PQACT02)1313Document Q3_2017_Quarter_Report13Chapter Consolidated Income Statement13Row ltlt Forwarding services from third parties gtgt (ltlt 2017 gtgt q_act)13User Value -1081765298 Tsd | r5 PAC Hamon Pierrick Referenced Value (value_1_PQACTJAN02)1313Document Q3_2017_Quarter_Report13Chapter Consolidated Income Statement13Row ltlt Forwarding services from third parties gtgt (ltlt 2017 gtgt q_act_jan)13User Value -3040736424 Tsd | 00 | 01 | 01 | |||||||||||||||||||||||||||||||
| Gross profit | 3649 | 3714 | 7363 | 3554 | 10917 | 3329 | 14246 | 3327 | 3404 | 6731 | 3516 | 10248 | r6 PAC Hamon Pierrick Referenced Value (value_1_PQACT02)1313Document Q3_2017_Quarter_Report13Chapter Consolidated Income Statement13Row ltlt Gross profit gtgt (ltlt 2017 gtgt q_act)13User Value 351645826 Tsd | r6 PAC Hamon Pierrick Referenced Value (value_1_PQACTJAN02)1313Document Q3_2017_Quarter_Report13Chapter Consolidated Income Statement13Row ltlt Gross profit gtgt (ltlt 2017 gtgt q_act_jan)13User Value 1024763993 Tsd | 00 | 00 | 00 | |||||||||||||||||||||||||||||||
| Personnel expenses | (2250) | (2213) | (4463) | (2129) | (6592) | (2113) | (8705) | (2164) | (2162) | (4326) | (2186) | (6511) | r7 PAC Hamon Pierrick Referenced Value (value_1_PQACT02)1313Document Q3_2017_Quarter_Report13Chapter Consolidated Income Statement13Row ltlt Personnel expenses gtgt (ltlt 2017 gtgt q_act)13User Value -218561825 Tsd | r7 PAC Hamon Pierrick Referenced Value (value_1_PQACTJAN02)1313Document Q3_2017_Quarter_Report13Chapter Consolidated Income Statement13Row ltlt Personnel expenses gtgt (ltlt 2017 gtgt q_act_jan)13User Value -651090060 Tsd | 00 | 00 | 00 | |||||||||||||||||||||||||||||||
| Other operating expenses | (1037) | (1011) | (2047) | (971) | (3018) | (927) | (3945) | (893) | (880) | (1773) | (925) | (2698) | r8 PAC Hamon Pierrick Referenced Value (value_1_PQACT02)1313Document Q3_2017_Quarter_Report13Chapter Consolidated Income Statement13Row ltlt Other operating expenses gtgt (ltlt 2017 gtgt q_act)13User Value -92494218 Tsd | r8 PAC Hamon Pierrick Referenced Value (value_1_PQACTJAN02)1313Document Q3_2017_Quarter_Report13Chapter Consolidated Income Statement13Row ltlt Other operating expenses gtgt (ltlt 2017 gtgt q_act_jan)13User Value -269813050 Tsd | 00 | 01 | 01 | |||||||||||||||||||||||||||||||
| EBITDA adjusted | 362 | 491 | 853 | 454 | 1307 | 289 | 1596 | 271 | 362 | 633 | 406 | 1039 | r9 PAC Hamon Pierrick Referenced Value (value_1_PQACT02)1313Document Q3_2017_Quarter_Report13Chapter Consolidated Income Statement13Row ltlt EBITDA gtgt (ltlt 2017 gtgt q_act)13User Value 40589783 Tsd | r9 PAC Hamon Pierrick Referenced Value (value_1_PQACTJAN02)1313Document Q3_2017_Quarter_Report13Chapter Consolidated Income Statement13Row ltlt EBITDA gtgt (ltlt 2017 gtgt q_act_jan)13User Value 103860882 Tsd | -00 | 00 | 00 | |||||||||||||||||||||||||||||||
| Depreciation of property plant and equip | (62) | (62) | (125) | (62) | (187) | (71) | (258) | (53) | (54) | (107) | (50) | (156) | r10 PAC Hamon Pierrick Referenced Value (value_1_PQACT02)1313Document Q3_2017_Quarter_Report13Chapter Consolidated Income Statement13Row ltlt Depreciation of property plant and equipment gtgt (ltlt 2017 gtgt q_act)13User Value -4981553 Tsd | r10 PAC Hamon Pierrick Referenced Value (value_1_PQACTJAN02)1313Document Q3_2017_Quarter_Report13Chapter Consolidated Income Statement13Row ltlt Depreciation of property plant and equipment gtgt (ltlt 2017 gtgt q_act_jan)13User Value -15648388 Tsd | 00 | -01 | -01 | |||||||||||||||||||||||||||||||
| Amortization of intangible assets | (60) | (60) | (120) | (63) | (183) | (56) | (239) | (54) | (52) | (106) | (55) | (162) | r11 PAC Hamon Pierrick Referenced Value (value_1_PQACT02)1313Document Q3_2017_Quarter_Report13Chapter Consolidated Income Statement13Row ltlt Amortization of intangible assets gtgt (ltlt 2017 gtgt q_act)13User Value -5514918 Tsd | r11 PAC Hamon Pierrick Referenced Value (value_1_PQACTJAN02)1313Document Q3_2017_Quarter_Report13Chapter Consolidated Income Statement13Row ltlt Amortization of intangible assets gtgt (ltlt 2017 gtgt q_act_jan)13User Value -16157763 Tsd | -00 | 00 | 00 | |||||||||||||||||||||||||||||||
| EBIT adjusted | 240 | 368 | 608 | 329 | 936 | 163 | 1099 | 164 | 256 | 420 | 301 | 721 | r12 PAC Hamon Pierrick Referenced Value (value_1_PQACT02)1313Document Q3_2017_Quarter_Report13Chapter Consolidated Income Statement13Row ltlt Operating result (EBIT) gtgt (ltlt 2017 gtgt q_act)13User Value 30093312 Tsd | r12 PAC Hamon Pierrick Referenced Value (value_1_PQACTJAN02)1313Document Q3_2017_Quarter_Report13Chapter Consolidated Income Statement13Row ltlt Operating result (EBIT) gtgt (ltlt 2017 gtgt q_act_jan)13User Value 72054731 Tsd | -00 | 00 | -01 | |||||||||||||||||||||||||||||||
| in of gross profit | 66 | 99 | 83 | 92 | 86 | 49 | 77 | 49 | 75 | 62 | 86 | 70 | s13 | s13 | ||||||||||||||||||||||||||||||||||
| Non-recurring items | 00 | 00 | 00 | |||||||||||||||||||||||||||||||||||||||||||||
| Restructuring expenses | 00 | (261) | (261) | 00 | (261) | (19) | (280) | 00 | 00 | 00 | 00 | 00 | r15 PAC Hamon Pierrick Referenced Value (value_1_PQACT02)1313Document Q3_2017_Quarter_Report13Chapter Consolidated Income Statement13Row ltlt Restructuring expenses gtgt (ltlt 2017 gtgt q_act)13User Value 0000000 Tsd | r15 PAC Hamon Pierrick Referenced Value (value_1_PQACTJAN02)1313Document Q3_2017_Quarter_Report13Chapter Consolidated Income Statement13Row ltlt Restructuring expenses gtgt (ltlt 2017 gtgt q_act_jan)13User Value 0000000 Tsd | 00 | 00 | 00 | |||||||||||||||||||||||||||||||
| EBIT reported | 240 | 107 | 347 | 329 | 675 | 144 | 820 | 164 | 256 | 420 | 301 | 721 | s17 | s17 | -00 | 00 | 00 | |||||||||||||||||||||||||||||||
| in of gross profit | 66 | 29 | 47 | 92 | 62 | 43 | 58 | 49 | 75 | 62 | 86 | 70 | s18 | s18 | -01 | -00 | -02 | |||||||||||||||||||||||||||||||
| Financial result | (09) | 07 | (02) | (04) | (06) | 02 | (04) | 02 | 01 | 03 | (04) | (02) | r19 PAC Hamon Pierrick Referenced Value (value_1_PQACT02)1313Document Q3_2017_Quarter_Report13Chapter Consolidated Income Statement13130939883 Tsd - ltlt Finance income gtgt (ltlt 2017 gtgt q_act)13-1343957 Tsd - ltlt Finance costs gtgt (ltlt 2017 gtgt q_act)13---------------------13-0404074 Tsd (Total) | r19 PAC Hamon Pierrick Referenced Value (value_1_PQACTJAN02)1313Document Q3_2017_Quarter_Report13Chapter Consolidated Income Statement13133163726 Tsd - ltlt Finance income gtgt (ltlt 2017 gtgt q_act_jan)13-3315684 Tsd - ltlt Finance costs gtgt (ltlt 2017 gtgt q_act_jan)13---------------------13-0151958 Tsd (Total) | -00 | 00 | 00 | |||||||||||||||||||||||||||||||
| Earnings before taxes (EBT) | 231 | 114 | 345 | 325 | 670 | 146 | 816 | 165 | 257 | 422 | 297 | 719 | r20 PAC Hamon Pierrick Referenced Value (value_1_PQACT02)1313Document Q3_2017_Quarter_Report13Chapter Consolidated Income Statement13Row ltlt Profit before income tax (EBT) gtgt (ltlt 2017 gtgt q_act)13User Value 29689237 Tsd | r20 PAC Hamon Pierrick Referenced Value (value_1_PQACTJAN02)1313Document Q3_2017_Quarter_Report13Chapter Consolidated Income Statement13Row ltlt Profit before income tax (EBT) gtgt (ltlt 2017 gtgt q_act_jan)13User Value 71902773 Tsd | 00 | 00 | 00 | |||||||||||||||||||||||||||||||
| Income tax expenses | (58) | (69) | (126) | (79) | (205) | (88) | (293) | (42) | (81) | (123) | (112) | (235) | r21 PAC Hamon Pierrick Referenced Value (value_1_PQACT02)1313Document Q3_2017_Quarter_Report13Chapter Consolidated Income Statement13Row ltlt Income tax expenses gtgt (ltlt 2017 gtgt q_act)13User Value -8638414 Tsd | r21 PAC Hamon Pierrick Referenced Value (value_1_PQACTJAN02)1313Document Q3_2017_Quarter_Report13Chapter Consolidated Income Statement13Row ltlt Income tax expenses gtgt (ltlt 2017 gtgt q_act_jan)13User Value -20922552 Tsd | 00 | 01 | 01 | |||||||||||||||||||||||||||||||
| of EBT | 250 | 602 | 367 | 242 | 306 | 601 | 359 | 252 | 316 | 291 | 378 | 327 | s22 | s22 | ||||||||||||||||||||||||||||||||||
| Profit | 173 | 45 | 218 | 246 | 465 | 58 | 523 | 124 | 176 | 299 | 185 | 484 | r23 PAC Hamon Pierrick Referenced Value (value_1_PQACT02)1313Document Q3_2017_Quarter_Report13Chapter Consolidated Income Statement13Row ltlt Profit gtgt (ltlt 2017 gtgt q_act)13User Value 21050824 Tsd | r23 PAC Hamon Pierrick Referenced Value (value_1_PQACTJAN02)1313Document Q3_2017_Quarter_Report13Chapter Consolidated Income Statement13Row ltlt Profit gtgt (ltlt 2017 gtgt q_act_jan)13User Value 50980221 Tsd | -00 | 00 | 01 | |||||||||||||||||||||||||||||||
| Earnings per share | 075 | 021 | 096 | 106 | 201 | 027 | 229 | 054 | 075 | 129 | 079 | 208 | s24 PAC Serova Elena (External) Referenced Value (value_1_PQACTJAN02)1313Document Q2_2017_Quarter_Report13Chapter Consolidated Income Statement13Row ltlt Basic gtgt (ltlt 2017 gtgt q_act_jan)13User Value 0000540 Tsd | s24 PAC Serova Elena (External) Referenced Value (value_1_PQACTJAN02)1313Document Q2_2017_Quarter_Report13Chapter Consolidated Income Statement13Row ltlt Basic gtgt (ltlt 2017 gtgt q_act_jan)13User Value 0000540 Tsd | 00 | 00 | 00 | |||||||||||||||||||||||||||||||
| 0 | 0 | 46460419259 | 0 | 0 | 0 | 0 | m25 | m25 | 00 | 00 | ||||||||||||||||||||||||||||||||||||||
| Earnings per share 1000 | 0000788 | 0002078 | rf28 PAC Hamon Pierrick Referenced Value (value_1_PQACT02)1313Document Q3_2017_Quarter_Report13Chapter Consolidated Income Statement13Row ltlt Basic gtgt (ltlt 2017 gtgt q_act)13User Value 0000898 Tsd | rf28 PAC Hamon Pierrick Referenced Value (value_1_PQACTJAN02)1313Document Q3_2017_Quarter_Report13Chapter Consolidated Income Statement13Row ltlt Basic gtgt (ltlt 2017 gtgt q_act_jan)13User Value 0002188 Tsd | ||||||||||||||||||||||||||||||||||||||||||||
| Total Operating Expenses | (3111) | (9209) | s25 | s25 | ||||||||||||||||||||||||||||||||||||||||||||
| OOE YoY | ||||||||||||||||||||||||||||||||||||||||||||||||
| 042 |

15Q3 RESULTS 2017 | 19 OCTOBER 2017 |
INCOME STATEMENT PER QUARTER ndash AIR FREIGHT
Note Air Freight figures in CHF million
Air Freight Q1 2016 Q2 2016 Q3 2016 Q3YTD 2016 Q4 2016 FY 2016 Q1 2017 Q2 2017 Q3 2017 Q3 YTD 2017Net forwarding revenue 6332 6359 6341 19032 7234 26267 6571 7000 7389 20960 Forwarding expenses (4846) (4800) (4853) (14499) (5816) (20315) (5125) (5500) (5775) (16400)Gross profit 1486 1559 1489 4534 1418 5952 1447 1500 1614 4560 Personnel expenses (885) (869) (847) (2600) (873) (3473) (905) (916) (928) (2750)Other operating expenses (371) (359) (318) (1048) (284) (1333) (324) (317) (337) (978)EBITDA adjusted 230 331 324 885 261 1146 218 266 349 833 Depreciation and amortization (52) (52) (55) (158) (53) (211) (46) (47) (46) (139)EBIT adjusted 178 279 269 726 208 935 171 220 303 694 in of gross profit 120 179 181 160 147 157 118 146 188 152Non-recurring itemsRestructuring expenses 00 (127) 00 (127) 00 (127) 00 00 00 00
EBIT reported 178 153 269 600 208 808 171 220 303 694 in of gross profit 120 98 181 132 147 136 118 146 188 152
Air Freight volumes (000 tons) 2161 2251 2278 6690 2524 9214 2332 2399 2489 7220 change YoY 54 111 99 88 141 102 79 66 93 79GPton (CHF) 688 693 653 678 562 646 620 625 648 632 change YoY -47 -36 -73 -52 -140 -75 -98 -97 -08 -68
SNVeryHiddenParameterSheet
PAN_ISpQ_AirFreight
image1png
16Q3 RESULTS 2017 | 19 OCTOBER 2017 |
INCOME STATEMENT PER QUARTER ndash OCEAN FREIGHT
Note Ocean Freight figures in CHF million
Ocean Freight Q1 2016 Q2 2016 Q3 2016 Q3YTD 2016 Q4 2016 FY 2016 Q1 2017 Q2 2017 Q3 2017 Q3YTD 2017Net forwarding revenue 5338 4921 4955 15214 4770 19984 4915 5172 5551 15637 Forwarding expenses (4157) (3773) (3834) (11764) (3783) (15547) (3860) (4081) (4463) (12404)Gross profit 1181 1148 1121 3450 987 4438 1055 1091 1088 3234 Personnel expenses (791) (752) (755) (2298) (721) (3019) (779) (784) (788) (2352)Other operating expenses (305) (288) (274) (868) (275) (1144) (271) (265) (290) (827)EBITDA adjusted 84 108 92 284 (09) 275 05 41 09 55 Depreciation and amortization (41) (42) (41) (124) (42) (166) (36) (36) (38) (110)EBIT adjusted 43 66 51 160 (51) 109 (32) 06 (29) (55)in of gross profit 37 58 45 46 -51 25 -30 05 -27 -17Non-recurring itemsRestructuring expenses 00 (97) 0 (97) (19) (115) 00 00 00 00
EBIT reported 43 (30) 51 63 (69) (06) (32) 06 (29) (55)in of gross profit 37 -26 45 18 -70 -01 -30 05 -27 -17
Ocean Freight volumes (000 tons) 3482 3726 3787 10995 3890 14885 3742 3828 3856 11426 change YoY -100 -82 -88 -90 08 -66 75 27 18 39GPTEU (CHF) 339 308 296 314 254 298 282 285 282 283 change YoY 102 59 -16 47 -176 -11 -169 -75 -47 -98
SNVeryHiddenParameterSheet
PAN_ISpQ_OceanFreight
image1png
17Q3 RESULTS 2017 | 19 OCTOBER 2017 |
INCOME STATEMENT PER QUARTER ndash LOGISTICS
Note Logistics figures in CHF million
Logistics Q1 2016 Q2 2016 Q3 2016 Q3YTD 2016 Q4 2016 FY 2016 Q1 2017 Q2 2017 Q3 2017 Q3YTD 2017Net forwarding revenue 1402 1613 1374 4389 1321 5709 1286 1377 1394 4057 Forwarding expenses (420) (607) (429) (1456) (397) (1853) (460) (564) (580) (1604)Gross profit 982 1006 944 2933 924 3857 825 813 815 2454 Personnel expenses (574) (591) (528) (1694) (519) (2213) (479) (461) (469) (1409)Other operating expenses (360) (363) (378) (1102) (367) (1469) (298) (298) (298) (894)EBITDA adjusted 48 52 38 138 37 175 48 54 48 151 Depreciation and amortization (29) (29) (29) (88) (32) (119) (25) (24) (21) (69)EBIT adjusted 18 23 09 50 05 56 24 31 27 81 Non-recurring itemsRestructuring expenses 00 (38) 00 (38) 00 (38) 00 00 00 00
EBIT reported 18 (15) 09 12 05 18 24 31 27 81
SNVeryHiddenParameterSheet
PAN_ISpQ_Logistics
image1png
18Q3 RESULTS 2017 | 19 OCTOBER 2017 |
BALANCE SHEET
CHF Cash and cash equivalents 3888 2946 (942) -24Trade receivables unbilled forwarding services 9087 9893 806 9Other current assets 1025 1167 142 14Property plant and equipment 635 803 168 26Intangible assets 979 917 (62) -6Other non-current assets 990 1133 143 14Total assets 16606 16859 253 2
Short-term borrowings 23 21 (02) -10Trade payables accured cost of services 6524 7075 551 8Other current liabilities 2439 2254 (185) -8Long-Term borrowings 00 20 20 naOther long-term liabilities 1449 1527 78 5Total liabilities 10436 10896 460 4Share capital 24 24 (00) -1Reserves treasury shares 6057 5884 (173) -3Non-controlling interests 89 55 (34) -38Total equity 6170 5963 (207) -3Total equity and liabilities 16606 16859 253 2
31-Dec-16 30-Sept-17Change in
SNVeryHiddenParameterSheet
PAN_BalanceSheet
image1png
19Q3 RESULTS 2017 | 19 OCTOBER 2017 |
CASH FLOW
Note Figures in CHF million
30-Sep-16 30-Sep-17Change in
Cash flow before changes in working capital 1029 1075 Changes in working capital 357 (477)Cash from operations 1386 599
Interest and income taxes paid (292) (331)Net cash from operating activities 1094 267 -76
Net cash from investing activities (342) (409) 20
Free cash flow 752 (141) -119
Net cash used in financing activities (858) (894) 4
Net increase (decrease) in cash and cash equivalents (106) (1035)Cash and cash equivalents at beginning of period 3923 3888 Effect of exchange rate changes (17) 93 Cash and cash equivalents at end of period 3799 2946
SNVeryHiddenParameterSheet
Tabele PAN_Cashflow
Reported cash and cash equivalents at 31122016Profit YTD 092017Other non-cash items (eg DampA)Changes in working capitalInterest and income taxes paidNet cash from investing activitiesFinancing activitiesdividendEffect of exchange rate changesReported cash and cash equivalents at 300920173887843716999999999996448614155374652852799999999999728527999999999997Reported cash and cash equivalents at 31122016Profit YTD 092017Other non-cash items (eg DampA)Changes in working capitalInterest and income taxes paidNet cash from investing activitiesFinancing activitiesdividendEffect of exchange rate changesReported cash and cash equivalents at 30092017388784839591476633114085893793329463
- Nine months results 2017
- Slide Number 2
- ACHIEVEMENTS and key figures
- Third consecutive quarter with GP and EBIT Growth
- Operating and financial review
- Air Freight Strong and profitable growth
- Ocean Freight quarterly loss due to margin Stagnation
- Logistics improved profitability
- Outlook and priorities 2017
- outlook and priorities 2017
- Next EVENTs
- Disclaimer
- Appendix
- Income statement per quarter ndash Group
- Income statement per quarter ndash Air Freight
- Income statement per quarter ndash Ocean Freight
- Income statement per quarter ndash Logistics
- Balance sheet
- Cash flow
-
| 30-Sep-16 | 30-Sep-17 | Change in | ||||||||||||||||||||||||||||||||||||||||||||||||||||||
| Cash flow before changes in working capital | 1029 | 1075 | r2 PAC Hamon Pierrick Referenced Value (value_1_PQACTJAN02)1313Document Q3_2017_Quarter_Report13Chapter Consolidated Statement of Cash Flows13Row ltlt Subtotal cash flow from operations gtgt (ltlt 2017 gtgt q_act_jan)13User Value 10749 Tsd | PY IS MANUAL | ||||||||||||||||||||||||||||||||||||||||||||||||||||
| Changes in working capital | 357 | (477) | r3 PAC Hamon Pierrick Referenced Value (value_1_PQACTJAN02)1313Document Q3_2017_Quarter_Report13Chapter Consolidated Statement of Cash Flows1313-7973 Tsd - ltlt (Increase) decrease receivables other current assets and unbilled forwarding services gtgt (ltlt 2017 gtgt q_act_jan)134406 Tsd - ltlt Increase (decrease) payables and accruals incl accrued cost of service gtgt (ltlt 2017 gtgt q_act_jan)13-472 Tsd - ltlt Increase (decrease) non-current provisions and other liabilities gtgt (ltlt 2017 gtgt q_act_jan)13-749 Tsd - ltlt Increase (decrease) current provisions and other liabilities gtgt (ltlt 2017 gtgt q_act_jan)13---------------------13-4787 Tsd (Total) | |||||||||||||||||||||||||||||||||||||||||||||||||||||
| Cash from operations | 1386 | 599 | r4 PAC Hamon Pierrick Referenced Value (value_1_PQACTJAN02)1313Document Q3_2017_Quarter_Report13Chapter Consolidated Statement of Cash Flows13Row ltlt Cash generated from operations gtgt (ltlt 2017 gtgt q_act_jan)13User Value 5963 Tsd | |||||||||||||||||||||||||||||||||||||||||||||||||||||
| Interest and income taxes paid | (292) | (331) | r6 PAC Hamon Pierrick Referenced Value (value_1_PQACTJAN02)1313Document Q3_2017_Quarter_Report13Chapter Consolidated Statement of Cash Flows1313-136 Tsd - ltlt Interest paid gtgt (ltlt 2017 gtgt q_act_jan)13-3175 Tsd - ltlt Income taxes paid gtgt (ltlt 2017 gtgt q_act_jan)13---------------------13-3311 Tsd (Total) | |||||||||||||||||||||||||||||||||||||||||||||||||||||
| Net cash from operating activities | 1094 | 267 | -76 | r7 PAC Hamon Pierrick Referenced Value (value_1_PQACTJAN02)1313Document Q3_2017_Quarter_Report13Chapter Consolidated Statement of Cash Flows13Row ltlt Net cash from operating activities gtgt (ltlt 2017 gtgt q_act_jan)13User Value 2652 Tsd | ||||||||||||||||||||||||||||||||||||||||||||||||||||
| Net cash from investing activities | (342) | (409) | 20 | r9 PAC Hamon Pierrick Referenced Value (value_1_PQACTJAN02)1313Document Q3_2017_Quarter_Report13Chapter Consolidated Statement of Cash Flows13Row ltlt Net cash used in investing activities gtgt (ltlt 2017 gtgt q_act_jan)13User Value -4063 Tsd | ||||||||||||||||||||||||||||||||||||||||||||||||||||
| Free cash flow | 752 | (141) | -119 | r11 PAC Hamon Pierrick Referenced Value (value_1_PQACTJAN02)1313Document Q3_2017_Quarter_Report13Chapter Consolidated Statement of Cash Flows13Row ltlt Free cash flow gtgt (ltlt 2017 gtgt q_act_jan)13User Value -1411 Tsd | ||||||||||||||||||||||||||||||||||||||||||||||||||||
| Net cash used in financing activities | (858) | (894) | 4 | r13 PAC Hamon Pierrick Referenced Value (value_1_PQACTJAN02)1313Document Q3_2017_Quarter_Report13Chapter Consolidated Statement of Cash Flows13Row ltlt Net cash used in financing activities gtgt (ltlt 2017 gtgt q_act_jan)13User Value -8937 Tsd | ||||||||||||||||||||||||||||||||||||||||||||||||||||
| Net increase (decrease) in cash and cash equivalents | (106) | (1035) | r15 PAC Hamon Pierrick Referenced Value (value_1_PQACTJAN02)1313Document Q3_2017_Quarter_Report13Chapter Consolidated Statement of Cash Flows13Row ltlt Net increase (decrease) in cash and cash equivalents gtgt (ltlt 2017 gtgt q_act_jan)13User Value -10348 Tsd | |||||||||||||||||||||||||||||||||||||||||||||||||||||
| Cash and cash equivalents at beginning of period | 3923 | 3888 | r16 PAC Hamon Pierrick Referenced Value (value_1_PQACTJAN02)1313Document Q3_2017_Quarter_Report13Chapter Consolidated Statement of Cash Flows13Row ltlt Cash and cash equivalents at the beginning of the period gtgt (ltlt 2017 gtgt q_act_jan)13User Value 38878 Tsd | |||||||||||||||||||||||||||||||||||||||||||||||||||||
| Effect of exchange rate changes | (17) | 93 | r17 PAC Hamon Pierrick Referenced Value (value_1_PQACTJAN02)1313Document Q3_2017_Quarter_Report13Chapter Consolidated Statement of Cash Flows13Row ltlt Effect of exchange rate changes on cash and cash equivalents gtgt (ltlt 2017 gtgt q_act_jan)13User Value 933 Tsd | |||||||||||||||||||||||||||||||||||||||||||||||||||||
| Cash and cash equivalents at end of period | 3799 | 2946 | r18 PAC Hamon Pierrick Referenced Value (value_1_PQACTJAN02)1313Document Q3_2017_Quarter_Report13Chapter Consolidated Statement of Cash Flows13Row ltlt Cash and cash equivalents at the end of the period gtgt (ltlt 2017 gtgt q_act_jan)13User Value 29463 Tsd | |||||||||||||||||||||||||||||||||||||||||||||||||||||
| Reported cash and cash equivalents at 31122016 | 3888 | r21 PAC Hamon Pierrick Referenced Value (value_1_PQACTJAN02)1313Document Q3_2017_Quarter_Report13Chapter Consolidated Statement of Cash Flows13Row ltlt Cash and cash equivalents at the beginning of the period gtgt (ltlt 2017 gtgt q_act_jan)13User Value 38878 Tsd | Reported cash and cash equivalents at 31122016 | 3888 | ||||||||||||||||||||||||||||||||||||||||||||||||||||
| Profit YTD 092017 | 4839 | r19 PAC Hamon Pierrick Referenced Value (value_1_PQACTJAN02)1313Document Q3_2017_Quarter_Report13Chapter Consolidated Statement of Cash Flows13Row ltlt Profit gtgt (ltlt 2017 gtgt q_act_jan)13User Value 4839 Tsd | Profit YTD 092017 | 3888 | 484 | |||||||||||||||||||||||||||||||||||||||||||||||||||
| Other non-cash items (eg DampA) | 591 | r23 PAC Hamon Pierrick Referenced Value (value_1_PQACTJAN02)1313Document Q3_2017_Quarter_Report13Chapter Consolidated Statement of Cash Flows13131565 Tsd - ltlt Depreciation of property plant and equipment gtgt (ltlt 2017 gtgt q_act_jan)131616 Tsd - ltlt Amortization of intangible assets gtgt (ltlt 2017 gtgt q_act_jan)13-165 Tsd - ltlt Interest income and dividend on available-for-sale financial assets gtgt (ltlt 2017 gtgt q_act_jan)13-167 Tsd - ltlt Exchange differences gtgt (ltlt 2017 gtgt q_act_jan)13-025 Tsd - ltlt Loss (gain) on sales of property plant and equipment gtgt (ltlt 2017 gtgt q_act_jan)13000 Tsd - ltlt Loss (gain) on sales of financial assets gtgt (ltlt 2017 gtgt q_act_jan)13497 Tsd - ltlt Expenses for share-based compensation plans gtgt (ltlt 2017 gtgt q_act_jan)13238 Tsd - ltlt Other non-cash (income) and expenses gtgt (ltlt 2017 gtgt q_act_jan)132351 Tsd - ltlt Income tax expenses gtgt (ltlt 2017 gtgt q_act_jan)13---------------------135910 Tsd (Total) | Other non-cash items (eg DampA) | 4372 | 591 | |||||||||||||||||||||||||||||||||||||||||||||||||||
| Changes in working capital | -4766 | r24 PAC Hamon Pierrick Referenced Value (value_1_PQACTJAN02)1313Document Q3_2017_Quarter_Report13Chapter Consolidated Statement of Cash Flows1313-7973 Tsd - ltlt (Increase) decrease receivables other current assets and unbilled forwarding services gtgt (ltlt 2017 gtgt q_act_jan)134406 Tsd - ltlt Increase (decrease) payables and accruals incl accrued cost of service gtgt (ltlt 2017 gtgt q_act_jan)13-472 Tsd - ltlt Increase (decrease) non-current provisions and other liabilities gtgt (ltlt 2017 gtgt q_act_jan)13-749 Tsd - ltlt Increase (decrease) current provisions and other liabilities gtgt (ltlt 2017 gtgt q_act_jan)13---------------------13-4787 Tsd (Total) | Changes in working capital | 4486 | 477 | neg | ||||||||||||||||||||||||||||||||||||||||||||||||||
| Interest and income taxes paid | -3311 | r25 PAC Hamon Pierrick Referenced Value (value_1_PQACTJAN02)1313Document Q3_2017_Quarter_Report13Chapter Consolidated Statement of Cash Flows1313-136 Tsd - ltlt Interest paid gtgt (ltlt 2017 gtgt q_act_jan)13-3175 Tsd - ltlt Income taxes paid gtgt (ltlt 2017 gtgt q_act_jan)13---------------------13-3311 Tsd (Total) | Interest and income taxes paid | 4155 | 331 | neg | ||||||||||||||||||||||||||||||||||||||||||||||||||
| Net cash from investing activities | -4085 | r26 PAC Hamon Pierrick Referenced Value (value_1_PQACTJAN02)1313Document Q3_2017_Quarter_Report13Chapter Consolidated Statement of Cash Flows13Row ltlt Net cash used in investing activities gtgt (ltlt 2017 gtgt q_act_jan)13User Value -4063 Tsd | Net cash from investing activities | 3747 | 409 | neg | ||||||||||||||||||||||||||||||||||||||||||||||||||
| Financing activitiesdividend | -8937 | r27 PAC Hamon Pierrick Referenced Value (value_1_PQACTJAN02)1313Document Q3_2017_Quarter_Report13Chapter Consolidated Statement of Cash Flows13Row ltlt Net cash used in financing activities gtgt (ltlt 2017 gtgt q_act_jan)13User Value -8937 Tsd | Financing activitiesdividend | 2853 | 894 | neg | ||||||||||||||||||||||||||||||||||||||||||||||||||
| Effect of exchange rate changes | 933 | r28 PAC Hamon Pierrick Referenced Value (value_1_PQACTJAN02)1313Document Q3_2017_Quarter_Report13Chapter Consolidated Statement of Cash Flows13Row ltlt Effect of exchange rate changes on cash and cash equivalents gtgt (ltlt 2017 gtgt q_act_jan)13User Value 933 Tsd | Effect of exchange rate changes | 2853 | 93 | |||||||||||||||||||||||||||||||||||||||||||||||||||
| Reported cash and cash equivalents at 30092017 | 29463 | r29 PAC Hamon Pierrick Referenced Value (value_1_PQACTJAN02)1313Document Q3_2017_Quarter_Report13Chapter Consolidated Statement of Cash Flows13Row ltlt Cash and cash equivalents at the end of the period gtgt (ltlt 2017 gtgt q_act_jan)13User Value 29463 Tsd | PAC Hamon Pierrick Referenced Value (value_1_PQACTJAN02)1313Document Q3_2017_Quarter_Report13Chapter Consolidated Statement of Cash Flows13Row ltlt Subtotal cash flow from operations gtgt (ltlt 2017 gtgt q_act_jan)13User Value 10749 Tsd | PAC Hamon Pierrick Referenced Value (value_1_PQACTJAN02)1313Document Q3_2017_Quarter_Report13Chapter Consolidated Statement of Cash Flows1313-7973 Tsd - ltlt (Increase) decrease receivables other current assets and unbilled forwarding services gtgt (ltlt 2017 gtgt q_act_jan)134406 Tsd - ltlt Increase (decrease) payables and accruals incl accrued cost of service gtgt (ltlt 2017 gtgt q_act_jan)13-472 Tsd - ltlt Increase (decrease) non-current provisions and other liabilities gtgt (ltlt 2017 gtgt q_act_jan)13-749 Tsd - ltlt Increase (decrease) current provisions and other liabilities gtgt (ltlt 2017 gtgt q_act_jan)13---------------------13-4787 Tsd (Total) | PAC Hamon Pierrick Referenced Value (value_1_PQACTJAN02)1313Document Q3_2017_Quarter_Report13Chapter Consolidated Statement of Cash Flows13Row ltlt Cash generated from operations gtgt (ltlt 2017 gtgt q_act_jan)13User Value 5963 Tsd | PAC Hamon Pierrick Referenced Value (value_1_PQACTJAN02)1313Document Q3_2017_Quarter_Report13Chapter Consolidated Statement of Cash Flows1313-136 Tsd - ltlt Interest paid gtgt (ltlt 2017 gtgt q_act_jan)13-3175 Tsd - ltlt Income taxes paid gtgt (ltlt 2017 gtgt q_act_jan)13---------------------13-3311 Tsd (Total) | PAC Hamon Pierrick Referenced Value (value_1_PQACTJAN02)1313Document Q3_2017_Quarter_Report13Chapter Consolidated Statement of Cash Flows13Row ltlt Net cash from operating activities gtgt (ltlt 2017 gtgt q_act_jan)13User Value 2652 Tsd | PAC Hamon Pierrick Referenced Value (value_1_PQACTJAN02)1313Document Q3_2017_Quarter_Report13Chapter Consolidated Statement of Cash Flows13Row ltlt Net cash used in investing activities gtgt (ltlt 2017 gtgt q_act_jan)13User Value -4063 Tsd | PAC Hamon Pierrick Referenced Value (value_1_PQACTJAN02)1313Document Q3_2017_Quarter_Report13Chapter Consolidated Statement of Cash Flows13Row ltlt Free cash flow gtgt (ltlt 2017 gtgt q_act_jan)13User Value -1411 Tsd | PAC Hamon Pierrick Referenced Value (value_1_PQACTJAN02)1313Document Q3_2017_Quarter_Report13Chapter Consolidated Statement of Cash Flows13Row ltlt Net cash used in financing activities gtgt (ltlt 2017 gtgt q_act_jan)13User Value -8937 Tsd | PAC Hamon Pierrick Referenced Value (value_1_PQACTJAN02)1313Document Q3_2017_Quarter_Report13Chapter Consolidated Statement of Cash Flows13Row ltlt Net increase (decrease) in cash and cash equivalents gtgt (ltlt 2017 gtgt q_act_jan)13User Value -10348 Tsd | PAC Hamon Pierrick Referenced Value (value_1_PQACTJAN02)1313Document Q3_2017_Quarter_Report13Chapter Consolidated Statement of Cash Flows13Row ltlt Cash and cash equivalents at the beginning of the period gtgt (ltlt 2017 gtgt q_act_jan)13User Value 38878 Tsd | PAC Hamon Pierrick Referenced Value (value_1_PQACTJAN02)1313Document Q3_2017_Quarter_Report13Chapter Consolidated Statement of Cash Flows13Row ltlt Effect of exchange rate changes on cash and cash equivalents gtgt (ltlt 2017 gtgt q_act_jan)13User Value 933 Tsd | PAC Hamon Pierrick Referenced Value (value_1_PQACTJAN02)1313Document Q3_2017_Quarter_Report13Chapter Consolidated Statement of Cash Flows13Row ltlt Cash and cash equivalents at the end of the period gtgt (ltlt 2017 gtgt q_act_jan)13User Value 29463 Tsd | PAC Hamon Pierrick Referenced Value (value_1_PQACTJAN02)1313Document Q3_2017_Quarter_Report13Chapter Consolidated Statement of Cash Flows13Row ltlt Cash and cash equivalents at the beginning of the period gtgt (ltlt 2017 gtgt q_act_jan)13User Value 38878 Tsd | PAC Hamon Pierrick Referenced Value (value_1_PQACTJAN02)1313Document Q3_2017_Quarter_Report13Chapter Consolidated Statement of Cash Flows13Row ltlt Profit gtgt (ltlt 2017 gtgt q_act_jan)13User Value 4839 Tsd | PAC Hamon Pierrick Referenced Value (value_1_PQACTJAN02)1313Document Q3_2017_Quarter_Report13Chapter Consolidated Statement of Cash Flows13131565 Tsd - ltlt Depreciation of property plant and equipment gtgt (ltlt 2017 gtgt q_act_jan)131616 Tsd - ltlt Amortization of intangible assets gtgt (ltlt 2017 gtgt q_act_jan)13-165 Tsd - ltlt Interest income and dividend on available-for-sale financial assets gtgt (ltlt 2017 gtgt q_act_jan)13-167 Tsd - ltlt Exchange differences gtgt (ltlt 2017 gtgt q_act_jan)13-025 Tsd - ltlt Loss (gain) on sales of property plant and equipment gtgt (ltlt 2017 gtgt q_act_jan)13000 Tsd - ltlt Loss (gain) on sales of financial assets gtgt (ltlt 2017 gtgt q_act_jan)13497 Tsd - ltlt Expenses for share-based compensation plans gtgt (ltlt 2017 gtgt q_act_jan)13238 Tsd - ltlt Other non-cash (income) and expenses gtgt (ltlt 2017 gtgt q_act_jan)132351 Tsd - ltlt Income tax expenses gtgt (ltlt 2017 gtgt q_act_jan)13---------------------135910 Tsd (Total) | PAC Hamon Pierrick Referenced Value (value_1_PQACTJAN02)1313Document Q3_2017_Quarter_Report13Chapter Consolidated Statement of Cash Flows1313-7973 Tsd - ltlt (Increase) decrease receivables other current assets and unbilled forwarding services gtgt (ltlt 2017 gtgt q_act_jan)134406 Tsd - ltlt Increase (decrease) payables and accruals incl accrued cost of service gtgt (ltlt 2017 gtgt q_act_jan)13-472 Tsd - ltlt Increase (decrease) non-current provisions and other liabilities gtgt (ltlt 2017 gtgt q_act_jan)13-749 Tsd - ltlt Increase (decrease) current provisions and other liabilities gtgt (ltlt 2017 gtgt q_act_jan)13---------------------13-4787 Tsd (Total) | PAC Hamon Pierrick Referenced Value (value_1_PQACTJAN02)1313Document Q3_2017_Quarter_Report13Chapter Consolidated Statement of Cash Flows1313-136 Tsd - ltlt Interest paid gtgt (ltlt 2017 gtgt q_act_jan)13-3175 Tsd - ltlt Income taxes paid gtgt (ltlt 2017 gtgt q_act_jan)13---------------------13-3311 Tsd (Total) | Reported cash and cash equivalents at 30092017 | 2946 | 3888 | ||||||||||||||||||||||||||||||||||
| 484 | ||||||||||||||||||||||||||||||||||||||||||||||||||||||||
| 591 | ||||||||||||||||||||||||||||||||||||||||||||||||||||||||
| (479) | ||||||||||||||||||||||||||||||||||||||||||||||||||||||||
| (331) | ||||||||||||||||||||||||||||||||||||||||||||||||||||||||
| (406) | ||||||||||||||||||||||||||||||||||||||||||||||||||||||||
| (894) | ||||||||||||||||||||||||||||||||||||||||||||||||||||||||
| 93 | ||||||||||||||||||||||||||||||||||||||||||||||||||||||||
| 2946 |
| 31-Dec-16 | 30-Sept-17 | Change in | ||||||||||||||||||||||||||||||||||||||||||||||||||||||||
| CHF | ||||||||||||||||||||||||||||||||||||||||||||||||||||||||||
| Cash and cash equivalents | 3888 | 2946 | (942) | -24 | r3 PAC Hamon Pierrick Referenced Value (value_1_PQACTJAN02)1313Document Q3_2017_Quarter_Report13Chapter Consolidated Statement of Financial Position13Row ltlt Cash and cash equivalents gtgt (ltlt September 30 2017 gtgt q_act_jan)13User Value 29463 Tsd | 3888 | 3999 | 111 | 3 | |||||||||||||||||||||||||||||||||||||||||||||||||
| Trade receivables unbilled forwarding services | 9087 | 9893 | 806 | 9 | r4 PAC Hamon Pierrick Referenced Value (value_1_PQACTJAN02)1313Document Q3_2017_Quarter_Report13Chapter Consolidated Statement of Financial Position13Row ltlt Trade receivables unbilled forwarding services gtgt (ltlt September 30 2017 gtgt q_act_jan)13User Value 98929 Tsd | 9087 | 8693 | -394 | -4 | |||||||||||||||||||||||||||||||||||||||||||||||||
| Other current assets | 1025 | 1167 | 142 | 14 | r5 PAC Hamon Pierrick Referenced Value (value_1_PQACTJAN02)1313Document Q3_2017_Quarter_Report13Chapter Consolidated Statement of Financial Position13Row ltlt Other current assets gtgt (ltlt September 30 2017 gtgt q_act_jan)13User Value 11671 Tsd | 1025 | 1335 | 31 | 30 | |||||||||||||||||||||||||||||||||||||||||||||||||
| Property plant and equipment | 635 | 803 | 168 | 26 | r6 PAC Hamon Pierrick Referenced Value (value_1_PQACTJAN02)1313Document Q3_2017_Quarter_Report13Chapter Consolidated Statement of Financial Position13Row ltlt Property plant and equipment gtgt (ltlt September 30 2017 gtgt q_act_jan)13User Value 8028 Tsd | 635 | 651 | 16 | 3 | |||||||||||||||||||||||||||||||||||||||||||||||||
| Intangible assets | 979 | 917 | (62) | -6 | r7 PAC Hamon Pierrick Referenced Value (value_1_PQACTJAN02)1313Document Q3_2017_Quarter_Report13Chapter Consolidated Statement of Financial Position13Row ltlt Intangible assets gtgt (ltlt September 30 2017 gtgt q_act_jan)13User Value 9168 Tsd | 979 | 926 | -53 | -5 | |||||||||||||||||||||||||||||||||||||||||||||||||
| Other non-current assets | 990 | 1133 | 143 | 14 | r8 PAC Hamon Pierrick Referenced Value (value_1_PQACTJAN02)1313Document Q3_2017_Quarter_Report13Chapter Consolidated Statement of Financial Position13Row ltlt Other non-current assets gtgt (ltlt September 30 2017 gtgt q_act_jan)13User Value 11586 Tsd | 99 | 1073 | 83 | 8 | |||||||||||||||||||||||||||||||||||||||||||||||||
| Total assets | 16606 | 16859 | 253 | 2 | r9 PAC Hamon Pierrick Referenced Value (value_1_PQACTJAN02)1313Document Q3_2017_Quarter_Report13Chapter Consolidated Statement of Financial Position13Row ltlt Total assets gtgt (ltlt September 30 2017 gtgt q_act_jan)13User Value 168844 Tsd | 166060 | 166780 | 72 | 0 | |||||||||||||||||||||||||||||||||||||||||||||||||
| 0 | ||||||||||||||||||||||||||||||||||||||||||||||||||||||||||
| Short-term borrowings | 23 | 21 | (02) | -10 | r11 PAC Hamon Pierrick Referenced Value (value_1_PQACTJAN02)1313Document Q3_2017_Quarter_Report13Chapter Consolidated Statement of Financial Position13Row ltlt Short-term borrowings gtgt (ltlt September 30 2017 gtgt q_act_jan)13User Value 208 Tsd | 23 | 05 | -18 | -78 | |||||||||||||||||||||||||||||||||||||||||||||||||
| Trade payables accured cost of services | 6524 | 7075 | 551 | 8 | r12 PAC Hamon Pierrick Referenced Value (value_1_PQACTJAN02)1313Document Q3_2017_Quarter_Report13Chapter Consolidated Statement of Financial Position13Row ltlt Trade payables accured cost of services gtgt (ltlt September 30 2017 gtgt q_act_jan)13User Value 70745 Tsd | 6524 | 620 | -324 | -5 | |||||||||||||||||||||||||||||||||||||||||||||||||
| Other current liabilities | 2439 | 2254 | (185) | -8 | r13 PAC Hamon Pierrick Referenced Value (value_1_PQACTJAN02)1313Document Q3_2017_Quarter_Report13Chapter Consolidated Statement of Financial Position13Row ltlt Other current liabilities gtgt (ltlt September 30 2017 gtgt q_act_jan)13User Value 22538 Tsd | 2439 | 2592 | 153 | 6 | |||||||||||||||||||||||||||||||||||||||||||||||||
| Long-Term borrowings | 00 | 20 | 20 | na | r20 PAC Hamon Pierrick Referenced Value (value_1_PQACTJAN02)1313Document Q3_2017_Quarter_Report13Chapter Consolidated Statement of Financial Position13Row ltlt Long-term borrowings gtgt (ltlt September 30 2017 gtgt q_act_jan)13User Value 197 Tsd | 0 | 12 | 12 | na | |||||||||||||||||||||||||||||||||||||||||||||||||
| Other long-term liabilities | 1449 | 1527 | 78 | 5 | r21 PAC Hamon Pierrick Referenced Value (value_1_PQACTJAN02)1313Document Q3_2017_Quarter_Report13Chapter Consolidated Statement of Financial Position13Row ltlt Other long-term liabilities gtgt (ltlt September 30 2017 gtgt q_act_jan)13User Value 15270 Tsd | 1449 | 1479 | 3 | 2 | |||||||||||||||||||||||||||||||||||||||||||||||||
| Total liabilities | 10436 | 10896 | 460 | 4 | r14 PAC Hamon Pierrick Referenced Value (value_1_PQACTJAN02)1313Document Q3_2017_Quarter_Report13Chapter Consolidated Statement of Financial Position13Row ltlt Total liabilities gtgt (ltlt September 30 2017 gtgt q_act_jan)13User Value 108956 Tsd | 104360 | 102880 | -148 | -1 | |||||||||||||||||||||||||||||||||||||||||||||||||
| Share capital | 24 | 24 | (00) | -1 | r15 PAC Hamon Pierrick Referenced Value (value_1_PQACTJAN02)1313Document Q3_2017_Quarter_Report13Chapter Consolidated Statement of Financial Position13Row ltlt Share capital gtgt (ltlt September 30 2017 gtgt q_act_jan)13User Value 238 Tsd | 24 | 24 | 0 | 0 | |||||||||||||||||||||||||||||||||||||||||||||||||
| Reserves treasury shares | 6057 | 5884 | (173) | -3 | r16 PAC Hamon Pierrick Referenced Value (value_1_PQACTJAN02)1313Document Q3_2017_Quarter_Report13Chapter Consolidated Statement of Financial Position13Row ltlt Reserves treasury shares gtgt (ltlt September 30 2017 gtgt q_act_jan)13User Value 59100 Tsd | 6057 | 6285 | 228 | 4 | |||||||||||||||||||||||||||||||||||||||||||||||||
| Non-controlling interests | 89 | 55 | (34) | -38 | r17 PAC Hamon Pierrick Referenced Value (value_1_PQACTJAN02)1313Document Q3_2017_Quarter_Report13Chapter Consolidated Statement of Financial Position13Row ltlt Non-controlling interests gtgt (ltlt September 30 2017 gtgt q_act_jan)13User Value 550 Tsd | 89 | 81 | -08 | -9 | |||||||||||||||||||||||||||||||||||||||||||||||||
| Total equity | 6170 | 5963 | (207) | -3 | r18 PAC Hamon Pierrick Referenced Value (value_1_PQACTJAN02)1313Document Q3_2017_Quarter_Report13Chapter Consolidated Statement of Financial Position13Row ltlt Total equity gtgt (ltlt September 30 2017 gtgt q_act_jan)13User Value 59887 Tsd | 617 | 639 | 22 | 4 | |||||||||||||||||||||||||||||||||||||||||||||||||
| Total equity and liabilities | 16606 | 16859 | 253 | 2 | r19 PAC Hamon Pierrick Referenced Value (value_1_PQACTJAN02)1313Document Q3_2017_Quarter_Report13Chapter Consolidated Statement of Financial Position13Row ltlt Total equity and liabilities gtgt (ltlt September 30 2017 gtgt q_act_jan)13User Value 168844 Tsd | 166060 | 166780 | 72 | 0 | |||||||||||||||||||||||||||||||||||||||||||||||||
| KPIs | 31-Dec-16 | 30-Jun-17 | ||||||||||||||||||||||||||||||||||||||||||||||||||||||||
| Equity Ratio | 372 | 354 | s20 PAC Hamon Pierrick Referenced Value (value_1_PQACTJAN02)1313Document Q2_2017_Quarter_Report13Chapter Consolidated Statement of Financial Position13Row ltlt Total equity and liabilities gtgt (ltlt June 30 2017 gtgt q_act_jan)13User Value 153472 Tsd | |||||||||||||||||||||||||||||||||||||||||||||||||||||||
PAC Hamon Pierrick Referenced Value (value_1_PQACTJAN02)1313Document Q3_2017_Quarter_Report13Chapter Consolidated Statement of Financial Position13Row ltlt Cash and cash equivalents gtgt (ltlt September 30 2017 gtgt q_act_jan)13User Value 29463 Tsd | PAC Hamon Pierrick Referenced Value (value_1_PQACTJAN02)1313Document Q3_2017_Quarter_Report13Chapter Consolidated Statement of Financial Position13Row ltlt Trade receivables unbilled forwarding services gtgt (ltlt September 30 2017 gtgt q_act_jan)13User Value 98929 Tsd | PAC Hamon Pierrick Referenced Value (value_1_PQACTJAN02)1313Document Q3_2017_Quarter_Report13Chapter Consolidated Statement of Financial Position13Row ltlt Other current assets gtgt (ltlt September 30 2017 gtgt q_act_jan)13User Value 11671 Tsd | PAC Hamon Pierrick Referenced Value (value_1_PQACTJAN02)1313Document Q3_2017_Quarter_Report13Chapter Consolidated Statement of Financial Position13Row ltlt Property plant and equipment gtgt (ltlt September 30 2017 gtgt q_act_jan)13User Value 8028 Tsd | PAC Hamon Pierrick Referenced Value (value_1_PQACTJAN02)1313Document Q3_2017_Quarter_Report13Chapter Consolidated Statement of Financial Position13Row ltlt Intangible assets gtgt (ltlt September 30 2017 gtgt q_act_jan)13User Value 9168 Tsd | PAC Hamon Pierrick Referenced Value (value_1_PQACTJAN02)1313Document Q3_2017_Quarter_Report13Chapter Consolidated Statement of Financial Position13Row ltlt Other non-current assets gtgt (ltlt September 30 2017 gtgt q_act_jan)13User Value 11586 Tsd | PAC Hamon Pierrick Referenced Value (value_1_PQACTJAN02)1313Document Q3_2017_Quarter_Report13Chapter Consolidated Statement of Financial Position13Row ltlt Total assets gtgt (ltlt September 30 2017 gtgt q_act_jan)13User Value 168844 Tsd | PAC Hamon Pierrick Referenced Value (value_1_PQACTJAN02)1313Document Q3_2017_Quarter_Report13Chapter Consolidated Statement of Financial Position13Row ltlt Short-term borrowings gtgt (ltlt September 30 2017 gtgt q_act_jan)13User Value 208 Tsd | PAC Hamon Pierrick Referenced Value (value_1_PQACTJAN02)1313Document Q3_2017_Quarter_Report13Chapter Consolidated Statement of Financial Position13Row ltlt Trade payables accured cost of services gtgt (ltlt September 30 2017 gtgt q_act_jan)13User Value 70745 Tsd | PAC Hamon Pierrick Referenced Value (value_1_PQACTJAN02)1313Document Q3_2017_Quarter_Report13Chapter Consolidated Statement of Financial Position13Row ltlt Other current liabilities gtgt (ltlt September 30 2017 gtgt q_act_jan)13User Value 22538 Tsd | PAC Hamon Pierrick Referenced Value (value_1_PQACTJAN02)1313Document Q3_2017_Quarter_Report13Chapter Consolidated Statement of Financial Position13Row ltlt Long-term borrowings gtgt (ltlt September 30 2017 gtgt q_act_jan)13User Value 197 Tsd | PAC Hamon Pierrick Referenced Value (value_1_PQACTJAN02)1313Document Q3_2017_Quarter_Report13Chapter Consolidated Statement of Financial Position13Row ltlt Other long-term liabilities gtgt (ltlt September 30 2017 gtgt q_act_jan)13User Value 15270 Tsd | PAC Hamon Pierrick Referenced Value (value_1_PQACTJAN02)1313Document Q3_2017_Quarter_Report13Chapter Consolidated Statement of Financial Position13Row ltlt Total liabilities gtgt (ltlt September 30 2017 gtgt q_act_jan)13User Value 108956 Tsd | PAC Hamon Pierrick Referenced Value (value_1_PQACTJAN02)1313Document Q3_2017_Quarter_Report13Chapter Consolidated Statement of Financial Position13Row ltlt Share capital gtgt (ltlt September 30 2017 gtgt q_act_jan)13User Value 238 Tsd | PAC Hamon Pierrick Referenced Value (value_1_PQACTJAN02)1313Document Q3_2017_Quarter_Report13Chapter Consolidated Statement of Financial Position13Row ltlt Reserves treasury shares gtgt (ltlt September 30 2017 gtgt q_act_jan)13User Value 59100 Tsd | PAC Hamon Pierrick Referenced Value (value_1_PQACTJAN02)1313Document Q3_2017_Quarter_Report13Chapter Consolidated Statement of Financial Position13Row ltlt Non-controlling interests gtgt (ltlt September 30 2017 gtgt q_act_jan)13User Value 550 Tsd | PAC Hamon Pierrick Referenced Value (value_1_PQACTJAN02)1313Document Q3_2017_Quarter_Report13Chapter Consolidated Statement of Financial Position13Row ltlt Total equity gtgt (ltlt September 30 2017 gtgt q_act_jan)13User Value 59887 Tsd | PAC Hamon Pierrick Referenced Value (value_1_PQACTJAN02)1313Document Q3_2017_Quarter_Report13Chapter Consolidated Statement of Financial Position13Row ltlt Total equity and liabilities gtgt (ltlt September 30 2017 gtgt q_act_jan)13User Value 168844 Tsd | NWC-Intensity | 18 | 13 | mf24 | |||||||||||||||||||||||||||||||||||||
| DSO 3-m-rolling YTD | 455 | 467 | m22 | |||||||||||||||||||||||||||||||||||||||||||||||||||||||
| DPO 3-m-rolling YTD | 407 | 397 | m23 |
| 2017 | 2016 | |||||||||||||||||||||||||||||||||||||||||||||||||||||||||||||||||||
| Logistics | Q1 2016 | Q2 2016 | HY 2016 | Q3 2016 | Q3YTD 2016 | Q4 2016 | FY 2016 | Q1 2017 | Q2 2017 | HY 2017 | Q3 2017 | Q3YTD 2017 | ||||||||||||||||||||||||||||||||||||||||||||||||||||||||
| Net forwarding revenue | 1402 | 1613 | 3015 | 1374 | 4389 | 1321 | 5709 | 1286 | 1377 | 2663 | 1394 | 4057 | m4 | m4 | r4 PAC Hamon Pierrick Referenced Value (value_1_PQACT02)1313Document Q3_2017_Quarter_Report13Chapter Products quater and year to date13Row ltlt Net forwarding revenue gtgt (ltlt value_3 gtgt q_act)13User Value 13945 Tsd | r4 PAC Hamon Pierrick Referenced Value (value_1_PQACTJAN02)1313Document Q3_2017_Quarter_Report13Chapter Products quater and year to date13Row ltlt Net forwarding revenue gtgt (ltlt value_3 gtgt q_act_jan)13User Value 40573 Tsd | -00 | 00 | (01) | |||||||||||||||||||||||||||||||||||||||||||||||||
| Forwarding expenses | (420) | (607) | (1027) | (429) | (1456) | (397) | (1853) | (460) | (564) | (1024) | (580) | (1604) | m5 | m5 | r5 PAC Hamon Pierrick Referenced Value (value_1_PQACT02)1313Document Q3_2017_Quarter_Report13Chapter Products quater and year to date13Row ltlt Forwarding services from third parties gtgt (ltlt value_3 gtgt q_act)13User Value -5796 Tsd | r5 PAC Hamon Pierrick Referenced Value (value_1_PQACTJAN02)1313Document Q3_2017_Quarter_Report13Chapter Products quater and year to date13Row ltlt Forwarding services from third parties gtgt (ltlt value_3 gtgt q_act_jan)13User Value -16035 Tsd | -00 | 00 | 00 | |||||||||||||||||||||||||||||||||||||||||||||||||
| Gross profit | 982 | 1006 | 1989 | 944 | 2933 | 924 | 3857 | 825 | 813 | 1639 | 815 | 2454 | m6 | m6 | r6 PAC Hamon Pierrick Referenced Value (value_1_PQACT02)1313Document Q3_2017_Quarter_Report13Chapter Products quater and year to date13Row ltlt Gross profit gtgt (ltlt value_3 gtgt q_act)13User Value 8148 Tsd | r6 PAC Hamon Pierrick Referenced Value (value_1_PQACTJAN02)1313Document Q3_2017_Quarter_Report13Chapter Products quater and year to date13Row ltlt Gross profit gtgt (ltlt value_3 gtgt q_act_jan)13User Value 24537 Tsd | 00 | 01 | 01 | |||||||||||||||||||||||||||||||||||||||||||||||||
| Personnel expenses | (574) | (591) | (1166) | (528) | (1694) | (519) | (2213) | (479) | (461) | (940) | (469) | (1409) | m7 | m7 | r7 PAC Hamon Pierrick Referenced Value (value_1_PQACT02)1313Document Q3_2017_Quarter_Report13Chapter Products quater and year to date13Row ltlt Personnel expenses gtgt (ltlt value_3 gtgt q_act)13User Value -4692 Tsd | r7 PAC Hamon Pierrick Referenced Value (value_1_PQACTJAN02)1313Document Q3_2017_Quarter_Report13Chapter Products quater and year to date13Row ltlt Personnel expenses gtgt (ltlt value_3 gtgt q_act_jan)13User Value -14091 Tsd | -00 | (01) | (01) | |||||||||||||||||||||||||||||||||||||||||||||||||
| Other operating expenses | (360) | (363) | (723) | (378) | (1102) | (367) | (1469) | (298) | (298) | (596) | (298) | (894) | m8 | m8 | r8 PAC Hamon Pierrick Referenced Value (value_1_PQACT02)1313Document Q3_2017_Quarter_Report13Chapter Products quater and year to date13Row ltlt Other operating expenses gtgt (ltlt value_3 gtgt q_act)13User Value -2977 Tsd | r8 PAC Hamon Pierrick Referenced Value (value_1_PQACTJAN02)1313Document Q3_2017_Quarter_Report13Chapter Products quater and year to date13Row ltlt Other operating expenses gtgt (ltlt value_3 gtgt q_act_jan)13User Value -8940 Tsd | 00 | 00 | (01) | |||||||||||||||||||||||||||||||||||||||||||||||||
| EBITDA adjusted | 48 | 52 | 100 | 38 | 138 | 37 | 175 | 48 | 54 | 103 | 48 | 151 | m9 | m9 | r9 PAC Hamon Pierrick Referenced Value (value_1_PQACT02)1313Document Q3_2017_Quarter_Report13Chapter Products quater and year to date13Row ltlt EBITDA gtgt (ltlt value_3 gtgt q_act)13User Value 479 Tsd | r9 PAC Hamon Pierrick Referenced Value (value_1_PQACTJAN02)1313Document Q3_2017_Quarter_Report13Chapter Products quater and year to date13Row ltlt EBITDA gtgt (ltlt value_3 gtgt q_act_jan)13User Value 1506 Tsd | 00 | 00 | 00 | |||||||||||||||||||||||||||||||||||||||||||||||||
| Depreciation and amortization | (29) | (29) | (58) | (29) | (88) | (32) | (119) | (25) | (24) | (48) | (21) | (69) | m10 | m10 | r10 PAC Hamon Pierrick Referenced Value (value_1_PQACT02)1313Document Q3_2017_Quarter_Report13Chapter Products quater and year to date13Row ltlt Depreciation and amortization gtgt (ltlt value_3 gtgt q_act)13User Value -208 Tsd | r10 PAC Hamon Pierrick Referenced Value (value_1_PQACTJAN02)1313Document Q3_2017_Quarter_Report13Chapter Products quater and year to date13Row ltlt Depreciation and amortization gtgt (ltlt value_3 gtgt q_act_jan)13User Value -692 Tsd | 00 | 00 | 00 | |||||||||||||||||||||||||||||||||||||||||||||||||
| EBIT adjusted | 18 | 23 | 41 | 09 | 50 | 05 | 56 | 24 | 31 | 54 | 27 | 81 | m11 | m11 | r11 PAC Hamon Pierrick Referenced Value (value_1_PQACT02)1313Document Q3_2017_Quarter_Report13Chapter Products quater and year to date13Row ltlt Operating result (EBIT) gtgt (ltlt value_3 gtgt q_act)13User Value 271 Tsd | r11 PAC Hamon Pierrick Referenced Value (value_1_PQACTJAN02)1313Document Q3_2017_Quarter_Report13Chapter Products quater and year to date13Row ltlt Operating result (EBIT) gtgt (ltlt value_3 gtgt q_act_jan)13User Value 815 Tsd | -00 | 00 | 01 | |||||||||||||||||||||||||||||||||||||||||||||||||
| Non-recurring items | ||||||||||||||||||||||||||||||||||||||||||||||||||||||||||||||||||||
| Restructuring expenses | 00 | (38) | (38) | 00 | (38) | 00 | (38) | 00 | 00 | 00 | 00 | 00 | m13 | m13 | m13 | m13 | 00 | 00 | 00 | |||||||||||||||||||||||||||||||||||||||||||||||||
| EBIT reported | 18 | (15) | 03 | 09 | 12 | 05 | 18 | 24 | 31 | 54 | 27 | 81 | m15 | m15 | r15 PAC Hamon Pierrick Referenced Value (value_1_PQACT02)1313Document Q3_2017_Quarter_Report13Chapter Products quater and year to date13Row ltlt Operating result (EBIT) gtgt (ltlt value_3 gtgt q_act)13User Value 271 Tsd | r15 PAC Hamon Pierrick Referenced Value (value_1_PQACTJAN02)1313Document Q3_2017_Quarter_Report13Chapter Products quater and year to date13Row ltlt Operating result (EBIT) gtgt (ltlt value_3 gtgt q_act_jan)13User Value 815 Tsd | ||||||||||||||||||||||||||||||||||||||||||||||||||||
PAC Hamon Pierrick Referenced Value (value_1_PQACT02)1313Document Q3_2017_Quarter_Report13Chapter Products quater and year to date13Row ltlt Net forwarding revenue gtgt (ltlt value_3 gtgt q_act)13User Value 13945 Tsd | PAC Hamon Pierrick Referenced Value (value_1_PQACTJAN02)1313Document Q3_2017_Quarter_Report13Chapter Products quater and year to date13Row ltlt Net forwarding revenue gtgt (ltlt value_3 gtgt q_act_jan)13User Value 40573 Tsd | PAC Hamon Pierrick Referenced Value (value_1_PQACT02)1313Document Q3_2017_Quarter_Report13Chapter Products quater and year to date13Row ltlt Forwarding services from third parties gtgt (ltlt value_3 gtgt q_act)13User Value -5796 Tsd | GP Change YoY | -19 | -18 | -14 | -16 | s16 | s16 | |||||||||||||||||||||||||||||||||||||||||||||||||||||||||||
| 2017 | 2016 | ||||||||||||||||||||||||||||||||||||||||||||||||||||||||||
| Ocean Freight | Q1 2016 | Q2 2016 | HY 2016 | Q3 2016 | Q3YTD 2016 | Q4 2016 | FY 2016 | Q1 2017 | Q2 2017 | HY 2017 | Q3 2017 | Q3YTD 2017 | |||||||||||||||||||||||||||||||||||||||||||||||
| Net forwarding revenue | 5338 | 4921 | 10259 | 4955 | 15214 | 4770 | 19984 | 4915 | 5172 | 10087 | 5551 | 15637 | m4 | m4 | r4 PAC Hamon Pierrick Referenced Value (value_1_PQACT02)1313Document Q3_2017_Quarter_Report13Chapter Products quater and year to date13Row ltlt Net forwarding revenue gtgt (ltlt value_2 gtgt q_act)13User Value 55506 Tsd | r4 PAC Hamon Pierrick Referenced Value (value_1_PQACTJAN02)1313Document Q3_2017_Quarter_Report13Chapter Products quater and year to date13Row ltlt Net forwarding revenue gtgt (ltlt value_2 gtgt q_act_jan)13User Value 156375 Tsd | 00 | 00 | 00 | ||||||||||||||||||||||||||||||||||||||||
| Forwarding expenses | (4157) | (3773) | (7930) | (3834) | (11764) | (3783) | (15547) | (3860) | (4081) | (7941) | (4463) | (12404) | m5 | m5 | r5 PAC Hamon Pierrick Referenced Value (value_1_PQACT02)1313Document Q3_2017_Quarter_Report13Chapter Products quater and year to date13Row ltlt Forwarding services from third parties gtgt (ltlt value_2 gtgt q_act)13User Value -44629 Tsd | r5 PAC Hamon Pierrick Referenced Value (value_1_PQACTJAN02)1313Document Q3_2017_Quarter_Report13Chapter Products quater and year to date13Row ltlt Forwarding services from third parties gtgt (ltlt value_2 gtgt q_act_jan)13User Value -124038 Tsd | -00 | 00 | 00 | ||||||||||||||||||||||||||||||||||||||||
| Gross profit | 1181 | 1148 | 2329 | 1121 | 3450 | 987 | 4438 | 1055 | 1091 | 2146 | 1088 | 3234 | m6 | m6 | r6 PAC Hamon Pierrick Referenced Value (value_1_PQACT02)1313Document Q3_2017_Quarter_Report13Chapter Products quater and year to date13Row ltlt Gross profit gtgt (ltlt value_2 gtgt q_act)13User Value 10877 Tsd | r6 PAC Hamon Pierrick Referenced Value (value_1_PQACTJAN02)1313Document Q3_2017_Quarter_Report13Chapter Products quater and year to date13Row ltlt Gross profit gtgt (ltlt value_2 gtgt q_act_jan)13User Value 32337 Tsd | 00 | 00 | 01 | ||||||||||||||||||||||||||||||||||||||||
| Personnel expenses | (791) | (752) | (1543) | (755) | (2298) | (721) | (3019) | (779) | (784) | (1564) | (788) | (2352) | m7 | m7 | r7 PAC Hamon Pierrick Referenced Value (value_1_PQACT02)1313Document Q3_2017_Quarter_Report13Chapter Products quater and year to date13Row ltlt Personnel expenses gtgt (ltlt value_2 gtgt q_act)13User Value -7884 Tsd | r7 PAC Hamon Pierrick Referenced Value (value_1_PQACTJAN02)1313Document Q3_2017_Quarter_Report13Chapter Products quater and year to date13Row ltlt Personnel expenses gtgt (ltlt value_2 gtgt q_act_jan)13User Value -23522 Tsd | -00 | 00 | 00 | ||||||||||||||||||||||||||||||||||||||||
| Other operating expenses | (305) | (288) | (594) | (274) | (868) | (275) | (1144) | (271) | (265) | (536) | (290) | (827) | m8 | m8 | r8 PAC Hamon Pierrick Referenced Value (value_1_PQACT02)1313Document Q3_2017_Quarter_Report13Chapter Products quater and year to date13Row ltlt Other operating expenses gtgt (ltlt value_2 gtgt q_act)13User Value -2905 Tsd | r8 PAC Hamon Pierrick Referenced Value (value_1_PQACTJAN02)1313Document Q3_2017_Quarter_Report13Chapter Products quater and year to date13Row ltlt Other operating expenses gtgt (ltlt value_2 gtgt q_act_jan)13User Value -8265 Tsd | -00 | (01) | (02) | ||||||||||||||||||||||||||||||||||||||||
| EBITDA adjusted | 84 | 108 | 192 | 92 | 284 | (09) | 275 | 05 | 41 | 46 | 09 | 55 | m9 | m9 | r9 PAC Hamon Pierrick Referenced Value (value_1_PQACT02)1313Document Q3_2017_Quarter_Report13Chapter Products quater and year to date13Row ltlt EBITDA gtgt (ltlt value_2 gtgt q_act)13User Value 089 Tsd | r9 PAC Hamon Pierrick Referenced Value (value_1_PQACTJAN02)1313Document Q3_2017_Quarter_Report13Chapter Products quater and year to date13Row ltlt EBITDA gtgt (ltlt value_2 gtgt q_act_jan)13User Value 550 Tsd | -00 | 00 | 00 | ||||||||||||||||||||||||||||||||||||||||
| Depreciation and amortization | (41) | (42) | (83) | (41) | (124) | (42) | (166) | (36) | (36) | (72) | (38) | (110) | m10 | m10 | r10 PAC Hamon Pierrick Referenced Value (value_1_PQACT02)1313Document Q3_2017_Quarter_Report13Chapter Products quater and year to date13Row ltlt Depreciation and amortization gtgt (ltlt value_2 gtgt q_act)13User Value -384 Tsd | r10 PAC Hamon Pierrick Referenced Value (value_1_PQACTJAN02)1313Document Q3_2017_Quarter_Report13Chapter Products quater and year to date13Row ltlt Depreciation and amortization gtgt (ltlt value_2 gtgt q_act_jan)13User Value -1102 Tsd | -00 | 00 | 00 | ||||||||||||||||||||||||||||||||||||||||
| EBIT adjusted | 43 | 66 | 109 | 51 | 160 | (51) | 109 | (32) | 06 | (26) | (29) | (55) | m11 | m11 | r11 PAC Hamon Pierrick Referenced Value (value_1_PQACT02)1313Document Q3_2017_Quarter_Report13Chapter Products quater and year to date13Row ltlt Operating result (EBIT) gtgt (ltlt value_2 gtgt q_act)13User Value -295 Tsd | r11 PAC Hamon Pierrick Referenced Value (value_1_PQACTJAN02)1313Document Q3_2017_Quarter_Report13Chapter Products quater and year to date13Row ltlt Operating result (EBIT) gtgt (ltlt value_2 gtgt q_act_jan)13User Value -552 Tsd | 00 | 00 | 00 | ||||||||||||||||||||||||||||||||||||||||
| in of gross profit | 37 | 58 | 47 | 45 | 46 | -51 | 25 | -30 | 05 | -12 | -27 | -17 | m12 | m12 | s12 | s12 | |||||||||||||||||||||||||||||||||||||||||||
| Non-recurring items | 00 | 00 | 00 | ||||||||||||||||||||||||||||||||||||||||||||||||||||||||
| Restructuring expenses | 00 | (97) | (97) | 0 | (97) | (19) | (115) | 00 | 00 | 00 | 00 | 00 | m14 | m14 | m14 | m14 | 00 | 00 | 01 | ||||||||||||||||||||||||||||||||||||||||
| EBIT reported | 43 | (30) | 13 | 51 | 63 | (69) | (06) | (32) | 06 | (26) | (29) | (55) | m16 | m16 | r16 PAC Hamon Pierrick Referenced Value (value_1_PQACT02)1313Document Q3_2017_Quarter_Report13Chapter Products quater and year to date13Row ltlt Operating result (EBIT) gtgt (ltlt value_2 gtgt q_act)13User Value -295 Tsd | r16 PAC Hamon Pierrick Referenced Value (value_1_PQACTJAN02)1313Document Q3_2017_Quarter_Report13Chapter Products quater and year to date13Row ltlt Operating result (EBIT) gtgt (ltlt value_2 gtgt q_act_jan)13User Value -552 Tsd | PAC Hamon Pierrick Referenced Value (value_1_PQACT02)1313Document Q3_2017_Quarter_Report13Chapter Products quater and year to date13Row ltlt Net forwarding revenue gtgt (ltlt value_2 gtgt q_act)13User Value 55506 Tsd | PAC Hamon Pierrick Referenced Value (value_1_PQACTJAN02)1313Document Q3_2017_Quarter_Report13Chapter Products quater and year to date13Row ltlt Net forwarding revenue gtgt (ltlt value_2 gtgt q_act_jan)13User Value 156375 Tsd | PAC Hamon Pierrick Referenced Value (value_1_PQACT02)1313Document Q3_2017_Quarter_Report13Chapter Products quater and year to date13Row ltlt Forwarding services from third parties gtgt (ltlt value_2 gtgt q_act)13User Value -44629 Tsd | 00 | 00 | (01) | |||||||||||||||||||||||||||||||||||||
| in of gross profit | 37 | -26 | 05 | 45 | 18 | -70 | -01 | -30 | 05 | -12 | -27 | -17 | m17 | m17 | s17 | s17 | |||||||||||||||||||||||||||||||||||||||||||
| Ocean Freight volumes (000 tons) | 3482 | 3726 | 7208 | 3787 | 10995 | 3890 | 14885 | 3742 | 3828 | 7570 | 3856 | 11426 | m19 | m19 | m19 | m19 | 00 | 00 | 00 | ||||||||||||||||||||||||||||||||||||||||
| change YoY | -100 | -82 | -91 | -88 | -90 | 08 | -66 | 75 | 27 | 50 | 18 | 39 | m20 | m20 | s20 | s20 | |||||||||||||||||||||||||||||||||||||||||||
| GPTEU (CHF) | 339 | 308 | 323 | 296 | 314 | 254 | 298 | 282 | 285 | 283 | 282 | 283 | m21 | m21 | s21 | s21 | |||||||||||||||||||||||||||||||||||||||||||
| change YoY | 102 | 59 | 80 | -16 | 47 | -176 | -11 | -169 | -75 | -122 | -47 | -98 | m22 | m22 | s22 | s22 | |||||||||||||||||||||||||||||||||||||||||||
| GP change YoY | -5 | -8 | -3 | -6 | s23 | s23 | |||||||||||||||||||||||||||||||||||||||||||||||||||||
| 2017 | 2016 | ||||||||||||||||||||||||||||||||||||||||||||||||||||||||||
| Air Freight | Q1 2016 | Q2 2016 | HY 2016 | Q3 2016 | Q3YTD 2016 | Q4 2016 | FY 2016 | Q1 2017 | Q2 2017 | HY 2017 | Q3 2017 | Q3 YTD 2017 | |||||||||||||||||||||||||||||||||||||||||||||||
| Net forwarding revenue | 6332 | 6359 | 12691 | 6341 | 19032 | 7234 | 26267 | 6571 | 7000 | 13571 | 7389 | 20960 | m4 | m4 | r4 PAC Hamon Pierrick Referenced Value (value_1_PQACT02)1313Document Q3_2017_Quarter_Report13Chapter Products quater and year to date13Row ltlt Net forwarding revenue gtgt (ltlt value_1 gtgt q_act)13User Value 73890 Tsd | r4 PAC Hamon Pierrick Referenced Value (value_1_PQACTJAN02)1313Document Q3_2017_Quarter_Report13Chapter Products quater and year to date13Row ltlt Net forwarding revenue gtgt (ltlt value_1 gtgt q_act_jan)13User Value 209603 Tsd | 00 | 00 | 006009999999958 | ||||||||||||||||||||||||||||||||||||||||
| Forwarding expenses | (4846) | (4800) | (9646) | (4853) | (14499) | (5816) | (20315) | (5125) | (5500) | (10625) | (5775) | (16400) | m5 | m5 | r5 PAC Hamon Pierrick Referenced Value (value_1_PQACT02)1313Document Q3_2017_Quarter_Report13Chapter Products quater and year to date13Row ltlt Forwarding services from third parties gtgt (ltlt value_1 gtgt q_act)13User Value -57751 Tsd | r5 PAC Hamon Pierrick Referenced Value (value_1_PQACTJAN02)1313Document Q3_2017_Quarter_Report13Chapter Products quater and year to date13Row ltlt Forwarding services from third parties gtgt (ltlt value_1 gtgt q_act_jan)13User Value -164000 Tsd | 00 | 00 | 00 | ||||||||||||||||||||||||||||||||||||||||
| Gross profit | 1486 | 1559 | 3045 | 1489 | 4534 | 1418 | 5952 | 1447 | 1500 | 2946 | 1614 | 4560 | m6 | m6 | r6 PAC Hamon Pierrick Referenced Value (value_1_PQACT02)1313Document Q3_2017_Quarter_Report13Chapter Products quater and year to date13Row ltlt Gross profit gtgt (ltlt value_1 gtgt q_act)13User Value 16139 Tsd | r6 PAC Hamon Pierrick Referenced Value (value_1_PQACTJAN02)1313Document Q3_2017_Quarter_Report13Chapter Products quater and year to date13Row ltlt Gross profit gtgt (ltlt value_1 gtgt q_act_jan)13User Value 45602 Tsd | -00 | 00 | 00 | ||||||||||||||||||||||||||||||||||||||||
| Personnel expenses | (885) | (869) | (1754) | (847) | (2600) | (873) | (3473) | (905) | (916) | (1822) | (928) | (2750) | m7 | m7 | r7 PAC Hamon Pierrick Referenced Value (value_1_PQACT02)1313Document Q3_2017_Quarter_Report13Chapter Products quater and year to date13Row ltlt Personnel expenses gtgt (ltlt value_1 gtgt q_act)13User Value -9280 Tsd | r7 PAC Hamon Pierrick Referenced Value (value_1_PQACTJAN02)1313Document Q3_2017_Quarter_Report13Chapter Products quater and year to date13Row ltlt Personnel expenses gtgt (ltlt value_1 gtgt q_act_jan)13User Value -27496 Tsd | -00 | 00 | 01 | ||||||||||||||||||||||||||||||||||||||||
| Other operating expenses | (371) | (359) | (730) | (318) | (1048) | (284) | (1333) | (324) | (317) | (641) | (337) | (978) | m8 | m8 | r8 PAC Hamon Pierrick Referenced Value (value_1_PQACT02)1313Document Q3_2017_Quarter_Report13Chapter Products quater and year to date13Row ltlt Other operating expenses gtgt (ltlt value_1 gtgt q_act)13User Value -3367 Tsd | r8 PAC Hamon Pierrick Referenced Value (value_1_PQACTJAN02)1313Document Q3_2017_Quarter_Report13Chapter Products quater and year to date13Row ltlt Other operating expenses gtgt (ltlt value_1 gtgt q_act_jan)13User Value -9776 Tsd | 00 | 00 | (01) | ||||||||||||||||||||||||||||||||||||||||
| EBITDA adjusted | 230 | 331 | 561 | 324 | 885 | 261 | 1146 | 218 | 266 | 484 | 349 | 833 | m9 | m9 | r9 PAC Hamon Pierrick Referenced Value (value_1_PQACT02)1313Document Q3_2017_Quarter_Report13Chapter Products quater and year to date13Row ltlt EBITDA gtgt (ltlt value_1 gtgt q_act)13User Value 3492 Tsd | r9 PAC Hamon Pierrick Referenced Value (value_1_PQACTJAN02)1313Document Q3_2017_Quarter_Report13Chapter Products quater and year to date13Row ltlt EBITDA gtgt (ltlt value_1 gtgt q_act_jan)13User Value 8330 Tsd | -00 | 00 | 00 | ||||||||||||||||||||||||||||||||||||||||
| Depreciation and amortization | (52) | (52) | (103) | (55) | (158) | (53) | (211) | (46) | (47) | (93) | (46) | (139) | m10 | m10 | r10 PAC Hamon Pierrick Referenced Value (value_1_PQACT02)1313Document Q3_2017_Quarter_Report13Chapter Products quater and year to date13Row ltlt Depreciation and amortization gtgt (ltlt value_1 gtgt q_act)13User Value -458 Tsd | r10 PAC Hamon Pierrick Referenced Value (value_1_PQACTJAN02)1313Document Q3_2017_Quarter_Report13Chapter Products quater and year to date13Row ltlt Depreciation and amortization gtgt (ltlt value_1 gtgt q_act_jan)13User Value -1387 Tsd | -00 | 01 | 01 | ||||||||||||||||||||||||||||||||||||||||
| EBIT adjusted | 178 | 279 | 457 | 269 | 726 | 208 | 935 | 171 | 220 | 391 | 303 | 694 | m11 | m11 | r11 PAC Hamon Pierrick Referenced Value (value_1_PQACT02)1313Document Q3_2017_Quarter_Report13Chapter Products quater and year to date13Row ltlt Operating result (EBIT) gtgt (ltlt value_1 gtgt q_act)13User Value 3033 Tsd | r11 PAC Hamon Pierrick Referenced Value (value_1_PQACTJAN02)1313Document Q3_2017_Quarter_Report13Chapter Products quater and year to date13Row ltlt Operating result (EBIT) gtgt (ltlt value_1 gtgt q_act_jan)13User Value 6943 Tsd | 00 | 00 | 01 | ||||||||||||||||||||||||||||||||||||||||
| in of gross profit | 120 | 179 | 150 | 181 | 160 | 147 | 157 | 118 | 146 | 133 | 188 | 152 | m12 | m12 | s12 | s12 | |||||||||||||||||||||||||||||||||||||||||||
| Non-recurring items | 00 | 00 | 00 | ||||||||||||||||||||||||||||||||||||||||||||||||||||||||
| Restructuring expenses | 00 | (127) | (127) | 00 | (127) | 00 | (127) | 00 | 00 | 00 | 00 | 00 | m14 | m14 | m14 | m14 | 00 | 00 | 00 | ||||||||||||||||||||||||||||||||||||||||
| EBIT reported | 178 | 153 | 331 | 269 | 600 | 208 | 808 | 171 | 220 | 391 | 303 | 694 | m16 | m16 | r16 PAC Hamon Pierrick Referenced Value (value_1_PQACT02)1313Document Q3_2017_Quarter_Report13Chapter Products quater and year to date13Row ltlt Operating result (EBIT) gtgt (ltlt value_1 gtgt q_act)13User Value 3033 Tsd | r16 PAC Hamon Pierrick Referenced Value (value_1_PQACTJAN02)1313Document Q3_2017_Quarter_Report13Chapter Products quater and year to date13Row ltlt Operating result (EBIT) gtgt (ltlt value_1 gtgt q_act_jan)13User Value 6943 Tsd | PAC Hamon Pierrick Referenced Value (value_1_PQACT02)1313Document Q3_2017_Quarter_Report13Chapter Products quater and year to date13Row ltlt Net forwarding revenue gtgt (ltlt value_1 gtgt q_act)13User Value 73890 Tsd | PAC Hamon Pierrick Referenced Value (value_1_PQACTJAN02)1313Document Q3_2017_Quarter_Report13Chapter Products quater and year to date13Row ltlt Net forwarding revenue gtgt (ltlt value_1 gtgt q_act_jan)13User Value 209603 Tsd | PAC Hamon Pierrick Referenced Value (value_1_PQACT02)1313Document Q3_2017_Quarter_Report13Chapter Products quater and year to date13Row ltlt Forwarding services from third parties gtgt (ltlt value_1 gtgt q_act)13User Value -57751 Tsd | 00 | 00 | 00 | |||||||||||||||||||||||||||||||||||||
| in of gross profit | 120 | 98 | 109 | 181 | 132 | 147 | 136 | 118 | 146 | 133 | 188 | 152 | m17 | m17 | s17 | s17 | |||||||||||||||||||||||||||||||||||||||||||
| Air Freight volumes (000 tons) | 2161 | 2251 | 4412 | 2278 | 6690 | 2524 | 9214 | 2332 | 2399 | 4731 | 2489 | 7220 | m19 | m19 | m19 | m19 | 00 | 00 | 00 | ||||||||||||||||||||||||||||||||||||||||
| change YoY | 54 | 111 | 82 | 99 | 88 | 141 | 102 | 79 | 66 | 72 | 93 | 79 | m20 | m20 | s20 | s20 | |||||||||||||||||||||||||||||||||||||||||||
| GPton (CHF) | 688 | 693 | 690 | 653 | 678 | 562 | 646 | 620 | 625 | 623 | 648 | 632 | m21 | m21 | s21 | s21 | |||||||||||||||||||||||||||||||||||||||||||
| change YoY | -47 | -36 | -41 | -73 | -52 | -140 | -75 | -98 | -97 | -98 | -08 | -68 | m22 | m22 | s22 | s22 | |||||||||||||||||||||||||||||||||||||||||||
| GP change YoY | -4 | -3 | 8 | 1 | s23 | s23 |

16Q3 RESULTS 2017 | 19 OCTOBER 2017 |
INCOME STATEMENT PER QUARTER ndash OCEAN FREIGHT
Note Ocean Freight figures in CHF million
Ocean Freight Q1 2016 Q2 2016 Q3 2016 Q3YTD 2016 Q4 2016 FY 2016 Q1 2017 Q2 2017 Q3 2017 Q3YTD 2017Net forwarding revenue 5338 4921 4955 15214 4770 19984 4915 5172 5551 15637 Forwarding expenses (4157) (3773) (3834) (11764) (3783) (15547) (3860) (4081) (4463) (12404)Gross profit 1181 1148 1121 3450 987 4438 1055 1091 1088 3234 Personnel expenses (791) (752) (755) (2298) (721) (3019) (779) (784) (788) (2352)Other operating expenses (305) (288) (274) (868) (275) (1144) (271) (265) (290) (827)EBITDA adjusted 84 108 92 284 (09) 275 05 41 09 55 Depreciation and amortization (41) (42) (41) (124) (42) (166) (36) (36) (38) (110)EBIT adjusted 43 66 51 160 (51) 109 (32) 06 (29) (55)in of gross profit 37 58 45 46 -51 25 -30 05 -27 -17Non-recurring itemsRestructuring expenses 00 (97) 0 (97) (19) (115) 00 00 00 00
EBIT reported 43 (30) 51 63 (69) (06) (32) 06 (29) (55)in of gross profit 37 -26 45 18 -70 -01 -30 05 -27 -17
Ocean Freight volumes (000 tons) 3482 3726 3787 10995 3890 14885 3742 3828 3856 11426 change YoY -100 -82 -88 -90 08 -66 75 27 18 39GPTEU (CHF) 339 308 296 314 254 298 282 285 282 283 change YoY 102 59 -16 47 -176 -11 -169 -75 -47 -98
SNVeryHiddenParameterSheet
PAN_ISpQ_OceanFreight
image1png
17Q3 RESULTS 2017 | 19 OCTOBER 2017 |
INCOME STATEMENT PER QUARTER ndash LOGISTICS
Note Logistics figures in CHF million
Logistics Q1 2016 Q2 2016 Q3 2016 Q3YTD 2016 Q4 2016 FY 2016 Q1 2017 Q2 2017 Q3 2017 Q3YTD 2017Net forwarding revenue 1402 1613 1374 4389 1321 5709 1286 1377 1394 4057 Forwarding expenses (420) (607) (429) (1456) (397) (1853) (460) (564) (580) (1604)Gross profit 982 1006 944 2933 924 3857 825 813 815 2454 Personnel expenses (574) (591) (528) (1694) (519) (2213) (479) (461) (469) (1409)Other operating expenses (360) (363) (378) (1102) (367) (1469) (298) (298) (298) (894)EBITDA adjusted 48 52 38 138 37 175 48 54 48 151 Depreciation and amortization (29) (29) (29) (88) (32) (119) (25) (24) (21) (69)EBIT adjusted 18 23 09 50 05 56 24 31 27 81 Non-recurring itemsRestructuring expenses 00 (38) 00 (38) 00 (38) 00 00 00 00
EBIT reported 18 (15) 09 12 05 18 24 31 27 81
SNVeryHiddenParameterSheet
PAN_ISpQ_Logistics
image1png
18Q3 RESULTS 2017 | 19 OCTOBER 2017 |
BALANCE SHEET
CHF Cash and cash equivalents 3888 2946 (942) -24Trade receivables unbilled forwarding services 9087 9893 806 9Other current assets 1025 1167 142 14Property plant and equipment 635 803 168 26Intangible assets 979 917 (62) -6Other non-current assets 990 1133 143 14Total assets 16606 16859 253 2
Short-term borrowings 23 21 (02) -10Trade payables accured cost of services 6524 7075 551 8Other current liabilities 2439 2254 (185) -8Long-Term borrowings 00 20 20 naOther long-term liabilities 1449 1527 78 5Total liabilities 10436 10896 460 4Share capital 24 24 (00) -1Reserves treasury shares 6057 5884 (173) -3Non-controlling interests 89 55 (34) -38Total equity 6170 5963 (207) -3Total equity and liabilities 16606 16859 253 2
31-Dec-16 30-Sept-17Change in
SNVeryHiddenParameterSheet
PAN_BalanceSheet
image1png
19Q3 RESULTS 2017 | 19 OCTOBER 2017 |
CASH FLOW
Note Figures in CHF million
30-Sep-16 30-Sep-17Change in
Cash flow before changes in working capital 1029 1075 Changes in working capital 357 (477)Cash from operations 1386 599
Interest and income taxes paid (292) (331)Net cash from operating activities 1094 267 -76
Net cash from investing activities (342) (409) 20
Free cash flow 752 (141) -119
Net cash used in financing activities (858) (894) 4
Net increase (decrease) in cash and cash equivalents (106) (1035)Cash and cash equivalents at beginning of period 3923 3888 Effect of exchange rate changes (17) 93 Cash and cash equivalents at end of period 3799 2946
SNVeryHiddenParameterSheet
Tabele PAN_Cashflow
Reported cash and cash equivalents at 31122016Profit YTD 092017Other non-cash items (eg DampA)Changes in working capitalInterest and income taxes paidNet cash from investing activitiesFinancing activitiesdividendEffect of exchange rate changesReported cash and cash equivalents at 300920173887843716999999999996448614155374652852799999999999728527999999999997Reported cash and cash equivalents at 31122016Profit YTD 092017Other non-cash items (eg DampA)Changes in working capitalInterest and income taxes paidNet cash from investing activitiesFinancing activitiesdividendEffect of exchange rate changesReported cash and cash equivalents at 30092017388784839591476633114085893793329463
- Nine months results 2017
- Slide Number 2
- ACHIEVEMENTS and key figures
- Third consecutive quarter with GP and EBIT Growth
- Operating and financial review
- Air Freight Strong and profitable growth
- Ocean Freight quarterly loss due to margin Stagnation
- Logistics improved profitability
- Outlook and priorities 2017
- outlook and priorities 2017
- Next EVENTs
- Disclaimer
- Appendix
- Income statement per quarter ndash Group
- Income statement per quarter ndash Air Freight
- Income statement per quarter ndash Ocean Freight
- Income statement per quarter ndash Logistics
- Balance sheet
- Cash flow
-
| 30-Sep-16 | 30-Sep-17 | Change in | ||||||||||||||||||||||||||||||||||||||||||||||||||||||
| Cash flow before changes in working capital | 1029 | 1075 | r2 PAC Hamon Pierrick Referenced Value (value_1_PQACTJAN02)1313Document Q3_2017_Quarter_Report13Chapter Consolidated Statement of Cash Flows13Row ltlt Subtotal cash flow from operations gtgt (ltlt 2017 gtgt q_act_jan)13User Value 10749 Tsd | PY IS MANUAL | ||||||||||||||||||||||||||||||||||||||||||||||||||||
| Changes in working capital | 357 | (477) | r3 PAC Hamon Pierrick Referenced Value (value_1_PQACTJAN02)1313Document Q3_2017_Quarter_Report13Chapter Consolidated Statement of Cash Flows1313-7973 Tsd - ltlt (Increase) decrease receivables other current assets and unbilled forwarding services gtgt (ltlt 2017 gtgt q_act_jan)134406 Tsd - ltlt Increase (decrease) payables and accruals incl accrued cost of service gtgt (ltlt 2017 gtgt q_act_jan)13-472 Tsd - ltlt Increase (decrease) non-current provisions and other liabilities gtgt (ltlt 2017 gtgt q_act_jan)13-749 Tsd - ltlt Increase (decrease) current provisions and other liabilities gtgt (ltlt 2017 gtgt q_act_jan)13---------------------13-4787 Tsd (Total) | |||||||||||||||||||||||||||||||||||||||||||||||||||||
| Cash from operations | 1386 | 599 | r4 PAC Hamon Pierrick Referenced Value (value_1_PQACTJAN02)1313Document Q3_2017_Quarter_Report13Chapter Consolidated Statement of Cash Flows13Row ltlt Cash generated from operations gtgt (ltlt 2017 gtgt q_act_jan)13User Value 5963 Tsd | |||||||||||||||||||||||||||||||||||||||||||||||||||||
| Interest and income taxes paid | (292) | (331) | r6 PAC Hamon Pierrick Referenced Value (value_1_PQACTJAN02)1313Document Q3_2017_Quarter_Report13Chapter Consolidated Statement of Cash Flows1313-136 Tsd - ltlt Interest paid gtgt (ltlt 2017 gtgt q_act_jan)13-3175 Tsd - ltlt Income taxes paid gtgt (ltlt 2017 gtgt q_act_jan)13---------------------13-3311 Tsd (Total) | |||||||||||||||||||||||||||||||||||||||||||||||||||||
| Net cash from operating activities | 1094 | 267 | -76 | r7 PAC Hamon Pierrick Referenced Value (value_1_PQACTJAN02)1313Document Q3_2017_Quarter_Report13Chapter Consolidated Statement of Cash Flows13Row ltlt Net cash from operating activities gtgt (ltlt 2017 gtgt q_act_jan)13User Value 2652 Tsd | ||||||||||||||||||||||||||||||||||||||||||||||||||||
| Net cash from investing activities | (342) | (409) | 20 | r9 PAC Hamon Pierrick Referenced Value (value_1_PQACTJAN02)1313Document Q3_2017_Quarter_Report13Chapter Consolidated Statement of Cash Flows13Row ltlt Net cash used in investing activities gtgt (ltlt 2017 gtgt q_act_jan)13User Value -4063 Tsd | ||||||||||||||||||||||||||||||||||||||||||||||||||||
| Free cash flow | 752 | (141) | -119 | r11 PAC Hamon Pierrick Referenced Value (value_1_PQACTJAN02)1313Document Q3_2017_Quarter_Report13Chapter Consolidated Statement of Cash Flows13Row ltlt Free cash flow gtgt (ltlt 2017 gtgt q_act_jan)13User Value -1411 Tsd | ||||||||||||||||||||||||||||||||||||||||||||||||||||
| Net cash used in financing activities | (858) | (894) | 4 | r13 PAC Hamon Pierrick Referenced Value (value_1_PQACTJAN02)1313Document Q3_2017_Quarter_Report13Chapter Consolidated Statement of Cash Flows13Row ltlt Net cash used in financing activities gtgt (ltlt 2017 gtgt q_act_jan)13User Value -8937 Tsd | ||||||||||||||||||||||||||||||||||||||||||||||||||||
| Net increase (decrease) in cash and cash equivalents | (106) | (1035) | r15 PAC Hamon Pierrick Referenced Value (value_1_PQACTJAN02)1313Document Q3_2017_Quarter_Report13Chapter Consolidated Statement of Cash Flows13Row ltlt Net increase (decrease) in cash and cash equivalents gtgt (ltlt 2017 gtgt q_act_jan)13User Value -10348 Tsd | |||||||||||||||||||||||||||||||||||||||||||||||||||||
| Cash and cash equivalents at beginning of period | 3923 | 3888 | r16 PAC Hamon Pierrick Referenced Value (value_1_PQACTJAN02)1313Document Q3_2017_Quarter_Report13Chapter Consolidated Statement of Cash Flows13Row ltlt Cash and cash equivalents at the beginning of the period gtgt (ltlt 2017 gtgt q_act_jan)13User Value 38878 Tsd | |||||||||||||||||||||||||||||||||||||||||||||||||||||
| Effect of exchange rate changes | (17) | 93 | r17 PAC Hamon Pierrick Referenced Value (value_1_PQACTJAN02)1313Document Q3_2017_Quarter_Report13Chapter Consolidated Statement of Cash Flows13Row ltlt Effect of exchange rate changes on cash and cash equivalents gtgt (ltlt 2017 gtgt q_act_jan)13User Value 933 Tsd | |||||||||||||||||||||||||||||||||||||||||||||||||||||
| Cash and cash equivalents at end of period | 3799 | 2946 | r18 PAC Hamon Pierrick Referenced Value (value_1_PQACTJAN02)1313Document Q3_2017_Quarter_Report13Chapter Consolidated Statement of Cash Flows13Row ltlt Cash and cash equivalents at the end of the period gtgt (ltlt 2017 gtgt q_act_jan)13User Value 29463 Tsd | |||||||||||||||||||||||||||||||||||||||||||||||||||||
| Reported cash and cash equivalents at 31122016 | 3888 | r21 PAC Hamon Pierrick Referenced Value (value_1_PQACTJAN02)1313Document Q3_2017_Quarter_Report13Chapter Consolidated Statement of Cash Flows13Row ltlt Cash and cash equivalents at the beginning of the period gtgt (ltlt 2017 gtgt q_act_jan)13User Value 38878 Tsd | Reported cash and cash equivalents at 31122016 | 3888 | ||||||||||||||||||||||||||||||||||||||||||||||||||||
| Profit YTD 092017 | 4839 | r19 PAC Hamon Pierrick Referenced Value (value_1_PQACTJAN02)1313Document Q3_2017_Quarter_Report13Chapter Consolidated Statement of Cash Flows13Row ltlt Profit gtgt (ltlt 2017 gtgt q_act_jan)13User Value 4839 Tsd | Profit YTD 092017 | 3888 | 484 | |||||||||||||||||||||||||||||||||||||||||||||||||||
| Other non-cash items (eg DampA) | 591 | r23 PAC Hamon Pierrick Referenced Value (value_1_PQACTJAN02)1313Document Q3_2017_Quarter_Report13Chapter Consolidated Statement of Cash Flows13131565 Tsd - ltlt Depreciation of property plant and equipment gtgt (ltlt 2017 gtgt q_act_jan)131616 Tsd - ltlt Amortization of intangible assets gtgt (ltlt 2017 gtgt q_act_jan)13-165 Tsd - ltlt Interest income and dividend on available-for-sale financial assets gtgt (ltlt 2017 gtgt q_act_jan)13-167 Tsd - ltlt Exchange differences gtgt (ltlt 2017 gtgt q_act_jan)13-025 Tsd - ltlt Loss (gain) on sales of property plant and equipment gtgt (ltlt 2017 gtgt q_act_jan)13000 Tsd - ltlt Loss (gain) on sales of financial assets gtgt (ltlt 2017 gtgt q_act_jan)13497 Tsd - ltlt Expenses for share-based compensation plans gtgt (ltlt 2017 gtgt q_act_jan)13238 Tsd - ltlt Other non-cash (income) and expenses gtgt (ltlt 2017 gtgt q_act_jan)132351 Tsd - ltlt Income tax expenses gtgt (ltlt 2017 gtgt q_act_jan)13---------------------135910 Tsd (Total) | Other non-cash items (eg DampA) | 4372 | 591 | |||||||||||||||||||||||||||||||||||||||||||||||||||
| Changes in working capital | -4766 | r24 PAC Hamon Pierrick Referenced Value (value_1_PQACTJAN02)1313Document Q3_2017_Quarter_Report13Chapter Consolidated Statement of Cash Flows1313-7973 Tsd - ltlt (Increase) decrease receivables other current assets and unbilled forwarding services gtgt (ltlt 2017 gtgt q_act_jan)134406 Tsd - ltlt Increase (decrease) payables and accruals incl accrued cost of service gtgt (ltlt 2017 gtgt q_act_jan)13-472 Tsd - ltlt Increase (decrease) non-current provisions and other liabilities gtgt (ltlt 2017 gtgt q_act_jan)13-749 Tsd - ltlt Increase (decrease) current provisions and other liabilities gtgt (ltlt 2017 gtgt q_act_jan)13---------------------13-4787 Tsd (Total) | Changes in working capital | 4486 | 477 | neg | ||||||||||||||||||||||||||||||||||||||||||||||||||
| Interest and income taxes paid | -3311 | r25 PAC Hamon Pierrick Referenced Value (value_1_PQACTJAN02)1313Document Q3_2017_Quarter_Report13Chapter Consolidated Statement of Cash Flows1313-136 Tsd - ltlt Interest paid gtgt (ltlt 2017 gtgt q_act_jan)13-3175 Tsd - ltlt Income taxes paid gtgt (ltlt 2017 gtgt q_act_jan)13---------------------13-3311 Tsd (Total) | Interest and income taxes paid | 4155 | 331 | neg | ||||||||||||||||||||||||||||||||||||||||||||||||||
| Net cash from investing activities | -4085 | r26 PAC Hamon Pierrick Referenced Value (value_1_PQACTJAN02)1313Document Q3_2017_Quarter_Report13Chapter Consolidated Statement of Cash Flows13Row ltlt Net cash used in investing activities gtgt (ltlt 2017 gtgt q_act_jan)13User Value -4063 Tsd | Net cash from investing activities | 3747 | 409 | neg | ||||||||||||||||||||||||||||||||||||||||||||||||||
| Financing activitiesdividend | -8937 | r27 PAC Hamon Pierrick Referenced Value (value_1_PQACTJAN02)1313Document Q3_2017_Quarter_Report13Chapter Consolidated Statement of Cash Flows13Row ltlt Net cash used in financing activities gtgt (ltlt 2017 gtgt q_act_jan)13User Value -8937 Tsd | Financing activitiesdividend | 2853 | 894 | neg | ||||||||||||||||||||||||||||||||||||||||||||||||||
| Effect of exchange rate changes | 933 | r28 PAC Hamon Pierrick Referenced Value (value_1_PQACTJAN02)1313Document Q3_2017_Quarter_Report13Chapter Consolidated Statement of Cash Flows13Row ltlt Effect of exchange rate changes on cash and cash equivalents gtgt (ltlt 2017 gtgt q_act_jan)13User Value 933 Tsd | Effect of exchange rate changes | 2853 | 93 | |||||||||||||||||||||||||||||||||||||||||||||||||||
| Reported cash and cash equivalents at 30092017 | 29463 | r29 PAC Hamon Pierrick Referenced Value (value_1_PQACTJAN02)1313Document Q3_2017_Quarter_Report13Chapter Consolidated Statement of Cash Flows13Row ltlt Cash and cash equivalents at the end of the period gtgt (ltlt 2017 gtgt q_act_jan)13User Value 29463 Tsd | PAC Hamon Pierrick Referenced Value (value_1_PQACTJAN02)1313Document Q3_2017_Quarter_Report13Chapter Consolidated Statement of Cash Flows13Row ltlt Subtotal cash flow from operations gtgt (ltlt 2017 gtgt q_act_jan)13User Value 10749 Tsd | PAC Hamon Pierrick Referenced Value (value_1_PQACTJAN02)1313Document Q3_2017_Quarter_Report13Chapter Consolidated Statement of Cash Flows1313-7973 Tsd - ltlt (Increase) decrease receivables other current assets and unbilled forwarding services gtgt (ltlt 2017 gtgt q_act_jan)134406 Tsd - ltlt Increase (decrease) payables and accruals incl accrued cost of service gtgt (ltlt 2017 gtgt q_act_jan)13-472 Tsd - ltlt Increase (decrease) non-current provisions and other liabilities gtgt (ltlt 2017 gtgt q_act_jan)13-749 Tsd - ltlt Increase (decrease) current provisions and other liabilities gtgt (ltlt 2017 gtgt q_act_jan)13---------------------13-4787 Tsd (Total) | PAC Hamon Pierrick Referenced Value (value_1_PQACTJAN02)1313Document Q3_2017_Quarter_Report13Chapter Consolidated Statement of Cash Flows13Row ltlt Cash generated from operations gtgt (ltlt 2017 gtgt q_act_jan)13User Value 5963 Tsd | PAC Hamon Pierrick Referenced Value (value_1_PQACTJAN02)1313Document Q3_2017_Quarter_Report13Chapter Consolidated Statement of Cash Flows1313-136 Tsd - ltlt Interest paid gtgt (ltlt 2017 gtgt q_act_jan)13-3175 Tsd - ltlt Income taxes paid gtgt (ltlt 2017 gtgt q_act_jan)13---------------------13-3311 Tsd (Total) | PAC Hamon Pierrick Referenced Value (value_1_PQACTJAN02)1313Document Q3_2017_Quarter_Report13Chapter Consolidated Statement of Cash Flows13Row ltlt Net cash from operating activities gtgt (ltlt 2017 gtgt q_act_jan)13User Value 2652 Tsd | PAC Hamon Pierrick Referenced Value (value_1_PQACTJAN02)1313Document Q3_2017_Quarter_Report13Chapter Consolidated Statement of Cash Flows13Row ltlt Net cash used in investing activities gtgt (ltlt 2017 gtgt q_act_jan)13User Value -4063 Tsd | PAC Hamon Pierrick Referenced Value (value_1_PQACTJAN02)1313Document Q3_2017_Quarter_Report13Chapter Consolidated Statement of Cash Flows13Row ltlt Free cash flow gtgt (ltlt 2017 gtgt q_act_jan)13User Value -1411 Tsd | PAC Hamon Pierrick Referenced Value (value_1_PQACTJAN02)1313Document Q3_2017_Quarter_Report13Chapter Consolidated Statement of Cash Flows13Row ltlt Net cash used in financing activities gtgt (ltlt 2017 gtgt q_act_jan)13User Value -8937 Tsd | PAC Hamon Pierrick Referenced Value (value_1_PQACTJAN02)1313Document Q3_2017_Quarter_Report13Chapter Consolidated Statement of Cash Flows13Row ltlt Net increase (decrease) in cash and cash equivalents gtgt (ltlt 2017 gtgt q_act_jan)13User Value -10348 Tsd | PAC Hamon Pierrick Referenced Value (value_1_PQACTJAN02)1313Document Q3_2017_Quarter_Report13Chapter Consolidated Statement of Cash Flows13Row ltlt Cash and cash equivalents at the beginning of the period gtgt (ltlt 2017 gtgt q_act_jan)13User Value 38878 Tsd | PAC Hamon Pierrick Referenced Value (value_1_PQACTJAN02)1313Document Q3_2017_Quarter_Report13Chapter Consolidated Statement of Cash Flows13Row ltlt Effect of exchange rate changes on cash and cash equivalents gtgt (ltlt 2017 gtgt q_act_jan)13User Value 933 Tsd | PAC Hamon Pierrick Referenced Value (value_1_PQACTJAN02)1313Document Q3_2017_Quarter_Report13Chapter Consolidated Statement of Cash Flows13Row ltlt Cash and cash equivalents at the end of the period gtgt (ltlt 2017 gtgt q_act_jan)13User Value 29463 Tsd | PAC Hamon Pierrick Referenced Value (value_1_PQACTJAN02)1313Document Q3_2017_Quarter_Report13Chapter Consolidated Statement of Cash Flows13Row ltlt Cash and cash equivalents at the beginning of the period gtgt (ltlt 2017 gtgt q_act_jan)13User Value 38878 Tsd | PAC Hamon Pierrick Referenced Value (value_1_PQACTJAN02)1313Document Q3_2017_Quarter_Report13Chapter Consolidated Statement of Cash Flows13Row ltlt Profit gtgt (ltlt 2017 gtgt q_act_jan)13User Value 4839 Tsd | PAC Hamon Pierrick Referenced Value (value_1_PQACTJAN02)1313Document Q3_2017_Quarter_Report13Chapter Consolidated Statement of Cash Flows13131565 Tsd - ltlt Depreciation of property plant and equipment gtgt (ltlt 2017 gtgt q_act_jan)131616 Tsd - ltlt Amortization of intangible assets gtgt (ltlt 2017 gtgt q_act_jan)13-165 Tsd - ltlt Interest income and dividend on available-for-sale financial assets gtgt (ltlt 2017 gtgt q_act_jan)13-167 Tsd - ltlt Exchange differences gtgt (ltlt 2017 gtgt q_act_jan)13-025 Tsd - ltlt Loss (gain) on sales of property plant and equipment gtgt (ltlt 2017 gtgt q_act_jan)13000 Tsd - ltlt Loss (gain) on sales of financial assets gtgt (ltlt 2017 gtgt q_act_jan)13497 Tsd - ltlt Expenses for share-based compensation plans gtgt (ltlt 2017 gtgt q_act_jan)13238 Tsd - ltlt Other non-cash (income) and expenses gtgt (ltlt 2017 gtgt q_act_jan)132351 Tsd - ltlt Income tax expenses gtgt (ltlt 2017 gtgt q_act_jan)13---------------------135910 Tsd (Total) | PAC Hamon Pierrick Referenced Value (value_1_PQACTJAN02)1313Document Q3_2017_Quarter_Report13Chapter Consolidated Statement of Cash Flows1313-7973 Tsd - ltlt (Increase) decrease receivables other current assets and unbilled forwarding services gtgt (ltlt 2017 gtgt q_act_jan)134406 Tsd - ltlt Increase (decrease) payables and accruals incl accrued cost of service gtgt (ltlt 2017 gtgt q_act_jan)13-472 Tsd - ltlt Increase (decrease) non-current provisions and other liabilities gtgt (ltlt 2017 gtgt q_act_jan)13-749 Tsd - ltlt Increase (decrease) current provisions and other liabilities gtgt (ltlt 2017 gtgt q_act_jan)13---------------------13-4787 Tsd (Total) | PAC Hamon Pierrick Referenced Value (value_1_PQACTJAN02)1313Document Q3_2017_Quarter_Report13Chapter Consolidated Statement of Cash Flows1313-136 Tsd - ltlt Interest paid gtgt (ltlt 2017 gtgt q_act_jan)13-3175 Tsd - ltlt Income taxes paid gtgt (ltlt 2017 gtgt q_act_jan)13---------------------13-3311 Tsd (Total) | Reported cash and cash equivalents at 30092017 | 2946 | 3888 | ||||||||||||||||||||||||||||||||||
| 484 | ||||||||||||||||||||||||||||||||||||||||||||||||||||||||
| 591 | ||||||||||||||||||||||||||||||||||||||||||||||||||||||||
| (479) | ||||||||||||||||||||||||||||||||||||||||||||||||||||||||
| (331) | ||||||||||||||||||||||||||||||||||||||||||||||||||||||||
| (406) | ||||||||||||||||||||||||||||||||||||||||||||||||||||||||
| (894) | ||||||||||||||||||||||||||||||||||||||||||||||||||||||||
| 93 | ||||||||||||||||||||||||||||||||||||||||||||||||||||||||
| 2946 |
| 31-Dec-16 | 30-Sept-17 | Change in | ||||||||||||||||||||||||||||||||||||||||||||||||||||||||
| CHF | ||||||||||||||||||||||||||||||||||||||||||||||||||||||||||
| Cash and cash equivalents | 3888 | 2946 | (942) | -24 | r3 PAC Hamon Pierrick Referenced Value (value_1_PQACTJAN02)1313Document Q3_2017_Quarter_Report13Chapter Consolidated Statement of Financial Position13Row ltlt Cash and cash equivalents gtgt (ltlt September 30 2017 gtgt q_act_jan)13User Value 29463 Tsd | 3888 | 3999 | 111 | 3 | |||||||||||||||||||||||||||||||||||||||||||||||||
| Trade receivables unbilled forwarding services | 9087 | 9893 | 806 | 9 | r4 PAC Hamon Pierrick Referenced Value (value_1_PQACTJAN02)1313Document Q3_2017_Quarter_Report13Chapter Consolidated Statement of Financial Position13Row ltlt Trade receivables unbilled forwarding services gtgt (ltlt September 30 2017 gtgt q_act_jan)13User Value 98929 Tsd | 9087 | 8693 | -394 | -4 | |||||||||||||||||||||||||||||||||||||||||||||||||
| Other current assets | 1025 | 1167 | 142 | 14 | r5 PAC Hamon Pierrick Referenced Value (value_1_PQACTJAN02)1313Document Q3_2017_Quarter_Report13Chapter Consolidated Statement of Financial Position13Row ltlt Other current assets gtgt (ltlt September 30 2017 gtgt q_act_jan)13User Value 11671 Tsd | 1025 | 1335 | 31 | 30 | |||||||||||||||||||||||||||||||||||||||||||||||||
| Property plant and equipment | 635 | 803 | 168 | 26 | r6 PAC Hamon Pierrick Referenced Value (value_1_PQACTJAN02)1313Document Q3_2017_Quarter_Report13Chapter Consolidated Statement of Financial Position13Row ltlt Property plant and equipment gtgt (ltlt September 30 2017 gtgt q_act_jan)13User Value 8028 Tsd | 635 | 651 | 16 | 3 | |||||||||||||||||||||||||||||||||||||||||||||||||
| Intangible assets | 979 | 917 | (62) | -6 | r7 PAC Hamon Pierrick Referenced Value (value_1_PQACTJAN02)1313Document Q3_2017_Quarter_Report13Chapter Consolidated Statement of Financial Position13Row ltlt Intangible assets gtgt (ltlt September 30 2017 gtgt q_act_jan)13User Value 9168 Tsd | 979 | 926 | -53 | -5 | |||||||||||||||||||||||||||||||||||||||||||||||||
| Other non-current assets | 990 | 1133 | 143 | 14 | r8 PAC Hamon Pierrick Referenced Value (value_1_PQACTJAN02)1313Document Q3_2017_Quarter_Report13Chapter Consolidated Statement of Financial Position13Row ltlt Other non-current assets gtgt (ltlt September 30 2017 gtgt q_act_jan)13User Value 11586 Tsd | 99 | 1073 | 83 | 8 | |||||||||||||||||||||||||||||||||||||||||||||||||
| Total assets | 16606 | 16859 | 253 | 2 | r9 PAC Hamon Pierrick Referenced Value (value_1_PQACTJAN02)1313Document Q3_2017_Quarter_Report13Chapter Consolidated Statement of Financial Position13Row ltlt Total assets gtgt (ltlt September 30 2017 gtgt q_act_jan)13User Value 168844 Tsd | 166060 | 166780 | 72 | 0 | |||||||||||||||||||||||||||||||||||||||||||||||||
| 0 | ||||||||||||||||||||||||||||||||||||||||||||||||||||||||||
| Short-term borrowings | 23 | 21 | (02) | -10 | r11 PAC Hamon Pierrick Referenced Value (value_1_PQACTJAN02)1313Document Q3_2017_Quarter_Report13Chapter Consolidated Statement of Financial Position13Row ltlt Short-term borrowings gtgt (ltlt September 30 2017 gtgt q_act_jan)13User Value 208 Tsd | 23 | 05 | -18 | -78 | |||||||||||||||||||||||||||||||||||||||||||||||||
| Trade payables accured cost of services | 6524 | 7075 | 551 | 8 | r12 PAC Hamon Pierrick Referenced Value (value_1_PQACTJAN02)1313Document Q3_2017_Quarter_Report13Chapter Consolidated Statement of Financial Position13Row ltlt Trade payables accured cost of services gtgt (ltlt September 30 2017 gtgt q_act_jan)13User Value 70745 Tsd | 6524 | 620 | -324 | -5 | |||||||||||||||||||||||||||||||||||||||||||||||||
| Other current liabilities | 2439 | 2254 | (185) | -8 | r13 PAC Hamon Pierrick Referenced Value (value_1_PQACTJAN02)1313Document Q3_2017_Quarter_Report13Chapter Consolidated Statement of Financial Position13Row ltlt Other current liabilities gtgt (ltlt September 30 2017 gtgt q_act_jan)13User Value 22538 Tsd | 2439 | 2592 | 153 | 6 | |||||||||||||||||||||||||||||||||||||||||||||||||
| Long-Term borrowings | 00 | 20 | 20 | na | r20 PAC Hamon Pierrick Referenced Value (value_1_PQACTJAN02)1313Document Q3_2017_Quarter_Report13Chapter Consolidated Statement of Financial Position13Row ltlt Long-term borrowings gtgt (ltlt September 30 2017 gtgt q_act_jan)13User Value 197 Tsd | 0 | 12 | 12 | na | |||||||||||||||||||||||||||||||||||||||||||||||||
| Other long-term liabilities | 1449 | 1527 | 78 | 5 | r21 PAC Hamon Pierrick Referenced Value (value_1_PQACTJAN02)1313Document Q3_2017_Quarter_Report13Chapter Consolidated Statement of Financial Position13Row ltlt Other long-term liabilities gtgt (ltlt September 30 2017 gtgt q_act_jan)13User Value 15270 Tsd | 1449 | 1479 | 3 | 2 | |||||||||||||||||||||||||||||||||||||||||||||||||
| Total liabilities | 10436 | 10896 | 460 | 4 | r14 PAC Hamon Pierrick Referenced Value (value_1_PQACTJAN02)1313Document Q3_2017_Quarter_Report13Chapter Consolidated Statement of Financial Position13Row ltlt Total liabilities gtgt (ltlt September 30 2017 gtgt q_act_jan)13User Value 108956 Tsd | 104360 | 102880 | -148 | -1 | |||||||||||||||||||||||||||||||||||||||||||||||||
| Share capital | 24 | 24 | (00) | -1 | r15 PAC Hamon Pierrick Referenced Value (value_1_PQACTJAN02)1313Document Q3_2017_Quarter_Report13Chapter Consolidated Statement of Financial Position13Row ltlt Share capital gtgt (ltlt September 30 2017 gtgt q_act_jan)13User Value 238 Tsd | 24 | 24 | 0 | 0 | |||||||||||||||||||||||||||||||||||||||||||||||||
| Reserves treasury shares | 6057 | 5884 | (173) | -3 | r16 PAC Hamon Pierrick Referenced Value (value_1_PQACTJAN02)1313Document Q3_2017_Quarter_Report13Chapter Consolidated Statement of Financial Position13Row ltlt Reserves treasury shares gtgt (ltlt September 30 2017 gtgt q_act_jan)13User Value 59100 Tsd | 6057 | 6285 | 228 | 4 | |||||||||||||||||||||||||||||||||||||||||||||||||
| Non-controlling interests | 89 | 55 | (34) | -38 | r17 PAC Hamon Pierrick Referenced Value (value_1_PQACTJAN02)1313Document Q3_2017_Quarter_Report13Chapter Consolidated Statement of Financial Position13Row ltlt Non-controlling interests gtgt (ltlt September 30 2017 gtgt q_act_jan)13User Value 550 Tsd | 89 | 81 | -08 | -9 | |||||||||||||||||||||||||||||||||||||||||||||||||
| Total equity | 6170 | 5963 | (207) | -3 | r18 PAC Hamon Pierrick Referenced Value (value_1_PQACTJAN02)1313Document Q3_2017_Quarter_Report13Chapter Consolidated Statement of Financial Position13Row ltlt Total equity gtgt (ltlt September 30 2017 gtgt q_act_jan)13User Value 59887 Tsd | 617 | 639 | 22 | 4 | |||||||||||||||||||||||||||||||||||||||||||||||||
| Total equity and liabilities | 16606 | 16859 | 253 | 2 | r19 PAC Hamon Pierrick Referenced Value (value_1_PQACTJAN02)1313Document Q3_2017_Quarter_Report13Chapter Consolidated Statement of Financial Position13Row ltlt Total equity and liabilities gtgt (ltlt September 30 2017 gtgt q_act_jan)13User Value 168844 Tsd | 166060 | 166780 | 72 | 0 | |||||||||||||||||||||||||||||||||||||||||||||||||
| KPIs | 31-Dec-16 | 30-Jun-17 | ||||||||||||||||||||||||||||||||||||||||||||||||||||||||
| Equity Ratio | 372 | 354 | s20 PAC Hamon Pierrick Referenced Value (value_1_PQACTJAN02)1313Document Q2_2017_Quarter_Report13Chapter Consolidated Statement of Financial Position13Row ltlt Total equity and liabilities gtgt (ltlt June 30 2017 gtgt q_act_jan)13User Value 153472 Tsd | |||||||||||||||||||||||||||||||||||||||||||||||||||||||
PAC Hamon Pierrick Referenced Value (value_1_PQACTJAN02)1313Document Q3_2017_Quarter_Report13Chapter Consolidated Statement of Financial Position13Row ltlt Cash and cash equivalents gtgt (ltlt September 30 2017 gtgt q_act_jan)13User Value 29463 Tsd | PAC Hamon Pierrick Referenced Value (value_1_PQACTJAN02)1313Document Q3_2017_Quarter_Report13Chapter Consolidated Statement of Financial Position13Row ltlt Trade receivables unbilled forwarding services gtgt (ltlt September 30 2017 gtgt q_act_jan)13User Value 98929 Tsd | PAC Hamon Pierrick Referenced Value (value_1_PQACTJAN02)1313Document Q3_2017_Quarter_Report13Chapter Consolidated Statement of Financial Position13Row ltlt Other current assets gtgt (ltlt September 30 2017 gtgt q_act_jan)13User Value 11671 Tsd | PAC Hamon Pierrick Referenced Value (value_1_PQACTJAN02)1313Document Q3_2017_Quarter_Report13Chapter Consolidated Statement of Financial Position13Row ltlt Property plant and equipment gtgt (ltlt September 30 2017 gtgt q_act_jan)13User Value 8028 Tsd | PAC Hamon Pierrick Referenced Value (value_1_PQACTJAN02)1313Document Q3_2017_Quarter_Report13Chapter Consolidated Statement of Financial Position13Row ltlt Intangible assets gtgt (ltlt September 30 2017 gtgt q_act_jan)13User Value 9168 Tsd | PAC Hamon Pierrick Referenced Value (value_1_PQACTJAN02)1313Document Q3_2017_Quarter_Report13Chapter Consolidated Statement of Financial Position13Row ltlt Other non-current assets gtgt (ltlt September 30 2017 gtgt q_act_jan)13User Value 11586 Tsd | PAC Hamon Pierrick Referenced Value (value_1_PQACTJAN02)1313Document Q3_2017_Quarter_Report13Chapter Consolidated Statement of Financial Position13Row ltlt Total assets gtgt (ltlt September 30 2017 gtgt q_act_jan)13User Value 168844 Tsd | PAC Hamon Pierrick Referenced Value (value_1_PQACTJAN02)1313Document Q3_2017_Quarter_Report13Chapter Consolidated Statement of Financial Position13Row ltlt Short-term borrowings gtgt (ltlt September 30 2017 gtgt q_act_jan)13User Value 208 Tsd | PAC Hamon Pierrick Referenced Value (value_1_PQACTJAN02)1313Document Q3_2017_Quarter_Report13Chapter Consolidated Statement of Financial Position13Row ltlt Trade payables accured cost of services gtgt (ltlt September 30 2017 gtgt q_act_jan)13User Value 70745 Tsd | PAC Hamon Pierrick Referenced Value (value_1_PQACTJAN02)1313Document Q3_2017_Quarter_Report13Chapter Consolidated Statement of Financial Position13Row ltlt Other current liabilities gtgt (ltlt September 30 2017 gtgt q_act_jan)13User Value 22538 Tsd | PAC Hamon Pierrick Referenced Value (value_1_PQACTJAN02)1313Document Q3_2017_Quarter_Report13Chapter Consolidated Statement of Financial Position13Row ltlt Long-term borrowings gtgt (ltlt September 30 2017 gtgt q_act_jan)13User Value 197 Tsd | PAC Hamon Pierrick Referenced Value (value_1_PQACTJAN02)1313Document Q3_2017_Quarter_Report13Chapter Consolidated Statement of Financial Position13Row ltlt Other long-term liabilities gtgt (ltlt September 30 2017 gtgt q_act_jan)13User Value 15270 Tsd | PAC Hamon Pierrick Referenced Value (value_1_PQACTJAN02)1313Document Q3_2017_Quarter_Report13Chapter Consolidated Statement of Financial Position13Row ltlt Total liabilities gtgt (ltlt September 30 2017 gtgt q_act_jan)13User Value 108956 Tsd | PAC Hamon Pierrick Referenced Value (value_1_PQACTJAN02)1313Document Q3_2017_Quarter_Report13Chapter Consolidated Statement of Financial Position13Row ltlt Share capital gtgt (ltlt September 30 2017 gtgt q_act_jan)13User Value 238 Tsd | PAC Hamon Pierrick Referenced Value (value_1_PQACTJAN02)1313Document Q3_2017_Quarter_Report13Chapter Consolidated Statement of Financial Position13Row ltlt Reserves treasury shares gtgt (ltlt September 30 2017 gtgt q_act_jan)13User Value 59100 Tsd | PAC Hamon Pierrick Referenced Value (value_1_PQACTJAN02)1313Document Q3_2017_Quarter_Report13Chapter Consolidated Statement of Financial Position13Row ltlt Non-controlling interests gtgt (ltlt September 30 2017 gtgt q_act_jan)13User Value 550 Tsd | PAC Hamon Pierrick Referenced Value (value_1_PQACTJAN02)1313Document Q3_2017_Quarter_Report13Chapter Consolidated Statement of Financial Position13Row ltlt Total equity gtgt (ltlt September 30 2017 gtgt q_act_jan)13User Value 59887 Tsd | PAC Hamon Pierrick Referenced Value (value_1_PQACTJAN02)1313Document Q3_2017_Quarter_Report13Chapter Consolidated Statement of Financial Position13Row ltlt Total equity and liabilities gtgt (ltlt September 30 2017 gtgt q_act_jan)13User Value 168844 Tsd | NWC-Intensity | 18 | 13 | mf24 | |||||||||||||||||||||||||||||||||||||
| DSO 3-m-rolling YTD | 455 | 467 | m22 | |||||||||||||||||||||||||||||||||||||||||||||||||||||||
| DPO 3-m-rolling YTD | 407 | 397 | m23 |
| 2017 | 2016 | |||||||||||||||||||||||||||||||||||||||||||||||||||||||||||||||||||
| Logistics | Q1 2016 | Q2 2016 | HY 2016 | Q3 2016 | Q3YTD 2016 | Q4 2016 | FY 2016 | Q1 2017 | Q2 2017 | HY 2017 | Q3 2017 | Q3YTD 2017 | ||||||||||||||||||||||||||||||||||||||||||||||||||||||||
| Net forwarding revenue | 1402 | 1613 | 3015 | 1374 | 4389 | 1321 | 5709 | 1286 | 1377 | 2663 | 1394 | 4057 | m4 | m4 | r4 PAC Hamon Pierrick Referenced Value (value_1_PQACT02)1313Document Q3_2017_Quarter_Report13Chapter Products quater and year to date13Row ltlt Net forwarding revenue gtgt (ltlt value_3 gtgt q_act)13User Value 13945 Tsd | r4 PAC Hamon Pierrick Referenced Value (value_1_PQACTJAN02)1313Document Q3_2017_Quarter_Report13Chapter Products quater and year to date13Row ltlt Net forwarding revenue gtgt (ltlt value_3 gtgt q_act_jan)13User Value 40573 Tsd | -00 | 00 | (01) | |||||||||||||||||||||||||||||||||||||||||||||||||
| Forwarding expenses | (420) | (607) | (1027) | (429) | (1456) | (397) | (1853) | (460) | (564) | (1024) | (580) | (1604) | m5 | m5 | r5 PAC Hamon Pierrick Referenced Value (value_1_PQACT02)1313Document Q3_2017_Quarter_Report13Chapter Products quater and year to date13Row ltlt Forwarding services from third parties gtgt (ltlt value_3 gtgt q_act)13User Value -5796 Tsd | r5 PAC Hamon Pierrick Referenced Value (value_1_PQACTJAN02)1313Document Q3_2017_Quarter_Report13Chapter Products quater and year to date13Row ltlt Forwarding services from third parties gtgt (ltlt value_3 gtgt q_act_jan)13User Value -16035 Tsd | -00 | 00 | 00 | |||||||||||||||||||||||||||||||||||||||||||||||||
| Gross profit | 982 | 1006 | 1989 | 944 | 2933 | 924 | 3857 | 825 | 813 | 1639 | 815 | 2454 | m6 | m6 | r6 PAC Hamon Pierrick Referenced Value (value_1_PQACT02)1313Document Q3_2017_Quarter_Report13Chapter Products quater and year to date13Row ltlt Gross profit gtgt (ltlt value_3 gtgt q_act)13User Value 8148 Tsd | r6 PAC Hamon Pierrick Referenced Value (value_1_PQACTJAN02)1313Document Q3_2017_Quarter_Report13Chapter Products quater and year to date13Row ltlt Gross profit gtgt (ltlt value_3 gtgt q_act_jan)13User Value 24537 Tsd | 00 | 01 | 01 | |||||||||||||||||||||||||||||||||||||||||||||||||
| Personnel expenses | (574) | (591) | (1166) | (528) | (1694) | (519) | (2213) | (479) | (461) | (940) | (469) | (1409) | m7 | m7 | r7 PAC Hamon Pierrick Referenced Value (value_1_PQACT02)1313Document Q3_2017_Quarter_Report13Chapter Products quater and year to date13Row ltlt Personnel expenses gtgt (ltlt value_3 gtgt q_act)13User Value -4692 Tsd | r7 PAC Hamon Pierrick Referenced Value (value_1_PQACTJAN02)1313Document Q3_2017_Quarter_Report13Chapter Products quater and year to date13Row ltlt Personnel expenses gtgt (ltlt value_3 gtgt q_act_jan)13User Value -14091 Tsd | -00 | (01) | (01) | |||||||||||||||||||||||||||||||||||||||||||||||||
| Other operating expenses | (360) | (363) | (723) | (378) | (1102) | (367) | (1469) | (298) | (298) | (596) | (298) | (894) | m8 | m8 | r8 PAC Hamon Pierrick Referenced Value (value_1_PQACT02)1313Document Q3_2017_Quarter_Report13Chapter Products quater and year to date13Row ltlt Other operating expenses gtgt (ltlt value_3 gtgt q_act)13User Value -2977 Tsd | r8 PAC Hamon Pierrick Referenced Value (value_1_PQACTJAN02)1313Document Q3_2017_Quarter_Report13Chapter Products quater and year to date13Row ltlt Other operating expenses gtgt (ltlt value_3 gtgt q_act_jan)13User Value -8940 Tsd | 00 | 00 | (01) | |||||||||||||||||||||||||||||||||||||||||||||||||
| EBITDA adjusted | 48 | 52 | 100 | 38 | 138 | 37 | 175 | 48 | 54 | 103 | 48 | 151 | m9 | m9 | r9 PAC Hamon Pierrick Referenced Value (value_1_PQACT02)1313Document Q3_2017_Quarter_Report13Chapter Products quater and year to date13Row ltlt EBITDA gtgt (ltlt value_3 gtgt q_act)13User Value 479 Tsd | r9 PAC Hamon Pierrick Referenced Value (value_1_PQACTJAN02)1313Document Q3_2017_Quarter_Report13Chapter Products quater and year to date13Row ltlt EBITDA gtgt (ltlt value_3 gtgt q_act_jan)13User Value 1506 Tsd | 00 | 00 | 00 | |||||||||||||||||||||||||||||||||||||||||||||||||
| Depreciation and amortization | (29) | (29) | (58) | (29) | (88) | (32) | (119) | (25) | (24) | (48) | (21) | (69) | m10 | m10 | r10 PAC Hamon Pierrick Referenced Value (value_1_PQACT02)1313Document Q3_2017_Quarter_Report13Chapter Products quater and year to date13Row ltlt Depreciation and amortization gtgt (ltlt value_3 gtgt q_act)13User Value -208 Tsd | r10 PAC Hamon Pierrick Referenced Value (value_1_PQACTJAN02)1313Document Q3_2017_Quarter_Report13Chapter Products quater and year to date13Row ltlt Depreciation and amortization gtgt (ltlt value_3 gtgt q_act_jan)13User Value -692 Tsd | 00 | 00 | 00 | |||||||||||||||||||||||||||||||||||||||||||||||||
| EBIT adjusted | 18 | 23 | 41 | 09 | 50 | 05 | 56 | 24 | 31 | 54 | 27 | 81 | m11 | m11 | r11 PAC Hamon Pierrick Referenced Value (value_1_PQACT02)1313Document Q3_2017_Quarter_Report13Chapter Products quater and year to date13Row ltlt Operating result (EBIT) gtgt (ltlt value_3 gtgt q_act)13User Value 271 Tsd | r11 PAC Hamon Pierrick Referenced Value (value_1_PQACTJAN02)1313Document Q3_2017_Quarter_Report13Chapter Products quater and year to date13Row ltlt Operating result (EBIT) gtgt (ltlt value_3 gtgt q_act_jan)13User Value 815 Tsd | -00 | 00 | 01 | |||||||||||||||||||||||||||||||||||||||||||||||||
| Non-recurring items | ||||||||||||||||||||||||||||||||||||||||||||||||||||||||||||||||||||
| Restructuring expenses | 00 | (38) | (38) | 00 | (38) | 00 | (38) | 00 | 00 | 00 | 00 | 00 | m13 | m13 | m13 | m13 | 00 | 00 | 00 | |||||||||||||||||||||||||||||||||||||||||||||||||
| EBIT reported | 18 | (15) | 03 | 09 | 12 | 05 | 18 | 24 | 31 | 54 | 27 | 81 | m15 | m15 | r15 PAC Hamon Pierrick Referenced Value (value_1_PQACT02)1313Document Q3_2017_Quarter_Report13Chapter Products quater and year to date13Row ltlt Operating result (EBIT) gtgt (ltlt value_3 gtgt q_act)13User Value 271 Tsd | r15 PAC Hamon Pierrick Referenced Value (value_1_PQACTJAN02)1313Document Q3_2017_Quarter_Report13Chapter Products quater and year to date13Row ltlt Operating result (EBIT) gtgt (ltlt value_3 gtgt q_act_jan)13User Value 815 Tsd | ||||||||||||||||||||||||||||||||||||||||||||||||||||
PAC Hamon Pierrick Referenced Value (value_1_PQACT02)1313Document Q3_2017_Quarter_Report13Chapter Products quater and year to date13Row ltlt Net forwarding revenue gtgt (ltlt value_3 gtgt q_act)13User Value 13945 Tsd | PAC Hamon Pierrick Referenced Value (value_1_PQACTJAN02)1313Document Q3_2017_Quarter_Report13Chapter Products quater and year to date13Row ltlt Net forwarding revenue gtgt (ltlt value_3 gtgt q_act_jan)13User Value 40573 Tsd | PAC Hamon Pierrick Referenced Value (value_1_PQACT02)1313Document Q3_2017_Quarter_Report13Chapter Products quater and year to date13Row ltlt Forwarding services from third parties gtgt (ltlt value_3 gtgt q_act)13User Value -5796 Tsd | GP Change YoY | -19 | -18 | -14 | -16 | s16 | s16 | |||||||||||||||||||||||||||||||||||||||||||||||||||||||||||
| 2017 | 2016 | ||||||||||||||||||||||||||||||||||||||||||||||||||||||||||
| Ocean Freight | Q1 2016 | Q2 2016 | HY 2016 | Q3 2016 | Q3YTD 2016 | Q4 2016 | FY 2016 | Q1 2017 | Q2 2017 | HY 2017 | Q3 2017 | Q3YTD 2017 | |||||||||||||||||||||||||||||||||||||||||||||||
| Net forwarding revenue | 5338 | 4921 | 10259 | 4955 | 15214 | 4770 | 19984 | 4915 | 5172 | 10087 | 5551 | 15637 | m4 | m4 | r4 PAC Hamon Pierrick Referenced Value (value_1_PQACT02)1313Document Q3_2017_Quarter_Report13Chapter Products quater and year to date13Row ltlt Net forwarding revenue gtgt (ltlt value_2 gtgt q_act)13User Value 55506 Tsd | r4 PAC Hamon Pierrick Referenced Value (value_1_PQACTJAN02)1313Document Q3_2017_Quarter_Report13Chapter Products quater and year to date13Row ltlt Net forwarding revenue gtgt (ltlt value_2 gtgt q_act_jan)13User Value 156375 Tsd | 00 | 00 | 00 | ||||||||||||||||||||||||||||||||||||||||
| Forwarding expenses | (4157) | (3773) | (7930) | (3834) | (11764) | (3783) | (15547) | (3860) | (4081) | (7941) | (4463) | (12404) | m5 | m5 | r5 PAC Hamon Pierrick Referenced Value (value_1_PQACT02)1313Document Q3_2017_Quarter_Report13Chapter Products quater and year to date13Row ltlt Forwarding services from third parties gtgt (ltlt value_2 gtgt q_act)13User Value -44629 Tsd | r5 PAC Hamon Pierrick Referenced Value (value_1_PQACTJAN02)1313Document Q3_2017_Quarter_Report13Chapter Products quater and year to date13Row ltlt Forwarding services from third parties gtgt (ltlt value_2 gtgt q_act_jan)13User Value -124038 Tsd | -00 | 00 | 00 | ||||||||||||||||||||||||||||||||||||||||
| Gross profit | 1181 | 1148 | 2329 | 1121 | 3450 | 987 | 4438 | 1055 | 1091 | 2146 | 1088 | 3234 | m6 | m6 | r6 PAC Hamon Pierrick Referenced Value (value_1_PQACT02)1313Document Q3_2017_Quarter_Report13Chapter Products quater and year to date13Row ltlt Gross profit gtgt (ltlt value_2 gtgt q_act)13User Value 10877 Tsd | r6 PAC Hamon Pierrick Referenced Value (value_1_PQACTJAN02)1313Document Q3_2017_Quarter_Report13Chapter Products quater and year to date13Row ltlt Gross profit gtgt (ltlt value_2 gtgt q_act_jan)13User Value 32337 Tsd | 00 | 00 | 01 | ||||||||||||||||||||||||||||||||||||||||
| Personnel expenses | (791) | (752) | (1543) | (755) | (2298) | (721) | (3019) | (779) | (784) | (1564) | (788) | (2352) | m7 | m7 | r7 PAC Hamon Pierrick Referenced Value (value_1_PQACT02)1313Document Q3_2017_Quarter_Report13Chapter Products quater and year to date13Row ltlt Personnel expenses gtgt (ltlt value_2 gtgt q_act)13User Value -7884 Tsd | r7 PAC Hamon Pierrick Referenced Value (value_1_PQACTJAN02)1313Document Q3_2017_Quarter_Report13Chapter Products quater and year to date13Row ltlt Personnel expenses gtgt (ltlt value_2 gtgt q_act_jan)13User Value -23522 Tsd | -00 | 00 | 00 | ||||||||||||||||||||||||||||||||||||||||
| Other operating expenses | (305) | (288) | (594) | (274) | (868) | (275) | (1144) | (271) | (265) | (536) | (290) | (827) | m8 | m8 | r8 PAC Hamon Pierrick Referenced Value (value_1_PQACT02)1313Document Q3_2017_Quarter_Report13Chapter Products quater and year to date13Row ltlt Other operating expenses gtgt (ltlt value_2 gtgt q_act)13User Value -2905 Tsd | r8 PAC Hamon Pierrick Referenced Value (value_1_PQACTJAN02)1313Document Q3_2017_Quarter_Report13Chapter Products quater and year to date13Row ltlt Other operating expenses gtgt (ltlt value_2 gtgt q_act_jan)13User Value -8265 Tsd | -00 | (01) | (02) | ||||||||||||||||||||||||||||||||||||||||
| EBITDA adjusted | 84 | 108 | 192 | 92 | 284 | (09) | 275 | 05 | 41 | 46 | 09 | 55 | m9 | m9 | r9 PAC Hamon Pierrick Referenced Value (value_1_PQACT02)1313Document Q3_2017_Quarter_Report13Chapter Products quater and year to date13Row ltlt EBITDA gtgt (ltlt value_2 gtgt q_act)13User Value 089 Tsd | r9 PAC Hamon Pierrick Referenced Value (value_1_PQACTJAN02)1313Document Q3_2017_Quarter_Report13Chapter Products quater and year to date13Row ltlt EBITDA gtgt (ltlt value_2 gtgt q_act_jan)13User Value 550 Tsd | -00 | 00 | 00 | ||||||||||||||||||||||||||||||||||||||||
| Depreciation and amortization | (41) | (42) | (83) | (41) | (124) | (42) | (166) | (36) | (36) | (72) | (38) | (110) | m10 | m10 | r10 PAC Hamon Pierrick Referenced Value (value_1_PQACT02)1313Document Q3_2017_Quarter_Report13Chapter Products quater and year to date13Row ltlt Depreciation and amortization gtgt (ltlt value_2 gtgt q_act)13User Value -384 Tsd | r10 PAC Hamon Pierrick Referenced Value (value_1_PQACTJAN02)1313Document Q3_2017_Quarter_Report13Chapter Products quater and year to date13Row ltlt Depreciation and amortization gtgt (ltlt value_2 gtgt q_act_jan)13User Value -1102 Tsd | -00 | 00 | 00 | ||||||||||||||||||||||||||||||||||||||||
| EBIT adjusted | 43 | 66 | 109 | 51 | 160 | (51) | 109 | (32) | 06 | (26) | (29) | (55) | m11 | m11 | r11 PAC Hamon Pierrick Referenced Value (value_1_PQACT02)1313Document Q3_2017_Quarter_Report13Chapter Products quater and year to date13Row ltlt Operating result (EBIT) gtgt (ltlt value_2 gtgt q_act)13User Value -295 Tsd | r11 PAC Hamon Pierrick Referenced Value (value_1_PQACTJAN02)1313Document Q3_2017_Quarter_Report13Chapter Products quater and year to date13Row ltlt Operating result (EBIT) gtgt (ltlt value_2 gtgt q_act_jan)13User Value -552 Tsd | 00 | 00 | 00 | ||||||||||||||||||||||||||||||||||||||||
| in of gross profit | 37 | 58 | 47 | 45 | 46 | -51 | 25 | -30 | 05 | -12 | -27 | -17 | m12 | m12 | s12 | s12 | |||||||||||||||||||||||||||||||||||||||||||
| Non-recurring items | 00 | 00 | 00 | ||||||||||||||||||||||||||||||||||||||||||||||||||||||||
| Restructuring expenses | 00 | (97) | (97) | 0 | (97) | (19) | (115) | 00 | 00 | 00 | 00 | 00 | m14 | m14 | m14 | m14 | 00 | 00 | 01 | ||||||||||||||||||||||||||||||||||||||||
| EBIT reported | 43 | (30) | 13 | 51 | 63 | (69) | (06) | (32) | 06 | (26) | (29) | (55) | m16 | m16 | r16 PAC Hamon Pierrick Referenced Value (value_1_PQACT02)1313Document Q3_2017_Quarter_Report13Chapter Products quater and year to date13Row ltlt Operating result (EBIT) gtgt (ltlt value_2 gtgt q_act)13User Value -295 Tsd | r16 PAC Hamon Pierrick Referenced Value (value_1_PQACTJAN02)1313Document Q3_2017_Quarter_Report13Chapter Products quater and year to date13Row ltlt Operating result (EBIT) gtgt (ltlt value_2 gtgt q_act_jan)13User Value -552 Tsd | PAC Hamon Pierrick Referenced Value (value_1_PQACT02)1313Document Q3_2017_Quarter_Report13Chapter Products quater and year to date13Row ltlt Net forwarding revenue gtgt (ltlt value_2 gtgt q_act)13User Value 55506 Tsd | PAC Hamon Pierrick Referenced Value (value_1_PQACTJAN02)1313Document Q3_2017_Quarter_Report13Chapter Products quater and year to date13Row ltlt Net forwarding revenue gtgt (ltlt value_2 gtgt q_act_jan)13User Value 156375 Tsd | PAC Hamon Pierrick Referenced Value (value_1_PQACT02)1313Document Q3_2017_Quarter_Report13Chapter Products quater and year to date13Row ltlt Forwarding services from third parties gtgt (ltlt value_2 gtgt q_act)13User Value -44629 Tsd | 00 | 00 | (01) | |||||||||||||||||||||||||||||||||||||
| in of gross profit | 37 | -26 | 05 | 45 | 18 | -70 | -01 | -30 | 05 | -12 | -27 | -17 | m17 | m17 | s17 | s17 | |||||||||||||||||||||||||||||||||||||||||||
| Ocean Freight volumes (000 tons) | 3482 | 3726 | 7208 | 3787 | 10995 | 3890 | 14885 | 3742 | 3828 | 7570 | 3856 | 11426 | m19 | m19 | m19 | m19 | 00 | 00 | 00 | ||||||||||||||||||||||||||||||||||||||||
| change YoY | -100 | -82 | -91 | -88 | -90 | 08 | -66 | 75 | 27 | 50 | 18 | 39 | m20 | m20 | s20 | s20 | |||||||||||||||||||||||||||||||||||||||||||
| GPTEU (CHF) | 339 | 308 | 323 | 296 | 314 | 254 | 298 | 282 | 285 | 283 | 282 | 283 | m21 | m21 | s21 | s21 | |||||||||||||||||||||||||||||||||||||||||||
| change YoY | 102 | 59 | 80 | -16 | 47 | -176 | -11 | -169 | -75 | -122 | -47 | -98 | m22 | m22 | s22 | s22 | |||||||||||||||||||||||||||||||||||||||||||
| GP change YoY | -5 | -8 | -3 | -6 | s23 | s23 | |||||||||||||||||||||||||||||||||||||||||||||||||||||

17Q3 RESULTS 2017 | 19 OCTOBER 2017 |
INCOME STATEMENT PER QUARTER ndash LOGISTICS
Note Logistics figures in CHF million
Logistics Q1 2016 Q2 2016 Q3 2016 Q3YTD 2016 Q4 2016 FY 2016 Q1 2017 Q2 2017 Q3 2017 Q3YTD 2017Net forwarding revenue 1402 1613 1374 4389 1321 5709 1286 1377 1394 4057 Forwarding expenses (420) (607) (429) (1456) (397) (1853) (460) (564) (580) (1604)Gross profit 982 1006 944 2933 924 3857 825 813 815 2454 Personnel expenses (574) (591) (528) (1694) (519) (2213) (479) (461) (469) (1409)Other operating expenses (360) (363) (378) (1102) (367) (1469) (298) (298) (298) (894)EBITDA adjusted 48 52 38 138 37 175 48 54 48 151 Depreciation and amortization (29) (29) (29) (88) (32) (119) (25) (24) (21) (69)EBIT adjusted 18 23 09 50 05 56 24 31 27 81 Non-recurring itemsRestructuring expenses 00 (38) 00 (38) 00 (38) 00 00 00 00
EBIT reported 18 (15) 09 12 05 18 24 31 27 81
SNVeryHiddenParameterSheet
PAN_ISpQ_Logistics
image1png
18Q3 RESULTS 2017 | 19 OCTOBER 2017 |
BALANCE SHEET
CHF Cash and cash equivalents 3888 2946 (942) -24Trade receivables unbilled forwarding services 9087 9893 806 9Other current assets 1025 1167 142 14Property plant and equipment 635 803 168 26Intangible assets 979 917 (62) -6Other non-current assets 990 1133 143 14Total assets 16606 16859 253 2
Short-term borrowings 23 21 (02) -10Trade payables accured cost of services 6524 7075 551 8Other current liabilities 2439 2254 (185) -8Long-Term borrowings 00 20 20 naOther long-term liabilities 1449 1527 78 5Total liabilities 10436 10896 460 4Share capital 24 24 (00) -1Reserves treasury shares 6057 5884 (173) -3Non-controlling interests 89 55 (34) -38Total equity 6170 5963 (207) -3Total equity and liabilities 16606 16859 253 2
31-Dec-16 30-Sept-17Change in
SNVeryHiddenParameterSheet
PAN_BalanceSheet
image1png
19Q3 RESULTS 2017 | 19 OCTOBER 2017 |
CASH FLOW
Note Figures in CHF million
30-Sep-16 30-Sep-17Change in
Cash flow before changes in working capital 1029 1075 Changes in working capital 357 (477)Cash from operations 1386 599
Interest and income taxes paid (292) (331)Net cash from operating activities 1094 267 -76
Net cash from investing activities (342) (409) 20
Free cash flow 752 (141) -119
Net cash used in financing activities (858) (894) 4
Net increase (decrease) in cash and cash equivalents (106) (1035)Cash and cash equivalents at beginning of period 3923 3888 Effect of exchange rate changes (17) 93 Cash and cash equivalents at end of period 3799 2946
SNVeryHiddenParameterSheet
Tabele PAN_Cashflow
Reported cash and cash equivalents at 31122016Profit YTD 092017Other non-cash items (eg DampA)Changes in working capitalInterest and income taxes paidNet cash from investing activitiesFinancing activitiesdividendEffect of exchange rate changesReported cash and cash equivalents at 300920173887843716999999999996448614155374652852799999999999728527999999999997Reported cash and cash equivalents at 31122016Profit YTD 092017Other non-cash items (eg DampA)Changes in working capitalInterest and income taxes paidNet cash from investing activitiesFinancing activitiesdividendEffect of exchange rate changesReported cash and cash equivalents at 30092017388784839591476633114085893793329463
- Nine months results 2017
- Slide Number 2
- ACHIEVEMENTS and key figures
- Third consecutive quarter with GP and EBIT Growth
- Operating and financial review
- Air Freight Strong and profitable growth
- Ocean Freight quarterly loss due to margin Stagnation
- Logistics improved profitability
- Outlook and priorities 2017
- outlook and priorities 2017
- Next EVENTs
- Disclaimer
- Appendix
- Income statement per quarter ndash Group
- Income statement per quarter ndash Air Freight
- Income statement per quarter ndash Ocean Freight
- Income statement per quarter ndash Logistics
- Balance sheet
- Cash flow
-
| 30-Sep-16 | 30-Sep-17 | Change in | ||||||||||||||||||||||||||||||||||||||||||||||||||||||
| Cash flow before changes in working capital | 1029 | 1075 | r2 PAC Hamon Pierrick Referenced Value (value_1_PQACTJAN02)1313Document Q3_2017_Quarter_Report13Chapter Consolidated Statement of Cash Flows13Row ltlt Subtotal cash flow from operations gtgt (ltlt 2017 gtgt q_act_jan)13User Value 10749 Tsd | PY IS MANUAL | ||||||||||||||||||||||||||||||||||||||||||||||||||||
| Changes in working capital | 357 | (477) | r3 PAC Hamon Pierrick Referenced Value (value_1_PQACTJAN02)1313Document Q3_2017_Quarter_Report13Chapter Consolidated Statement of Cash Flows1313-7973 Tsd - ltlt (Increase) decrease receivables other current assets and unbilled forwarding services gtgt (ltlt 2017 gtgt q_act_jan)134406 Tsd - ltlt Increase (decrease) payables and accruals incl accrued cost of service gtgt (ltlt 2017 gtgt q_act_jan)13-472 Tsd - ltlt Increase (decrease) non-current provisions and other liabilities gtgt (ltlt 2017 gtgt q_act_jan)13-749 Tsd - ltlt Increase (decrease) current provisions and other liabilities gtgt (ltlt 2017 gtgt q_act_jan)13---------------------13-4787 Tsd (Total) | |||||||||||||||||||||||||||||||||||||||||||||||||||||
| Cash from operations | 1386 | 599 | r4 PAC Hamon Pierrick Referenced Value (value_1_PQACTJAN02)1313Document Q3_2017_Quarter_Report13Chapter Consolidated Statement of Cash Flows13Row ltlt Cash generated from operations gtgt (ltlt 2017 gtgt q_act_jan)13User Value 5963 Tsd | |||||||||||||||||||||||||||||||||||||||||||||||||||||
| Interest and income taxes paid | (292) | (331) | r6 PAC Hamon Pierrick Referenced Value (value_1_PQACTJAN02)1313Document Q3_2017_Quarter_Report13Chapter Consolidated Statement of Cash Flows1313-136 Tsd - ltlt Interest paid gtgt (ltlt 2017 gtgt q_act_jan)13-3175 Tsd - ltlt Income taxes paid gtgt (ltlt 2017 gtgt q_act_jan)13---------------------13-3311 Tsd (Total) | |||||||||||||||||||||||||||||||||||||||||||||||||||||
| Net cash from operating activities | 1094 | 267 | -76 | r7 PAC Hamon Pierrick Referenced Value (value_1_PQACTJAN02)1313Document Q3_2017_Quarter_Report13Chapter Consolidated Statement of Cash Flows13Row ltlt Net cash from operating activities gtgt (ltlt 2017 gtgt q_act_jan)13User Value 2652 Tsd | ||||||||||||||||||||||||||||||||||||||||||||||||||||
| Net cash from investing activities | (342) | (409) | 20 | r9 PAC Hamon Pierrick Referenced Value (value_1_PQACTJAN02)1313Document Q3_2017_Quarter_Report13Chapter Consolidated Statement of Cash Flows13Row ltlt Net cash used in investing activities gtgt (ltlt 2017 gtgt q_act_jan)13User Value -4063 Tsd | ||||||||||||||||||||||||||||||||||||||||||||||||||||
| Free cash flow | 752 | (141) | -119 | r11 PAC Hamon Pierrick Referenced Value (value_1_PQACTJAN02)1313Document Q3_2017_Quarter_Report13Chapter Consolidated Statement of Cash Flows13Row ltlt Free cash flow gtgt (ltlt 2017 gtgt q_act_jan)13User Value -1411 Tsd | ||||||||||||||||||||||||||||||||||||||||||||||||||||
| Net cash used in financing activities | (858) | (894) | 4 | r13 PAC Hamon Pierrick Referenced Value (value_1_PQACTJAN02)1313Document Q3_2017_Quarter_Report13Chapter Consolidated Statement of Cash Flows13Row ltlt Net cash used in financing activities gtgt (ltlt 2017 gtgt q_act_jan)13User Value -8937 Tsd | ||||||||||||||||||||||||||||||||||||||||||||||||||||
| Net increase (decrease) in cash and cash equivalents | (106) | (1035) | r15 PAC Hamon Pierrick Referenced Value (value_1_PQACTJAN02)1313Document Q3_2017_Quarter_Report13Chapter Consolidated Statement of Cash Flows13Row ltlt Net increase (decrease) in cash and cash equivalents gtgt (ltlt 2017 gtgt q_act_jan)13User Value -10348 Tsd | |||||||||||||||||||||||||||||||||||||||||||||||||||||
| Cash and cash equivalents at beginning of period | 3923 | 3888 | r16 PAC Hamon Pierrick Referenced Value (value_1_PQACTJAN02)1313Document Q3_2017_Quarter_Report13Chapter Consolidated Statement of Cash Flows13Row ltlt Cash and cash equivalents at the beginning of the period gtgt (ltlt 2017 gtgt q_act_jan)13User Value 38878 Tsd | |||||||||||||||||||||||||||||||||||||||||||||||||||||
| Effect of exchange rate changes | (17) | 93 | r17 PAC Hamon Pierrick Referenced Value (value_1_PQACTJAN02)1313Document Q3_2017_Quarter_Report13Chapter Consolidated Statement of Cash Flows13Row ltlt Effect of exchange rate changes on cash and cash equivalents gtgt (ltlt 2017 gtgt q_act_jan)13User Value 933 Tsd | |||||||||||||||||||||||||||||||||||||||||||||||||||||
| Cash and cash equivalents at end of period | 3799 | 2946 | r18 PAC Hamon Pierrick Referenced Value (value_1_PQACTJAN02)1313Document Q3_2017_Quarter_Report13Chapter Consolidated Statement of Cash Flows13Row ltlt Cash and cash equivalents at the end of the period gtgt (ltlt 2017 gtgt q_act_jan)13User Value 29463 Tsd | |||||||||||||||||||||||||||||||||||||||||||||||||||||
| Reported cash and cash equivalents at 31122016 | 3888 | r21 PAC Hamon Pierrick Referenced Value (value_1_PQACTJAN02)1313Document Q3_2017_Quarter_Report13Chapter Consolidated Statement of Cash Flows13Row ltlt Cash and cash equivalents at the beginning of the period gtgt (ltlt 2017 gtgt q_act_jan)13User Value 38878 Tsd | Reported cash and cash equivalents at 31122016 | 3888 | ||||||||||||||||||||||||||||||||||||||||||||||||||||
| Profit YTD 092017 | 4839 | r19 PAC Hamon Pierrick Referenced Value (value_1_PQACTJAN02)1313Document Q3_2017_Quarter_Report13Chapter Consolidated Statement of Cash Flows13Row ltlt Profit gtgt (ltlt 2017 gtgt q_act_jan)13User Value 4839 Tsd | Profit YTD 092017 | 3888 | 484 | |||||||||||||||||||||||||||||||||||||||||||||||||||
| Other non-cash items (eg DampA) | 591 | r23 PAC Hamon Pierrick Referenced Value (value_1_PQACTJAN02)1313Document Q3_2017_Quarter_Report13Chapter Consolidated Statement of Cash Flows13131565 Tsd - ltlt Depreciation of property plant and equipment gtgt (ltlt 2017 gtgt q_act_jan)131616 Tsd - ltlt Amortization of intangible assets gtgt (ltlt 2017 gtgt q_act_jan)13-165 Tsd - ltlt Interest income and dividend on available-for-sale financial assets gtgt (ltlt 2017 gtgt q_act_jan)13-167 Tsd - ltlt Exchange differences gtgt (ltlt 2017 gtgt q_act_jan)13-025 Tsd - ltlt Loss (gain) on sales of property plant and equipment gtgt (ltlt 2017 gtgt q_act_jan)13000 Tsd - ltlt Loss (gain) on sales of financial assets gtgt (ltlt 2017 gtgt q_act_jan)13497 Tsd - ltlt Expenses for share-based compensation plans gtgt (ltlt 2017 gtgt q_act_jan)13238 Tsd - ltlt Other non-cash (income) and expenses gtgt (ltlt 2017 gtgt q_act_jan)132351 Tsd - ltlt Income tax expenses gtgt (ltlt 2017 gtgt q_act_jan)13---------------------135910 Tsd (Total) | Other non-cash items (eg DampA) | 4372 | 591 | |||||||||||||||||||||||||||||||||||||||||||||||||||
| Changes in working capital | -4766 | r24 PAC Hamon Pierrick Referenced Value (value_1_PQACTJAN02)1313Document Q3_2017_Quarter_Report13Chapter Consolidated Statement of Cash Flows1313-7973 Tsd - ltlt (Increase) decrease receivables other current assets and unbilled forwarding services gtgt (ltlt 2017 gtgt q_act_jan)134406 Tsd - ltlt Increase (decrease) payables and accruals incl accrued cost of service gtgt (ltlt 2017 gtgt q_act_jan)13-472 Tsd - ltlt Increase (decrease) non-current provisions and other liabilities gtgt (ltlt 2017 gtgt q_act_jan)13-749 Tsd - ltlt Increase (decrease) current provisions and other liabilities gtgt (ltlt 2017 gtgt q_act_jan)13---------------------13-4787 Tsd (Total) | Changes in working capital | 4486 | 477 | neg | ||||||||||||||||||||||||||||||||||||||||||||||||||
| Interest and income taxes paid | -3311 | r25 PAC Hamon Pierrick Referenced Value (value_1_PQACTJAN02)1313Document Q3_2017_Quarter_Report13Chapter Consolidated Statement of Cash Flows1313-136 Tsd - ltlt Interest paid gtgt (ltlt 2017 gtgt q_act_jan)13-3175 Tsd - ltlt Income taxes paid gtgt (ltlt 2017 gtgt q_act_jan)13---------------------13-3311 Tsd (Total) | Interest and income taxes paid | 4155 | 331 | neg | ||||||||||||||||||||||||||||||||||||||||||||||||||
| Net cash from investing activities | -4085 | r26 PAC Hamon Pierrick Referenced Value (value_1_PQACTJAN02)1313Document Q3_2017_Quarter_Report13Chapter Consolidated Statement of Cash Flows13Row ltlt Net cash used in investing activities gtgt (ltlt 2017 gtgt q_act_jan)13User Value -4063 Tsd | Net cash from investing activities | 3747 | 409 | neg | ||||||||||||||||||||||||||||||||||||||||||||||||||
| Financing activitiesdividend | -8937 | r27 PAC Hamon Pierrick Referenced Value (value_1_PQACTJAN02)1313Document Q3_2017_Quarter_Report13Chapter Consolidated Statement of Cash Flows13Row ltlt Net cash used in financing activities gtgt (ltlt 2017 gtgt q_act_jan)13User Value -8937 Tsd | Financing activitiesdividend | 2853 | 894 | neg | ||||||||||||||||||||||||||||||||||||||||||||||||||
| Effect of exchange rate changes | 933 | r28 PAC Hamon Pierrick Referenced Value (value_1_PQACTJAN02)1313Document Q3_2017_Quarter_Report13Chapter Consolidated Statement of Cash Flows13Row ltlt Effect of exchange rate changes on cash and cash equivalents gtgt (ltlt 2017 gtgt q_act_jan)13User Value 933 Tsd | Effect of exchange rate changes | 2853 | 93 | |||||||||||||||||||||||||||||||||||||||||||||||||||
| Reported cash and cash equivalents at 30092017 | 29463 | r29 PAC Hamon Pierrick Referenced Value (value_1_PQACTJAN02)1313Document Q3_2017_Quarter_Report13Chapter Consolidated Statement of Cash Flows13Row ltlt Cash and cash equivalents at the end of the period gtgt (ltlt 2017 gtgt q_act_jan)13User Value 29463 Tsd | PAC Hamon Pierrick Referenced Value (value_1_PQACTJAN02)1313Document Q3_2017_Quarter_Report13Chapter Consolidated Statement of Cash Flows13Row ltlt Subtotal cash flow from operations gtgt (ltlt 2017 gtgt q_act_jan)13User Value 10749 Tsd | PAC Hamon Pierrick Referenced Value (value_1_PQACTJAN02)1313Document Q3_2017_Quarter_Report13Chapter Consolidated Statement of Cash Flows1313-7973 Tsd - ltlt (Increase) decrease receivables other current assets and unbilled forwarding services gtgt (ltlt 2017 gtgt q_act_jan)134406 Tsd - ltlt Increase (decrease) payables and accruals incl accrued cost of service gtgt (ltlt 2017 gtgt q_act_jan)13-472 Tsd - ltlt Increase (decrease) non-current provisions and other liabilities gtgt (ltlt 2017 gtgt q_act_jan)13-749 Tsd - ltlt Increase (decrease) current provisions and other liabilities gtgt (ltlt 2017 gtgt q_act_jan)13---------------------13-4787 Tsd (Total) | PAC Hamon Pierrick Referenced Value (value_1_PQACTJAN02)1313Document Q3_2017_Quarter_Report13Chapter Consolidated Statement of Cash Flows13Row ltlt Cash generated from operations gtgt (ltlt 2017 gtgt q_act_jan)13User Value 5963 Tsd | PAC Hamon Pierrick Referenced Value (value_1_PQACTJAN02)1313Document Q3_2017_Quarter_Report13Chapter Consolidated Statement of Cash Flows1313-136 Tsd - ltlt Interest paid gtgt (ltlt 2017 gtgt q_act_jan)13-3175 Tsd - ltlt Income taxes paid gtgt (ltlt 2017 gtgt q_act_jan)13---------------------13-3311 Tsd (Total) | PAC Hamon Pierrick Referenced Value (value_1_PQACTJAN02)1313Document Q3_2017_Quarter_Report13Chapter Consolidated Statement of Cash Flows13Row ltlt Net cash from operating activities gtgt (ltlt 2017 gtgt q_act_jan)13User Value 2652 Tsd | PAC Hamon Pierrick Referenced Value (value_1_PQACTJAN02)1313Document Q3_2017_Quarter_Report13Chapter Consolidated Statement of Cash Flows13Row ltlt Net cash used in investing activities gtgt (ltlt 2017 gtgt q_act_jan)13User Value -4063 Tsd | PAC Hamon Pierrick Referenced Value (value_1_PQACTJAN02)1313Document Q3_2017_Quarter_Report13Chapter Consolidated Statement of Cash Flows13Row ltlt Free cash flow gtgt (ltlt 2017 gtgt q_act_jan)13User Value -1411 Tsd | PAC Hamon Pierrick Referenced Value (value_1_PQACTJAN02)1313Document Q3_2017_Quarter_Report13Chapter Consolidated Statement of Cash Flows13Row ltlt Net cash used in financing activities gtgt (ltlt 2017 gtgt q_act_jan)13User Value -8937 Tsd | PAC Hamon Pierrick Referenced Value (value_1_PQACTJAN02)1313Document Q3_2017_Quarter_Report13Chapter Consolidated Statement of Cash Flows13Row ltlt Net increase (decrease) in cash and cash equivalents gtgt (ltlt 2017 gtgt q_act_jan)13User Value -10348 Tsd | PAC Hamon Pierrick Referenced Value (value_1_PQACTJAN02)1313Document Q3_2017_Quarter_Report13Chapter Consolidated Statement of Cash Flows13Row ltlt Cash and cash equivalents at the beginning of the period gtgt (ltlt 2017 gtgt q_act_jan)13User Value 38878 Tsd | PAC Hamon Pierrick Referenced Value (value_1_PQACTJAN02)1313Document Q3_2017_Quarter_Report13Chapter Consolidated Statement of Cash Flows13Row ltlt Effect of exchange rate changes on cash and cash equivalents gtgt (ltlt 2017 gtgt q_act_jan)13User Value 933 Tsd | PAC Hamon Pierrick Referenced Value (value_1_PQACTJAN02)1313Document Q3_2017_Quarter_Report13Chapter Consolidated Statement of Cash Flows13Row ltlt Cash and cash equivalents at the end of the period gtgt (ltlt 2017 gtgt q_act_jan)13User Value 29463 Tsd | PAC Hamon Pierrick Referenced Value (value_1_PQACTJAN02)1313Document Q3_2017_Quarter_Report13Chapter Consolidated Statement of Cash Flows13Row ltlt Cash and cash equivalents at the beginning of the period gtgt (ltlt 2017 gtgt q_act_jan)13User Value 38878 Tsd | PAC Hamon Pierrick Referenced Value (value_1_PQACTJAN02)1313Document Q3_2017_Quarter_Report13Chapter Consolidated Statement of Cash Flows13Row ltlt Profit gtgt (ltlt 2017 gtgt q_act_jan)13User Value 4839 Tsd | PAC Hamon Pierrick Referenced Value (value_1_PQACTJAN02)1313Document Q3_2017_Quarter_Report13Chapter Consolidated Statement of Cash Flows13131565 Tsd - ltlt Depreciation of property plant and equipment gtgt (ltlt 2017 gtgt q_act_jan)131616 Tsd - ltlt Amortization of intangible assets gtgt (ltlt 2017 gtgt q_act_jan)13-165 Tsd - ltlt Interest income and dividend on available-for-sale financial assets gtgt (ltlt 2017 gtgt q_act_jan)13-167 Tsd - ltlt Exchange differences gtgt (ltlt 2017 gtgt q_act_jan)13-025 Tsd - ltlt Loss (gain) on sales of property plant and equipment gtgt (ltlt 2017 gtgt q_act_jan)13000 Tsd - ltlt Loss (gain) on sales of financial assets gtgt (ltlt 2017 gtgt q_act_jan)13497 Tsd - ltlt Expenses for share-based compensation plans gtgt (ltlt 2017 gtgt q_act_jan)13238 Tsd - ltlt Other non-cash (income) and expenses gtgt (ltlt 2017 gtgt q_act_jan)132351 Tsd - ltlt Income tax expenses gtgt (ltlt 2017 gtgt q_act_jan)13---------------------135910 Tsd (Total) | PAC Hamon Pierrick Referenced Value (value_1_PQACTJAN02)1313Document Q3_2017_Quarter_Report13Chapter Consolidated Statement of Cash Flows1313-7973 Tsd - ltlt (Increase) decrease receivables other current assets and unbilled forwarding services gtgt (ltlt 2017 gtgt q_act_jan)134406 Tsd - ltlt Increase (decrease) payables and accruals incl accrued cost of service gtgt (ltlt 2017 gtgt q_act_jan)13-472 Tsd - ltlt Increase (decrease) non-current provisions and other liabilities gtgt (ltlt 2017 gtgt q_act_jan)13-749 Tsd - ltlt Increase (decrease) current provisions and other liabilities gtgt (ltlt 2017 gtgt q_act_jan)13---------------------13-4787 Tsd (Total) | PAC Hamon Pierrick Referenced Value (value_1_PQACTJAN02)1313Document Q3_2017_Quarter_Report13Chapter Consolidated Statement of Cash Flows1313-136 Tsd - ltlt Interest paid gtgt (ltlt 2017 gtgt q_act_jan)13-3175 Tsd - ltlt Income taxes paid gtgt (ltlt 2017 gtgt q_act_jan)13---------------------13-3311 Tsd (Total) | Reported cash and cash equivalents at 30092017 | 2946 | 3888 | ||||||||||||||||||||||||||||||||||
| 484 | ||||||||||||||||||||||||||||||||||||||||||||||||||||||||
| 591 | ||||||||||||||||||||||||||||||||||||||||||||||||||||||||
| (479) | ||||||||||||||||||||||||||||||||||||||||||||||||||||||||
| (331) | ||||||||||||||||||||||||||||||||||||||||||||||||||||||||
| (406) | ||||||||||||||||||||||||||||||||||||||||||||||||||||||||
| (894) | ||||||||||||||||||||||||||||||||||||||||||||||||||||||||
| 93 | ||||||||||||||||||||||||||||||||||||||||||||||||||||||||
| 2946 |
| 31-Dec-16 | 30-Sept-17 | Change in | ||||||||||||||||||||||||||||||||||||||||||||||||||||||||
| CHF | ||||||||||||||||||||||||||||||||||||||||||||||||||||||||||
| Cash and cash equivalents | 3888 | 2946 | (942) | -24 | r3 PAC Hamon Pierrick Referenced Value (value_1_PQACTJAN02)1313Document Q3_2017_Quarter_Report13Chapter Consolidated Statement of Financial Position13Row ltlt Cash and cash equivalents gtgt (ltlt September 30 2017 gtgt q_act_jan)13User Value 29463 Tsd | 3888 | 3999 | 111 | 3 | |||||||||||||||||||||||||||||||||||||||||||||||||
| Trade receivables unbilled forwarding services | 9087 | 9893 | 806 | 9 | r4 PAC Hamon Pierrick Referenced Value (value_1_PQACTJAN02)1313Document Q3_2017_Quarter_Report13Chapter Consolidated Statement of Financial Position13Row ltlt Trade receivables unbilled forwarding services gtgt (ltlt September 30 2017 gtgt q_act_jan)13User Value 98929 Tsd | 9087 | 8693 | -394 | -4 | |||||||||||||||||||||||||||||||||||||||||||||||||
| Other current assets | 1025 | 1167 | 142 | 14 | r5 PAC Hamon Pierrick Referenced Value (value_1_PQACTJAN02)1313Document Q3_2017_Quarter_Report13Chapter Consolidated Statement of Financial Position13Row ltlt Other current assets gtgt (ltlt September 30 2017 gtgt q_act_jan)13User Value 11671 Tsd | 1025 | 1335 | 31 | 30 | |||||||||||||||||||||||||||||||||||||||||||||||||
| Property plant and equipment | 635 | 803 | 168 | 26 | r6 PAC Hamon Pierrick Referenced Value (value_1_PQACTJAN02)1313Document Q3_2017_Quarter_Report13Chapter Consolidated Statement of Financial Position13Row ltlt Property plant and equipment gtgt (ltlt September 30 2017 gtgt q_act_jan)13User Value 8028 Tsd | 635 | 651 | 16 | 3 | |||||||||||||||||||||||||||||||||||||||||||||||||
| Intangible assets | 979 | 917 | (62) | -6 | r7 PAC Hamon Pierrick Referenced Value (value_1_PQACTJAN02)1313Document Q3_2017_Quarter_Report13Chapter Consolidated Statement of Financial Position13Row ltlt Intangible assets gtgt (ltlt September 30 2017 gtgt q_act_jan)13User Value 9168 Tsd | 979 | 926 | -53 | -5 | |||||||||||||||||||||||||||||||||||||||||||||||||
| Other non-current assets | 990 | 1133 | 143 | 14 | r8 PAC Hamon Pierrick Referenced Value (value_1_PQACTJAN02)1313Document Q3_2017_Quarter_Report13Chapter Consolidated Statement of Financial Position13Row ltlt Other non-current assets gtgt (ltlt September 30 2017 gtgt q_act_jan)13User Value 11586 Tsd | 99 | 1073 | 83 | 8 | |||||||||||||||||||||||||||||||||||||||||||||||||
| Total assets | 16606 | 16859 | 253 | 2 | r9 PAC Hamon Pierrick Referenced Value (value_1_PQACTJAN02)1313Document Q3_2017_Quarter_Report13Chapter Consolidated Statement of Financial Position13Row ltlt Total assets gtgt (ltlt September 30 2017 gtgt q_act_jan)13User Value 168844 Tsd | 166060 | 166780 | 72 | 0 | |||||||||||||||||||||||||||||||||||||||||||||||||
| 0 | ||||||||||||||||||||||||||||||||||||||||||||||||||||||||||
| Short-term borrowings | 23 | 21 | (02) | -10 | r11 PAC Hamon Pierrick Referenced Value (value_1_PQACTJAN02)1313Document Q3_2017_Quarter_Report13Chapter Consolidated Statement of Financial Position13Row ltlt Short-term borrowings gtgt (ltlt September 30 2017 gtgt q_act_jan)13User Value 208 Tsd | 23 | 05 | -18 | -78 | |||||||||||||||||||||||||||||||||||||||||||||||||
| Trade payables accured cost of services | 6524 | 7075 | 551 | 8 | r12 PAC Hamon Pierrick Referenced Value (value_1_PQACTJAN02)1313Document Q3_2017_Quarter_Report13Chapter Consolidated Statement of Financial Position13Row ltlt Trade payables accured cost of services gtgt (ltlt September 30 2017 gtgt q_act_jan)13User Value 70745 Tsd | 6524 | 620 | -324 | -5 | |||||||||||||||||||||||||||||||||||||||||||||||||
| Other current liabilities | 2439 | 2254 | (185) | -8 | r13 PAC Hamon Pierrick Referenced Value (value_1_PQACTJAN02)1313Document Q3_2017_Quarter_Report13Chapter Consolidated Statement of Financial Position13Row ltlt Other current liabilities gtgt (ltlt September 30 2017 gtgt q_act_jan)13User Value 22538 Tsd | 2439 | 2592 | 153 | 6 | |||||||||||||||||||||||||||||||||||||||||||||||||
| Long-Term borrowings | 00 | 20 | 20 | na | r20 PAC Hamon Pierrick Referenced Value (value_1_PQACTJAN02)1313Document Q3_2017_Quarter_Report13Chapter Consolidated Statement of Financial Position13Row ltlt Long-term borrowings gtgt (ltlt September 30 2017 gtgt q_act_jan)13User Value 197 Tsd | 0 | 12 | 12 | na | |||||||||||||||||||||||||||||||||||||||||||||||||
| Other long-term liabilities | 1449 | 1527 | 78 | 5 | r21 PAC Hamon Pierrick Referenced Value (value_1_PQACTJAN02)1313Document Q3_2017_Quarter_Report13Chapter Consolidated Statement of Financial Position13Row ltlt Other long-term liabilities gtgt (ltlt September 30 2017 gtgt q_act_jan)13User Value 15270 Tsd | 1449 | 1479 | 3 | 2 | |||||||||||||||||||||||||||||||||||||||||||||||||
| Total liabilities | 10436 | 10896 | 460 | 4 | r14 PAC Hamon Pierrick Referenced Value (value_1_PQACTJAN02)1313Document Q3_2017_Quarter_Report13Chapter Consolidated Statement of Financial Position13Row ltlt Total liabilities gtgt (ltlt September 30 2017 gtgt q_act_jan)13User Value 108956 Tsd | 104360 | 102880 | -148 | -1 | |||||||||||||||||||||||||||||||||||||||||||||||||
| Share capital | 24 | 24 | (00) | -1 | r15 PAC Hamon Pierrick Referenced Value (value_1_PQACTJAN02)1313Document Q3_2017_Quarter_Report13Chapter Consolidated Statement of Financial Position13Row ltlt Share capital gtgt (ltlt September 30 2017 gtgt q_act_jan)13User Value 238 Tsd | 24 | 24 | 0 | 0 | |||||||||||||||||||||||||||||||||||||||||||||||||
| Reserves treasury shares | 6057 | 5884 | (173) | -3 | r16 PAC Hamon Pierrick Referenced Value (value_1_PQACTJAN02)1313Document Q3_2017_Quarter_Report13Chapter Consolidated Statement of Financial Position13Row ltlt Reserves treasury shares gtgt (ltlt September 30 2017 gtgt q_act_jan)13User Value 59100 Tsd | 6057 | 6285 | 228 | 4 | |||||||||||||||||||||||||||||||||||||||||||||||||
| Non-controlling interests | 89 | 55 | (34) | -38 | r17 PAC Hamon Pierrick Referenced Value (value_1_PQACTJAN02)1313Document Q3_2017_Quarter_Report13Chapter Consolidated Statement of Financial Position13Row ltlt Non-controlling interests gtgt (ltlt September 30 2017 gtgt q_act_jan)13User Value 550 Tsd | 89 | 81 | -08 | -9 | |||||||||||||||||||||||||||||||||||||||||||||||||
| Total equity | 6170 | 5963 | (207) | -3 | r18 PAC Hamon Pierrick Referenced Value (value_1_PQACTJAN02)1313Document Q3_2017_Quarter_Report13Chapter Consolidated Statement of Financial Position13Row ltlt Total equity gtgt (ltlt September 30 2017 gtgt q_act_jan)13User Value 59887 Tsd | 617 | 639 | 22 | 4 | |||||||||||||||||||||||||||||||||||||||||||||||||
| Total equity and liabilities | 16606 | 16859 | 253 | 2 | r19 PAC Hamon Pierrick Referenced Value (value_1_PQACTJAN02)1313Document Q3_2017_Quarter_Report13Chapter Consolidated Statement of Financial Position13Row ltlt Total equity and liabilities gtgt (ltlt September 30 2017 gtgt q_act_jan)13User Value 168844 Tsd | 166060 | 166780 | 72 | 0 | |||||||||||||||||||||||||||||||||||||||||||||||||
| KPIs | 31-Dec-16 | 30-Jun-17 | ||||||||||||||||||||||||||||||||||||||||||||||||||||||||
| Equity Ratio | 372 | 354 | s20 PAC Hamon Pierrick Referenced Value (value_1_PQACTJAN02)1313Document Q2_2017_Quarter_Report13Chapter Consolidated Statement of Financial Position13Row ltlt Total equity and liabilities gtgt (ltlt June 30 2017 gtgt q_act_jan)13User Value 153472 Tsd | |||||||||||||||||||||||||||||||||||||||||||||||||||||||
PAC Hamon Pierrick Referenced Value (value_1_PQACTJAN02)1313Document Q3_2017_Quarter_Report13Chapter Consolidated Statement of Financial Position13Row ltlt Cash and cash equivalents gtgt (ltlt September 30 2017 gtgt q_act_jan)13User Value 29463 Tsd | PAC Hamon Pierrick Referenced Value (value_1_PQACTJAN02)1313Document Q3_2017_Quarter_Report13Chapter Consolidated Statement of Financial Position13Row ltlt Trade receivables unbilled forwarding services gtgt (ltlt September 30 2017 gtgt q_act_jan)13User Value 98929 Tsd | PAC Hamon Pierrick Referenced Value (value_1_PQACTJAN02)1313Document Q3_2017_Quarter_Report13Chapter Consolidated Statement of Financial Position13Row ltlt Other current assets gtgt (ltlt September 30 2017 gtgt q_act_jan)13User Value 11671 Tsd | PAC Hamon Pierrick Referenced Value (value_1_PQACTJAN02)1313Document Q3_2017_Quarter_Report13Chapter Consolidated Statement of Financial Position13Row ltlt Property plant and equipment gtgt (ltlt September 30 2017 gtgt q_act_jan)13User Value 8028 Tsd | PAC Hamon Pierrick Referenced Value (value_1_PQACTJAN02)1313Document Q3_2017_Quarter_Report13Chapter Consolidated Statement of Financial Position13Row ltlt Intangible assets gtgt (ltlt September 30 2017 gtgt q_act_jan)13User Value 9168 Tsd | PAC Hamon Pierrick Referenced Value (value_1_PQACTJAN02)1313Document Q3_2017_Quarter_Report13Chapter Consolidated Statement of Financial Position13Row ltlt Other non-current assets gtgt (ltlt September 30 2017 gtgt q_act_jan)13User Value 11586 Tsd | PAC Hamon Pierrick Referenced Value (value_1_PQACTJAN02)1313Document Q3_2017_Quarter_Report13Chapter Consolidated Statement of Financial Position13Row ltlt Total assets gtgt (ltlt September 30 2017 gtgt q_act_jan)13User Value 168844 Tsd | PAC Hamon Pierrick Referenced Value (value_1_PQACTJAN02)1313Document Q3_2017_Quarter_Report13Chapter Consolidated Statement of Financial Position13Row ltlt Short-term borrowings gtgt (ltlt September 30 2017 gtgt q_act_jan)13User Value 208 Tsd | PAC Hamon Pierrick Referenced Value (value_1_PQACTJAN02)1313Document Q3_2017_Quarter_Report13Chapter Consolidated Statement of Financial Position13Row ltlt Trade payables accured cost of services gtgt (ltlt September 30 2017 gtgt q_act_jan)13User Value 70745 Tsd | PAC Hamon Pierrick Referenced Value (value_1_PQACTJAN02)1313Document Q3_2017_Quarter_Report13Chapter Consolidated Statement of Financial Position13Row ltlt Other current liabilities gtgt (ltlt September 30 2017 gtgt q_act_jan)13User Value 22538 Tsd | PAC Hamon Pierrick Referenced Value (value_1_PQACTJAN02)1313Document Q3_2017_Quarter_Report13Chapter Consolidated Statement of Financial Position13Row ltlt Long-term borrowings gtgt (ltlt September 30 2017 gtgt q_act_jan)13User Value 197 Tsd | PAC Hamon Pierrick Referenced Value (value_1_PQACTJAN02)1313Document Q3_2017_Quarter_Report13Chapter Consolidated Statement of Financial Position13Row ltlt Other long-term liabilities gtgt (ltlt September 30 2017 gtgt q_act_jan)13User Value 15270 Tsd | PAC Hamon Pierrick Referenced Value (value_1_PQACTJAN02)1313Document Q3_2017_Quarter_Report13Chapter Consolidated Statement of Financial Position13Row ltlt Total liabilities gtgt (ltlt September 30 2017 gtgt q_act_jan)13User Value 108956 Tsd | PAC Hamon Pierrick Referenced Value (value_1_PQACTJAN02)1313Document Q3_2017_Quarter_Report13Chapter Consolidated Statement of Financial Position13Row ltlt Share capital gtgt (ltlt September 30 2017 gtgt q_act_jan)13User Value 238 Tsd | PAC Hamon Pierrick Referenced Value (value_1_PQACTJAN02)1313Document Q3_2017_Quarter_Report13Chapter Consolidated Statement of Financial Position13Row ltlt Reserves treasury shares gtgt (ltlt September 30 2017 gtgt q_act_jan)13User Value 59100 Tsd | PAC Hamon Pierrick Referenced Value (value_1_PQACTJAN02)1313Document Q3_2017_Quarter_Report13Chapter Consolidated Statement of Financial Position13Row ltlt Non-controlling interests gtgt (ltlt September 30 2017 gtgt q_act_jan)13User Value 550 Tsd | PAC Hamon Pierrick Referenced Value (value_1_PQACTJAN02)1313Document Q3_2017_Quarter_Report13Chapter Consolidated Statement of Financial Position13Row ltlt Total equity gtgt (ltlt September 30 2017 gtgt q_act_jan)13User Value 59887 Tsd | PAC Hamon Pierrick Referenced Value (value_1_PQACTJAN02)1313Document Q3_2017_Quarter_Report13Chapter Consolidated Statement of Financial Position13Row ltlt Total equity and liabilities gtgt (ltlt September 30 2017 gtgt q_act_jan)13User Value 168844 Tsd | NWC-Intensity | 18 | 13 | mf24 | |||||||||||||||||||||||||||||||||||||
| DSO 3-m-rolling YTD | 455 | 467 | m22 | |||||||||||||||||||||||||||||||||||||||||||||||||||||||
| DPO 3-m-rolling YTD | 407 | 397 | m23 |
| 2017 | 2016 | |||||||||||||||||||||||||||||||||||||||||||||||||||||||||||||||||||
| Logistics | Q1 2016 | Q2 2016 | HY 2016 | Q3 2016 | Q3YTD 2016 | Q4 2016 | FY 2016 | Q1 2017 | Q2 2017 | HY 2017 | Q3 2017 | Q3YTD 2017 | ||||||||||||||||||||||||||||||||||||||||||||||||||||||||
| Net forwarding revenue | 1402 | 1613 | 3015 | 1374 | 4389 | 1321 | 5709 | 1286 | 1377 | 2663 | 1394 | 4057 | m4 | m4 | r4 PAC Hamon Pierrick Referenced Value (value_1_PQACT02)1313Document Q3_2017_Quarter_Report13Chapter Products quater and year to date13Row ltlt Net forwarding revenue gtgt (ltlt value_3 gtgt q_act)13User Value 13945 Tsd | r4 PAC Hamon Pierrick Referenced Value (value_1_PQACTJAN02)1313Document Q3_2017_Quarter_Report13Chapter Products quater and year to date13Row ltlt Net forwarding revenue gtgt (ltlt value_3 gtgt q_act_jan)13User Value 40573 Tsd | -00 | 00 | (01) | |||||||||||||||||||||||||||||||||||||||||||||||||
| Forwarding expenses | (420) | (607) | (1027) | (429) | (1456) | (397) | (1853) | (460) | (564) | (1024) | (580) | (1604) | m5 | m5 | r5 PAC Hamon Pierrick Referenced Value (value_1_PQACT02)1313Document Q3_2017_Quarter_Report13Chapter Products quater and year to date13Row ltlt Forwarding services from third parties gtgt (ltlt value_3 gtgt q_act)13User Value -5796 Tsd | r5 PAC Hamon Pierrick Referenced Value (value_1_PQACTJAN02)1313Document Q3_2017_Quarter_Report13Chapter Products quater and year to date13Row ltlt Forwarding services from third parties gtgt (ltlt value_3 gtgt q_act_jan)13User Value -16035 Tsd | -00 | 00 | 00 | |||||||||||||||||||||||||||||||||||||||||||||||||
| Gross profit | 982 | 1006 | 1989 | 944 | 2933 | 924 | 3857 | 825 | 813 | 1639 | 815 | 2454 | m6 | m6 | r6 PAC Hamon Pierrick Referenced Value (value_1_PQACT02)1313Document Q3_2017_Quarter_Report13Chapter Products quater and year to date13Row ltlt Gross profit gtgt (ltlt value_3 gtgt q_act)13User Value 8148 Tsd | r6 PAC Hamon Pierrick Referenced Value (value_1_PQACTJAN02)1313Document Q3_2017_Quarter_Report13Chapter Products quater and year to date13Row ltlt Gross profit gtgt (ltlt value_3 gtgt q_act_jan)13User Value 24537 Tsd | 00 | 01 | 01 | |||||||||||||||||||||||||||||||||||||||||||||||||
| Personnel expenses | (574) | (591) | (1166) | (528) | (1694) | (519) | (2213) | (479) | (461) | (940) | (469) | (1409) | m7 | m7 | r7 PAC Hamon Pierrick Referenced Value (value_1_PQACT02)1313Document Q3_2017_Quarter_Report13Chapter Products quater and year to date13Row ltlt Personnel expenses gtgt (ltlt value_3 gtgt q_act)13User Value -4692 Tsd | r7 PAC Hamon Pierrick Referenced Value (value_1_PQACTJAN02)1313Document Q3_2017_Quarter_Report13Chapter Products quater and year to date13Row ltlt Personnel expenses gtgt (ltlt value_3 gtgt q_act_jan)13User Value -14091 Tsd | -00 | (01) | (01) | |||||||||||||||||||||||||||||||||||||||||||||||||
| Other operating expenses | (360) | (363) | (723) | (378) | (1102) | (367) | (1469) | (298) | (298) | (596) | (298) | (894) | m8 | m8 | r8 PAC Hamon Pierrick Referenced Value (value_1_PQACT02)1313Document Q3_2017_Quarter_Report13Chapter Products quater and year to date13Row ltlt Other operating expenses gtgt (ltlt value_3 gtgt q_act)13User Value -2977 Tsd | r8 PAC Hamon Pierrick Referenced Value (value_1_PQACTJAN02)1313Document Q3_2017_Quarter_Report13Chapter Products quater and year to date13Row ltlt Other operating expenses gtgt (ltlt value_3 gtgt q_act_jan)13User Value -8940 Tsd | 00 | 00 | (01) | |||||||||||||||||||||||||||||||||||||||||||||||||
| EBITDA adjusted | 48 | 52 | 100 | 38 | 138 | 37 | 175 | 48 | 54 | 103 | 48 | 151 | m9 | m9 | r9 PAC Hamon Pierrick Referenced Value (value_1_PQACT02)1313Document Q3_2017_Quarter_Report13Chapter Products quater and year to date13Row ltlt EBITDA gtgt (ltlt value_3 gtgt q_act)13User Value 479 Tsd | r9 PAC Hamon Pierrick Referenced Value (value_1_PQACTJAN02)1313Document Q3_2017_Quarter_Report13Chapter Products quater and year to date13Row ltlt EBITDA gtgt (ltlt value_3 gtgt q_act_jan)13User Value 1506 Tsd | 00 | 00 | 00 | |||||||||||||||||||||||||||||||||||||||||||||||||
| Depreciation and amortization | (29) | (29) | (58) | (29) | (88) | (32) | (119) | (25) | (24) | (48) | (21) | (69) | m10 | m10 | r10 PAC Hamon Pierrick Referenced Value (value_1_PQACT02)1313Document Q3_2017_Quarter_Report13Chapter Products quater and year to date13Row ltlt Depreciation and amortization gtgt (ltlt value_3 gtgt q_act)13User Value -208 Tsd | r10 PAC Hamon Pierrick Referenced Value (value_1_PQACTJAN02)1313Document Q3_2017_Quarter_Report13Chapter Products quater and year to date13Row ltlt Depreciation and amortization gtgt (ltlt value_3 gtgt q_act_jan)13User Value -692 Tsd | 00 | 00 | 00 | |||||||||||||||||||||||||||||||||||||||||||||||||
| EBIT adjusted | 18 | 23 | 41 | 09 | 50 | 05 | 56 | 24 | 31 | 54 | 27 | 81 | m11 | m11 | r11 PAC Hamon Pierrick Referenced Value (value_1_PQACT02)1313Document Q3_2017_Quarter_Report13Chapter Products quater and year to date13Row ltlt Operating result (EBIT) gtgt (ltlt value_3 gtgt q_act)13User Value 271 Tsd | r11 PAC Hamon Pierrick Referenced Value (value_1_PQACTJAN02)1313Document Q3_2017_Quarter_Report13Chapter Products quater and year to date13Row ltlt Operating result (EBIT) gtgt (ltlt value_3 gtgt q_act_jan)13User Value 815 Tsd | -00 | 00 | 01 | |||||||||||||||||||||||||||||||||||||||||||||||||
| Non-recurring items | ||||||||||||||||||||||||||||||||||||||||||||||||||||||||||||||||||||
| Restructuring expenses | 00 | (38) | (38) | 00 | (38) | 00 | (38) | 00 | 00 | 00 | 00 | 00 | m13 | m13 | m13 | m13 | 00 | 00 | 00 | |||||||||||||||||||||||||||||||||||||||||||||||||
| EBIT reported | 18 | (15) | 03 | 09 | 12 | 05 | 18 | 24 | 31 | 54 | 27 | 81 | m15 | m15 | r15 PAC Hamon Pierrick Referenced Value (value_1_PQACT02)1313Document Q3_2017_Quarter_Report13Chapter Products quater and year to date13Row ltlt Operating result (EBIT) gtgt (ltlt value_3 gtgt q_act)13User Value 271 Tsd | r15 PAC Hamon Pierrick Referenced Value (value_1_PQACTJAN02)1313Document Q3_2017_Quarter_Report13Chapter Products quater and year to date13Row ltlt Operating result (EBIT) gtgt (ltlt value_3 gtgt q_act_jan)13User Value 815 Tsd | ||||||||||||||||||||||||||||||||||||||||||||||||||||
PAC Hamon Pierrick Referenced Value (value_1_PQACT02)1313Document Q3_2017_Quarter_Report13Chapter Products quater and year to date13Row ltlt Net forwarding revenue gtgt (ltlt value_3 gtgt q_act)13User Value 13945 Tsd | PAC Hamon Pierrick Referenced Value (value_1_PQACTJAN02)1313Document Q3_2017_Quarter_Report13Chapter Products quater and year to date13Row ltlt Net forwarding revenue gtgt (ltlt value_3 gtgt q_act_jan)13User Value 40573 Tsd | PAC Hamon Pierrick Referenced Value (value_1_PQACT02)1313Document Q3_2017_Quarter_Report13Chapter Products quater and year to date13Row ltlt Forwarding services from third parties gtgt (ltlt value_3 gtgt q_act)13User Value -5796 Tsd | GP Change YoY | -19 | -18 | -14 | -16 | s16 | s16 | |||||||||||||||||||||||||||||||||||||||||||||||||||||||||||

18Q3 RESULTS 2017 | 19 OCTOBER 2017 |
BALANCE SHEET
CHF Cash and cash equivalents 3888 2946 (942) -24Trade receivables unbilled forwarding services 9087 9893 806 9Other current assets 1025 1167 142 14Property plant and equipment 635 803 168 26Intangible assets 979 917 (62) -6Other non-current assets 990 1133 143 14Total assets 16606 16859 253 2
Short-term borrowings 23 21 (02) -10Trade payables accured cost of services 6524 7075 551 8Other current liabilities 2439 2254 (185) -8Long-Term borrowings 00 20 20 naOther long-term liabilities 1449 1527 78 5Total liabilities 10436 10896 460 4Share capital 24 24 (00) -1Reserves treasury shares 6057 5884 (173) -3Non-controlling interests 89 55 (34) -38Total equity 6170 5963 (207) -3Total equity and liabilities 16606 16859 253 2
31-Dec-16 30-Sept-17Change in
SNVeryHiddenParameterSheet
PAN_BalanceSheet
image1png
19Q3 RESULTS 2017 | 19 OCTOBER 2017 |
CASH FLOW
Note Figures in CHF million
30-Sep-16 30-Sep-17Change in
Cash flow before changes in working capital 1029 1075 Changes in working capital 357 (477)Cash from operations 1386 599
Interest and income taxes paid (292) (331)Net cash from operating activities 1094 267 -76
Net cash from investing activities (342) (409) 20
Free cash flow 752 (141) -119
Net cash used in financing activities (858) (894) 4
Net increase (decrease) in cash and cash equivalents (106) (1035)Cash and cash equivalents at beginning of period 3923 3888 Effect of exchange rate changes (17) 93 Cash and cash equivalents at end of period 3799 2946
SNVeryHiddenParameterSheet
Tabele PAN_Cashflow
Reported cash and cash equivalents at 31122016Profit YTD 092017Other non-cash items (eg DampA)Changes in working capitalInterest and income taxes paidNet cash from investing activitiesFinancing activitiesdividendEffect of exchange rate changesReported cash and cash equivalents at 300920173887843716999999999996448614155374652852799999999999728527999999999997Reported cash and cash equivalents at 31122016Profit YTD 092017Other non-cash items (eg DampA)Changes in working capitalInterest and income taxes paidNet cash from investing activitiesFinancing activitiesdividendEffect of exchange rate changesReported cash and cash equivalents at 30092017388784839591476633114085893793329463
- Nine months results 2017
- Slide Number 2
- ACHIEVEMENTS and key figures
- Third consecutive quarter with GP and EBIT Growth
- Operating and financial review
- Air Freight Strong and profitable growth
- Ocean Freight quarterly loss due to margin Stagnation
- Logistics improved profitability
- Outlook and priorities 2017
- outlook and priorities 2017
- Next EVENTs
- Disclaimer
- Appendix
- Income statement per quarter ndash Group
- Income statement per quarter ndash Air Freight
- Income statement per quarter ndash Ocean Freight
- Income statement per quarter ndash Logistics
- Balance sheet
- Cash flow
-
| 30-Sep-16 | 30-Sep-17 | Change in | ||||||||||||||||||||||||||||||||||||||||||||||||||||||
| Cash flow before changes in working capital | 1029 | 1075 | r2 PAC Hamon Pierrick Referenced Value (value_1_PQACTJAN02)1313Document Q3_2017_Quarter_Report13Chapter Consolidated Statement of Cash Flows13Row ltlt Subtotal cash flow from operations gtgt (ltlt 2017 gtgt q_act_jan)13User Value 10749 Tsd | PY IS MANUAL | ||||||||||||||||||||||||||||||||||||||||||||||||||||
| Changes in working capital | 357 | (477) | r3 PAC Hamon Pierrick Referenced Value (value_1_PQACTJAN02)1313Document Q3_2017_Quarter_Report13Chapter Consolidated Statement of Cash Flows1313-7973 Tsd - ltlt (Increase) decrease receivables other current assets and unbilled forwarding services gtgt (ltlt 2017 gtgt q_act_jan)134406 Tsd - ltlt Increase (decrease) payables and accruals incl accrued cost of service gtgt (ltlt 2017 gtgt q_act_jan)13-472 Tsd - ltlt Increase (decrease) non-current provisions and other liabilities gtgt (ltlt 2017 gtgt q_act_jan)13-749 Tsd - ltlt Increase (decrease) current provisions and other liabilities gtgt (ltlt 2017 gtgt q_act_jan)13---------------------13-4787 Tsd (Total) | |||||||||||||||||||||||||||||||||||||||||||||||||||||
| Cash from operations | 1386 | 599 | r4 PAC Hamon Pierrick Referenced Value (value_1_PQACTJAN02)1313Document Q3_2017_Quarter_Report13Chapter Consolidated Statement of Cash Flows13Row ltlt Cash generated from operations gtgt (ltlt 2017 gtgt q_act_jan)13User Value 5963 Tsd | |||||||||||||||||||||||||||||||||||||||||||||||||||||
| Interest and income taxes paid | (292) | (331) | r6 PAC Hamon Pierrick Referenced Value (value_1_PQACTJAN02)1313Document Q3_2017_Quarter_Report13Chapter Consolidated Statement of Cash Flows1313-136 Tsd - ltlt Interest paid gtgt (ltlt 2017 gtgt q_act_jan)13-3175 Tsd - ltlt Income taxes paid gtgt (ltlt 2017 gtgt q_act_jan)13---------------------13-3311 Tsd (Total) | |||||||||||||||||||||||||||||||||||||||||||||||||||||
| Net cash from operating activities | 1094 | 267 | -76 | r7 PAC Hamon Pierrick Referenced Value (value_1_PQACTJAN02)1313Document Q3_2017_Quarter_Report13Chapter Consolidated Statement of Cash Flows13Row ltlt Net cash from operating activities gtgt (ltlt 2017 gtgt q_act_jan)13User Value 2652 Tsd | ||||||||||||||||||||||||||||||||||||||||||||||||||||
| Net cash from investing activities | (342) | (409) | 20 | r9 PAC Hamon Pierrick Referenced Value (value_1_PQACTJAN02)1313Document Q3_2017_Quarter_Report13Chapter Consolidated Statement of Cash Flows13Row ltlt Net cash used in investing activities gtgt (ltlt 2017 gtgt q_act_jan)13User Value -4063 Tsd | ||||||||||||||||||||||||||||||||||||||||||||||||||||
| Free cash flow | 752 | (141) | -119 | r11 PAC Hamon Pierrick Referenced Value (value_1_PQACTJAN02)1313Document Q3_2017_Quarter_Report13Chapter Consolidated Statement of Cash Flows13Row ltlt Free cash flow gtgt (ltlt 2017 gtgt q_act_jan)13User Value -1411 Tsd | ||||||||||||||||||||||||||||||||||||||||||||||||||||
| Net cash used in financing activities | (858) | (894) | 4 | r13 PAC Hamon Pierrick Referenced Value (value_1_PQACTJAN02)1313Document Q3_2017_Quarter_Report13Chapter Consolidated Statement of Cash Flows13Row ltlt Net cash used in financing activities gtgt (ltlt 2017 gtgt q_act_jan)13User Value -8937 Tsd | ||||||||||||||||||||||||||||||||||||||||||||||||||||
| Net increase (decrease) in cash and cash equivalents | (106) | (1035) | r15 PAC Hamon Pierrick Referenced Value (value_1_PQACTJAN02)1313Document Q3_2017_Quarter_Report13Chapter Consolidated Statement of Cash Flows13Row ltlt Net increase (decrease) in cash and cash equivalents gtgt (ltlt 2017 gtgt q_act_jan)13User Value -10348 Tsd | |||||||||||||||||||||||||||||||||||||||||||||||||||||
| Cash and cash equivalents at beginning of period | 3923 | 3888 | r16 PAC Hamon Pierrick Referenced Value (value_1_PQACTJAN02)1313Document Q3_2017_Quarter_Report13Chapter Consolidated Statement of Cash Flows13Row ltlt Cash and cash equivalents at the beginning of the period gtgt (ltlt 2017 gtgt q_act_jan)13User Value 38878 Tsd | |||||||||||||||||||||||||||||||||||||||||||||||||||||
| Effect of exchange rate changes | (17) | 93 | r17 PAC Hamon Pierrick Referenced Value (value_1_PQACTJAN02)1313Document Q3_2017_Quarter_Report13Chapter Consolidated Statement of Cash Flows13Row ltlt Effect of exchange rate changes on cash and cash equivalents gtgt (ltlt 2017 gtgt q_act_jan)13User Value 933 Tsd | |||||||||||||||||||||||||||||||||||||||||||||||||||||
| Cash and cash equivalents at end of period | 3799 | 2946 | r18 PAC Hamon Pierrick Referenced Value (value_1_PQACTJAN02)1313Document Q3_2017_Quarter_Report13Chapter Consolidated Statement of Cash Flows13Row ltlt Cash and cash equivalents at the end of the period gtgt (ltlt 2017 gtgt q_act_jan)13User Value 29463 Tsd | |||||||||||||||||||||||||||||||||||||||||||||||||||||
| Reported cash and cash equivalents at 31122016 | 3888 | r21 PAC Hamon Pierrick Referenced Value (value_1_PQACTJAN02)1313Document Q3_2017_Quarter_Report13Chapter Consolidated Statement of Cash Flows13Row ltlt Cash and cash equivalents at the beginning of the period gtgt (ltlt 2017 gtgt q_act_jan)13User Value 38878 Tsd | Reported cash and cash equivalents at 31122016 | 3888 | ||||||||||||||||||||||||||||||||||||||||||||||||||||
| Profit YTD 092017 | 4839 | r19 PAC Hamon Pierrick Referenced Value (value_1_PQACTJAN02)1313Document Q3_2017_Quarter_Report13Chapter Consolidated Statement of Cash Flows13Row ltlt Profit gtgt (ltlt 2017 gtgt q_act_jan)13User Value 4839 Tsd | Profit YTD 092017 | 3888 | 484 | |||||||||||||||||||||||||||||||||||||||||||||||||||
| Other non-cash items (eg DampA) | 591 | r23 PAC Hamon Pierrick Referenced Value (value_1_PQACTJAN02)1313Document Q3_2017_Quarter_Report13Chapter Consolidated Statement of Cash Flows13131565 Tsd - ltlt Depreciation of property plant and equipment gtgt (ltlt 2017 gtgt q_act_jan)131616 Tsd - ltlt Amortization of intangible assets gtgt (ltlt 2017 gtgt q_act_jan)13-165 Tsd - ltlt Interest income and dividend on available-for-sale financial assets gtgt (ltlt 2017 gtgt q_act_jan)13-167 Tsd - ltlt Exchange differences gtgt (ltlt 2017 gtgt q_act_jan)13-025 Tsd - ltlt Loss (gain) on sales of property plant and equipment gtgt (ltlt 2017 gtgt q_act_jan)13000 Tsd - ltlt Loss (gain) on sales of financial assets gtgt (ltlt 2017 gtgt q_act_jan)13497 Tsd - ltlt Expenses for share-based compensation plans gtgt (ltlt 2017 gtgt q_act_jan)13238 Tsd - ltlt Other non-cash (income) and expenses gtgt (ltlt 2017 gtgt q_act_jan)132351 Tsd - ltlt Income tax expenses gtgt (ltlt 2017 gtgt q_act_jan)13---------------------135910 Tsd (Total) | Other non-cash items (eg DampA) | 4372 | 591 | |||||||||||||||||||||||||||||||||||||||||||||||||||
| Changes in working capital | -4766 | r24 PAC Hamon Pierrick Referenced Value (value_1_PQACTJAN02)1313Document Q3_2017_Quarter_Report13Chapter Consolidated Statement of Cash Flows1313-7973 Tsd - ltlt (Increase) decrease receivables other current assets and unbilled forwarding services gtgt (ltlt 2017 gtgt q_act_jan)134406 Tsd - ltlt Increase (decrease) payables and accruals incl accrued cost of service gtgt (ltlt 2017 gtgt q_act_jan)13-472 Tsd - ltlt Increase (decrease) non-current provisions and other liabilities gtgt (ltlt 2017 gtgt q_act_jan)13-749 Tsd - ltlt Increase (decrease) current provisions and other liabilities gtgt (ltlt 2017 gtgt q_act_jan)13---------------------13-4787 Tsd (Total) | Changes in working capital | 4486 | 477 | neg | ||||||||||||||||||||||||||||||||||||||||||||||||||
| Interest and income taxes paid | -3311 | r25 PAC Hamon Pierrick Referenced Value (value_1_PQACTJAN02)1313Document Q3_2017_Quarter_Report13Chapter Consolidated Statement of Cash Flows1313-136 Tsd - ltlt Interest paid gtgt (ltlt 2017 gtgt q_act_jan)13-3175 Tsd - ltlt Income taxes paid gtgt (ltlt 2017 gtgt q_act_jan)13---------------------13-3311 Tsd (Total) | Interest and income taxes paid | 4155 | 331 | neg | ||||||||||||||||||||||||||||||||||||||||||||||||||
| Net cash from investing activities | -4085 | r26 PAC Hamon Pierrick Referenced Value (value_1_PQACTJAN02)1313Document Q3_2017_Quarter_Report13Chapter Consolidated Statement of Cash Flows13Row ltlt Net cash used in investing activities gtgt (ltlt 2017 gtgt q_act_jan)13User Value -4063 Tsd | Net cash from investing activities | 3747 | 409 | neg | ||||||||||||||||||||||||||||||||||||||||||||||||||
| Financing activitiesdividend | -8937 | r27 PAC Hamon Pierrick Referenced Value (value_1_PQACTJAN02)1313Document Q3_2017_Quarter_Report13Chapter Consolidated Statement of Cash Flows13Row ltlt Net cash used in financing activities gtgt (ltlt 2017 gtgt q_act_jan)13User Value -8937 Tsd | Financing activitiesdividend | 2853 | 894 | neg | ||||||||||||||||||||||||||||||||||||||||||||||||||
| Effect of exchange rate changes | 933 | r28 PAC Hamon Pierrick Referenced Value (value_1_PQACTJAN02)1313Document Q3_2017_Quarter_Report13Chapter Consolidated Statement of Cash Flows13Row ltlt Effect of exchange rate changes on cash and cash equivalents gtgt (ltlt 2017 gtgt q_act_jan)13User Value 933 Tsd | Effect of exchange rate changes | 2853 | 93 | |||||||||||||||||||||||||||||||||||||||||||||||||||
| Reported cash and cash equivalents at 30092017 | 29463 | r29 PAC Hamon Pierrick Referenced Value (value_1_PQACTJAN02)1313Document Q3_2017_Quarter_Report13Chapter Consolidated Statement of Cash Flows13Row ltlt Cash and cash equivalents at the end of the period gtgt (ltlt 2017 gtgt q_act_jan)13User Value 29463 Tsd | PAC Hamon Pierrick Referenced Value (value_1_PQACTJAN02)1313Document Q3_2017_Quarter_Report13Chapter Consolidated Statement of Cash Flows13Row ltlt Subtotal cash flow from operations gtgt (ltlt 2017 gtgt q_act_jan)13User Value 10749 Tsd | PAC Hamon Pierrick Referenced Value (value_1_PQACTJAN02)1313Document Q3_2017_Quarter_Report13Chapter Consolidated Statement of Cash Flows1313-7973 Tsd - ltlt (Increase) decrease receivables other current assets and unbilled forwarding services gtgt (ltlt 2017 gtgt q_act_jan)134406 Tsd - ltlt Increase (decrease) payables and accruals incl accrued cost of service gtgt (ltlt 2017 gtgt q_act_jan)13-472 Tsd - ltlt Increase (decrease) non-current provisions and other liabilities gtgt (ltlt 2017 gtgt q_act_jan)13-749 Tsd - ltlt Increase (decrease) current provisions and other liabilities gtgt (ltlt 2017 gtgt q_act_jan)13---------------------13-4787 Tsd (Total) | PAC Hamon Pierrick Referenced Value (value_1_PQACTJAN02)1313Document Q3_2017_Quarter_Report13Chapter Consolidated Statement of Cash Flows13Row ltlt Cash generated from operations gtgt (ltlt 2017 gtgt q_act_jan)13User Value 5963 Tsd | PAC Hamon Pierrick Referenced Value (value_1_PQACTJAN02)1313Document Q3_2017_Quarter_Report13Chapter Consolidated Statement of Cash Flows1313-136 Tsd - ltlt Interest paid gtgt (ltlt 2017 gtgt q_act_jan)13-3175 Tsd - ltlt Income taxes paid gtgt (ltlt 2017 gtgt q_act_jan)13---------------------13-3311 Tsd (Total) | PAC Hamon Pierrick Referenced Value (value_1_PQACTJAN02)1313Document Q3_2017_Quarter_Report13Chapter Consolidated Statement of Cash Flows13Row ltlt Net cash from operating activities gtgt (ltlt 2017 gtgt q_act_jan)13User Value 2652 Tsd | PAC Hamon Pierrick Referenced Value (value_1_PQACTJAN02)1313Document Q3_2017_Quarter_Report13Chapter Consolidated Statement of Cash Flows13Row ltlt Net cash used in investing activities gtgt (ltlt 2017 gtgt q_act_jan)13User Value -4063 Tsd | PAC Hamon Pierrick Referenced Value (value_1_PQACTJAN02)1313Document Q3_2017_Quarter_Report13Chapter Consolidated Statement of Cash Flows13Row ltlt Free cash flow gtgt (ltlt 2017 gtgt q_act_jan)13User Value -1411 Tsd | PAC Hamon Pierrick Referenced Value (value_1_PQACTJAN02)1313Document Q3_2017_Quarter_Report13Chapter Consolidated Statement of Cash Flows13Row ltlt Net cash used in financing activities gtgt (ltlt 2017 gtgt q_act_jan)13User Value -8937 Tsd | PAC Hamon Pierrick Referenced Value (value_1_PQACTJAN02)1313Document Q3_2017_Quarter_Report13Chapter Consolidated Statement of Cash Flows13Row ltlt Net increase (decrease) in cash and cash equivalents gtgt (ltlt 2017 gtgt q_act_jan)13User Value -10348 Tsd | PAC Hamon Pierrick Referenced Value (value_1_PQACTJAN02)1313Document Q3_2017_Quarter_Report13Chapter Consolidated Statement of Cash Flows13Row ltlt Cash and cash equivalents at the beginning of the period gtgt (ltlt 2017 gtgt q_act_jan)13User Value 38878 Tsd | PAC Hamon Pierrick Referenced Value (value_1_PQACTJAN02)1313Document Q3_2017_Quarter_Report13Chapter Consolidated Statement of Cash Flows13Row ltlt Effect of exchange rate changes on cash and cash equivalents gtgt (ltlt 2017 gtgt q_act_jan)13User Value 933 Tsd | PAC Hamon Pierrick Referenced Value (value_1_PQACTJAN02)1313Document Q3_2017_Quarter_Report13Chapter Consolidated Statement of Cash Flows13Row ltlt Cash and cash equivalents at the end of the period gtgt (ltlt 2017 gtgt q_act_jan)13User Value 29463 Tsd | PAC Hamon Pierrick Referenced Value (value_1_PQACTJAN02)1313Document Q3_2017_Quarter_Report13Chapter Consolidated Statement of Cash Flows13Row ltlt Cash and cash equivalents at the beginning of the period gtgt (ltlt 2017 gtgt q_act_jan)13User Value 38878 Tsd | PAC Hamon Pierrick Referenced Value (value_1_PQACTJAN02)1313Document Q3_2017_Quarter_Report13Chapter Consolidated Statement of Cash Flows13Row ltlt Profit gtgt (ltlt 2017 gtgt q_act_jan)13User Value 4839 Tsd | PAC Hamon Pierrick Referenced Value (value_1_PQACTJAN02)1313Document Q3_2017_Quarter_Report13Chapter Consolidated Statement of Cash Flows13131565 Tsd - ltlt Depreciation of property plant and equipment gtgt (ltlt 2017 gtgt q_act_jan)131616 Tsd - ltlt Amortization of intangible assets gtgt (ltlt 2017 gtgt q_act_jan)13-165 Tsd - ltlt Interest income and dividend on available-for-sale financial assets gtgt (ltlt 2017 gtgt q_act_jan)13-167 Tsd - ltlt Exchange differences gtgt (ltlt 2017 gtgt q_act_jan)13-025 Tsd - ltlt Loss (gain) on sales of property plant and equipment gtgt (ltlt 2017 gtgt q_act_jan)13000 Tsd - ltlt Loss (gain) on sales of financial assets gtgt (ltlt 2017 gtgt q_act_jan)13497 Tsd - ltlt Expenses for share-based compensation plans gtgt (ltlt 2017 gtgt q_act_jan)13238 Tsd - ltlt Other non-cash (income) and expenses gtgt (ltlt 2017 gtgt q_act_jan)132351 Tsd - ltlt Income tax expenses gtgt (ltlt 2017 gtgt q_act_jan)13---------------------135910 Tsd (Total) | PAC Hamon Pierrick Referenced Value (value_1_PQACTJAN02)1313Document Q3_2017_Quarter_Report13Chapter Consolidated Statement of Cash Flows1313-7973 Tsd - ltlt (Increase) decrease receivables other current assets and unbilled forwarding services gtgt (ltlt 2017 gtgt q_act_jan)134406 Tsd - ltlt Increase (decrease) payables and accruals incl accrued cost of service gtgt (ltlt 2017 gtgt q_act_jan)13-472 Tsd - ltlt Increase (decrease) non-current provisions and other liabilities gtgt (ltlt 2017 gtgt q_act_jan)13-749 Tsd - ltlt Increase (decrease) current provisions and other liabilities gtgt (ltlt 2017 gtgt q_act_jan)13---------------------13-4787 Tsd (Total) | PAC Hamon Pierrick Referenced Value (value_1_PQACTJAN02)1313Document Q3_2017_Quarter_Report13Chapter Consolidated Statement of Cash Flows1313-136 Tsd - ltlt Interest paid gtgt (ltlt 2017 gtgt q_act_jan)13-3175 Tsd - ltlt Income taxes paid gtgt (ltlt 2017 gtgt q_act_jan)13---------------------13-3311 Tsd (Total) | Reported cash and cash equivalents at 30092017 | 2946 | 3888 | ||||||||||||||||||||||||||||||||||
| 484 | ||||||||||||||||||||||||||||||||||||||||||||||||||||||||
| 591 | ||||||||||||||||||||||||||||||||||||||||||||||||||||||||
| (479) | ||||||||||||||||||||||||||||||||||||||||||||||||||||||||
| (331) | ||||||||||||||||||||||||||||||||||||||||||||||||||||||||
| (406) | ||||||||||||||||||||||||||||||||||||||||||||||||||||||||
| (894) | ||||||||||||||||||||||||||||||||||||||||||||||||||||||||
| 93 | ||||||||||||||||||||||||||||||||||||||||||||||||||||||||
| 2946 |
| 31-Dec-16 | 30-Sept-17 | Change in | ||||||||||||||||||||||||||||||||||||||||||||||||||||||||
| CHF | ||||||||||||||||||||||||||||||||||||||||||||||||||||||||||
| Cash and cash equivalents | 3888 | 2946 | (942) | -24 | r3 PAC Hamon Pierrick Referenced Value (value_1_PQACTJAN02)1313Document Q3_2017_Quarter_Report13Chapter Consolidated Statement of Financial Position13Row ltlt Cash and cash equivalents gtgt (ltlt September 30 2017 gtgt q_act_jan)13User Value 29463 Tsd | 3888 | 3999 | 111 | 3 | |||||||||||||||||||||||||||||||||||||||||||||||||
| Trade receivables unbilled forwarding services | 9087 | 9893 | 806 | 9 | r4 PAC Hamon Pierrick Referenced Value (value_1_PQACTJAN02)1313Document Q3_2017_Quarter_Report13Chapter Consolidated Statement of Financial Position13Row ltlt Trade receivables unbilled forwarding services gtgt (ltlt September 30 2017 gtgt q_act_jan)13User Value 98929 Tsd | 9087 | 8693 | -394 | -4 | |||||||||||||||||||||||||||||||||||||||||||||||||
| Other current assets | 1025 | 1167 | 142 | 14 | r5 PAC Hamon Pierrick Referenced Value (value_1_PQACTJAN02)1313Document Q3_2017_Quarter_Report13Chapter Consolidated Statement of Financial Position13Row ltlt Other current assets gtgt (ltlt September 30 2017 gtgt q_act_jan)13User Value 11671 Tsd | 1025 | 1335 | 31 | 30 | |||||||||||||||||||||||||||||||||||||||||||||||||
| Property plant and equipment | 635 | 803 | 168 | 26 | r6 PAC Hamon Pierrick Referenced Value (value_1_PQACTJAN02)1313Document Q3_2017_Quarter_Report13Chapter Consolidated Statement of Financial Position13Row ltlt Property plant and equipment gtgt (ltlt September 30 2017 gtgt q_act_jan)13User Value 8028 Tsd | 635 | 651 | 16 | 3 | |||||||||||||||||||||||||||||||||||||||||||||||||
| Intangible assets | 979 | 917 | (62) | -6 | r7 PAC Hamon Pierrick Referenced Value (value_1_PQACTJAN02)1313Document Q3_2017_Quarter_Report13Chapter Consolidated Statement of Financial Position13Row ltlt Intangible assets gtgt (ltlt September 30 2017 gtgt q_act_jan)13User Value 9168 Tsd | 979 | 926 | -53 | -5 | |||||||||||||||||||||||||||||||||||||||||||||||||
| Other non-current assets | 990 | 1133 | 143 | 14 | r8 PAC Hamon Pierrick Referenced Value (value_1_PQACTJAN02)1313Document Q3_2017_Quarter_Report13Chapter Consolidated Statement of Financial Position13Row ltlt Other non-current assets gtgt (ltlt September 30 2017 gtgt q_act_jan)13User Value 11586 Tsd | 99 | 1073 | 83 | 8 | |||||||||||||||||||||||||||||||||||||||||||||||||
| Total assets | 16606 | 16859 | 253 | 2 | r9 PAC Hamon Pierrick Referenced Value (value_1_PQACTJAN02)1313Document Q3_2017_Quarter_Report13Chapter Consolidated Statement of Financial Position13Row ltlt Total assets gtgt (ltlt September 30 2017 gtgt q_act_jan)13User Value 168844 Tsd | 166060 | 166780 | 72 | 0 | |||||||||||||||||||||||||||||||||||||||||||||||||
| 0 | ||||||||||||||||||||||||||||||||||||||||||||||||||||||||||
| Short-term borrowings | 23 | 21 | (02) | -10 | r11 PAC Hamon Pierrick Referenced Value (value_1_PQACTJAN02)1313Document Q3_2017_Quarter_Report13Chapter Consolidated Statement of Financial Position13Row ltlt Short-term borrowings gtgt (ltlt September 30 2017 gtgt q_act_jan)13User Value 208 Tsd | 23 | 05 | -18 | -78 | |||||||||||||||||||||||||||||||||||||||||||||||||
| Trade payables accured cost of services | 6524 | 7075 | 551 | 8 | r12 PAC Hamon Pierrick Referenced Value (value_1_PQACTJAN02)1313Document Q3_2017_Quarter_Report13Chapter Consolidated Statement of Financial Position13Row ltlt Trade payables accured cost of services gtgt (ltlt September 30 2017 gtgt q_act_jan)13User Value 70745 Tsd | 6524 | 620 | -324 | -5 | |||||||||||||||||||||||||||||||||||||||||||||||||
| Other current liabilities | 2439 | 2254 | (185) | -8 | r13 PAC Hamon Pierrick Referenced Value (value_1_PQACTJAN02)1313Document Q3_2017_Quarter_Report13Chapter Consolidated Statement of Financial Position13Row ltlt Other current liabilities gtgt (ltlt September 30 2017 gtgt q_act_jan)13User Value 22538 Tsd | 2439 | 2592 | 153 | 6 | |||||||||||||||||||||||||||||||||||||||||||||||||
| Long-Term borrowings | 00 | 20 | 20 | na | r20 PAC Hamon Pierrick Referenced Value (value_1_PQACTJAN02)1313Document Q3_2017_Quarter_Report13Chapter Consolidated Statement of Financial Position13Row ltlt Long-term borrowings gtgt (ltlt September 30 2017 gtgt q_act_jan)13User Value 197 Tsd | 0 | 12 | 12 | na | |||||||||||||||||||||||||||||||||||||||||||||||||
| Other long-term liabilities | 1449 | 1527 | 78 | 5 | r21 PAC Hamon Pierrick Referenced Value (value_1_PQACTJAN02)1313Document Q3_2017_Quarter_Report13Chapter Consolidated Statement of Financial Position13Row ltlt Other long-term liabilities gtgt (ltlt September 30 2017 gtgt q_act_jan)13User Value 15270 Tsd | 1449 | 1479 | 3 | 2 | |||||||||||||||||||||||||||||||||||||||||||||||||
| Total liabilities | 10436 | 10896 | 460 | 4 | r14 PAC Hamon Pierrick Referenced Value (value_1_PQACTJAN02)1313Document Q3_2017_Quarter_Report13Chapter Consolidated Statement of Financial Position13Row ltlt Total liabilities gtgt (ltlt September 30 2017 gtgt q_act_jan)13User Value 108956 Tsd | 104360 | 102880 | -148 | -1 | |||||||||||||||||||||||||||||||||||||||||||||||||
| Share capital | 24 | 24 | (00) | -1 | r15 PAC Hamon Pierrick Referenced Value (value_1_PQACTJAN02)1313Document Q3_2017_Quarter_Report13Chapter Consolidated Statement of Financial Position13Row ltlt Share capital gtgt (ltlt September 30 2017 gtgt q_act_jan)13User Value 238 Tsd | 24 | 24 | 0 | 0 | |||||||||||||||||||||||||||||||||||||||||||||||||
| Reserves treasury shares | 6057 | 5884 | (173) | -3 | r16 PAC Hamon Pierrick Referenced Value (value_1_PQACTJAN02)1313Document Q3_2017_Quarter_Report13Chapter Consolidated Statement of Financial Position13Row ltlt Reserves treasury shares gtgt (ltlt September 30 2017 gtgt q_act_jan)13User Value 59100 Tsd | 6057 | 6285 | 228 | 4 | |||||||||||||||||||||||||||||||||||||||||||||||||
| Non-controlling interests | 89 | 55 | (34) | -38 | r17 PAC Hamon Pierrick Referenced Value (value_1_PQACTJAN02)1313Document Q3_2017_Quarter_Report13Chapter Consolidated Statement of Financial Position13Row ltlt Non-controlling interests gtgt (ltlt September 30 2017 gtgt q_act_jan)13User Value 550 Tsd | 89 | 81 | -08 | -9 | |||||||||||||||||||||||||||||||||||||||||||||||||
| Total equity | 6170 | 5963 | (207) | -3 | r18 PAC Hamon Pierrick Referenced Value (value_1_PQACTJAN02)1313Document Q3_2017_Quarter_Report13Chapter Consolidated Statement of Financial Position13Row ltlt Total equity gtgt (ltlt September 30 2017 gtgt q_act_jan)13User Value 59887 Tsd | 617 | 639 | 22 | 4 | |||||||||||||||||||||||||||||||||||||||||||||||||
| Total equity and liabilities | 16606 | 16859 | 253 | 2 | r19 PAC Hamon Pierrick Referenced Value (value_1_PQACTJAN02)1313Document Q3_2017_Quarter_Report13Chapter Consolidated Statement of Financial Position13Row ltlt Total equity and liabilities gtgt (ltlt September 30 2017 gtgt q_act_jan)13User Value 168844 Tsd | 166060 | 166780 | 72 | 0 | |||||||||||||||||||||||||||||||||||||||||||||||||
| KPIs | 31-Dec-16 | 30-Jun-17 | ||||||||||||||||||||||||||||||||||||||||||||||||||||||||
| Equity Ratio | 372 | 354 | s20 PAC Hamon Pierrick Referenced Value (value_1_PQACTJAN02)1313Document Q2_2017_Quarter_Report13Chapter Consolidated Statement of Financial Position13Row ltlt Total equity and liabilities gtgt (ltlt June 30 2017 gtgt q_act_jan)13User Value 153472 Tsd | |||||||||||||||||||||||||||||||||||||||||||||||||||||||
PAC Hamon Pierrick Referenced Value (value_1_PQACTJAN02)1313Document Q3_2017_Quarter_Report13Chapter Consolidated Statement of Financial Position13Row ltlt Cash and cash equivalents gtgt (ltlt September 30 2017 gtgt q_act_jan)13User Value 29463 Tsd | PAC Hamon Pierrick Referenced Value (value_1_PQACTJAN02)1313Document Q3_2017_Quarter_Report13Chapter Consolidated Statement of Financial Position13Row ltlt Trade receivables unbilled forwarding services gtgt (ltlt September 30 2017 gtgt q_act_jan)13User Value 98929 Tsd | PAC Hamon Pierrick Referenced Value (value_1_PQACTJAN02)1313Document Q3_2017_Quarter_Report13Chapter Consolidated Statement of Financial Position13Row ltlt Other current assets gtgt (ltlt September 30 2017 gtgt q_act_jan)13User Value 11671 Tsd | PAC Hamon Pierrick Referenced Value (value_1_PQACTJAN02)1313Document Q3_2017_Quarter_Report13Chapter Consolidated Statement of Financial Position13Row ltlt Property plant and equipment gtgt (ltlt September 30 2017 gtgt q_act_jan)13User Value 8028 Tsd | PAC Hamon Pierrick Referenced Value (value_1_PQACTJAN02)1313Document Q3_2017_Quarter_Report13Chapter Consolidated Statement of Financial Position13Row ltlt Intangible assets gtgt (ltlt September 30 2017 gtgt q_act_jan)13User Value 9168 Tsd | PAC Hamon Pierrick Referenced Value (value_1_PQACTJAN02)1313Document Q3_2017_Quarter_Report13Chapter Consolidated Statement of Financial Position13Row ltlt Other non-current assets gtgt (ltlt September 30 2017 gtgt q_act_jan)13User Value 11586 Tsd | PAC Hamon Pierrick Referenced Value (value_1_PQACTJAN02)1313Document Q3_2017_Quarter_Report13Chapter Consolidated Statement of Financial Position13Row ltlt Total assets gtgt (ltlt September 30 2017 gtgt q_act_jan)13User Value 168844 Tsd | PAC Hamon Pierrick Referenced Value (value_1_PQACTJAN02)1313Document Q3_2017_Quarter_Report13Chapter Consolidated Statement of Financial Position13Row ltlt Short-term borrowings gtgt (ltlt September 30 2017 gtgt q_act_jan)13User Value 208 Tsd | PAC Hamon Pierrick Referenced Value (value_1_PQACTJAN02)1313Document Q3_2017_Quarter_Report13Chapter Consolidated Statement of Financial Position13Row ltlt Trade payables accured cost of services gtgt (ltlt September 30 2017 gtgt q_act_jan)13User Value 70745 Tsd | PAC Hamon Pierrick Referenced Value (value_1_PQACTJAN02)1313Document Q3_2017_Quarter_Report13Chapter Consolidated Statement of Financial Position13Row ltlt Other current liabilities gtgt (ltlt September 30 2017 gtgt q_act_jan)13User Value 22538 Tsd | PAC Hamon Pierrick Referenced Value (value_1_PQACTJAN02)1313Document Q3_2017_Quarter_Report13Chapter Consolidated Statement of Financial Position13Row ltlt Long-term borrowings gtgt (ltlt September 30 2017 gtgt q_act_jan)13User Value 197 Tsd | PAC Hamon Pierrick Referenced Value (value_1_PQACTJAN02)1313Document Q3_2017_Quarter_Report13Chapter Consolidated Statement of Financial Position13Row ltlt Other long-term liabilities gtgt (ltlt September 30 2017 gtgt q_act_jan)13User Value 15270 Tsd | PAC Hamon Pierrick Referenced Value (value_1_PQACTJAN02)1313Document Q3_2017_Quarter_Report13Chapter Consolidated Statement of Financial Position13Row ltlt Total liabilities gtgt (ltlt September 30 2017 gtgt q_act_jan)13User Value 108956 Tsd | PAC Hamon Pierrick Referenced Value (value_1_PQACTJAN02)1313Document Q3_2017_Quarter_Report13Chapter Consolidated Statement of Financial Position13Row ltlt Share capital gtgt (ltlt September 30 2017 gtgt q_act_jan)13User Value 238 Tsd | PAC Hamon Pierrick Referenced Value (value_1_PQACTJAN02)1313Document Q3_2017_Quarter_Report13Chapter Consolidated Statement of Financial Position13Row ltlt Reserves treasury shares gtgt (ltlt September 30 2017 gtgt q_act_jan)13User Value 59100 Tsd | PAC Hamon Pierrick Referenced Value (value_1_PQACTJAN02)1313Document Q3_2017_Quarter_Report13Chapter Consolidated Statement of Financial Position13Row ltlt Non-controlling interests gtgt (ltlt September 30 2017 gtgt q_act_jan)13User Value 550 Tsd | PAC Hamon Pierrick Referenced Value (value_1_PQACTJAN02)1313Document Q3_2017_Quarter_Report13Chapter Consolidated Statement of Financial Position13Row ltlt Total equity gtgt (ltlt September 30 2017 gtgt q_act_jan)13User Value 59887 Tsd | PAC Hamon Pierrick Referenced Value (value_1_PQACTJAN02)1313Document Q3_2017_Quarter_Report13Chapter Consolidated Statement of Financial Position13Row ltlt Total equity and liabilities gtgt (ltlt September 30 2017 gtgt q_act_jan)13User Value 168844 Tsd | NWC-Intensity | 18 | 13 | mf24 | |||||||||||||||||||||||||||||||||||||
| DSO 3-m-rolling YTD | 455 | 467 | m22 | |||||||||||||||||||||||||||||||||||||||||||||||||||||||
| DPO 3-m-rolling YTD | 407 | 397 | m23 |

19Q3 RESULTS 2017 | 19 OCTOBER 2017 |
CASH FLOW
Note Figures in CHF million
30-Sep-16 30-Sep-17Change in
Cash flow before changes in working capital 1029 1075 Changes in working capital 357 (477)Cash from operations 1386 599
Interest and income taxes paid (292) (331)Net cash from operating activities 1094 267 -76
Net cash from investing activities (342) (409) 20
Free cash flow 752 (141) -119
Net cash used in financing activities (858) (894) 4
Net increase (decrease) in cash and cash equivalents (106) (1035)Cash and cash equivalents at beginning of period 3923 3888 Effect of exchange rate changes (17) 93 Cash and cash equivalents at end of period 3799 2946
SNVeryHiddenParameterSheet
Tabele PAN_Cashflow
Reported cash and cash equivalents at 31122016Profit YTD 092017Other non-cash items (eg DampA)Changes in working capitalInterest and income taxes paidNet cash from investing activitiesFinancing activitiesdividendEffect of exchange rate changesReported cash and cash equivalents at 300920173887843716999999999996448614155374652852799999999999728527999999999997Reported cash and cash equivalents at 31122016Profit YTD 092017Other non-cash items (eg DampA)Changes in working capitalInterest and income taxes paidNet cash from investing activitiesFinancing activitiesdividendEffect of exchange rate changesReported cash and cash equivalents at 30092017388784839591476633114085893793329463
- Nine months results 2017
- Slide Number 2
- ACHIEVEMENTS and key figures
- Third consecutive quarter with GP and EBIT Growth
- Operating and financial review
- Air Freight Strong and profitable growth
- Ocean Freight quarterly loss due to margin Stagnation
- Logistics improved profitability
- Outlook and priorities 2017
- outlook and priorities 2017
- Next EVENTs
- Disclaimer
- Appendix
- Income statement per quarter ndash Group
- Income statement per quarter ndash Air Freight
- Income statement per quarter ndash Ocean Freight
- Income statement per quarter ndash Logistics
- Balance sheet
- Cash flow
-
| 30-Sep-16 | 30-Sep-17 | Change in | ||||||||||||||||||||||||||||||||||||||||||||||||||||||
| Cash flow before changes in working capital | 1029 | 1075 | r2 PAC Hamon Pierrick Referenced Value (value_1_PQACTJAN02)1313Document Q3_2017_Quarter_Report13Chapter Consolidated Statement of Cash Flows13Row ltlt Subtotal cash flow from operations gtgt (ltlt 2017 gtgt q_act_jan)13User Value 10749 Tsd | PY IS MANUAL | ||||||||||||||||||||||||||||||||||||||||||||||||||||
| Changes in working capital | 357 | (477) | r3 PAC Hamon Pierrick Referenced Value (value_1_PQACTJAN02)1313Document Q3_2017_Quarter_Report13Chapter Consolidated Statement of Cash Flows1313-7973 Tsd - ltlt (Increase) decrease receivables other current assets and unbilled forwarding services gtgt (ltlt 2017 gtgt q_act_jan)134406 Tsd - ltlt Increase (decrease) payables and accruals incl accrued cost of service gtgt (ltlt 2017 gtgt q_act_jan)13-472 Tsd - ltlt Increase (decrease) non-current provisions and other liabilities gtgt (ltlt 2017 gtgt q_act_jan)13-749 Tsd - ltlt Increase (decrease) current provisions and other liabilities gtgt (ltlt 2017 gtgt q_act_jan)13---------------------13-4787 Tsd (Total) | |||||||||||||||||||||||||||||||||||||||||||||||||||||
| Cash from operations | 1386 | 599 | r4 PAC Hamon Pierrick Referenced Value (value_1_PQACTJAN02)1313Document Q3_2017_Quarter_Report13Chapter Consolidated Statement of Cash Flows13Row ltlt Cash generated from operations gtgt (ltlt 2017 gtgt q_act_jan)13User Value 5963 Tsd | |||||||||||||||||||||||||||||||||||||||||||||||||||||
| Interest and income taxes paid | (292) | (331) | r6 PAC Hamon Pierrick Referenced Value (value_1_PQACTJAN02)1313Document Q3_2017_Quarter_Report13Chapter Consolidated Statement of Cash Flows1313-136 Tsd - ltlt Interest paid gtgt (ltlt 2017 gtgt q_act_jan)13-3175 Tsd - ltlt Income taxes paid gtgt (ltlt 2017 gtgt q_act_jan)13---------------------13-3311 Tsd (Total) | |||||||||||||||||||||||||||||||||||||||||||||||||||||
| Net cash from operating activities | 1094 | 267 | -76 | r7 PAC Hamon Pierrick Referenced Value (value_1_PQACTJAN02)1313Document Q3_2017_Quarter_Report13Chapter Consolidated Statement of Cash Flows13Row ltlt Net cash from operating activities gtgt (ltlt 2017 gtgt q_act_jan)13User Value 2652 Tsd | ||||||||||||||||||||||||||||||||||||||||||||||||||||
| Net cash from investing activities | (342) | (409) | 20 | r9 PAC Hamon Pierrick Referenced Value (value_1_PQACTJAN02)1313Document Q3_2017_Quarter_Report13Chapter Consolidated Statement of Cash Flows13Row ltlt Net cash used in investing activities gtgt (ltlt 2017 gtgt q_act_jan)13User Value -4063 Tsd | ||||||||||||||||||||||||||||||||||||||||||||||||||||
| Free cash flow | 752 | (141) | -119 | r11 PAC Hamon Pierrick Referenced Value (value_1_PQACTJAN02)1313Document Q3_2017_Quarter_Report13Chapter Consolidated Statement of Cash Flows13Row ltlt Free cash flow gtgt (ltlt 2017 gtgt q_act_jan)13User Value -1411 Tsd | ||||||||||||||||||||||||||||||||||||||||||||||||||||
| Net cash used in financing activities | (858) | (894) | 4 | r13 PAC Hamon Pierrick Referenced Value (value_1_PQACTJAN02)1313Document Q3_2017_Quarter_Report13Chapter Consolidated Statement of Cash Flows13Row ltlt Net cash used in financing activities gtgt (ltlt 2017 gtgt q_act_jan)13User Value -8937 Tsd | ||||||||||||||||||||||||||||||||||||||||||||||||||||
| Net increase (decrease) in cash and cash equivalents | (106) | (1035) | r15 PAC Hamon Pierrick Referenced Value (value_1_PQACTJAN02)1313Document Q3_2017_Quarter_Report13Chapter Consolidated Statement of Cash Flows13Row ltlt Net increase (decrease) in cash and cash equivalents gtgt (ltlt 2017 gtgt q_act_jan)13User Value -10348 Tsd | |||||||||||||||||||||||||||||||||||||||||||||||||||||
| Cash and cash equivalents at beginning of period | 3923 | 3888 | r16 PAC Hamon Pierrick Referenced Value (value_1_PQACTJAN02)1313Document Q3_2017_Quarter_Report13Chapter Consolidated Statement of Cash Flows13Row ltlt Cash and cash equivalents at the beginning of the period gtgt (ltlt 2017 gtgt q_act_jan)13User Value 38878 Tsd | |||||||||||||||||||||||||||||||||||||||||||||||||||||
| Effect of exchange rate changes | (17) | 93 | r17 PAC Hamon Pierrick Referenced Value (value_1_PQACTJAN02)1313Document Q3_2017_Quarter_Report13Chapter Consolidated Statement of Cash Flows13Row ltlt Effect of exchange rate changes on cash and cash equivalents gtgt (ltlt 2017 gtgt q_act_jan)13User Value 933 Tsd | |||||||||||||||||||||||||||||||||||||||||||||||||||||
| Cash and cash equivalents at end of period | 3799 | 2946 | r18 PAC Hamon Pierrick Referenced Value (value_1_PQACTJAN02)1313Document Q3_2017_Quarter_Report13Chapter Consolidated Statement of Cash Flows13Row ltlt Cash and cash equivalents at the end of the period gtgt (ltlt 2017 gtgt q_act_jan)13User Value 29463 Tsd | |||||||||||||||||||||||||||||||||||||||||||||||||||||
| Reported cash and cash equivalents at 31122016 | 3888 | r21 PAC Hamon Pierrick Referenced Value (value_1_PQACTJAN02)1313Document Q3_2017_Quarter_Report13Chapter Consolidated Statement of Cash Flows13Row ltlt Cash and cash equivalents at the beginning of the period gtgt (ltlt 2017 gtgt q_act_jan)13User Value 38878 Tsd | Reported cash and cash equivalents at 31122016 | 3888 | ||||||||||||||||||||||||||||||||||||||||||||||||||||
| Profit YTD 092017 | 4839 | r19 PAC Hamon Pierrick Referenced Value (value_1_PQACTJAN02)1313Document Q3_2017_Quarter_Report13Chapter Consolidated Statement of Cash Flows13Row ltlt Profit gtgt (ltlt 2017 gtgt q_act_jan)13User Value 4839 Tsd | Profit YTD 092017 | 3888 | 484 | |||||||||||||||||||||||||||||||||||||||||||||||||||
| Other non-cash items (eg DampA) | 591 | r23 PAC Hamon Pierrick Referenced Value (value_1_PQACTJAN02)1313Document Q3_2017_Quarter_Report13Chapter Consolidated Statement of Cash Flows13131565 Tsd - ltlt Depreciation of property plant and equipment gtgt (ltlt 2017 gtgt q_act_jan)131616 Tsd - ltlt Amortization of intangible assets gtgt (ltlt 2017 gtgt q_act_jan)13-165 Tsd - ltlt Interest income and dividend on available-for-sale financial assets gtgt (ltlt 2017 gtgt q_act_jan)13-167 Tsd - ltlt Exchange differences gtgt (ltlt 2017 gtgt q_act_jan)13-025 Tsd - ltlt Loss (gain) on sales of property plant and equipment gtgt (ltlt 2017 gtgt q_act_jan)13000 Tsd - ltlt Loss (gain) on sales of financial assets gtgt (ltlt 2017 gtgt q_act_jan)13497 Tsd - ltlt Expenses for share-based compensation plans gtgt (ltlt 2017 gtgt q_act_jan)13238 Tsd - ltlt Other non-cash (income) and expenses gtgt (ltlt 2017 gtgt q_act_jan)132351 Tsd - ltlt Income tax expenses gtgt (ltlt 2017 gtgt q_act_jan)13---------------------135910 Tsd (Total) | Other non-cash items (eg DampA) | 4372 | 591 | |||||||||||||||||||||||||||||||||||||||||||||||||||
| Changes in working capital | -4766 | r24 PAC Hamon Pierrick Referenced Value (value_1_PQACTJAN02)1313Document Q3_2017_Quarter_Report13Chapter Consolidated Statement of Cash Flows1313-7973 Tsd - ltlt (Increase) decrease receivables other current assets and unbilled forwarding services gtgt (ltlt 2017 gtgt q_act_jan)134406 Tsd - ltlt Increase (decrease) payables and accruals incl accrued cost of service gtgt (ltlt 2017 gtgt q_act_jan)13-472 Tsd - ltlt Increase (decrease) non-current provisions and other liabilities gtgt (ltlt 2017 gtgt q_act_jan)13-749 Tsd - ltlt Increase (decrease) current provisions and other liabilities gtgt (ltlt 2017 gtgt q_act_jan)13---------------------13-4787 Tsd (Total) | Changes in working capital | 4486 | 477 | neg | ||||||||||||||||||||||||||||||||||||||||||||||||||
| Interest and income taxes paid | -3311 | r25 PAC Hamon Pierrick Referenced Value (value_1_PQACTJAN02)1313Document Q3_2017_Quarter_Report13Chapter Consolidated Statement of Cash Flows1313-136 Tsd - ltlt Interest paid gtgt (ltlt 2017 gtgt q_act_jan)13-3175 Tsd - ltlt Income taxes paid gtgt (ltlt 2017 gtgt q_act_jan)13---------------------13-3311 Tsd (Total) | Interest and income taxes paid | 4155 | 331 | neg | ||||||||||||||||||||||||||||||||||||||||||||||||||
| Net cash from investing activities | -4085 | r26 PAC Hamon Pierrick Referenced Value (value_1_PQACTJAN02)1313Document Q3_2017_Quarter_Report13Chapter Consolidated Statement of Cash Flows13Row ltlt Net cash used in investing activities gtgt (ltlt 2017 gtgt q_act_jan)13User Value -4063 Tsd | Net cash from investing activities | 3747 | 409 | neg | ||||||||||||||||||||||||||||||||||||||||||||||||||
| Financing activitiesdividend | -8937 | r27 PAC Hamon Pierrick Referenced Value (value_1_PQACTJAN02)1313Document Q3_2017_Quarter_Report13Chapter Consolidated Statement of Cash Flows13Row ltlt Net cash used in financing activities gtgt (ltlt 2017 gtgt q_act_jan)13User Value -8937 Tsd | Financing activitiesdividend | 2853 | 894 | neg | ||||||||||||||||||||||||||||||||||||||||||||||||||
| Effect of exchange rate changes | 933 | r28 PAC Hamon Pierrick Referenced Value (value_1_PQACTJAN02)1313Document Q3_2017_Quarter_Report13Chapter Consolidated Statement of Cash Flows13Row ltlt Effect of exchange rate changes on cash and cash equivalents gtgt (ltlt 2017 gtgt q_act_jan)13User Value 933 Tsd | Effect of exchange rate changes | 2853 | 93 | |||||||||||||||||||||||||||||||||||||||||||||||||||
| Reported cash and cash equivalents at 30092017 | 29463 | r29 PAC Hamon Pierrick Referenced Value (value_1_PQACTJAN02)1313Document Q3_2017_Quarter_Report13Chapter Consolidated Statement of Cash Flows13Row ltlt Cash and cash equivalents at the end of the period gtgt (ltlt 2017 gtgt q_act_jan)13User Value 29463 Tsd | PAC Hamon Pierrick Referenced Value (value_1_PQACTJAN02)1313Document Q3_2017_Quarter_Report13Chapter Consolidated Statement of Cash Flows13Row ltlt Subtotal cash flow from operations gtgt (ltlt 2017 gtgt q_act_jan)13User Value 10749 Tsd | PAC Hamon Pierrick Referenced Value (value_1_PQACTJAN02)1313Document Q3_2017_Quarter_Report13Chapter Consolidated Statement of Cash Flows1313-7973 Tsd - ltlt (Increase) decrease receivables other current assets and unbilled forwarding services gtgt (ltlt 2017 gtgt q_act_jan)134406 Tsd - ltlt Increase (decrease) payables and accruals incl accrued cost of service gtgt (ltlt 2017 gtgt q_act_jan)13-472 Tsd - ltlt Increase (decrease) non-current provisions and other liabilities gtgt (ltlt 2017 gtgt q_act_jan)13-749 Tsd - ltlt Increase (decrease) current provisions and other liabilities gtgt (ltlt 2017 gtgt q_act_jan)13---------------------13-4787 Tsd (Total) | PAC Hamon Pierrick Referenced Value (value_1_PQACTJAN02)1313Document Q3_2017_Quarter_Report13Chapter Consolidated Statement of Cash Flows13Row ltlt Cash generated from operations gtgt (ltlt 2017 gtgt q_act_jan)13User Value 5963 Tsd | PAC Hamon Pierrick Referenced Value (value_1_PQACTJAN02)1313Document Q3_2017_Quarter_Report13Chapter Consolidated Statement of Cash Flows1313-136 Tsd - ltlt Interest paid gtgt (ltlt 2017 gtgt q_act_jan)13-3175 Tsd - ltlt Income taxes paid gtgt (ltlt 2017 gtgt q_act_jan)13---------------------13-3311 Tsd (Total) | PAC Hamon Pierrick Referenced Value (value_1_PQACTJAN02)1313Document Q3_2017_Quarter_Report13Chapter Consolidated Statement of Cash Flows13Row ltlt Net cash from operating activities gtgt (ltlt 2017 gtgt q_act_jan)13User Value 2652 Tsd | PAC Hamon Pierrick Referenced Value (value_1_PQACTJAN02)1313Document Q3_2017_Quarter_Report13Chapter Consolidated Statement of Cash Flows13Row ltlt Net cash used in investing activities gtgt (ltlt 2017 gtgt q_act_jan)13User Value -4063 Tsd | PAC Hamon Pierrick Referenced Value (value_1_PQACTJAN02)1313Document Q3_2017_Quarter_Report13Chapter Consolidated Statement of Cash Flows13Row ltlt Free cash flow gtgt (ltlt 2017 gtgt q_act_jan)13User Value -1411 Tsd | PAC Hamon Pierrick Referenced Value (value_1_PQACTJAN02)1313Document Q3_2017_Quarter_Report13Chapter Consolidated Statement of Cash Flows13Row ltlt Net cash used in financing activities gtgt (ltlt 2017 gtgt q_act_jan)13User Value -8937 Tsd | PAC Hamon Pierrick Referenced Value (value_1_PQACTJAN02)1313Document Q3_2017_Quarter_Report13Chapter Consolidated Statement of Cash Flows13Row ltlt Net increase (decrease) in cash and cash equivalents gtgt (ltlt 2017 gtgt q_act_jan)13User Value -10348 Tsd | PAC Hamon Pierrick Referenced Value (value_1_PQACTJAN02)1313Document Q3_2017_Quarter_Report13Chapter Consolidated Statement of Cash Flows13Row ltlt Cash and cash equivalents at the beginning of the period gtgt (ltlt 2017 gtgt q_act_jan)13User Value 38878 Tsd | PAC Hamon Pierrick Referenced Value (value_1_PQACTJAN02)1313Document Q3_2017_Quarter_Report13Chapter Consolidated Statement of Cash Flows13Row ltlt Effect of exchange rate changes on cash and cash equivalents gtgt (ltlt 2017 gtgt q_act_jan)13User Value 933 Tsd | PAC Hamon Pierrick Referenced Value (value_1_PQACTJAN02)1313Document Q3_2017_Quarter_Report13Chapter Consolidated Statement of Cash Flows13Row ltlt Cash and cash equivalents at the end of the period gtgt (ltlt 2017 gtgt q_act_jan)13User Value 29463 Tsd | PAC Hamon Pierrick Referenced Value (value_1_PQACTJAN02)1313Document Q3_2017_Quarter_Report13Chapter Consolidated Statement of Cash Flows13Row ltlt Cash and cash equivalents at the beginning of the period gtgt (ltlt 2017 gtgt q_act_jan)13User Value 38878 Tsd | PAC Hamon Pierrick Referenced Value (value_1_PQACTJAN02)1313Document Q3_2017_Quarter_Report13Chapter Consolidated Statement of Cash Flows13Row ltlt Profit gtgt (ltlt 2017 gtgt q_act_jan)13User Value 4839 Tsd | PAC Hamon Pierrick Referenced Value (value_1_PQACTJAN02)1313Document Q3_2017_Quarter_Report13Chapter Consolidated Statement of Cash Flows13131565 Tsd - ltlt Depreciation of property plant and equipment gtgt (ltlt 2017 gtgt q_act_jan)131616 Tsd - ltlt Amortization of intangible assets gtgt (ltlt 2017 gtgt q_act_jan)13-165 Tsd - ltlt Interest income and dividend on available-for-sale financial assets gtgt (ltlt 2017 gtgt q_act_jan)13-167 Tsd - ltlt Exchange differences gtgt (ltlt 2017 gtgt q_act_jan)13-025 Tsd - ltlt Loss (gain) on sales of property plant and equipment gtgt (ltlt 2017 gtgt q_act_jan)13000 Tsd - ltlt Loss (gain) on sales of financial assets gtgt (ltlt 2017 gtgt q_act_jan)13497 Tsd - ltlt Expenses for share-based compensation plans gtgt (ltlt 2017 gtgt q_act_jan)13238 Tsd - ltlt Other non-cash (income) and expenses gtgt (ltlt 2017 gtgt q_act_jan)132351 Tsd - ltlt Income tax expenses gtgt (ltlt 2017 gtgt q_act_jan)13---------------------135910 Tsd (Total) | PAC Hamon Pierrick Referenced Value (value_1_PQACTJAN02)1313Document Q3_2017_Quarter_Report13Chapter Consolidated Statement of Cash Flows1313-7973 Tsd - ltlt (Increase) decrease receivables other current assets and unbilled forwarding services gtgt (ltlt 2017 gtgt q_act_jan)134406 Tsd - ltlt Increase (decrease) payables and accruals incl accrued cost of service gtgt (ltlt 2017 gtgt q_act_jan)13-472 Tsd - ltlt Increase (decrease) non-current provisions and other liabilities gtgt (ltlt 2017 gtgt q_act_jan)13-749 Tsd - ltlt Increase (decrease) current provisions and other liabilities gtgt (ltlt 2017 gtgt q_act_jan)13---------------------13-4787 Tsd (Total) | PAC Hamon Pierrick Referenced Value (value_1_PQACTJAN02)1313Document Q3_2017_Quarter_Report13Chapter Consolidated Statement of Cash Flows1313-136 Tsd - ltlt Interest paid gtgt (ltlt 2017 gtgt q_act_jan)13-3175 Tsd - ltlt Income taxes paid gtgt (ltlt 2017 gtgt q_act_jan)13---------------------13-3311 Tsd (Total) | Reported cash and cash equivalents at 30092017 | 2946 | 3888 | ||||||||||||||||||||||||||||||||||
| 484 | ||||||||||||||||||||||||||||||||||||||||||||||||||||||||
| 591 | ||||||||||||||||||||||||||||||||||||||||||||||||||||||||
| (479) | ||||||||||||||||||||||||||||||||||||||||||||||||||||||||
| (331) | ||||||||||||||||||||||||||||||||||||||||||||||||||||||||
| (406) | ||||||||||||||||||||||||||||||||||||||||||||||||||||||||
| (894) | ||||||||||||||||||||||||||||||||||||||||||||||||||||||||
| 93 | ||||||||||||||||||||||||||||||||||||||||||||||||||||||||
| 2946 |