q2 & hy 2009 results - tnt.com · • press releases since the first quarter 9 express ... •...
TRANSCRIPT

Contents
Q2 & HY 2009 results Press release Version

Q2 2009 results
Q2 & HY 2009 results 2
Table of contents
• Highlights 3 • CEO Statement 4 Group • Summary 4 • Other Group financial indicators 5 • Business development 5 • Dividend 6 • Outlook 7 • Q2 segment summary 8 • Half year segment summary 8 • Half year performance 9 • Press releases since the first quarter 9 Express • Overview 10 Mail • Overview 12 Reporting responsibilities and risks • Related party transactions 14 • Auditor’s involvement 14 • Directors’ responsibility statement 14 • Risks 14 Consolidated interim financial statements • General information 16 • Basis of preparation 16 • Segment information 16 • Consolidated statement of financial position 17 • Consolidated income statement 18 • Consolidated statement of cash flows 19 • Consolidated statement of changes in equity 20 • Consolidated statement of comprehensive income 20 • Notes to consolidated interim financial statements 21
Other • Working days 26 • Financial calendar 27 • Contact information 27 • Warning about forward-looking statements 28

Q2 & HY 2009 results 3
Q2 2009 results
Focus on costs and cash pays off Group • Recessionary business environment persists in Q2 • Strong cash flow resulting from ongoing focus on working capital and tax • Interim 2009 dividend of € 0.18 per share, at choice of shareholder in cash or stock Express • Volume decline stable throughout Q2 • Strong cost savings performance at € 135 million, full year target increased • Underlying* operating income of € 89 million (€ 153 million in Q2 2008) • Reported operating income at € 29 million due to one-offs, Easter and foreign exchange
impact Mail • Revenue in line with last year • Addressed mail volume decline in the Netherlands 6%, excluding various one-off mailings • Operating income of € 150 million (€ 173 million in Q2 2008)
Key figures Q2in € millions, except percentages Q2 2009 Q2 2008 % Change Q2 2009 Q2 2008 % Change
GroupRevenues 2,528 2,809 -10.0% 2,613 2,809 -6.9%EBITDA 262 410 -36.1% 317 410 -22.7%Operating income (EBIT) 178 324 -45.1% 226 324 -30.2%Profit from continuing operations 89 207 -57.0% 127 207 -38.6%Profit attributable to the shareholders 81 205 -60.5% 125 205 -39.0%Cash generated from operations 289 337 -14.2% 289 337 -14.2%Net cash from operating activities 410 215 90.7%ExpressRevenues 1,450 1,716 -15.5% 1,523 1,716 -11.2%EBITDA 83 209 -60.3% 151 209 -27.8%Operating income (EBIT) 29 153 -81.0% 89 153 -41.8%MailRevenues 1,020 1,028 -0.8% 1,032 1,028 0.4%EBITDA 179 201 -10.9% 167 201 -16.9%Operating income (EBIT) 150 173 -13.3% 138 173 -20.2%
As reported Underlying *
y g g y p g p p (€ ) (€ ),
Reconciliation Q2 2009in € millions
Express 1,450 0 40 33 1,523 Mail 1,020 0 12 1,032 Other networks 63 63 Non-allocated (5) (5) Total revenues 2,528 0 40 0 45 2,613 Express 29 34 20 6 89 Mail 150 (11) (1) 138 Other networks 3 3 Non-allocated (4) (4) Operating income (EBIT) 178 34 20 (11) 5 226
As reported
Expressrestructuring
Mail one-offs
FX rates impact Underlying*
ExpressEaster impact
* The underlying figures over 2009 are at constant currency and for Express exclude the impact of a restructuring provision (€ 34 m), the Easter impact on revenues (€ 40 m) and EBIT (€ 20 m); and for Mail net one-offs consisting of a restructuring provision (€ 4 m), a one-off charge (€ 5 m) and book gains (€ 20 m).

Q2 2009 results
Q2 & HY 2009 results 4
CEO Peter Bakker comments:
“The trading environment continued to be tough this quarter. In response, TNT’s management teams have once again significantly reduced costs without jeopardising our service levels. The underlying performance in our businesses clearly improved over Q1 this year. Our focus on cash has resulted in a strong free cash flow over the first six months this year. Our announcement today of a € 0.18 dividend per share, optional in cash or shares, is a sign of confidence in our operational performance.
Through the quarter, the rate of decline of Express volumes has been stable, with a small upturn in the last weeks of June. The decline of Express volumes seems to be bottoming out. The excellent implementation of cost savings measures has allowed us to increase our savings target for the full year. In the summer period, however, there remains the possibility of longer holiday stops in production lines of our customers, which may impact volumes.
In Mail, the operating result was impacted by lower volumes, higher costs of pensions and one-off costs in EMN. After the union members had voted down the CLA agreement for TNT Post in the Netherlands, we have launched significant restructuring plans. We continue, however, to aim to develop a renewed discussion with the unions to explore wage-based alternatives.
Going forward we assume continuation of tough trading conditions to persist in the second half of the year, as early signs pointing towards improvements in the general economic climate in the second half of 2009 are still too uncertain to indicate a positive trend line development.”
Q2 2009 Group Summary Group reported revenues saw a decline of 10.0% to a level of € 2,528 million due to lower volumes in Express and Mail and the effect of Easter being in Q2 in 2009 whilst it was in Q1 in 2008. Reported operating income saw a decline of 45.1% to € 178 million due to lower volumes, the effect of Easter, and net one-off charges, only partially offset by substantial cost savings in Express and Mail. Profit attributable to the shareholders came in at € 81 million (€ 205 million in Q2 2008).
As business results and trading environment are often better explained by underlying* developments, the analysis below will focus thereon.
Group underlying∗ revenues were –6.9% in Q2 2009. Underlying operating income decreased by 30.2%, or € 98 million, to € 226 million. Net cash from operating activities was € 410 million, an improvement of € 195 million versus last year, mainly as a result of improved working capital (€ 84 million) and net income tax refund (€ 157 million) more than offsetting lower cash generated from earnings. This strong cash development is reflected in the reduction in net debt from € 1.7 billion in Q1 2009 to € 1.4 billion.
Express underlying revenues were down 11.2%, of which 3.3% fuel surcharge, to € 1,523 million. Core kilos declined more than the decline in consignments, resulting in 6.1% lower weight per consignment. Combined with an average lower rate per kilo, this resulted in an 11.0% lower revenue per consignment.
Partially offsetting these developments were aggressive cost savings. Total costs were reduced by 9.2% or € 135 million (excluding fuel), which compares favourably with the 6.4% decline in consignments (-3.7% excluding weeks 15 and 16).
At constant rates of exchange, excluding a € 34 million restructuring charge and after adjusting for the impact of Easter, Express operating income was € 89 million, representing an underlying 5.8% operating margin, compared to 2.1% in Q1 2009.
Overall, Mail revenues were essentially in line with the previous year. Addressed volumes in the Netherlands fell by 6%, excluding the impact of significant one-off mailings. A good performance by Mail Netherlands and Parcels was offset by the performance in Emerging Mail, that was hit by one-off charges, and Spring.
Operating income of Mail was impacted by higher pension charges as well as lower volumes. This was partially offset by € 19 million Master plan savings. This quarter saw a net positive one-off impact from the sale of Spring Aspac to Singapore Post of € 20 million, a provision for reorganisation in respect of a Cendris acquisition and a one-off charge in EMN Italy of € 5 million. Underlying Mail operating income was € 138 million, which represents an operating margin of 13.4%.
* The underlying figures over 2009 are at constant currency and for Express exclude the impact of a restructuring provision (€ 34 m), the Easter impact on revenues (€ 40 m) and EBIT (€ 20 m); and for Mail net one-offs consisting of a restructuring provision (€ 4 m), a one-off charge (€ 5 m) and book gains (€ 20 m).

Q2 2009 results
Q2 & HY 2009 results 5
Other Group financial indicators
* The underlying figures over 2009 are at constant currency and for Express exclude the impact of a restructuring provision (€ 34 m), the Easter impact on revenues (€ 40 m) and EBIT (€ 20 m); and for Mail net one-offs consisting of a restructuring provision (€ 4 m), a one-off charge (€ 5 m) and book gains (€ 20 m).
Business development Given the current economic environment TNT’s management is placing its focus on day-to-day business operations and in particular on managing the cost base and cash flow of our Group to sustain economic value.
The following other elements in TNT’s business development are relevant:
• Optimising the cash flow is one of the key focus areas for the Group in 2009. Today’s decision on interim dividend reflects the strength of and confidence in the cash flow and operational delivery of short term objectives.
• In the current economic climate TNT will restrain the outflow of capital and focus on cost savings and optimisation of its networks. As a result M&A will continue to be low on the list of priorities until more visibility is reached and cash flow headroom is restored.
• TNT announces that it has formally withdrawn from the process for a strategic partnership with Royal Mail.
• In the ongoing review, as mentioned in December 2008, of the business portfolio and strategic mid-term objectives the following updates are relevant:
o TNT Express aims at extending its leading position in the market of Europe. The focus on expanding road based networks for parcels and freight continues to play into the trends for cheaper, high quality transport services and is complemented by a fast (air-based) next-day network. New Direct Express connections will strengthen revenue growth, whilst cost optimisation through further network redesign will continue to reinforce the competitive position.
The focus on leading selected Intercontinental lanes (to and from China and South America) plays into the ambition to expand the strong domestic / regional road platforms that TNT has built in China and Latin America over the last three years.
o New growth in Europe will be actively pursued by creating a dedicated Standard Parcels unit aimed at developing a position in both BtB and BtC delivery of parcels, a growing market currently estimated to be € 20 billion in size.
Net financial expense € 41 million (Q2 08 € 40 million)
No material changes in interest and similar income
Effective tax rate (ETR): 29.4% (Q2 08 27.1%)
The ETR of 29.4% (or 31.9% adjusted for non-tax effected components in earnings) increased compared to last year mainly due to changes in the profit before tax mix
Net cash from operating activities: € 410 million (Q2 08 € 215 million)
Good improvements in working capital (€ 84 million) and a net income tax refund (€ 157 million) more than offset a lower level of EBITDA (€ 148 million)
Net debt (27 June 2009): € 1,387 million (Q2 08 € 1,931 million)
Decrease due to cash surplus and repayments of borrowings
Net Capex: € 48 million (Q2 08 € 72 million)
Tight control over investments in current economic environment
Acquisitions: € 39 million (Q2 08 € 2 million)
Mainly first payment Expresso Araçatuba and smaller acquisitions in Mail
Disposals of group companies: € 23 million (Q2 08 € 0 million)
Mainly sale of Spring Aspac to Singapore Post

Q2 2009 results
Q2 & HY 2009 results 6
As a starting point, the Standard Parcels unit will in the first instance combine TNT Post Pakketservice and TNT Innight with related elements from Express alongside other third-party partnerships.
In addition to parcels, TNT will focus on capturing the growing customer demand in so-called “special delivery solutions”, through dedicated networks – like shop logistics, fashion services – or via hybrid and digital solutions – like e-commerce and e-billing.
o For TNT Post in the Netherlands the volume declines resulting from substitution continue to underline the mature nature of this business. After it has proven impossible to finalise the agreement on the new CLA TNT Post has confirmed the need to reduce the labour force by 11,000 instead of the planned 6,500 FTEs. Planning for this restructuring is in full speed and further announcements are expected in Q3/Q4. Parallel to this, discussion with the unions will proceed in Q3.
For EMN it is clear that the Dutch decision to liberalise the mail market is not being followed anywhere else in Europe. This changing outlook on the business opportunities will have TNT actively consider forms of co-operation in European mail markets to manage the cash performance and strengthen its competitive position.
As usual, TNT will provide a further update on 3 December during the annual Analyst Day.
Dividend TNT has decided to declare an interim dividend of € 0.18 per share. This level results in a pay-out of approximately 38% of normalised net income over the first half of 2009 as compared to a pro-forma 36% full year dividend over 2008. The calculation of the level of normalised net income is clarified on page 25 of this report.
At the shareholder’s choice, the interim dividend is payable, either wholly in cash or wholly in ordinary shares. The election period is from 29 July 2009 to 11 August 2009 inclusive.
To the extent the dividend is paid in shares, it will be paid out of additional paid in capital as part of the distributable reserves, free of withholding tax in the Netherlands. The ratio of the value of the stock dividend to that of the cash dividend will be determined on 14 August 2009, after the close of trading on NYSE Euronext by Euronext Amsterdam (‘Euronext’), based on the volume-weighted average price (‘VWAP’) of all TNT shares traded on Euronext over a three trading day period from 12 to 14 August 2009 inclusive. The value of the stock dividend, based on this VWAP, will, subject to rounding, be targeted at but not lower than 3% above the cash dividend. There will be no trading in the stock dividend rights.
The ex dividend date will be 28 July 2009, the record date 30 July 2009 and the dividend will be payable as from 19 August 2009 (contrary to the date of 4 August 2009 as previously communicated).

Q2 2009 results
Q2 & HY 2009 results 7
Outlook In February 2009, TNT announced it would not give a 2009 outlook. This paragraph describes the operating environment TNT finds itself in.
As previously indicated, TNT assumes that the severe pressure on the global economy is likely to persist throughout 2009, as early signs pointing towards improvements in the general economic climate in the second half of 2009 are still too uncertain to indicate a positive trend line development.
Express revenues in 2009 are expected to be down compared to 2008, as a result of lower volumes and lower fuel surcharges.
For Mail in the Netherlands, as previously indicated, addressed volumes are expected to show an increasing rate of decline compared with the years before 2009, driven by substitution, along with a somewhat weaker price mix. Emerging Mail & Parcels is expected to continue to grow in revenue at a comparable underlying operating margin to 2008.
Cost savings in total of around € 550 - € 600 million, an increase from the previously indicated € 400 million, are targeted in 2009 (around € 275 million reached in the first half of the year).
Pension charges to the P&L will go up from € 24 million in 2008 to € 64 million in 2009, as previously indicated.
Other information regarding 2009 Outlook:
TNT expects non-allocated costs to stay at around € 35 million for the year.
TNT previously indicated a level of provisions for its cost optimisation initiatives in the period 2008-2010 of € 125-200 million and possible
impairments up to € 150 million. TNT has charged € 41 million of provisions for these initiatives in the first half of 2009 and € 115 million
in 2008 and made impairments of € 44 million in 2008. The indicated range of provisions does not include the possible impact of CLA
negotiations for Mail Netherlands.

Q2 2009 results
Q2 & HY 2009 results 8
Group Summary Q2 % Change as reported
in € millions, except percentages Q2 2009 Q2 2008 Operational Fx Total
Revenues 2,528 2,809 -8.4% -1.6% -10.0%EBITDA 262 410 -33.2% -2.9% -36.1%Operating income (EBIT) 178 324 -43.6% -1.5% -45.1%Profit from continuing operations 89 207 -55.6% -1.4% -57.0%Profit attributable to the shareholders 81 205 -59.0% -1.5% -60.5%Net cash from operating activities 410 215 90.7%
Segment Summary Q2 % Change as reported
in € millions, except percentages Q2 2009 Q2 2008 Operational Fx Total
ExpressRevenues 1,450 1,716 -13.6% -1.9% -15.5%EBITDA 83 209 -53.6% -6.7% -60.3%Operating income (EBIT) 29 153 -77.1% -3.9% -81.0%Operating margin 2.0% 8.9%
Mail Revenues 1,020 1,028 0.4% -1.2% -0.8%EBITDA 179 201 -11.4% 0.5% -10.9%Operating income (EBIT) 150 173 -13.9% 0.6% -13.3%Operating margin 14.7% 16.8%Other NetworksRevenues 63 71 -11.3% -11.3%EBITDA 4 5 -20.0% -20.0%Operating income (EBIT) 3 5 -40.0% -40.0%Operating margin 4.8% 7.0%
Non-allocated (4) (7) 42.9% 42.9%
Operating income (EBIT) 178 324 -43.6% -1.5% -45.1%* The underlying figures over 2009 are at constant currency and exclude the impact of a restructuring provision in Express (€ 34 m) and Mail (€ 4
As reported
As reported
Group Summary HY % Change as reported
in € millions, except percentages HY 2009 HY 2008 Operational Fx Total
Revenues 4,972 5,532 -8.1% -2.0% -10.1%EBITDA 507 791 -33.5% -2.4% -35.9%Operating income (EBIT) 341 613 -42.3% -2.1% -44.4%Profit from continuing operations 164 386 -55.4% -2.1% -57.5%Profit attributable to the shareholders 157 384 -57.0% -2.1% -59.1%Net cash from operating activities 567 465 21.9% 21.9%
Segment Summary HY % Change as reported
in € millions, except percentages HY 2009 HY 2008 Operational Fx Total
ExpressRevenues 2,814 3,330 -13.1% -2.4% -15.5%EBITDA 155 369 -52.6% -5.4% -58.0%Operating income (EBIT) 49 259 -76.1% -5.0% -81.1%Operating margin 1.7% 7.8%
Mail Revenues 2,046 2,077 -0.1% -1.4% -1.5%EBITDA 355 432 -17.8% -17.8%Operating income (EBIT) 299 367 -18.5% -18.5%Operating margin 14.6% 17.7%Other NetworksRevenues 123 135 -8.9% -8.9%EBITDA 6 6 Operating income (EBIT) 4 5 -20.0% -20.0%Operating margin 3.3% 3.7%
Non-allocated (11) (18) 38.9% 38.9%
Operating income (EBIT) 341 613 -42.3% -2.1% -44.4%
As reported
As reported

Q2 2009 results
Q2 & HY 2009 results 9
Half year performance Over the first half of 2009, Group revenues decreased over the prior year period by 10.1% and EBIT decreased by 44.4%. During the first half, non-allocated costs were brought down considerably as part of the company’s overall push to cut costs (€ 11 million versus € 18 million). Cash performance was very strong due to our tight working capital control: net cash from operating activities was up 21.9% despite the fall in operating income.
Express revenues were impacted by the current economic environment. After mid-January though, the rate of decline of Express volumes has remained broadly unchanged. TNT Express has seen improving underlying results from Q1 to Q2, mainly as a result of management’s effectiveness in implementing the cost-savings initiatives. The overall volume decline stabilised through the quarter and cost savings accelerated. In Q1 2009, Express achieved in excess of € 100 million in savings with an additional € 135 million in Q2 2009. In total for the half year, Express reached savings of more than € 240 million versus 2008 against a full year target of € 325 million, which target is therefore now increased towards € 500 million.
Mail revenues were slightly below last year due to anticipated lower volumes in the Netherlands only partially offset by good but slowing revenue growth in Emerging Mail & Parcels. The Mail addressed volume decline in the first half year of 2009, excluding the one-off mailings referred to earlier, was in line with our indications.
Press releases since the first quarter
Date Subject
5 May 2009 • TNT extends Asia Road Network into Cambodia
14 May 2009 • TNT Express Italy opens “Milano Mega”, the new generation branch/hub
19 May 2009 • TNT Post Germany confirms talks with Georg von Holtzbrinck publishing group on possible partnership
3 June 2009 • TNT launches first-to-market South American integrated road network
5 June 2009 • TNT acquires Mikropakket, a Dutch leader in secured delivery
15 June 2009 • TNT Express starts international road freight and parcel delivery service to four eastern and central European countries
16 June 2009 • TNT Post in Germany broadens household coverage through a strategic partnership with the Georg von Holtzbrinck publishing group
18 June 2009 • TNT opens road hub in Wuhan, China
24 June 2009 • TNT secures ISO 28000 security certification
2 July 2009 • TNT Post survey: forfeiting pay negotiable
7 July 2009 • TNT India helps victims of cyclone Aila

Q2 2009 results
Q2 & HY 2009 results 10
Express overview
Key figures Q2in € millions, except percentages Q2 2009 Q2 2008 % Change
Revenues 1,523 1,716 -11.2%EBITDA 151 209 -27.8%Operating income (EBIT) 89 153 -41.8%Operating margin 5.8% 8.9%
Underlying *
* The underlying figures over 2009 are at constant currency and exclude the impact of a restructuring provision (€ 34 m) and the impact of Easter on revenues (€ 40 m) and EBIT (€ 20 m).
Trading environment and operating focus Trading conditions for Express remained challenging throughout the second quarter. Customers continued to look for cost-effective delivery solutions as their businesses faced recessionary headwinds. Significantly, however, the underlying rate of volume decline was mostly stable through the quarter, both in weight and consignments, with a relative improvement towards the end of June – which is when the economic decline first notably began to impact volumes last year.
Against this backdrop, Express’ operating focus is to maintain service levels (year-on-year improvement was achieved in the second quarter) while reducing costs. In the quarter, management has made a significant step forward by taking out € 135 million (excluding direct fuel costs) from the cost base. A € 34 million restructuring charge was taken to reduce further the number of FTEs by more than 600, leading to savings of € 15 million in 2009 and € 36 million of annualised savings as of 2010. So far, since the announcement of our restructuring initiatives, a total of approximately 2,400 FTEs has left Express. Year to date, Express management has saved more than € 240 million of costs compared to the same period in 2008. Around one third of this represents structural savings. The full year target of € 325 million will be comfortably exceeded ranging now around € 500 million.
Operating costs in Q2 2009 were reduced by 9.2%, which appreciably exceeds the 6.4% fall in volume of consignments.
Main sources of the € 135 million cost savings are: significant central network and labour-related cost savings, lower PUD costs due to subcontractor rate reductions and route optimisation and managing down of linehaul costs. Other financial indicators Operational performance indicators Cost savings achieved (excl. fuel): € 135 million Actual costs: -9.2%, € 1,423 million (Q2 08 € 1,568 million) Restructuring provisions: € 34 million
Core kilos (excluding weeks 15 and 16*): -9.6% Air: -20.6%, Road -17.1%, Domestic -7.3%
Core consignments (excluding weeks 15 and 16*): -3.7%
Average weight per core consignment: -6.1%
Fuel-adjusted revenue quality yield on core volumes: -6.2%
* As these weeks comprised Good Friday and Easter Monday, which fell in Q1 in 2008
Operational performance Core kilos declined more than consignments, resulting in 6.1% lower weight per consignment. Combined with a lower rate per kilo, as all competitors try to fill their under-utilised networks, this resulted in 11.0% lower revenue per consignment. Additionally, this quarter saw 3.3% lower revenue from fuel surcharges. For all these reasons, underlying revenues fell by 11.2%.
The reduction in costs, as explained above, partly offset the decrease in consignments and in revenues. The underlying operating margin was 5.8%, which compares with the prior year’s 8.7%.

Q2 2009 results
Q2 & HY 2009 results 11
Revenue analysis Q2in € millions, except percentages Q2 2009 Q2 2008 % Change Organic Acq
International & Domestic 1,220 1,417 -13.9% -13.9% 0.0%Emerging platforms 303 299 1.3% -3.7% 5.0%Express 1,523 1,716 -11.2% -12.1% 0.9%
of which Underlying *
*The underlying figures over 2009 are at constant currency.
International & Domestic Within International & Domestic, most large European countries (France, Benelux, Germany and Italy) experienced revenue declines because of continuing weak volumes and pressure on prices due to lower weights and lower fuel surcharges. The UK results developed well under the circumstances, and France’s decline was mild given its higher exposure to Domestic and Special Services.
Emerging platforms Underlying revenues grew modestly helped by the acquisitions of LIT Cargo and Expresso Araçatuba. On a like-for-like basis, year-on-year growth in Q2 2009 was better than in Q1 2009. Of particular note is the relative strength of Hoau domestic in China, which had a 12% growth in volumes. South America overall reported a stable performance.
in € millions, except percentages and volumes Q2 2009 Q2 2008 % Change HY 2009 HY 2008 % Change
EXPRESSInternational & Domestic
Revenues 1,139 1,417 2,242 2,765
Growth % -19.6% 5.8% -18.9% 3.4%Organic -16.6% 9.2% -15.2% 6.5%Acquisition / Disposal 0.0% 0.0% 0.0% 0.0%Fx -3.0% -3.4% -3.7% -3.1%Emerging platforms
Revenues 311 299 572 565
Growth % 4.0% 11.2% 1.2% 13.9%Organic -4.0% 18.3% -5.9% 16.2%Acquisition / Disposal 5.0% 0.0% 3.4% 4.0%Fx 3.0% -7.1% 3.7% -6.3%Total Express
Revenues 1,450 1,716 2,814 3,330
Growth % -15.5% 6.7% -15.5% 5.0%Organic -14.5% 10.7% -13.7% 8.0%Acquisition / Disposal 0.9% 0.0% 0.6% 0.6%Fx -1.9% -4.0% -2.4% -3.6%
Operating income (EBIT) 29 153 49 259Operating margin 2.0% 8.9% 1.7% 7.8%
Other information Express
Working days 60.0 63.0 121.0 124.0
Core* consignments (in millions) 50.0 53.4 -6.4% 98.3 104.5 -5.9% Domestic core consignments 39.2 41.1 -4.7% 77.3 80.5 -4.0% International core consignments 10.8 12.3 -12.1% 21.0 24.0 -12.2%Core* kilos (in millions) 944.2 1,065.6 -11.4% 1,861.6 2,112.9 -11.9% Domestic core kilos 691.6 759.5 -8.9% 1,362.3 1,509.7 -9.8% International core kilos 252.7 306.1 -17.4% 499.3 603.2 -17.2%Core* revenue quality yield improvement -8.6% 3.6%
* Core excludes Special Services, Hoau, Mercurio and LIT Cargo.
As reported As reported

Q2 2009 results
Q2 & HY 2009 results 12
Mail overview
Key figures Q2in € millions, except percentages Q2 2009 Q2 2008 % Change
Revenues 1,032 1,028 0.4%EBITDA 167 201 -16.9%Operating income (EBIT) 138 173 -20.2%Operating margin 13.4% 16.8%
* The underlying figures over 2009 are at constant currency and exclude a restructuring provision (€ 4 m), a one-off charge (€ 5 m) and book gains (€ 20 m).
Underlying *
Trading environment and operating focus To adjust to the new mail market conditions, TNT continues to focus on the Master plan savings and the related labour agreement. Master plan savings this quarter were € 19 million, which is an increase on Q1 because of the roll out of certain regional cost savings initiatives.
In April, the union members voted down the agreement reached between TNT and the union leadership which would have led to lower wage rates in return for increased job security and certain transitional measures. As a consequence, a total of 11,000 jobs will be at risk during the next three years and TNT presented further plans in that context. On 2 July, TNT announced the outcome of a survey of operational staff in Mail. The survey asked some 23,000 employees for their views on a number of key issues regarding their future and that of the company. The results show that 74% of the 7,700 respondents would choose to exchange a somewhat lower wage for a job guarantee and/or package of transitional measures. The company management and the Works Council will discuss the matter with the trade unions.
On 16 June, TNT confirmed that it would strengthen its position in Germany by acquiring shares in the regional mail companies of the Georg von Holtzbrinck publishing group. With this strategic partnership, TNT Post increases coverage for the distribution of letter mail items to more than 40% of all German households and will therefore be better able to benefit from further regional growth potential.
The liberalisation process in Europe is progressing slowly. Austria, Belgium and Slovakia are amending their postal legislation following the adoption of the third European Postal Directive. All legislative proposals, however, include new barriers to entry. TNT has communicated its concerns both locally and at EU level.
Other financial indicators Operational performance indicators Master plan savings achieved: € 19 million
Netherlands addressed mail volumes excluding various one-off mailings: -6.0%
Operational performance Although no demonstrable progress was made in the process of the new Collective Labour Agreement, Mail showed good results.
Addressed mail volumes in the Netherlands declined in line with trend (-6%), but were helped by election mail and several one-off mailings. Including these one-off mailings the decline would have been 3%. Revenues lost due to volume declines in Mail Netherlands were offset by Emerging Mail & Parcels.
Overall, Mail operating income decreased resulting from higher pension charges as well as lower volumes. Revenue analysis Q2in € millions, except percentages Q2 2009 Q2 2008 % Change Organic Acq
Mail 1,032 1,028 0.4% 0.3% 0.1%of which Emerging Mail&Parcels(excl EMN Germany) 329 305 7.9% 7.6% 0.3%
*The underlying figures over 2009 are at constant currency.
Underlying * of which
Emerging Mail & Parcels showed good revenue growth. The main contributors to this growth were the Dutch Parcels business and EMN in the UK.
EMN Germany showed a slight revenue decline of 2%. Operating income improved by 15%, though still remains negative.

Q2 2009 results
Q2 & HY 2009 results 13
in € millions, except percentages and volumes Q2 2009 Q2 2008 HY 2009 HY 2008
MAILRevenues 1,020 1,028 2,046 2,077
Growth % -0.8% 0.6% -1.5% -0.2%Organic 0.3% 2.7% 0.0% 1.4%Acquisition / Disposal 0.1% -0.5% -0.1% -0.2%Fx -1.2% -1.6% -1.4% -1.4%
of which Emerging Mail & Parcels (excl Germany)Revenues 317 305 625 599
Growth % 3.9% 10.5% 4.3% 10.9%Organic 7.5% 16.7% 9.8% 17.0%Acquisition / Disposal 0.3% -1.1% -0.5% -1.1%Fx -3.9% -5.1% -5.0% -5.0%Operating income (EBIT) 150 173 299 367Operating margin 14.7% 16.8% 14.6% 17.7%
Other information MailAddressed Mail NL volumes (in million items) 1,071 1,104 2,214 2,303Growth % -3.0% -3.2% -3.9% -3.2%Working days 61 62 122 124
As reported As reported

Q2 & HY 2009 results 14
Reporting responsibilities and risks
Related party transactions Major related party transactions are disclosed in note 11 to the Consolidated Interim Financial Statements.
Auditor’s involvement The content of this interim financial report has not been audited or reviewed by an external auditor.
Directors’ responsibility statement In conjunction with the EU Transparency Directive as incorporated in the Dutch Financial Markets Supervision Act (Wet op het financieel toezicht) the Board of Management confirms to the best of its knowledge that: • The consolidated interim financial statements for the six months ended 27 June 2009 give a true and
fair view of the assets, liabilities, financial position and profit or loss of TNT N.V. and its consolidated companies, and
• The Interim report of the Board of Management gives a fair review of the information required pursuant to section 5:25d(8)/(9) of the Dutch Financial Markets Supervision Act (Wet op het financieel toezicht).
Peter Bakker - Chief Executive Officer Hoofddorp, 27 July 2009 Henk van Dalen - Chief Financial Officer Harry Koorstra - General Managing Director Mail Marie-Christine Lombard - General Managing Director Express
Risks Whilst continuous emphasis has been placed on the identification of risks at all levels of the organisation and the development of mitigating actions, the constant changes in the environment in 2008 have made it challenging to keep abreast of the rapidly evolving situation. During 2008 the risk profile within TNT changed significantly with many previously reported inherent risks becoming specific within a very short period of time. TNT management has reviewed the risk profile throughout the first half of 2009 and will continue to do so during the remainder of 2009. No new material risks have been identified that have not already been disclosed in the 2008 Annual Report.
Understanding risks is a vital element of TNT’s management decision making processes. However it is not a means to an end but a process to support management. No matter how good a risk management and control system may be, it cannot be assumed to be exhaustive nor can it provide certainty that it will prevent negative developments in TNT’s business and business environment from occurring. It is important to note that new risks could be identified that are not known currently and that any of the following known risks could have a material adverse effect on TNT’s financial position, results of operations, liquidity and the actual outcome of matters referred to in the forward-looking statements contained in this half year report.
The Board of Management have reviewed TNT’s risk profile as at 30 June 2009 and confirms that the following specific key risks continue to require focused and decisive management attention in the second half of 2009: • Continued sharp volume declines and shifts in customer preferences from premium to economy
products in TNT Express which are amongst others directly related to the declining macroeconomic situation can lead to the need to further rationalise TNT’s Express operations and the air and road networks.
• The loss of key customers/suppliers due to insolvency/bankruptcy in a worsening macroeconomic environment or significant further decline in volumes could have a significant impact on TNT’s cash flows and operational capabilities.
• The liberalisation of the Dutch and EU postal markets could adversely affect TNT’s revenues and profitability.

Reporting responsibilities and risks
Q2 & HY 2009 results 15
• A downturn in the capital markets and/or a decline in interest rates may increase the discounted present value of TNT’s defined benefit pension fund liabilities, which in turn could require significant additional funding by TNT as of 2010.
• Measures taken to reduce costs, including employee redundancies, may not achieve the results intended and could adversely affect TNT’s employee relations, reputation, revenues and profitability.
• A downgrade in TNT’s credit rating may increase TNT’s financing costs and harm TNT’s ability to finance its operations and acquisitions, which could negatively affect revenues and profitability.
• The World Health Organisation’s confirmation of a global pandemic of Influenza (H1N1) 2009 has resulted in TNT changing its view on this risk from an inherent risk to a specific risk. Comprehensive business continuity plans have been developed since 2006. However the exact impact on TNT’s business operations of this risk remains uncertain and TNT management will continue to closely monitor and act accordingly.

Q2 & HY 2009 results 16
Consolidated interim financial statements General information The interim financial statements have been prepared in accordance with IAS 34 ‘Interim financial reporting’.
TNT N.V. (‘TNT’ or the ‘Company’), a public limited liability company with its registered seat in Amsterdam, the Netherlands, and its head office in Amsterdam, the Netherlands, provides businesses and consumers worldwide with an extensive range of services for their express delivery and mail needs. TNT’s services involve the collection, storage, sorting, transport and distribution of a wide range of items for the Company’s customers within specific timeframes, and related data and document management services.
Basis of preparation The information is reported on a year-to-date basis ending 27 June 2009. Where material to an understanding of the period starting 1 January 2009 and ending 27 June 2009 further information is disclosed. The interim financial statements were discussed in and approved by the Board of Management. The interim financial statements should be read in conjunction with TNT’s consolidated 2008 annual report as published on 16 February 2009.
The significant accounting policies applied in these consolidated interim financial statements are consistent with those applied in TNT’s consolidated 2008 annual report for the year ended 31 December 2008. In 2009, amendments to IAS 1 are applicable for TNT. These amendments concern mainly the presentation of changes in equity, in which changes as a result of transactions with shareholders should be presented separately. TNT has chosen to present all non-owner changes in equity in two separate statements, namely, a separate income statement and statement of comprehensive income.
The measure of profit and loss and assets and liabilities is based on the TNT Group Accounting Policies, which are compliant with IFRS. The pricing of intercompany sales is done at arm’s length.
Segment information TNT operates its businesses through three reportable segments Express, Mail and Other networks.
The Express business provides on-demand door-to-door express delivery services for customers sending documents, parcels and freight. The Mail business provides services for collecting, sorting, transporting and distributing domestic and international mail. The Other networks business provides time-critical deliveries to individually agreed service delivery points for business customers during the night.
Revenues and results are impacted by the seasonality of sales whereby Q4 is the strongest quarter in the financial year and Q3 is the weakest quarter.
In the following table reconciliation is presented of the segment information relating to the income statement and total assets of the reportable segments for the first half year of 2009 and 2008:
in € millionsExpress Mail Other
networksInter-
companyNon-
allocatedTotal
HY 2009 ended at 27 June 2009 Net sales 2,763 2,029 120 1 4,913 Inter-company sales 5 6 1 (12) 0 Other operating revenues 46 11 2 59 Total operating revenues 2,814 2,046 123 (12) 1 4,972 Other income 2 27 0 1 30 Depreciation/impairment property, plant and equipment (79) (43) (1) (2) (125) Amortisation/impairment intangibles (27) (13) (1) 0 (41) Total operating income 49 299 4 (11) 341 Total assets 4,468 1,621 99 1,469 7,657
HY 2008 ended at 28 June 2008 Net sales 3,269 2,054 133 0 5,456 Inter-company sales 3 6 1 (10) 0 Other operating revenues 58 17 1 76 Total operating revenues 3,330 2,077 135 (10) 0 5,532 Other income 6 18 1 0 25 Depreciation/impairment property, plant and equipment (85) (45) (1) (1) (132) Amortisation/impairment intangibles (25) (20) 0 (1) (46) Total operating income 259 367 5 (18) 613 Total assets 4,546 1,614 105 884 7,149

Consolidated financial interim statements
Q2 & HY 2009 results 17
Consolidated statement of financial position
27 Jun 31 Decin € millions 2009 2008
Goodwill 1,914 1,807
Other intangible assets 288 2561 Intangible assets 2,202 2,063
Land and buildings 816 793
Plant and equipment 345 336
Aircraft 292 303
Other 158 163
Construction in progress 51 392 Property, plant and equipment 1,662 1,634
Investments in associates 58 64
Other loans receivable 6 5
Deferred tax assets 214 205
Prepayments and accrued income 32 33
Financial fixed assets 310 307
3 Pension assets 786 726
Total non-current assets 4,960 4,730
Inventory 28 24
Trade accounts receivable 1,318 1,370
Accounts receivable 202 204
Income tax receivable 44 37
Prepayments and accrued income 306 2985 Cash and cash equivalents 772 497
Total current assets 2,670 2,430
Assets held for sale 27 25
Total assets 7,657 7,185
Equity attributable to the equity holders of the parent 1,967 1,733
Minority interests 24 244 Total equity 1,991 1,757
Deferred tax liabilities 348 3353 Provisions for pension liabilities 325 3606 Other provisions 215 2125 Long term debt 1,908 1,845
Accrued liabilities 5 4
Total non-current liabilities 2,801 2,756
Trade accounts payable 451 4146 Other provisions 193 190
Other current liabilities 855 890 Income tax payable 267 47 Accrued current liabilities 1,099 1,131
Total current liabilities 2,865 2,672
Total liabilities and equity 7,657 7,185
these numbers relate to the notes belonging to these interim financial statements.

Consolidated financial interim statements
Q2 & HY 2009 results 18
Consolidated income statement
in € millions Q2 2009 Q2 2008 HY 2009 HY 2008
Net sales 2,498 2,764 4,914 5,456
Other operating revenues 30 45 58 76
Total revenues 2,528 2,809 4,972 5,532
Other income 25 15 30 25
Cost of materials (101) (119) (197) (230)
Work contracted out and other external expenses (1,133) (1,244) (2,220) (2,437)
Salaries and social security contributions (883) (893) (1,746) (1,780)
Depreciation, amortisation and impairments (84) (86) (166) (178)
Other operating expenses (174) (158) (332) (319)
Total operating expenses (2,375) (2,500) (4,661) (4,944)
Operating income 178 324 341 613
Interest and similar income 5 13 15 31
Interest and similar expenses (46) (53) (96) (103)
Net financial (expense)/income (41) (40) (81) (72)
7 Results from investments in associates (11) 0 (12) (1)
Profit before income taxes 126 284 248 540
8 Income taxes (37) (77) (84) (154)
Profit for the period from continuing operations 89 207 164 386
Profit from discontinued operations 0 0 0 0
Profit for the period 89 207 164 386
Attributable to:Minority interests 8 2 7 2
Equityholders of the parents 81 205 157 384
Earnings per ordinary share (in € cents) 1 22.1 56.2 43.3 104.9
Earnings per diluted ordinary share (in € cents) 2 21.9 55.9 43.0 104.4
Earnings from continuing operations per ordinary share (in € cents) 1 22.1 56.2 43.3 104.9
Earnings from continuing operations per diluted ordinary share (in € cents) 2 21.9 55.9 43.0 104.4
1. In HY 2009 based on an average of 362,532,698 of outstanding ordinary shares (HY 2008: 366,159,156). See note 4.2. In HY 2009 based on an average of 364,731,755 of outstanding ordinary shares (HY 2008: 367,870,244). See note 4.

Consolidated financial interim statements
Q2 & HY 2009 results 19
Consolidated statement of cash flows
in € millions Q2 2009 Q2 2008 HY 2009 HY 2008
Profit before income taxes 126 284 248 540 Adjustments for:Depreciation, amortisation and impairments 84 86 166 178 Share based payments 5 4 9 8 Investment income: (Profit)/loss on sale of property, plant and equipment (2) (13) (7) (23) (Profit)/loss on sale of Group companies (20) 0 (20) 0 Interest and similar income (5) (13) (15) (31) Foreign exchange (gains) and losses 2 2 4 7 Interest and similar expenses 44 51 92 96 Results from investments in associates 10 0 11 1 Changes in provisions: Pension liabilities (57) (44) (94) (90) Other provisions 9 (29) (9) (54) Changes in working capital: Inventory 0 0 (1) 0 Trade accounts receivable 46 (5) 87 (62) Other accounts receivable 37 (38) 4 (10) Other current assets 54 (1) (20) (59) Trade accounts payable (2) 34 1 23 Other current liabilities excluding short term financing and taxes (42) 19 28 145 Cash generated from operations 289 337 484 669 Interest paid (36) (46) (58) (74) Income taxes paid 157 (76) 141 (130)
Net cash from operating activities 410 215 567 465 Interest received 7 13 18 27 Dividends received 0 0 0 0 Acquisition of group companies (net of cash) (39) (2) (80) (3) Disposals of group companies and joint ventures 23 0 23 0 Investment in associates (3) (5) (8) (6) Disposals of associates 0 0 0 0 Capital expenditure on intangible assets (15) (22) (27) (38) Disposal of intangible assets 1 0 1 0 Capital expenditure on property, plant and equipment (43) (66) (97) (134) Proceeds from sale of property, plant and equipment 9 16 21 31 Other changes in (financial) fixed assets 1 0 1 3 Changes in minority interests 0 1 1 1
Net cash used in investing activities (59) (65) (147) (119) Repurchases of shares 0 (171) 0 (280) Cash proceeds from the exercise of shares/options 1 1 1 1 Proceeds from long term borrowings 0 0 46 0 Repayments to long term borrowings (2) (1) (2) (2) Proceeds from short term borrowings 0 92 166 135 Repayments to short term borrowings (295) (6) (345) (45) Repayments to finance leases (7) (6) (10) (8) Dividends paid 0 (202) 0 (202) Financing relating to our discontinued operations 0 0 0 0
Net cash used in financing activities (303) (293) (144) (401)
Changes in cash from continuing operations 48 (143) 276 (55)
Cash at beginning of the period 726 378 497 295 Cash from divested business 0 0 0 0 Exchange rate differences (2) 0 (1) (5) Changes in cash from continuing operations 48 (143) 276 (55) Cash at end of period as reported 772 235 772 235

Consolidated financial interim statements
Q2 & HY 2009 results 20
Consolidated statement of changes in equity
in € millions
Issued share
capital
Additional paid in capital
Translation reserve
Hedging reserve
Other reserves
Retained earnings
Attributable to equity
holders of the parent
Minority interest
Total equity
Balance at 31 December 2007 182 982 (82) (22) 0 871 1,931 20 1,951
Total comprehensive income 0 0 (49) 6 0 384 341 2 343 Final dividend previous year (202) (202) (202) Appropriation of net income 669 (669) 0 0 Interim dividend current year 0 0 0 Repurchases and cancellation of shares (5) (106) (187) (298) (298) Share based compensation 8 8 8 Other 0 1 1 2 3
Total direct changes in equity (5) (106) 0 0 491 (871) (491) 2 (489)
Balance at 28 June 2008 177 876 (131) (16) 491 384 1,781 24 1,805
Balance at 31 December 2008 173 876 (212) (35) 497 434 1,733 24 1,757
Total comprehensive income 0 0 69 (7) 0 157 219 7 226 Stock dividend previous year 4 (4) 0 0 0 Appropriation of net income 434 (434) 0 0 Interim dividend current year 0 0 0 Repurchases and cancellation of shares 0 0 0 0 0 Share based compensation 9 9 9 Other 0 6 6 (7) (1)
Total direct changes in equity 4 (4) 0 0 449 (434) 15 (7) 8
Balance at 27 June 2009 177 872 (143) (42) 946 157 1,967 24 1,991
Consolidated statement of comprehensive income
in € millions Q2 2009 Q2 2008 HY 2009 HY 2008
Profit for the period 89 207 164 386 Gains/(losses) on cashflow hedges, net of tax 0 21 (7) 6 Currency translation adjustment net of tax (15) 20 69 (49) Other comprensive income for the period (15) 41 62 (43) Total comprehensive income for the period 74 248 226 343
Attributable to:Minority interest 8 2 7 2 Equity holders of the parent 66 246 219 341
Notes to the consolidated interim financial statements
Q2 & HY 2009 results 21
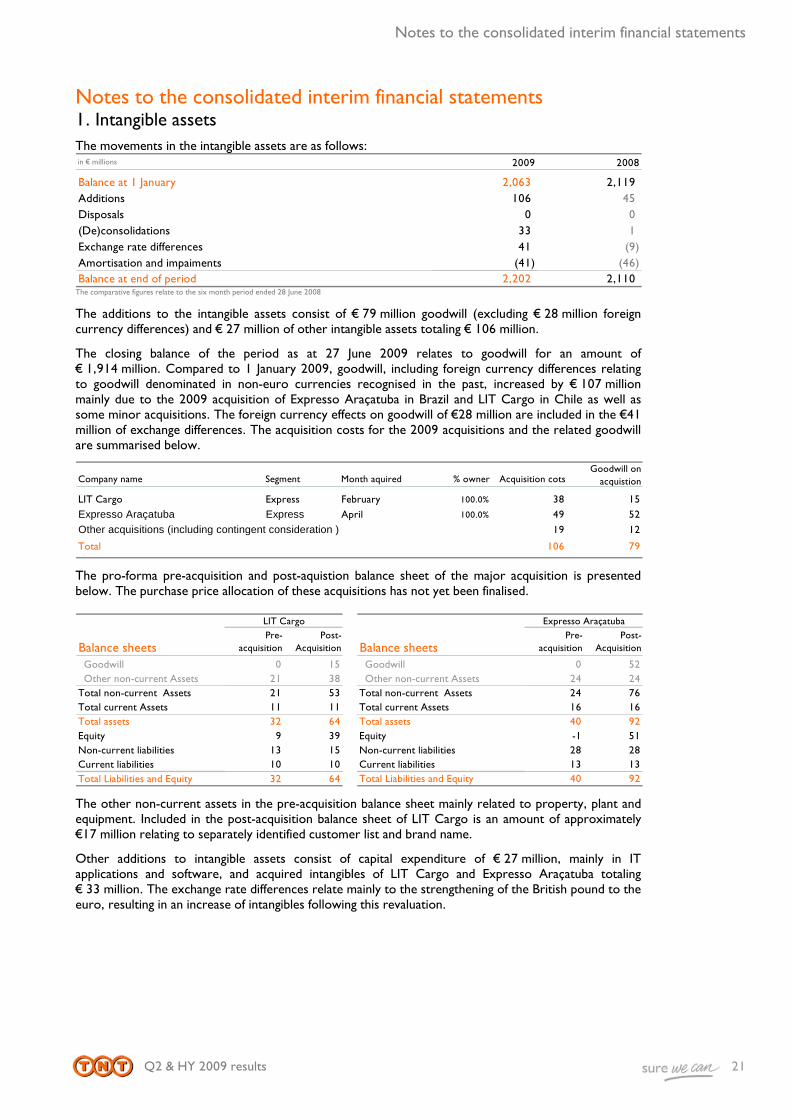
Notes to the consolidated interim financial statements 1. Intangible assets The movements in the intangible assets are as follows: in € millions 2009 2008
Balance at 1 January 2,063 2,119 Additions 106 45 Disposals 0 0 (De)consolidations 33 1 Exchange rate differences 41 (9) Amortisation and impaiments (41) (46) Balance at end of period 2,202 2,110
The comparative figures relate to the six month period ended 28 June 2008
The additions to the intangible assets consist of € 79 million goodwill (excluding € 28 million foreign currency differences) and € 27 million of other intangible assets totaling € 106 million.
The closing balance of the period as at 27 June 2009 relates to goodwill for an amount of € 1,914 million. Compared to 1 January 2009, goodwill, including foreign currency differences relating to goodwill denominated in non-euro currencies recognised in the past, increased by € 107 million mainly due to the 2009 acquisition of Expresso Araçatuba in Brazil and LIT Cargo in Chile as well as some minor acquisitions. The foreign currency effects on goodwill of €28 million are included in the €41 million of exchange differences. The acquisition costs for the 2009 acquisitions and the related goodwill are summarised below.
Company name Segment Month aquired % owner Acquisition cotsGoodwill on
acquistion
LIT Cargo Express February 100.0% 38 15
Expresso Araçatuba Express April 100.0% 49 52
Other acquisitions (including contingent consideration ) 19 12
Total 106 79
The pro-forma pre-acquisition and post-aquistion balance sheet of the major acquisition is presented below. The purchase price allocation of these acquisitions has not yet been finalised.
Balance sheetsPre-
acquisitionPost-
Acquisition Balance sheetsPre-
acquisitionPost-
Acquisition
Goodwill 0 15 Goodwill 0 52 Other non-current Assets 21 38 Other non-current Assets 24 24Total non-current Assets 21 53 Total non-current Assets 24 76Total current Assets 11 11 Total current Assets 16 16Total assets 32 64 Total assets 40 92Equity 9 39 Equity -1 51Non-current liabilities 13 15 Non-current liabilities 28 28Current liabilities 10 10 Current liabilities 13 13Total Liabilities and Equity 32 64 Total Liabilities and Equity 40 92
LIT Cargo Expresso Araçatuba
The other non-current assets in the pre-acquisition balance sheet mainly related to property, plant and equipment. Included in the post-acquisition balance sheet of LIT Cargo is an amount of approximately €17 million relating to separately identified customer list and brand name.
Other additions to intangible assets consist of capital expenditure of € 27 million, mainly in IT applications and software, and acquired intangibles of LIT Cargo and Expresso Araçatuba totaling € 33 million. The exchange rate differences relate mainly to the strengthening of the British pound to the euro, resulting in an increase of intangibles following this revaluation.

Notes to the consolidated interim financial statements
Q2 & HY 2009 results 22
2. Property, plant and equipment The movements in property, plant and equipment are as follows: in € millions 2009 2008
Balance at 1 January 1,634 1,785 Capital expenditures 98 134 Acquisitions 28 1 Disposals (13) (7) Exchange rate differences 43 (26) Depreciation and impairments (125) (132) Transfers to assets held for sale (3) (1) Balance at end of period 1,662 1,754
The comparative figures relate to the six month period ended 28 June 2008
Capital expenditures of € 98 million concerns investments within Express of € 66 million and Mail of € 32 million. The investments mainly relate to depots and hubs, vehicle replacements and sorting machinery. Acquisitions of € 28 million mainly relate to property, plant and equipment of LIT Cargo of € 21 million and Expresso Araçatuba of € 6 million following first-time consolidation of these entities in 2009.
The exchange differences are due to the strengthening of mainly the British pound to the euro and are recorded in equity.
3. Pensions On the balance sheet, the pension assets and pension liabilities of the various defined benefit pension schemes have been presented separately. The pension assets increased by € 60 million and the pension liabilities decreased by € 35 million, resulting in a net € 95 million movement. This movement is the net result of the recorded defined benefit pension costs of € 32 million in the first half year 2009 and contributions paid by TNT to the pension funds and early retirement payments for a total amount of € 127 million. In Q2 2009, €75 million has been paid, which is higher than the € 52 million paid in Q1 2009. These additional payments have been made to further strengthen the financial position of the pension funds. Pension costs in the first half year of 2009 of € 32 million are above the pension cost of Q2008 of €12 million due to a lower expected return on assets and a lower discount rate.
4. Equity Total equity increased to € 1,991 million in 27 June 2009 from € 1,757 million as per 31 December 2008. This increase of € 234 million is mainly due to comprehensive income of € 226 million, of which € 164 million is profit for the period and € 62 million is direct equity movements (mainly currency translation movements.) In addition, € 9 million of share-based payments expenses have been recorded in the first half of 2009 (2008: € 8 million).
In 2009, TNT issued 9.0 million shares with a nominal value of € 0.48 following the pay out of the 2008 stock dividend. As a result, the number of issued and outstanding shares increased from 360.0 million in December 2009 to 369.0 million in 27 June 2009.
27 Jun 31 Dec 28 Jun2009 2008 2008
Number of issued and outstanding shares 369.0 360.0 368.2 Shares held by the company to cover share plans 0.5 1.1 1.1 Shares held by the company for cancellation 0 0 7.8
Average number of shares 362.5 363.6 366.2 Average number of diluted shares 2.2 1.1 1.7 Average number of shares on a fully diluted basis 364.7 364.7 367.9
(in millions)

Notes to the consolidated interim financial statements
Q2 & HY 2009 results 23
5. Net debt The net debt is specified in the table below.
27 Jun 31 Dec 28 Jun
2009 2008 2008
Short term debt 251 396 897 Long term debt 1,908 1,845 1,272 Total interest bearing debt 2,159 2,241 2,169 Cash and other interest bearing assets (772) (497) (238) Net debt 1,387 1,744 1,931 * Net debt does not include adjustments for operating leases and pension liabilities that are incorporated in the definition of total debt used for credit rating purposes.
The net debt position as at 27 June 2009 improved by € 357 million compared to December 2008 due to a reduction of interest bearing debt of € 82 million and an increase of cash and other interest bearing assets of € 275 million. Cash was positively impacted by net cash from operating activities of € 567 million partly offset by net cash used in investing and financing activities (€ 292 million). The net cash from operating activities has been positively impacted by € 99 million inflow of working capital and a preliminary net tax refund totaling € 141 million, which is predominantly due to tax refunds from the Dutch tax authorities relating to prior years.
Net debt decreased € 544 million compared to 28 June 2008 mainly as no share buy backs and cash dividend payments have occurred in 2009.
6. Provisions The other provisions consist of long term provisions and short term provisions for restructuring, claims and indemnities and other employee benefits. In the first half of 2009 the balance of the long- and short-term provisions increased by € 6 million, from € 402 million to € 408 million as at 27 June 2009.
in € millions 2009 2008
Balance at 1 January 402 362 Additions 64 20 Withdrawals (66) (64) (De)consolidations 2 0 Interest 4 3 Other/releases (7) (12) Exchange rate differences 9 (1) Balance at end of period 408 308
The comparative figures relate to the six month period ended 28 June 2008
Included in the additions of € 64 million are restructuring projects within the Express division of € 37 million, of which € 34 million has been recorded in Q2 2009 and restructurings within the Mail division of € 8 million. These together total € 45 million. The remaining Express restructuring programme covers approximately 1,260 FTEs that will be made redundant, of which 400 FTEs in South America, 500 FTEs in Europe and the remainder in the rest of the world. The restructuring within Mail relates to one-off restructuring programmes within Document Management of € 3 million, Parcels Belgium of €1 million and ongoing restructuring programmes of € 4 million.
Other additions of € 19 million relate to other non-employee-related provisions of € 12 million and provision for claims and insurance of € 7 million.
The withdrawals of € 66 million for the first half of 2009 relate to withdrawals of € 39 million within the Express division for settlement payments following restructuring programme in Europe and settlement of commitments. Within the Mail division € 27 million has been withdrawn from restructuring provision following settlement payments within Mail Netherlands mainly following the execution of Master plan initiatives and settlement payments within our joint venture ‘Postkantoren’.
7. Result from investment in associates The result from investments in associates as at 27 June 2009 mainly concerns the result of our investments in Logispring entities, the sole activity of which is to invest in incubator funds. Due to the current economic environment for such activities, the value of underlying investments decreased, resulting in a loss of €10 million.

Notes to the consolidated interim financial statements
Q2 & HY 2009 results 24
8. Effective tax rate
Effective tax rate HY 2009 HY 2008
Dutch statutory tax rate 25.5% 25.5%Other statutory tax rates 1.6% 2.2%Weighted average statutory tax rate 27.1% 27.7%Non and partly deductible costs 1.6% 1.0%Excempt income -2.9% 0.0%Other 8.1% -0.2%Effective tax rate 33.9% 28.5%
The effective tax rate as at 27 June 2009 amounted to 33.9%, which is higher than the comparable effective tax rate of 28.5% per half year 2008.
The exempt income refers to the sale of G3 Worldwide Aspac PTE Ltd. to Singapore Post. The effective tax rate decreased by 2.9% due to the tax-exempted realised gain of € 20 million (€ 14 million after adjusting minority interest) under the participation exemption. The line other shows an increase of the effective tax rate of 8.1% for the first half of 2009 and relates predominantly to current year losses for which no deferred tax assets could be recognised due to uncertainty regarding the recoverability of such assets.
9. Contingent liability As announced on 16 June 2009, TNT Post Germany entered into a strategic partnership with the Georg von Holtzbrinck publishing group. As a result TNT will acquire shares in regional mail companies, leading to two 50% joint ventures and five minority participations of 25.1% each. The acquisitions are subject to approvals from the European Union and “Kartelambt” in Germany. These approvals are expected in the second half of 2009. The consideration for the shares will amount to € 12 million.
10. Labour force The headcount at the end of the quarter as well as the average number of full time equivalents is specified in the table below 27 Jun 31 Dec
Employees 2009 2008
Express 74,099 75,648
Mail 75,738 83,592
Other Networks 1,357 1,358
Non-allocated 350 255
TNT 151,544 160,853
Average FTE's HY 2009 HY 2008
Express 71,670 71,259
Mail 39,233 41,835
Other Networks 1,168 1,125
Non-allocated 262 250
TNT 112,333 114,469
Total headcount as at June 2009 of 151,544 decreased by approximately 10,000 compared to December 2008 following restructuring plans and mobility arrangements.
The average number of full time equivalents working in TNT Express during the first half year of 2009 was 71,670, which is comparable to the same period in 2008. Increase in full time equivalents in emerging countries is largely offset by restructurings.
The average number of full time equivalents working in TNT Mail during first half year of 2009 was 39,233, a decrease of 2,602 compared to December 2008 following staff reductions within operations in the Netherlands. This movement in staff numbers was due to declining volumes and efficiency improvements partly offset by staff increases due to expansion in EMN Germany and the UK.

Notes to the consolidated interim financial statements
Q2 & HY 2009 results 25
11. Related parties At 27 June 2009, TNT’s related party transactions for the year to date totalled € 4 million (2008: € 7 million). Purchases by TNT from joint ventures amounted to € 35 million (2008: € 41 million). The net amounts due to the joint venture entities amounted to € 91 million (2008: € 54 million). As at 27 June 2009, the net amount due from associated companies amounted to € 2 million (2008: € 3 million).
12. Subsequent events The proposed interim dividend over 2009 is € 0.18 per share. The interim dividend is payable, at the shareholder’s election, either wholly in ordinary shares or wholly in cash. The election period is from 29 July 2009 to 11 August 2009 inclusive. This pay-out is based on normalised net income of € 177 million for the first half of 2009. This includes a normalisation for the tax-free gain on disposal of Spring Aspac (€ 14 million after minority interests), the revaluation of our investment in Logispring (- € 10 million) and after-tax reorganisation costs in Express (- € 24 million).

Q2 & HY 2009 results 26
Other
Working days Q1 Q2 Q3 Q4 Total
Express2005 64 63 65 64 256 2006 64 60 64 63 251 2007 64 60 64 64 252 2008 61 63 64 66 254 2009 61 60 65 68 254 Mail2005 62 63 64 64 253 2006 65 62 65 63 255 2007 64 61 65 64 254 2008 62 62 65 66 255 2009 61 61 65 68 255

Other
Q2 & HY 2009 results 27
Financial calendar Tuesday 28 July 2009 Interim ex-dividend listing
Tuesday 30 July 2009 Record date interim dividend
Tuesday 19 August 2009 Interim dividend 2009 payment date
Monday 2 November 2009 Publication of 2009 third quarter results
Thursday 3 December 2009 Analysts’ Meeting Additional information available at
http://group.tnt.com
Investor Relations Cees Visser Director Investor Relations Phone +31 20 500 62 41 Email [email protected] Andrew Beh Deputy Director Investor Relations Phone +31 20 500 8717 Email [email protected] Yolanda Bolleurs Manager Investor Relations Phone +31 20 500 8514 Email [email protected]
Group Communications / Media Relations Ernst Moeksis Director Media Relations Phone +31 20 500 6171 Email [email protected] Daphne Andriesse Senior Press Officer Media Relations Phone +31 20 500 6224 Email [email protected] Cyrille Gibot Senior Press Officer Media Relations Phone +31 20 500 6223 Email [email protected]
Published by TNT N.V. Neptunusstraat 41-63 2132 JA Hoofddorp P.O. Box 13000 1100 KG Amsterdam Phone +31 20 500 6000 Fax +31 20 500 7000 Email [email protected]

Other
Q2 & HY 2009 results 28
Warning about forward-looking statements Some statements in this press release are "forward-looking statements". By their nature, forward-looking statements involve risk and uncertainty because they relate to events and depend on circumstances that will occur in the future. These forward-looking statements involve known and unknown risks, uncertainties and other factors that are outside of our control and impossible to predict and may cause actual results to differ materially from any future results expressed or implied. These forward-looking statements are based on current expectations, estimates, forecasts, analyses and projections about the industries in which we operate and management's beliefs and assumptions about future events. You are cautioned not to put undue reliance on these forward-looking statements, which only speak as of the date of this press release and are neither predictions nor guarantees of future events or circumstances. We do not undertake any obligation to release publicly any revisions to these forward-looking statements to reflect events or circumstances after the date of this press release or to reflect the occurrence of unanticipated events, except as may be required under applicable securities laws.