q2 and first half year 2021 results - smartcraftready.com
TRANSCRIPT
Q2 and first half year 2021 resultsSmartCraft ASA

IMPORTANT – You must read the following before continuing. The following applies to this document, the oral presentation of the information in this document by SmartCraft ASA (the "Company") or any person on behalf of theCompany, and any question-and-answer session that follows the oral presentation (collectively, the "Information"). In accessing the Information, you agree to be bound by the following terms and conditions.
The Information does not constitute or form part of, and should not be construed as an offer or the solicitation of an offer to subscribe for or purchase shares or other securities of the Company, and nothing contained therein shallform the basis of or be relied on in connection with any contract or commitment whatsoever, nor does it constitute a recommendation regarding such shares or other securities. Any shares or other securities of the Company maynot be offered or sold in the United States or any other jurisdiction where such a registration would be required unless so registered, or an exemption from the registration requirements of the U.S. Securities Act of 1933, asamended, or other applicable laws and regulations is available. The Information is not directed to, or intended for distribution to or use by, any person or entity that is a citizen or resident of, or located in, any locality, state,country or other jurisdiction where such distribution or use would be contrary to law or regulation or which would require any registration or licensing within such jurisdiction. The Information is not for publication, release ordistribution in any jurisdiction in which offers or sales would be prohibited by applicable law.
The Information has been prepared by the Company, and no other party accepts any responsibility whatsoever, or makes any representation or warranty, express or implied, for the contents of the Information, including itsaccuracy, completeness or verification or for any other statement made or purported to be made in connection with the Company and nothing in this document or at this presentation shall be relied upon as a promise orrepresentation in this respect, whether as to the past or the future.
The Information contains forward-looking statements. All statements other than statements of historical fact included in the Information are forward-looking statements. Forward-looking statements give the Company's currentexpectations and projections relating to its financial condition, results of operations, plans, objectives, future performance and business. These statements may include, without limitation, any statements preceded by, followed byor including words such as "target", "ambition", "outlook", "believe", "expect", "aim", "intend", "may", "anticipate", "estimate", "plan", "project", "will", "can", "have", "likely", "should", "would", "could" and other words and termsof similar meaning or the negative thereof. Such forward-looking statements involve known and unknown risks, uncertainties and other important factors beyond the Company's control that could cause the Company's actualresults, performance or achievements to be materially different from the expected results, performance or achievements expressed or implied by such forward-looking statements. Such forward-looking statements are based onnumerous assumptions regarding the Company's present and future business strategies and the environment in which it will operate in the future. Furthermore, information about past performance given in this Information is givenfor illustrative purposes only and should not be relied upon as, and is not, an indication of future performance.
No representation, warranty or undertaking, express or implied, is made as to, and no reliance should be placed on, the fairness, accuracy, completeness or correctness of the Information or the opinions contained therein, and noliability whatsoever is accepted as to any errors, omissions or misstatements contained herein, and, accordingly, neither the Company nor any of its parent or subsidiary undertakings or any such person's officers or employeesaccepts any liability whatsoever arising directly or indirectly from the use of this document. The Information has not been independently verified and will not be updated. The Information, including but not limited to forward-looking statements, applies only as of the date of this document and is not intended to give any assurances as to future results. The Company expressly disclaims any obligation or undertaking to disseminate any updates orrevisions to the Information, including any financial data or forward-looking statements, and will not publicly release any revisions it may make to the Information that may result from any change in the Company's expectations,any change in events, conditions or circumstances on which these forward-looking statements are based, or other events or circumstances arising after the date of this document.
This presentation contains statistics, data, statements and other information relating to the group's markets and the industry in which it operates. Where such information has been derived from third-party sources, such sourceshave been identified herein. In addition, the Company has been named as a source for certain market and industry statements included in this presentation. Such "Company information" reflects the Company's views based on oneor more sources available to it (some of which are not publicly available, but can be obtained against payment), including data compiled by professional organisations, consultants and analysts and information otherwise obtainedfrom other third party sources.
By reviewing this Information you acknowledge that you will be solely responsible for your own assessment of the market and the market position of the Company and that you will conduct your own analysis and be solelyresponsible for forming your own view of the potential future performance of the businesses of the Company. This Information must be read in conjunction with the recent financial reports of the Company and the disclosurestherein.
This Information shall be governed by Norwegian law, and any disputes relating to hereto is subject to the sole and exclusive jurisdiction of Norwegian courts.
Disclaimer
Q2 and half year 2021 results 24.08.2021 Slide 2

• A brief intro to SmartCraft• Q2 operational and financial highlights• Summary and outlook• Q&A
Agenda
Q2 and half year 2021 results 24.08.2021 Slide 3

A brief intro to SmartCraft
Q2 and half year 2021 results 24.08.2021Slide 4

Presenters
Q2 and half year 2021 results 24.08.2021 Slide 5
Gustav LineChief Executive Officer
Kjartan BøChief Financial Officer

History of strong profitability and rapid growth
Q2 and half year 2021 results 24.08.2021 Slide 6
75
154
219
0
50
100
150
200
250
300
350
400
450
500
Inc. full-year effect of Congrid (NOKm)
2017 2018 2019 2020 2025Industry pioneers with deep domain expertise
Revenues (NOKm) % Adj. EBITDA margin
Domestic expansion Nordic expansion W. European expansion
General contractors Specialty contractors
Note: Financials for 2019 and 2020 prepared according to IFRS, 2018 financials prepared according to NGAAP1. Including full-year effect of full-year effect of Congrid; 2. Like-for-like growth defined as weighted average growth of companies part of the group at the end of the year
33% 36% 38%1
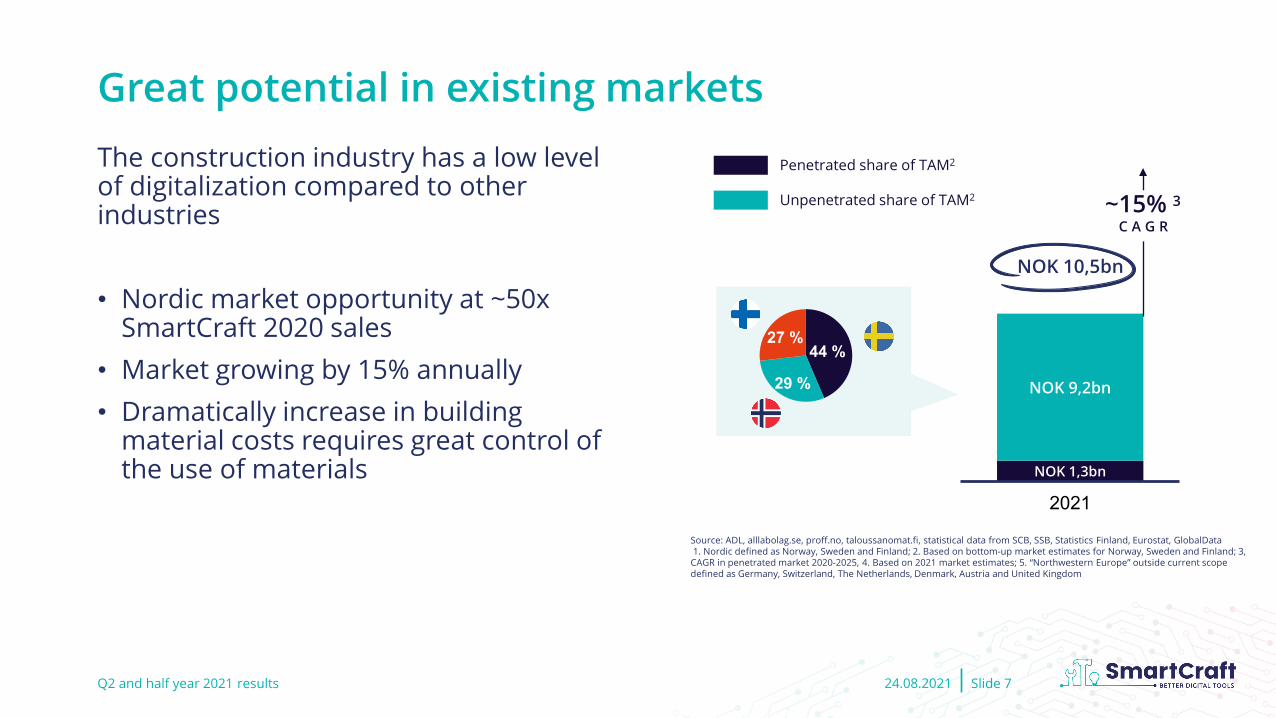
The construction industry has a low level of digitalization compared to other industries
• Nordic market opportunity at ~50x SmartCraft 2020 sales
• Market growing by 15% annually• Dramatically increase in building
material costs requires great control of the use of materials
Great potential in existing markets
Q2 and half year 2021 results 24.08.2021 Slide 7
Source: ADL, alllabolag.se, proff.no, taloussanomat.fi, statistical data from SCB, SSB, Statistics Finland, Eurostat, GlobalData1. Nordic defined as Norway, Sweden and Finland; 2. Based on bottom-up market estimates for Norway, Sweden and Finland; 3,
CAGR in penetrated market 2020-2025, 4. Based on 2021 market estimates; 5. “Northwestern Europe” outside current scope defined as Germany, Switzerland, The Netherlands, Denmark, Austria and United Kingdom
NOK 1,3bn
NOK 9,2bn
NOK 10,5bn
NOK 0bn
NOK 2bn
NOK 4bn
NOK 6bn
NOK 8bn
NOK 10bn
NOK 12bn
NOK 14bn
NOK 16bn
NOK 18bn
NOK 20bn
2021
44 %
29 %
27 %
Penetrated share of TAM2
Unpenetrated share of TAM2 ~15% 3C A G R

Highly integrated solutions with many touch points
Q2 and half year 2021 results 24.08.2021 Slide 8
In officeIntegrated with ERP, CRM and other software solutions
RegulatoryAutomated reporting to relevant bodies
In fieldUsed by workers daily across sites
SuppliersDirectly integrated to major suppliers
Integrated with all key customer activities All-encompassing, easy-to-use platform
Solution covers all daily and new project tasks
Modular offering
«All-in-one» app solution
~80% of users1 use the solutions on a daily basis
Easy to implement, easy to use, easy support
Note: 1. Based on Cordel users

SmartCraft has a clearly differentiated and unique position in the value chain
Q2 and half year 2021 results 24.08.2021 Slide 9
SME
Enterprise
Architects | Engineers | Planners General and speciality contractors Accountants and administratorsCustomers / User groups
Least digitalized
Design and planning phase
Building phase
Accounting phase

Multiple attractive levers to drive organic growth
Q2 and half year 2021 results 24.08.2021 Slide 10
Continue to capitalize on position and
underpenetrated market
Up-sell & price optimizationMultiple levers for up-selling
Cross-sell existing portfolio Deepen and expand presence in new industry
verticals and new SaaS modules
Clear growth levers to be driven by a strong commercial organisation and proven go-to-market model
1 2 3 4
New industry verticals
New SaaS ModulesAll modules across all
geographies15%
CAGR ’20-’25
#1
Market leader
Basic
Users added
Upgrade to premium
Modules added
Use case expanded

Q2 operational and financial highlights

• Financial results and execution in Q2 according to plan• 36% revenue growth• 47% adjusted EBITDA
• Successful IPO• Acquisition of HomeRun strengthens position in Finland• Christian Saleki started as CTO enabling further synergies and
scale• Strengthened position in Electro with strategic customer wins
and new features in solutions• Continued focus on sales excellence
• Success with digital events and meetings continues• EL-VIS 1500 participants at digital events
Continued focus on M&A, product developmentand organization
Q2 and half year 2021 results 24.08.2021 Slide 12

• Solid domestic and international investors including• Capital World Investors• Carnegie Fonder AB• Handelsbanken Fonder AB
• Strengthened Board of Directors with broad industry and international experience
• IPO proceeds gross mNOK 568*:• Redeemed preference shares mNOK 209• Paid down loan facilities mNOK 234• Strengthened investment and acquisition ability
Successful IPO – Solid platform for future growth
Q2 and half year 2021 results 24.08.2021 Slide 13
Key facts
Listed
Oslo Børs, Norway
IPO date
24 June 2021
Ticker code
SMCRT
Reporting interval
Quarterly
Research coverage
ABG Sundal CollierBerenbergCarnegie
Website
Smartcraftready.com
*) Including greenshoe of mNOK 68 materialized in July
Market cap
Pr 20/8/21: BNOK 3.84

• BIM viewer released and pilots ongoing• Cordel Quality Assurance module
reached 600 users• EL-VIS is on plan for internationalization,
on target to release in Finland in Q3• Released new Bygglet App• Launch pilot of Nordic tender
calculation in H2
Product development on plan
Q2 and half year 2021 results 24.08.2021 Slide 14
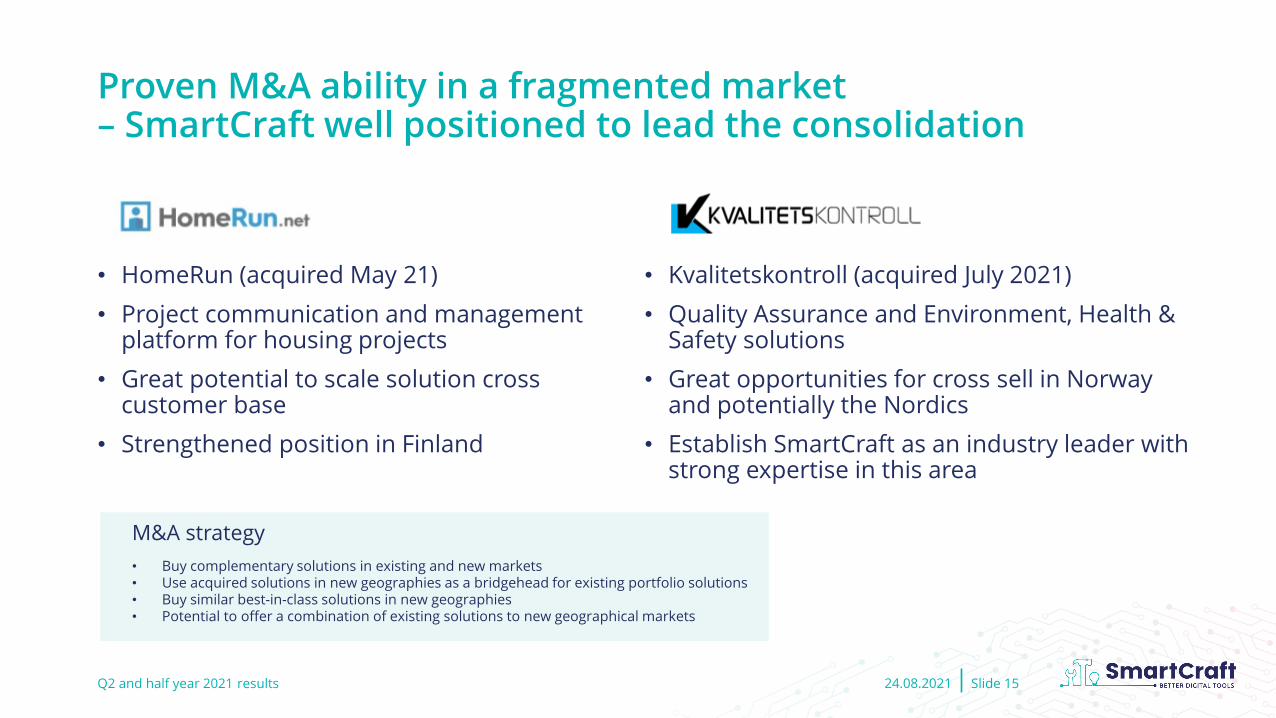
• HomeRun (acquired May 21)• Project communication and management
platform for housing projects• Great potential to scale solution cross
customer base• Strengthened position in Finland
Proven M&A ability in a fragmented market – SmartCraft well positioned to lead the consolidation
Q2 and half year 2021 results 24.08.2021 Slide 15
• Kvalitetskontroll (acquired July 2021)• Quality Assurance and Environment, Health &
Safety solutions• Great opportunities for cross sell in Norway
and potentially the Nordics• Establish SmartCraft as an industry leader with
strong expertise in this area
M&A strategy• Buy complementary solutions in existing and new markets• Use acquired solutions in new geographies as a bridgehead for existing portfolio solutions• Buy similar best-in-class solutions in new geographies• Potential to offer a combination of existing solutions to new geographical markets

• Strong growth in ARR and ARPC
• 35,7% revenue growth
• 17,9% organic growth
• 47,1% adjusted EBITDA margin
• Churn stable at 6,3%
• Strong cash conversion
Strong growth and high profitability in Q2
Q2 and half year 2021 results 24.08.2021 Slide 16
167.0
Q2’20
225.9
ARR development, mNOK
205.3
173.5
204.6
Q2’21Q1’21Q4’20Q3’20
+35%
22.4
Q2’20
27.1
ARPC development, tNOK
26.3
22.8
25.2
Q2’21Q1’21Q4’20Q3’20
+21%

Q2 2021 proves the strong momentum of the business and the scalability of the business model
Q2 and half year 2021 results 24.08.2021 Slide 17
47.1
Q2’20 Q2’21
63.9+36%
Q2’20 Q2’21
26.2
3.9
2.8
18.2
21.0
30.1+43%
RevenueR&D capex Adj. EBITDA - R&D capex
45% 47%
Adj. EBITDA margin
mNOK mNOK
Recurring revenue (%)
94% 94%
Strong YoY revenue growth increasing profitability
Note 1. Defined as weighted average growth of the companies part of the group in Q1’20 adjusted for currency effects
• Continued solid organic growth with additional M&A
• Q2 is a seasonally strong quarter• Some planned hires delayed
• R&D capex expected to continue to increase in line with growing revenues
R&D capex
6% 6%
2.8 3.9
R&D capex R&D capex % of sales
mNOK
Q2’20 Q2’21
Organicgrowth1
+18%

• General construction revenue growth 69%• Acquired two companies• Existing solutions in general construction drive
EBITDA growth
• Stable revenue growth of 12% in specialized construction solutions
• Strong EBITDA margin due to unique value proposition and seasonality
• Segments have equal share of revenue in Q2
Healthy development in both segments in Q2
Q2 and half year 2021 results 24.08.2021 Slide 18
• General construction growth driven by both acquisitions of Congrid and Homerun and existing solutions
• Both segment’s underlines the business scalability
Segment development
19.6
27.5
Q2’21
30.8
Q2’20 Q2’20
6.2
16.0
General construction
Adj. EBITDA
mNOK
Q2’21
11.9
33.1
19.0
Specialized construction
Revenue
42%
58%
52%
48%
Q2’20 Q2’21
Specialized constructionGeneral construction
Revenue share

• Maintaining a high gross margin
• Payroll expenses increase from acquisition, FTE
growth and salary increases
• EBITDA adjusted for restructuring/IPO expenses,
acquisition costs and other one-off items
• D&A increase driven by acquisition and R&D
• Net financial items decrease as Q1’20 was largely
affected by currency changes
• Accrued tax is determined by a set representative
tax rate for the Group and calculated on basis of
GAAP taxable profit
Financials
Q2 and half year 2021 results 24.08.2021 Slide 19
Amounts in NOK (thousands) Q2 2021unaudited
Q2 2020unaudited change change %
Revenue from customers 63 889 47 093 16 796 35,7 %
Purchase of goods and services 5 734 4 727 1 007 21,3 %
Gross profit 58 154 42 366 15 789 37,3 %
Gross margin 91,0 % 90,0 % +1,0 pts +1,0 pts
Payroll and related expenses 22 717 15 755 6 962 44,2 %
Other operating expenses 29 131 5 890 23 241 394,6 %
EBITDA 6 306 20 720 (14 414) (69,6 %)
Adjustments of special items 23 755 240 23 515 9798,1 %
Adjusted EBITDA 30 062 20 960 9 101 43,4 %
EBITDA margin 9,9 % 44,0 % (34,1 pts) (34,1 pts)
Adjusted EBITDA margin 47,1 % 44,5 % +2,6 pts +2,6 pts
Depreciation and amortization 5 064 4 196 867 20,7 %
EBIT 1 243 16 524 (15 281) (92,5 %)
Net financial income (expense) (2 282) 339 (2 621) (773,3 %)
EBT (1 040) 16 863 (17 903) (106,2 %)
Tax expense 1 121 3 119 (1 998) (64,0 %)
Profit (loss) (2 161) 13 744 (15 905) (115,7 %)

Financials
Q2 and half year 2021 results 24.08.2021 Slide 20
Balance sheet, June 30, 2021
18.0
Assets
Current assets
mNOK
Equity and liabilities
Goodwill and intangible assets
• Repaid all loan facilities, negative NIBD post IPO• Increasing negative NWC driven by customer
payment plans
601.1
138.4 60.9
609.4
27.7 79.935.1
Non-current assets
Cash and cash equivalents
Current liabilities
Equity
Non-current liabilities
Deferred revenue
Cash flow
Cash Q1’21
mNOK
• Strong cash flow in Q2 excl. IPO and M&A• Cash conversion in line with expected level• IPO proceeds of mNOK 500 offset by repayment of loan
facilities and redemption of preference shares
122.0 136.6
+15.7(36.9) +35.6
Cash flowfrom
operations
Cash Q2’21Cash flowfrom
financing
Cash flowfrom
investments

Summary and outlook

Key focus H2 2021 • Integrate HomeRun and
Kvalitetskontroll• ELVIS in Finland• Cordel Nordic Calculation• Continue focus on Electro
companies• Investigate cross group
opportunities
Summary & outlook
Q2 and half year 2021 results 24.08.2021 Slide 22
Medium-term financial targets• 15-20% annual organic revenue
growth• Customers need to digitalize to increase
productivity and reduce costs of material
• Large underpenetrated market growing double digits annually
• Cross sell and upsell
• Adjusted EBITDA margin to increase compared to the 2020 baseline due to scalability and synergies

Q&A
